
Submitted:
26 November 2025
Posted:
27 November 2025
You are already at the latest version
Abstract
Objective: This study investigates the association between consumers’ perceived readability of Multiple Traffic Light label print size and the frequency of food consumption within the United Kingdom. We aimed to disentangle the effect of label readability from label content. Using non-equivalent dependent variables, we test if the association is specific to unhealthy convenience foods and absent for healthy or unlabeled foods. We also test for heterogeneity across consumer subgroups. Methods: Data from 8,948 adults across four waves (2012-2018) of the UK Food and You Survey were analyzed. Cumulative link ordinal logistic regressions were employed to model the association between self-reported print size readability and the consumption frequency of four product types: pre-package sandwiches and precooked meat (unhealthy, labeled), dairy (healthy, labeled), and fresh meat (unlabeled control). Results: The findings reveal a content-specific and significant dynamic relationship exclusively for pre-package sandwiches. This relationship reversed from a 9% decrease in the odds of frequent consumption in 2012 to a 4% increase by 2018. In contrast, a persistent null association was observed for pre-cooked meat, dairy, and fresh meat. Subgroup analyses for sandwiches indicated that the association with readability was strongest among less-engaged consumers. Conclusion: Empirical evidence challenges the utility of a standardised approach to food labelling, suggesting the effectiveness of label salience is contingent not just on the consumer, but on the product’s context and the content of its message.
Keywords:
food labeling
; food consumption
; nutrition surveys
; ultra-processed food
; readability
; salience
1. Introduction
In the United Kingdom, the rise in diet-related health issues has spurred extensive discussions on improving the population’s dietary quality. Data indicates that over half of dietary energy intake is derived from ultra-processed food consumption [1,2]. Indeed, the UK ranked third in per capita sales volume (140.7 kg/capita/year) in a 2019 assessment of worldwide trends in ultra-processed foods [3]. The high reliance on these products contributes to population-level intakes of saturated fat, sodium, and free sugar far exceeds the recommended limits. The consumption of this food category is a significant factor in the sustained high prevalence of overweight and obesity, impacting over 60% of the UK population. These conditions are widely recognized as increasing the risk of cardiovascular disease and various forms of cancer [4,5].
Ready-to-eat meals (REM) represent one of the fastest-growing ultra-processed food categories, with a 90% penetration rate in the UK [6]. REM are products cooked in advance and sold ready for consumption or with minimal preparation [7,8]. These products often present a more economical choice compared to home-cooked alternatives [6,9], and their consumption is also frequently driven by the convenience of saving time. Attributed to their perceived consumer benefits, REM meals has emerged as the second most frequently consumed ultra-processed food category in the UK for almost the past two decades [2]. Currently, REM account for 7.8% of the total energy intake among the adult population, with approximately 18.75 kg of chilled and frozen ready meals consumed per capita annually [1,10].
Public interventions have aimed to reduce the consumption of REM among the population. In particular, the UK government introduced the multiple traffic light (MTL) front-of-pack labelling policy in 2013 to signal the adverse nutrient profile of REM and similar convenience products [11]. Compared to earlier versions, MTL is considered a larger, eye-catching, color-coded print label used by retailers on their food packages (see Figure 1). This nutritional labelling aimed to provide consumers with a quick and easy way to assess the nutritional content of food and beverage products, thereby facilitating informed dietary choices. By specifically employing red as a warning color to indicate high levels of saturated fat, sugar, and salt, policymakers made the nutritional characteristics of this ultra-processed food category unmistakable to shoppers [12]. Recent market-wide audits revealed that 94% of all REMs sold at retail outlets received a red and/or amber warning for one of the MTL nutrients, confirming the negative nutritional homogeneity of the category [9,13]. Despite this salient signaling, the percentage of total REM energy intake has paradoxically increased even after the implementation of the MTL system [14].
Following the introduction of the MTL policy in the UK, the expectation was that this visual warning—coupled with voluntary industry uptake—would steer demand away from REM products [15,16,17]. Nevertheless, while post-implementation surveys indicated that nine in ten shoppers reported them as a salient clue for healthy choices [18], scanner data reveal only modest shifts in actual REM purchasing behavior [16,17,19,20,21]. A plausible explanation for this ineffectiveness is that the red warning only affects choices when consumers can comfortably read the message it contains, considering both the surface area it occupies on the packaging and, specifically, the font size. Currently, the UK’s Food Standards Agency specifies a minimum font size of 1.2mm for MTL, which decreases to 0.9mm if the label’s surface area is under 80cm² [22]. Given that the surface area of the MTL in proportion to the package size is minuscule, it is reasonable to assume that the warnings have been difficult for many consumers to discern, potentially leading to the MTL going unnoticed by a segment of the population.
Despite these observations, empirical research specifically investigating the salience of print size within the MTL system has been notably limited [21,23,24]. While previous studies on MTL effectiveness have explored nutrient ranking and interpretive symbols, few have isolated print size as a distinct feature. Existing research often assumes typography is readable, focusing instead on whether shoppers decode the colour rules, leaving unanswered the question of whether print size itself limits or enables behavioural change [25,26,27]. From a psychological perspective, the clarity and simplicity with which information is presented on a label significantly affect how people effectively use it. Individuals possess limited attentional and cognitive capacities, necessitating a careful balance between the time and effort required to interpret information [28]. Consequently, appropriate print sizes can enhance consumers’ ability to make optimal purchasing decisions by improving attention and, subsequently, understanding [29]. Indeed, the labelling literature frames the transition from label salience to label understanding as the pathway through which consumers develop subjective understanding—a personal confidence and feeling of being informed that predicts behavioral change [30,31,32,33]. This is distinct from objective understanding, emphasizing that a favorable perception of a label can positively influence choice, even without perfect factual recall [33,34].
Label understanding is not uniform; instead, it is often shaped and filtered by consumers’ pre-existing beliefs and health motivation [29,35,36]. For instance, the clarity of visual presentations and the structure of patient consent texts influence how accurately patients decode and interpret information, with their impact often contingent on individuals’ preconceived notions and experiences [37,38,39,40]. Similarly, in the context of food choices, empirical research indicates that consumers concerned about food safety and actively seeking nutritional information may be influenced by their perceptions of threats and their assessment of the advantages of taking action, consistent with the health belief model [41,42,43].
This research investigates the association between consumers’ perceived readability of MTL print size and food consumption frequency, specifically by testing the hypothesized salience-to-understanding pathway. However, examining this relationship presents a critical methodological challenge related to the label’s specific content. Isolating the effect of label readability necessitates distinguishing the text’s visual clarity from the nutritional message’s valence. Enhanced readability does not inherently deter consumption; instead, it amplifies the message encoded on the package. Consequently, a highly readable label could theoretically suppress consumption if it signals unhealthiness via red warnings, or conversely, promote it if green indicators signal healthiness [44,45]. Previous approaches that group heterogeneous food categories risk obscuring these opposing effects [12,16,46], making it difficult to ascertain whether readability drives behavioral change through a specific warning signal or merely through broadly increased product visibility.
To mitigate potential threats to internal validity, this study employs a quasi-experimental design, specifically utilizing non-equivalent dependent variables (NEDVs) [47,48]. This approach enhances causal inference by comparing the target outcome with control outcomes that, while exposed to analogous environmental historical influences, are theoretically isolated from the specific causal warning mechanism under investigation [49]. More precisely, the consumption frequency of red warning labeled products, namely pre-packaged sandwiches and pre-cooked meat, is contrasted against that of dairy products and fresh meat. Dairy products serve as a healthy-labeled control, characterized by green or amber nutritional signals [1,2,13], whereas fresh meat functions as an unlabeled falsification test.
This study thus aims to achieve two objectives: 1) to investigate the association between the perceived readability of MTL print size and consumption frequency across specified product categories, and 2) to ascertain whether these associations exhibit heterogeneity among consumer subgroups characterized by their pre-existing health beliefs. We propose a content-dependent hypothesis, positing that a significant association between readability and consumption will be observed for REM-labeled products, where the salience-to-understanding pathway operates as a warning mechanism. Conversely, for healthy-labeled control products, where the label reinforces rather than warns, we anticipate a null or distinct association. Furthermore, a null association is hypothesized for the unlabeled control, given the complete absence of the warning mechanism. By analyzing population-level observational data collected from 2012 to 2018, this design allows for a rigorous examination of whether readability functions as a genuine warning mechanism, rather than merely contributing to increased general product salience.
2. Materials and Methods
2.1. Study Design
This study employs a quasi-experimental design, specifically utilizing a non-equivalent dependent variable (NEDV) framework [47,48,49].
The nationwide implementation of the MTL intervention in 2013 at the outset precluded the establishment of conventional control groups. This inherent methodological difficulty has led some authors to advocate for the application of NEDVs as an alternative to untreated comparison groups [50]. A NEDV is defined as an outcome variable that is not expected to respond to the intervention but would instead react to potential confounding factors that could also influence the primary outcome of interest [51]. Crucially, NEDVs should be related to, but not identical with, the dependent variable of interest. Consequently, this design posits that a causal effect is more credibly supported if it manifests in the target dependent variable but is absent in other comparable variables that are theoretically insulated from the specific causal mechanism [49]. This approach offers advantages similar to those of an untreated control group, while also enabling control for local history bias and mitigating the risk of selection bias, as both the target and control outcomes are exposed to the same contextual factors and significant determinants of health outcomes [52]. This strengthens the evidence that the change in the target dependent variable was not attributable to common threats to internal validity [47,53]. However, this methodological approach has not yet been widely adopted in the evaluation of nutritional interventions such as MTL [52].
In this study, the target outcome variable is the consumption frequency of REM products, specifically pre-packaged sandwiches and pre-cooked meat. Dairy and fresh meat consumption serve as the NEDVs. These product categories are influenced by several shared determinants, encompassing sociocultural elements, economic and physical accessibility, and consumers’ perceptions of their benefits or needs [51]. Dairy products, such as milk, cheese, and yogurt, exhibit identical MTL labeling and are purchased by a comparable consumer demographic within similar retail environments. Furthermore, they are subject to similar industry strategies, including price setting and reformulation [46]. This shared context increases consumers’ exposure to nutritional warning messages at the point of purchase, thereby familiarizing them with label interpretation in order to promote healthier dietary choices. Nevertheless, this is theoretically decoupled from the specific causal mechanism because dairy labels predominantly display green or amber indicators for all nutrients [1,2]. Indeed, a study found that milk drinks and yogurts were the most common ultra-processed foods without red MTL, accounting for 7.5% of the 1650 ultra-processed items analyzed in the UK National Diet and Nutrition Survey (NDNS) from 2008 to 2019 [13]. These indicators serve a reinforcing role, contrasting with the red warning messages frequently present for multiple nutrients on pre-packaged sandwiches [1,2,13,54,55], which are hypothesized to reduce consumption frequency.
Likewise, fresh meat consumption serves as a crucial falsification test. While this product is subject to similar UK consumer trends, it is entirely isolated from the intervention itself, as fresh meat products are not processed foods and thus do not typically display MTL labels [2,56].
Dairy products (labeled outcome control) and fresh meat (no-label falsification test) are identified as nutritional advisable products in this study design; consequently, they are not expected to react to the MTL red warning message. Instead, NEDVs are expected to be sensitive to other changes that could also influence the trend in REM consumption, such as retail marketing strategies [16], product reformulation [16,54], changes in prices [46,57], and product substitutions [46].
2.2. Data Sources
The analysis utilizes repeated cross-sectional data collected in the UK, spanning four waves from 2012 to 2018. The data originates from the UK Food and You Survey [58], a biannual survey that gathers information on respondents’ behaviors, perceptions, and knowledge related to food. This dataset includes a nationally representative sample of adults in England, Wales, and Northern Ireland. Participants were interviewed face-to-face using computer-assisted personal interviewing, and biological samples were collected by nurses in some instances. The initial sample comprised 11,889 participants. However, some individuals were excluded due to missing data: 2,892 participants had missing sociodemographic data, 33 had missing data on MTL readability perceptions, and 16 had missing values for food consumption. After applying these exclusion criteria, the final sample comprised 8948 individuals (2011-2012 = 2135, 2013-2014 = 2335, 2015-2016 = 2309, and 2017-2018 = 2168).
2.3. Outcome Variables
Participants in the UK Food and You Survey were asked to indicate how often they consumed a range of 14 food items, including vegetables, fruits, meats, dairy, and REM products (see Appendix). Our analysis focused on the two REM items available: pre-packaged sandwiches and pre-cooked meats, along with dairy products and fresh meat. Originally, participants’ responses were captured using an eight-point frequency scale, ranging from never consumption (1) to daily consumption (8). To enhance interpretability, the original eight-point scale was collapsed into a three-point ranking that aligns with consumption patterns familiar to consumers: never (1), monthly (2) and daily or weekly (3). Aggregating the detailed categories retains the ordinal structure of the data while producing groups that are conceptually meaningful and statistically balanced.
2.4. Independent Variables
The main independent variable in this study is the individual’s perceived MTL print size. Across the four consecutive UK Food and You Survey waves, participants were asked about the ease or difficulty of reading labels on food packages. Specifically, the question was: How easy do you find it to read the labelling on food products (e.g. ingredients, nutrition or storage information) in terms of the size of the print (using glasses or contact lenses if you wear them)? Subjects responded using a 5-point Likert scale, where 1 indicated very difficult to read and 5 indicated very easy to read.
2.5. Control Variables
In addition to food consumption frequency and perceptions of MTL print size, we added several behavioural, location, and sociodemographic variables to the analysis, acknowledging their influence on REM consumption patterns [59]. This includes the presence of children under the age of 16 in the household, represented as a dichotomous variable (1 for presence, 0 for absence). Households with children tend to place a greater emphasis on nutrition, often leading to increased consumption of fruits and vegetables and reduced intake of ultra-processed foods due to heightened awareness of nutritional information [60,61]. Studies have demonstrated that family composition, in terms of the number of members and their relationships, is associated with lower dietary diversity [62]. In this study, household size is represented by an ordinal variable encompassing family members from 1 to 4+, and marital status is a categorical variable with binary coding (1 for married or living with partner; and 0 for single, widowed, divorced, separated, or other). Research indicates that religious affiliation can impact dietary choices, with studies suggesting that individuals who are religious tend to have less diverse diets or avoid certain foods [62]. Religion is included as a dummy variable to denote Christian affiliation and other religions, with no religion serving as the reference category.
Shopping responsibilities, which indicate whether an individual is responsible for (1) all or most of the food/grocery shopping, or (0) less than half of the purchases, capture the frequency with which individuals engage in food purchasing at home. Studies suggest a decline in food purchasing and cooking at home, coinciding with the increased availability of REM in markets. Consequently, individuals who are more actively involved in home food shopping and cooking are less inclined to consume ultra-processed foods [63].
Individual characteristics such as sex and household income were also included in the analysis [64]. Sex is a binary variable, with 1 representing male and 0 representing female. Age is an ordinal variable divided into seven distinct ranges: 16-24 years, 25-34 years, 35-44 years, 45-54 years, 55-64 years, 65-74 years, and 75 years and above. Household income is a binary variable, with 1 indicating high (£26,000 and above) and 0 indicating low (Up to £25,999). The country of residence is also included as a dummy variable representing England, Wales, with Northern Ireland as the reference category. Another included geographical variable is the classification of urban (1) versus rural (0) areas. Recent research has indicated that diet-related concerns, such as food insecurity and obesity, are related to area-level deprivation in the UK [65].
2.6. Subgroup Analysis
This research integrates consumers’ health beliefs, specifically their concerns regarding food safety and their engagement in seeking nutritional information, as these factors influence how labels are utilized for food choices [29,35,36]. Concerns about safe eating were measured using the question: I often worry about whether the food I have is safe to eat. The original 5-point Likert scale was dichotomized into a high concern group (comprising those who selected definitely agree or tend to agree) and a low concern group (comprising all other respondents). Second, information-seeking behavior was derived from a question about sources used to get information on food safety. Respondents who selected the specific option I don’t look for information on food safety were classified as non-information seekers, while all other respondents were classified as information seekers.
2.7. Statistical Analysis
We employed cumulative link proportional odds ordinal logistic regressions to investigate the associations between individuals’ perceptions of MTL print size and the consumption frequency of the target products (pre-packaged sandwiches and pre-cooked meat) and the non-equivalent dependent variables (dairy and fresh meat). The model is specified as follows:
Where Y denotes the ordinal result of the frequency of consumption for the analyzed food category. j indices the thresholds between the result categories. The threshold-specific intercepts define the baseline log-odds of being below each threshold. represents the coefficient for perception of MTL print size, for the year interaction variable, and for the coefficients of the control variables. The term captures the combined influence of all additional control variables not listed individually. Each denotes an extra covariate, and its corresponding coefficient reflects that variable’s contribution to the log-odds of belonging to a higher consumption-frequency category once the primary predictors have been taken into account. A negative coefficient for at a particular threshold indicates that participants who find the MTL print size easy to read are less likely to fall into a higher consumption frequency category.
The Variance Inflation Factor (VIF) analysis was conducted to assess for multicollinearity among the predictor variables, while the Brant test evaluated whether the parallel regression assumptions were met (see Appendix). Based on the results of this test, we utilized ordinal logistic regression models with proportional odds (without relaxation), as the parallel odds assumptions were satisfied for the key variables. Most variables met the parallel odds assumptions.
The analyses were carried out using the statistical software R [66], with a significance level set at 5%.
3. Results
3.1. Participant Characteristics
Table 1 details the sociodemographic characteristics of the 8,948 participants, stratified by their consumption frequency of pre-packaged sandwiches, pre-cooked meat, dairy, and fresh meat. The demographic profiles of these consumer segments illustrate distinct consumption patterns across product categories. For sandwiches, high-frequency consumption was notably more prevalent among women (62.4%) compared to non-consumers (45.8%). This segment of frequent consumers was also significantly younger, with individuals in the 18-24 (19.9%) and 25-34 (23.8%) age brackets being highly represented, whereas the 65+ age group predominantly comprised non-consumers (27. 8%). Furthermore, individuals without religious affiliation demonstrated a greater concentration among weekly consumers (41.9%) compared to those who never consumed these products (29.3%).
In contrast, the demographic profile of pre-cooked meat consumers presents distinct characteristics. Specifically, the gender distribution transitions from a predominantly male (55.0%) representation among non-consumers to a majority female (53.0%) composition among those who consume these products weekly. Contrary to sandwich consumption patterns, older age cohorts exhibit higher consumption rates, with individuals aged 65+ forming a significant proportion of both monthly (24.7%) and weekly (20.7%) consumers. Furthermore, religious affiliation demonstrates a divergent trend, as Christians constitute a substantial majority of weekly consumers (63.8%), whereas individuals identifying with other religions are disproportionately prevalent among non-consumers (22.8%). The consumption patterns for dairy and fresh meat also reveal unique demographic distributions. Dairy product consumption is nearly universal, with the predominant portion of the sample belonging to the weekly consumption category. This segment demonstrates a balanced gender representation (49.9% male) and comprises a considerable proportion of older consumers (21.0% aged 65+). The demographic profile for fresh meat consumption largely corresponds to that of pre-cooked meat, indicating a shift from a majority male (59.4%) non-consumer group to a majority female (53.1%) weekly consumer group, alongside a comparably high incidence of older adults (21.8%) within the weekly consumption cohort.
Across all four product categories, lower-income households consistently comprised a larger proportion of monthly and weekly consumer segments compared to non-consumers. Similarly, characteristics such as household size and marital status exhibited heterogeneous distributions across consumption levels, thereby highlighting the distinct demographic compositions of each consumer segment.
Table 2 indicates differentiated behavioral profiles across the product categories. Specifically, a discernible pattern regarding shopping responsibility is evident among sandwich consumers, where individuals with reduced responsibility (Sometimes/Never) exhibit a higher concentration within the frequent consumption segment (56.6%, weekly) compared to non-consumers (43.7%). This association, however, does not extend to other product categories. For pre-cooked meat, dairy, and fresh meat, the distribution of shopping responsibility demonstrates greater uniformity across all consumption frequencies.
Concerns pertaining to safe eating practices exhibited divergent relationships across the product categories. For pre-packaged sandwiches, a higher prevalence of individuals with significant safety concerns was observed among weekly (25.8%) consumers compared to monthly consumers (17.7%). Conversely, regarding pre-cooked meat, elevated safety concerns were most frequently noted among non-consumers (34.3%). This inverse correlation was even more pronounced for dairy products, where the highest level of concern was identified among individuals who never consumed the product (34.3%), while the lowest concern was evident among weekly consumers (20.8%). In contrast, for fresh meat, the degree of high concern remained notably consistent, at approximately 21%, across all consumption groups. Furthermore, information-seeking behavior emerged as a distinguishing factor exclusively for sandwich consumption, with active information seekers constituting a larger proportion of the weekly consumer segment (84.1%) relative to the non-consumer group (79.5%). However, for pre-cooked meat, dairy, and fresh meat, the proportion of information seekers remained stable at approximately 81-83% across all consumption levels, indicating that this behavior did not serve as a key differentiator for these particular products.
Temporal analysis of the survey year variable indicates shifts in the consumer base across all product categories. For sandwich consumption, the 2018 cohort demonstrated the highest proportion among monthly consumers (28.6%). A comparable trend was observed for pre-cooked meat, fresh meat, and dairy products, with the 2018 cohort also predominantly represented within their respective monthly consumption groups (30.2%, 33.7%, and 40.3%, respectively). Conversely, for these latter three categories, the 2018 cohort exhibited the lowest representation among weekly consumers, a pattern distinct from that seen for sandwiches.
3.2. Perceived MTL Print Size Readability
Figure 2 illustrates the perceived readability of MTL print size among diverse demographic and behavioral subgroups from 2012 to 2018. Where higher scores denote enhanced readability, the findings delineate significant disparities in food label perception across distinct subgroups. A pronounced and consistent age-related pattern is observed. Specifically, younger respondents (16–24 years) consistently reported the greatest ease of label comprehension, with their mean scores demonstrating an upward trajectory from 3.91 in 2012 to a peak of 4.23 in 2018. In contrast, middle-aged cohorts (45–54) experienced the most significant challenges in readability, indicated by a decline in scores from 2.88 to 2.58 during the corresponding timeframe. Older adults (65+), however, reported a moderate level of reading ease, characterized by stable mean scores approximating 3.2.
Household and socioeconomic factors also reveal distinct patterns. Respondents from high-income households (means around 3.5-3.6) consistently found labels easier to read than those from low-income households (means around 3.1-3.3). Similarly, those with no children at home reported significantly greater ease of reading (mean 3.75) than those with children (mean approximately 3.3). Geographically, residents in Wales reported finding labels easiest to read in 2012 (mean = 3.92), though this level later converged with England and Northern Ireland. Behavioral characteristics were also associated with perceived readability. Individuals who do not actively seek food information (mean 3.50 in 2012) reported greater ease of reading than active information seekers (mean 3.33 in 2012). Likewise, those with less shopping responsibility (Sometimes/Never) reported finding labels easier to read (mean approximately 3.5) than those with primary responsibility (mean around 3.4). Differences based on food safety concerns were less pronounced, with both high- and low-concern groups reporting similar levels of readability.
Regarding pre-packaged sandwiches, a distinct and consistent hierarchical pattern in perceived readability is evident across various consumption subgroups. Specifically, individuals categorized as never consumers consistently reported the highest mean readability scores, fluctuating between 3.78 in 2012 and 3.66 in 2018. Conversely, weekly consumers consistently indicated the lowest mean readability. In the context of pre-cooked meat, the observed pattern is less clearly delineated. Although monthly consumers generally reported the greatest ease of reading (mean 3.63 in 2012), the readability values across all three consumption segments were considerably similar and exhibited convergence over the study period, thus precluding the establishment of an enduring hierarchy. Dairy products revealed a hierarchical structure akin to that observed for sandwiches, albeit less pronounced: never consumers (mean 3.47 in 2012) and monthly consumers (mean 3.44 in 2012) consistently reported higher readability levels compared to the predominant weekly consumer subgroup. For fresh meat, the pattern is again less distinct and more closely resembles pre-cooked meat.
3.3. Perceived MTL Print Size Readability and Food Consumption Associations
Table 3 and Figure 3 present the findings derived from the ordinal logistic regressions conducted using non-equivalent dependent variables (NEDVs). Initial analysis revealed a statistically significant association exclusively concerning pre-packaged sandwiches (). Estimations elucidate a more intricate relationship when considering the interaction between perceived readability and the survey year. Specifically for pre-packaged sandwiches (Panel A), a notable dynamic relationship was discerned. During the baseline year of 2012, a statistically significant inverse relationship was observed (OR = 0.91, 95% CI [0.83, 0.99]), where in each one-unit increment in perceived readability correlated with an approximate 9% reduction in the odds of more frequent consumption. This negative relationship, reflected in the interaction terms, persisted through 2014 (-4%) and 2016 (-5%). This association underwent a transformation over the study period, evidenced by a significant positive interaction term for 2018 (Readability × 2018: OR = 1.15, 95% CI [1.02, 1.29]). Consequently, by 2018, the overall impact of readability had inverted (combined OR = 1.04), manifesting as a 4% increase in the odds of frequent consumption for each one-unit rise in perceived readability.
This dynamic association was not observed across the control outcome categories. Specifically, the analysis for pre-cooked meat (Panel B), dairy (Panel C), and fresh meat (Panel D) revealed no comparable temporal dynamic; neither the main association with readability nor its interactions with the survey year achieved statistical significance. This consistent pattern robustly indicates that the observed dynamic association is not a generalised consequence of label salience but rather an effect specific to the pre-packaged sandwich category. While this dynamic interaction was specific to this category, other significant temporal trends were observed across all models. Specifically, for pre-packaged sandwiches, the odds of frequent consumption in 2018 were reduced by 62% compared to those in 2012. In contrast, the odds of frequent consumption for pre-cooked meat demonstrated a significant elevation in subsequent years, increasing by 87% in 2016 and 73% in 2018 relative to the 2012 baseline. Furthermore, fresh meat consumption exhibited an even more pronounced increase, with the odds of frequent consumption in 2018 exceeding a two-fold rise.
3.4. Health Belief Associations
Table 4 and Table 5 show the findings from ordinal logistic regressions, stratified by health belief behavioral subgroups. The results confirms that the relationship between perceived MTL print size readability and consumption frequency is significantly influenced by product category, suggesting varied patterns of label engagement.
The analysis stratified by information-seeking behavior highlights a key divergence. Among non-information seekers, a significant negative correlation was observed between perceived readability and the frequency of pre-packaged sandwich consumption (OR = 0.81, 95% CI [0.69, 0.95]). In other words, each one-unit increment in perceived MTL print size readability correlated with an approximate 19% reduction in the odds of more frequent consumption. While the primary association did not achieve significance among information seekers, a statistically significant interaction with the year 2018 was exclusively observed within this group (OR = 1.15, 95% CI [1.01, 1.30]). This indicates that their relationship with readability has evolved, manifesting as a 7% increase in the odds of frequent consumption for each one-unit rise in perceived readability.
For the control pre-cooked meat, readability consistently showed no significant main or interaction effects in either group. This null finding is mirrored in the no-label falsification test, fresh meat. Notably, the dairy control analysis revealed a pattern analogous to that of sandwiches, where a significant main effect of readability was exclusively identified among non-information-seeking participants (OR = 0.65, 95% CI [0.46, 0.92]).
When stratifying by concerns regarding food safety, a comparable pattern was observed. Specifically for pre-packaged sandwiches, both the significant primary association with readability (OR = 0.90, 95% CI [0.82, 0.99]) and the notable interaction effect with the year 2018 (OR = 1.16, 95% CI [1.03, 1.31]) were observed solely among individuals expressing low levels of concern. In this subgroup, a one-unit increment in perceived MTL print size readability initially correlated with an approximate 10% reduction in the odds of more frequent consumption, a trend that subsequently evolved into a 4% increase by 2018. In the control categories of pre-cooked meat and dairy, readability did not emerge as a significant factor for either the high- or low-concern subgroups. Conversely, the no-label fresh meat model unexpectedly revealed a significant positive interaction with the year 2018 specifically within the high-concern group (OR = 1.40, 95% CI [1.08, 1.81]), despite the main effect of readability not reaching statistical significance for either subgroup.
3.5. Sensitivity Analysis
As a robustness check, we reframed the analysis using binary logistic regression, where consumption was classified as either Yes (any frequency) or No (never), while adjusting for the same control variables (see Appendix). The results from this binary approach reveal a consistent directional association for pre-package sandwiches compared to the ordinal model. For this product, a statistically significant negative association emerged suggesting that each one-unit increment in perceived MTL print size readability correlated with an approximate 16% reduction in the odds of being a consumer. The findings for the control outcome categories aligned with those obtained from the primary ordinal model, indicating an absence of a statistically significant association between perceived readability and the propensity for consumption. While this robustness check confirms the product-specific nature of the findings, it is important to note that the binary classification of consumption is a simplification. This approach may mask more subtle relationships by not distinguishing between different levels of consumption frequency, such as monthly versus weekly, which were considered in the primary ordinal analysis.
We conducted a sensitivity analysis to address the possibility of reverse causality. Specifically, we modelled readability as the outcome and consumption frequency as the predictor, adjusting for the same covariates (see Appendix). The results indicate that the direct association between these two variables was statistically significant for both pre-packaged sandwiches and pre-cooked meat. This significant reverse association underscores the importance of carefully considering the directional implications within the primary model. While our findings support strong reverse causality, the cross-sectional nature of the data means we cannot definitively establish the direction of the relationship. Future longitudinal studies are needed to clarify these dynamics.
While ready meal constitutes a distinct category within the UK Food and You Survey, its data availability was limited to 2016, thereby precluding the analysis of cross-sectional associations central to this research. For transparency, the ordinal logistic regression model for this specific category was included in the appendix. The resulting positive, non-statistically significant estimates corroborate the findings of our primary model for pre-cooked meat, although caution is required due to the small sample size.
Transportability is part of the external validity checks [67,68]. This analysis adjusts study results from a sample to a target population by accounting for differences in baseline characteristic distributions [69]. We accomplished this by generalizing the UK Food and You findings to the National Diet and Nutritional Survey (NDNS) target population, employing two generalized boosted models (GBM) with distinct sets of covariates. The first model included only demographic and socioeconomic covariates, while the second, which we refer to as the fully adjusted model in our main analysis, encompassed a broader set of variables. To examine the stability of our key findings, we recalculated the transportability weights and re-estimated the transported association for pre-packaged sandwiches under various specifications. This sensitivity analysis confirmed the robustness of the primary models. Specifically, for pre-packaged sandwiches, the significant association with readability remained stable and became more precise after full adjustment. Similarly, the null finding for pre-cooked meat was insensitive to the choice of adjustment variables.
Furthermore, to evaluate how well the transportability weights from our fully adjusted model balanced the covariate distributions, we performed two diagnostic checks. First, we created a table comparing the distributions of the shared covariates between the Food and You and NDNS samples. Second, we plotted the density of the estimated participation scores for both survey samples to visually assess their overlap and the success of the weighting adjustment.
4. Discussion
This study investigated the association between consumers’ perceived readability of MTL print size and the frequency of food consumption within the United Kingdom, using self-reported readability as a proxy for the successful completion of the salience-to-understanding pathway. Strengthened by non-equivalent dependent variables (NEDVs), our findings move beyond a simple product-specific interpretation, revealing a content-specific association. Specifically, we observed a significant and dynamic association between readability and consumption that was exclusive to pre-packaged sandwiches. This effect was absent for our other REM labelled product (pre-cooked meat), our healthy-labelled control (dairy), and the no-label falsification test (fresh meat).
Pre-packaged sandwich consumption patterns strongly support the notion that the salience-to-understanding pathway for food labels is not a universal phenomenon, but is rather content-dependent[70]. Specifically, in 2012, enhanced readability was linked to a 9% reduction in the odds of frequent consumption, consistent with the proposed warning mechanism. However, while the ongoing reduction persisted in 2014 and 2016, this relationship reversed by 2018, with the interaction term becoming positive and statistically significant. Practically, reducing consumption from weekly (52 sandwiches/year) to monthly (12 sandwiches/year) eliminate approximately 40 sandwiches from an individual’s annual diet. This reduction translates to roughly 16,000 fewer calories per year, a significant amount for both weight management and cardiovascular health [71]. This central finding was also validated through transportability analysis, confirming its robustness. Moreover, the outcomes observed for the control categories offer crucial corroboration for our hypothesis concerning the absence of this effect in contexts where a warning signal is not implicated. The consistent absence of a significant association for both the healthy-labeled dairy control and the unlabeled fresh meat control lends support to the prediction that, in scenarios where a label serves as a reinforcer instead of a warning, or is entirely absent, perceived readability does not operate as a salient behavioral cue [45,72].
The statistically significant interaction between perceived MTL print size readability and survey year, exclusively observed for pre-packaged sandwiches, indicates an evolving association. This reversal in the relationship is interpreted as a reflection of broader transformations within the food environment, rather than being solely attributable to a straightforward consumer learning effect [16,24,46]. As manufacturers adapted to MTL regulations, product reformulations and enhanced marketing strategies may have recontextualized the MTL, shifting its perception from an avoidable option to a marker of a standard convenience item [73]. This aligns with recent research on REM consumption, which confirms the dominance of new ready meal varieties in the UK market, often featuring claims such as the absence of additives or preservatives, vegetarian/vegan suitability, environmentally friendly packaging, and microwave compatibility [6,73]. Consequently, by 2018, a product category already established for its convenience could plausibly be associated with increased consumption, notwithstanding the presence of health-related warnings. The increased consumption may also stem from the dilution of health warnings’ effectiveness due to their widespread presence and sophisticated marketing of convenience foods, potentially desensitizing consumers rather than leading to a complete disregard for health information [74,75]. This complex interplay warrants further investigation.
For pre-packaged sandwiches, the results showed that the main effect of readability was significant and negative exclusively for non-information seekers and those with low concern. This supports the hypothesis that content-specific readability acts as a primary behavioral cue for less-engaged consumer groups [46,76]. Specifically, each one-unit increment in perceived MTL print size readability was associated with an approximate 19% and 10% reduction in the odds of more frequent consumption for non-information seekers and those with low concern, respectively. Consistent with the primary finding, this association also reversed over time within these segments. For pre-cooked meat and dairy, no significant main or interaction effects were found in almost any subgroup, reinforcing their null status. The fresh meat model was also largely null, with the exception of an unexpected positive 2018 interaction for the high-concern group. Despite this anomaly, the overwhelming pattern across subgroups and NEDVs is one of null effects, reinforcing the uniqueness of the sandwich findings. This pattern observed suggests that the efficacy of the MTL is more dependent on consumer engagement and beliefs than on the mere dissemination of information, as postulated by nudging theories [27,72,77,78,79].
The product-specific nature of our findings is further explained by the distinct demographic profiles of the consumer bases for each food category. The profile of the high-frequency pre-package sandwich consumer aligns with a convenience-driven mindset. This group is markedly female (62.4%), younger (with the 18-24 and 25-34 age brackets making up over 43.7% of weekly consumers), and has less shopping responsibility (56.6%). These consumer trends align with the broader trends in ultra-processed food consumption in the UK [80,81]. This contrasts with the consumer base for pre-cooked meat, which is older and more balanced. Our NEDVs fit this logic highlighting that the fresh meat consumer profile closely mirrors that of pre-cooked meat, suggesting a similar motivation. The dairy consumer base is nearly universal, representing a demographically balanced staple, unlike the specific, convenience-oriented profile of the sandwich consumer [1].
The present study corroborates that consumers’ subjective understanding of labels is not uniform, but rather exhibits systematic variations across distinct consumer profiles. Descriptive analysis indicated that younger consumer subgroups (16–24 years) consistently reported the highest perceived ease of reading, whereas middle-aged (45–54 years) demographics encountered the greatest challenges. Concurrently, individuals from higher-income brackets and those without dependent children at home consistently reported superior readability perceptions. These systematic perceptual disparities underscore the inadequacy of a standardized, one-size-fits-all approach to food labelling, given that the foundational stage of the salience-to-understanding pathway is not uniformly experienced across the consumer populace. Although a significant portion of extant research on food labels presupposes a baseline level of readability [25,26], our findings emphasize that the perception of print size constitutes a critically heterogeneous factor. This observation aligns with evidence from other health-related contexts, wherein informational clarity serves as a fundamental prerequisite for comprehension [37,38].
This research significantly contributes to food policy by addressing the well-documented discrepancy between consumers’ reported engagement with and comprehension of MTL labels and the limited influence these labels have on purchasing behaviors [17,18,19,35]. Our findings indicate that the association between label readability and consumer choice is contingent not only on the product itself but also on the specific content of the label. For instance, an enlarged font size might exert a more pronounced effect on the purchasing decisions for an ambiguous convenience item featuring a red warning, yet it may have a negligible impact on products perceived as healthy or those constituting traditional meal components. Consequently, policy interventions should not presuppose a uniform effect across all contexts. While increasing print size could be an effective strategy, our results suggest that its efficacy is moderated by both the message’s content and the particular product category to which it is applied.
Limitations
This study’s primary strength lies in its use of a large, nationally representative dataset to examine the real-world association between label readability and consumer choice, a context that distinguishes our approach from research that relies predominantly on experimental designs. By analyzing observational data spanning the 2013 MTL redesign (2012-2018), we were able to capture cross-sectional trends. This temporal perspective was crucial for uncovering our key findings.
Methodologically, the study makes several contributions. The use of proportional odds ordinal logistic regression provided the flexibility to model the nuanced nature of consumption frequency without imposing restrictive assumptions. In addition, our study’s primary contribution is the formal transportability analysis, which moves beyond a simple qualitative statement of limitation to provide robust, model-based evidence for the external validity of our findings.
This investigation offers valuable insights into real-world phenomena; however, several limitations warrant consideration. Primarily, the data structure inherently constrains the ability to draw definitive causal inferences. Given the simultaneous nationwide implementation of the MTL policy in the UK, it was not feasible to distinguish distinct treatment groups, thereby impeding robust causal identification. While tests for reverse causality lent support to a reverse association, the study is confined to reporting statistical associations rather than establishing causal effects.
The observed reversal in the association for pre-package sandwiches may stem from concurrent, unmeasured events, such as broader public health campaigns or shifts in product marketing, instead of solely reflecting individual-level adaptation to the MTL. Consequently, while the repeated cross-sectional analysis offers a strength, population-level trends warrant cautious interpretation given the risk of an ecological fallacy.
Second, there are limitations related to our key measures. Our central variable, perceived readability, is a self-reported proxy for the salience-to-understanding pathway, not a direct objective measure of comprehension. Similarly, the consumption data is self-reported and may be subject to recall or social desirability biases. We sought to mitigate this by cross-validating our consumption trends against the UK National Diet and Nutrition Survey, which showed comparable patterns and lends external validity to our findings. Finally, while our study highlights the crucial role of print size, a limitation is that our measure of perceived readability cannot be fully disentangled from other interacting design elements on a package, such as color contrast, layout, and font type, which also contribute to a label’s overall salience and ease of processing.
Third, the dataset presented statistical challenges, notably a significant portion of missing income data. As this exceeded 20% of the sample, imputation was not used, which consequently reduced the statistical power in our models. Furthermore, due to inconsistencies in how consumption frequency was measured across different food categories in the UK Food and You Survey, we could not extend this comparative analysis to other types of food products.
5. Conclusions
The association between the perceived MTL print size readability and consumption frequency is intricate and contingent not just on product type but on the label’s content and the product’s context. Our primary finding strengthened by non-equivalent dependent variables indicates that the role of label salience is highly specific. We found a significant dynamic association isolated exclusively to pre-package sandwiches which reversed from a 9% decrease in the odds of frequent consumption in 2012 to a 4% increase by 2018. Conversely a persistent null association was found for pre-cooked meat our healthy-labeled control dairy and our no-label falsification test fresh meat. This pattern strongly supports our hypothesis that the salience-to-understanding pathway as proxied by readability functions as a warning mechanism where its effect is specific to the red health warnings on ambivalent convenience foods and is not a general effect of all labels. The association for sandwiches was strongest among less-engaged consumer groups supporting a model where readability acts as the primary behavioral cue. Theoretically our findings challenge the efficacy of a uniform approach to label-based interventions. Our results emphasize the necessity for public health strategies to transcend the mere provision of information.
Author Contributions
Conceptualization, C.A., N.S. and Y.W.; methodology, C.A.; validation, C.A., N.S. and Y.W.; formal analysis, C.A.; data curation, C.A.; writing—original draft preparation, C.A.; writing—review and editing, C.A., N.S. and Y.W.; visualization, C.A.; supervision, N.S. and Y.W. All authors have read and agreed to the published version of the manuscript.
Funding
This work was supported by the ANID-Chile (Agencia Nacional de Investigación y Desarrollo) under grant number 720210020. The funders had no role in study design, data collection and analysis, decision to publish, or preparation of the manuscript.
Institutional Review Board Statement
Not applicable.
Informed Consent Statement
Not applicable.
Data Availability Statement
Publicly available datasets were analyzed in this study. The data from the Food and You Survey can be found in the UK Data Service at https://beta.ukdataservice.ac.uk/datacatalogue/series/series?id=2000053 and on the UK Food Standards Agency (FSA) website at https://www.food.gov.uk/. Additional data regarding food labelling guidelines and calorie reduction targets are available from Public Health England via https://www.gov.uk/government/organisations/public-health-england.
Acknowledgments
Part of this work was done while Constanza Avalos was Enrichment Student at the Alan Turing Institute. Therefore, we would like to thank the Institute for their welcoming and all the helpful and inspiring discussions, in particular with Turing Research and Innovation Cluster in Digital Twins. Besides, we would like to thank the acting editors for their work and their numerous comments, which helped us to improve a lot the quality of the manuscript. Furthermore, I would like to thank Dr. Yan Wang and Dr. Nick Shryane for their invaluable mentorship and advice, and the RAGS Social Statistics seminars of the Department of Social Statistics at the University of Manchester for comments and suggestions. I also wish to thank Javiera Ponce for her excellent research assistance.
Conflicts of Interest
The authors declare no conflicts of interest.
Abbreviations
The following abbreviations are used in this manuscript:
| FOP | Front-of-Package |
| REM | Ready-to-Eat Meals |
| FSA | Food Standards Agency |
| FYS | UK Food and You Survey |
| MTL | Multiple Traffic Light |
| NDNS | National Diet and Nutrition Survey |
| UK | United Kingdom |
| NEDVs | Non-equivalent dependent variables |
| VIF | Variance Inflation Factor |
| OR | Odds ratios |
| SE | Standard errors |
| CI | Confidence intervals |
Appendix A.
Appendix A.1
QUESTION: At the moment, how often do you eat INSERT FOOD?
Alternatives:
- Cuts or portions of beef, lamb or pork, for example joints, steak, chops
- Burgers
- Sausages
- Chicken or turkey
- Duck or goose
- Pre-cooked meats
- Cured or dried meats
- Milk and dairy foods like cheese and yoghurt (INTERVIER NOTE: THIS INCLUDES DRINKING MILK, MILK IN TEA ETC.)
- Raw milk – by raw milk I mean milk that has not been pasteurised.
- Cooked eggs
- Cooked eggs? Please also think about food containing cooked eggs.
- Raw or uncooked eggs, including in things like homemade mayonnaise or homemade royal icing
- Cooked or smoked fish, excluding shellfish
- Cooked shellfish, for example crab, prawns, lobster, mussels
- Raw oysters
- Raw fruit
- Raw vegetables, including salad
- Cooked vegetables
- Frozen fruits, for example berries
- Pre-packed sandwiches
- Ready meals

Table A1.
Brant Test of the Parallel Regression Assumption.
| Pre-package Sandwich | Pre-cooked Meat | |||
|---|---|---|---|---|
| Variable | p-value | p-value | ||
| Omnibus Test | 176.11 | <.001 | 159.57 | <.001 |
| Readability (Q6_4) | 3.52 | 0.061 | 0.43 | 0.510 |
| Sex | 42.09 | <.001 | 0.64 | 0.424 |
| Age | 12.42 | <.001 | 2.31 | 0.129 |
| Religion | 0.74 | 0.391 | 4.81 | 0.028 |
| High Income | 7.11 | 0.008 | 28.34 | <.001 |
| Low Income | 0.65 | 0.421 | 1.64 | 0.200 |
| Area (Urban/Rural) | 7.31 | 0.007 | 3.57 | 0.059 |
| Shopping Responsibility | 0.05 | 0.817 | 1.07 | 0.302 |
| Children at home | 2.11 | 0.147 | 5.37 | 0.021 |
| Household size | 3.08 | 0.079 | 10.59 | 0.001 |
| Marital status | 19.82 | <.001 | 0.18 | 0.667 |
| Country | 0.43 | 0.513 | 0.22 | 0.641 |
| Survey year | 13.24 | <.001 | 14.43 | <.001 |
Note: A significant p-value suggests the parallel regression assumption is violated. Null Hypothesis (H0): Parallel Regression Assumption holds. Significance levels: , , .
Table A2.
Binary logistic regression results: associations of perceived MTL readability and food consumption frequency (adjusted for all sociodemographic, behavioural, and temporal variables).
Table A2.
Binary logistic regression results: associations of perceived MTL readability and food consumption frequency (adjusted for all sociodemographic, behavioural, and temporal variables).
| Pre-package Sandwich | Pre-cooked Meat | Dairy | Fresh Meat | |||||
|---|---|---|---|---|---|---|---|---|
| Variable | (SE) | OR [95% CI] | (SE) | OR [95% CI] | (SE) | OR [95% CI] | (SE) | OR [95% CI] |
| Readability | -0.17 (0.05) | 0.84 [0.77, 0.92] | 0.09 (0.06) | 1.09 [0.98, 1.22] | -0.09 (0.15) | 0.92 [0.68, 1.23] | 0.14 (0.09) | 1.15 [0.96, 1.36] |
| Year (vs. 2012) | ||||||||
| 2014 | -0.20 (0.18) | 0.82 [0.58, 1.16] | 0.17 (0.25) | 1.18 [0.73, 1.92] | 0.25 (0.60) | 1.28 [0.39, 4.17] | 0.68 · (0.37) | 1.97 [0.96, 4.04] |
| 2016 | 0.11 (0.18) | 1.11 [0.78, 1.58] | 0.12 (0.25) | 1.13 [0.70, 1.82] | -0.53 (0.65) | 0.59 [0.17, 2.09] | -0.13 (0.34) | 0.88 [0.45, 1.69] |
| 2018 | 0.19 (0.18) | 1.20 [0.84, 1.72] | -0.02 (0.25) | 0.98 [0.61, 1.59] | -1.17 · (0.60) | 0.31 [0.09, 1.01] | -0.45 (0.34) | 0.64 [0.33, 1.23] |
| Interactions | ||||||||
| Readability × 2014 | 0.08 (0.06) | 1.08 [0.96, 1.22] | -0.08 (0.09) | 0.92 [0.77, 1.10] | -0.18 (0.20) | 0.83 [0.56, 1.25] | -0.27 (0.12) | 0.76 [0.60, 0.97] |
| Readability × 2016 | 0.09 (0.06) | 1.09 [0.96, 1.23] | -0.17 (0.08) | 0.84 [0.72, 0.99] | -0.05 (0.20) | 0.95 [0.64, 1.41] | -0.17 (0.11) | 0.84 [0.68, 1.05] |
| Readability × 2018 | 0.17 (0.06) | 1.19 [1.05, 1.35] | -0.14 (0.08) | 0.87 [0.74, 1.03] | 0.03 (0.19) | 1.03 [0.71, 1.49] | -0.01 (0.11) | 0.99 [0.79, 1.23] |
Note: Outcome is binary (Consumer = 1, Never = 0). Table displays coefficients () with standard errors (SE), odds ratios (OR), and 95% confidence intervals (CI). Significance levels: · , , , .
Table A3.
Reverse Causality: Ordinal logistic regression predicting perceived MTL readability from food consumption frequency (adjusted for all sociodemographic, behavioural, and temporal variables)
Table A3.
Reverse Causality: Ordinal logistic regression predicting perceived MTL readability from food consumption frequency (adjusted for all sociodemographic, behavioural, and temporal variables)
| Pre-package Sandwich | Pre-cooked Meat | Dairy | Fresh Meat | |||||
|---|---|---|---|---|---|---|---|---|
| Predictor | (SE) | OR [95% CI] | (SE) | OR [95% CI] | (SE) | OR [95% CI] | (SE) | OR [95% CI] |
| Consumption | ||||||||
| (vs. Never) | ||||||||
| Monthly | -0.27 (0.12) | 0.76 [0.60, 0.96] | 0.34 (0.17) | 1.41 [1.00, 1.97] | -0.21 (0.53) | 0.81 [0.29, 2.27] | 0.23 (0.23) | 1.26 [0.80, 1.97] |
| Weekly | -0.43 (0.14) | 0.65 [0.49, 0.85] | 0.24 (0.14) | 1.27 [0.96, 1.68] | -0.04 (0.40) | 0.96 [0.44, 2.10] | 0.38 (0.21) | 1.46 [0.97, 2.20] |
| Interactions | ||||||||
| Monthly×2014 | 0.26 (0.15) | 1.29 [0.96, 1.74] | -0.20 (0.25) | 0.82 [0.51, 1.33] | -0.54 (0.69) | 0.58 [0.15, 2.26] | -0.48 (0.30) | 0.62 [0.34, 1.12] |
| Weekly×2014 | 0.15 (0.20) | 1.16 [0.78, 1.73] | -0.11 (0.19) | 0.90 [0.61, 1.31] | -0.45 (0.51) | 0.64 [0.23, 1.75] | -0.54 (0.29) | 0.58 [0.33, 1.02] |
| Monthly×2016 | 0.22 (0.16) | 1.24 [0.91, 1.69] | -0.49 (0.24) | 0.61 [0.38, 0.98] | -0.27 (0.72) | 0.76 [0.18, 3.12] | -0.32 (0.29) | 0.73 [0.41, 1.28] |
| Weekly×2016 | 0.21 (0.20) | 1.23 [0.82, 1.83] | -0.54 (0.20) | 0.58 [0.40, 0.86] | -0.53 (0.52) | 0.59 [0.21, 1.63] | -0.49 (0.26) | 0.61 [0.37, 1.02] |
| Monthly×2018 | 0.34 (0.16) | 1.41 [1.03, 1.93] | -0.36 (0.23) | 0.70 [0.44, 1.10] | 0.11 (0.64) | 1.12 [0.32, 3.96] | 0.16 (0.28) | 1.17 [0.67, 2.04] |
| Weekly×2018 | 0.49 (0.21) | 1.64 [1.08, 2.47] | -0.30 (0.19) | 0.74 [0.51, 1.08] | -0.20 (0.48) | 0.82 [0.32, 2.12] | -0.11 (0.26) | 0.90 [0.53, 1.51] |
Note: Outcome variable is Perceived Readability. Table displays coefficients () with standard errors (SE), odds ratios (OR), and 95% confidence intervals (CI). Significance levels: , , .
Table A4.
Ordinal logistic regression results for ready meal category (2016)
| Ready meals (2016) | |||
|---|---|---|---|
| Variable | (SE) | OR | 95% CI |
| Readability | 0.003 | 1.00 | [0.93, 1.09] |
| (0.040) | |||
Note: Table displays coefficients (), standard errors (SE), odds ratios (OR), and 95% confidence intervals (CI). Model adjusted for all covariates in 2016. Significance levels: , , .
Table A5.
Ordinal logistic regression results: associations of perceived MTL print size and REM consumption frequency (unadjusted).
Table A5.
Ordinal logistic regression results: associations of perceived MTL print size and REM consumption frequency (unadjusted).
| Pre-package Sandwich | abc | Pre-cooked Meat | |||||
|---|---|---|---|---|---|---|---|
| Variable | (SE) | OR | 95% CI | (SE) | OR | 95% CI | |
| Readability | -0.036 | 0.964 | [0.921, 1.010] | -0.012 | 0.988 | [0.944, 1.034] | |
| (0.023) | (0.023) | ||||||
Note: Table displays coefficients (), standard errors (SE), odds ratios (OR), and 95% confidence intervals (CI). Significance levels: , , .
Table A6.
Mean and Standard Errors (SE) perceived readability of MTL labelling from 2012 to 2018, stratified by sociodemographic characteristics, behavioral characteristics, food products.
Table A6.
Mean and Standard Errors (SE) perceived readability of MTL labelling from 2012 to 2018, stratified by sociodemographic characteristics, behavioral characteristics, food products.
| Variable | Category | 2012 | 2014 | 2016 | 2018 |
|---|---|---|---|---|---|
| Sex | Male | 3.42 (0.05) | 3.42 (0.05) | 3.38 (0.05) | 3.32 (0.05) |
| Female | 3.50 (0.06) | 3.49 (0.05) | 3.40 (0.06) | 3.46 (0.06) | |
| Age | 16-24 | 3.91 (0.12) | 4.03 (0.11) | 3.90 (0.14) | 4.23 (0.12) |
| 25-34 | 4.13 (0.07) | 3.97 (0.08) | 4.02 (0.08) | 4.07 (0.07) | |
| 35-44 | 2.87 (0.09) | 2.95 (0.09) | 2.87 (0.08) | 2.91 (0.09) | |
| 45-54 | 2.88 (0.07) | 2.91 (0.07) | 2.85 (0.06) | 2.58 (0.05) | |
| 55-64 | 3.93 (0.07) | 3.82 (0.07) | 3.90 (0.07) | 3.93 (0.07) | |
| 65+ | 3.11 (0.08) | 3.21 (0.07) | 3.16 (0.08) | 3.18 (0.09) | |
| Income | Low income | 3.30 (0.06) | 3.31 (0.05) | 3.20 (0.07) | 3.13 (0.06) |
| High income | 3.59 (0.05) | 3.55 (0.05) | 3.51 (0.05) | 3.53 (0.05) | |
| Religion | Christian | 3.67 (0.07) | 3.68 (0.05) | 3.51 (0.06) | 3.71 (0.06) |
| Other religion | 3.35 (0.05) | 3.33 (0.05) | 3.31 (0.05) | 3.11 (0.05) | |
| No religion | 3.60 (0.16) | 3.33 (0.21) | 3.54 (0.16) | 3.67 (0.15) | |
| Area | Urban | 3.50 (0.04) | 3.47 (0.04) | 3.41 (0.05) | 3.46 (0.05) |
| Rural | 3.21 (0.12) | 3.32 (0.10) | 3.32 (0.08) | 3.17 (0.09) | |
| Children at home | Yes | 3.35 (0.05) | 3.31 (0.05) | 3.24 (0.05) | 3.23 (0.05) |
| No | 3.75 (0.07) | 3.78 (0.06) | 3.75 (0.06) | 3.75 (0.07) | |
| Shopping responsability | All/Most | 3.38 (0.05) | 3.40 (0.04) | 3.37 (0.05) | 3.31 (0.05) |
| Sometimes/Never | 3.55 (0.06) | 3.51 (0.05) | 3.42 (0.06) | 3.48 (0.06) | |
| Country | England | 3.46 (0.05) | 3.46 (0.04) | 3.39 (0.05) | 3.39 (0.05) |
| Wales | 3.92 (0.09) | 3.44 (0.12) | 3.55 (0.09) | 3.59 (0.09) | |
| Northern Ireland | 3.23 (0.16) | 3.37 (0.07) | 3.29 (0.11) | 3.28 (0.08) | |
| Concern safe eating | High | 3.46 (0.05) | 3.46 (0.04) | 3.45 (0.04) | 3.38 (0.05) |
| Low | 3.46 (0.08) | 3.45 (0.09) | 3.18 (0.10) | 3.43 (0.08) | |
| Information seeking | Yes | 3.33 (0.09) | 3.19 (0.09) | 3.09 (0.09) | 3.21 (0.09) |
| No | 3.50 (0.05) | 3.50 (0.04) | 3.46 (0.04) | 3.44 (0.05) | |
| Pre-package sandwich | Never | 3.78 (0.09) | 3.75 (0.09) | 3.64 (0.09) | 3.66 (0.09) |
| Monthly | 3.59 (0.06) | 3.46 (0.06) | 3.45 (0.06) | 3.36 (0.06) | |
| Weekly | 3.27 (0.06) | 3.34 (0.05) | 3.25 (0.05) | 3.28 (0.07) | |
| Pre-cooked meat | Never | 3.45 (0.05) | 3.46 (0.05) | 3.44 (0.05) | 3.38 (0.05) |
| Monthly | 3.63 (0.09) | 3.48 (0.08) | 3.36 (0.09) | 3.45 (0.09) | |
| Weekly | 3.36 (0.08) | 3.42 (0.08) | 3.33 (0.07) | 3.37 (0.07) | |
| Diary | Never | 3.47 (0.04) | 3.46 (0.04) | 3.40 (0.04) | 3.39 (0.04) |
| Monthly | 3.44 (0.29) | 3.55 (0.27) | 3.22 (0.30) | 3.53 (0.19) | |
| Weekly | 3.30 (0.29) | 3.00 (0.23) | 3.20 (0.25) | 3.36 (0.19) | |
| Fresh eat | Never | 3.47 (0.09) | 3.47 (0.07) | 3.44 (0.07) | 3.37 (0.06) |
| Monthly | 3.44 (0.05) | 3.47 (0.05) | 3.38 (0.05) | 3.35 (0.05) | |
| Weekly | 3.73 (0.14) | 3.30 (0.13) | 3.37 (0.10) | 3.65 (0.11) |
Appendix B. Ready-to Eat Meals Consumption Patterns
Table A7 reveals updated temporal patterns in ready-to-eat meal consumption. For pre-packaged sandwiches, weekly consumption was relatively low but rose modestly over the six-year span, climbing from 17.3% in 2012 to 20.1% in 2018 (a 2.8-percentage-point increase). A larger shift occurred among occasional users: monthly consumption expanded from 33.4% to 42.4%, while the share of respondents who never ate pre-packaged sandwiches fell sharply from 49.3% to 37.5%. These changes indicate a movement away from complete avoidance toward at least occasional use of pre-packaged sandwiches. Pre-cooked meat products displayed the opposite trajectory. Weekly consumption started high at 66.4% in 2012 but declined steadily to 50.9% in 2018 (−15.5 percentage points). Meanwhile, monthly consumption nearly doubled—from 18.0% to 28.4% —and the proportion who never consumed pre-cooked meat inched up from 15.7% to 20.7%. Together, these figures suggest that some regular consumers of pre-cooked meats reduced the frequency of intake, shifting into the monthly or non-consumer categories by 2018.
To validate the Food and You patterns, we compared consumption trends with data from the National Diet and Nutrition Survey (NDNS). While NDNS does not include identical product categories, it captures consumption of manufactured meat products and ready meals (including beef, chicken, pork, and fish-based products) measured. To estimate the annual prevalence of ready-to-eat meal consumption in the NDNS, we first identified all relevant ready-to-eat or manufactured products (see Ready-to-Eat Meals list in NDNS 2008-2019). For each survey participant, we summed the number of ready-made products reported consumed during the 4-day period. Individuals reporting at least one ready meal were classified as consumers. To ensure national representativeness, we calculated the weighted annual prevalence of ready meal consumption for each survey year.
Table A7.
Comparative analysis of REM consumption trends: Food and You and NDNS Data (No survey weights).
Table A7.
Comparative analysis of REM consumption trends: Food and You and NDNS Data (No survey weights).
| Food and You Survey | Category | 2012 | 2014 | 2016 | 2018 |
|---|---|---|---|---|---|
| n = 8954 | n = 2136 | n = 2336 | n = 2309 | n = 2173 | |
| Pre-package sandwich | Weekly | 369 (17.3%) | 455 (19.5%) | 415 (18.0%) | 437 (20.1%) |
| Monthly | 713 (33.4%) | 741 (31.7%) | 849 (36.8%) | 921 (42.4%) | |
| Never | 1054 (49.3%) | 1141 (48.8%) | 1045 (45.3%) | 815 (37.5%) | |
| Pre-cooked meat | Weekly | 1418 (66.4%) | 1505 (64.4%) | 1271 (55.0%) | 1107 (50.9%) |
| Monthly | 384 (18.0%) | 446 (19.1%) | 591 (25.6%) | 616 (28.4%) | |
| Never | 334 (15.7%) | 386 (16.5%) | 447 (19.4%) | 450 (20.7%) | |
| NDNS | n = 3019 | n = 795 | n = 764 | n = 758 | n = 702 |
| Ready-to-eat meals | Annually | 531 (66.7%) | 468 (61.2%) | 505 (67.0%) | 491 (70.0%) |
The comparison reveals several key convergences that support external validity. First, temporal trends align consistently across datasets: NDNS ready meal consumption increased from 66.7% to 70.0% (2012-2018), paralleling the FYS’s documented shift toward more frequent convenience food consumption. Specifically, weekly and monthly pre-cooked meat consumption rose indicating growing acceptance of manufactured meat products that mirrors NDNS trends. Second, the magnitude of consumption patterns demonstrates comparable population engagement with convenience foods. NDNS data showing approximately 67% annual ready meal consumption aligns with Food and You findings that 33.4% of respondents consume pre-packaged sandwiches at least monthly in 2012, increasing to 42.4%. Third, both surveys capture similar demographic representativeness with substantial sample sizes (FYS: n=8854; NDNS: n=3019) and consistent year-over-year participation, lending confidence to trend analyses.
Appendix B.1. Ready-to-Eat Meals list in NDNS 2008-2019
- MANUFACTURED BEEF PRODUCTS INCLUDING READY MEALS
- MANUFACTURED CANNED TUNA PRODUCTS INCL READY MEALS
- MANUFACTURED CHICKEN PRODUCTS INCL READY MEALS
- MANUFACTURED COATED CHICKEN / TURKEY PRODUCTS
- MANUFACTURED EGG PRODUCTS INCLUDING READY MEALS
- MANUFACTURED LAMB PRODUCTS INCLUDING READY MEALS
- MANUFACTURED MEAT PIES AND PASTRIES
- MANUFACTURED OILY FISH PRODUCTS INCL READY MEALS
- MANUFACTURED PORK PRODUCTS INCLUDING READY MEALS
- MANUFACTURED SHELLFISH PRODUCTS INCL READY MEALS
- MANUFACTURED WHITE FISH PRODUCTS INCL READY MEALS
- MEAT ALTERNATIVES INCL READY MEALS & HOMEMADE DISH
- OTHER MEAT PRODUCTS MANUFACTURED INCL READY MEALS
- READY MEALS BASED ON SAUSAGES
Appendix B.2. Transportability Analysis
To validate and evaluate the applicability of our primary findings, we conduct a non-nested transportability analysis [67]. This analysis adjusts the results from a study sample to align with a target population by accounting for differences in baseline characteristic distributions [69]. Although similar weighting techniques have recently been employed to transport causal estimates from randomized trials to representative survey populations, we modified these techniques to assess the consistency of a statistical association between two distinct national representative surveys [82,83]. In this study, the application of transportability methods is justified by the inherent differences in diet measurement and sampling methodologies employed in nutritional surveys. Food and You survey served as the study sample, characterized by a single visit including questions on attitudes and perceptions, whereas the target population was drawn from the NDNS, which utilizes a exhaustive 4-day food diary [1,84]. To meet the positivity assumption necessary for transportability, the NDNS sample excluded participants from Scotland, and included only adults who consumed at least one ready-to-eat meal product between 2012 and 2019 (see Appendix). After applying these exclusion criteria, the final NDNS sample included 1988 participants.
Table A8.
Covariate distributions between the Food & You and NDNS Samples. All covariates included in the participation model.
Table A8.
Covariate distributions between the Food & You and NDNS Samples. All covariates included in the participation model.
| Characteristic | Level | Food & You | NDNS Target |
|---|---|---|---|
| (Unweighted) | (Weighted) | ||
| (N = 8949) | (N = 1988) | ||
| Sex | |||
| Male | 4470 (49.9%) | 853 (42.9%) | |
| Female | 4479 (50.1%) | 1135 (57.1%) | |
| Age Group | |||
| 16-24 | 996 (11.1%) | 201 (10.1%) | |
| 25-34 | 1556 (17.4%) | 302 (15.2%) | |
| 35-44 | 1542 (17.2%) | 335 (16.9%) | |
| 45-54 | 1764 (19.7%) | 352 (17.7%) | |
| 55-64 | 1232 (13.8%) | 311 (15.6%) | |
| 65+ | 1859 (20.8%) | 487 (24.5%) | |
| Household Size | |||
| 1 | 1548 (17.3%) | 512 (25.8%) | |
| 2 | 3315 (37.0%) | 697 (35.1%) | |
| 3 | 1697 (18.9%) | 304 (15.3%) | |
| 4+ | 2389 (26.7%) | 475 (23.9%) | |
| Marital Status | |||
| Married/Similar | 5294 (59.2%) | 923 (46.4%) | |
| Single/Similar | 3655 (40.8%) | 1065 (53.6%) | |
| Children at home | |||
| No | 6291 (70.3%) | 1623 (81.6%) | |
| Yes | 2658 (29.7%) | 365 (18.4%) | |
| Income Tercile | |||
| Lowest | 4539 (49.3%) | 509 (25.6%) | |
| Middle | 2657 (28.9%) | 557 (28.0%) | |
| Highest | 2006 (21.8%) | 682 (34.3%) | |
| Missing | 0 (0.0%) | 240 (12.1%) | |
| Country | |||
| England | 8232 (91.9%) | 1461 (73.5%) | |
| Wales | 456 (5.1%) | 286 (14.4%) | |
| N. Ireland | 261 (2.9%) | 241 (12.1%) |
Note: The NDNS target sample is filtered to include adults from England, Wales, and Northern Ireland who consumed REM between 2012-2019.
To interpret the results derived from transportability analyses as indicators of the MTL readability’s effectiveness within the NDNS population, we establish two primary assumptions. Firstly, we presume the transportability of MTL readability’s effects, conditional on the observed covariates, across differing Food and You participation statuses [67,83]. Essentially, this assumption posits that the covariates incorporated into the model for predicting Food and You participation are adequate for adjusting for selective participation in the survey [68]. Secondly, we assume that every combination of these covariates present in the NDNS population has a non-zero probability of being represented within the Food and You sample [67].
Figure A1.
Distribution of the estimated participation scores for the Food & You (F&Y) and National Diet and Nutrition Survey (NDNS) samples. Panel (A) shows the distributions before weighting, and Panel (B) shows the distributions after applying the inverse probability of sampling weights to the F&Y sample. The improved overlap in Panel (B) supports the positivity assumption for the transportability analysis.
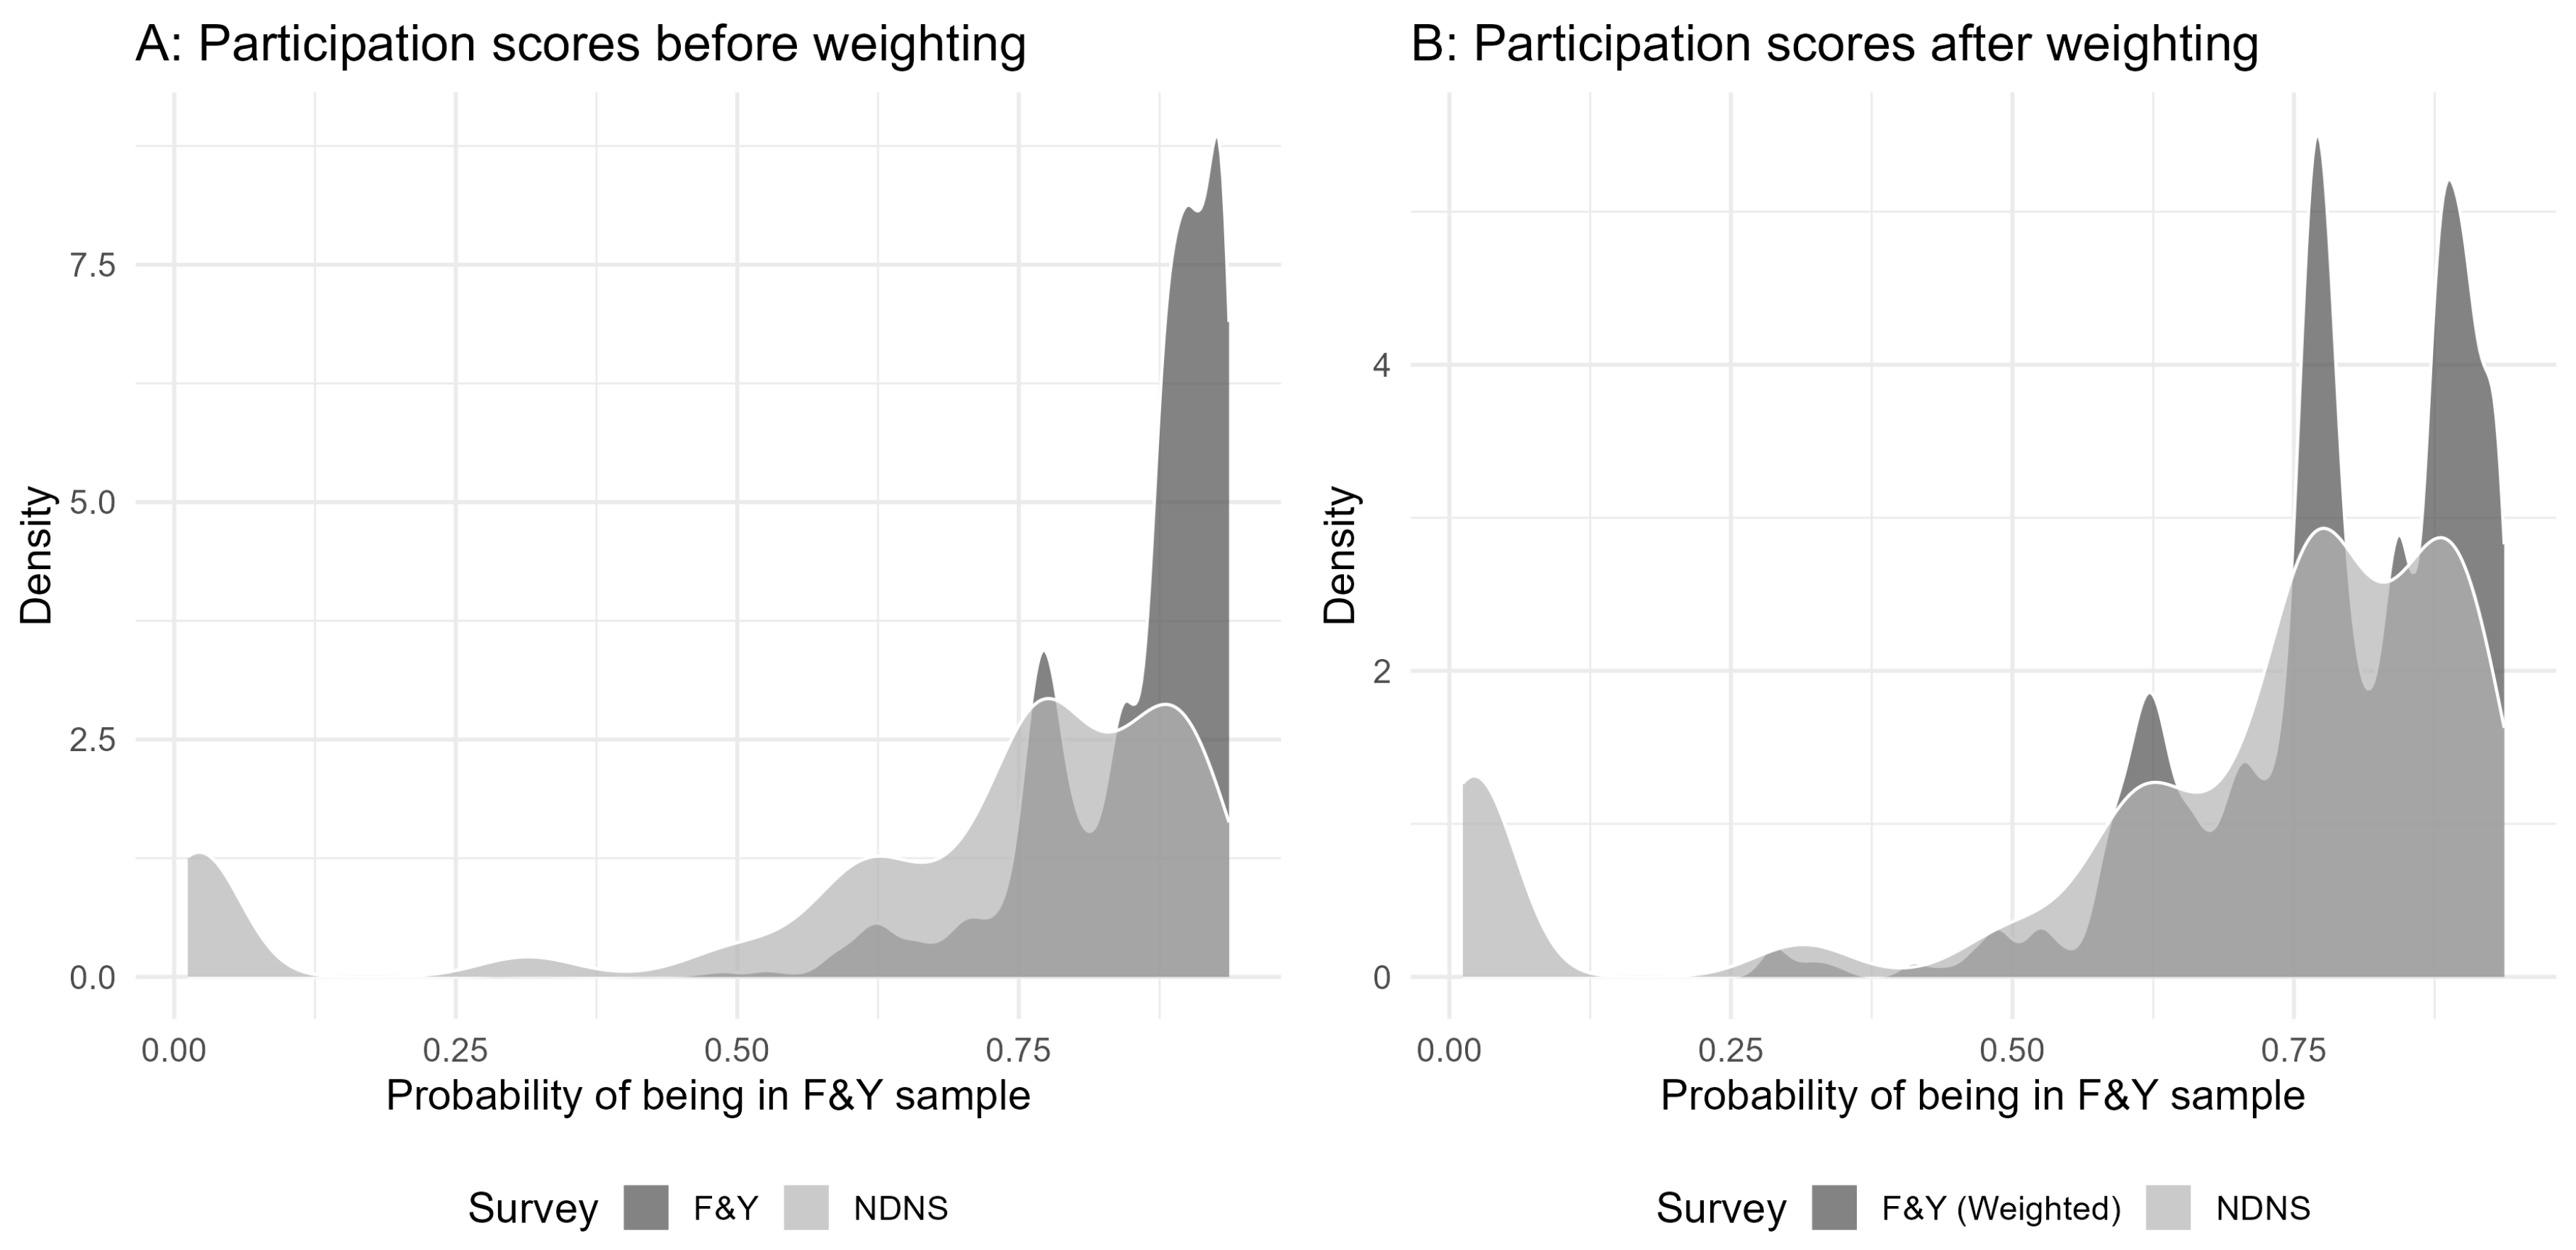
Table A9.
Sensitivity Analysis: Comparison of transported associations using different covariate sets in the participation model.
Table A9.
Sensitivity Analysis: Comparison of transported associations using different covariate sets in the participation model.
| Transported (Demographics Model) | Transported (Fully Adjusted Model) | |||
|---|---|---|---|---|
| Variable | (SE) | OR [95% CI] | (SE) | OR [95% CI] |
| Pre-package Sandwich | ||||
| Readability | -0.11 (0.05) | 0.89 [0.81, 0.99] | -0.21 (0.07) | 0.81 [0.70, 0.92] |
| Year (vs. 2012) | ||||
| 2014 | -0.38 (0.28) | 0.68 [0.39, 1.18] | -0.59 (0.31) | 0.55 [0.30, 1.01] |
| 2016 | -0.40 (0.26) | 0.67 [0.40, 1.12] | -0.92 (0.32) | 0.40 [0.21, 0.74] |
| 2018 | -0.94 (0.26) | 0.39 [0.23, 0.66] | -1.36 (0.31) | 0.26 [0.14, 0.47] |
| Interactions | ||||
| Readability × 2014 | 0.07 (0.08) | 1.07 [0.92, 1.25] | 0.13 (0.09) | 1.14 [0.95, 1.36] |
| Readability × 2016 | 0.05 (0.07) | 1.05 [0.91, 1.21] | 0.17 (0.09) | 1.19 [1.00, 1.42] |
| Readability × 2018 | 0.13 (0.07) | 1.13 [0.98, 1.30] | 0.23 (0.09) | 1.26 [1.06, 1.50] |
| Pre-cooked Meat | ||||
| Readability | 0.08 (0.05) | 1.08 [0.98, 1.19] | 0.01 (0.06) | 1.01 [0.90, 1.14] |
| Year (vs. 2012) | ||||
| 2014 | 0.28 (0.26) | 1.33 [0.80, 2.20] | -0.23 (0.32) | 0.80 [0.42, 1.49] |
| 2016 | 0.85 (0.24) | 2.35 [1.47, 3.75] | 0.67 (0.29) | 1.96 [1.11, 3.46] |
| 2018 | 0.87 (0.23) | 2.39 [1.53, 3.74] | 0.49 (0.28) | 1.62 [0.94, 2.80] |
| Interactions | ||||
| Readability × 2014 | -0.08 (0.07) | 0.93 [0.81, 1.07] | 0.05 (0.08) | 1.05 [0.89, 1.23] |
| Readability × 2016 | -0.12 (0.07) | 0.89 [0.78, 1.01] | -0.09 (0.08) | 0.91 [0.78, 1.07] |
| Readability × 2018 | -0.08 (0.07) | 0.92 [0.81, 1.05] | 0.03 (0.08) | 1.03 [0.88, 1.19] |
Note: Table displays coefficients () with standard errors (SE), odds ratios (OR), and 95% confidence intervals (CI). The "Demographics Model" adjusted for age and sex. The "Fully Adjusted Model" additionally adjusted for household size, children, marital status, country, and income tercile. Significance levels: , , .
With a comparable target population defined, a three-step weighting methodology was used for the transportability analysis. Initially, the partial proportional odds ordinal logistic regression models to estimate the primary association within the study sample, accounting for the Food and You survey’s complex design [68]. Following this, a participation model was constructed using a Generalized Boosted Model (GBM), a machine learning technique adept at handling intricate, non-linear relationships without predefined assumptions [68,85]. This model was trained on combined datasets to predict survey membership based on a suite of harmonized, shared covariates. The following baseline covariates were included in the participation model for adjustment: sex, age, children under 16 in the household, household size, marital status, household income and country. Other variables, such as shopping responsibilities or health beliefs, were not available in the NDNS database; however, these characteristics were measured in the Food and You database and thus were not included for the participation model. The final step involved calculating Inverse Probability of Sampling Weights (IPSW) using the predicted probabilities from the GBM, which were then multiplied by the original Food and You survey weights to generate a comprehensive, combined weight [69,86]. The initial ordinal logistic regression models were subsequently refitted with this combined weight to yield the transported estimates.
References
- Rauber, F.; Steele, E.M.; Louzada, M.L.d.C.; Millett, C.; Monteiro, C.A.; Levy, R.B. Ultra-processed food consumption and indicators of obesity in the United Kingdom population (2008-2016). PloS one 2020, 15, e0232676. [Google Scholar] [CrossRef] [PubMed]
- Rauber, F.; Chang, K.; Vamos, E.P.; da Costa Louzada, M.L.; Monteiro, C.A.; Millett, C.; Levy, R.B. Ultra-processed food consumption and risk of obesity: a prospective cohort study of UK Biobank. European journal of nutrition 2021, 60, 2169–2180. [Google Scholar] [CrossRef] [PubMed]
- Vandevijvere, S.; Barquera, S.; Caceres, G.; Corvalan, C.; Karupaiah, T.; Kroker-Lobos, M.F.; L’Abbé, M.; Ng, S.H.; Phulkerd, S.; Ramirez-Zea, M.; et al. An 11-country study to benchmark the implementation of recommended nutrition policies by national governments using the Healthy Food Environment Policy Index, 2015-2018. Obesity Reviews 2019, 20, 57–66. [Google Scholar] [CrossRef] [PubMed]
- Luli, M.; Yeo, G.; Farrell, E.; Ogden, J.; Parretti, H.; Frew, E.; Bevan, S.; Brown, A.; Logue, J.; Menon, V.; et al. The implications of defining obesity as a disease: a report from the Association for the Study of Obesity 2021 annual conference. EClinicalMedicine 2023, 58. [Google Scholar] [CrossRef]
- Nardocci, M.; Leclerc, B.S.; Louzada, M.L.; Monteiro, C.A.; Batal, M.; Moubarac, J.C. Consumption of ultra-processed foods and obesity in Canada. Canadian Journal of Public Health 2019, 110, 4–14. [Google Scholar] [CrossRef]
- Costa-Font, M.; Dogbe, W.; Revoredo-Giha, C. Ready Meals in the UK: An Analysis Based on Their Nutritional and Sustainable Claims 2021.
- Alkerwi, A.; Crichton, G.E.; Hébert, J.R. Consumption of ready-made meals and increased risk of obesity: findings from the Observation of Cardiovascular Risk Factors in Luxembourg (ORISCAV-LUX) study. British Journal of Nutrition 2015, 113, 270–277. [Google Scholar] [CrossRef]
- Braesco, V.; Souchon, I.; Sauvant, P.; Haurogné, T.; Maillot, M.; Féart, C.; Darmon, N. Ultra-processed foods: how functional is the NOVA system? European Journal of Clinical Nutrition 2022, 76, 1245–1253. [Google Scholar] [CrossRef]
- Hillier, S.; Nunn, O.; Lorrain-Smith, K. An analysis of the nutritional value of UK supermarket ready meals. Proceedings of the Nutrition Society 2020, 79, E794. [Google Scholar] [CrossRef]
- .
- Agency, F.S. Guide to creating a front of pack (FoP) nutrition label for pre-packed products sold through retail outlets, 2016.
- Fichera, E.; von Hinke, S. The response to nutritional labels: Evidence from a quasi-experiment. Journal of Health Economics 2020, 72, 102326. [Google Scholar] [CrossRef]
- Dicken, S.J.; Batterham, R.L.; Brown, A. Nutrients or processing? An analysis of food and drink items from the UK National Diet and Nutrition Survey based on nutrient content, the NOVA classification and front of package traffic light labelling. British Journal of Nutrition 2024, 131, 1619–1632. [Google Scholar] [CrossRef]
- Madruga, M.; Steele, E.M.; Reynolds, C.; Levy, R.B.; Rauber, F. Trends in food consumption according to the degree of food processing among the UK population over 11 years. British Journal of Nutrition 2023, 130, 476–483. [Google Scholar] [CrossRef] [PubMed]
- Araya, S.; Elberg, A.; Noton, C.; Schwartz, D. Identifying Food Labeling Effects on Consumer Behavior. SSRN Electronic Journal 2019. [Google Scholar] [CrossRef]
- Griffith, R.; O’Connell, M.; Smith, K. The Importance of Product Reformulation Versus Consumer Choice in Improving Diet Quality. Economica 2017, 84. [Google Scholar] [CrossRef]
- Taillie, L.S.; Hall, M.G.; Popkin, B.M.; Ng, S.W.; Murukutla, N. Experimental studies of front-of-package nutrient warning labels on sugar-sweetened beverages and ultra-processed foods: a scoping review. Nutrients 2020, 12, 569. [Google Scholar] [CrossRef]
- of Health, D.; Care, S. Building on the Success of Front-of-Pack Nutrition Labelling in the UK: A Public Consultation.
- Hawkes, C. Nutrition labels and health claims: the global regulatory environment. In Nutrition labels and health claims: the global regulatory environment; 2004; pp. x–74.
- Helfer, P.; Shultz, T.R. The effects of nutrition labeling on consumer food choice: a psychological experiment and computational model. Annals of the New York Academy of Sciences 2014, 1331, 174–185. [Google Scholar] [CrossRef]
- Shangguan, S.; Afshin, A.; Shulkin, M.; Ma, W.; Marsden, D.; Smith, J.; Saheb-Kashaf, M.; Shi, P.; Micha, R.; Imamura, F.; et al. A Meta-Analysis of Food Labeling Effects on Consumer Diet Behaviors and Industry Practices. American journal of preventive medicine 2019, 56, 300–314. [Google Scholar] [CrossRef]
- European Commission. The Food and Beverage Market Entry Handbook: UNITED KINGDOM. A Practical Guide to the Market in the UK for European Agri-food Products. Market entry handbook, European Commission, 2021. Accessed , 2025. 1 August.
- Mazzocchi, M.; Capacci, S.; Biondi, B. Causal inference on the impact of nutrition policies using observational data. Bio-based and Applied Economics Journal 2022, 11, 3–20. [Google Scholar] [CrossRef]
- Song, J.; Brown, M.K.; Tan, M.; MacGregor, G.A.; Webster, J.; Campbell, N.R.; Trieu, K.; Mhurchu, C.N.; Cobb, L.K.; He, F.J. Impact of color-coded and warning nutrition labelling schemes: A systematic review and network meta-analysis. PLoS medicine 2021, 18, e1003765. [Google Scholar] [CrossRef]
- Goodman, M.; Finnegan, R.; Mohadjer, L.; Krenzke, T.; Hogan, J. Literacy, Numeracy, and Problem Solving in Technology-Rich Environments among US Adults: Results from the Program for the International Assessment of Adult Competencies 2012. First Look. NCES 2014-008. National center for education statistics 2013.
- Cooper, K.; Gasper, W.; Flores, R.; Clarke, M.; Bass, E.; Evans, L.; Ponce, J. Exploring the Readability of Ingredients Lists of Food Labels with Existing Metrics. AMIA Summits on Translational Science Proceedings 2022, 2022, 159. [Google Scholar]
- Acton, R.B.; Rynard, V.L.; Adams, J.; Bhawra, J.; Cameron, A.J.; Contreras-Manzano, A.; Davis, R.E.; Jáuregui, A.; Sacks, G.; Thrasher, J.F.; et al. Awareness, use and understanding of nutrition labels among adults from five countries: findings from the 2018–2020 International Food Policy Study. Appetite 2023, 180, 106311. [Google Scholar] [CrossRef]
- Ayres, P.; Paas, F. Cognitive load theory: New directions and challenges, 2012.
- Grunert, K.G.; Wills, J.M. A review of European research on consumer response to nutrition information on food labels. Journal of public health 2007, 15, 385–399. [Google Scholar] [CrossRef]
- Talati, Z.; Egnell, M.; Hercberg, S.; Julia, C.; Pettigrew, S. Consumers’ perceptions of five front-of-package nutrition labels: An experimental study across 12 countries. Nutrients 2019, 11, 1934. [Google Scholar] [CrossRef] [PubMed]
- Dubois, P.; Albuquerque, P.; Allais, O.; Bonnet, C.; Bertail, P.; Combris, P.; Lahlou, S.; Rigal, N.; Ruffieux, B.; Chandon, P. Effects of front-of-pack labels on the nutritional quality of supermarket food purchases: evidence from a large-scale randomized controlled trial. Journal of the Academy of Marketing Science volume 2021. [Google Scholar] [CrossRef]
- Crosetto, P.; Lacroix, A.; Muller, L.; Ruffieux, B. Nutritional and economic impact of five alternative front-of-pack nutritional labels: experimental evidence 2020. [CrossRef]
- Mazzù, M.F.; Romani, S.; Gambicorti, A. Effects on consumers’ subjective understanding of a new front-of-pack nutritional label: a study on Italian consumers. International journal of food sciences and nutrition 2021, 72, 357–366. [Google Scholar] [CrossRef]
- Mazzù, M.F.; Romani, S.; Baccelloni, A.; Gambicorti, A. A cross-country experimental study on consumers’ subjective understanding and liking on front-of-pack nutrition labels. International Journal of Food Sciences and Nutrition 2021, 72, 833–847. [Google Scholar] [CrossRef]
- Packer, J.; Russell, S.J.; Ridout, D.; Conolly, A.; Jessop, C.; Viner, R.M.; Croker, H. Secondary Outcomes of a Front-of-Pack-Labelling Randomised Controlled Experiment in a Representative British Sample: Understanding, Ranking Speed and Perceptions. Nutrients 2022, 14, 2188. [Google Scholar] [CrossRef]
- Folwarczny, M.; Sigurdsson, V.; Menon, R.V.; Otterbring, T. Consumer susceptibility to front-of-package (FOP) food labeling: Scale development and validation. Appetite 2024, 192, 107097. [Google Scholar] [CrossRef]
- Martin, S. Measuring cognitive load and cognition: metrics for technology-enhanced learning. In Technology-Enhanced and Collaborative Learning; Routledge, 2018; pp. 77–106.
- Mcinnes, N.; Haglund, B.J. Readability of online health information: implications for health literacy. Informatics for health and social care 2011, 36, 173–189. [Google Scholar] [CrossRef]
- Crossley, S.; Heintz, A.; Choi, J.S.; Batchelor, J.; Karimi, M.; Malatinszky, A. A large-scaled corpus for assessing text readability. Behavior Research Methods 2023, 55, 491–507. [Google Scholar] [CrossRef]
- Pires, C.; Vigário, M.; Cavaco, A. Graphical content of medicinal package inserts: an exploratory study to evaluate potential legibility issues. Health Information & Libraries Journal 2016, 33, 121–139. [Google Scholar]
- Green, E.C.; Murphy, E.M.; Gryboski, K. The health belief model. The Wiley encyclopedia of health psychology 2020, pp. 211–214.
- González-Castro, J.L.; Ubillos-Landa, S.; Puente-Martínez, A.; Gracia-Leiva, M. Perceived vulnerability and severity predict adherence to COVID-19 protection measures: the mediating role of instrumental coping. Frontiers in Psychology 2021, 12, 674032. [Google Scholar] [CrossRef]
- Wang, Y.; Wang, J.; Shen, Q. A consumer segmentation study of nutrition information seeking and its relation to food consumption in Beijing, China. Foods 2022, 11, 453. [Google Scholar] [CrossRef] [PubMed]
- Scarborough, P.; Matthews, A.; Eyles, H.; Kaur, A.; Hodgkins, C.; Raats, M.M.; Rayner, M. Reds are more important than greens: how UK supermarket shoppers use the different information on a traffic light nutrition label in a choice experiment. International Journal of Behavioral Nutrition and Physical Activity 2015, 12, 1–9. [Google Scholar] [CrossRef] [PubMed]
- Scarborough, P.; Hodgkins, C.; Raats, M.M.; Harrington, R.A.; Cowburn, G.; Dean, M.; Doherty, A.; Foster, C.; Juszczak, E.; Matthews, A.; et al. Protocol for a pilot randomised controlled trial of an intervention to increase the use of traffic light food labelling in UK shoppers (the FLICC trial). Pilot and feasibility studies 2015, 1, 1–11. [Google Scholar] [CrossRef] [PubMed]
- Barahona, N.; Otero, C.; Otero, S. Equilibrium effects of food labeling policies. Econometrica 2023, 91, 839–868. [Google Scholar] [CrossRef]
- Coryn, C.L.; Hobson, K.A. Using nonequivalent dependent variables to reduce internal validity threats in quasi-experiments: Rationale, history, and examples from practice. New Directions for Evaluation 2011, 2011, 31–39. [Google Scholar] [CrossRef]
- Schweizer, M.L.; Braun, B.I.; Milstone, A.M. Research methods in healthcare epidemiology and antimicrobial stewardship—quasi-experimental designs. Infection control & hospital epidemiology 2016, 37, 1135–1140. [Google Scholar]
- Wagenaar, B.H.; Sherr, K.; Fernandes, Q.; Wagenaar, A.C. Using routine health information systems for well-designed health evaluations in low-and middle-income countries. Health policy and planning 2016, 31, 129–135. [Google Scholar] [CrossRef]
- Hunter, P.R.; Colón-González, F.J.; Brainard, J.; Rushton, S. Impact of non-pharmaceutical interventions against COVID-19 in Europe in 2020: a quasi-experimental non-equivalent group and time series design study. Eurosurveillance 2021, 26, 2001401. [Google Scholar] [CrossRef]
- Meda, I.B.; Kouanda, S.; Ridde, V. Effect of cost-reduction interventions on facility-based deliveries in Burkina Faso: a controlled interrupted time-series study with multiple non-equivalent dependent variables. J Epidemiol Community Health 2023, 77, 133–139. [Google Scholar] [CrossRef]
- Chatfield, S.L.; Mumaw, E.; Davis, T.; Hallam, J.S. Pre-test data and lessons learned from a group research project examining changes in physical activity behavior following construction of a rails-to-trails facility. Journal of community health 2014, 39, 386–393. [Google Scholar] [CrossRef]
- Reynolds, J.J. Improving the assessment of teaching effectiveness with the nonequivalent dependent variables approach. Teaching of Psychology 2022, 49, 381–387. [Google Scholar] [CrossRef]
- Reyes, M.; Taillie, L.S.; Popkin, B.; Kanter, R.; Vandevijvere, S.; Corvalán, C. Changes in the amount of nutrient of packaged foods and beverages after the initial implementation of the Chilean Law of Food Labelling and Advertising: A nonexperimental prospective study, 2020. [CrossRef]
- Sacks, G.; Rayner, M.; Swinburn, B. Impact of front-of-pack ‘traffic-light’nutrition labelling on consumer food purchases in the UK. Health promotion international 2009, 24, 344–352. [Google Scholar] [CrossRef]
- Hughes, J.P.; Weick, M.; Vasiljevic, M. Impact of pictorial warning labels on meat meal selection: A randomised experimental study with UK meat consumers. Appetite 2023, 190, 107026. [Google Scholar] [CrossRef]
- Allais, O.; Etilé, F.; Lecocq, S. Mandatory labels, taxes and market forces: An empirical evaluation of fat policies. Journal of Health Economics 2015, 43, 27–44. [Google Scholar] [CrossRef] [PubMed]
- Food Standards Agency and National Centre for Social Research (NatCen). Food and You, Waves 1-5 Data, 2010-2018. Food Standards Agency, 2019. [data file].
- Aceves-Martins, M.; Bates, R.L.; Craig, L.C.; Chalmers, N.; Horgan, G.; Boskamp, B.; de Roos, B. Nutritional quality, environmental impact and cost of ultra-processed foods: a UK food-based analysis. International journal of environmental research and public health 2022, 19, 3191. [Google Scholar] [CrossRef] [PubMed]
- Odoms-Young, A.M.; Kong, A.; Schiffer, L.A.; Porter, S.J.; Blumstein, L.; Bess, S.; Berbaum, M.L.; Fitzgibbon, M.L. Evaluating the initial impact of the revised Special Supplemental Nutrition Program for Women, Infants, and Children (WIC) food packages on dietary intake and home food availability in African-American and Hispanic families. Public health nutrition 2014, 17, 83–93. [Google Scholar] [CrossRef] [PubMed]
- Capasso, M.; Califano, G.; Caracciolo, F.; Caso, D. Only the best for my kids: An extended TPB model to understand mothers’ use of food labels. Appetite 2023, 191, 107040. [Google Scholar] [CrossRef]
- Robinson, S.; Marriott, L.; Poole, J.; Crozier, S.; Borland, S.; Lawrence, W.; Law, C.; Godfrey, K.; Cooper, C.; Inskip, H.; et al. Dietary patterns in infancy: the importance of maternal and family influences on feeding practice. British Journal of Nutrition 2007, 98, 1029–1037. [Google Scholar] [CrossRef]
- Smith, L.P.; Ng, S.W.; Popkin, B.M. Trends in US home food preparation and consumption: analysis of national nutrition surveys and time use studies from 1965–1966 to 2007–2008. Nutrition journal 2013, 12, 1–10. [Google Scholar] [CrossRef]
- Koch, F.; Hoffmann, I.; Claupein, E. Types of nutrition knowledge, their socio-demographic determinants and their association with food consumption: results of the NEMONIT study. Frontiers in nutrition 2021, 8, 630014. [Google Scholar] [CrossRef] [PubMed]
- Neelon, S.E.B.; Burgoine, T.; Gallis, J.A.; Monsivais, P. Spatial analysis of food insecurity and obesity by area-level deprivation in children in early years settings in England. Spatial and Spatio-temporal Epidemiology 2017, 23, 1–9. [Google Scholar] [CrossRef] [PubMed]
- R Core Team. R: A Language and Environment for Statistical Computing. R Foundation for Statistical Computing, Vienna, Austria, 2021.
- Dahabreh, I.J.; Robertson, S.E.; Steingrimsson, J.A.; Stuart, E.A.; Hernan, M.A. Extending inferences from a randomized trial to a new target population. Statistics in medicine 2020, 39, 1999–2014. [Google Scholar] [CrossRef]
- Ackerman, B.; Lesko, C.R.; Siddique, J.; Susukida, R.; Stuart, E.A. Generalizing randomized trial findings to a target population using complex survey population data. Statistics in medicine 2021, 40, 1101–1120. [Google Scholar] [CrossRef] [PubMed]
- Ling, A.Y.; Montez-Rath, M.E.; Carita, P.; Chandross, K.J.; Lucats, L.; Meng, Z.; Sebastien, B.; Kapphahn, K.; Desai, M. An overview of current methods for real-world applications to generalize or transport clinical trial findings to target populations of interest. Epidemiology 2023, 34, 627–636. [Google Scholar] [CrossRef]
- Bix, L.; Sundar, R.P.; Bello, N.M.; Peltier, C.; Weatherspoon, L.J.; Becker, M.W. To See or Not to See: Do Front of Pack Nutrition Labels Affect Attention to Overall Nutrition Information? PLOS ONE 2015, 10, e0139732. [Google Scholar] [CrossRef]
- Public Health England. Calorie reduction: The scope and ambition for action. Technical report, Public Health England, London, 2018. Accessed: 2025-08-01.
- Schmälzle, R.; Renner, B.; Schupp, H.T. Health risk perception and risk communication. Policy Insights from the Behavioral and Brain Sciences 2017, 4, 163–169. [Google Scholar] [CrossRef]
- Howard, S.; Adams, J.; White, M. Nutritional content of supermarket ready meals and recipes by television chefs in the United Kingdom: cross sectional study. Bmj 2012, 345. [Google Scholar] [CrossRef]
- Franckle, R.L.; Levy, D.E.; Macias-Navarro, L.; Rimm, E.B.; Thorndike, A.N. Traffic-light labels and financial incentives to reduce sugar-sweetened beverage purchases by low-income Latino families: a randomized controlled trial. Public health nutrition 2018, 21, 1426–1434. [Google Scholar] [CrossRef]
- Nguyen, L.; De Steur, H. Public Acceptability of Policy interventions to reduce sugary drink consumption in Urban Vietnam. Sustainability 2021, 13, 13422. [Google Scholar] [CrossRef]
- Griffith, R.; O’Connell, M.; Smith, K. Shopping around: how households adjusted food spending over the great recession. Economica 2016, 83, 247–280. [Google Scholar] [CrossRef]
- Liu, P.J.; Wisdom, J.; Roberto, C.A.; Liu, L.J.; Ubel, P.A. Using behavioral economics to design more effective food policies to address obesity. Applied Economic Perspectives and Policy 2014, 36, 6–24. [Google Scholar] [CrossRef]
- Congiu, L.; Moscati, I. A review of nudges: Definitions, justifications, effectiveness. Journal of Economic Surveys 2022, 36, 188–213. [Google Scholar] [CrossRef]
- Loewenstein, G.; Sunstein, C.R.; Golman, R. Disclosure: Psychology changes everything. Annu. Rev. Econ. 2014, 6, 391–419. [Google Scholar] [CrossRef]
- Chavez-Ugalde, I.Y.; de Vocht, F.; Jago, R.; Adams, J.; Ong, K.K.; Forouhi, N.G.; Colombet, Z.; Ricardo, L.I.; van Sluijs, E.; Toumpakari, Z. Ultra-processed food consumption in UK adolescents: distribution, trends, and sociodemographic correlates using the National Diet and Nutrition Survey 2008/09 to 2018/19. European journal of nutrition 2024, 63, 2709–2723. [Google Scholar] [CrossRef]
- Clifford Astbury, C.; Penney, T.L.; Adams, J. Comparison of individuals with low versus high consumption of home-prepared food in a group with universally high dietary quality: a cross-sectional analysis of the UK National Diet & Nutrition Survey (2008–2016). International Journal of Behavioral Nutrition and Physical Activity 2019, 16, 9. [Google Scholar]
- Hayes-Larson, E.; Zhou, Y.; Wu, Y.; Rojas-Saunero, L.P.; Seamans, M.J.; Gee, G.C.; Brookmeyer, R.; Gilsanz, P.; Whitmer, R.A.; Mayeda, E.R. Estimating dementia incidence in insured older Asian Americans and Pacific Islanders in California: an application of inverse odds of selection weights. American journal of epidemiology 2025, 194, 1304–1313. [Google Scholar] [CrossRef]
- Ramagopalan, S.V.; Popat, S.; Gupta, A.; Boyne, D.J.; Lockhart, A.; Hsu, G.; O’Sullivan, D.E.; Inskip, J.; Ray, J.; Cheung, W.Y.; et al. Transportability of overall survival estimates from US to Canadian patients with advanced non–small cell lung cancer with implications for regulatory and health technology assessment. JAMA Network Open 2022, 5, e2239874. [Google Scholar] [CrossRef]
- Public Health England., and Food Standards Agency. National Diet and Nutrition Survey Rolling Programme, Years 1-15, 2008-2023, 2024. [data collection]. UK Data Service. 6: SN, 6533. [CrossRef]
- Coffman, D.L.; Zhou, J.; Cai, X. Comparison of methods for handling covariate missingness in propensity score estimation with a binary exposure. BMC medical research methodology 2020, 20, 168. [Google Scholar] [CrossRef]
- DuGoff, E.H.; Schuler, M.; Stuart, E.A. Generalizing observational study results: applying propensity score methods to complex surveys. Health services research 2014, 49, 284–303. [Google Scholar] [CrossRef]
Figure 1.
MTL labelling visual representation. MTL displays the percentages of the recommended daily nutrient intake as the numerical assessment of the product’s overall contribution for an average adult diet of 2,000 calories.
Figure 1.
MTL labelling visual representation. MTL displays the percentages of the recommended daily nutrient intake as the numerical assessment of the product’s overall contribution for an average adult diet of 2,000 calories.
Figure 2.
Mean perceived MTL print size readability from 2012 to 2018, stratified by sociodemographic characteristics, behavioral characteristics, food products. Higher scores denote enhanced readability.
Figure 2.
Mean perceived MTL print size readability from 2012 to 2018, stratified by sociodemographic characteristics, behavioral characteristics, food products. Higher scores denote enhanced readability.
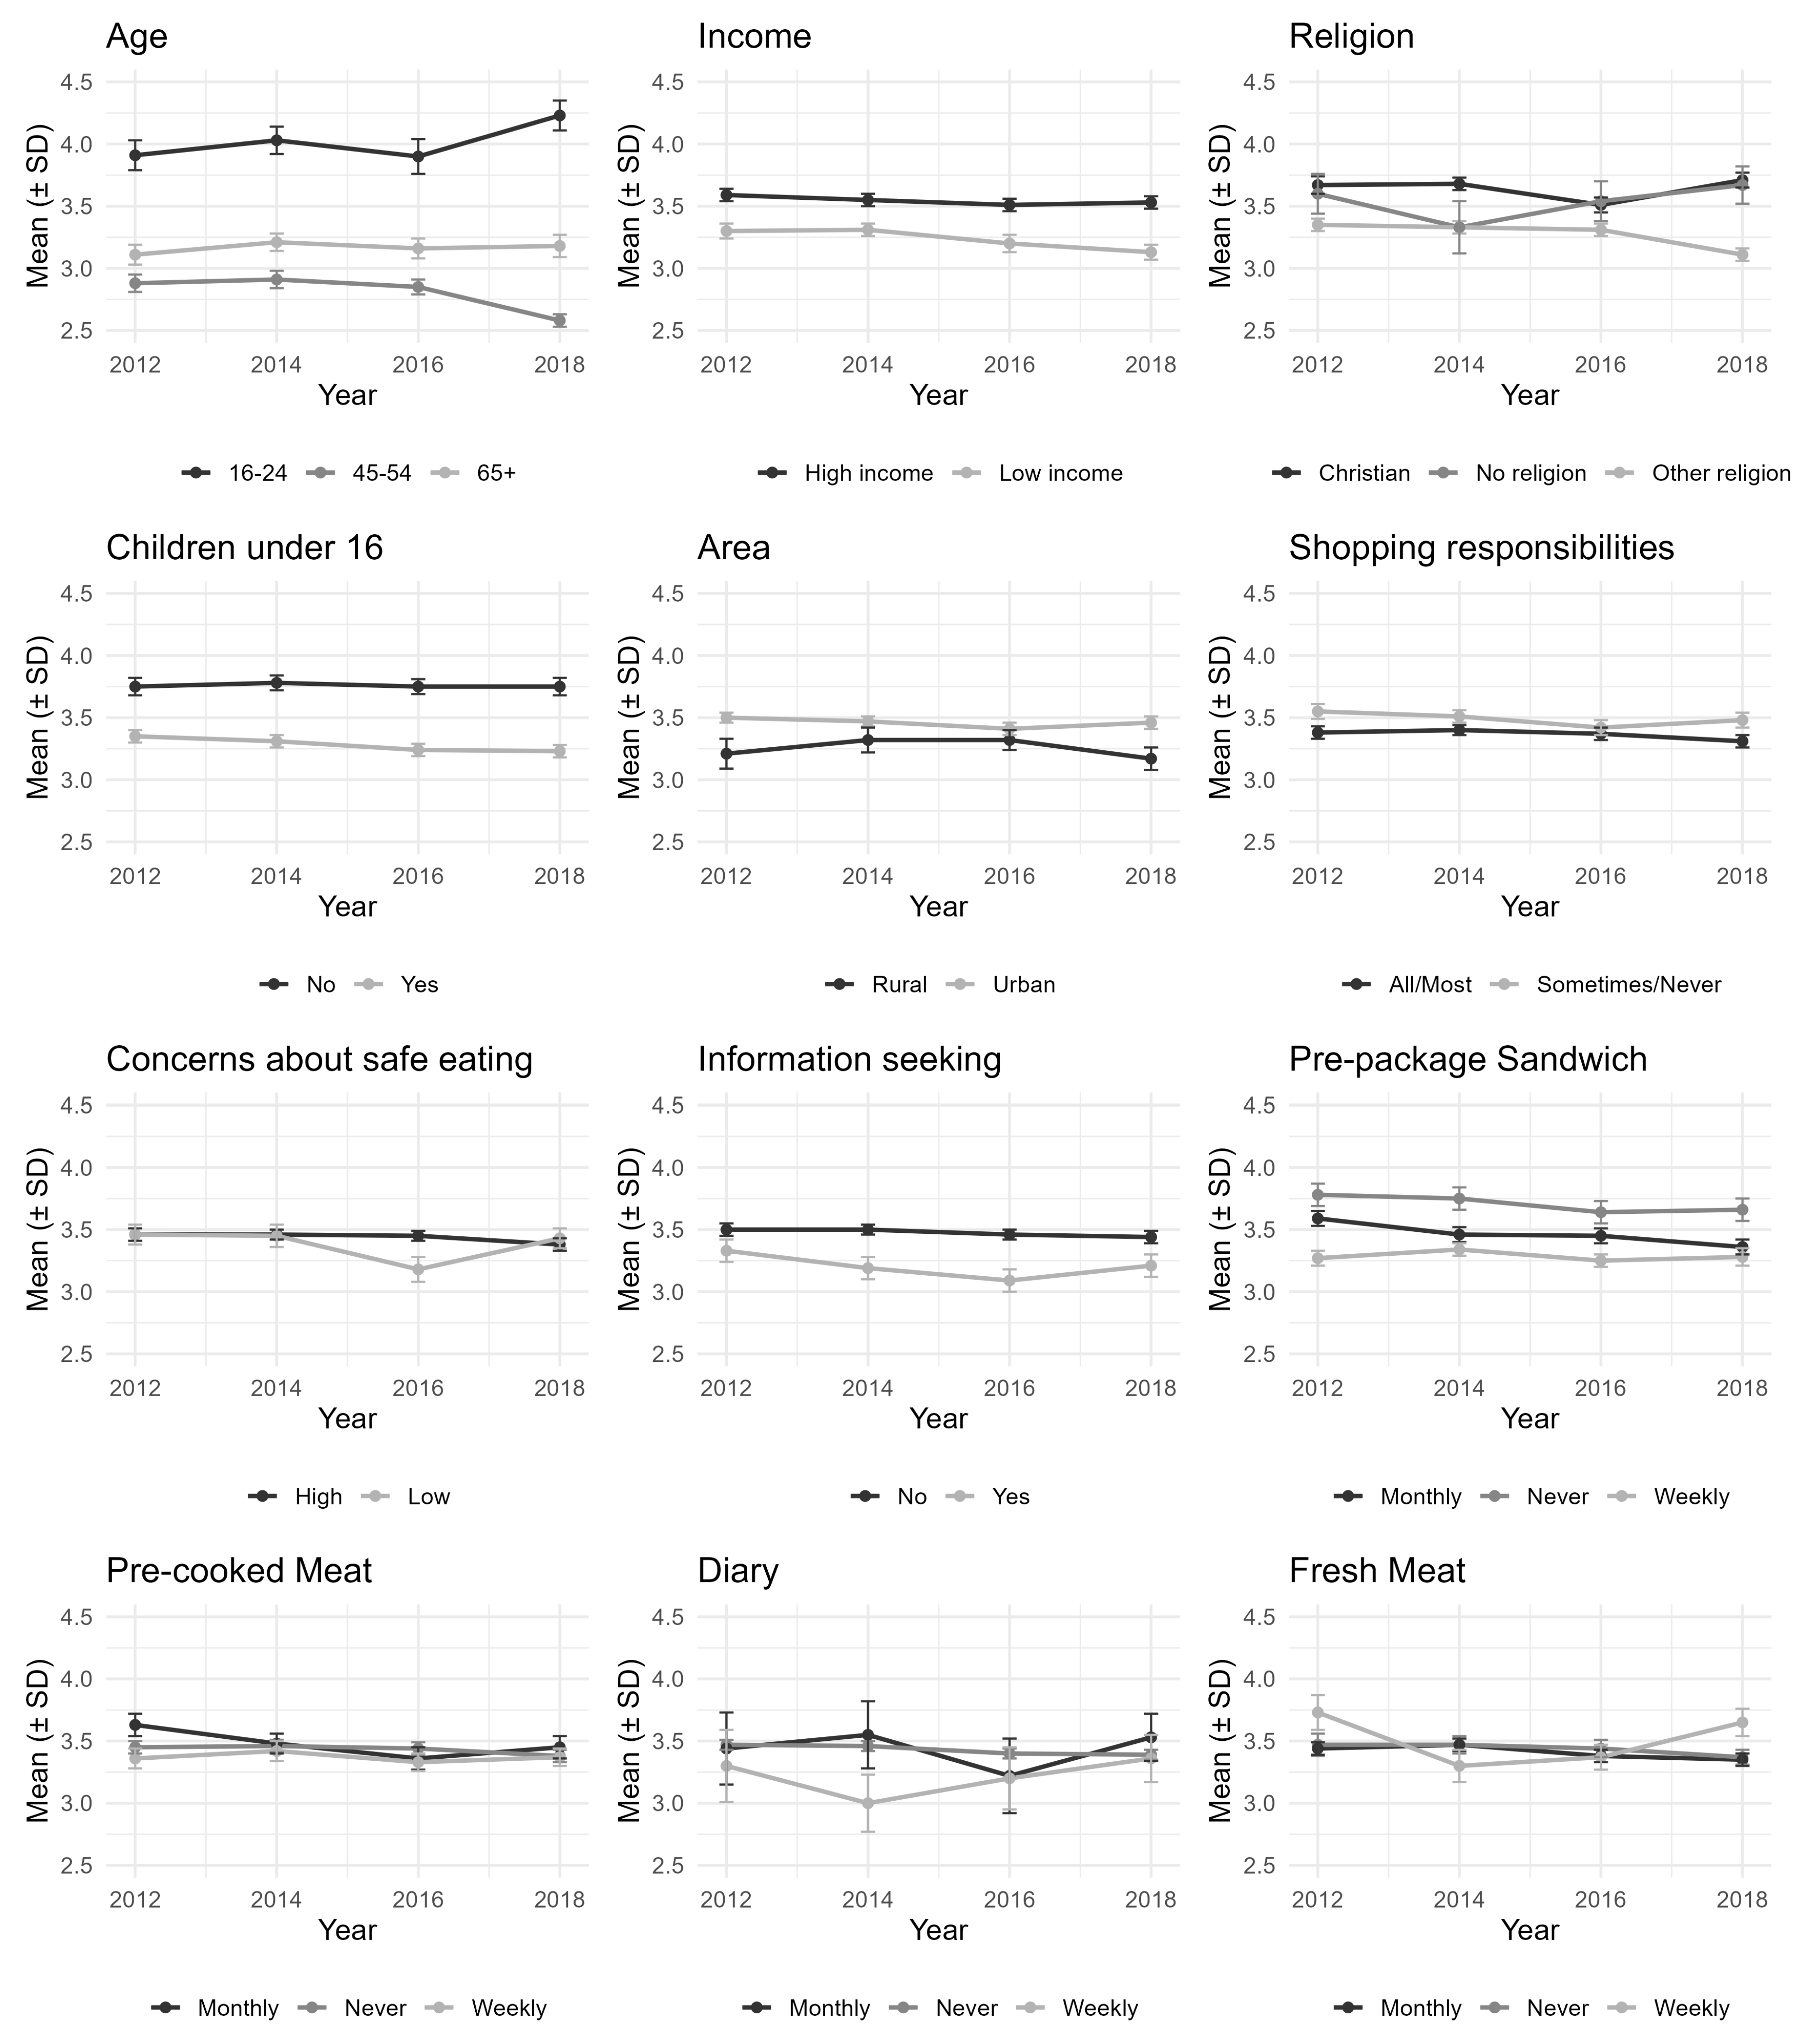
Figure 3.
Perceived MTL print size readability and consumption frequency. Cross-sectional trends by product type.
Figure 3.
Perceived MTL print size readability and consumption frequency. Cross-sectional trends by product type.
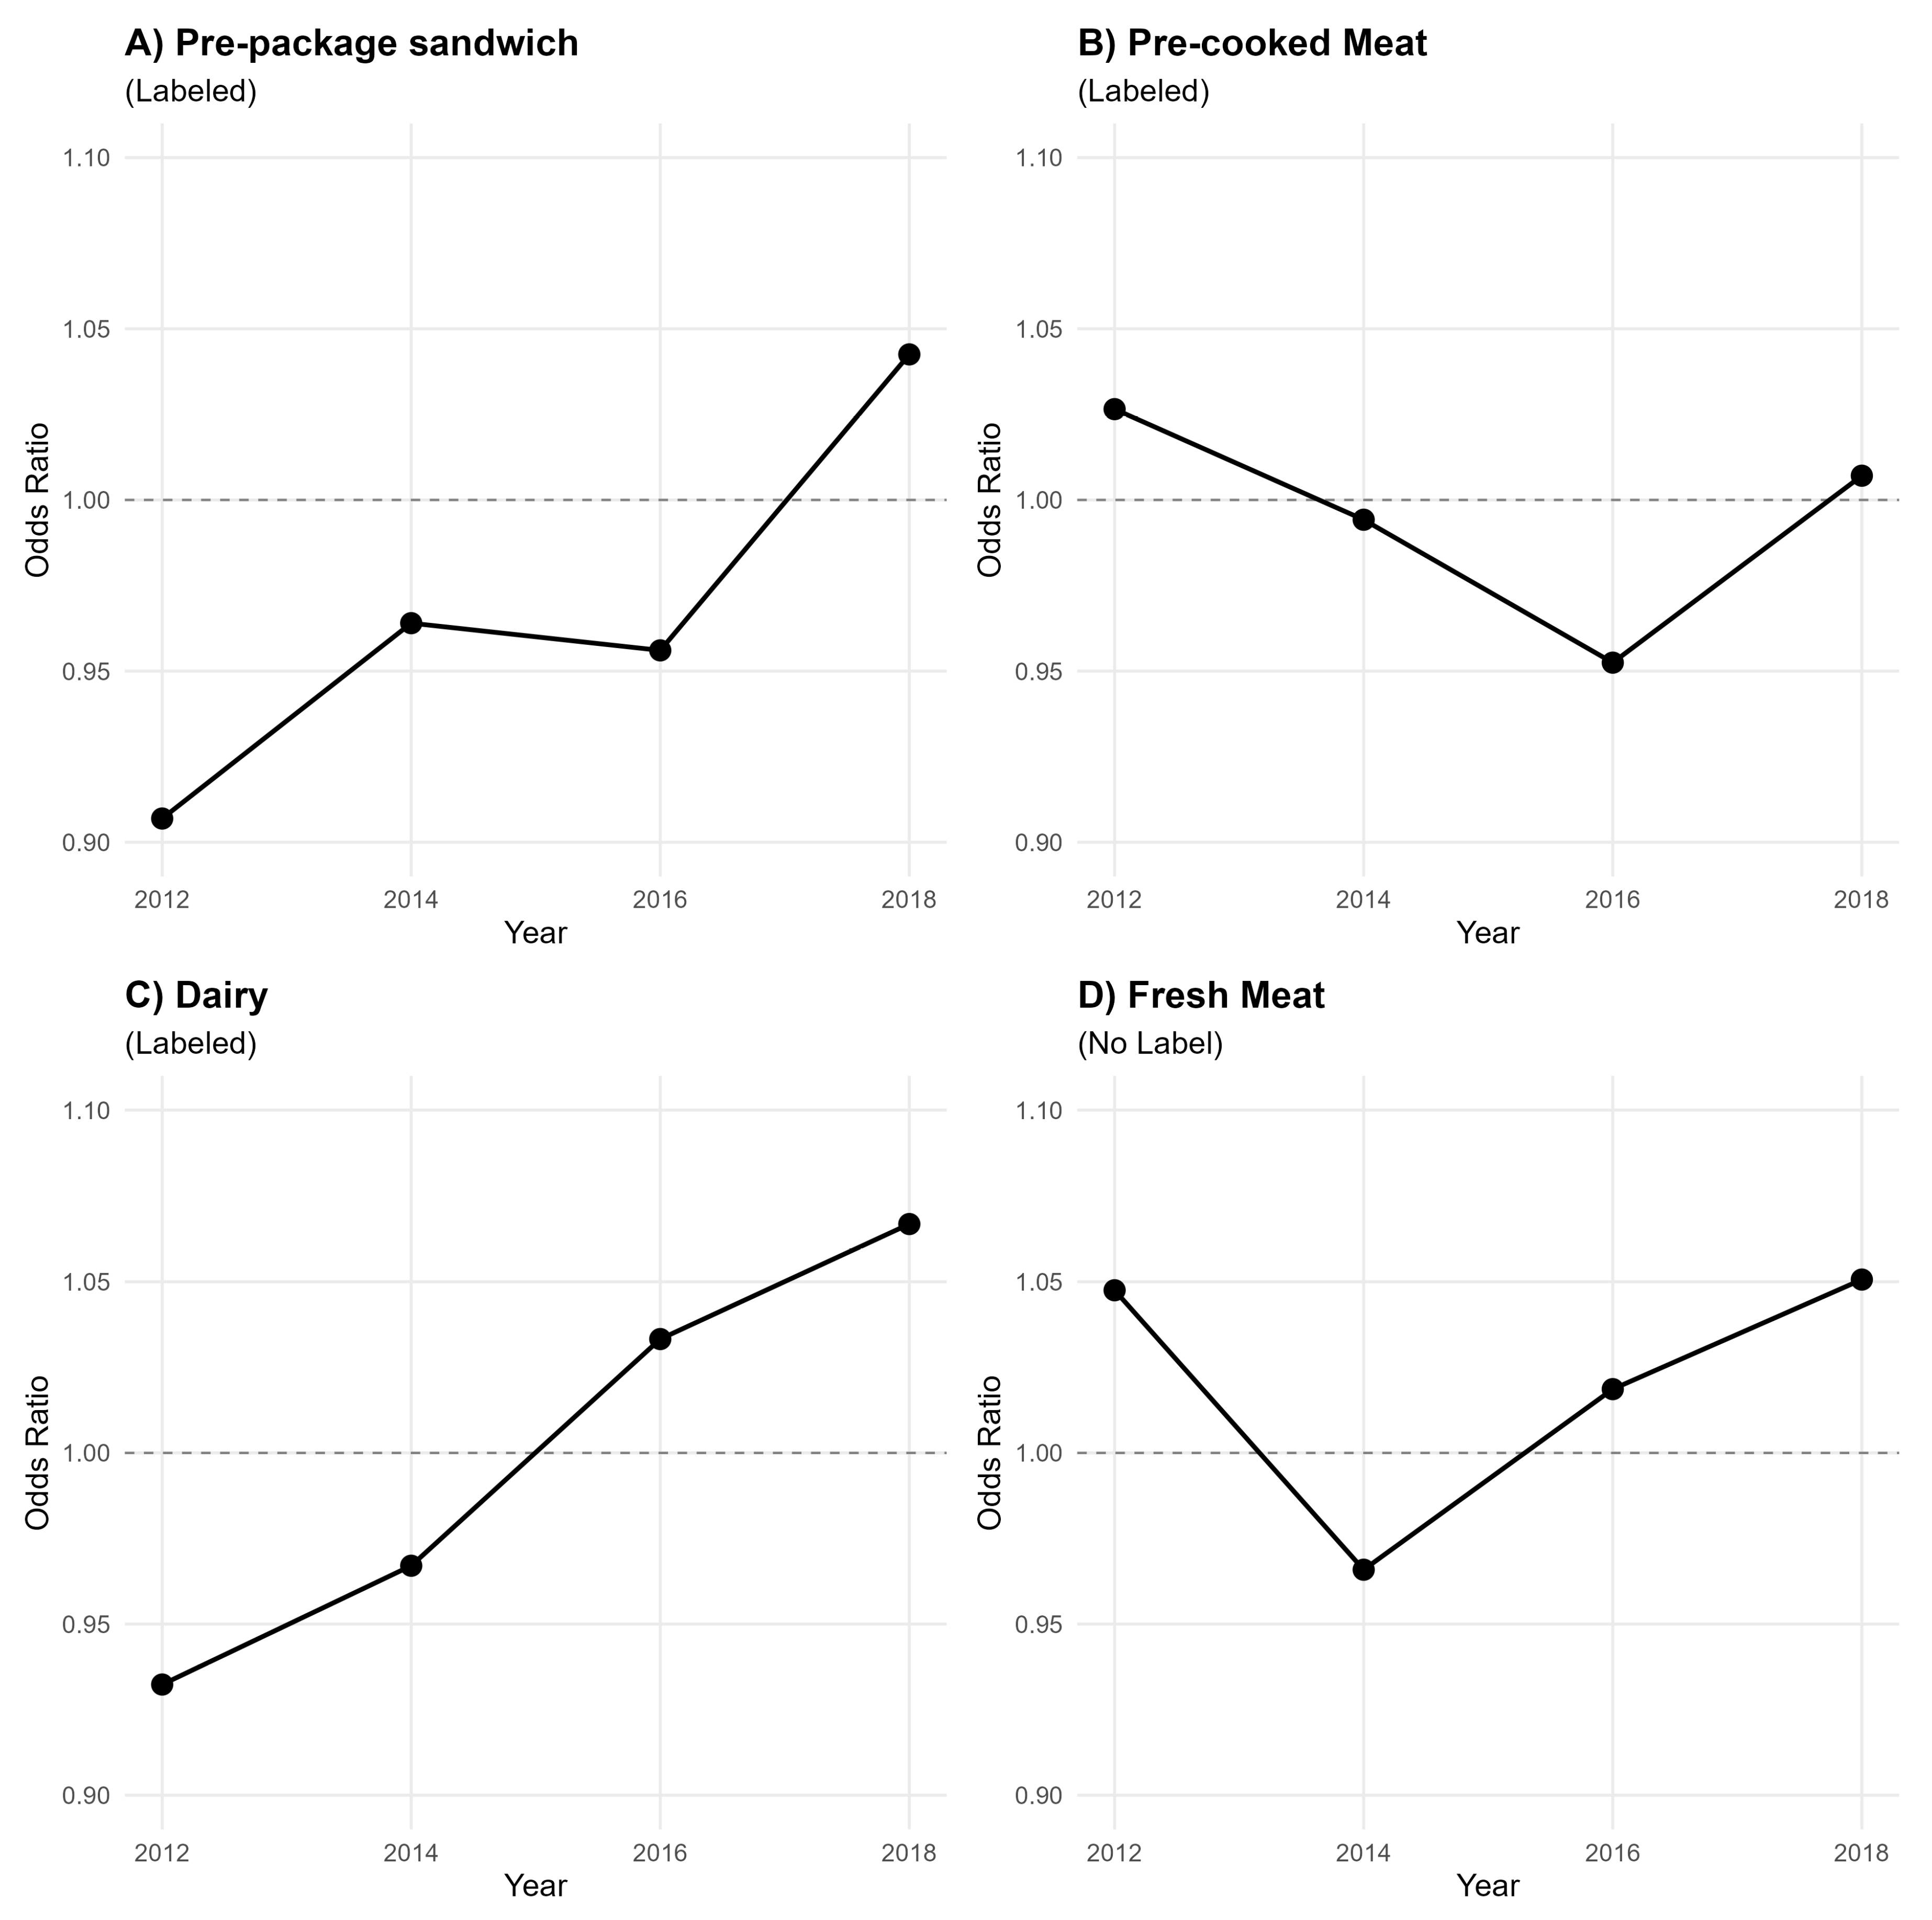
Table 1.
Sociodemographic characteristics of participants by food consumption frequency.
| Pre-package Sandwich | Pre-cooked Meat | Dairy | Fresh Meat | |||||||||
|---|---|---|---|---|---|---|---|---|---|---|---|---|
| Category | Never | Monthly | Weekly | Never | Monthly | Weekly | Never | Monthly | Weekly | Never | Monthly | Weekly |
| n = 8948 | 4052 | 3221 | 1675 | 1615 | 2035 | 5298 | 246 | 203 | 8498 | 789 | 2197 | 5963 |
| Sex | ||||||||||||
| Male | 54.2 | 51.3 | 37.6 | 55.0 | 54.0 | 47.0 | 53.6 | 52.9 | 49.9 | 59.4 | 55.1 | 46.9 |
| Female | 45.8 | 48.7 | 62.4 | 45.0 | 46.0 | 53.0 | 46.4 | 47.1 | 50.1 | 40.6 | 44.9 | 53.1 |
| Age | ||||||||||||
| 18-24 | 7.7 | 10.9 | 19.9 | 14.6 | 9.0 | 10.9 | 8.1 | 14.7 | 11.1 | 12.5 | 10.7 | 11.1 |
| 25-34 | 14.2 | 18.1 | 23.8 | 19.3 | 18.4 | 16.4 | 18.1 | 21.1 | 17.3 | 17.4 | 17.8 | 17.2 |
| 35-44 | 15.5 | 18.1 | 19.7 | 18.2 | 15.4 | 17.6 | 18.5 | 15.7 | 17.2 | 19.1 | 17.7 | 16.8 |
| 45-54 | 19.1 | 20.3 | 20.0 | 20.8 | 17.8 | 20.1 | 19.3 | 20.6 | 19.7 | 20.2 | 21.0 | 19.2 |
| 55-64 | 15.7 | 14.3 | 8.2 | 11.2 | 14.7 | 14.2 | 19.2 | 12.5 | 13.7 | 11.7 | 14.2 | 13.9 |
| 65+ | 27.8 | 18.4 | 8.4 | 15.9 | 24.7 | 20.7 | 16.8 | 15.5 | 21.0 | 19.1 | 18.6 | 21.8 |
| Religion | ||||||||||||
| Christian | 63.8 | 58.0 | 48.7 | 42.1 | 59.5 | 63.8 | 55.5 | 54.0 | 59.1 | 42.4 | 57.4 | 61.6 |
| Other religion | 6.9 | 6.3 | 9.4 | 22.8 | 6.2 | 2.8 | 8.9 | 6.8 | 7.1 | 15.9 | 6.4 | 6.3 |
| No religion | 29.3 | 35.7 | 41.9 | 35.2 | 34.3 | 33.5 | 35.6 | 39.1 | 33.8 | 41.7 | 36.2 | 32.1 |
| Marital status | ||||||||||||
| Married | 39.0 | 37.5 | 51.7 | 44.3 | 41.2 | 39.6 | 46.3 | 51.8 | 40.4 | 45.4 | 42.4 | 39.6 |
| Single | 61.0 | 62.5 | 48.3 | 55.7 | 58.8 | 60.4 | 53.7 | 48.2 | 59.6 | 54.6 | 57.6 | 60.4 |
| Household size | ||||||||||||
| 1 | 19.5 | 14.2 | 17.9 | 16.5 | 20.1 | 16.5 | 25.3 | 24.7 | 16.9 | 20.5 | 19.6 | 16.0 |
| 2 | 38.7 | 39.3 | 28.7 | 30.8 | 41.4 | 37.3 | 30.8 | 29.7 | 37.4 | 29.5 | 36.2 | 38.3 |
| 3 | 17.4 | 18.3 | 24.2 | 21.2 | 17.9 | 18.7 | 17.6 | 18.3 | 19.0 | 21.8 | 17.7 | 19.1 |
| 4 | 24.4 | 28.2 | 29.2 | 31.6 | 20.7 | 27.5 | 26.3 | 27.3 | 26.7 | 28.3 | 26.5 | 26.6 |
| Children at home | ||||||||||||
| Yes | 72.6 | 68.8 | 67.7 | 64.4 | 75.8 | 70.0 | 75.3 | 69.3 | 70.2 | 65.6 | 69.8 | 71.1 |
| No | 27.4 | 31.2 | 32.3 | 35.6 | 24.2 | 30.0 | 24.7 | 30.7 | 29.8 | 34.4 | 30.2 | 28.9 |
| Income | ||||||||||||
| Low | 53.8 | 66.6 | 68.9 | 57.7 | 62.5 | 61.8 | 53.8 | 59.2 | 61.5 | 59.8 | 59.9 | 61.9 |
| High | 46.2 | 33.4 | 31.1 | 42.3 | 37.5 | 38.2 | 46.2 | 40.8 | 38.5 | 40.2 | 40.1 | 38.1 |
| Area | ||||||||||||
| Urban | 17.2 | 19.1 | 12.3 | 13.4 | 19.0 | 17.3 | 13.8 | 9.6 | 17.2 | 14.4 | 16.2 | 17.6 |
| Rural | 82.8 | 80.9 | 87.7 | 86.6 | 81.0 | 82.7 | 86.2 | 90.4 | 82.8 | 85.6 | 83.8 | 82.4 |
| Country | ||||||||||||
| England | 91.1 | 92.2 | 93.8 | 93.7 | 92.9 | 91.1 | 94.0 | 92.5 | 91.9 | 93.8 | 93.1 | 91.3 |
| Wales | 5.4 | 5.2 | 4.2 | 4.2 | 4.9 | 5.4 | 3.0 | 4.5 | 5.2 | 4.5 | 4.7 | 5.3 |
| Northern Ireland | 3.5 | 2.6 | 2.0 | 2.0 | 2.2 | 3.4 | 3.0 | 3.0 | 2.9 | 1.7 | 2.1 | 3.3 |
Table 2.
Behavioral characteristics of participants by food consumption frequency.
| Pre-package Sandwich | Pre-cooked Meat | Dairy | Fresh Meat | |||||||||
|---|---|---|---|---|---|---|---|---|---|---|---|---|
| Category | Never | Monthly | Weekly | Never | Monthly | Weekly | Never | Monthly | Weekly | Never | Monthly | Weekly |
| n = 8948 | 4052 | 3221 | 1675 | 1615 | 2035 | 5298 | 246 | 203 | 8498 | 789 | 2197 | 5963 |
| Shopping | ||||||||||||
| responsability | ||||||||||||
| All/Most | 56.3 | 50.9 | 43.4 | 51.7 | 56.2 | 50.4 | 58.9 | 53.6 | 51.7 | 53.1 | 54.3 | 50.9 |
| Sometimes/Never | 43.7 | 49.1 | 56.6 | 48.3 | 43.8 | 49.6 | 41.1 | 46.4 | 48.3 | 46.9 | 45.7 | 49.1 |
| Concerns | ||||||||||||
| safe eating | ||||||||||||
| High | 22.2 | 17.7 | 25.8 | 24.8 | 20.3 | 20.5 | 34.3 | 24.9 | 20.8 | 21.1 | 21.3 | 21.2 |
| Low | 77.8 | 82.3 | 74.2 | 75.2 | 79.7 | 79.5 | 65.7 | 75.1 | 79.2 | 78.9 | 78.7 | 78.8 |
| Information | ||||||||||||
| seeking | ||||||||||||
| Yes | 79.5 | 83.7 | 84.1 | 81.4 | 82.4 | 81.8 | 83.4 | 80.2 | 81.9 | 81.7 | 82.8 | 81.5 |
| No | 20.5 | 16.3 | 15.9 | 18.6 | 17.6 | 18.2 | 16.6 | 19.8 | 18.1 | 18.3 | 17.2 | 18.5 |
| Year | ||||||||||||
| 2012 | 26.0 | 22.1 | 22.0 | 20.7 | 18.8 | 26.8 | 15.3 | 13.9 | 24.3 | 18.1 | 17.5 | 27.0 |
| 2014 | 28.2 | 23.0 | 27.1 | 23.8 | 21.9 | 28.4 | 21.8 | 28.2 | 26.2 | 20.4 | 20.5 | 28.9 |
| 2016 | 25.8 | 26.4 | 24.8 | 27.7 | 29.1 | 24.0 | 26.2 | 17.6 | 26.0 | 32.1 | 28.2 | 24.1 |
| 2018 | 20.1 | 28.6 | 26.0 | 27.8 | 30.2 | 20.8 | 36.7 | 40.3 | 23.5 | 29.4 | 33.7 | 20.1 |
Table 3.
Ordinal logistic regression results: associations of Perceived MTL print size readability and food consumption frequency, including interactions (adjusted for all sociodemographic, behavioural, and temporal variables)
Table 3.
Ordinal logistic regression results: associations of Perceived MTL print size readability and food consumption frequency, including interactions (adjusted for all sociodemographic, behavioural, and temporal variables)
| Pre-package Sandwich | Pre-cooked Meat | Dairy | Fresh Meat | |||||
|---|---|---|---|---|---|---|---|---|
| Variable | (SE) | OR [95% CI] | (SE) | OR [95% CI] | (SE) | OR [95% CI] | (SE) | OR [95% CI] |
| Readability | -0.10 (0.04) | 0.91 [0.83, 0.99] | 0.03 (0.03) | 1.03 [0.96, 1.10] | -0.07 (0.05) | 0.93 [0.84, 1.03] | 0.05 (0.04) | 1.05 [0.96, 1.14] |
| Year (vs. 2012) | ||||||||
| 2014 | -0.28 (0.23) | 0.76 [0.49, 1.18] | 0.15 (0.21) | 1.16 [0.77, 1.75] | 0.02 (0.26) | 1.02 [0.61, 1.70] | 0.27 (0.25) | 1.31 [0.81, 2.12] |
| 2016 | -0.39 (0.22) | 0.68 [0.44, 1.05] | 0.63 (0.19) | 1.87 [1.30, 2.70] | -0.48 (0.27) | 0.62 [0.36, 1.06] | 0.72 (0.20) | 2.06 [1.39, 3.05] |
| 2018 | -0.96 (0.21) | 0.38 [0.25, 0.58] | 0.55 (0.19) | 1.73 [1.20, 2.49] | -0.27 (0.25) | 0.76 [0.47, 1.24] | 0.84 (0.20) | 2.31 [1.57, 3.40] |
| Interactions | ||||||||
| Readability×2014 | 0.06 (0.06) | 1.06 [0.94, 1.20] | -0.03 (0.06) | 0.97 [0.86, 1.09] | 0.04 (0.07) | 1.04 [0.90, 1.19] | -0.08 (0.07) | 0.92 [0.80, 1.06] |
| Readability×2016 | 0.05 (0.06) | 1.05 [0.93, 1.19] | -0.07 (0.05) | 0.93 [0.84, 1.03] | 0.10 (0.07) | 1.11 [0.96, 1.28] | -0.03 (0.06) | 0.97 [0.87, 1.09] |
| Readability×2018 | 0.14 (0.06) | 1.15 [1.02, 1.29] | -0.02 (0.05) | 0.98 [0.89, 1.08] | 0.13 (0.07) | 1.14 [0.99, 1.31] | 0.00 (0.06) | 1.00 [0.89, 1.12] |
Note: Table displays coefficients () with standard errors (SE), odds ratios (OR), and 95% confidence intervals (CI). Significance levels: , , .
Table 4.
Ordinal logistic regression results: associations of perceived MTL print size readability and food consumption frequency by information-seeking subgroups (adjusted for all sociodemographic, behavioural, and temporal variables).
Table 4.
Ordinal logistic regression results: associations of perceived MTL print size readability and food consumption frequency by information-seeking subgroups (adjusted for all sociodemographic, behavioural, and temporal variables).
| Information Seekers | Non-Information Seekers | |||
|---|---|---|---|---|
| Variable | (SE) | OR [95% CI] | (SE) | OR [95% CI] |
| Pre-package Sandwich | ||||
| Readability | -0.07 (0.05) | 0.94 [0.85, 1.03] | -0.22 (0.08) | 0.81 [0.69, 0.95] |
| Year (vs. 2012) | ||||
| 2014 | -0.17 (0.25) | 0.84 [0.52, 1.36] | -0.47 (0.47) | 0.63 [0.25, 1.57] |
| 2016 | -0.41 (0.24) | 0.66 [0.41, 1.06] | -0.28 (0.45) | 0.75 [0.31, 1.81] |
| 2018 | -0.90 (0.23) | 0.41 [0.26, 0.64] | -1.10 (0.43) | 0.33 [0.14, 0.77] |
| Readability × Year | ||||
| 2014 vs. 2012 | 0.05 (0.07) | 1.05 [0.91, 1.20] | 0.04 (0.13) | 1.04 [0.80, 1.34] |
| 2016 vs. 2012 | 0.08 (0.07) | 1.08 [0.94, 1.24] | -0.08 (0.12) | 0.93 [0.73, 1.17] |
| 2018 vs. 2012 | 0.14 (0.06) | 1.15 [1.01, 1.30] | 0.12 (0.12) | 1.12 [0.88, 1.43] |
| Pre-cooked Meat | ||||
| Readability | 0.06 (0.05) | 1.06 [0.97, 1.16] | -0.06 (0.08) | 0.94 [0.79, 1.11] |
| Year (vs. 2012) | ||||
| 2014 | 0.24 (0.26) | 1.28 [0.77, 2.12] | -0.36 (0.46) | 0.70 [0.28, 1.73] |
| 2016 | 0.66 (0.24) | 1.93 [1.21, 3.09] | 0.83 (0.40) | 2.29 [1.04, 5.04] |
| 2018 | 0.76 (0.24) | 2.15 [1.35, 3.42] | 0.51 (0.37) | 1.67 [0.80, 3.46] |
| Readability × Year | ||||
| 2014 vs. 2012 | -0.06 (0.07) | 0.95 [0.82, 1.09] | 0.12 (0.13) | 1.13 [0.87, 1.46] |
| 2016 vs. 2012 | -0.06 (0.07) | 0.94 [0.82, 1.07] | -0.16 (0.13) | 0.85 [0.67, 1.09] |
| 2018 vs. 2012 | -0.05 (0.07) | 0.95 [0.84, 1.08] | -0.06 (0.11) | 0.95 [0.76, 1.18] |
| Dairy | ||||
| Readability | -0.02 (0.13) | 0.98 [0.75, 1.27] | -0.44 (0.18) | 0.65 [0.46, 0.92] |
| Year (vs. 2012) | ||||
| 2014 | 0.61 (0.73) | 1.85 [0.44, 7.74] | 0.55 (0.81) | 1.74 [0.36, 8.44] |
| 2016 | 0.71 (0.64) | 2.03 [0.58, 7.12] | -0.02 (0.90) | 0.98 [0.17, 5.67] |
| 2018 | 1.22 (0.57) | 3.40 [1.11, 10.4] | -0.82 (0.81) | 0.44 [0.09, 2.16] |
| Readability × Year | ||||
| 2014 vs. 2012 | -0.06 (0.20) | 0.94 [0.63, 1.39] | 0.06 (0.25) | 1.06 [0.65, 1.73] |
| 2016 vs. 2012 | -0.07 (0.18) | 0.93 [0.65, 1.33] | 0.15 (0.29) | 1.16 [0.66, 2.05] |
| 2018 vs. 2012 | 0.00 (0.16) | 1.00 [0.73, 1.37] | 0.45 (0.25) | 1.57 [0.97, 2.55] |
| Fresh Meat | ||||
| Readability | 0.09 (0.06) | 1.09 [0.98, 1.22] | -0.08 (0.10) | 0.92 [0.75, 1.13] |
| Year (vs. 2012) | ||||
| 2014 | 0.53 (0.28) | 1.69 [0.98, 2.92] | -0.19 (0.52) | 0.82 [0.30, 2.26] |
| 2016 | 0.90 (0.26) | 2.45 [1.47, 4.09] | 0.44 (0.47) | 1.55 [0.62, 3.87] |
| 2018 | 1.09 (0.25) | 2.97 [1.82, 4.84] | 0.30 (0.44) | 1.35 [0.57, 3.20] |
| Readability × Year | ||||
| 2014 vs. 2012 | -0.13 (0.08) | 0.88 [0.75, 1.03] | 0.03 (0.14) | 1.03 [0.79, 1.36] |
| 2016 vs. 2012 | -0.06 (0.07) | 0.94 [0.82, 1.09] | 0.03 (0.14) | 1.03 [0.78, 1.35] |
| 2018 vs. 2012 | -0.05 (0.07) | 0.95 [0.83, 1.09] | 0.14 (0.13) | 1.15 [0.89, 1.48] |
Note: Table displays coefficients (), standard errors (SE), odds ratios (OR), and 95% confidence intervals (CI). Significance levels: , , .
Table 5.
Ordinal logistic regression results: associations of perceived MTL print size readability and food consumption frequency by concern subgroups (adjusted for all sociodemographic, behavioural, and temporal variables).
Table 5.
Ordinal logistic regression results: associations of perceived MTL print size readability and food consumption frequency by concern subgroups (adjusted for all sociodemographic, behavioural, and temporal variables).
| High Concern | Low Concern | |||
|---|---|---|---|---|
| Variable | (SE) | OR [95% CI] | (SE) | OR [95% CI] |
| Pre-package Sandwich | ||||
| Readability | -0.09 (0.10) | 0.92 [0.76, 1.12] | -0.11 (0.05) | 0.90 [0.82, 0.99] |
| Year (vs. 2012) | ||||
| 2014 | -0.48 (0.47) | 0.62 [0.24, 1.55] | -0.17 (0.24) | 0.84 [0.53, 1.34] |
| 2016 | -0.66 (0.48) | 0.52 [0.20, 1.32] | -0.29 (0.24) | 0.75 [0.47, 1.20] |
| 2018 | -0.84 (0.46) | 0.43 [0.18, 1.06] | -1.00 (0.24) | 0.37 [0.23, 0.58] |
| Readability × Year | ||||
| 2014 vs. 2012 | 0.12 (0.13) | 1.13 [0.87, 1.46] | 0.03 (0.07) | 1.03 [0.91, 1.17] |
| 2016 vs. 2012 | 0.11 (0.13) | 1.12 [0.86, 1.44] | 0.03 (0.07) | 1.03 [0.90, 1.18] |
| 2018 vs. 2012 | 0.11 (0.13) | 1.12 [0.87, 1.44] | 0.15 (0.06) | 1.16 [1.03, 1.31] |
| Pre-cooked Meat | ||||
| Readability | 0.04 (0.09) | 1.04 [0.88, 1.23] | 0.02 (0.05) | 1.02 [0.93, 1.12] |
| Year (vs. 2012) | ||||
| 2014 | 0.05 (0.48) | 1.06 [0.41, 2.73] | 0.18 (0.26) | 1.19 [0.71, 2.00] |
| 2016 | 0.85 (0.43) | 2.35 [1.01, 5.46] | 0.63 (0.23) | 1.87 [1.20, 2.92] |
| 2018 | 0.69 (0.45) | 2.00 [0.83, 4.81] | 0.64 (0.22) | 1.90 [1.24, 2.92] |
| Readability × Year | ||||
| 2014 vs. 2012 | 0.05 (0.13) | 1.05 [0.81, 1.36] | -0.05 (0.07) | 0.95 [0.83, 1.09] |
| 2016 vs. 2012 | -0.17 (0.12) | 0.85 [0.67, 1.07] | -0.05 (0.06) | 0.95 [0.84, 1.08] |
| 2018 vs. 2012 | 0.01 (0.13) | 1.01 [0.79, 1.30] | -0.05 (0.06) | 0.96 [0.85, 1.08] |
| Dairy | ||||
| Readability | -0.04 (0.17) | 0.96 [0.69, 1.34] | -0.12 (0.15) | 0.89 [0.66, 1.19] |
| Year (vs. 2012) | ||||
| 2014 | 1.32 (0.90) | 3.76 [0.64, 22.0] | 0.22 (0.74) | 1.25 [0.29, 5.37] |
| 2016 | 0.29 (0.89) | 1.34 [0.24, 7.61] | 0.59 (0.69) | 1.80 [0.47, 6.94] |
| 2018 | 1.24 (0.71) | 3.46 [0.85, 14.0] | 0.63 (0.65) | 1.87 [0.52, 6.70] |
| Readability × Year | ||||
| 2014 vs. 2012 | -0.25 (0.26) | 0.78 [0.47, 1.29] | 0.05 (0.21) | 1.05 [0.70, 1.59] |
| 2016 vs. 2012 | 0.09 (0.26) | 1.10 [0.66, 1.82] | -0.06 (0.19) | 0.94 [0.65, 1.37] |
| 2018 vs. 2012 | -0.04 (0.22) | 0.96 [0.63, 1.47] | 0.15 (0.18) | 1.16 [0.81, 1.65] |
| Fresh Meat | ||||
| Readability | -0.14 (0.10) | 0.87 [0.72, 1.06] | 0.11 (0.05) | 1.11 [0.99, 1.24] |
| Year (vs. 2012) | ||||
| 2014 | -0.47 (0.51) | 0.63 [0.23, 1.70] | 0.63 (0.28) | 1.88 [1.09, 3.24] |
| 2016 | 0.07 (0.43) | 1.07 [0.47, 2.47] | 1.01 (0.25) | 2.74 [1.68, 4.45] |
| 2018 | -0.34 (0.45) | 0.71 [0.29, 1.71] | 1.23 (0.24) | 3.44 [2.16, 5.46] |
| Readability × Year | ||||
| 2014 vs. 2012 | 0.16 (0.15) | 1.17 [0.87, 1.57] | -0.17 (0.08) | 0.84 [0.72, 0.99] |
| 2016 vs. 2012 | 0.14 (0.12) | 1.15 [0.90, 1.47] | -0.09 (0.07) | 0.92 [0.80, 1.05] |
| 2018 vs. 2012 | 0.34 (0.13) | 1.40 [1.08, 1.81] | -0.09 (0.07) | 0.91 [0.80, 1.04] |
Note: Table displays coefficients (), standard errors (SE), odds ratios (OR), and 95% confidence intervals (CI). Significance levels: , , .
Disclaimer/Publisher’s Note: The statements, opinions and data contained in all publications are solely those of the individual author(s) and contributor(s) and not of MDPI and/or the editor(s). MDPI and/or the editor(s) disclaim responsibility for any injury to people or property resulting from any ideas, methods, instructions or products referred to in the content. |
© 2025 by the authors. Licensee MDPI, Basel, Switzerland. This article is an open access article distributed under the terms and conditions of the Creative Commons Attribution (CC BY) license (http://creativecommons.org/licenses/by/4.0/).
Copyright: This open access article is published under a Creative Commons CC BY 4.0 license, which permit the free download, distribution, and reuse, provided that the author and preprint are cited in any reuse.


