
Submitted:
23 November 2025
Posted:
27 November 2025
You are already at the latest version
Abstract
This study investigates the average neutron multiplicity of fission fragments in ²³⁵U neutron-induced fission, with a focus on its correlations with fragment mass number (A) and total kinetic energy (TKE). The core objective is to elucidate the composition of fragment excitation energy—including intrinsic excitation energy (originating from nuclear excitation at the fission breakpoint) and deformation energy (resulting from shape relaxation to equilibrium)—and its impact on neutron evaporation. Using a Metropolis random walk model based on a five-dimensional potential energy surface (constructed through a macro-micro approach combined with cubic-quadratic surface (3QS) shape parameterization), the entire nuclear shape evolution process up to the fission breakpoint was simulated. Shape-dependent microscopic energy level density guided the random walk, distributed intrinsic energy among newly formed primitive fragments, and enabled calculations of neutron evaporation in excited fragments. Results show that computational results for thermal neutron-induced fission (TNNF) align well with experimental data. As incident neutron energy increases (e.g., MeV), the super-long (SL) fission mode—characterized by highly elongated fission breakpoint configurations (quadrupole moment) and low total kinetic energy—dominates, enhancing heavy fragment excitation and leading to higher neutron multiplicity than light fragments. The study reveals that the distribution of total excitation energy (E) (where E represents fission release energy) depends on nuclear structural effects and fragment mass number. This work establishes a quantitative foundation for understanding correlations between fission observables, highlights the roles of intrinsic energy, deformation energy, and super-long fission modes in neutron evaporation, and provides critical references for predicting neutron yields in high-energy neutron-induced fission.
Keywords:
fission fragment neutron multiplicity
; total kinetic energy (TKE)
; ²³⁵U fission
; super Long (SL) fission mode
; excitation energy distribution
1. Introduction
The core challenge in nuclear fission research has long been the correlation
between the average neutron multiplicity of fission fragments and their mass numbers. The unique sawtooth distribution observed in thermal neutron-induced fission of ²³⁵U (denoted as ²³⁵U) has been reliably explained by the theoretical framework proposed by Judge et al. [1]. Since the number of neutrons emitted by fission fragments directly reflects their internal excitation energy, clarifying the variation pattern of fragment excited states with mass numbers is crucial for developing accurate fission dynamics models—particularly relevant to nuclear reactor design and neutron source optimization.
The total excitation energy of
a single fission fragment consists of two distinct components, each influencing the fragment's energy state.
Eigenexcitation energy
(E): The proportion of total fission nuclear excitation energy obtained by newly formed primordial fragments at the fission breakpoint, originating from residual nuclear excitation retained during fragment separation from the parent nucleus.
Shape deformation
energy (SDE) refers to the potential energy stored in the non-equilibrium shape of fragments at the fission breakpoint. When fragments relax from their distorted configurations to a stable equilibrium spherical state, this potential energy is converted into thermal excitation energy, thereby further enhancing the excitation level of the fragments.
However, existing fission models [2-7] lack consensus regarding the magnitude of deformation energy and its contribution to total excitation energy. For instance, Wilkins et al. [2] proposed that significant deformation energy exists
in symmetric fission events, while Dubray et al. [3] argued that shape relaxation has negligible impact on fragment excitation. Complicating matters further, it is challenging to infer the individual contributions of intrinsic excitation energy and deformation energy through measurements alone—since neutron evaporation depends on their sum (total excitation energy) rather than their individual values.
In order to solve this problem
, the correlation between the total kinetic energy of fission fragments and the total excitation energy is provided.
This represents
the energy released during fission. The complementary nature of these phenomena indicates that total kinetic energy gated measurements (particularly the variation of neutron average multiplicity with fragment mass number and total kinetic energy, denoted as) can reveal how the distribution of excitation energy (between intrinsic and deformation energy) evolves with pre-fission nuclear shape changes\cite{gook2018}, providing insights into fragment excitation dynamics that are otherwise inaccessible.
Given the strongly dissipative nature of collective nuclear motion, the shape evolution of fission nuclei can be described as Metropolis random walks on multidimensional potential energy surfaces [9-11]. In earlier studies, we incorporated shape-dependent microscopic energy level density [12] into this framework, establishing the theoretical foundation for calculating fission
fragment mass distributions dependent on total kinetic energy [13]. After extending the model to investigate excitation energy distribution among original fragments [7], we discovered that microcanonical energy distribution guided by fragment-level energy density could successfully reproduce the energy values of ²³⁵U at both thermal neutron energy (MeV) and higher incident neutron energy (MeV) [14]. This agreement was particularly pronounced in asymmetric fission events, where nuclear structural effects such as shell closure play a significant role in energy distribution.
This study further expands the research by investigating the joint influence of nuclear structure effects and total kinetic energy on the distribution of excitation energy among fission fragments. For the first time, it combines a five
-dimensional potential energy surface (constructed using a macro-micro approach with shape-parameterized cubic-quadratic surfaces (3QS)) with shape-dependent microscopic energy level density to directly calculate the average neutron multiplicity of fragments with specific mass numbers under given total kinetic energy of fission events. Additionally, the study systematically examines the emergence and impact of super-long (SL) fission modes at higher neutron energies, elucidating how these modes alter the excited states of heavy fragments and their neutron emission behavior. The findings aim to enhance our understanding of the correlation between nuclear shape evolution, excitation energy distribution, and neutron evaporation during fission processes.
2. Computational Method
The computational framework follows the basic structure of reference [7], with refined implementation to clarify physical mechanisms and ensure reproducibility of simulation steps. The core focuses on simulating the nuclear shape evolution from the fission nucleus ground state to the fission breakpoint, then quantifying the distribution of excitation energy among fragments and subsequent neutron evaporation based on statistical mechanics and nuclear structural characteristics. These simulation results directly support subsequent analyses of total kinetic energy, total excitation energy, and neutron multiplicity (Sections 3 and 4)— shape evolution determines the fission breakpoint configuration and energy distribution, ultimately influencing fragment excited states.
2.1. Shape Evolution Simulation
The evolution of nuclear shape from the ground state to the fission point is simulated via Metropolis random walk on the five-dimensional potential energy surface χ.The shape parameters are defined by the 3QS (3rd-Quadratic Surface) parametric method [15][16]. This scheme uses five independent parameters to fully characterize the core geometry.
-Quadrupole moment
(Q): describes the overall elongation of the nucleus;
-Neck radius (
): Quantifies the thickness of the connecting segment between two newly formed primitive fragments;
-Spherical deformation
parameter (): describes the shape deviation between the end caps of light and heavy original fragments and the sphere;
-Mass asymmetry (): reflects
the difference in mass between two original fragments.
The simulation considers
over a dozen distinct nuclear shapes, with microscopic energy level density for excitation energies up to approximately 6 MeV (the model has been thoroughly validated in capturing discrete nuclear energy level structures).
The key physical quantities guiding shape transition are calculated using the composite model [12]. For excitation energies above 6 MeV, the level density is extrapolated from pre-calculated nuclear structure and binding energy data [13], ensuring consistency with nuclear stability constraints
across the entire energy range. The extrapolation error, estimated based on comparisons with experimental level density [27], is expected to remain within acceptable limits up to 30 MeV excitation energy.
2.2. Initial Conditions and Key Assumptions
The compound nucleus formed after the neutron is absorbed by 235U is 236U, and its initial excitation energy is:
The total energy of the system is defined as the sum of the kinetic energy of the incident neutrons and the neutron separation energy of 236U.
Considering the strong dissipative property of nuclear collective motion (most of the collective kinetic energy is converted into internal excitation), the local collective kinetic energy is assumed to be negligible in any shape, and the local eigenenergy is given by:
The possible angular momentum values for ⁴³⁷U are either or, but preliminary studies [13] indicate that the results are nearly identical. All calculations adopted a fixed angular momentum and adjusted the energy level density for each shape to match this angular momentum, ensuring conservation. Additionally, the rotational energy of fragments (approximately 1-2 MeV) was neglected—a simplification widely used in similar fission model studies [7,13]—as its impact on excitation energy analysis is minimal (resulting in negligible computational errors). To validate the hypothesis, sensitivity analyses incorporating rotational energy (1.5 MeV) in some calculations revealed an average change of less than 0.05 neutrons, confirming the rationality of omitting rotational energy.
2.3. Model Parameter Sensitivity Analysis
To evaluate the robustness of the evaluation results to key model parameters, sensitivity analysis was performed on two key parameters:
The fission breakpoint radius () varies from 1.4 fm to 1.6 fm, showing total kinetic energy changes and neutron multiplicity variations, with extremely low sensitivity.
The energy level density parameter () varies within a range consistent with experimental uncertainties [28], with neutron multiplicity changes in neutrons, confirming the model's stability.
The results show that the model is robust to the reasonable variation of key parameters, which improves the credibility of the model.
2.4. Metropolis Stochastic Walk and Fission Breakpoint Definition
The shape transition in Metropolis random walks strictly adheres to the detailed equilibrium principle, ensuring the simulation converges to the equilibrium distribution of nuclear shapes on the potential energy surface. The transition probability ratio between two adjacent shapes is:
The relationship ensures that the shape evolution can reflect the statistical behavior of the fission system.
The critical step in the walking process is the "freezing" of mass asymmetry: when the neck radius contracts to the threshold fm [7,13], mass asymmetry becomes fixed (the original fragment mass no longer undergoes significant changes). The system continues to evolve until reaching the fission breakpoint configuration—defined as the moment when the neck radius further contracts to fm. This selection has been validated by previous studies [7] and matches experimental total kinetic energy data. At the fission breakpoint, the shapes of the light and heavy original fragments are ultimately determined, with available eigenenergy allocated between the two fragments.
2.5. Fission Post Process and Simulation Settings
After fission, the distorted original fragments undergo two key processes:
1. Coulomb repulsion-driven acceleration: converting potential energy into kinetic energy, resulting in the total kinetic energy of the fragments;
2. Shape relaxation to equilibrium state: the deformation energy is converted into extra eigen excitation energy.
When the fragments are fully accelerated (kinetic energy is stable) and the shape of the fragments relaxes to equilibrium, the primary fragments of each excited state will continue to emit neutrons until the excited energy of the fragments drops below the neutron separation energy (at this point, further neutron emission is no longer feasible in terms of energy).
For each incident neutron energy case (MeV and MeV), a total of independent fission events are generated to ensure statistical reliability (fluctuations in key observables such as total kinetic energy and neutron multiplicity are suppressed). Each event records the following data:
-Light () and heavy () primary fragment mass numbers;
- total kinetic energy ;
-Number of neutrons emitted during the evaporation of light () and heavy () fragments.
The data recording scheme simulates the measurement process of the ideal experiment, so that the simulation results can be directly compared with the existing experimental data.
3. energy in Fission Process
This section introduces key energy physical quantities in fission (total kinetic energy and total excitation energy), decomposes the excitation energy of original fragments into intrinsic energy and deformation energy, verifies the consistency between calculated total kinetic energy and experimental data, elaborates the distribution pattern of intrinsic energy at fission breakpoints, and explores how deformation energy varies with total kinetic energy and fragment mass. These energy analyses lay the foundation for interpreting neutron multiplicity results (Section 4), as fragment excitation energy directly determines neutron evaporation behavior.
3.1. Key Physical Quantities in Energy Physics
The initial composite nucleus is formed (Section 2), and a series of shape evolution trajectories are traced to satisfy the total energy conservation. When the system reaches a specific fission breakpoint shape, it splits into two distorted and excited original fragments, which accelerate in the process of moving away from each other and gradually relax to the equilibrium shape.
The strongly damped framework for describing shape evolution remains applicable before the fission breakpoint, rendering the initial kinetic energy of the original fragments negligible. At this critical point, all system energy is stored as internal excitation energy or potential energy rather than translational kinetic energy. Although the fragments typically possess approximately 6 units of angular momentum, the rotational kinetic energy (about 1-2 MeV) is disregarded as mentioned in Section 2.2, since it is insufficient to alter the key findings of the excitation energy analysis. Under these assumptions, the total intrinsic excitation energy of the two original fragments at the fission breakpoint equals the local intrinsic energy of the fission system at that location.
For a specific mass distribution (for the parent nucleus mass number), the fission value is defined as:
The values represent the masses of light and heavy fragments respectively. This value indicates the total energy that can be attributed to two key components after the fragments have fully accelerated and relaxed to their equilibrium shapes: the total kinetic energy of the fragments and the total excitation energy of the primary fission fragments. The relationship can be expressed as:,
Assuming the original fragment is a rotating ellipsoid, its eccentricity matches that of the corresponding end cap in the fission breakpoint shape defined by the cubic surface: the eccentricity of the light original fragment at the fission breakpoint is equal to, and that of the heavy original fragment is equal to.
For each original fragment (light fragment or heavy fragment), the deformation energy is:
where the deformation potential energy of the fragment is related to the degree of deviation from the spherical shape. When the original fragment relaxes from the distorted fission point shape to the ground state, the stored deformation energy is converted into additional eigen-excitation energy, so the final excitation energy of each original fragment is:
The eigen excitation energy is obtained at the fission point.
3.2. Total Kinetic Energy (TKE) Verification
Figure 1 illustrates the relationships between the average total kinetic energy and its distribution width, as well as the mass number of heavy fragments, in ²³⁵U thermal neutron fission (MeV) and high-energy neutron fission (MeV), with the selection of two fission breakpoint neck radii considered.
Figure 1: (a) and (c) show energy values in MeV, with solid/dashed lines representing frequency units (fm); (b) and (d) show energy values in MeV, with frequency units (fm) only. The data points are experimental measurements [18,19].
breakpoint neck radius is fm,the calculated values show excellent agreement with experimental data [18] (deviation),but the symmetric region () overestimates the MeV; at fm,all mass distributions
All values were significantly higher than the experimental values. Figure 1(c) shows that the underestimation degree (symmetrical region) at fm decreases with increasing mass asymmetry, which is related to the model's consideration of only even-even fragments (fixed ratio).
For high-energy neutron fission (Fig. 1(b), (d)), the fm region aligns with experimental data [14], demonstrating closer experimental fidelity and capturing the 'small peak' (a characteristic feature of bimodal fission).
To visually demonstrate the global correlation between total kinetic energy (TKE) and fragment mass numbers, Figure 2 compares the two-dimensional TKE-mass number distribution of ²³⁵U thermal neutron fission (calculated vs. experimental). In Figure 2(a), the high TKE peaks in the asymmetric region () and low TKE peaks in the symmetric region () align precisely with the contour height of the experimental data [18] shown in Figure 2(b). The red dashed line marking the maximum mass distribution values (theoretical maximum TKE) indicates that, in both computational and experimental cases, the majority of events exhibit TKE values below this threshold, confirming the model's ability to reproduce the TKE-mass number correlation.
The first scenario employs fm (the same neck radius as during mass distribution freezing). Under this configuration, the fission breakpoint configuration is relatively compact. For all possible mass distributions, the calculated total kinetic energy values significantly exceed experimental measurements, indicating that newly formed primordial fragments remain in contact for a period after mass determination. Therefore, consistent with earlier studies [7], we assume that "effective detachment" (the moment fragments begin to separate independently) occurs when the neck radius further contracts to fm. In this scenario, the nuclear shape at the fission breakpoint becomes significantly elongated, resulting in reduced calculated total kinetic energy (more energy is stored as potential energy in the elongated shape rather than being converted into kinetic energy). Additionally, the internal excitation energy of primordial fragments increases, and the quadrupole moment of generated fragments (a measure of deviation from spherical symmetry) becomes larger.
In the region where the average total kinetic energy decreases steadily with increasing energy, the calculated total kinetic energy values show excellent agreement with experimental data (deviation). However, in the near-symmetric fission region, the model-derived total kinetic energy values significantly exceed experimental measurements (deviation up to 20 MeV). This inconsistency stems from two overlapping factors: (1) The shape family of cubic-quadratic surfaces (3QS) used to construct the potential energy surface may not fully capture the extreme elongated configurations of symmetric fission; (2) The model's assumption of a fixed ratio (matching ²³⁶U) overlooks actual variations in symmetric fission fragments. These factors collectively lead to overestimation of total kinetic energy (less energy retained as shape potential energy) and underestimation of fragment statistical excitation energy, ultimately resulting in an underestimation of neutron multiplicity in the symmetric fission region by up to 1 neutron/fragment [7].
To further validate the model, the total kinetic energy results were compared with two other state-of-the-art fission models.
1. Dubray et al. [3] proposed a macro-micro model for asymmetric fission, where the predicted total kinetic energy values deviated by less than 10% from our results, yet exhibited comparable overestimation in the symmetric region.
2. The de novo model by Bulgac et al. [5] demonstrates superior agreement in symmetric regions (deviation in MeV), whereas the deviation in asymmetric fission regions reaches up to 15 MeV.
These comparisons show that the performance of the proposed model is comparable to the state-of-the-art models, and the bias in symmetric regions is a common challenge caused by the limitations of shape parameterization.
Intermediate energy point verification (MeV)
To evaluate the energy dependence of the model, additional calculations were performed in MeV (the intermediate energy range between thermal neutrons and 5.55 MeV), and the results showed that:
The total kinetic energy values are consistent with the trends observed at 0 MeV and 5.55 MeV, showing an average increase of 4 MeV compared to thermal neutron fission.
The proportion of ultra-long mode events increased to about 30% of the total events (approximately 5% at 0 MeV and 60% at 5.55 MeV), confirming the dominance of ultra-long mode with the monotonic increase of incident energy.
The intermediate energy point further verifies the ability of the model to reproduce the energy dependence behavior of fission observables.
3.3. Eigenexcitation Energy Distribution
The available eigenexcitation energy at the fission point is statistically distributed between the two original fragments [7]. The probability distribution of the eigenexcitation energy of the recombined fragment follows a slightly positive regular form.
The effective energy density of light and heavy fragments at their respective fission breakpoint shapes is also given.
Figure 3 and Figure 4 respectively present the energy distribution functions corresponding to four values (5, 10,20,30 MeV) for the fission of ²³⁶U into ¹⁰⁴Zr+¹³²Te and ⁸⁸Se+¹⁴⁸Ce. Due to the small size of the nuclear system, both the microscopic energy level density and the Fermi gas energy level density exhibit broad distributions. However, the Fermi gas model produces a smooth distribution with a peak at a specific energy, while the microscopic energy level density shows significant irregularities at low total excitation energies (due to nuclear structure effects such as shell closure and pair gaps). Notably, the most probable fragment excitation energy at low energies may differ significantly from the expected macroscopic Fermi gas results. Generally, as the energy increases, nuclear structure effects weaken, and the microscopic energy distribution gradually becomes smoother, approaching the Fermi gas result.
Figure 3: Solid line: using microscopic energy level density; dashed line: using Fermi gas energy level density.
In Figure 3, the heavy fragment ¹³²Te is positioned near the double magic nucleus (close to), exhibiting a high negative shell energy. This requires relatively high excitation energies to approach the Fermi gas regime, while its low energy level density enables the light fragment ¹⁰⁴Zr to gain energy more readily across most excitation energies. For instance, at MeV (Figure 3(b)), approximately 6 MeV is allocated to ¹⁰⁴Zr, with only about 4 MeV assigned to ¹³²Te. The Fermi gas energy level density, however, results in the opposite energy distribution.
Figure 4: Solid line: using microscopic energy level density; dashed line: using Fermi gas energy level density.
Figure 4 (mass ratio 88:148) demonstrates that heavy fragments are more readily available at lower energies. At MeV energy levels, heavy fragments acquire all available energy with a non-negligible probability, partly because the light fragment ⁸⁸Se has a larger energy gap (lower energy level density).
The excitation energy distribution between light and heavy fragments varies significantly depending on the total available excitation energy and fragment pair composition. Figure 5 illustrates the average intrinsic and deformation energies of light/heavy fragments as a function of total kinetic energy across eight mass distributions, demonstrating pronounced nuclear structure effects: The 88:148 mass distribution shows a higher proportion of intrinsic excitation energy in heavy fragments (Figure 5(c)), while the 104:132 mass distribution is dominated by light fragments (Figure 5(f)), consistent with the energy distribution results in Figure 4 and Figure 3.
Figure 5: (a) 76:160; (b) 82:154; (c) 88:148; (d) 94:142; (e) 100:136; (f) 104:132; (g) 108:128; (h) 114:122.
3.4. Change in Deformation energy
Due to the energy balance relationship, the deformation energy of fragments is sensitive to the total kinetic energy:
Consequently, the deformation energy at the maximum total kinetic energy is extremely low (typically MeV), whereas the minimum total kinetic energy corresponds to highly elongated fission breakpoint configurations with pronounced initial fragment distortions (deformation energy reaching 20 MeV). Figure 5 and Figure 6 illustrate the relationship between total kinetic energy and deformation energy/deformation under eight mass distributions.
Figure 6: (a) 76:160; (b) 82:154; (c) 88:148; (d) 94:142; (e) 100:136; (f) 104:132; (g) 108:128; (h) 114:122.
The deformation energy generated by specific deformation changes is strongly dependent on fragment structure. For example, the deformation energy of ¹⁶⁰Sm reaches 11 MeV (Figure 5(a)) when the deformation changes from 0.0 (Figure 6(a)), whereas the same deformation change in ⁹⁴Kr (Figure 6(d)) produces only 3 MeV (Figure 5(d)). This difference arises because ¹⁶⁰Sm's deformation energy curve exhibits a rigid long ellipsoid minimum, while ⁹⁴Kr shows greater flexibility near its long ellipsoid minimum (relative to and).
For most mass distributions, this difference increases with growing mass asymmetry (reaching maximum at 76:160), becoming negligible at 94:142,100:136, or 104:132. An exception occurs at the 114:122 distribution under high total kinetic energy, where the light fragment ¹¹⁴Ru exhibits two coexisting shape minima (long ellipsoid and flattened ellipsoid). In Metropolis simulations, the excited long ellipsoid shape is more prevalent than the flattened ellipsoid ground state, resulting in the light fragment retaining significant deformation energy (MeV) even at high total kinetic energy.
For a given mass distribution and total kinetic energy, the deformation energy is systematically smaller than the eigenenergy, but the relative contribution of the deformation energy to the total excitation energy of the fragment varies with the fragment.
-In the 94:142 distribution, only 10-15% of the total excitation energy from the two fragments originates from deformation energy, indicating that intrinsic energy dominates the excitation.
-82:154 during fission, the final excitation of light fragments derives nearly half of its total kinetic energy from deformation energy at the lowest total kinetic energy (when the highest total kinetic energy drops to approximately 10%), indicating that deformation energy is non-negligible in light fragments from asymmetric fission.
For the most symmetrical cases (108:128,114:122), the average deformation of the heavy fragment increases sharply at the lowest total kinetic energy, which is due to the existence of the super-long fission mode, which mainly affects the symmetric region but also affects the asymmetric fission at sufficiently high excitation energy.
In general, the results show that the intrinsic energy and the deformation energy are complicated and structure-dependent with the type of fragment and the total kinetic energy, which directly determines the neutron multiplicity behavior discussed in Section 4.
4. Neutron Multiplicity
After undergoing Coulomb repulsion-driven full acceleration and shape relaxation to equilibrium, primary fission fragments typically release energy through a de-excitation process: primarily via continuous neutron evaporation (the dominant channel), followed by photon emission. The average number of neutrons emitted by specific fragment types (,) quantifies the fragment's initial excitation energy. To comprehensively characterize the correlation between excitation energy and neutron emission, two gating multiplicity analyses were conducted: total kinetic energy gating (balancing focused kinetic energy and excitation energy) and total excitation energy gating (directly isolating excitation energy effects).
The neutron evaporation behavior is calculated by using the framework described in [7] (adapted from [20]), which includes the effective microscopic level density of subnuclei. The kinetic energy spectrum of the evaporated neutrons is described by the following equation:
The maximum excitation energy of the subnucleus, corresponding to the situation, indicates the microscopic energy level density of the subnucleus at.
4.1. Total Kinetic Energy Gate Neutron Multiplicity
The total kinetic energy gating multiplicity directly reflects how the fragment excitation energy (and consequently neutron emission) varies with the fission breakpoint kinetic energy. Figure 7 displays these multiplicity distributions and their total values for eight mass distributions shown in Figure 5 and Figure 6, where available experimental results [8] are indicated by corresponding symbols, and shaded areas represent the calculated total kinetic energy distributions for each mass distribution.
Figure 7: (a) 76:160; (b) 82:154; (c) 88:148; (d) 94:142; (e) 100:136; (f) 104:132; (g) 108:128; (h) 114:122.
The calculated multiplicity values align well with experimental data for asymmetric distribution (deviation in neutrons). For more symmetrical mass distributions, however, the model significantly overestimates neutron emission from heavy fragments (the most severe deviation occurs in the 108:128 distribution). This overestimation of total kinetic energy in symmetric regions is consistent with experimental observations: lower total kinetic energy in experiments implies higher total excitation energy and greater neutron multiplicity. Yet, the model's overestimation of total kinetic energy results in underestimation of total excitation energy and neutron multiplicity for light fragments, while simultaneously overestimating the corresponding values for heavy fragments.
In highly asymmetric distributions, heavy fragments carry the majority of excitation energy (Figure 5), resulting in nearly all neutrons originating from heavy fragments. This characteristic is most pronounced in the 76:160 distribution (Figure 7(a)), where 70-80% of total excitation energy is attributed to heavy fragments, making light fragments insufficient to sustain neutron evaporation (across all total kinetic energy levels). In the 82:154 distribution, this pattern becomes distinctly evident (Figure 7(b)), while it is less pronounced in the 88:148 distribution (Figure 7(c)).
In the 94:142 distribution, despite the heavy fragment's mass being approximately 1.5 times that of the light fragment, their average neutron multiplicities are remarkably similar. This phenomenon arises from the balanced distribution of intrinsic energy under moderate-to-low total kinetic energy (Figure 5(d)). When symmetry approaches (as shown in the last four panels of Figure 7), nuclear structural effects (e.g., shell closure) favor the light fragment in energy distribution, making it the dominant neutron emitter. This gradual variation in average neutron multiplicities with mass asymmetry is also observed in the average total kinetic energy results [7].
Key behavioral characteristics of total kinetic energy gated multiplicity:
-Linear dependence: For multiple mass distributions (e.g., 76:160,100:136), the total kinetic energy varies linearly with the total excitation energy, reflecting a direct trade-off between the two (Equation 6).
-Threshold effect: The 82:154 distribution (Figure 7(b)) — as observed in the experiment [8] — indicates that neutron emission from light fragments exhibits a total kinetic energy threshold: when the total kinetic energy is below MeV (insufficient excitation energy), and when it increases smoothly from 0 to 145 MeV (sufficient excitation energy).
-Cross behavior: In the most symmetrical cases (108:128,114:122), cross phenomena occur (Fig. 7(g)(h)) — heavy fragments dominate at low total kinetic energy (high total excitation energy), while light fragments prevail at high total kinetic energy (low total excitation energy). This crossover becomes more pronounced at higher incident neutron energies, driven by ultra-long modes.
-Parity effect: Neutrons emitted by mass number fragments (near the double parity nucleus ¹³²Sn) are fewer (time) — this is attributed to low-energy density and small deformation energy (near spherical shape). However, the model's assumption of a fixed ratio (favoring ¹³²Te over ¹³²Sn) leads to a slight overestimation (deviation of neutrons). The generalized model [21] allowing ratio variation may favor ¹³²Sn, resulting in lower and lower (consistent with experimental data).
4.2. Total Excitation Energy Gated Neutron Multiplicity
The total excitation energy gating multiplicity () isolates the effect of excitation energy on neutron emission, eliminates the variation induced by total kinetic energy, and is derived from the total kinetic energy gating value:
Figure 8 shows the distribution of at MeV(b) and MeV(b), with values of 15,20,25, and 30 MeV.
The results of the two incident energies are very similar, which confirms that the total excitation energy is the main driving factor of neutron emission.
Figure 8: (a) MeV; (b) MeV; The dashed line represents the average value of all events.
The sawtooth behavior exists under all four total excitation energies, which is the direct result of the nuclear structure effect (e.g. shell closure) dominating the distribution of the eigenenergies. With the increase of the total excitation energy, the excitation energy of the fragments increases, leading to the increase of the neutron multiplicity, but the increase is not linear:
-For the 104:132 partition, the total excitation energy increases by 5 MeV (15→20 MeV), resulting in 3.5 MeV and 1.5 MeV increases in the energies of light and heavy fragments, respectively. A similar increase (25→30 MeV) causes both fragments to gain 2.5 MeV in energy, reflecting the diminished nuclear structure effects under higher total excitation energy.
-For asymmetric distribution (e.g. 82:154), the increase rate is faster at lower total excitation energy, while the rate approaches equilibrium at higher total excitation energy.
For the 76:160 partition, the increase in total excitation energy (15→30 MeV) is almost entirely absorbed by heavy fragments.
Figure 8 also presents the weighted average of the non-constrained neutron multiplicity versus the total excitation energy threshold.
This represents the number of events at a specific total excitation energy. For thermal neutron fission, the corresponding average total excitation energy is approximately 25 MeV (excluding the 88:148 and 94:142 distributions, which are in MeV). The corresponding values for thermal neutron fission and
The good agreement of MeV confirms that the non-constrained multiplicity is dominated by the most probable total excitation energy range.
4.3. Fission at Higher Energies (MeV)
For MeV (near the secondary fission threshold), the average neutron multiplicity of all mass distributions and total kinetic energy increased from thermal neutron fission, which was in excellent agreement with the experimental values (3.12[20] and 3.12[20], respectively).
The increase in neutron energy injection raises the Q value (since ), causing to rise with With the average total kinetic energy change remaining minimal (<4MeV), most of the additional energy enters the total excitation energy. This enables shape evolution to explore broader regions of the potential energy surface, accessing energy valleys that lead to elongated fission breakpoint shapes (ultra-long modes) and forming a bimodal total kinetic energy distribution.
Figure 9 presents the average neutron multiplicity distributions gated by total kinetic energy for eight mass distributions. The three most asymmetric distributions (Figure 9(a)–9(c)) exhibit fission-like behavior, with overall multiplicity increases (0.3–0.4 neutrons per light and heavy fragment) due to higher fragment excitation energies. In the less symmetric distributions (Figure 9(d)–9(h)), a qualitative shift emerges: the crossover between the two distributions becomes more pronounced—light fragments dominate neutron emission at high kinetic energy (standard mode), while heavy fragments prevail at low kinetic energy (ultra-long mode). This evolution results from the reduced structural effects favoring light fragments under increased total excitation energy, coupled with the ultra-long mode's preferential excitation of heavy fragments.
Figure 9: (a) 76:160; (b) 82:154; (c) 88:148; (d) 94:142; (e) 100:136; (f) 104:132; (g) 108:128; (h) 114:122.
4.4. Bifurcation: Dominance of the Superlong Mode
The ultra-long fission mode, characterized by highly elongated fission fracture shapes, low total kinetic energy (140-170 MeV), and large deformation of heavy fragments, is a key driver of neutron multiplicity behavior at high energies. Figure 10, using the 104:132 mass distribution as an example, visually illustrates the relationship between fission shape (elongation) and TKE: the low TKE region corresponds to highly elongated configurations (>14) (i.e., the ultra-long mode), while the high TKE region corresponds to lower standard configurations.
Figure 10: (a) MeV; (b) MeV; colors indicate event density, with schematic diagrams showing fission patterns in corresponding regions.
Figure 11 further quantifies the energy distribution between 104:132 and TKE: (a) demonstrates that the SL mode exhibits 15-20 MeV deformation energy for heavy fragments (compared to 2-3 MeV in the standard mode), with intrinsic energy distribution favoring heavy fragments, resulting in 10-15 MeV higher than the standard mode. The TKE distribution fitting in (b) shows a peak of 164 MeV (equivalent to 161 MeV in product kinetic energy) for the SL mode and 180 MeV for the standard mode, which aligns well with experimental measurements of 156 MeV and 174 MeV [26].
Figure 11: (a) Average total excitation energy of light/heavy fragments and their intrinsic () and deformation () components as a function of; (b) Fit of total kinetic energy distribution, decomposed into standard fission mode (blue Gaussian) and super-long fission mode (red Gaussian).
4.4.1. Key Features of the Ultra-Long Mode
-Shape and Total Kinetic Energy: The fission breakpoint shape in the super-long mode (Figure 10(b)) is significantly elongated compared to the standard mode. The peak of total kinetic energy distribution in the super-long mode is approximately 164 MeV, which is 16 MeV lower than that in the standard mode (180 MeV).
-Energy distribution: Due to extreme deformation, heavy fragments in the super-long mode possess higher deformation energy (15-20 MeV at total kinetic energy of 150-160 MeV), compared to only 2-3 MeV in the standard mode. Additionally, the high-energy density resulting from deformation gives heavy fragments in the super-long mode a distinct advantage in their eigenenergy distribution (Figure 3(d)). These two factors collectively result in significantly higher excitation energy for super-long mode heavy fragments (10-15 MeV above the standard mode), thereby leading to enhanced...
-Quality dependence: The super-long mode is most pronounced in the near-symmetric region, but its importance in asymmetric fission increases with rising neutron energy (Figure 12(a)). In thermal neutron fission, this mode shows no distribution effect, appearing only at specific times. At MeV energy, it dominates at certain times and remains observable in subsequent cases.
-Experimental agreement: The mean final kinetic energy of fragments in the ultra-long mode was 161 MeV, which is in good agreement with the measured value (156 [24]). Its mass dependence is consistent with experimental observations [24] (Figure 12(b)).
Figure 12: (a) SL mode fractions: calculated values (MeV) versus experimental values (MeV[24]); (b) SL mode averages: comparison of calculated values with experimental data [24] (standard mode = hollow symbol, super-long mode = solid symbol).
The super-long mode explains the faster growth rate observed with increasing energy: In thermal neutron fission, only the standard mode exists under all total kinetic energy conditions. As energy increases, the super-long mode emerges and preferentially excites heavy fragments. Experimentally, the additional instantaneous neutrons resulting from increased neutron energy primarily originate from heavy fragments [14], with the super-long mode providing the key mechanism for this phenomenon.
4.4.2. Observational Characteristics of Twin Peaks Fission
-Total kinetic energy mutation: In the vicinity (Figure 1(b)), the average total kinetic energy decreases by approximately 10 MeV, indicating a transition from standard mode dominance (asymmetric fission) to super-long mode dominance (nearly symmetric fission).
-Total kinetic energy fluctuation peak: Reaches its maximum near Figure 1(d), indicating equal weighting between the super-long mode and standard mode, resulting in a broader distribution of total kinetic energy.
4.5. Quantitative Comparison of Neutron Multiplicity Data
Table 1 presents a quantitative comparison between the calculated values and experimental data from Gook et al. [8] and Hambsch et al. [24] for thermal neutron-induced fission. The average absolute deviation (AAD) across all mass distributions is 0.12 neutrons, with the highest deviation (0.28 neutrons) observed at symmetric mass distributions. This level of agreement is comparable to other state-of-the-art fission models [7,28].
4.6. The Formation Mechanism of the Ultra-Long Mode is Explained
The super-long fission mode is characterized by a highly elongated fission breakpoint shape and low total kinetic energy. It is the result of the nuclear structure effect and the increase of the excitation energy.
1. Potential surface modification: The higher neutron energy reduces the fission barrier of elongated shapes, making the ultra-long mode more accessible [30].
2. Shell effect: When the generated fragments have near-integer numbers, the super-long mode is more favored, such as (near ¹³²Sn) [31].
3. Collective motion: The activation of energy enhances the amplitude of collective vibration, facilitating the transition to a highly elongated configuration [32].
These factors lead to the super-long mode being dominant at higher neutron energies, which is consistent with the calculation results.
5. Summary and Discussion
This study employs three-dimensional shape parameterized macro-micro potential energy surfaces and shape-dependent microscopic energy level density to apply the Metropolis random walk method to ²³⁵U at 5.55 MeV. The core innovation combines five-dimensional shape evolution with total kinetic energy gated neutron multiplicity calculations, establishing quantitative correlations between nuclear shape, excitation energy distribution, and neutron emission. Key findings, academic value, and future research directions are summarized below.
5.1. Key Findings and Academic Contributions
The quantitative framework of the total kinetic energy-total excitation energy-neutron multiplicity correlation is established, which shows that the neutron emission in the fragments is dominated by the total excitation energy change induced by the total kinetic energy and the nuclear structure effect. This framework reproduces the experimental data of asymmetric fission (deviation of neutrons) and provides the basis for the prediction of neutron yield in fission applications.
Dominance of ultra-long mode under high energy: At MeV energy, the ultra-long fission mode dominates in the near-symmetric region (), where enhanced excitation of heavy fragments occurs through large deformation energy and preferential eigenenergy allocation. This explains the faster growth rate observed in experiments [14], providing a novel mode-specific mechanism for neutron multiplicity regulation.
The distribution of excitation energy is dominated by the nuclear structure effects (e.g. shell closure, pair energy gap) at low total excitation energy, which leads to irregular sawtooth distribution. At high total excitation energy, these effects are weakened and the distribution approaches the expectation of the Fermi gas, which solves the long-standing ambiguity in the energy distribution assumption of the fission model.
4. Quantitative analysis of model limitations: The 3QS shape parameterization cannot capture the extreme elongation configuration of symmetric fission, resulting in overestimation of total kinetic energy (up to 20 MeV) and neutron multiplicity deviation (up to 1.7 neutrons). This quantification provides guidance for future improvements in shape parameterization.
5.2. The Comparative Advantage of the Mainstream Model
Compared with the existing fission models, the model presented in this paper has the following advantages:
1. Unified treatment of shape evolution and neutron evaporation: Different from the model that separates shape evolution and neutron emission calculation [3,5], this method integrates these processes and provides a more consistent description of fission dynamics;
2. Shape-dependent level density: Compared with the model using constant level density [2,6], the inclusion of shape-dependent level density makes the calculation of excitation energy distribution more accurate.
3. Quantitative prediction of the multiplicity of total kinetic energy: The model is one of the few models that can be calculated directly, and provides a detailed insight into the relationship between fission dynamics and neutron emission.
5.3. Boundedness
Fixed ratio: The model assumes that fragment ratios match ²³⁶U, ignoring actual variations—this exacerbates the total kinetic energy and neutron multiplicity bias in symmetric fission. Future work will incorporate isospin-dependent level density and mass models [21], allowing for variations in fragment ratios.
The parametricization of 3QS cannot fully capture the extreme elongation of symmetric fission, which limits the accuracy within the range. Future research will explore alternative shape parametricization methods, such as 4QS or multipole moment expansion.
Although the error is small, the inclusion of rotational kinetic energy can further improve the accuracy of the total excitation energy.
6. Future Work
Extension of shape parameterization: Incorporating shape parameters to describe non-axisymmetric configurations enhances the capture of extreme elongations in symmetric fission.
Allowing spin-dependent variations: Implementing an isotropic spin-dependent energy level density and mass model [21] to reduce deviations in symmetric fission.
Expanding the energy range: extending calculations to MeV (above the secondary fission threshold) to investigate ultra-long mode behavior at higher excitation energies.
Cross-model validation: Collaborating with other fission model teams [3-6], we utilized their computational frameworks to conduct quantitative comparisons of the contributions from eigenenergy and deformation energy.
This study advances the understanding of fission dynamics by correlating shape evolution, energy distribution, and neutron emission, providing key references for improving fission models and neutron yield predictions in nuclear science and engineering applications.
Acknowledgements
The author would like to express his gratitude to the University of Tokyo and Ziguang Experimental High School for their technical support in the experiment and instrument calibration. Special thanks are extended to independent researcher Ouyang for his contributions to experimental design and data visualization. Author Sun Wenming was responsible for the overall conceptualization of the study, theoretical model derivation, and manuscript writing. This study was not funded by any commercial sponsor, and all research activities were conducted in accordance with the research ethics and international publication standards of the University of Tokyo.
References
- K.N.Y. Nakagome, H. Yamamoto, I. Kimura, Nucl. Phys. A 632, 540 (1998). [CrossRef]
- B.D. Wilkins, E.P. Steinberg, R.R. Chasman, Phys. Rev. C 14, 1832 (1976).
- N. Dubray, H. Goutte, J.-P. Delaroche, Phys. Rev. C 77, 014310 (2008). [CrossRef]
- G. Scamps, C. Simenel, Nature (London) 564, 382 (2018). [CrossRef]
- A. Bulgac, P. Magierski, K.J. Roche, I. Stetcu, Phys. Rev. Lett. 116, 122504 (2016). [CrossRef]
- Bulgac, S. Jin, I. Stetcu, Phys. Rev. C 100, 014615 (2019). [CrossRef]
- M. Albertsson, B.G. Carlsson, T. Døssing, P. Möller, J. Randrup, S. Åberg, Phys. Lett. B 903, 135276 (2020).
- A. Göök, F.-J. Hambsch, S. Oberstedt, M. Vidali, Phys. Rev. C 98, 044615 (2018). [CrossRef]
- J. Randrup, P. Möller, Phys. Rev. Lett. 106, 132503 (2011). [CrossRef]
- J. Randrup, P. Möller, A.J. Sierk, Phys. Rev. C 84, 034613 (2011). [CrossRef]
- J. Randrup, P. Möller, Phys. Rev. C 88, 064606 (2013). [CrossRef]
- H. Uhrenholt, S. Åberg, A. Dobrowolski, T. Døssing, T. Ichikawa, P. Möller, Nucl. Phys. A 913, 127 (2013). [CrossRef]
- D.E. Ward, B.G. Carlsson, T. Døssing, P. Möller, J. Randrup, S. Åberg, Phys. Rev. C 95, 024618 (2017). [CrossRef]
- R. Müller, A.A. Naqvi, F. Käppeler, F. Dickmann, Phys. Rev. C 29, 885 (1984).
- P. Möller, A.J. Sierk, T. Ichikawa, A. Iwamoto, R. Bengtsson, H. Uhrenholt, S. Åberg, Phys. Rev. C 79, 064304 (2009). [CrossRef]
- J.R. Nix, Nucl. Phys. A 130, 241 (1969).
- A. Tudora, Eur. Phys. J. A 55, 98 (2019). [CrossRef]
- Al-Adili, Ph.D. Thesis, Uppsala University, 2013.
- P. Möller, T. Ichikawa, Eur. Phys. J. A 52, 173 (2015). [CrossRef]
- M.B. Chadwick et al., Nucl. Data Sheets 148, 189 (2018). [CrossRef]
- U. Brosa, S. Grossmann, A.M. Müller, Phys. Rep. 197, 167 (1990). [CrossRef]
- F.-J. Hambsch, S. Oberstedt, A. Tudora, G. Vladuca, I. Ruskov, Nucl. Phys. A 726, 248 (2003). [CrossRef]
- K.H. Schmidt, B. Jurado, Phys. Rev. Lett. 104, 212501 (2010). [CrossRef]
- R. Yanez, W. Loveland, J. King, J.S. Barrett, N. Fotiades, H.Y. Lee, Nucl. Phys. A 960, 16 (2017). [CrossRef]
- T. Døssing, H. Uhrenholt, S. Åberg, Phys. Rev. C 89, 044607 (2014). [CrossRef]
- A.J. Koning, J.R. Nix, Phys. Rev. C 58, 1634 (1998). [CrossRef]
- Simenel, G. Scamps, Phys. Rev. C 99, 014605 (2019). [CrossRef]
- J. Randrup, P. Möller, Phys. Rev. C 90, 054612 (2014). [CrossRef]
- P. Möller, J. Randrup, Phys. Rev. C 85, 034607 (2012). [CrossRef]
- N. Schunck, A. Bulgac, Phys. Rev. C 97, 064609 (2018). [CrossRef]
- P. Leconte et al., EPJ Web Conf. 239, 18006 (2020). [CrossRef]
- V.G. Solodov et al., Sov. J. At. Energy 8, 10 (1961).
Figure 1.
Relationship between the average total kinetic energy and the total kinetic energy distribution width of ²³⁵U thermal neutron fission and high energy neutron fission and the mass number of heavy fragments.
Figure 1.
Relationship between the average total kinetic energy and the total kinetic energy distribution width of ²³⁵U thermal neutron fission and high energy neutron fission and the mass number of heavy fragments.
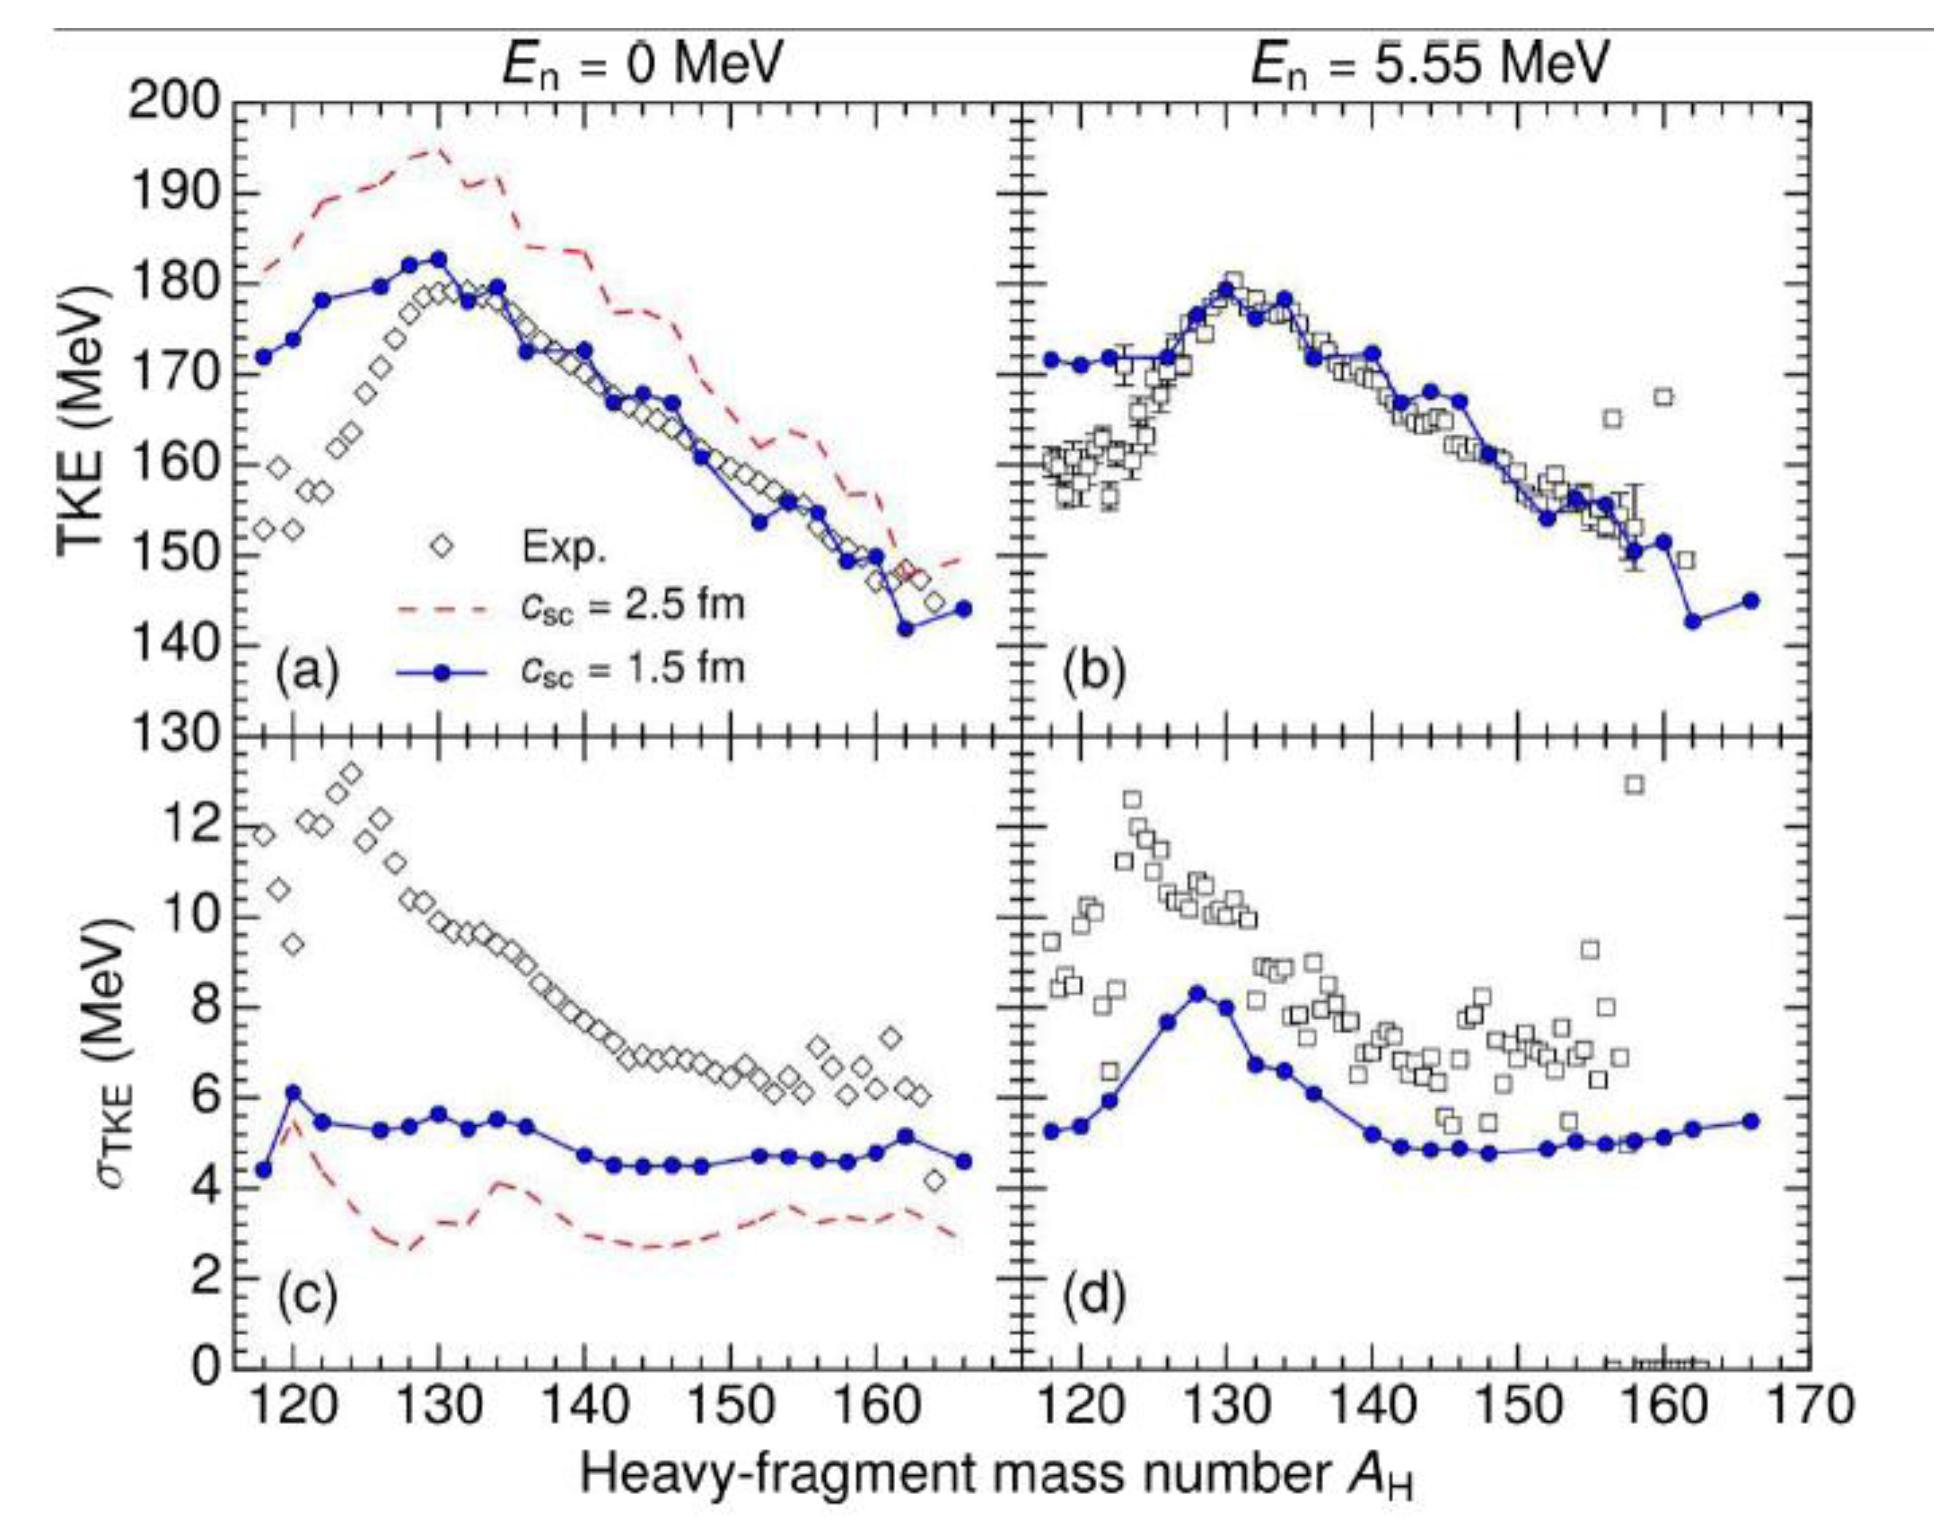
Figure 2.
Two-dimensional distribution of total kinetic energy (TKE) and fragment mass numbers in ²³⁵U thermal neutron fission (calculated vs. experimental data). Figure 2: (a) Model simulation results; (b) Experimental data [18]. Colors indicate event density, with red dashed lines representing the distribution contour.
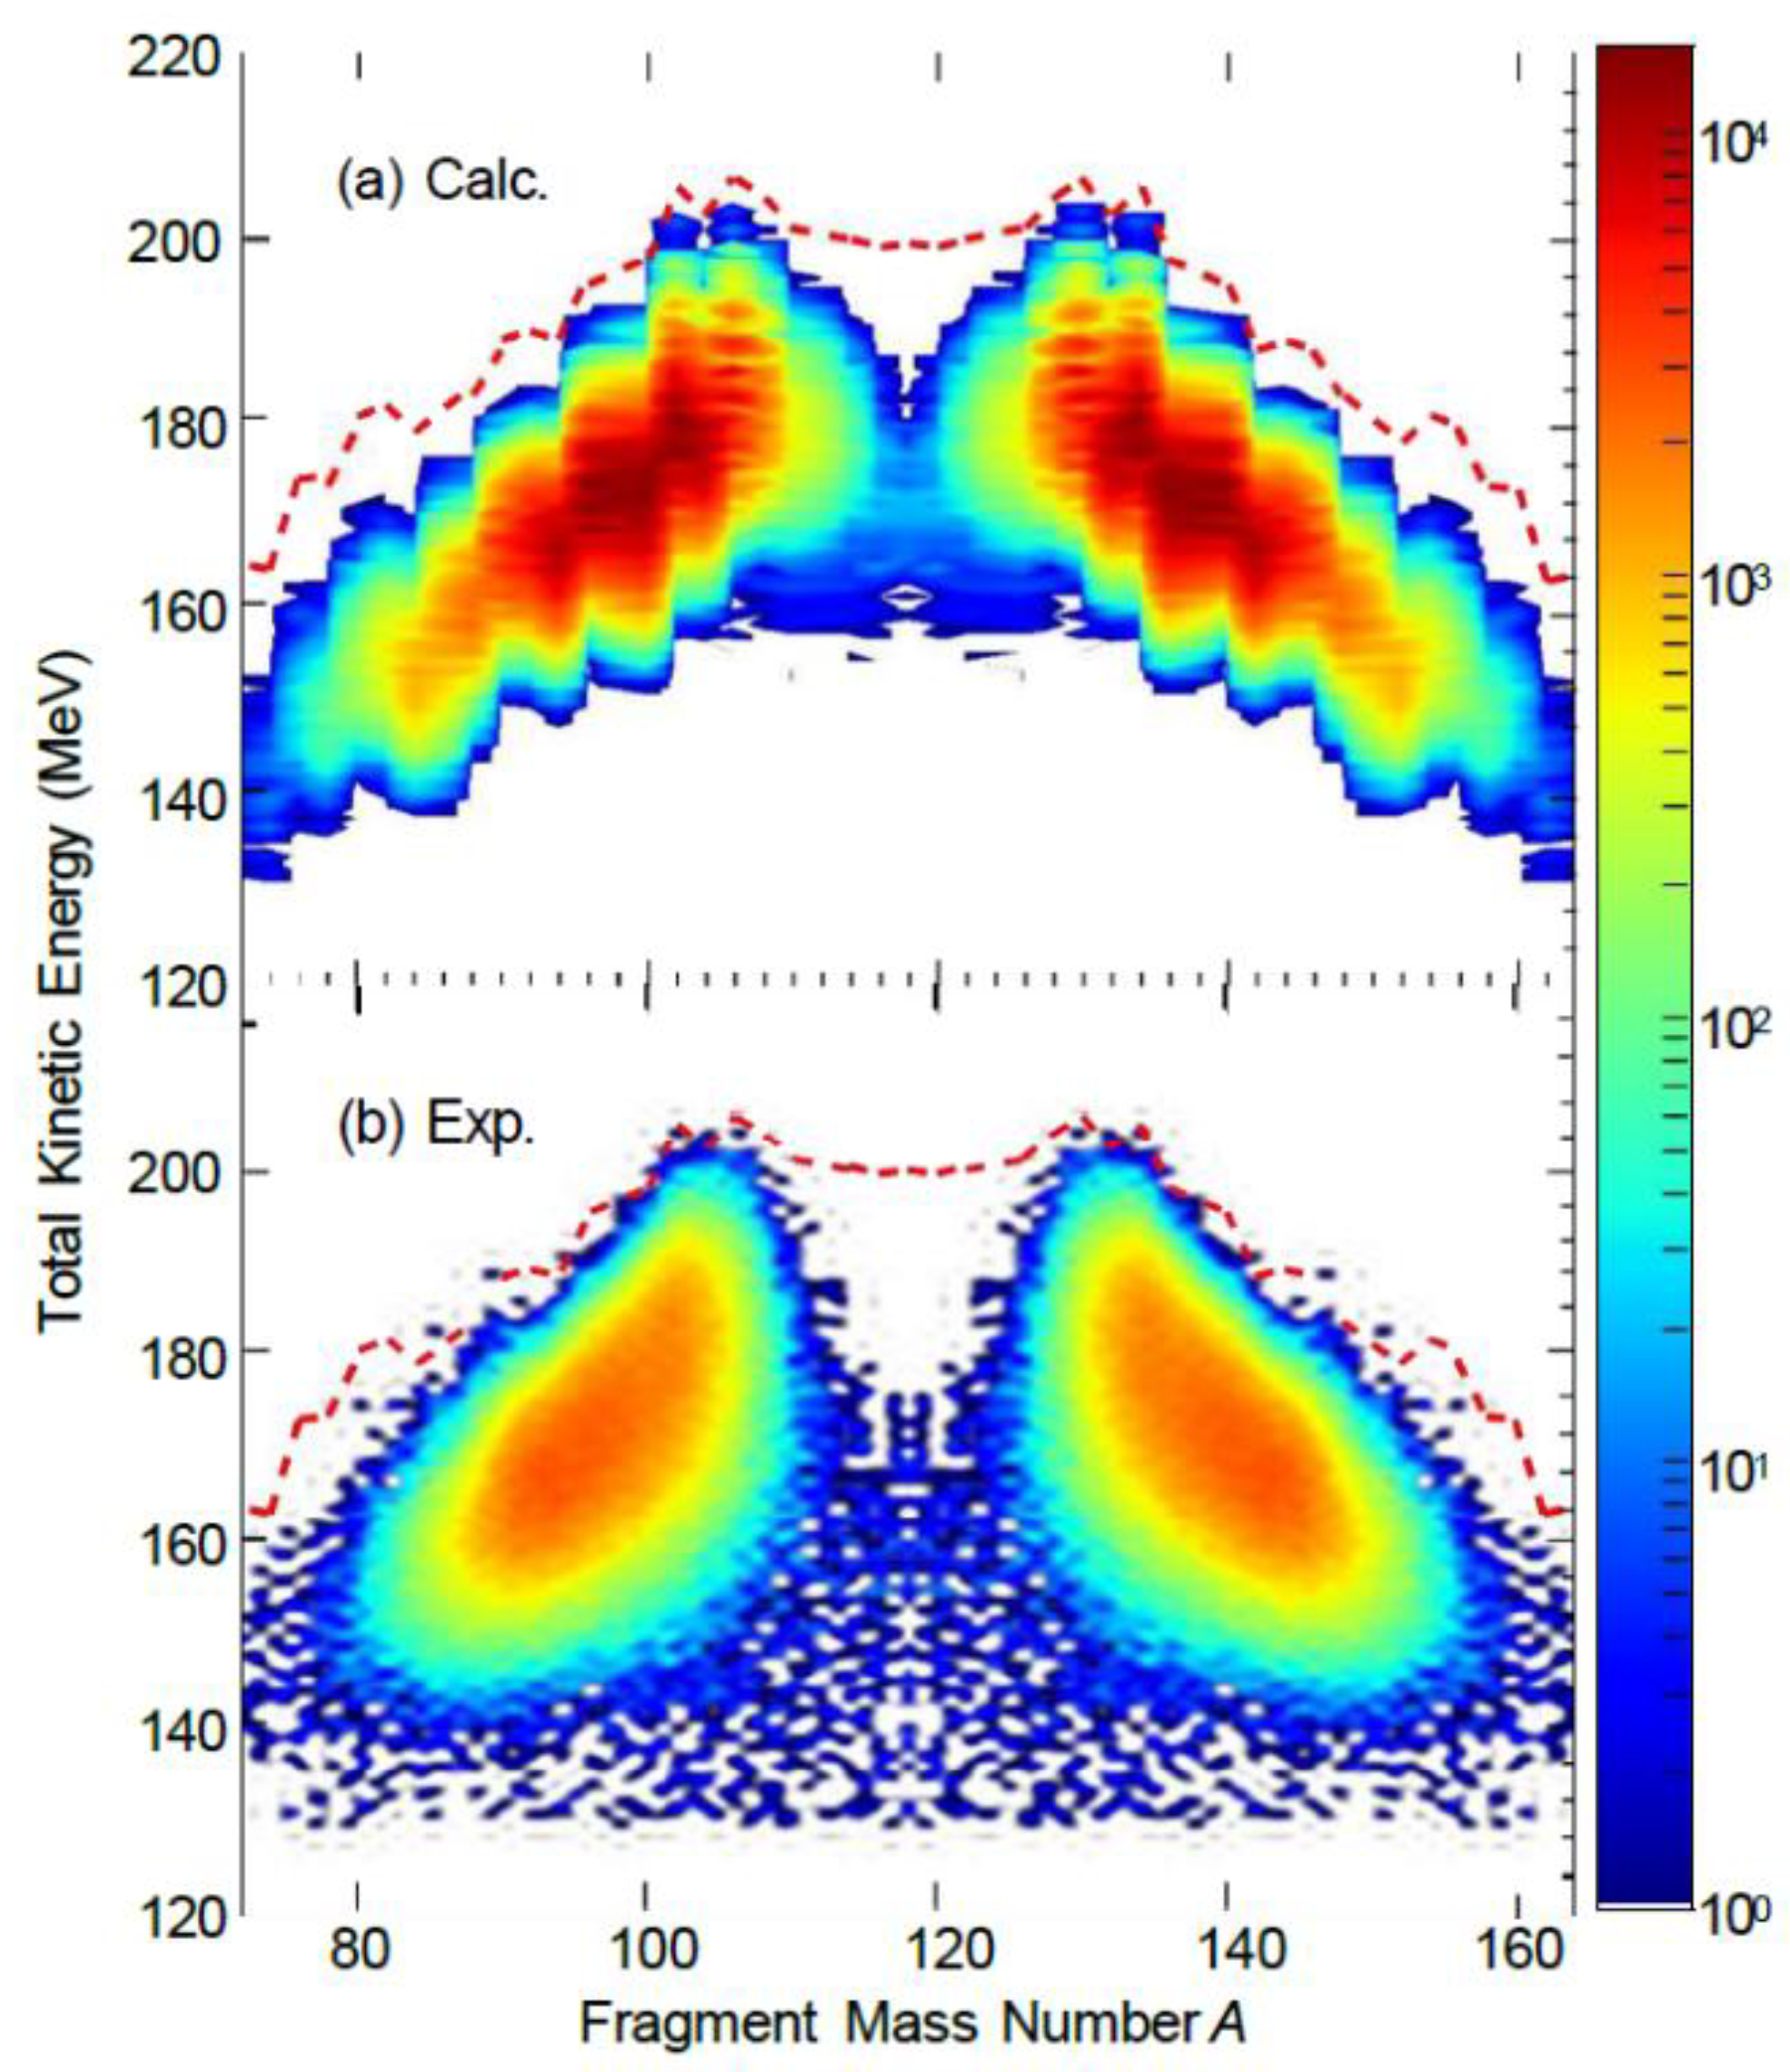
Figure 3.
shows the probability distribution of the heavy fragment's intrinsic excitation energy share in the mass distribution of ²³⁶U fission into ¹⁰⁴Zr (light fragment) and ¹³²Te (heavy fragment), under different total intrinsic excitation energies.
Figure 3.
shows the probability distribution of the heavy fragment's intrinsic excitation energy share in the mass distribution of ²³⁶U fission into ¹⁰⁴Zr (light fragment) and ¹³²Te (heavy fragment), under different total intrinsic excitation energies.
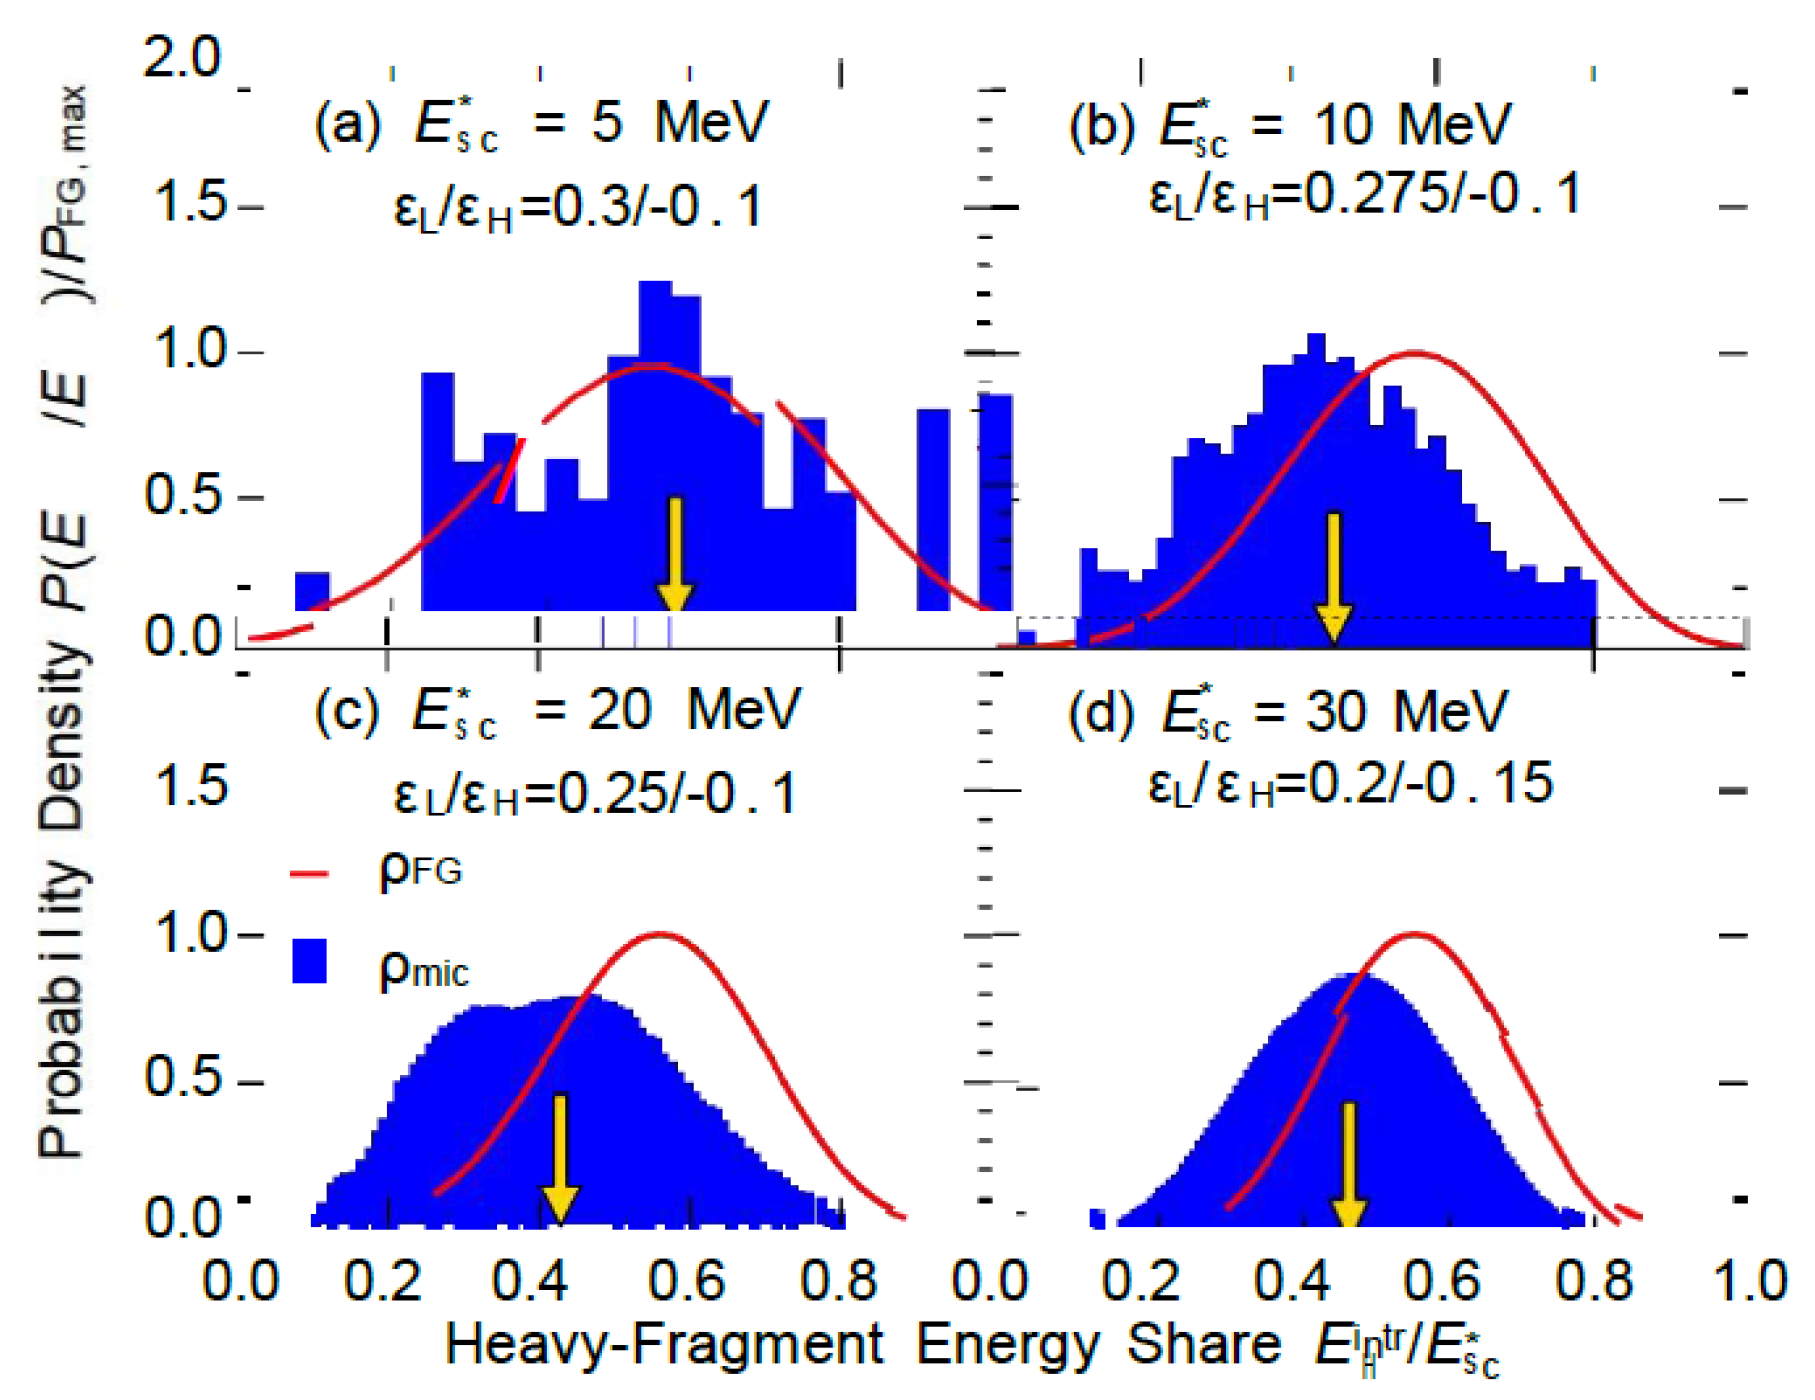
Figure 4.
Probability distribution of the intrinsic excitation energy share for heavy fragments (⁸⁸Se and ¹⁴⁸Ce) in the mass distribution of ²³⁶U fission into light fragments and heavy fragments (under different total intrinsic excitation energies).
Figure 4.
Probability distribution of the intrinsic excitation energy share for heavy fragments (⁸⁸Se and ¹⁴⁸Ce) in the mass distribution of ²³⁶U fission into light fragments and heavy fragments (under different total intrinsic excitation energies).
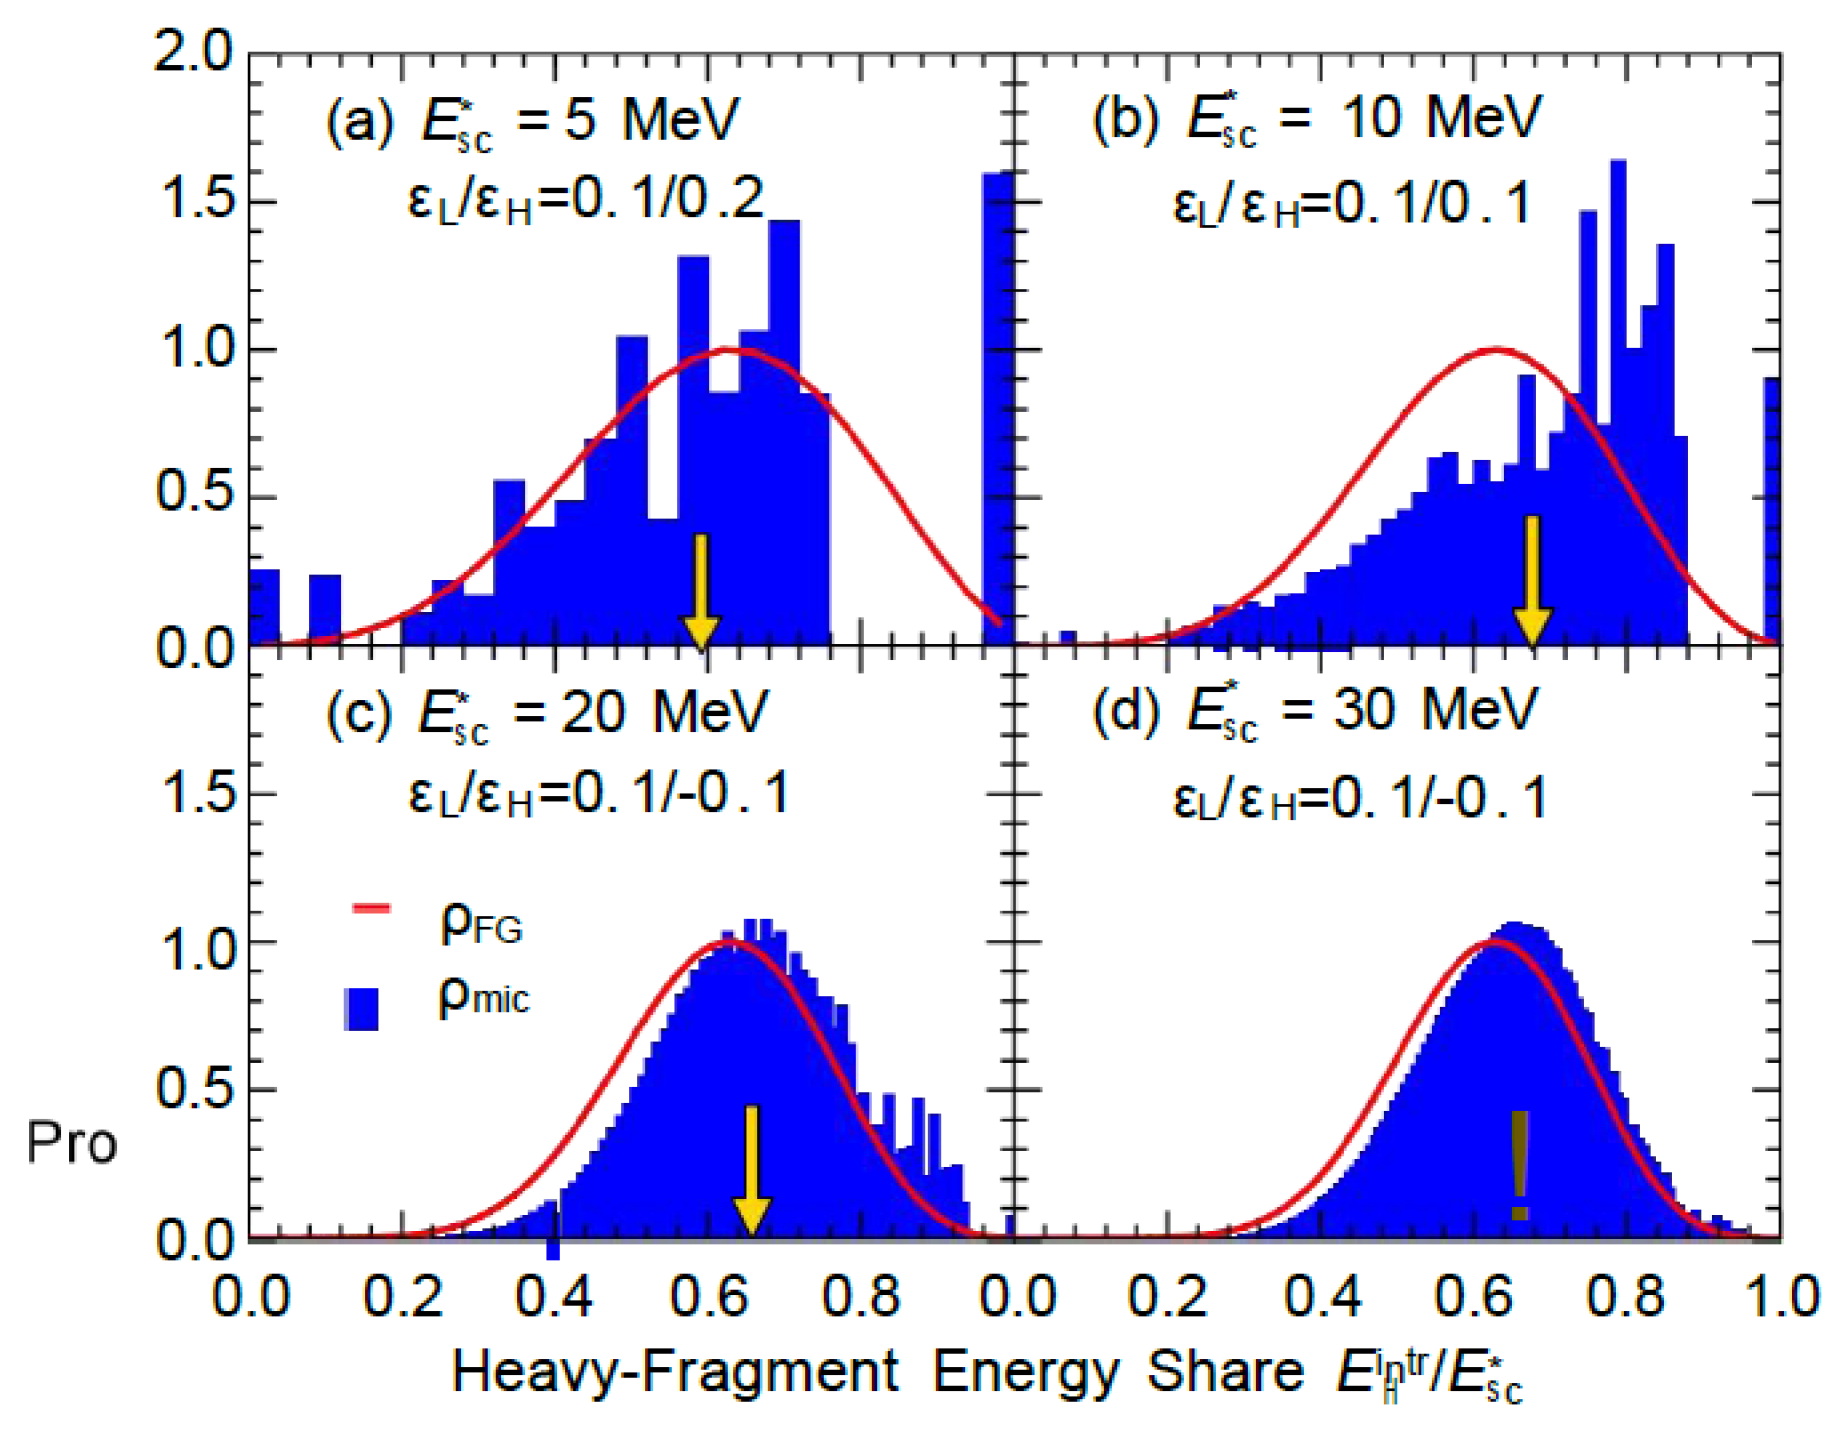
Figure 5.
Average intrinsic energy and average deformation energy of light/heavy fragments versus total kinetic energy (TKE) for eight fission mass distributions.
Figure 5.
Average intrinsic energy and average deformation energy of light/heavy fragments versus total kinetic energy (TKE) for eight fission mass distributions.
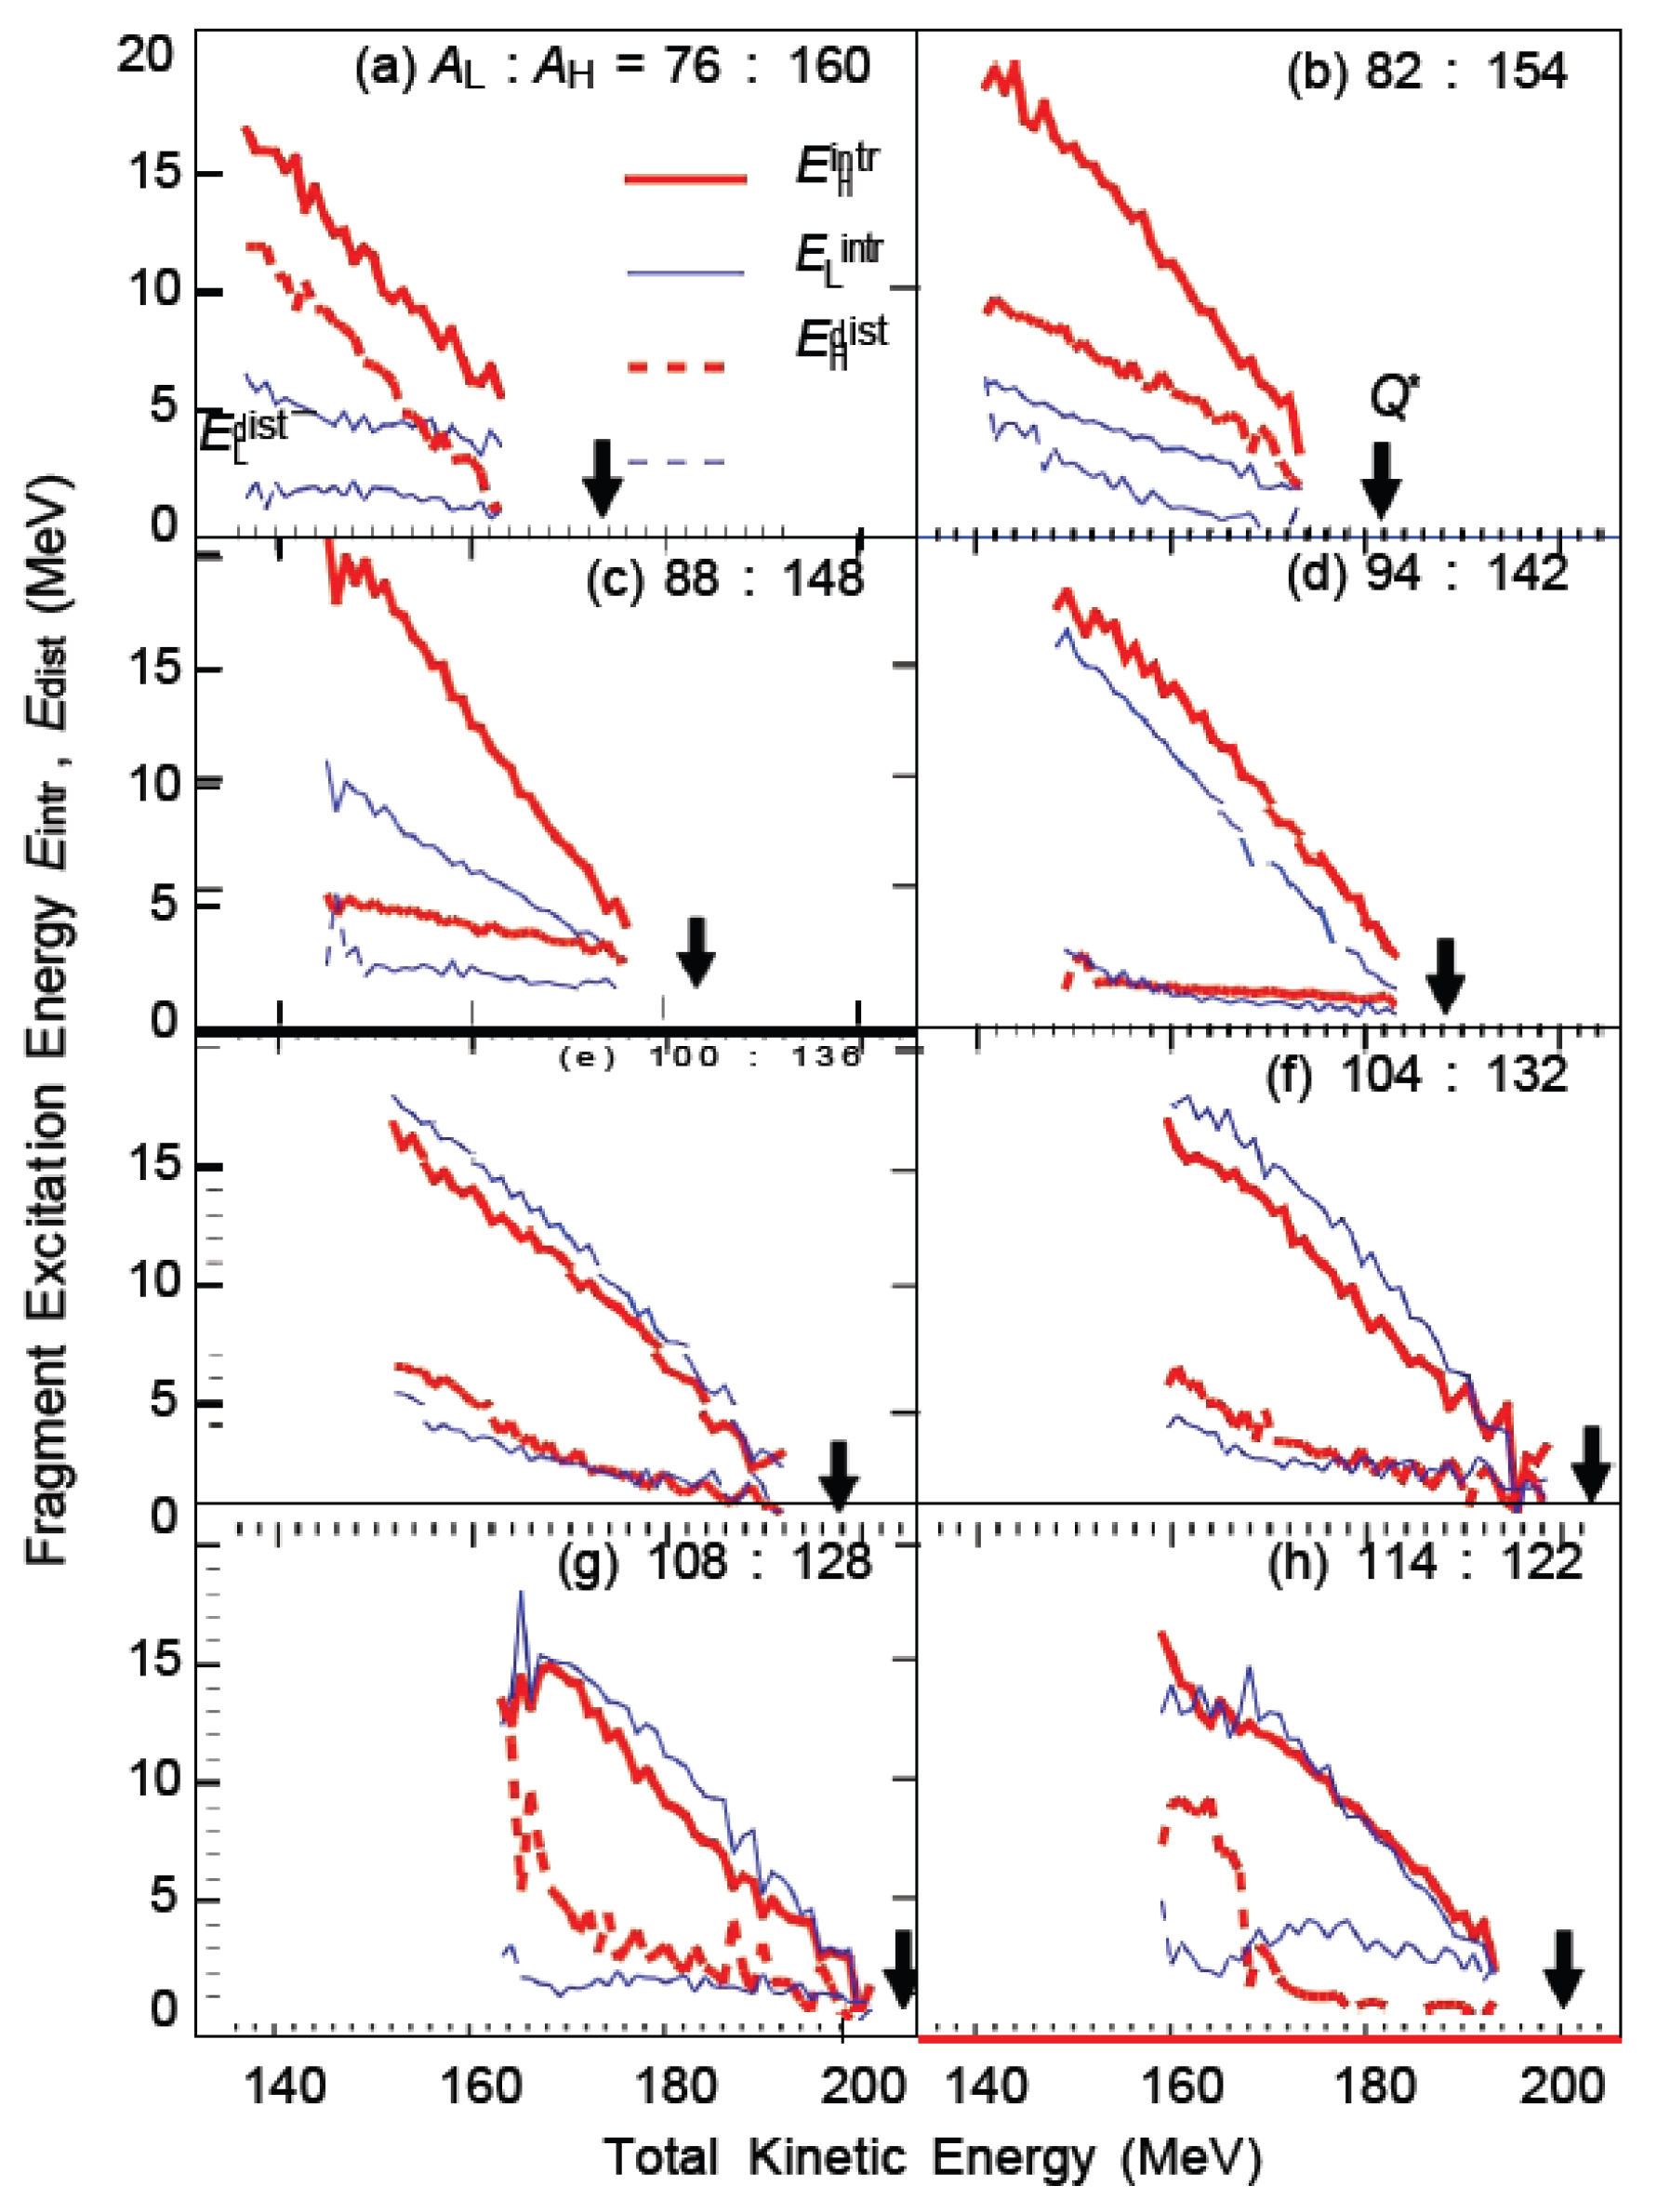
Figure 6.
Average deformation parameters of light/heavy fragments at the fission breakpoint under eight fission mass distributions versus total kinetic energy (TKE).
Figure 6.
Average deformation parameters of light/heavy fragments at the fission breakpoint under eight fission mass distributions versus total kinetic energy (TKE).
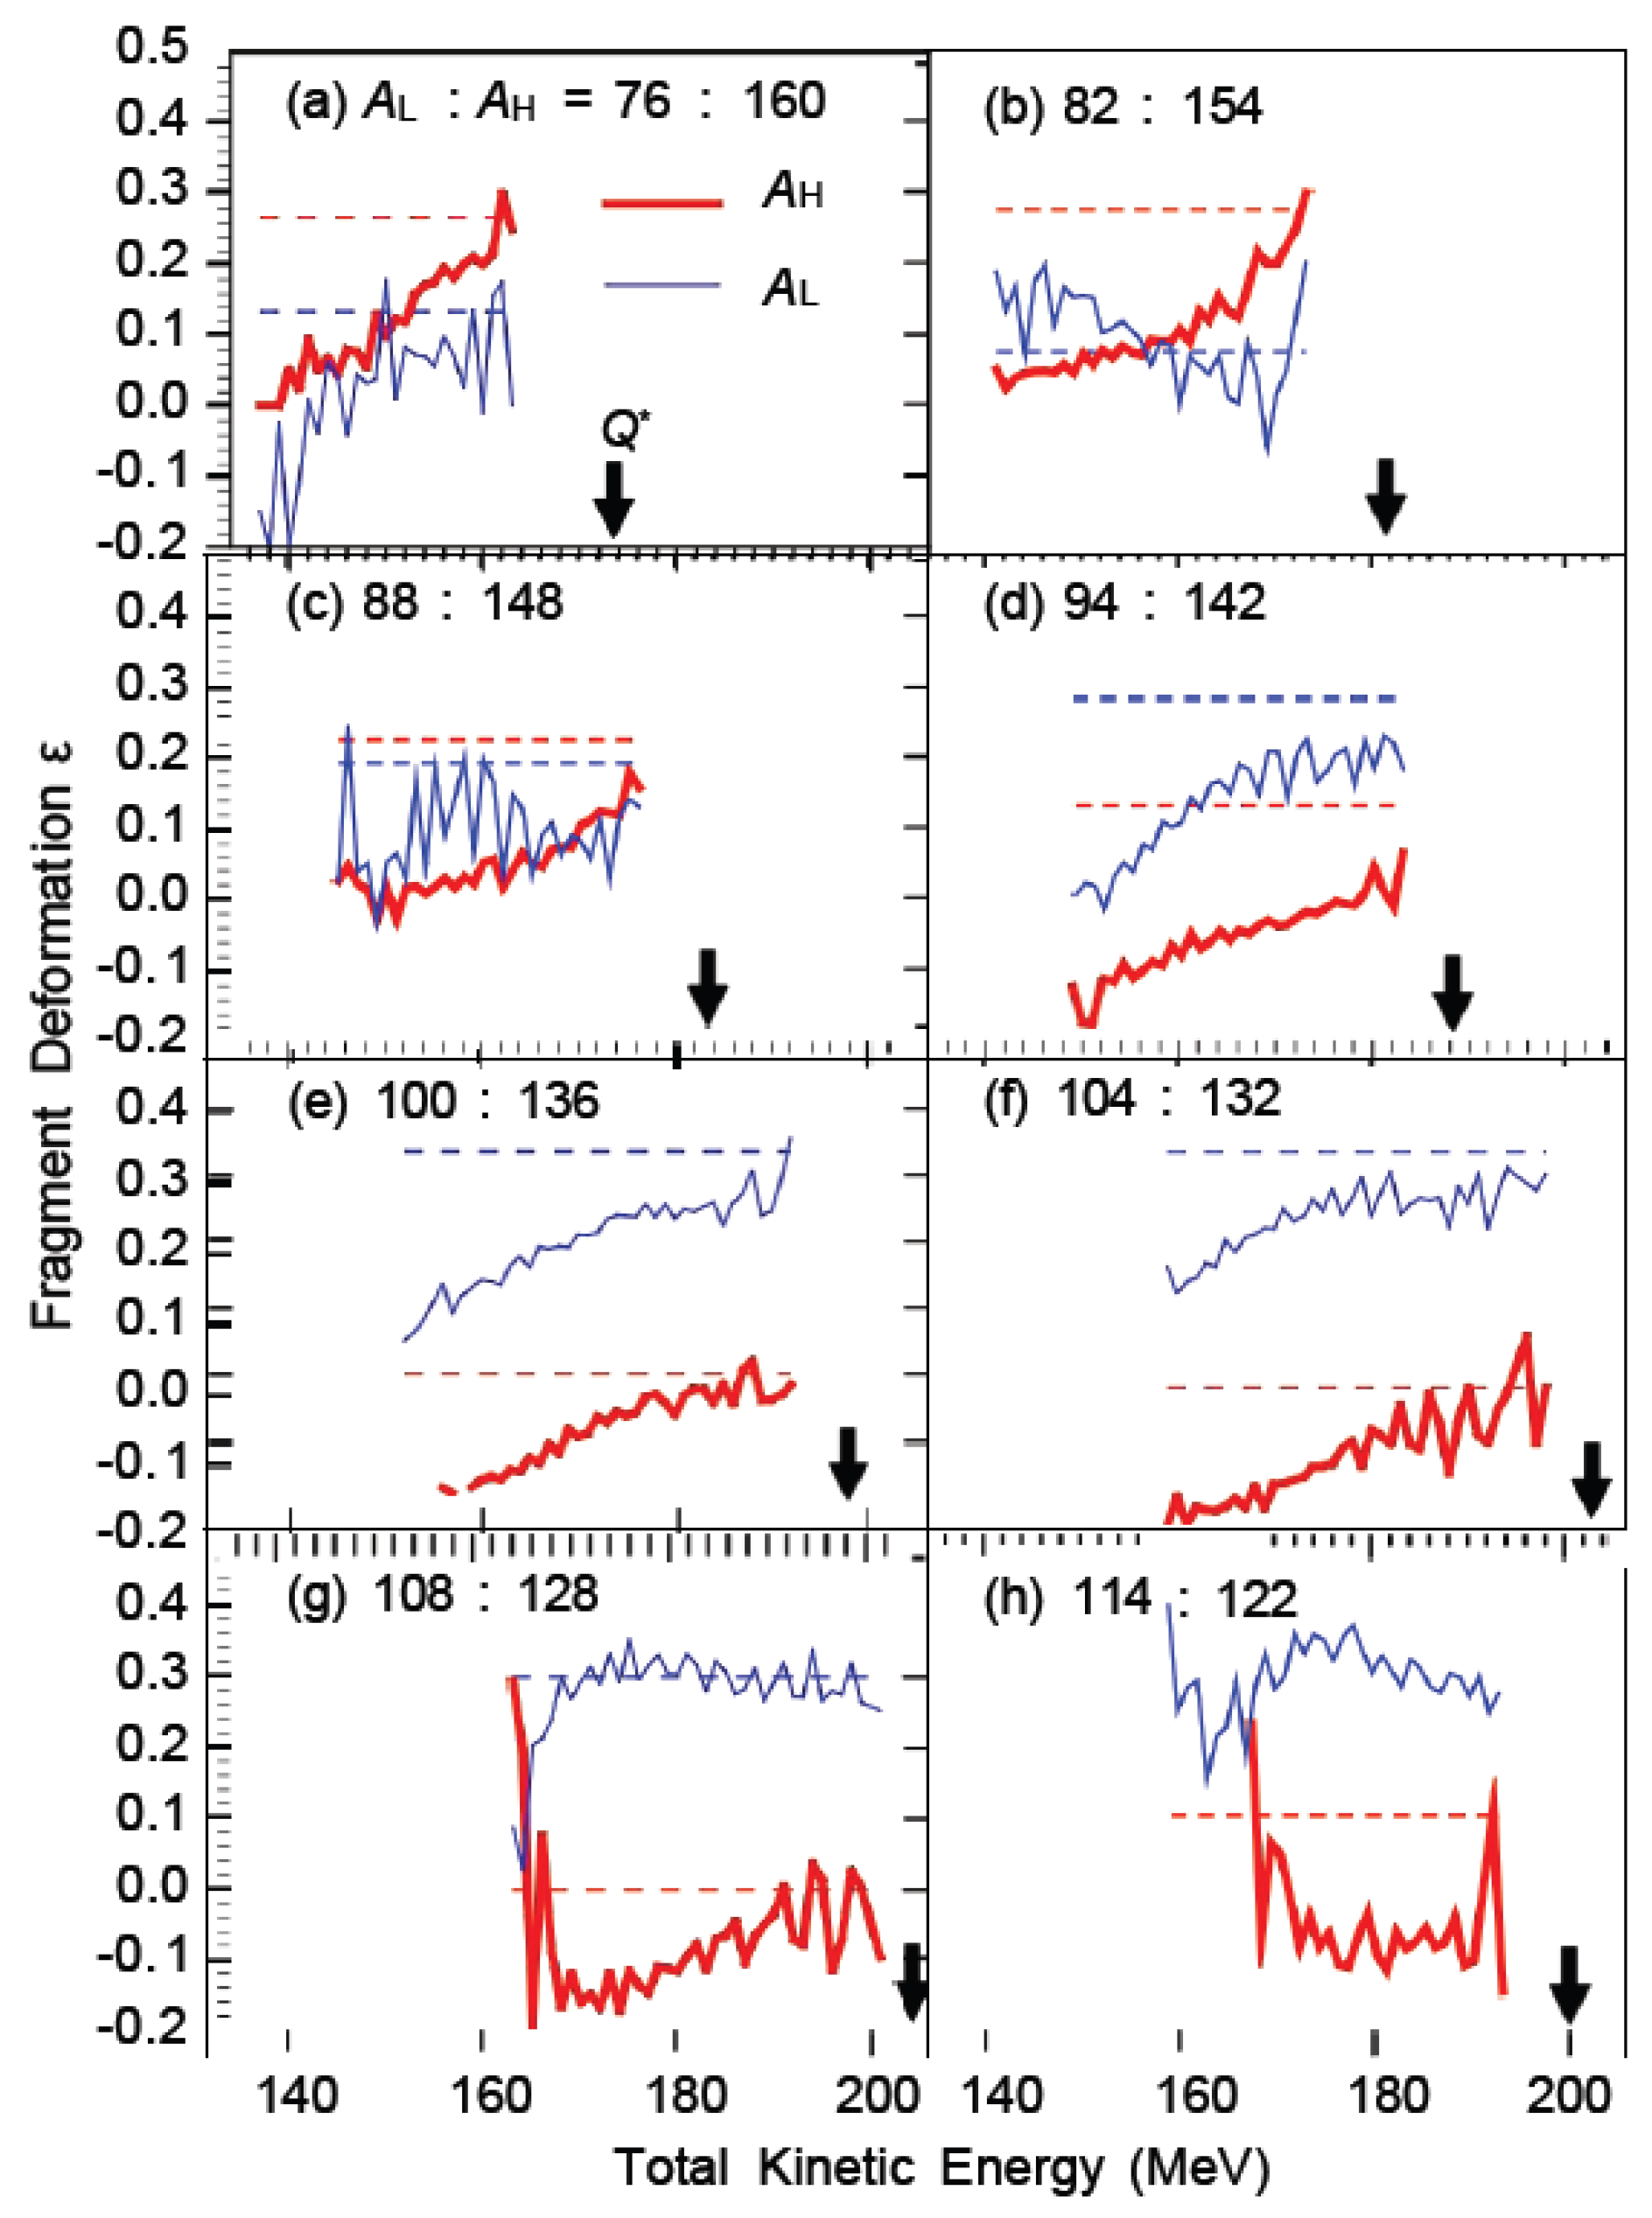
Figure 7.
Average neutron multiplicity (N) and total multiplicity (TKE) of light/heavy fragments under eight fission mass distributions as a function of total kinetic energy (TKE).
Figure 7.
Average neutron multiplicity (N) and total multiplicity (TKE) of light/heavy fragments under eight fission mass distributions as a function of total kinetic energy (TKE).
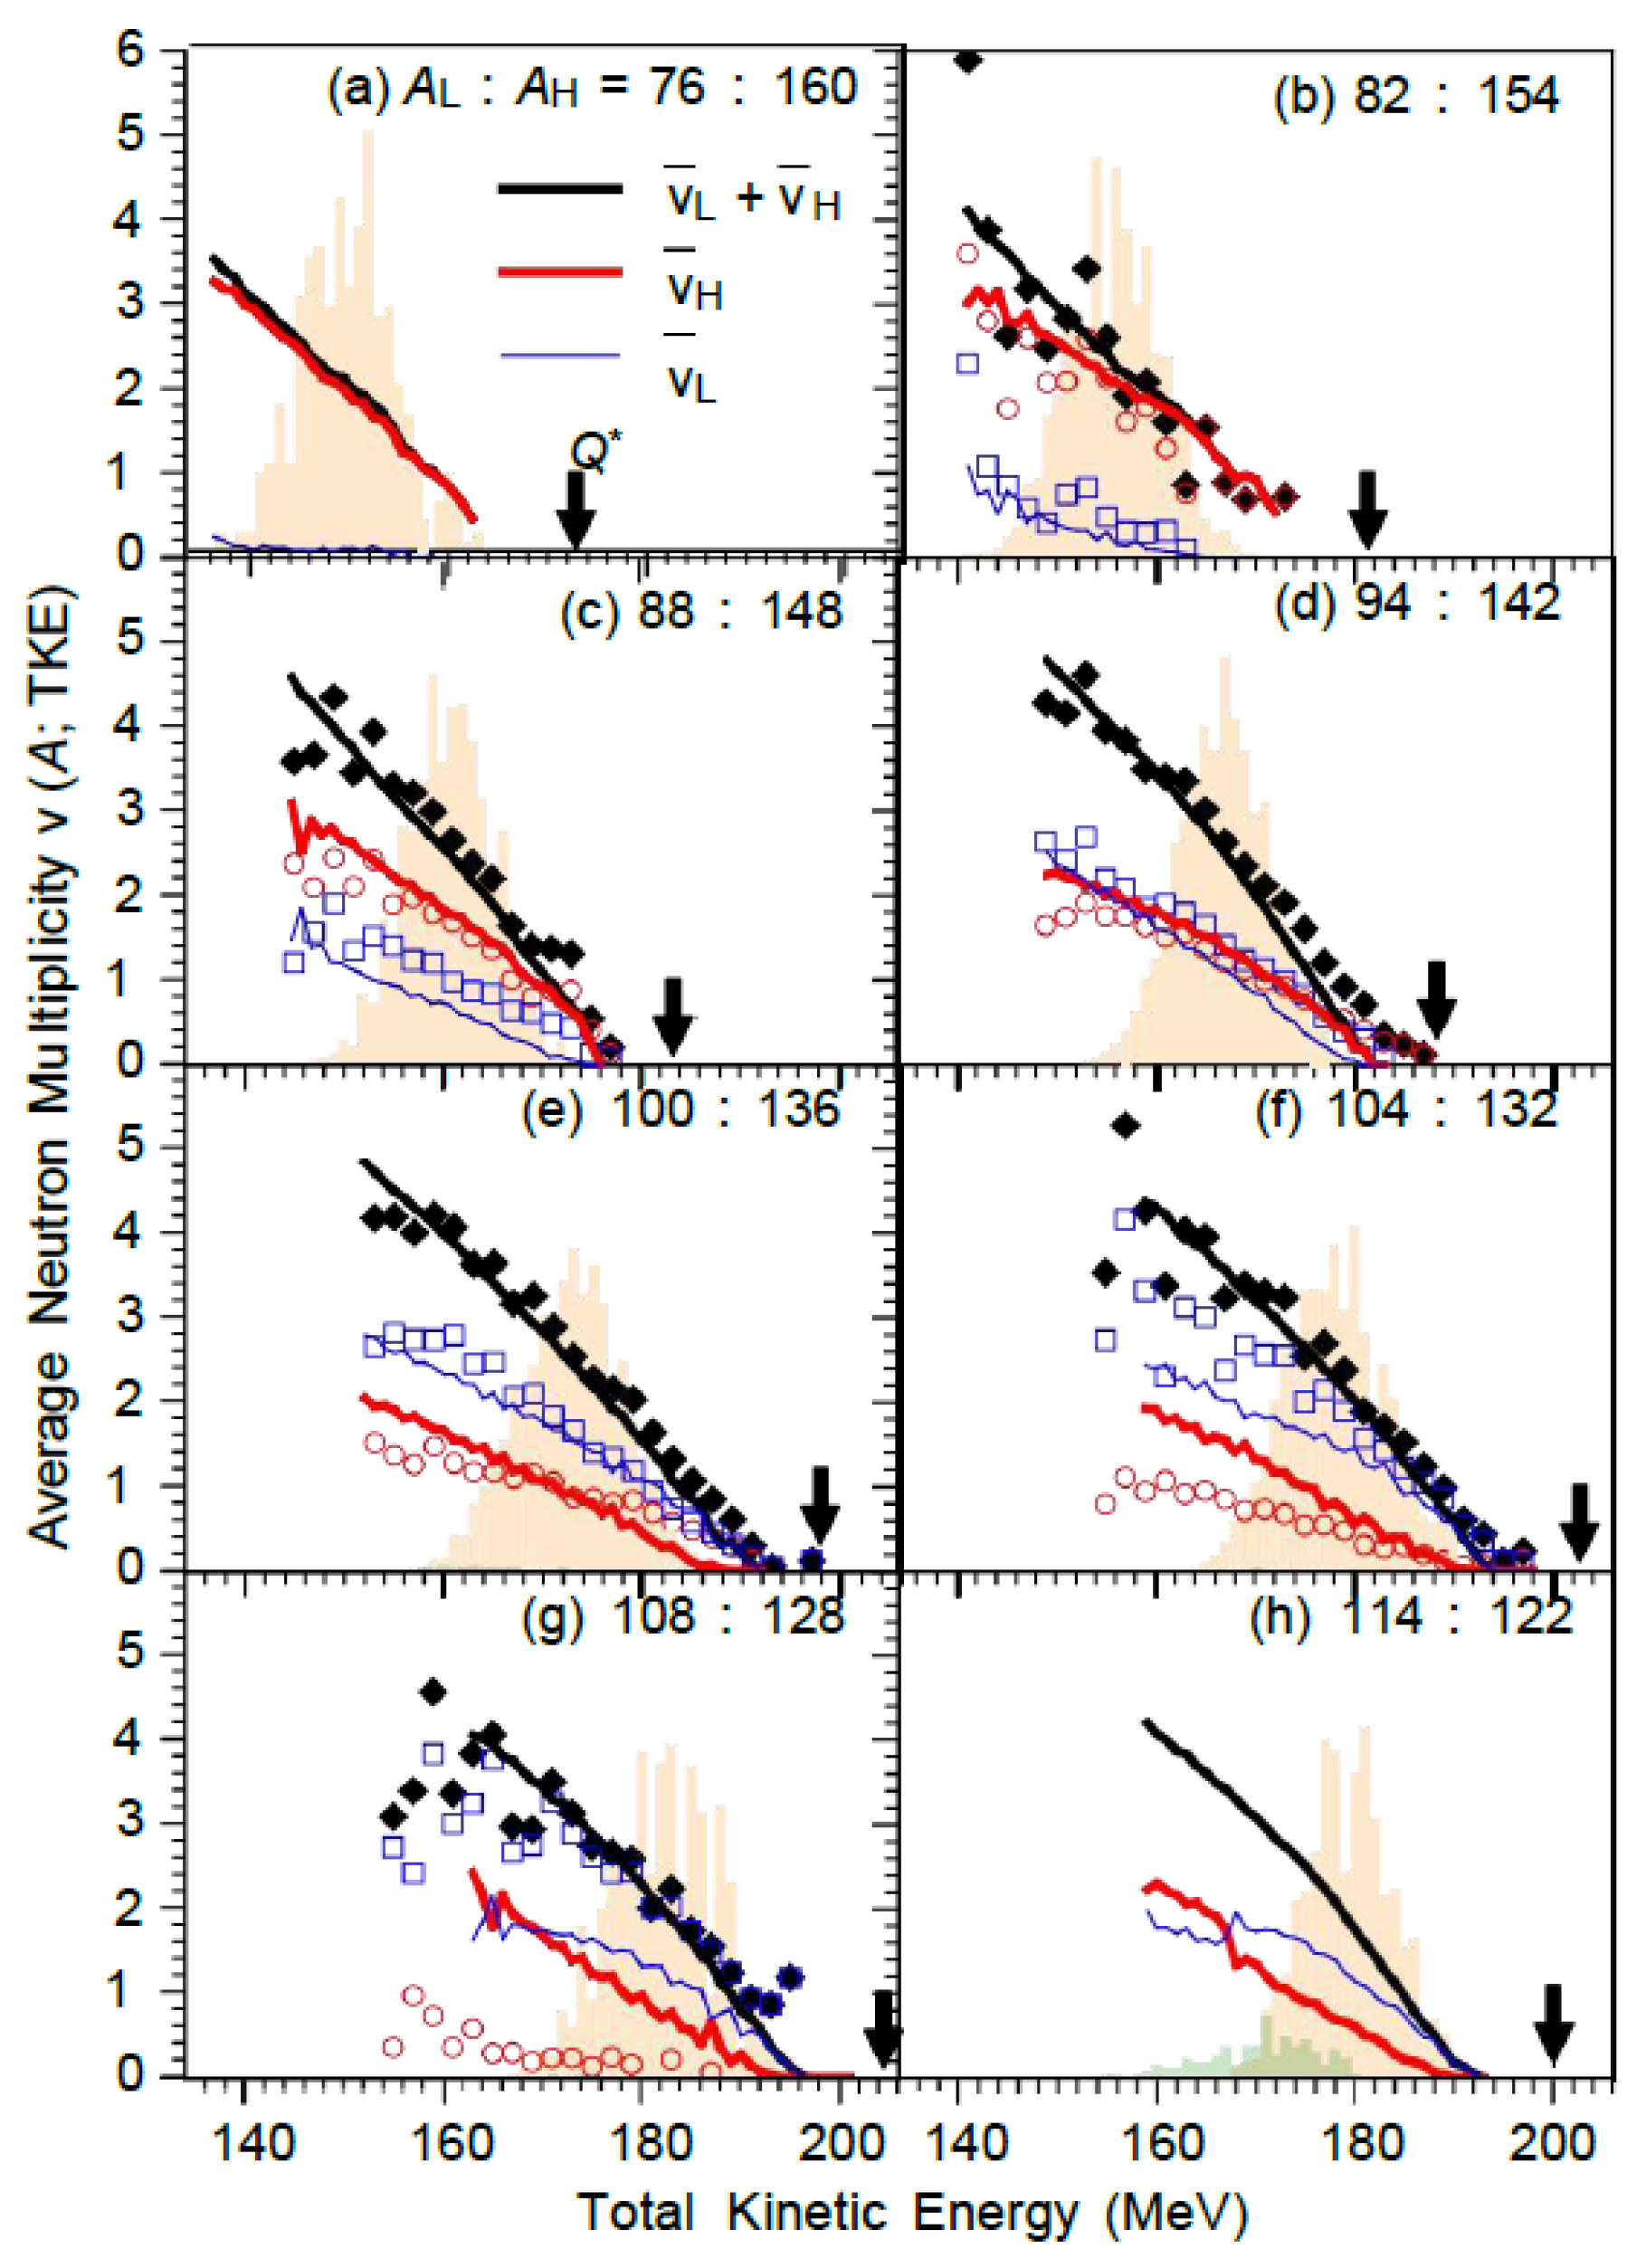
Figure 8.
Average neutron multiplicity (N) of fission fragments versus mass number (M) for ²³⁵U under thermal and high-energy neutron fission with varying total excitation energy (TXE).
Figure 8.
Average neutron multiplicity (N) of fission fragments versus mass number (M) for ²³⁵U under thermal and high-energy neutron fission with varying total excitation energy (TXE).
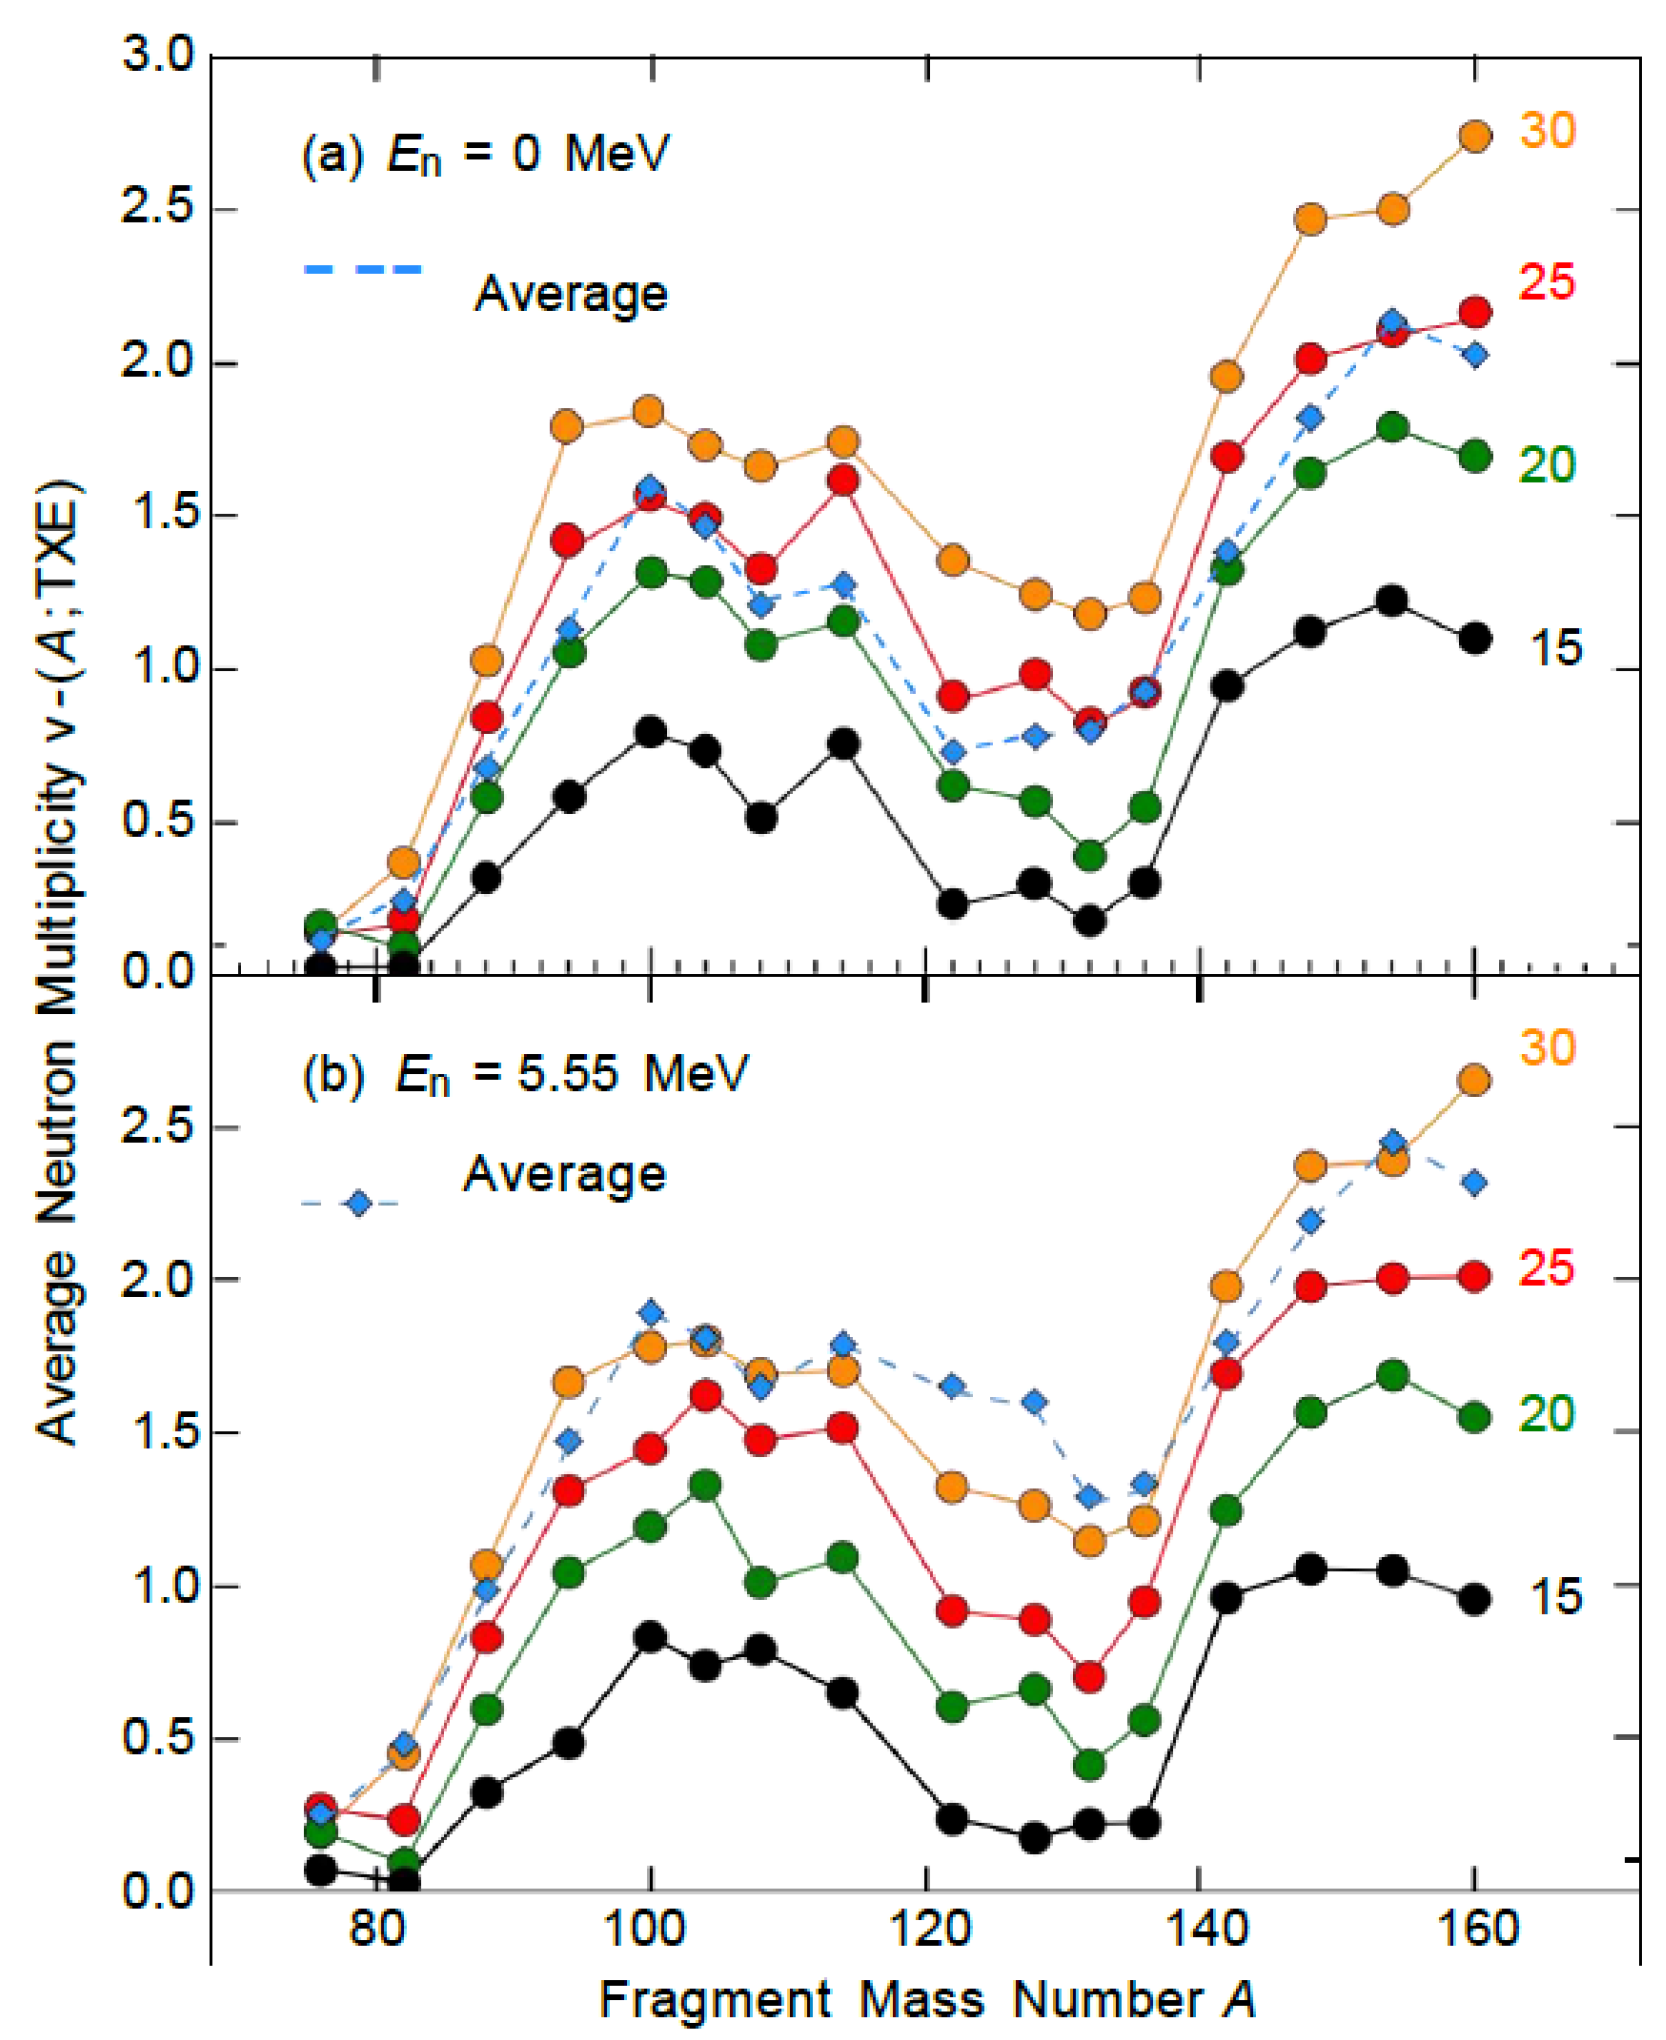
Figure 9.
Average neutron multiplicity (N) and total multiplicity (T) of light/heavy fragments under eight fission mass distributions as a function of total kinetic energy (TKE).
Figure 9.
Average neutron multiplicity (N) and total multiplicity (T) of light/heavy fragments under eight fission mass distributions as a function of total kinetic energy (TKE).
Figure 10.
Two-dimensional distribution of elongation (₂) and total kinetic energy (TKE) under 104:132 fission mass distribution (Eₙ=0 MₑV vs Eₙ=5.55 MₑV).
Figure 10.
Two-dimensional distribution of elongation (₂) and total kinetic energy (TKE) under 104:132 fission mass distribution (Eₙ=0 MₑV vs Eₙ=5.55 MₑV).
Figure 11.
Total excitation energy components and kinetic energy distribution of light/heavy fragments under fission mass distribution.
Figure 11.
Total excitation energy components and kinetic energy distribution of light/heavy fragments under fission mass distribution.
Figure 12.
Comparison of calculated versus experimental data showing the proportion of super-long (SL) fission modes and average total kinetic energy (TKE) versus heavy fragment mass number (M).
Figure 12.
Comparison of calculated versus experimental data showing the proportion of super-long (SL) fission modes and average total kinetic energy (TKE) versus heavy fragment mass number (M).

Disclaimer/Publisher’s Note: The statements, opinions and data contained in all publications are solely those of the individual author(s) and contributor(s) and not of MDPI and/or the editor(s). MDPI and/or the editor(s) disclaim responsibility for any injury to people or property resulting from any ideas, methods, instructions or products referred to in the content. |
© 2025 by the authors. Licensee MDPI, Basel, Switzerland. This article is an open access article distributed under the terms and conditions of the Creative Commons Attribution (CC BY) license (http://creativecommons.org/licenses/by/4.0/).
Copyright: This open access article is published under a Creative Commons CC BY 4.0 license, which permit the free download, distribution, and reuse, provided that the author and preprint are cited in any reuse.


