
Submitted:
26 November 2025
Posted:
26 November 2025
You are already at the latest version
Abstract
The rapid commercialization of next-generation photovoltaic (PV) technologies, particularly perovskite, thin-film roll-to-roll (R2R) architectures and tandem devices, necessitates the environmental performance, not only at cell or module level, but also in industrial manufacturing. Existing reviews and life cycle assessment (LCA) studies have compared device-level metrics, e.g., energy payback time and global warming potential, for silicon, cadmium telluride (CdTe), copper indium gallium selenide (CIGS) and perovskite technologies. Most syntheses yet remain limited to cradle-to-grave outcomes at technology level and rely heavily on aggregated inventory databases. They do not systematically compile or harmonize process-level life-cycle inventories (LCIs) for manufacturing steps that distinguish the industrial routes that include R2R coating, solution deposition, atomic layer deposition, low-temperature processing and novel encapsulation-metallization methods. These LCIs assess essentially how environmental impacts evolve across scale-up stages (lab-pilot-industrial), evaluating trade-offs in manufacturing, recyclability and critical material recovery, simultaneously providing standardized LCI templates for future studies. Motivated by gaps in inventory detail and methodological quince for emergent PV processes, this review: (1) compiles and critically analyses process-level LCIs for innovative PV manufacturing routes; (2) quantifies sensitivity to scale, yield, and energy mix; (3) proposes standardized methodological rules and open-access LCI templates to improve comparability, reproducibility, and techno-environmental modelling.
Keywords:
life cycle assessment
; photovoltaics
; sustainable manufacturing processes
; roll-to-roll
; perovskite
; scale-up
; life cycle inventory
; recycling
; material criticality
1. Introduction
The rapid expansion of global PV manufacturing marks a decisive phase in the clean-energy transition. By 2024, global installed PV capacity exceeded 1.6 TW, with annual production surpassing 400 GWp and a compound growth rate near 25% yr-¹ [1,2,3]. This surge has been driven by efficiency improvements, cost declines following a 20% learning rate per cumulative doubling of production [4,5,6], and increasing policy alignment with net-zero roadmaps [7,8]. As industrial production scales to the multi-gigawatt and terawatt levels, understanding the environmental performance of PV technologies is no longer limited to device physics or module-level metrics; it must encompass the manufacturing processes themselves that enable large-scale deployment.
Although PV technologies differ in materials, device structures, and manufacturing routes, most modern modules follow a broadly similar production sequence. Manufacturing typically begins with substrate or wafer preparation, such as cutting, texturing, or cleaning glass and silicon surfaces, followed by thin-film or wafer processing, which may involve coating, printing, chemical solution deposition, vapor deposition, or high-vacuum sputtering [3]. These layers are then consolidated through annealing or other thermal treatments to form the functional semiconductor stack. Metallization establishes the electrical contacts needed for charge extraction, while encapsulation and lamination protect the device from moisture, oxygen, and mechanical stress [8]. Finally, module assembly integrates the laminated cell stack with the frame, junction box, and wiring to produce the finished PV module. Each of these steps is associated with specific energy and material flows, which together determine the overall manufacturing footprint of PV technologies [3,8].
Previous comparative LCA studies of PV technologies have mainly evaluated different device classes, such as crystalline silicon, CdTe, CIGS, and perovskite, using high-level indicators. These indicators often include cradle-to-gate impacts, which cover environmental burdens from raw-material extraction (‘cradle’) to the point the product leaves the factory (‘gate’), and cradle-to-grave impacts, which additionally include use and end-of-life stages. Another commonly used indicator is energy payback time (EPBT), which measures how long a PV system must operate to generate the amount of energy that was required to produce it and global-warming potential (GWP), which expresses climate impacts in terms of CO₂-equivalent emissions over a specified time horizon [9,10,11,12].
Several studies, including Muteri et al. [9], Milousi et al. [10], and the ReCiPe-based assessment of Rashedi and Khanam [11], consistently report that thin-film technologies generally exhibit lower embodied energy and greenhouse-gas (GHG) emissions than conventional wafer-based silicon modules, largely due to lower material consumption and lower-temperature processing. ReCiPe is a widely used life cycle impact assessment (LCIA) method that converts emissions and resource flows into midpoint indicators, such as climate change, toxicity and endpoint indicators like human health, ecosystem quality, allowing for consistent comparison of environmental burdens [11]. However, these comparative assessments typically rely on aggregated LCIs datasets (e.g., Ecoinvent [10]) and therefore do not fully resolve the underlying unit-process data that describe coating, deposition, annealing, encapsulation, and metallization steps that dominate manufacturing impacts [12,13,14].
As next-generation PV technologies, particularly perovskite, tandem, and roll-to-roll (R2R) flexible architectures, move closer to commercialization, the need for process-specific environmental data becomes more urgent. Recent studies of pilot and industrial production lines show that steps such as drying/annealing, substrate preparation, and encapsulation can each contribute more than 60% of total cradle-to-gate GWP [12,13,14]. Detailed inventories covering R2R slot-die coating [15,16], atomic layer deposition (ALD) [17], low-temperature solution processing [18], and vacuum sputtering [19] further demonstrate strong sensitivity to operational conditions, including throughput, yield losses, and the carbon intensity of the electricity mix [20,21]. Yet few evaluations harmonize these datasets or examine how environmental indicators evolve as manufacturing scales from laboratory to pilot to industrial production levels [22,23].
Alongside these developments, new prospective and dynamic LCA frameworks have emerged to integrate technological learning rates and electricity-grid decarbonization with manufacturing LCIs [4,24,25]. These methods show that environmental learning curves can reduce the projected cradle-to-gate footprints of monocrystalline-Si and perovskite PV by 20-80% toward 2050 [24,26]. This aligns with techno-economic scaling models that link production capacity (MWp yr-¹) to both cost and embodied-energy reductions [2,13]. Together, these insights indicate that scale itself is an environmental variable, not only an economic one.
End-of-life (EoL) management has also gained prominence as global PV deployment expands. European industrial initiatives have demonstrated high-efficiency recovery of glass, aluminum, silver, and silicon from retired modules [27,28], while newer industrial trials report Ag and Si recovery rates above 90% [29,30]. Process-integrated LCAs show that closed-loop recycling can reduce cradle-to-grave GHG emissions by 40-80% [31,32], and policy analyses estimate more than 60 million tonnes of PV waste by 2045 in the EU alone [33]. Integrating these EoL pathways into manufacturing LCAs is therefore essential for circular-economy planning and assessing material criticality [6,34].
Despite this progress, no existing review systematically compiles and harmonizes process-level LCIs across the diverse manufacturing routes now emerging, from R2R coating and solution deposition to ALD, sputtering, and low-temperature encapsulation. Moreover, guidance on scaling rules, uncertainty treatment, and functional-unit normalization for such process inventories remains fragmented. Addressing these gaps is essential for consistent techno-environmental modeling and for designing the next generation of sustainable PV production lines.
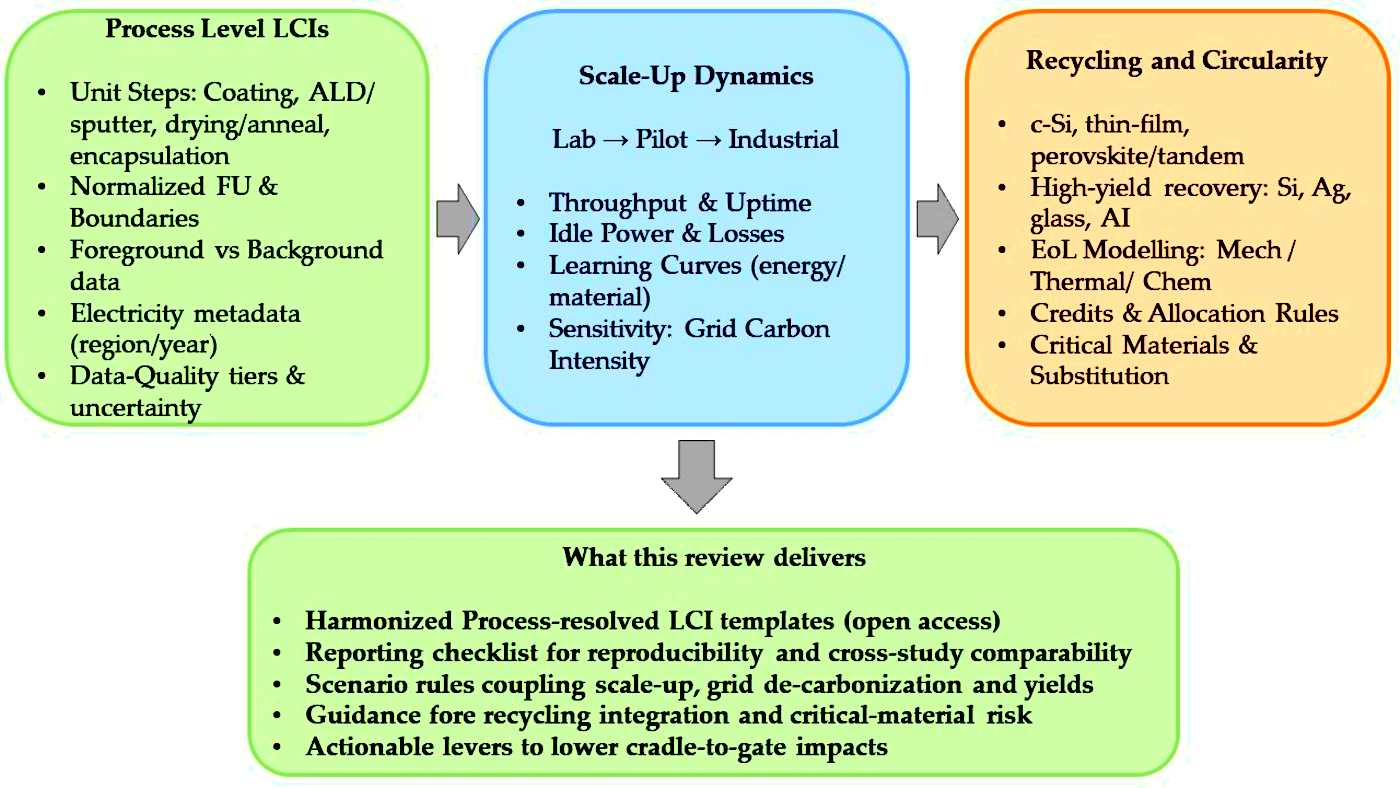
This review therefore aims to: (i) compile and critically analyze process-level LCIs reported for innovative PV manufacturing routes, including R2R, vacuum, and solution-processed lines; (ii) quantify scale-up dynamics (lab->pilot->industrial) and sensitivity to yield, throughput, and electricity carbon intensity; (iii) propose standardized methodological rules and open-access LCI templates to enhance comparability, reproducibility and integration with techno-economic assessments. By shifting the analytical focus from technology class to manufacturing process, this work contributes a harmonized evidence base for evaluating environmental trade-offs at industrial scale and supports the transition toward circular, low-carbon PV production.
2. Methodology
2.1. Literature Search Strategy
A structured literature search was carried out in Web of Science, ScienceDirect, and Google Scholar to identify peer-reviewed LCA studies relevant to PV manufacturing. The search covered publications from January 2015 to November 2025. The following exact search terms were used, both individually and in paired Boolean combinations:
- ‘life cycle assessment’,
- ‘LCA’,
- ‘photovoltaic’,
- ‘solar cell’,
- ‘perovskite’,
- ‘thin-film’,
- ‘roll-to-roll’,
- ‘tandem’,
- ‘manufacturing process’,
- ‘recycling’.
The Boolean structure followed the format: (life cycle assessment OR LCA) AND (photovoltaic OR solar cell) AND (manufacturing process OR recycling OR perovskite OR thin-film OR roll-to-roll OR tandem).
Using this exact search string ensured reproducibility and eliminated ambiguity in the retrieval procedure. A total of 1,824 articles were initially identified (889 from ScienceDirect, 543 from Web of Science, and 392 from Google Scholar), consistent with the screening summary shown in Figure 1.
2.2. Selection Criteria
To achieve consistency with the filtering steps shown in Figure 1, the inclusion and exclusion criteria were translated directly from the figure’s structure.
Inclusion filters (Figure 1, Step 2):
Articles were retained only if they met the following explicit criteria:
- Publication type: Review and Research article
- Research area: Environmental Science or directly related subfields
- Language: English
Exclusion filters (Figure 1, Step 2):
Articles were excluded if they focused on:
- E-waste
- Water-waste
- Medical-waste
- Construction-waste
- Hazardous-waste
or if they presented only one treatment scenario, making them unsuitable for comparative environmental analysis.
Applying these transparent filters reduced the dataset from 1,824 records to 102 articles, which were then included in the review.
2.3. Review Framework
Following the flow presented in Figure 1, the final set of 102 articles was examined to provide a general overview of the reviewed studies (Figure 1, Step 3). The analysis focused on identifying recurring themes in PV-related LCA research, including the types of manufacturing processes assessed, the system boundaries employed (cradle-to-gate or cradle-to-grave), and the methodological approaches used within Environmental Science research.
The selected studies were systematically analyzed based on:
- Technology focus: crystalline silicon, CdTe, CIGS, perovskite, tandem, or hybrid thin-film.;
- Manufacturing process coverage: deposition/coating, encapsulation, substrate preparation, metallization, and recycling;
- Scale and system boundary: laboratory, pilot, or industrial scale;
- Functional unit (FU) and impact categories (e.g., GWP, Cumulative Energy Demand (CED), Acidification Potential (AP), Eutrophication Potential (EP));
- The FU is the quantified reference that defines what exactly is being compared in an LCA. It provides a consistent basis for calculating and normalizing environmental impacts across different technologies, processes, or scales.
- Data source type: experimental, modeled, or hybrid;
- LCA methodology: attributional vs. consequential, LCI data transparency, and software tools used;
- Treatment of end-of-life (EoL) and circularity: recycling scenarios, recovery of critical materials, and reuse routes.
3. Technology and Process Landscape
Industrial PV manufacturing has diversified beyond conventional crystalline-silicon (c-Si) wafer routes toward perovskite, tandem, and thin-film architectures, bringing new materials, unit operations, and production configurations that reshape both environmental and techno-economic performance.
3.1. Perovskite, Tandem, and Thin-Film Routes: Technical Primer
Perovskite PVs have advanced from laboratory cells to pre-industrial modules exceeding 800 cm² and certified efficiency above 25% [1,14,18,35]. Two dominant device stacks, such as mesoporous n-i-p and inverted p-i-n, impose distinct sequences of deposition, annealing, and encapsulation with measurable differences in embodied impacts at the mini-module scale [14]. Tandem configurations that pair perovskite top cells with silicon or CIGS bottom cells provide a practical route beyond single-junction limits and are now a focal point of sustainability reviews and prospective LCAs [21,22]. Across technology families (Si, CdTe, CIGS, perovskite), comparative reviews consistently show that absorber chemistry governs toxicity/criticality profiles while substrates and encapsulants dominate energy use, particularly for flexible or building-integrated photovoltaics (BIPV) applications [19,36]. Low-temperature, carbon-electrode perovskites reduce both thermal budgets and metal intensity relative to noble-metal stacks, with recent cradle-to-gate LCAs confirming meaningful GWP reductions at process scale [18,35]. Taken together, these findings highlight perovskite and tandem platforms as strong candidates for high-efficiency, lower-temperature manufacturing with clear pathways toward flexible and integrated PV products [1,14,21,22,36].
3.2. Unit Operations and Equipment Classes
Process-level environmental burdens in next-generation lines are concentrated in a few unit operations: substrate preparation/clean, solution or vacuum deposition, drying/annealing, contact formation and encapsulation/lamination [8,12,37]. For solution-processed routes, slot-die and related scalable coaters enable continuous wet deposition with solvent choice and recovery as first-order levers; comparative studies show that switching to greener solvents and continuous coating cuts electricity and solvent burdens versus batch doctor-blading [15,16]. ALD and related vacuum steps remain essential for barrier layers and TCOs; recent assessments quantify their strong non-linear sensitivity to throughput and grid carbon intensity and outline mitigation pathways at the recipe and tool levels [17]. Thermal/photonic annealing frequently dominates step-level energy, reinforcing the need for furnace/oven ecodesign and heat-management strategies in industrial lines [12,38]. For device reliability and circularity, encapsulation choices (glass-glass vs. polymer-metal foils, barrier performance, curing routes) can shift cradle-to-gate GWP by double-digit percentages and determine feasible EoL pathways [12,39,40]. Complementary developments in thermal management and peripheral equipment (e.g., heat sinks, power electronics) round out the equipment landscape and hotspot profile for process-resolved LCIs [40,41]. Harmonizing these unit operations into wet/thermal/vacuum/ambient classes provides a consistent scaffold for cross-technology LCI reporting and later scale-up modelling [8,12,17].
3.3. Typical Line Configurations
Manufacturing architectures cluster into batch, continuous R2R, and hybrid flows. Batch toolsets (common in wafer-based lines) offer tight control but limited throughput scalability; in contrast, R2R integrates sequential coating, drying, and barrier formation on moving webs to maximize material utilization and line uptime [15,16]. Hybrid lines that combine continuous solution coating of functional stacks with batch vacuum finishing or encapsulation are increasingly used on pilot and pre-industrial perovskite/OPV lines and have demonstrated competitive energy use and yield trajectories [42,43]. System-level integrations (e.g., PV/Thermal (PV/T) hybrids) highlight additional layout choices and thermal constraints that influence both product design and line configuration [44]. As Figure 2 illustrates, the choice of batch vs. R2R vs. hybrid determines the frequency and intensity of energy-intensive steps (dry/anneal, vacuum modules) and therefore the dominant contributions to cradle-to-gate GWP and throughput-dependent learning.
4. Process-Level LCI Compilation and Harmonization
4.1. Normalization Rules (FU, Boundaries, Electricity)
Harmonized LCIs for next-generation PV processes require normalization of FUs, system boundaries, and energy inputs to ensure comparability across studies and technology readiness levels. Most cradle-to-gate studies adopt 1 m² of module area or 1 kWp of rated capacity as FU, yet results can diverge by more than an order of magnitude if yield, lifetime, or active-area ratios are not consistently applied [3,8,12,26,45]. A transparent reference FU anchored to 1 m² active layer and expressed in MJprimary/kWp or g CO₂-eq/Wp allows consistent scaling between lab-scale device data and industrial throughput scenarios [46,47,48].
Boundary harmonization similarly requires clear distinction between foreground process modeling (substrate, deposition, annealing, encapsulation) and background datasets (upstream electricity, gases, solvents). International Energy Agency (IEA) guidance [3] and recent prospective frameworks [23,24,26] recommend aligning cut-offs and material inclusions with ISO 14044 [49] while explicitly reporting excluded utilities (vacuum pumps, clean-room HVAC). Grid electricity normalization remains a dominant factor; its contribution to total GWP varies from <20% in low-carbon grids to >60% in coal-intensive systems [2,24,50]. Recent process-level LCAs show that electricity carbon intensity, tool idle times, and heating method (furnace vs. photonic) can explain 70-80% of cross-study variability in impact results [17,51].
To facilitate meta-analysis, all process inventories in this work are expressed using a unified reference of EU-27 grid (2023) [1] for baseline scenarios and a normalized FU of 1 m² active absorber equivalent, unless otherwise specified.
4.2. LCIs by Process Family
Process LCIs were grouped into solution-based, vacuum-based, and hybrid thin-film families according to dominant energy and material drivers [8,12,17,32,42,52]. For each, per-step data (solvent mass, energy use, emission factors) were harmonized following the functional-unit and boundary normalization rules given in Section 4.1. Solution processes (slot-die, blade, inkjet): Step LCIs are dominated by solvent use, drying/annealing, and substrate handling. Data from [12,15,16,42,48] indicate embodied energy between 200-400 MJ m⁻², with solvent recovery efficiency as the main uncertainty lever. Vacuum processes, ALD, sputtering, evaporation): Process LCIs from references [17,37,38,53] show strong throughput dependence. When normalized per m², chamber heating and pumping contribute ≈ 60% of process energy. Advanced pulsed-ALD and low-temperature sputter recipes can halve GWP if throughput is doubled [17,52,54].
Hybrid tandem and encapsulation flows: Integrated lines combining wet and dry steps show intermediate energy intensities (250-350 MJ m⁻²) and greater sensitivity to encapsulation and substrate mass [12,32,40,42,55]. For all process families, common equipment utilities, air handling, vacuum pumps, chillers, and dryers, were separately inventoried using scaling factors derived from [27,37,39,53]. Harmonized process tables (Figure 3 and Figure 4) present the mean, standard deviation, and range of energy and mass flows per step. These datasets span perovskite, silicon (Si), organic solar cells (OSC), and balance of system (BOS) inventories across regional and multi-technology contexts [52,53,54,55,56,57,58,59].
4.3. Data-Quality Tiers and Uncertainty Characterization
To capture data representativeness across technology readiness levels, we introduce a three-tier data-quality scheme:
Tier 1: Primary industrial data or verified pilot-line measurements.
Tier 2: Laboratory or pre-industrial LCIs adjusted via throughput and yield scaling.
Tier 3: Literature averages or modeled estimates without direct measurement.
Following [23,24,26,48,56,60,61], parameter uncertainty for each process was represented by log-normal distributions fitted to reported min-max values. Monte Carlo propagation (10⁴ samples) quantified uncertainty in aggregated cradle-to-gate GWP, showing coefficients of variation between 20-60% for lab-scale data and <15% for industrial references.
A cross-cutting finding from [17,24,26,48,56,57] is that energy intensity and solvent recovery efficiency dominate overall variance, while material yield and uptime become secondary at industrial scale. To enable transparent meta-analysis, all LCIs in this work are annotated with data-quality flags (Tier 1-3) and uncertainty ranges (95% CI) following the pedigree-matrix structure in Table 1.
.
5. Scale-Up Dynamics and Sensitivity Analysis
5.1. Scaling from Laboratory to Pilot and Industrial Production
Transitions from laboratory fabrication to pilot and industrial production introduce scale-dependent changes in energy intensity, solvent consumption, throughput and yield, all of which strongly influence cradle-to-gate impacts. Systematic scale-up reviews highlight that deposition uniformity, tool idle power and stabilization of continuous-line operation determine whether environmental improvements follow technological learning curves or remain constrained by equipment limitations [23,26]. Pre-industrial perovskite module lines show that drying/annealing, substrate preparation and encapsulation dominate laboratory footprints but decline markedly with increasing line speed, coating width, and stabilized uptime at pilot scale [12]. Perovskite fabrication studies consistently confirm that burdens shift from annealing and solvent losses toward utilities, substrate handling and equipment stabilization as scale increases [15,53].
Empirical learning-curve studies for silicon, thin-film, polysilicon feedstock and metallization demonstrate persistent 15-25% reductions in energy and material intensity per cumulative doubling of production [6], aligning with broader evidence from industrial learning in the energy sector [4,25]. Prospective LCA frameworks formalize how technology readiness level (TRL) progression, upscaling, and scenario design interact with manufacturing configuration to generate non-linear environmental improvements [23]. Pilot-to-industrial transitions also introduce new system-level interactions: thermal-management components such as heat sinks and phase-change materials, inverter and power-electronics integration, and utilities for heating, ventilation, and air conditioning (HVAC) and cooling begin to account for 10-25% of total process energy [41]. Scale-up demonstrations of titanium dioxide (TiO₂)-nanorod architectures show co-evolution between design, deposition method, and yield, with multi-fold improvements reported when transitioning from small-area lab devices to stabilized pilot lines [13]. Likewise, hybrid PV/T integrations reveal how thermal layout, substrate design, and throughput influence uptime and material efficiency during scale-up [44].
Process-resolved prospective LCAs confirm that industrial routes can reduce cradle-to-gate GWP by 30-70% relative to laboratory baselines once throughput normalization, tool loading, equipment duty cycles, and downtime optimization are incorporated, underscoring that environmental impacts evolve as functions of both scale and process architecture rather than device efficiency alone.
5.2. Parameterized Scenarios
Scenario-based modelling demonstrates that electricity carbon intensity is the dominant driver of cradle-to-gate GWP for emerging PV manufacturing routes. Carbon-aware optimization frameworks show strong GWP sensitivity to grid mix, duty cycles, and equipment-loading assumptions [62,63], while regional LCAs for perovskite, Si, and OPV systems consistently report 2-4× variation in impacts when identical processes are evaluated under different grid carbon intensities [35,60,64]. These findings are reinforced by studies in building-integrated and storage-integrated PV systems, which highlight the additional influence of BOS configurations and thermal-management pathways [43,65].
For solution-processed lines, scenario levers such as solvent-recovery efficiency, coating method and annealing route remain first-order determinants of environmental intensity [53]. Material-substitution scenarios, including carbon-electrode perovskites and reduced-Ag metallization, demonstrate significant GWP reductions relative to Au-based or high-Ag baselines, especially under low-carbon electricity [18,35,55]. Similar sensitivities appear in national-scale LCAs for Chinese PV production, where electricity mix, yield, and material efficiency jointly shape environmental outcomes [57].
Forward projections for South and North Italy and EU-wide electricity systems indicate substantial manufacturing-footprint reductions under 2030-2050 decarbonization trajectories [66,67,68]. Prospective LCA frameworks incorporating learning curves and TRL-based upscaling show that declining grid carbon intensity interacts strongly with yield and throughput improvements, producing non-linear environmental gains [24,69]. Consequential scenario modelling for distributed PV reaches similar conclusions: operational context and regional electricity mix dominate future-footprint estimates [46].
Dynamic LCA-LCC models further confirm the central role of electricity carbon intensity, while also capturing system-level cost–impact interactions relevant for industrial planning [10,56,61]. Prospective tandem-module assessments extend these insights to multi-junction architectures, revealing combined sensitivities to absorber choice, metallization strategy, and electricity mix [70]. Collectively, these scenario analyses show that grid decarbonization, solvent recovery, and material substitution, especially silver reduction, remain the most effective levers for lowering cradle-to-gate impacts across next-generation PV manufacturing.
5.3. Comparative Cradle-to-Gate Results Across Routes
Comparative LCAs across crystalline-Si, thin-film, perovskite, tandem, and perovskite-Si hybrid modules consistently show that electricity carbon intensity, manufacturing geography, and module design dominate cross-technology variance. Regional assessments report multi-fold differences (typically 2-4×) in cradle-to-gate GWP for identical module designs due solely to grid mix and upstream supply-chain characteristics, demonstrated in case studies for Burkina Faso, China, and Italy [2,64,67]. Similar patterns appear in national and sub-national assessments, where hydropower- or nuclear-dominated regions achieve substantially lower embodied GHG footprints than coal-based grids [58,67].
Supply-chain and geopolitical analyses indicate that upstream manufacturing pathways, especially ingot/wafer production for Si and vacuum deposition for thin films, drive large regional carbon-intensity disparities; relocating stages or shifting regional electricity mixes can therefore change technology rankings [7,48]. Multi-regional comparisons also show that encapsulation choice, module architecture, and substrate mass modulate these geographic sensitivities [32,67]. Prospective tandem and perovskite-Si hybrid studies suggest that future grid decarbonization and absorber-stack evolution can shift comparative rankings, with tandems surpassing mono- and multi-Si in several 2030-2050 scenarios [70]. Findings align with updated U.S. inventories: lower-temperature thin films and optimized tandems generally exhibit lower embodied GWP than mono-Si under low-carbon electricity [48]. Complementary national-scale LCAs confirm contexts where hydropower-linked Si chains can outperform thin films, depending on metallization and transparent conductive oxide (TCO) burdens [2,58].
EoL comparisons show that closed-loop recovery and high-yield recycling can reduce cradle-to-gate GWP by ~40-60% for perovskite/Si tandems and by similar margins for crystalline-Si modules when Ag and Si recovery exceed industrial benchmarks [32,58]. Overall, regional electricity mix, module architecture, and recovery efficiency remain the primary determinants of comparative environmental performance across current and next-generation PV technologies [2,64,67].
6. Recycling, Circularity, and Material Criticality
6.1. EoL Pathways, Recycling and Logistics
The environmental profile of PV manufacturing extends beyond the production phase into EoL systems. Studies analysing panel recovery show that demanufacturing, material separation, and logistics significantly influence cradle-to-grave impacts. For instance, recovery processes for c-Si modules show major GHG reductions when silver and silicon are recycled at high rates [34]. Research by Ansanelli et al. [28] evaluates detailed mechanical and chemical recovery pathways for polymer, glass, and metal fractions and shows that treatment-stage energy and chemical use dominate impacts when waste volumes are low, with transport contributing only marginally [28]. Celik et al. [71] demonstrate through logistics modelling that EoL transport distance, consolidation strategy, and fragmentation steps influence energy use and emissions across recovery systems.
Closed-loop recycling scenarios for crystalline-Si modules, evaluated through full grave-to-cradle modelling, show that loop-closure is feasible when high recovery efficiencies for Si, glass, Ag and Al are achieved, with performance strongly dependent on collection volumes and module-quality entering the recycling stream [72]. Laboratory-scale studies of polymer pyrolysis and delamination processes show how thermal treatment conditions and reactor design influence energy demand during polymer-layer removal, providing insight into how advanced separation steps may integrate into future EoL pathways [73]. Prospective assessments using advanced physical separation technologies indicate that future recycling systems could obtain higher recovery efficiencies and lower impacts as throughput increases and processes become more integrated [30]. Overall, effective EoL system design, including logistics, high-efficiency separation technologies, and high-yield recovery pathways, is pivotal for achieving circular PV supply chains.
6.2. Allocation, Credits and EoL Accounting
Allocation of recycled flows, crediting of recovered materials, and boundary settings strongly shape the environmental outcomes of PV EoL modelling. Ali et al. [74] show that adopting avoided-production credits for recovered materials (e.g., Si, Al) can substantially improve the performance of distributed PV systems when displacement factors are realistically defined. Allocation choices within mechanical-chemical recovery of c-Si modules, particularly for glass and metal fractions, can alter GWP results because different output streams inherit different portions of the energy and chemical burdens Closed-loop modelling confirms that material-reuse credits, particularly for Si and Al, can significantly reduce cradle-to-module impacts when loop-closure efficiency and sorting quality are sufficiently high [72]. Nevala et al. [75] show that allocation in physical-separation systems (e.g., liberation, optical sorting) determines how burdens are distributed between recyclable fractions, especially when comparing mechanical versus more chemically intensive processes. For perovskite modules, hydrometallurgical recycling studies show that credits for recovered Pb, Au, or Ag depend strongly on assumed substitution ratios and on whether the recovered material meets virgin-grade quality specifications [76].
Collectively, these studies underline that transparent allocation rules (mass, economic, system-expansion), consistent substitution assumptions, and clearly defined credits are essential for interpreting PV EoL LCAs across technologies.
6.3. Critical Materials, Scarcity and Substitution
Material criticality remains a central concern for long-term PV sustainability, especially for elements such as Ag, In, Sn, Pb, and Au. High-efficiency recovery of Ag and Si from c-Si modules has been shown to substantially reduce resource-scarcity indicators, underscoring the importance of metal-recovery yields in circular strategies [35]. Global, technology-spanning assessments of critical-material risks identify distinct vulnerability profiles for Si, thin-film, and tandem architectures, emphasizing that recycling and substitution strategies must be technology-specific [77]. Analyses of silver-use trajectories under net-zero scenarios show that reductions in Ag intensity, combined with robust recycling loops, are necessary to avoid future supply constraints [5]. Comparisons of upcycling and downcycling end-of-life pathways indicate that upcycling, where recovered materials displace high-value inputs, significantly improves material-criticality metrics relative to downcycling into low-grade applications [78].
Substitution pathways also provide relief: evaluations of biobased and fluorine-free encapsulants demonstrate reduced toxicity, lower dependence on fluoropolymers, and improved circularity potential for next-generation PV modules [79,80]. Prospective assessments of tandem supply chains further indicate that critical-material dependence can intensify if substitution and recycling strategies are not integrated early, highlighting the need for coordinated material-management planning. Taken together, these studies show that mitigating critical-material risks requires a combination of high-yield recycling, credible substitution strategies, and tighter material-loop closure, particularly for Ag, In/Sn, Pb, and specialty polymers. Figure 5 summarizes critical-material risk profiles for next-generation PV technologies, combining supply-risk indices, environmental-impact scores, recycling efficiency trajectories, and viable substitution pathways across Ag, In/Sn, Pb, and Au.
7. Methodological Guidance for Transparent Process-Level LCAs
To enable transparent, comparable, and reproducible process-resolved LCAs of PV manufacturing, a minimum set of core methodological and inventory elements are reported. These factors directly influence cradle-to-gate impacts and determine the robustness of scale-up assessments across solution-processed, vacuum-processed, hybrid thin-film, tandem, and crystalline-silicon technologies [3,8,12,24,26,48]. Recent supply-chain assessments further show that manufacturing geography and upstream routing can materially shift embodied emissions, making explicit disclosure of electricity sources and sourcing locations essential [81,82]. Agile LCA approaches in the built environment underline that inconsistent system boundaries and missing energy-flow metadata limit comparability and hinder integration with ecodesign and building-scale modelling [83], while façade-integrated PV decision tools demonstrate the need to co-report functional-unit assumptions, area-to-power conversions, and BOS dependencies when coupling LCA with cost/performance metrics [84].
For emerging PVs (e.g., OSC and perovskites), framework studies emphasize that inconsistent boundaries and incomplete process metadata undermine cross-technology comparisons, reinforcing strict reporting rules [49]. Multi-objective PV ecodesign also shows that optimization outcomes are highly sensitive to transparent background LCIs, energy flows, and declared sensitivity parameters [85]; regional EPBT/LCA case studies further highlight that electricity-mix metadata must be disclosed explicitly [86], and hydropower-linked silicon chains illustrate how supply-chain electricity choices affect foreground emissions and must be documented with spatial/temporal precision [87].
Because current PV LCA studies differ widely in their treatment of FUs, system boundaries, equipment-level energy accounting, solvent and gas flows, and uncertainty characterization, a structured reporting framework is essential. Table 2 summarizes the recommended reporting requirements for transparent and reproducible process-level inventories, including functional-unit specification, boundary definition, foreground/background separation, per-step energy and material flows, data-quality tier assignment, and uncertainty documentation.
To support practical adoption of these recommendations, Appendix A provides a complete standardized data template, including metadata, process maps, foreground inventories, background dataset links, electricity scenarios, data-quality structures, end-of-life modelling, and validation checks. The appendix tables serve both as reproducible documentation for the worked example and as a reusable template for future PV LCA studies.
Rather than prescribing a rigid format, the reporting checklist offers a harmonized minimum standard that all future process-resolved PV LCAs should meet. Consistent application of these elements will enable meaningful comparison across different manufacturing routes, geographical contexts, and technology-readiness levels, supporting integration with techno-economic analyses and prospective LCA models.
8. Conclusions
Achieving genuinely low-impact next-generation PV technologies ultimately depends on understanding and optimizing the manufacturing processes that enable their industrial deployment, rather than focusing solely on device-level performance. Across perovskite, tandem, thin-film, and crystalline-silicon routes, the dominant contributors to cradle-to-gate impacts are consistently found in energy-intensive steps such as drying and annealing, substrate preparation, vacuum pumping and heating, and encapsulation, all of which exhibit strong sensitivity to electricity carbon intensity, duty cycles, throughput, and idle power. Evidence from pilot and industrial lines shows that scale-up is itself a major environmental lever: as production shifts from laboratory conditions to continuous, high-uptime industrial operation, improved tool loading, higher line speeds, and stabilized solvent and heat-management systems typically reduce environmental footprints by 30-70%, tracking established industrial learning rates. Comparative LCAs make clear that technology rankings are highly context-dependent, with regional electricity mix, encapsulation and substrate choices, and supply-chain configurations exerting stronger influence than absorber chemistry alone. Circularity emerges as essential for future PV manufacturing, as high-yield recovery of silver, silicon, glass, and other critical materials can reduce cradle-to-grave GHG emissions by roughly 40-60%, provided that allocation rules and material-substitution assumptions are consistently defined. Despite methodological progress, uncertainty remains concentrated in vacuum-tool energy use, solvent balances, heating profiles, encapsulation data, and end-of-life modeling for emerging stacks, highlighting the need for improved metrology and transparent reporting. By harmonizing process-level LCIs, clarifying functional units and system boundaries, and providing standardized, open templates, this work supports reproducibility, comparability, and integration with prospective and techno-economic models, ultimately enabling more reliable assessments and more sustainable industrial pathways for next-generation PV technologies.
Author Contributions
Conceptualization, K.K.; methodology, K.K.; validation, G.P. and D.N.; investigation, K.K. and N.G.; resources, D.N.; data curation, K.K. and D.N.; writing—original draft preparation, K.K.; writing—review and editing, N.G, G.P. and D.N.; visualization, K.K. and N.G.; supervision, G.P. and D.N.; project administration, G.P. and D.N.; funding acquisition, D.N.
Funding
This research received no external funding.
Institutional Review Board Statement
Not applicable.
Informed Consent Statement
Not applicable.
Data Availability Statement
No new data were created or analyzed in this study. Data sharing is not applicable to this article.
Conflicts of Interest
The authors declare no conflicts of interest.
Abbreviations
The following abbreviations are used in this manuscript:
| ALD | Atomic Layer Deposition |
| AP | Acidification Potential (acidifying emissions, e.g., SO₂-eq) |
| BIPV | Building-Integrated Photovoltaic |
| BOS | Balance of System |
| CdTe | Cadmium Telluride |
| CED | Cumulative Energy Demand (total primary energy required) |
| CI | Confidence Interval |
| CIGS | Copper Indium Gallium Selenide |
| CoV | Coefficients of Variation |
| Cradle-to-gate | Assessment boundary that includes all life-cycle stages from resource extraction (‘cradle’) up to the point where the product leaves the manufacturing facility (‘gate’), excluding use and end-of-life phases. |
| Cradle-to-grave | Assessment boundary that includes the full life cycle of a product, from resource extraction (‘cradle’) through manufacturing, use, and end-of-life treatment (‘grave’). |
| c-Si | Crystalline-silicon |
| EoL | End-of-life |
| EP | Eutrophication Potential (nutrient enrichment impacts, e.g., PO₄³⁻-eq) |
| EPBT | Energy Payback Time |
| FU | Functional Unit |
| GHG | Greenhouse-gas |
| GWP | Global Warming Potential |
| HVAC | Heating, Ventilation, and Air Conditioning |
| IEA | International Energy Agency |
| LCA | Life Cycle Assessment |
| LCIA | Life Cycle Impact Assessment |
| LCI | Life Cycle Inventory |
| OSC | Organic Solar Cells |
| PV | Photovoltaic |
| PVPS | Photovoltaic Power Systems Programme |
| PV/T | Photovoltaic/Thermal Hybrid System |
| R2R | Roll-to-Roll (R2R) |
| Si | Silicon |
| TCO | Transparent Conductive Oxide |
| TiO₂ | Titanium Dioxide |
| TRL | Technology Readiness Level |
Appendix A
Appendix A.1: Standardized LCI Data Templates (How to Use)
To make process-resolved PV LCIs interoperable across studies and reproducible across TRLs, a standardized multi-tab template has been developed. Because the full file cannot be provided, the eight worksheet tables from this template are included as Table A1, Table A2, Table A3, Table A4, Table A5, Table A6, Table A7 and Table A8. The structure uses consistent terminology, units, metadata fields, and data-quality criteria aligned with best practice in the IEA PV Power Systems Programme (IEA PVPS) Task 12 and recent prospective LCA frameworks [3,8,12,24,26,48]. The worksheets are designed for straightforward transfer into standard LCA software environments (e.g., Brightway [93], openLCA [48], SimaPro [64]) and for use in meta-analysis, scale-up modeling, and scenario exploration.
Template structure (tabs and roles)
- VALIDATION: Automated checks for unit consistency, mass/energy balancing, solvent in-out consistency, and flagging of out-of-range values; includes a QA audit log for publication.
The FOREGROUND_LCI sheet uses fixed units and standardized field names to ensure interoperability across studies. Core columns include: Process_Step, Equipment_Class, TRL, Area_Pass (m²), Throughput, Uptime (%), Yield (%), Active_Time (min), Idle_Power (kW), Active_Power (kW), Electricity (kWh), Thermal_Energy (MJ), Solvent_i (kg), Recovery_Eff (%), Gases_i (kg), Substrate (kg), Encapsulant (kg), Waste (kg), Notes, Tier, Dist_Type, Mean, SD, Min, Max. Units are fixed, and the default functional unit is 1 m² active area, with embedded formulas enabling conversion to kWp or kWh based on user-defined device efficiency and STC assumptions [3,24,45,46,47,48].
The complete standardized template is released as Supplementary File S1 (PV_LCI_Template_Perovskite.xlsx). This file contains the full multi-tab structure (README, PROCESS_MAP, FOREGROUND_LCI, BACKGROUND_LINKS, ELECTRICITY_SCENARIOS, DATA_QUALITY, EoL_SCENARIOS, VALIDATION), pre-populated with a worked example for a pre-industrial perovskite PV device. The perovskite example demonstrates the intended use of the template, how to map process routes, populate per-step LCIs, assign background links, and conduct validation checks, while preserving flexibility for adaptation to other PV technologies.
How to use the template (workflow)
The template is intended for both reproducible reporting and direct integration into LCA software. The recommended workflow is:
- Run consistency checks in VALIDATION, then export machine-readable CSV/JSON and archive the versioned dataset with a DOI.
Good practices embedded in the template
- Fully versioned background datasets, grid datasets, and template versioning to ensure reproducibility.
- Built-in uncertainty structure using Tiers + stochastic ranges (mean/SD/min/max).
Appendix A.2: Priority Data Gaps and Measurement Needs
Despite rapid methodological progress, several high-leverage uncertainties limit comparability and forward-looking modeling of next-generation PV manufacturing.
- Critical-materials trajectories and substitution: Ag, In/Sn, Pb, and rare materials require linked supply-risk + LCA modeling tied to realistic manufacturing and regional supply chains [5,19,20,21,22,32,48,70,77,78]. Emission and release-potential studies for third-generation PVs should inform parameterization [100].
Appendix A.3
Appendix A3 provides the complete process-LCI template developed and used in this work for a representative pre-industrial perovskite (p-i-n) single-junction module produced on a hybrid solution-vacuum line. The eight tables document, in a machine-readable but publication-ready format, all metadata, unit operations, foreground inventories, background dataset links, electricity scenarios, data-quality pedigree, EoL assumptions, and internal validation checks that underpin the cradle-to-gate assessment. Together, they illustrate how the proposed reporting framework can be implemented in practice: Table A1 summarizes project-level definitions and functional-unit conventions; Table A2 maps the manufacturing route into discrete unit operations; Table A3 reports the step-resolved foreground LCIs; Table A4 links each flow to specific background processes; Table A5 defines baseline and prospective electricity-mix scenarios; Table A6 describes data tiers, sources, and uncertainties; Table A7 outlines end-of-life and recycling scenarios; and Table A8 aggregates energy and solvent balances and calculates consistency indicators. These appendix tables are intended both as transparent documentation for the case study and as a reusable template that other researchers can adapt to different PV technologies, scales, and regional contexts.

Table A1.
README - Metadata and system description.
| Field | Value |
|---|---|
| Project_Title | Perovskite (p-i-n) single-junction module - hybrid line (solution + vacuum) |
| Version | 1.0 (2025-11-10) |
| DOI_or_Repo_Link | |
| Authors | K. Kiskira; N. Gerolimos; G. Priniotakis; D. Nikolopoulos |
| Functional_Unit | 1 m² active area (default) and 1 kWp reported via conversion formulas |
| Active_to_Total_Area_Ratio | 0.9 |
| Module_Efficiency_STC_% | 20 |
| FU_Conversion_Notes | Conversions to kWp use user-specified efficiency (20%) and STC 1000 W/m². |
| System_Boundary | Cradle-to-gate (substrate → coating/deposition → anneal/dry → metallization → encapsulation). |
| Foreground_Included | Substrate cleaning; TCO sputter; ALD barrier; ETL coat; Perovskite coat; HTL coat; Metallization; Encapsulation; QA. |
| Background_Included | Electricity mix; gases; solvents; precursors; transport (default 200 km truck) mapped via BACKGROUND_LINKS. |
| Explicit_Exclusions | Clean-room HVAC (if site-wide), building works, spare parts outside scheduled maintenance, R&D scrap. |
| Baseline_Grid_Region | EU-27 |
| Baseline_Grid_Year | 2023 |
| Background_DB | Ecoinvent/GaBi (placeholder names) |
| DB_Version | v3.x/2024 equivalent |
| TRL | Pre-industrial/pilot (Tier 1-2 blend) |
| Geography_of_Manufacturing | EU (pilot line) |
| Citation_Primary | See manuscript bibliography IDs [12,15,16,17,33,41,43,49] |
| Notes | Numbers are representative within literature ranges; replace with site data when available. |
| HEAT_RECOVERY_FACTOR | 0.2 |
| GLASS_MASS_kg_per_m2 | 12 |
| ENCAPSULANT_kg_per_m2 | 0.6 |
Table A2.
PROCESS_MAP - Unit operations and routing.
| Unit_Operation | Equipment_Class | Tool_ID | Routing | Notes |
|---|---|---|---|---|
| Substrate wash and prep | wet | SUB-CLN-01 | batch | Glass soda-lime 3.2 mm; DI water; detergents |
| TCO sputter (ITO/AZO) | vacuum | TCO-SPT-01 | batch | DC sputter; Ar |
| ALD barrier (optional) | vacuum | ALD-BAR-01 | batch | Al₂O₃/HfO₂; H₂O |
| ETL slot-die coat | wet | ETL-SD-01 | R2R | SnO₂ dispersion; low-tox solvent |
| Perovskite slot-die coat | wet | PVK-SD-01 | R2R | p-i-n inks; greener solvent mix |
| Anneal/dry (IR/air) | thermal | ANN-OVN-01 | R2R | IR + air knife; heat recovery |
| HTL slot-die coat | wet | HTL-SD-01 | R2R | Polymer HTL ink |
| Metallization (screen/ink) | ambient | MET-PRT-01 | batch | Ag or Cu grid; low Ag route |
| Encapsulation and lamination | thermal | ENC-LAM-01 | batch | Glass-glass; POE/EVA |
| End-of-line test and QA | ambient | QA-VIS-01 | batch | EL test; visual |
Table A3.
FOREGROUND_LCI - Process inventory (calculated).
| Process_Step | Substrate Wash & Prep | TCO Sputter (ITO/AZO) | ALD Barrier (Optional) | ETL Slot-die Coat | Perovskite Slot-die Coat | Anneal/Dry (IR/Air) | HTL Slot-die Coat | Metallization (Screen/Ink) | Encapsulation & Lamination | End-of-Line Test & QA |
|---|---|---|---|---|---|---|---|---|---|---|
| Equipment_Class | wet | vacuum | vacuum | wet | wet | thermal | wet | ambient | thermal | ambient |
| TRL | Pilot | Pilot | Pilot | Pilot | Pilot | Pilot | Pilot | Pilot | Pilot | Pilot |
| Area_Pass_m2 | 1.0 | 1.0 | 0.7 | 1.0 | 1.0 | 1.0 | 1.0 | 1.0 | 1.0 | 1.0 |
| Throughput_m2_h | 20 | 15 | 10 | 30 | 30 | 30 | 30 | 20 | 15 | 15 |
| Uptime_% | 90 | 92 | 92 | 90 | 90 | 92 | 92 | 93 | 95 | 95 |
| Yield_% | 95 | 95 | 95 | 97 | 95 | 96 | 97 | 98 | 99 | 99 |
| Active_Time_min | 6 | 12 | 10 | 5 | 8 | 15 | 5 | 4 | 12 | 3 |
| Idle_Power_kW | 1 | 2.5 | 1.8 | 0.6 | 1.2 | 1.5 | 0.5 | 0.3 | 1 | 0.1 |
| Active_Power_kW | 2 | 5 | 3 | 1.2 | 3 | 4 | 1 | 0.8 | 3.5 | 0.3 |
| Electricity_kWh | 0.2 | 1 | 0.5 | 0.1 | 0.4 | 1 | 0.083333333 | 0.053333333 | 0.7 | 0.016666667 |
| Electricity_GWP_Gco2 | 540 | 1350 | 810 | 324 | 810 | 1080 | 270 | 216 | 945 | 81 |
| Thermal_Energy_MJ | 0 | 0.648550725 | 0.251086957 | 0.389 | 0.948 | 1.229347826 | 0.318448068 | 0.168309677 | 0.505964912 | 0.046896199 |
| Solvent_kg | 0.18 | 0.94 | 0.47 | 0.10 | 0.41 | 0.97 | 0.08 | 0.05 | 0.66 | 0.02 |
| Recovery_Eff_% | 0.00 | 5.14 | 2.39 | 7.55 | 11.25 | 7.86 | 6.18 | 4.12 | 4.18 | 1.55 |
| Gases_kg | 1.096842105 | 4.553240643 | 2.628931501 | 0.869647508 | 2.880373614 | 9.87740078 | 0.861910737 | 0.706690932 | 7.954427786 | 0.485529374 |
| Substrate_kg | 0.003644662 | 2.560429861 | 1.43419999 | 3.762090367 | 4.444846327 | 2.98151514 | 3.081433262 | 1.543336947 | 1.234734021 | 0.515569574 |
| Encapsulant_kg | 10.96840995 | 22.59551223 | 15.72605532 | 10.79954858 | 21.89624214 | 38.60583249 | 10.57144961 | 10.65786226 | 39.30444687 | 8.740303549 |
| Waste_kg | #DIV/0! | 5.468334561 | 3.482187809 | 1.069120146 | 2.713238252 | 8.289876321 | 0.913962715 | 0.596399308 | 6.755294886 | 0.249786594 |
| Notes | DI water recirc; mild detergent | Ar purge ~0.05 kg/m² | Al2O3 ~30 nm equiv. | Low-tox carrier; recovery 80% | Greener solvent blend; 85% recovery | IR anneal; heat recovery factor ~0.2 | Polymer HTL; 80% recovery | Low-Ag formulation ~1.5 g/m² | Glass-glass; POE/EVA ~0.6 kg/m² | EL imaging; visual |
| Tier | 2 | 2 | 2 | 2 | 2 | 2 | 2 | 2 | 1 | 1 |
| Dist_Type | lognormal | lognormal | lognormal | lognormal | lognormal | lognormal | lognormal | lognormal | lognormal | lognormal |
| Mean | ||||||||||
| SD | ||||||||||
| Min | 0.8 | 0.7 | 0.7 | 0.8 | 0.7 | 0.7 | 0.8 | 0.8 | 0.8 | 0.9 |
| Max | 1.2 | 1.3 | 1.4 | 1.3 | 1.4 | 1.3 | 1.3 | 1.2 | 1.2 | 1.1 |
| Time_Check | CHECK ACTIVE TIME | CHECK ACTIVE TIME | CHECK ACTIVE TIME | CHECK ACTIVE TIME | CHECK ACTIVE TIME | CHECK ACTIVE TIME | CHECK ACTIVE TIME | CHECK ACTIVE TIME | CHECK ACTIVE TIME |
Calculations for Table A3:
HEAT_RECOVERY_FACTOR = README!$B$22
GLASS_MASS_kg_per_m2 = README!$B$23
ENCAPSULANT_kg_per_m2 = README!$B$24
Electricity CO2 factor = VALIDATION!$B$11
Electricity_kWh = (Active_Time_min/60)*Active_Power_kW + (Active_Time_min/60)*(1-Uptime_%/100)*Idle_Power_kW,
If columns are:
Active_Time_min = H2
Active_Power_kW = K2
Idle_Power_kW = I2
Uptime_% = F2
Then:
Electricity_kWh =(H2/60)*K2 + (H2/60)*(1-F2/100)*I2,
Electricity_GWP_Gco2= Electricity_kWh * VALIDATION!$B$11,
If Electricity_kWh = L2:
Electricity_GWP_Gco2=L2 * VALIDATION!$B$11
Thermal_Energy_MJ = (Active_Time_min/60)*Active_Power_kW*(1-README!$B$22)*3.6,
If:
Active_Time_min = H2
Active_Power_kW = K2
Heat recovery factor = README!$B$22
Thermal_Energy_MJ = (H2/60)*K2*(1-README!$B$22)*3.6,
Solvent_kg = Base_Solvent_Input,
If your solvent input is column N2:
Solvent_kg = N2,
Recovery_Eff_%= Recovered_Solvent/Solvent_kg * 100,
Gases_kg = Base_Gas_Input,
If your gas mass is in column P2:
Gases_kg = P2,
Substrate_kg = Area_Pass_m2 * README!$B$23,
If Area_Pass_m2 = D2:
Substrate_kg = D2 * README!$B$23,
Encapsulant_kg = Area_Pass_m2 * README!$B$24,
If Area_Pass_m2 = D2:
Encapsulant_kg = D2 * README!$B$24,
Waste_kg= (Solvent_kg - Solvent_kg*(Recovery_Eff_%/100)) + (Sub-strate_kg*(1-Yield_%/100)),
Using actual columns:
Solvent_kg = N2
Recovery_Eff_% = O2
Substrate_kg = Q2
Yield_% = G2
Waste_kg= (N2 - N2*(O2/100)) + (Q2*(1-G2/100)),
Time_Check = IF(Active_Time_min = 0,"CHECK ACTIVE TIME",""),
If Active_Time_min = H2:
Time_Check = =IF(H2=0,"CHECK ACTIVE TIME",""),
Table A4.
BACKGROUND_LINKS - Dataset mapping.
| Dataset_Name | Database | Region | Year | Dataset_ID | Transport | Comment |
|---|---|---|---|---|---|---|
| Electricity, medium voltage, EU-27, 2023 | ecoinvent | EU-27 | 2023 | elec_mv_eu27_2023 | 0 km | Used for all electricity entries |
| Argon, at plant | ecoinvent | GLO | 2020 | argon_at_plant | 500 km truck | Sputtering purge gas |
| Al₂O₃ ALD precursor, at plant | ecoinvent | GLO | 2020 | ald_alumina_precursor | 300 km truck | Placeholder; adjust to actual |
| Glass, soda-lime, 3.2 mm, at plant | ecoinvent | RER | 2020 | glass_32mm | 200 km truck | Front/back glass |
| Encapsulant, POE/EVA, at plant | ecoinvent | GLO | 2020 | encapsulant_poe_eva | 300 km truck | POE/EVA film |
| Silver paste, at plant | ecoinvent | GLO | 2020 | silver_paste_lowAg | 1000 km truck | Low-Ag paste |
| Detergent, industrial, at plant | ecoinvent | GLO | 2020 | detergent_industrial | 200 km truck | Substrate cleaning |
| DI water, at plant | ecoinvent | RER | 2020 | di_water | Onsite | Closed-loop recirculation |
Table A5.
ELECTRICITY_SCENARIOS - Regional grid projections.
| Scenario | gCO₂_per_kWh |
|---|---|
| EU-27 baseline 2023 | 270 |
| EU-27 2030 projection | 150 |
| EU-27 2050 net-zero projection | 50 |
| Custom_User | 0 |
Table A6.
DATA_QUALITY - Foreground pedigree and uncertainty.
| Process_Step | Tier | Source_Type | Vintage | Uncertainty_Band | Pedigree | Notes |
|---|---|---|---|---|---|---|
| Substrate wash & prep | 1 | Primary pilot logs | 2024–2025 | ±20% | Good | Measured power and duty cycles |
| TCO sputter (ITO/AZO) | 2 | Scaled from tool specs + literature | 2020–2025 | ±30% | Medium | Throughput-sensitive |
| ALD barrier | 2 | Literature + vendor models | 2020–2024 | ±35% | Medium | Optional step |
| ETL coat | 2 | Pilot measurements + model | 2023–2025 | ±25% | Good | Solvent balance checked |
| Perovskite coat | 2 | Pilot measurements + model | 2023–2025 | ±30% | Good | Recovery efficiency critical |
| Anneal/dry | 2 | Measured furnace/IR logs | 2024–2025 | ±25% | Good | Heat-recovery assumed 0.2 |
| HTL coat | 2 | Pilot + model | 2023–2025 | ±25% | Good | Solvent balance checked |
| Metallization | 2 | Vendor + line data | 2023–2025 | ±20% | Good | Low-Ag recipe |
| Encapsulation | 1 | Plant recipe + datasheets | 2024–2025 | ±15% | High | Glass & POE mass measured |
| QA | 1 | Plant logs | 2024–2025 | ±10% | High | Minor energy share |
Table A7.
EOL_SCENARIOS - Recycling and recovery.
| Scenario | Allocation | Si_Recovered | Pb_Recovered | Glass_Recovered | Al_Recovered | Ag_Recovered | Polymer_Recovered | Notes |
|---|---|---|---|---|---|---|---|---|
| Baseline (mechanical+thermal) | mass | 0 | 0 | 0.9 | 0.85 | 0 | 0.95 | EU logistics; 200 km avg |
| Closed-loop enhanced (hydrometallurgical metals) | system_expansion | 0 | 0 | 0.95 | 0.9 | 0.9 | 0.97 | Credits for Ag; foil recovery if present |
| Landfill (counterfactual) | none | 0 | 0 | 0 | 0 | 0 | 0 | For sensitivity only |
Table A8.
PROCESS_MAP - Unit operations and routing.
| Unit_Operation | Equipment_Class | Tool_ID | Routing | Notes |
|---|---|---|---|---|
| Substrate wash and prep | wet | SUB-CLN-01 | batch | Glass soda-lime 3.2 mm; DI water; detergents |
| TCO sputter (ITO/AZO) | vacuum | TCO-SPT-01 | batch | DC sputter; Ar |
| ALD barrier (optional) | vacuum | ALD-BAR-01 | batch | Al₂O₃/HfO₂; H₂O |
| ETL slot-die coat | wet | ETL-SD-01 | R2R | SnO₂ dispersion; low-tox solvent |
| Perovskite slot-die coat | wet | PVK-SD-01 | R2R | p-i-n inks; greener solvent mix |
| Anneal/dry (IR/air) | thermal | ANN-OVN-01 | R2R | IR + air knife; heat recovery |
| HTL slot-die coat | wet | HTL-SD-01 | R2R | Polymer HTL ink |
| Metallization (screen/ink) | ambient | MET-PRT-01 | batch | Ag or Cu grid; low Ag route |
| Encapsulation and lamination | thermal | ENC-LAM-01 | batch | Glass-glass; POE/EVA |
| End-of-line test and QA | ambient | QA-VIS-01 | batch | EL test; visual |
Table A9.
VALIDATION - Energy and solvent balances (calculated).
| Check | Value | Status | Comment |
|---|---|---|---|
| Electricity total (kWh) | 4.05 | INFO | Sum over FOREGROUND_LCI |
| Thermal energy total (MJ) | 4.51 | INFO | Sum over FOREGROUND_LCI |
| Solvent in (kg) | 3.88 | INFO | Sum over coating steps |
| Solvent recovered (kg) | 22.44 | INFO | Recovery_Eff_% applied |
| Solvent loss (kg) | 3.66 | INFO | Should be >0 and reasonable |
| - | - | - | - |
| EU-27 baseline 2023 | - | - | - |
| Active_CO₂_Factor_(g_per_kWh) | 270 | - | - |
| Total_Electricity_GWP_(gCO₂) | 6426 | - | Electricity × factor |
| TOTAL GWP from electricity (kg CO₂) | 6.426 | INFO | =6426/1000 |
| Solvent recovery check (%) | 577.7 | INFO | =B5/B4 × 100 |
References
- Fraunhofer ISE; PSE Projects GmbH. Photovoltaics Report — updated: 31 October 2025. Fraunhofer Institute for Solar Energy Systems ISE: Freiburg, Germany; PSE Projects GmbH: Berlin, Germany, 2025; Available online: https://www.ise.fraunhofer.de/content/dam/ise/de/documents/publications/studies/Photovoltaics-Report.pdf (accessed on 2 November 2025).
- Liu, J.; Shen, X. Global PV Supply Chains: Costs and Energy Savings, GHG Emissions Reductions. Energy Policy 2025, 205, 114716. [Google Scholar] [CrossRef]
- Frischknecht, R.; Stolz, P.; Krebs, L.; de Wild-Scholten, M.; Sinha, P.; Fthenakis, V.; Kim, H.C.; Raugei, M.; Stucki, M. Life Cycle Inventories and Life Cycle Assessment of Photovoltaic Systems. International Energy Agency (IEA) PVPS Task 12, Report T12-19:2020; IEA PVPS: Paris, France, 2020. [Google Scholar]
- Haas, R.; Sayer, M.; Ajanovic, A.; Auer, H. Technological Learning: Lessons Learned on Energy Technologies. WIREs Energy Environ. 2022, 11, e463. [Google Scholar] [CrossRef]
- Hallam, B.; Kim, M.; Zhang, Y.; Dias, P.; Candelise, C.; Green, M.A. The Silver Learning Curve for Photovoltaics and Projected Silver Demand for Net-Zero Emissions by 2050. Prog. Photovolt. Res. Appl. 2023, 31, 598–606. [Google Scholar] [CrossRef]
- Goldschmidt, J.C.; Wagner, L.; Pietzcker, R.; Friedrich, L. Technological Learning for Resource Efficient Terawatt Scale Photovoltaics. Energy Environ. Sci. 2021, 14, 5147–5160. [Google Scholar] [CrossRef]
- Evans, M.-A.; Grand, P.-P. Diversifying the Solar Photovoltaic Supply Chain to Secure Europe’s Energy and Climate Roadmap and Sovereignty. iScience 2025, 33, 112751. [Google Scholar] [CrossRef]
- Dodd, N.; Espinosa, N. Preparatory Study for Solar Photovoltaic Modules, Inverters and Systems - Task 4: Technical Analysis Including End-of-Life; European Commission, Joint Research Centre (JRC): Ispra, Italy, 2018. Available online: https://susproc.jrc.ec.europa.eu/product-bureau/sites/default/files/contentype/product_group_documents/1581689975/DraftReport_Task5.pdf (accessed on 23 October 2025).
- Muteri, V.; Cellura, M.; Curto, D.; Franzitta, V.; Longo, S.; Mistretta, M.; Parisi, M.L. Review on Life Cycle Assessment of Solar Photovoltaic Panels. Energies 2020, 13, 252. [Google Scholar] [CrossRef]
- Milousi, M.; Souliotis, M.; Arampatzis, G.; Papaefthimiou, S. Evaluating the Environmental Performance of Solar Energy Systems through a Combined Life Cycle Assessment and Cost Analysis. Sustainability 2019, 11, 2539. [Google Scholar] [CrossRef]
- Rashedi, A.; Khanam, T. Life Cycle Assessment of Most Widely Adopted Solar Photovoltaic Energy Technologies by Mid-Point and End-Point Indicators of ReCiPe Method. Environ. Sci. Pollut. Res. 2020, 27, 29075–29090. [Google Scholar] [CrossRef]
- Alberola-Borràs, J.-A.; Baker, J.A.; De Rossi, F.; Vidal, R.; Beynon, D.; Hooper, K.E.A.; Watson, T.M.; Mora-Seró, I. Perovskite Photovoltaic Modules: Life Cycle Assessment of Pre-Industrial Production Process. iScience 2018, 9, 542–551. [Google Scholar] [CrossRef]
- Rao, H.K.R.; Gemechu, E.; Thakur, U.; Shankar, K.; Kumar, A. Techno-Economic Assessment of Titanium Dioxide Nanorod-Based Perovskite Solar Cells: From Lab-Scale to Large-Scale Manufacturing. Appl. Energy 2021, 298, 117251. [Google Scholar] [CrossRef]
- Príncipe, J.; Andrade, L.; Mata, T.M.; Martins, A.A. Comparative Life Cycle Assessment of Perovskite Solar Cell Production: Mesoporous n-i-p versus Inverted p-i-n Architectures. Adv. Energy Sustain. Res. 2025, 6, 2400368. [Google Scholar] [CrossRef]
- Duarte, V.C.M.; Andrade, L. Recent Advancements on Slot-Die Coating of Perovskite Solar Cells: The Lab-to-Fab Optimisation Process. Energies 2024, 17, 3896. [Google Scholar] [CrossRef]
- Lu, D.; Oluk, I.; Jung, M.; Tseng, S.; Byrne, D.M.; Harris, T.A.L.; Escobar, I.C. Comparative Life Cycle Assessment for the Fabrication of Polysulfone Membranes Using Slot Die Coating as a Scalable Fabrication Technique. Polymers 2025, 17, 2363. [Google Scholar] [CrossRef] [PubMed]
- Weber, M.; Boysen, N.; Graniel, O.; Sekkat, A.; Dussarrat, C.; Wiff, P.; Devi, A.; Muñoz-Rojas, D. Assessing the Environmental Impact of Atomic Layer Deposition (ALD) Processes and Pathways to Lower It. ACS Mater. Au 2023, 3, 274–298. [Google Scholar] [CrossRef]
- Singh, S.; Kajal, P.; Dhar, A.; Mathews, N.; Boix, P.P.; Powar, S. Reduced Global Warming Potential in Carbon-Based Perovskite Solar Modules: Cradle-to-Gate Life Cycle Analysis. J. Clean. Prod. 2023, 426, 139136. [Google Scholar] [CrossRef]
- Vidal, R.; Alberola-Borràs, J.-A.; Sánchez-Pantoja, N.; Mora-Seró, I. Comparison of Perovskite Solar Cells with Other Photovoltaic Technologies from the Point of View of Life Cycle Assessment. Adv. Energy Sustain. Res. 2021, 2, 2000088. [Google Scholar] [CrossRef]
- Bhati, N.; Nazeeruddin, M.K.; Maréchal, F. Environmental Impacts as the Key Objectives for Perovskite Solar Cells Optimization. Energy 2024, 299, 131492. [Google Scholar] [CrossRef]
- Leccisi, E.; Fthenakis, V. Life-Cycle Environmental Impacts of Single-Junction and Tandem Perovskite PVs: A Critical Review and Future Perspectives. Prog. Energy 2020, 2, 032002. [Google Scholar] [CrossRef]
- Akram, W.; Li, X.; Ahmed, S.; Ouyang, Z.; Li, G. A Review of Life Cycle Assessment and Sustainability Analysis of Perovskite/Si Tandem Solar Cells. RSC Sustain. 2025, 3, 21–36. [Google Scholar] [CrossRef]
- Marson, A.; Benozzi, A.; Manzardo, A. Looking to the Future: Prospective Life Cycle Assessment of Emerging Technologies. Chem. Eur. J. 2025, 31, e202500304. [Google Scholar] [CrossRef]
- van der Hulst, M.K.; Hauck, M.; Hoeks, S.; van Zelm, R.; Huijbregts, M.A.J. Learning Curves in Prospective Life Cycle Assessment. Environ. Sci. Technol. 2025, 59, 16501–16512. [Google Scholar] [CrossRef] [PubMed]
- Hallam, B.; Kim, M.; Underwood, R.; Drury, S.; Wang, L.; Dias, P. A Polysilicon Learning Curve and the Material Requirements for Broad Electrification with Photovoltaics by 2050. Solar RRL 2022, 6. [Google Scholar] [CrossRef]
- Erakca, M.; Baumann, M.; Helbig, C.; Weil, M. Systematic Review of Scale-Up Methods for Prospective Life Cycle Assessment of Emerging Technologies. J. Clean. Prod. 2024, 451, 142161. [Google Scholar] [CrossRef]
- Latunussa, C.E.L.; Ardente, F.; Blengini, G.A.; Mancini, L. Life Cycle Assessment of an Innovative Recycling Process for Crystalline Silicon Photovoltaic Panels. Sol. Energy Mater. Sol. Cells 2016, 156, 101–111. [Google Scholar] [CrossRef]
- Ansanelli, G.; Fiorentino, G.; Tammaro, M.; Zucaro, A. A Life Cycle Assessment of a Recovery Process from End-of-Life Photovoltaic Panels. Appl. Energy 2021, 290, 116727. [Google Scholar] [CrossRef]
- Fiandra, V.; Sannino, L.; Andreozzi, C.; Graditi, G. End-of-Life of Silicon PV Panels: A Sustainable Materials Recovery Process. Waste Manag. 2019, 84, 91–101. [Google Scholar] [CrossRef]
- Heiho, A.; Suwa, I.; Dou, Y.; Lim, S.; Namihira, T.; Koita, T.; Mochidzuki, K.; Murakami, S.; Daigo, I.; Tokoro, C.; et al. Prospective Life Cycle Assessment of Recycling Systems for Spent Photovoltaic Panels by Combined Application of Physical Separation Technologies. Resour. Conserv. Recycl. 2023, 192, 106922. [Google Scholar] [CrossRef]
- Klugmann-Radziemska, E.; Kuczyńska-Łażewska, A. The Use of Recycled Semiconductor Material in Crystalline Silicon Photovoltaic Modules Production—A Life Cycle Assessment of Environmental Impacts. Sol. Energy Mater. Sol. Cells 2020, 205, 110259. [Google Scholar] [CrossRef]
- Martulli, A.; Gota, F.; Rajagopalan, N.; Meyer, T.; Ramirez Quiroz, C.O.; Costa, D.; Paetzold, U.W.; Malina, R.; Vermang, B.; Lizin, S. Beyond Silicon: Thin-Film Tandem as an Opportunity for Photovoltaics Supply Chain Diversification and Faster Power System Decarbonization out to 2050. Sol. Energy Mater. Sol. Cells 2025, 279, 113212. [Google Scholar] [CrossRef]
- Psomopoulos, C.S.; Kalkanis, K.; Chatzistamou, E.D.; Kiskira, K.; Ioannidis, G.C.; Kaminaris, S.D. End-of-Life Treatment of Photovoltaic Panels: Expected Volumes up to 2045 in the E.U. AIP Conf. Proc. 2022, 2437, 020084. [Google Scholar] [CrossRef]
- Ardente, F.; Latunussa, C.E.L.; Blengini, G.A. Resource Efficient Recovery of Critical and Precious Metals from Waste Silicon PV Panel Recycling. Waste Manag. 2019, 91, 156–167. [Google Scholar] [CrossRef] [PubMed]
- Chaosukho, S.; Meeklinhom, S.; Rodbuntum, S.; Sukgorn, N.; Kaewprajak, A.; Kumnorkaew, P.; Varabuntoonvit, V. Life Cycle Assessment of Perovskite Solar Cells with Alternative Carbon Electrode. Environ. Impact Assess. Rev. 2024, 106, 107462. [Google Scholar] [CrossRef]
- Zhang, T.; Wang, M.; Yang, H. A Review of the Energy Performance and Life-Cycle Assessment of Building-Integrated Photovoltaic (BIPV) Systems. Energies 2018, 11, 3157. [Google Scholar] [CrossRef]
- Baudais, B.; Ben Ahmed, H.; Jodin, G.; Degrenne, N.; Lefebvre, S. Life Cycle Assessment of a 150 kW Electronic Power Inverter. Energies 2023, 16, 2192. [Google Scholar] [CrossRef]
- Bourtsalas, A.C.; Papadatos, P.E.; Kiskira, K.; Kalkanis, K.; Psomopoulos, C.S. Ecodesign for Industrial Furnaces and Ovens: A Review of the Current Environmental Legislation. Sustainability 2023, 15, 9436. [Google Scholar] [CrossRef]
- Kalkanis, K.; Kiskira, K.; Papageorgas, P.; Kaminaris, S.D.; Piromalis, D.; Banis, G.; Mpelesis, D.; Batagiannis, A. Advanced Manufacturing Design of an Emergency Mechanical Ventilator via 3D Printing—Effective Crisis Response. Sustainability 2023, 15(4), 2857. [Google Scholar] [CrossRef]
- Krebs-Moberg, M.; Pitz, M.; Dorsette, T.L.; Gheewala, S.H. Third Generation of Photovoltaic Panels: A Life Cycle Assessment. Renew. Energy 2021, 164, 556–565. [Google Scholar] [CrossRef]
- Moein-Jahromi, M.; Rahmanian-Koushkaki, H.; Rahmanian, S.; Pilban Jahromi, S. Evaluation of Nanostructured GNP and CuO Compositions in PCM-Based Heat Sinks for Photovoltaic Systems. J. Energy Storage 2022, 53, 105240. [Google Scholar] [CrossRef]
- Rossi, F.; Rotondi, L.; Stefanelli, M.; Parisi, M.L. Comparative Life Cycle Assessment of Different Fabrication Processes for Perovskite Solar Mini-Modules. EPJ Photovolt. 2024, 15, 20. [Google Scholar] [CrossRef]
- Chatzisideris, M.D.; Ohms, P.K.; Espinosa, N.; Krebs, F.C.; Laurent, A. Economic and Environmental Performances of Organic Photovoltaics with Battery Storage for Residential Self-Consumption. Appl. Energy 2019, 256, 113977. [Google Scholar] [CrossRef]
- Souliotis, M.; Arnaoutakis, N.; Panaras, G.; Kavga, A.; Papaefthimiou, S. Experimental Study and Life Cycle Assessment (LCA) of Hybrid Photovoltaic/Thermal (PV/T) Solar Systems for Domestic Applications. Renew. Energy 2018, 126, 708–723. [Google Scholar] [CrossRef]
- Ahmad Ludin, N. Economic and Life Cycle Analysis of Photovoltaic Systems in the APEC Region towards a Low-Carbon Society; Asia-Pacific Economic Cooperation (APEC), Solar Energy Research Institute (SERI), National University of Malaysia (UKM): Putrajaya, Malaysia, 2019. APEC Project EWG 06 2017A; APEC Secretariat: Singapore. Available online: https://www.apec.org/docs/default-source/Publications/2019/4/Life-Cycle-Assessment-of-Photovoltaic-Systems-in-the-APEC-Region/219_EWG_Life-Cycle-Assessment-of-Photovoltaic-Systems-in-the-APEC-Region.pdf (accessed on 1 November 2025).
- Jones, C.; Gilbert, P.; Raugei, M.; Mander, S.; Leccisi, E. An Approach to Prospective Consequential Life Cycle Assessment and Net Energy Analysis of Distributed Electricity Generation. Energy Policy 2017, 100, 350–358. [Google Scholar] [CrossRef]
- Maranghi, S.; Parisi, M.L.; Basosi, R.; Sinicropi, A. Environmental Profile of the Manufacturing Process of Perovskite Photovoltaics: Harmonization of Life Cycle Assessment Studies. Energies 2019, 12, 3746. [Google Scholar] [CrossRef]
- Smith, B.L.; Sekar, A.; Mirletz, H.; Heath, G.; Margolis, R. An Updated Life Cycle Assessment of Utility-Scale Solar Photovoltaic Systems Installed in the United States; National Renewable Energy Laboratory (NREL): Golden, CO, USA, 2024; NREL/TP-7A40-87372. Available online: https://www.nrel.gov/docs/fy24osti/87372.pdf (accessed on 20 October 2025).
- Kiskira, K.; Kalkanis, K.; Coelho, F.; Plakantonaki, S.; D’onofrio, C.; Psomopoulos, C.S.; Priniotakis, G.; Ioannidis, G.C. Life Cycle Assessment of Organic Solar Cells: Structure, Analytical Framework, and Future Product Concepts. Electronics 2025, 14, 2426. [Google Scholar] [CrossRef]
- Hemmati, M.; Bayati, N.; Ebel, T. Integrated Life Cycle Sustainability Assessment with Future Energy Mix: A Review of Methodologies for Evaluating the Sustainability of Multiple Power Generation Technologies Development. Renew. Energy Focus 2024, 49, 100581. [Google Scholar] [CrossRef]
- Talebian, S.H.; Balouchi, H.; Esazadeh, D.; Abbasi, M.; Azizi, H. An Environmental-Economic Analysis of a Case Solar Power Plant for Power Decarbonization. Energy Sci. Eng. 2025, 13, 3541–3550. [Google Scholar] [CrossRef]
- Fu, Y.; Liu, X.; Yuan, Z. Life-Cycle Assessment of Multi-Crystalline Photovoltaic (PV) Systems in China. J. Clean. Prod. 2015, 86, 180–190. [Google Scholar] [CrossRef]
- Correa Guerrero, N.B.; Herrera Martínez, W.O.; Civit, B.; Perez, M.D. Energy Performance of Perovskite Solar Cell Fabrication in Argentina: A Life Cycle Assessment Approach. Sol. Energy 2021, 230, 645–653. [Google Scholar] [CrossRef]
- Duan, Y.; Guo, F.; Gardy, J.; Xu, G.; Li, X.; Jiang, X. Life Cycle Assessment of Polysilicon Photovoltaic Modules with Green Recycling Based on the ReCiPe Method. Renew. Energy 2024, 236, 121407. [Google Scholar] [CrossRef]
- Fan, M.; Yu, Z.; Ma, W.; Li, L.; Zhang, J. Life Cycle Assessment of Crystalline Silicon Wafers for Photovoltaic Power Generation. Silicon 2021, 13, 3177–3189. [Google Scholar] [CrossRef]
- Müller, A.; Friedrich, L.; Reichel, C.; Herceg, S.; Mittag, M.; Neuhaus, D.H. A Comparative Life Cycle Assessment of Silicon PV Modules: Impact of Module Design, Manufacturing Location and Inventory. Sol. Energy Mater. Sol. Cells 2021, 230, 111277. [Google Scholar] [CrossRef]
- Pu, Y.; Wang, P.; Wang, Y.; Qiao, W.; Wang, L.; Zhang, Y. Environmental Effects Evaluation of Photovoltaic Power Industry in China on Life Cycle Assessment. J. Clean. Prod. 2021, 278, 123993. [Google Scholar] [CrossRef]
- Santoyo-Castelazo, E.; Solano-Olivares, K.; Martínez, E.; García, E.O.; Santoyo, E. Life Cycle Assessment for a Grid-Connected Multi-Crystalline Silicon Photovoltaic System of 3 kWp: A Case Study for Mexico. J. Clean. Prod. 2021, 316, 128314. [Google Scholar] [CrossRef]
- Skarkos, N.; Menti, A.; Kalkanis, K.; Chronis, I.; Psomopoulos, C.S. Impact Assessment of Photovoltaic Panels with Life Cycle Analysis Techniques. Sustain. Futures 2025, 10, 101071. [Google Scholar] [CrossRef]
- Bracquene, E.; Peeters, J.R.; Dewulf, W.; Duflou, J.R. Taking Evolution into Account in a Parametric LCA Model for PV Panels. Procedia CIRP 2018, 69, 389–394. [Google Scholar] [CrossRef]
- Ren, M.; Mitchell, C.R.; Mo, W. Dynamic Life Cycle Economic and Environmental Assessment of Residential Solar Photovoltaic Systems. Sci. Total Environ. 2020, 722, 137932. [Google Scholar] [CrossRef]
- Alevizos, V.; Gerolimos, N.; Leligkou, E.A.; Hompis, G.; Priniotakis, G. Sustainable Swarm Intelligence: Assessing Carbon-Aware Optimization in High-Performance AI Systems. Technologies 2025, 477. [Google Scholar] [CrossRef]
- Alevizos, V.; Gerolimos, N.; Yue, Z.; Edralin, S.; Xu, C.; Papakostas, G.A. Advanced Graph–Physics Hybrid Framework (AGPHF) for Holistic Integration of AI-Driven Graph- and Physics-Methodologies to Promote Resilient Wastewater Management in Dynamic Real Environments. Appl. Sci. 2025, 15, 9905. [Google Scholar] [CrossRef]
- Badza, K.; Soro, Y.M.; Sawadogo, M. Life Cycle Assessment of a 33.7 MW Solar Photovoltaic Power Plant in the Context of a Developing Country. Sustain. Environ. Res. 2023, 33, 38. [Google Scholar] [CrossRef]
- Guo, J.; Zhang, W.; Zhang, J.; Xie, L.; Zeng, X.; Zhong, J.; Zhao, O.; Yang, K.; Li, Z.; Zou, R.; et al. Carbon Reduction Measures-Based Life Cycle Assessment of the Photovoltaic-Supported Sewage Treatment System. Sustain. Cities Soc. 2024, 101, 105074. [Google Scholar] [CrossRef]
- Cusenza, M.A.; Guarino, F.; Longo, S.; Mistretta, M.; Cellura, M. Environmental Assessment of 2030 Electricity Generation Scenarios in Sicily: An Integrated Approach. Renew. Energy 2020, 160, 1148–1159. [Google Scholar] [CrossRef]
- Ferrara, C.; Marmiroli, B.; Carvalho, M.L.; Girardi, P. Life Cycle Assessment of Photovoltaic Electricity Production in Italy: Current Scenario and Future Developments. Sci. Total Environ. 2025, 852, 174846. [Google Scholar] [CrossRef]
- Flores Cayuela, J.A.; Mérida García, A.; Fernández García, I.; Rodríguez Díaz, J.A. Life Cycle Assessment of Large-Scale Solar Photovoltaic Irrigation. Sci. Total Environ. 2024, 954, 176813. [Google Scholar] [CrossRef] [PubMed]
- Parisi, M.L.; Maranghi, S.; Vesce, L.; Sinicropi, A.; Di Carlo, A.; Basosi, R. Prospective Life Cycle Assessment of Third-Generation Photovoltaics at the Pre-Industrial Scale: A Long-Term Scenario Approach. Renew. Sustain. Energy Rev. 2020, 121, 109703. [Google Scholar] [CrossRef]
- van der Hulst, M.K.; Magoss, D.; Massop, Y.; Veenstra, S.; van Loon, N.; Dogan, I.; Coletti, G.; Theelen, M.; Hoeks, S.; Huijbregts, M.A.J.; et al. Comparing Environmental Impacts of Single-Junction Silicon and Silicon/Perovskite Tandem Photovoltaics—A Prospective Life Cycle Assessment. ACS Sustain. Chem. Eng. 2024, 12, 8860–8870. [Google Scholar] [CrossRef] [PubMed]
- Celik, I.; Lunardi, M.; Frederickson, A.; Corkish, R. Sustainable End-of-Life Management of Crystalline Silicon and Thin Film Solar Photovoltaic Waste: The Impact of Transportation. Appl. Sci. 2020, 10, 5465. [Google Scholar] [CrossRef]
- Athanailidis, V.I.; Rentoumis, G.M.; Katsigiannis, A.Y.; Bilalis, N. Integration and Assessment of Recycling into c-Si Photovoltaic Module’s Life Cycle. Int. J. Sustain. Eng. 2018, 11, 186–195. [Google Scholar] [CrossRef]
- Azeumo, M.F.; Germana, C.; Ippolito, N.M.; Franco, M.; Piga, L.; Santilli, S. Photovoltaic Module Recycling: A Physical and a Chemical Recovery Process. Sol. Energy Mater. Sol. Cells 2019, 193, 314–319. [Google Scholar] [CrossRef]
- Ali, A.; Koch, T.W.; Volk, T.A.; Malmsheimer, R.W.; Eisenbies, M.H.; Kloster, D.; Brown, T.R.; Naim, N.; Therasme, O. The Environmental Life Cycle Assessment of Electricity Production in New York State from Distributed Solar Photovoltaic Systems. Energies 2022, 15, 7278. [Google Scholar] [CrossRef]
- Nevala, S.-M.; Hamuyuni, J.; Junnila, T.; Sirviö, T.; Eisert, S.; Wilson, B.P.; Serna-Guerrero, R.; Lundström, M. Electro-Hydraulic Fragmentation vs. Conventional Crushing of Photovoltaic Panels—Impact on Recycling. Waste Manag. 2019, 87, 43–50. [Google Scholar] [CrossRef]
- Oh, H.; Bae, J.; Han, J. Economic and Environmental Feasibility Evaluation Study of Hydrometallurgical Recycling Methods for Perovskite Solar Cells. J. Clean. Prod. 2025, 489, 144651. [Google Scholar] [CrossRef]
- Cui, C.; Lonergan, K.E.; Sansavini, G. Policy-Driven Transformation of Global Solar PV Supply Chains and Resulting Impacts. Nat. Commun. 2025, 16, 6742. [Google Scholar] [CrossRef] [PubMed]
- Mao, D.; Yang, S.; Ma, L.; Ma, W.; Yu, Z.; Xi, F.; Yu, J. Overview of Life Cycle Assessment of Recycling End-of-Life Photovoltaic Panels: A Case Study of Crystalline Silicon Photovoltaic Panels. J. Clean. Prod. 2024, 434, 140320. [Google Scholar] [CrossRef]
- Plakantonaki, S.; Stergiou, M.; Panagiotatos, G.; Kiskira, K.; Priniotakis, G. Regenerated Cellulosic Fibers from Agricultural Waste. AIP Conf. Proc. 2022, 2430, 080006. [Google Scholar] [CrossRef]
- Plakantonaki, S.; Kiskira, K.; Zacharopoulos, N.; Belessi, V.; Sfyroera, E.; Priniotakis, G.; Athanasekou, C. Investigating the Routes to Produce Cellulose Fibers from Agro-Waste: An Upcycling Process. ChemEngineering 2024, 8, 112. [Google Scholar] [CrossRef]
- Gan, Y.; Elgowainy, A.; Lu, Z.; Kelly, J.C.; Wang, M.; Boardman, R.D.; Marcinkoski, J. Greenhouse Gas Emissions Embodied in the U. S. Solar Photovoltaic Supply Chain. Environ. Res. Lett. 2023, 18(10), 104012. [Google Scholar] [CrossRef]
- Liang, H.; You, F. Reshoring Silicon Photovoltaics Manufacturing Contributes to Decarbonization and Climate Change Mitigation. Nat. Commun. 2023, 14, 1274. [Google Scholar] [CrossRef]
- Gómez-Navarro, T.; Stascheit, C.; Díaz-Bello, D.; Döll, J.; Neugebauer, S.; Sonnemann, G. An Agile Life Cycle Assessment for the Deployment of Photovoltaic Energy Systems in the Built Environment. Energy Sustain. Soc. 2024, 14, 60. [Google Scholar] [CrossRef]
- Hadi, E.; Heidari, A. Development of an Integrated Tool Based on Life Cycle Assessment, Levelized Energy, and Life Cycle Cost Analysis to Choose Sustainable Façade Integrated Photovoltaic Systems. J. Clean. Prod. 2021, 293, 126117. [Google Scholar] [CrossRef]
- Perez-Gallardo, J.R.; Azzaro-Pantel, C.; Astier, S. Combining Multi-Objective Optimization, Principal Component Analysis and Multiple Criteria Decision Making for Ecodesign of Photovoltaic Grid-Connected Systems. Sustain. Energy Technol. Assess. 2018, 27, 94–101. [Google Scholar] [CrossRef]
- Shah, H.H.; Bareschino, P.; Mancusi, E.; Pepe, F. Environmental Life Cycle Analysis and Energy Payback Period Evaluation of Solar PV Systems: The Case of Pakistan. Energies 2023, 16, 6400. [Google Scholar] [CrossRef]
- Shen, Z.; Ma, L.; Yang, Y.; Fan, M.; Ma, W.; Fu, L.; Li, M. A Life Cycle Assessment of Hydropower-Silicon-Photovoltaic Industrial Chain in China. J. Clean. Prod. 2022, 362, 132411. [Google Scholar] [CrossRef]
- Lunardi, M.M.; Alvarez-Gaitan, J.P.; Bilbao, J.I.; Corkish, R. A Review of Recycling Processes for Photovoltaic Modules. In Solar Panels and Photovoltaic Materials; Zaidi, B., Ed.; IntechOpen: London, UK, 2018. [Google Scholar] [CrossRef]
- Maani, T.; Celik, I.; Heben, M.J.; Ellingson, R.J.; Apul, D. Environmental Impacts of Recycling Crystalline Silicon (c-Si) and Cadmium Telluride (CdTe) Solar Panels. Sci. Total Environ. 2020, 735, 138827. [Google Scholar] [CrossRef] [PubMed]
- Tian, X.; Stranks, S.D.; You, F. Life Cycle Assessment of Recycling Strategies for Perovskite Photovoltaic Modules. University of Cambridge, 2021. [CrossRef]
- Wang, L.; Oberbeck, L.; Marchand Lasserre, M.; Perez-Lopez, P. Modelling Recycling for the Life Cycle Assessment of Perovskite/Silicon Tandem Modules. EPJ Photovolt. 2024, 15, 14. [Google Scholar] [CrossRef]
- Hernández-López, D.-A.; Vega-De-Lille, M.I.; Sacramento-Rivero, J.C.; Ponce-Caballero, C.; El-Mekaoui, A.; Navarro-Pineda, F. Life Cycle Assessment of Photovoltaic Panels Including Transportation and Two End-of-Life Scenarios: Shaping a Sustainable Future for Renewable Energy. Renew. Energy Focus 2024, 51, 100649. [Google Scholar] [CrossRef]
- Mutel, C. Brightway: An Open Source Framework for Life Cycle Assessment. J. Open Source Softw. 2017, 2, 236. [Google Scholar] [CrossRef]
- Dias, P.; Javimczik, S.; Benevit, M.; Veit, H. Recycling WEEE: Polymer Characterization and Pyrolysis Study for Waste of Crystalline Silicon Photovoltaic Modules. Waste Manag. 2017, 60, 716–722. [Google Scholar] [CrossRef]
- Waithaka, A.; Plakantonaki, S.; Kiskira, K.; Mburu, A.W.; Chronis, I.; Zakynthinos, G.; Githaiga, J.; Priniotakis, G. Cellulose-Based Biopolymers from Banana Pseudostem Waste: Innovations for Sustainable Bioplastics. Waste 2025, 3(4), 37. [Google Scholar] [CrossRef]
- Duflou, J.R.; Peeters, J.R.; Altamirano, D.; Bracquene, E.; Dewulf, W. Demanufacturing Photovoltaic Panels: Comparison of End-of-Life Treatment Strategies for Improved Resource Recovery. CIRP Annals 2018, 67, 29–32. [Google Scholar] [CrossRef]
- Zhao, P.; Guo, J.; Yan, G.; Zhu, G.; Zhu, X.; Zhang, Z.; Zhang, B. A Novel and Efficient Method for Resources Recycling in Waste Photovoltaic Panels: High Voltage Pulse Crushing. J. Clean. Prod. 2020, 257, 120442. [Google Scholar] [CrossRef]
- Chowdhury, M.S.; Rahman, K.S.; Chowdhury, T.; Nuthammachot, N.; Techato, K.; Akhtaruzzaman, M.; Tiong, S.K.; Sopian, K.; Amin, N. An Overview of Solar Photovoltaic Panels’ End-of-Life Material Recycling. Energy Strategy Rev. 2020, 27, 100431. [Google Scholar] [CrossRef]
- Mikucioniene, D.; Mínguez-García, D.; Repon, M.R.; Milašius, R.; Priniotakis, G.; Chronis, I.; Kiskira, K.; Hogeboom, R.; Belda-Anaya, R.; Díaz-García, P. Understanding and Addressing the Water Footprint in the Textile Sector: A Review. AUTEX Res. J. 2024, 24(1), 20240004. [Google Scholar] [CrossRef]
- Nain, P.; Kumar, A. Theoretical Evaluation of Metal Release Potential of Emerging Third Generation Solar Photovoltaics. Sol. Energy Mater. Sol. Cells 2021, 227, 111120. [Google Scholar] [CrossRef]
- Kalkanis, K.; Vokas, G.; Kiskira, K. Investigating the Sustainability of Wind Turbine Recycling: A Case Study—Greece. Mater. Circ. Econ. 2024, 6, 52. [Google Scholar] [CrossRef]
- Kolahchian Tabrizi, M.; Famiglietti, J.; Bonalumi, D.; Campanari, S. The Carbon Footprint of Hydrogen Produced with State-of-the-Art Photovoltaic Electricity Using Life-Cycle Assessment Methodology. Energies 2023, 16, 5190. [Google Scholar] [CrossRef]
Figure 1.
Search and selection criteria of reviewed studies.
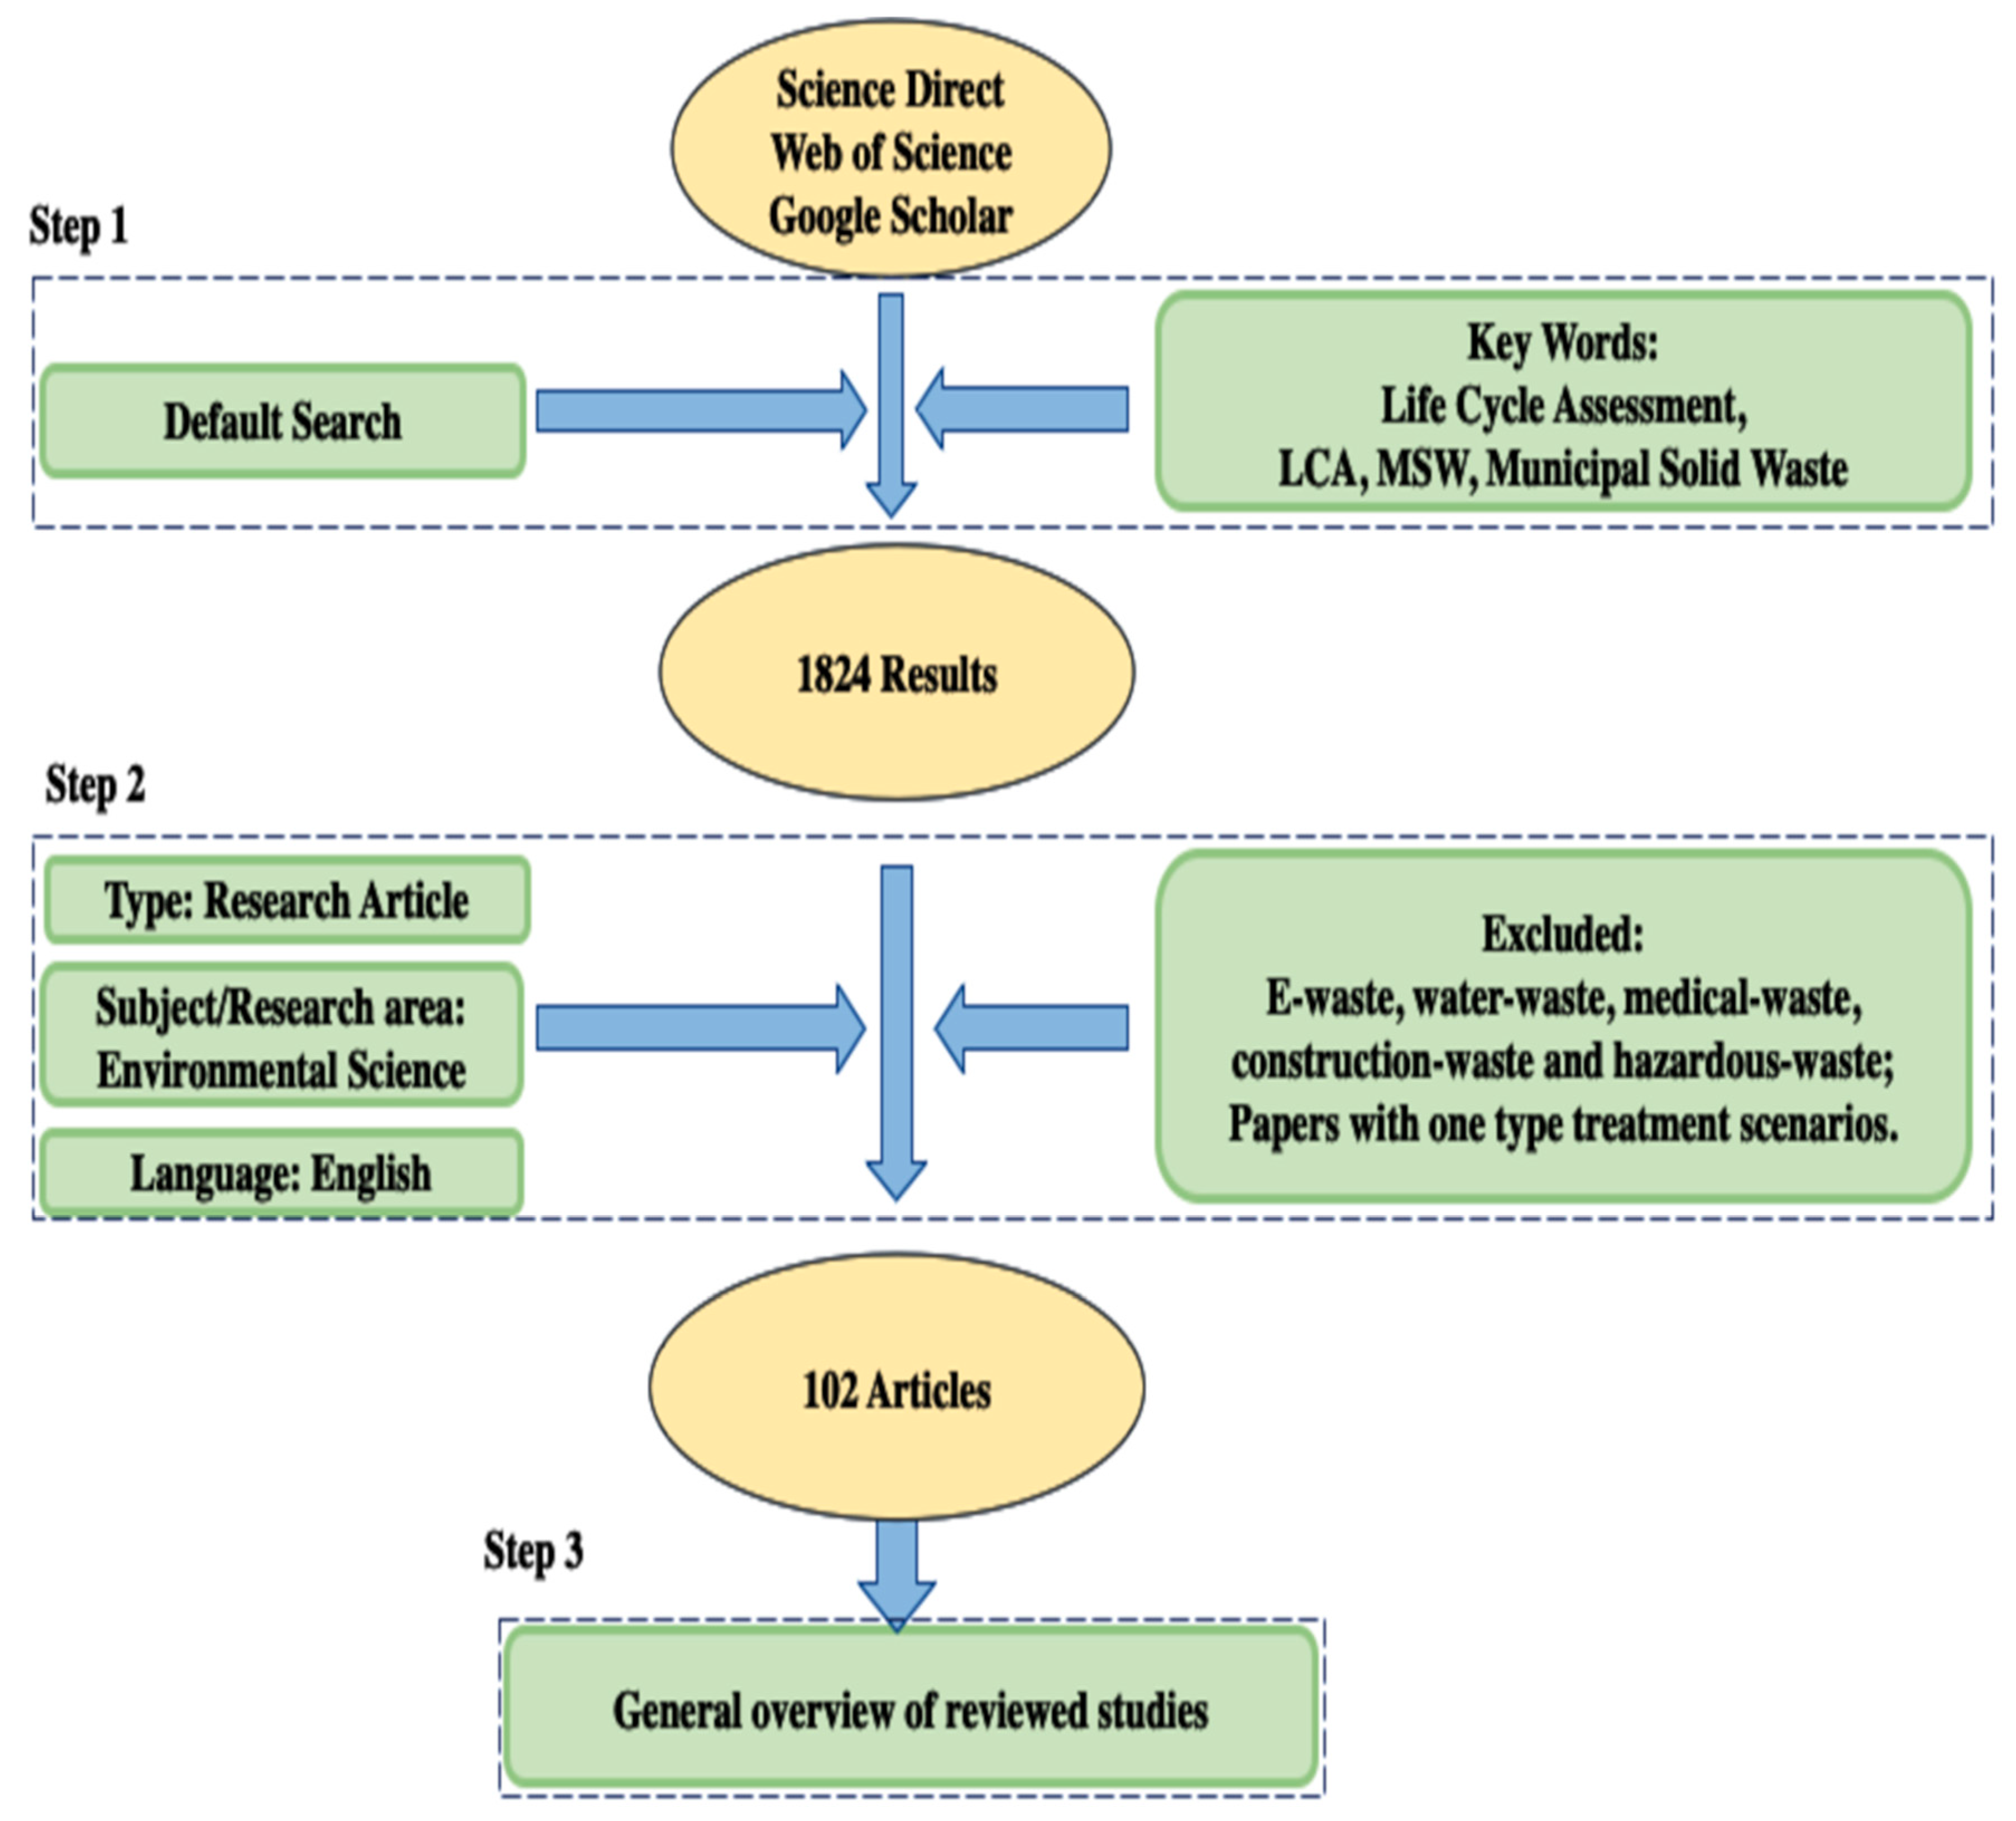
Figure 2.
Schematic overview of representative manufacturing line configurations for next-generation photovoltaic technologies.
Figure 2.
Schematic overview of representative manufacturing line configurations for next-generation photovoltaic technologies.
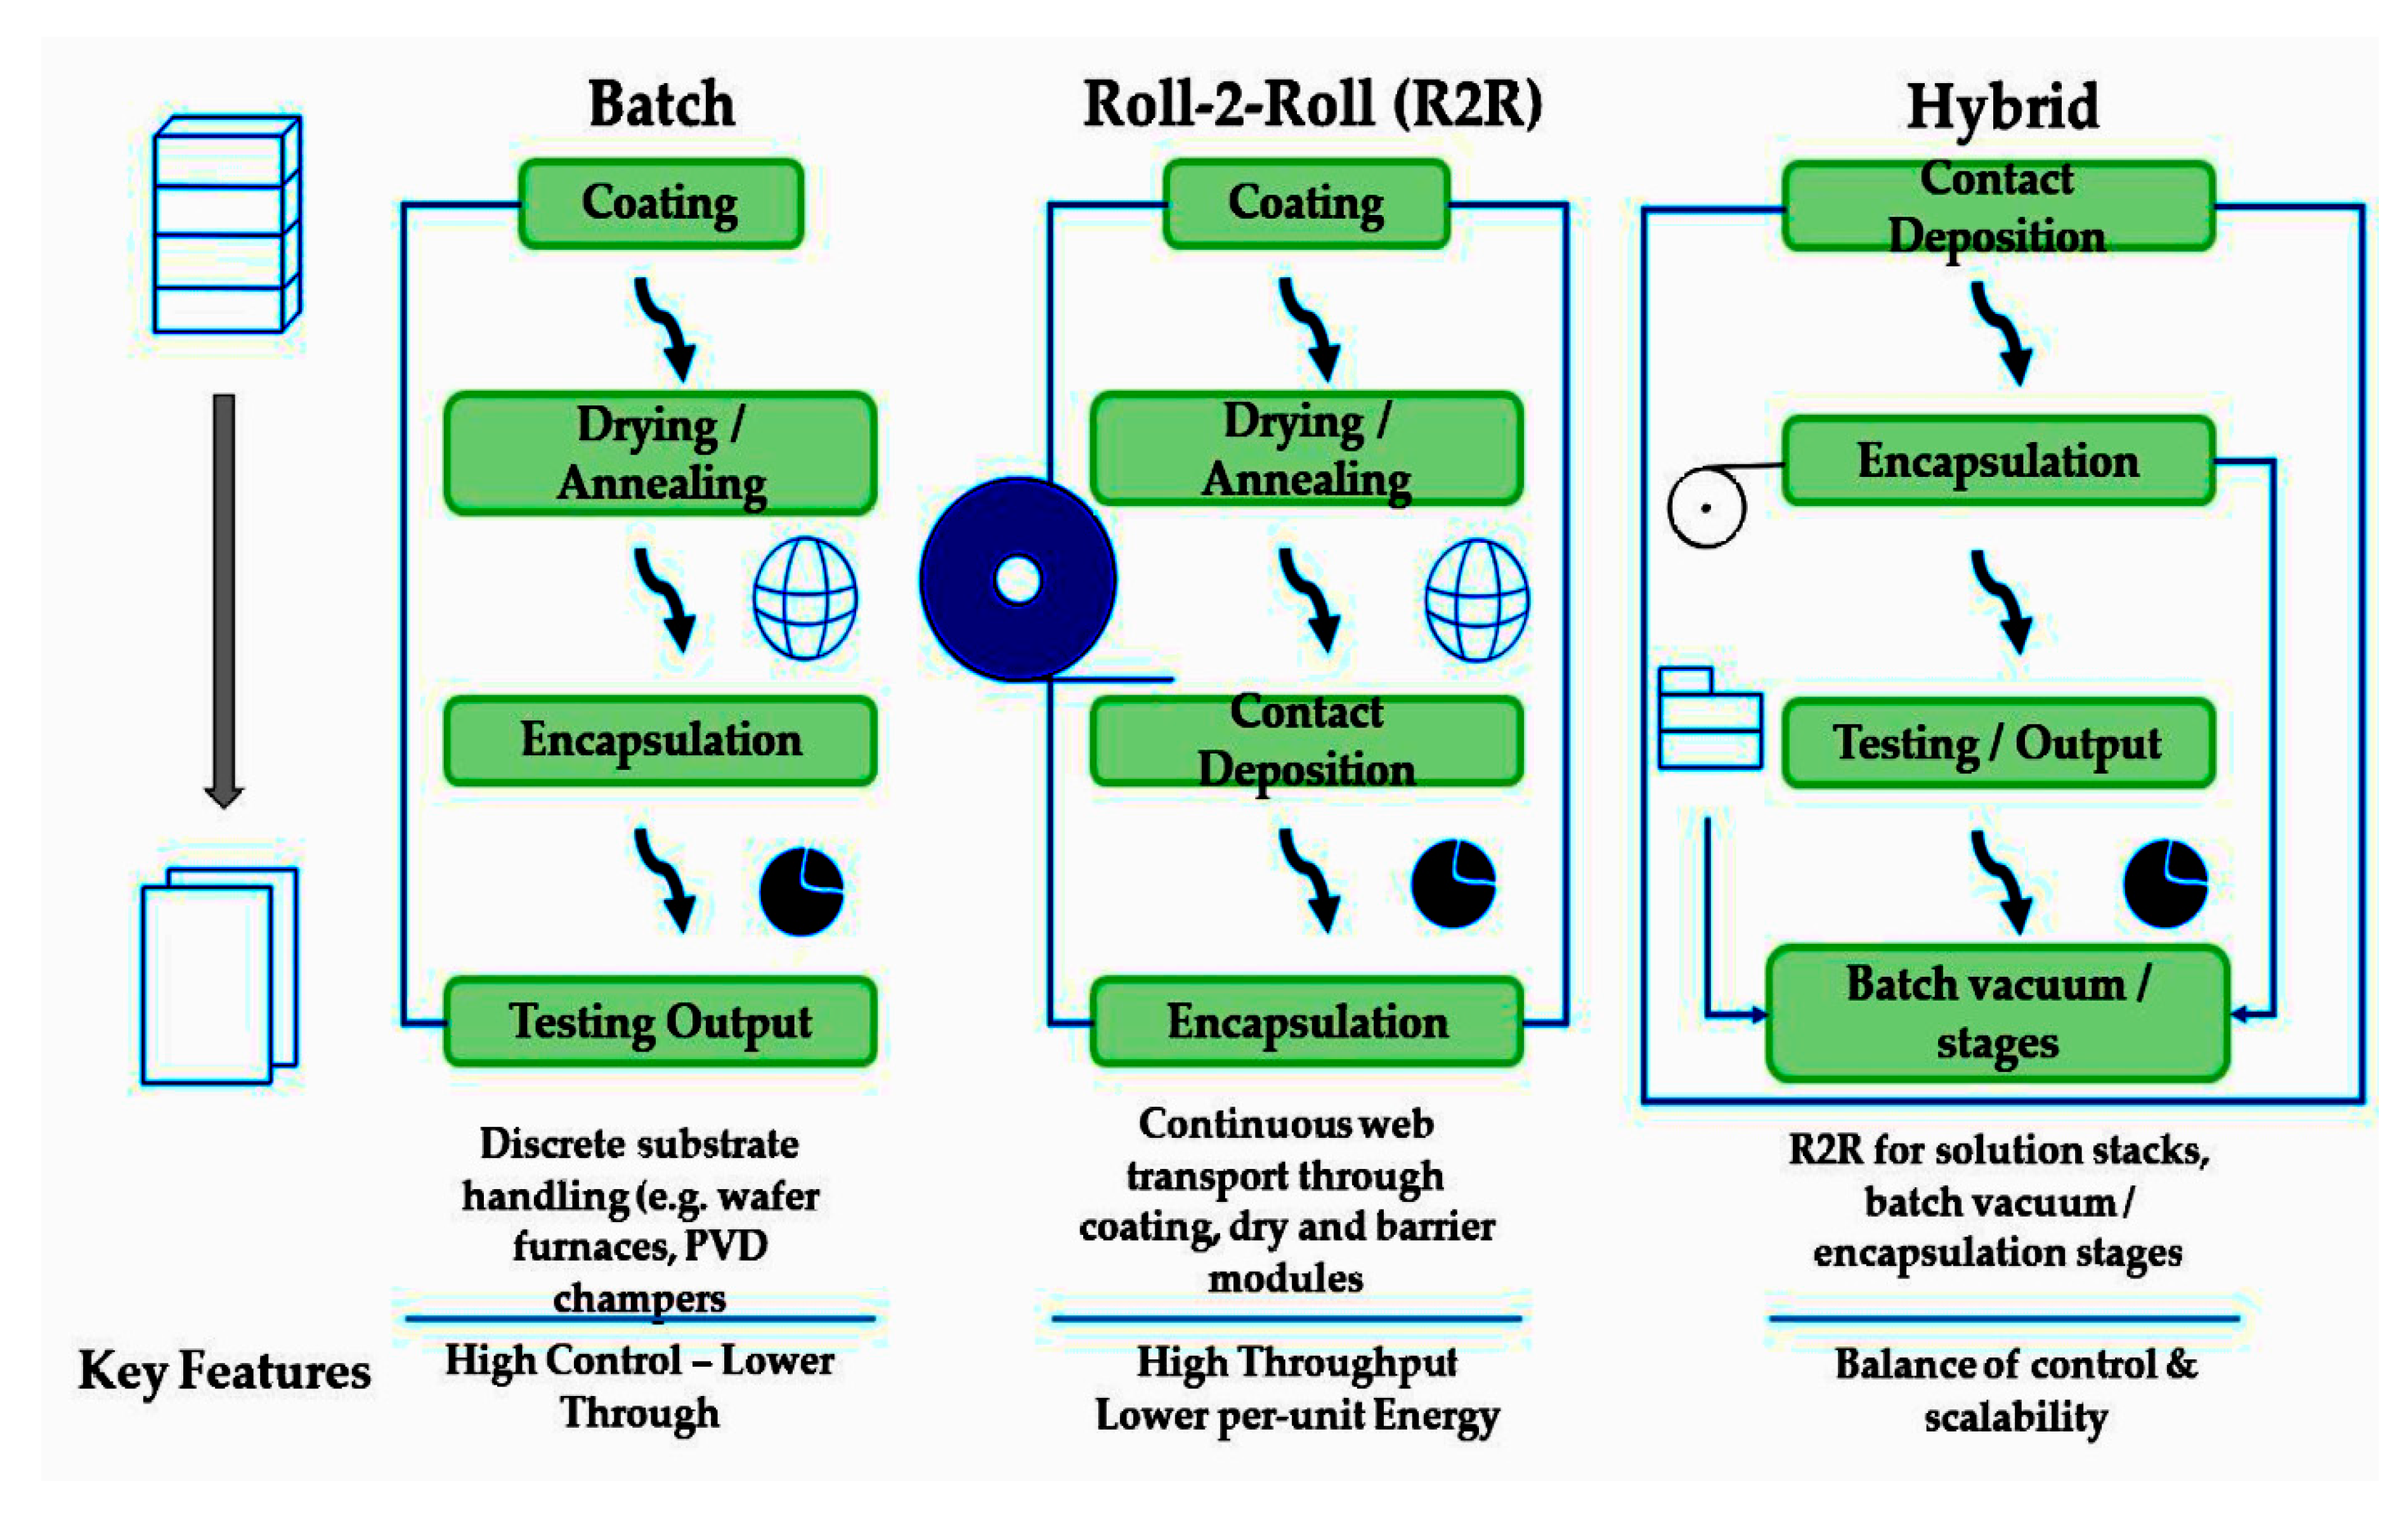
Figure 3.
Mean embodied energy and global-warming potential (GWP) intensities of solution-processed, vacuum-processed, and hybrid photovoltaic process families. Error bars denote one-sigma uncertainty derived from Tier 2-3 data (Table 1).
Figure 3.
Mean embodied energy and global-warming potential (GWP) intensities of solution-processed, vacuum-processed, and hybrid photovoltaic process families. Error bars denote one-sigma uncertainty derived from Tier 2-3 data (Table 1).
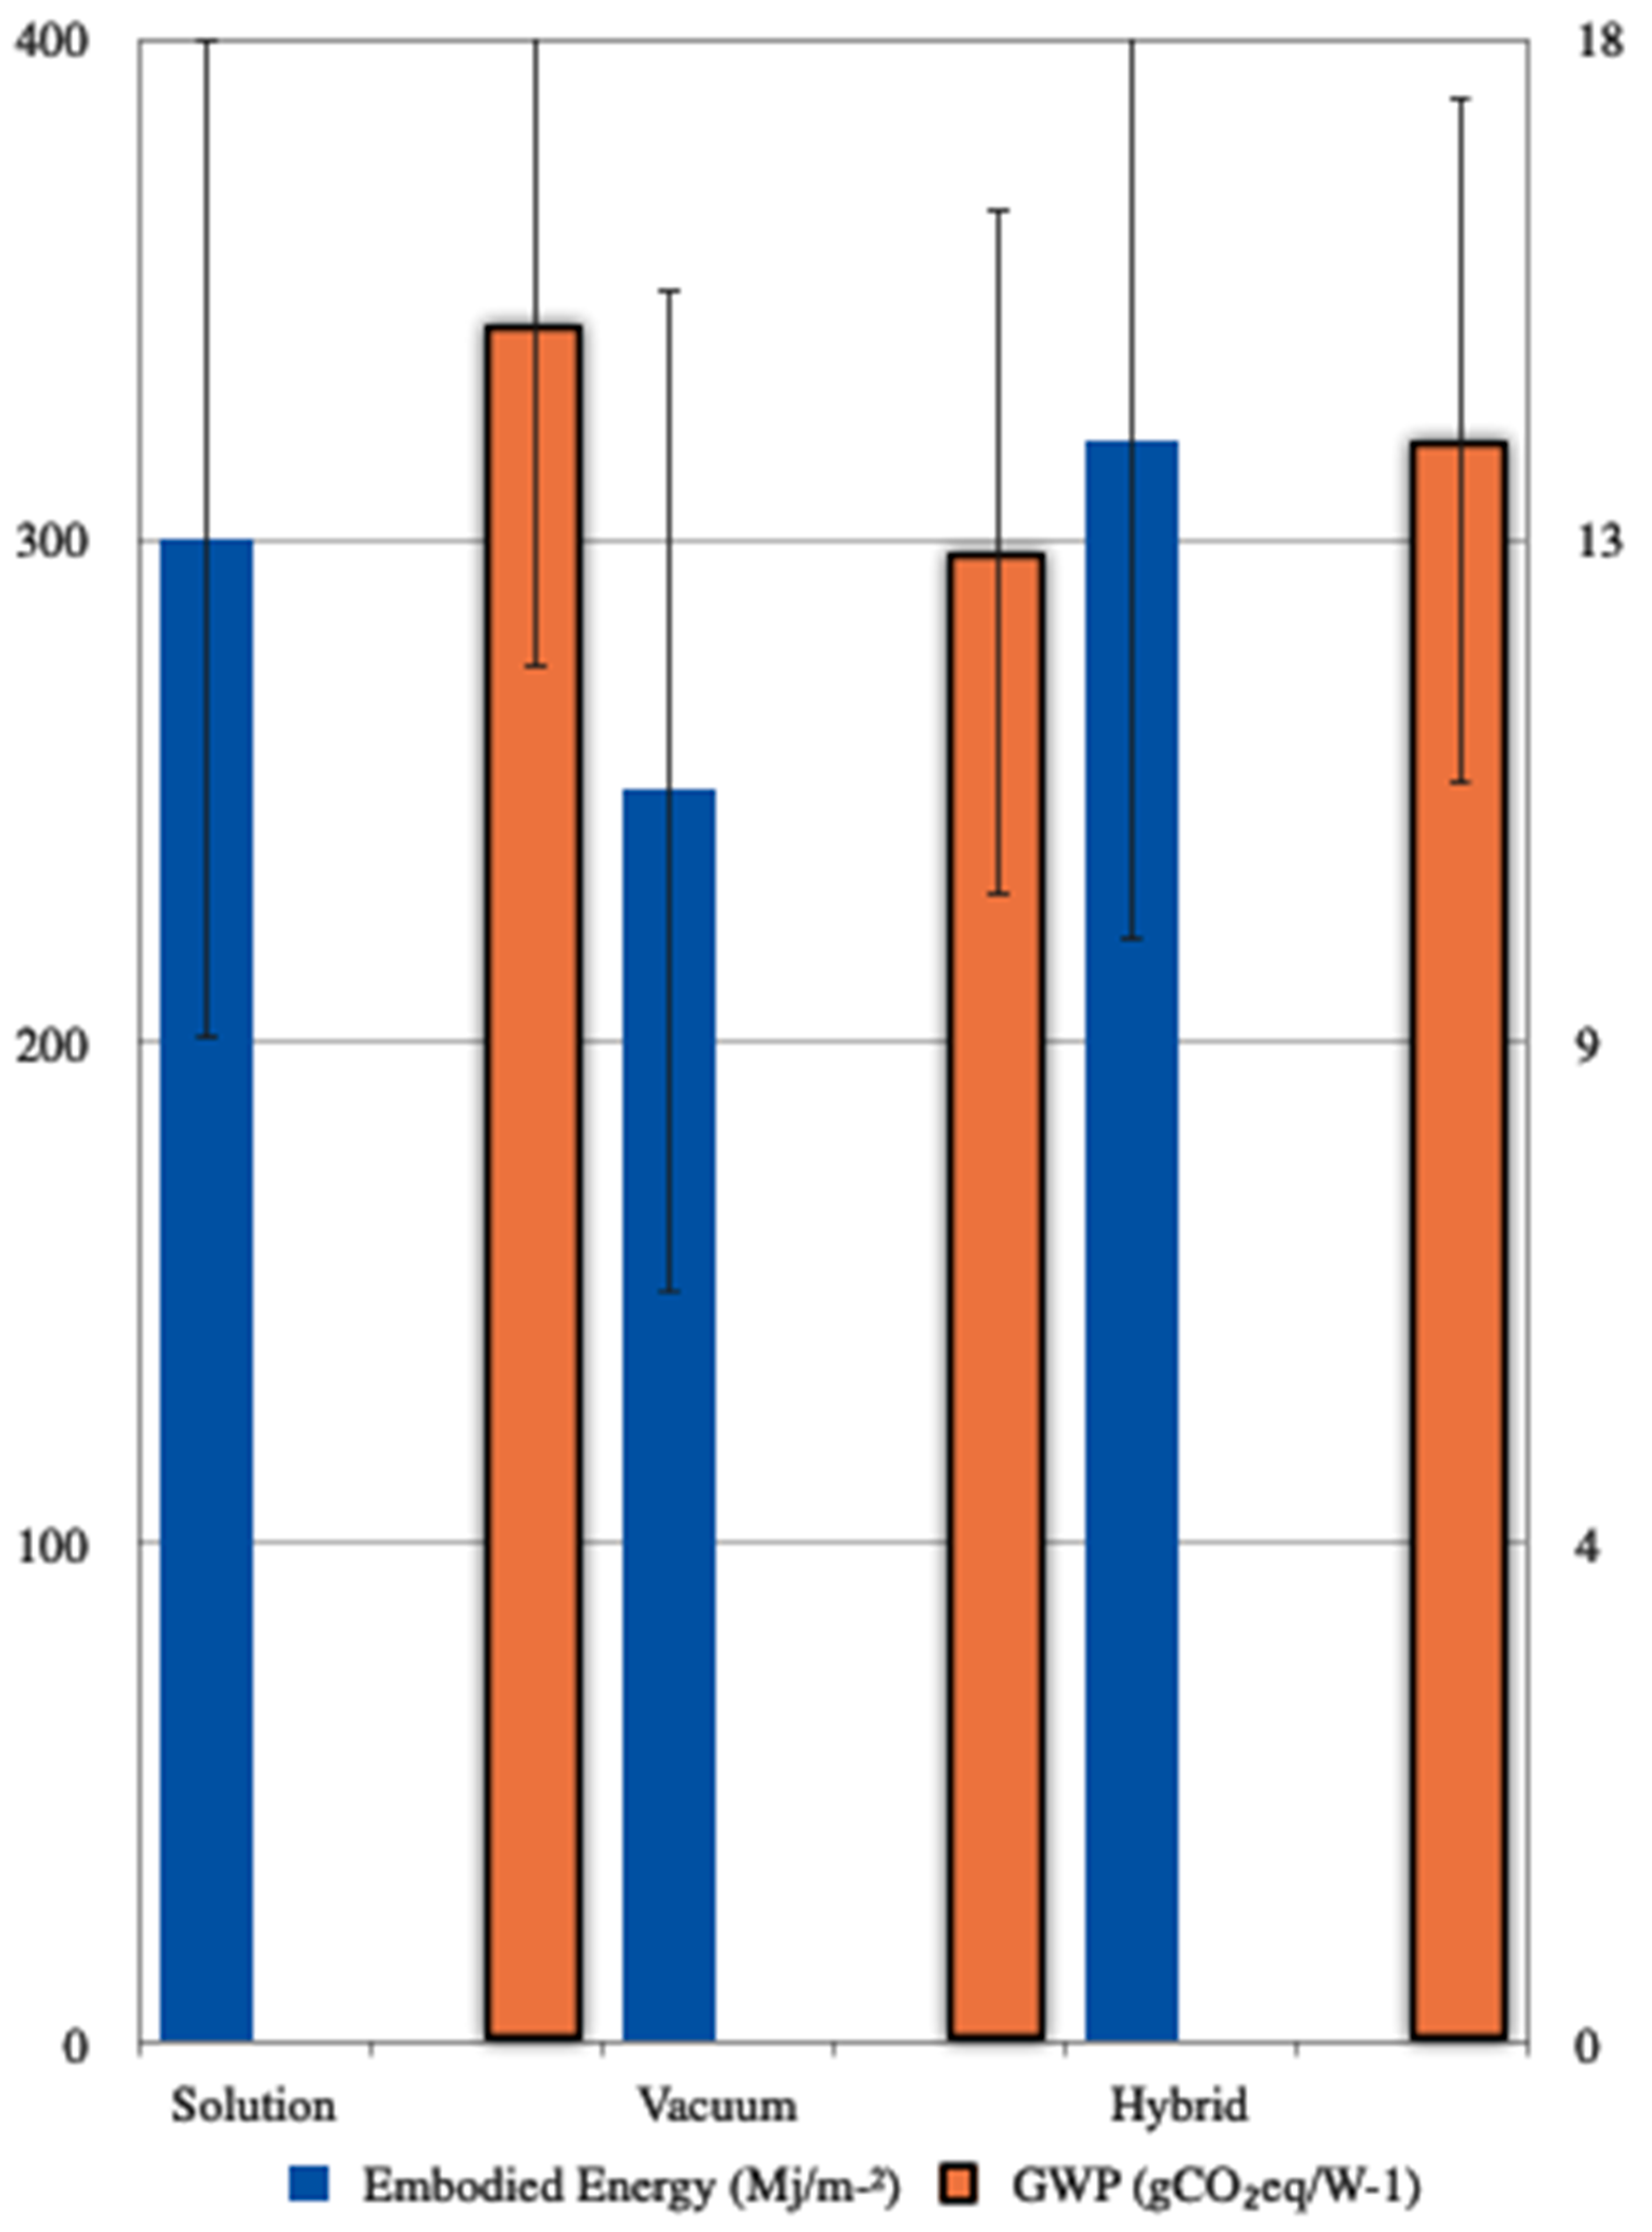
Figure 4.
Relative contributions of main unit operations to total process energy for representative solution, vacuum, and hybrid photovoltaic manufacturing lines. Data synthesized from [12,15,16,17,38,39,40,41,42,43,53,54,55] after normalization per m² active area (Section 4.1).
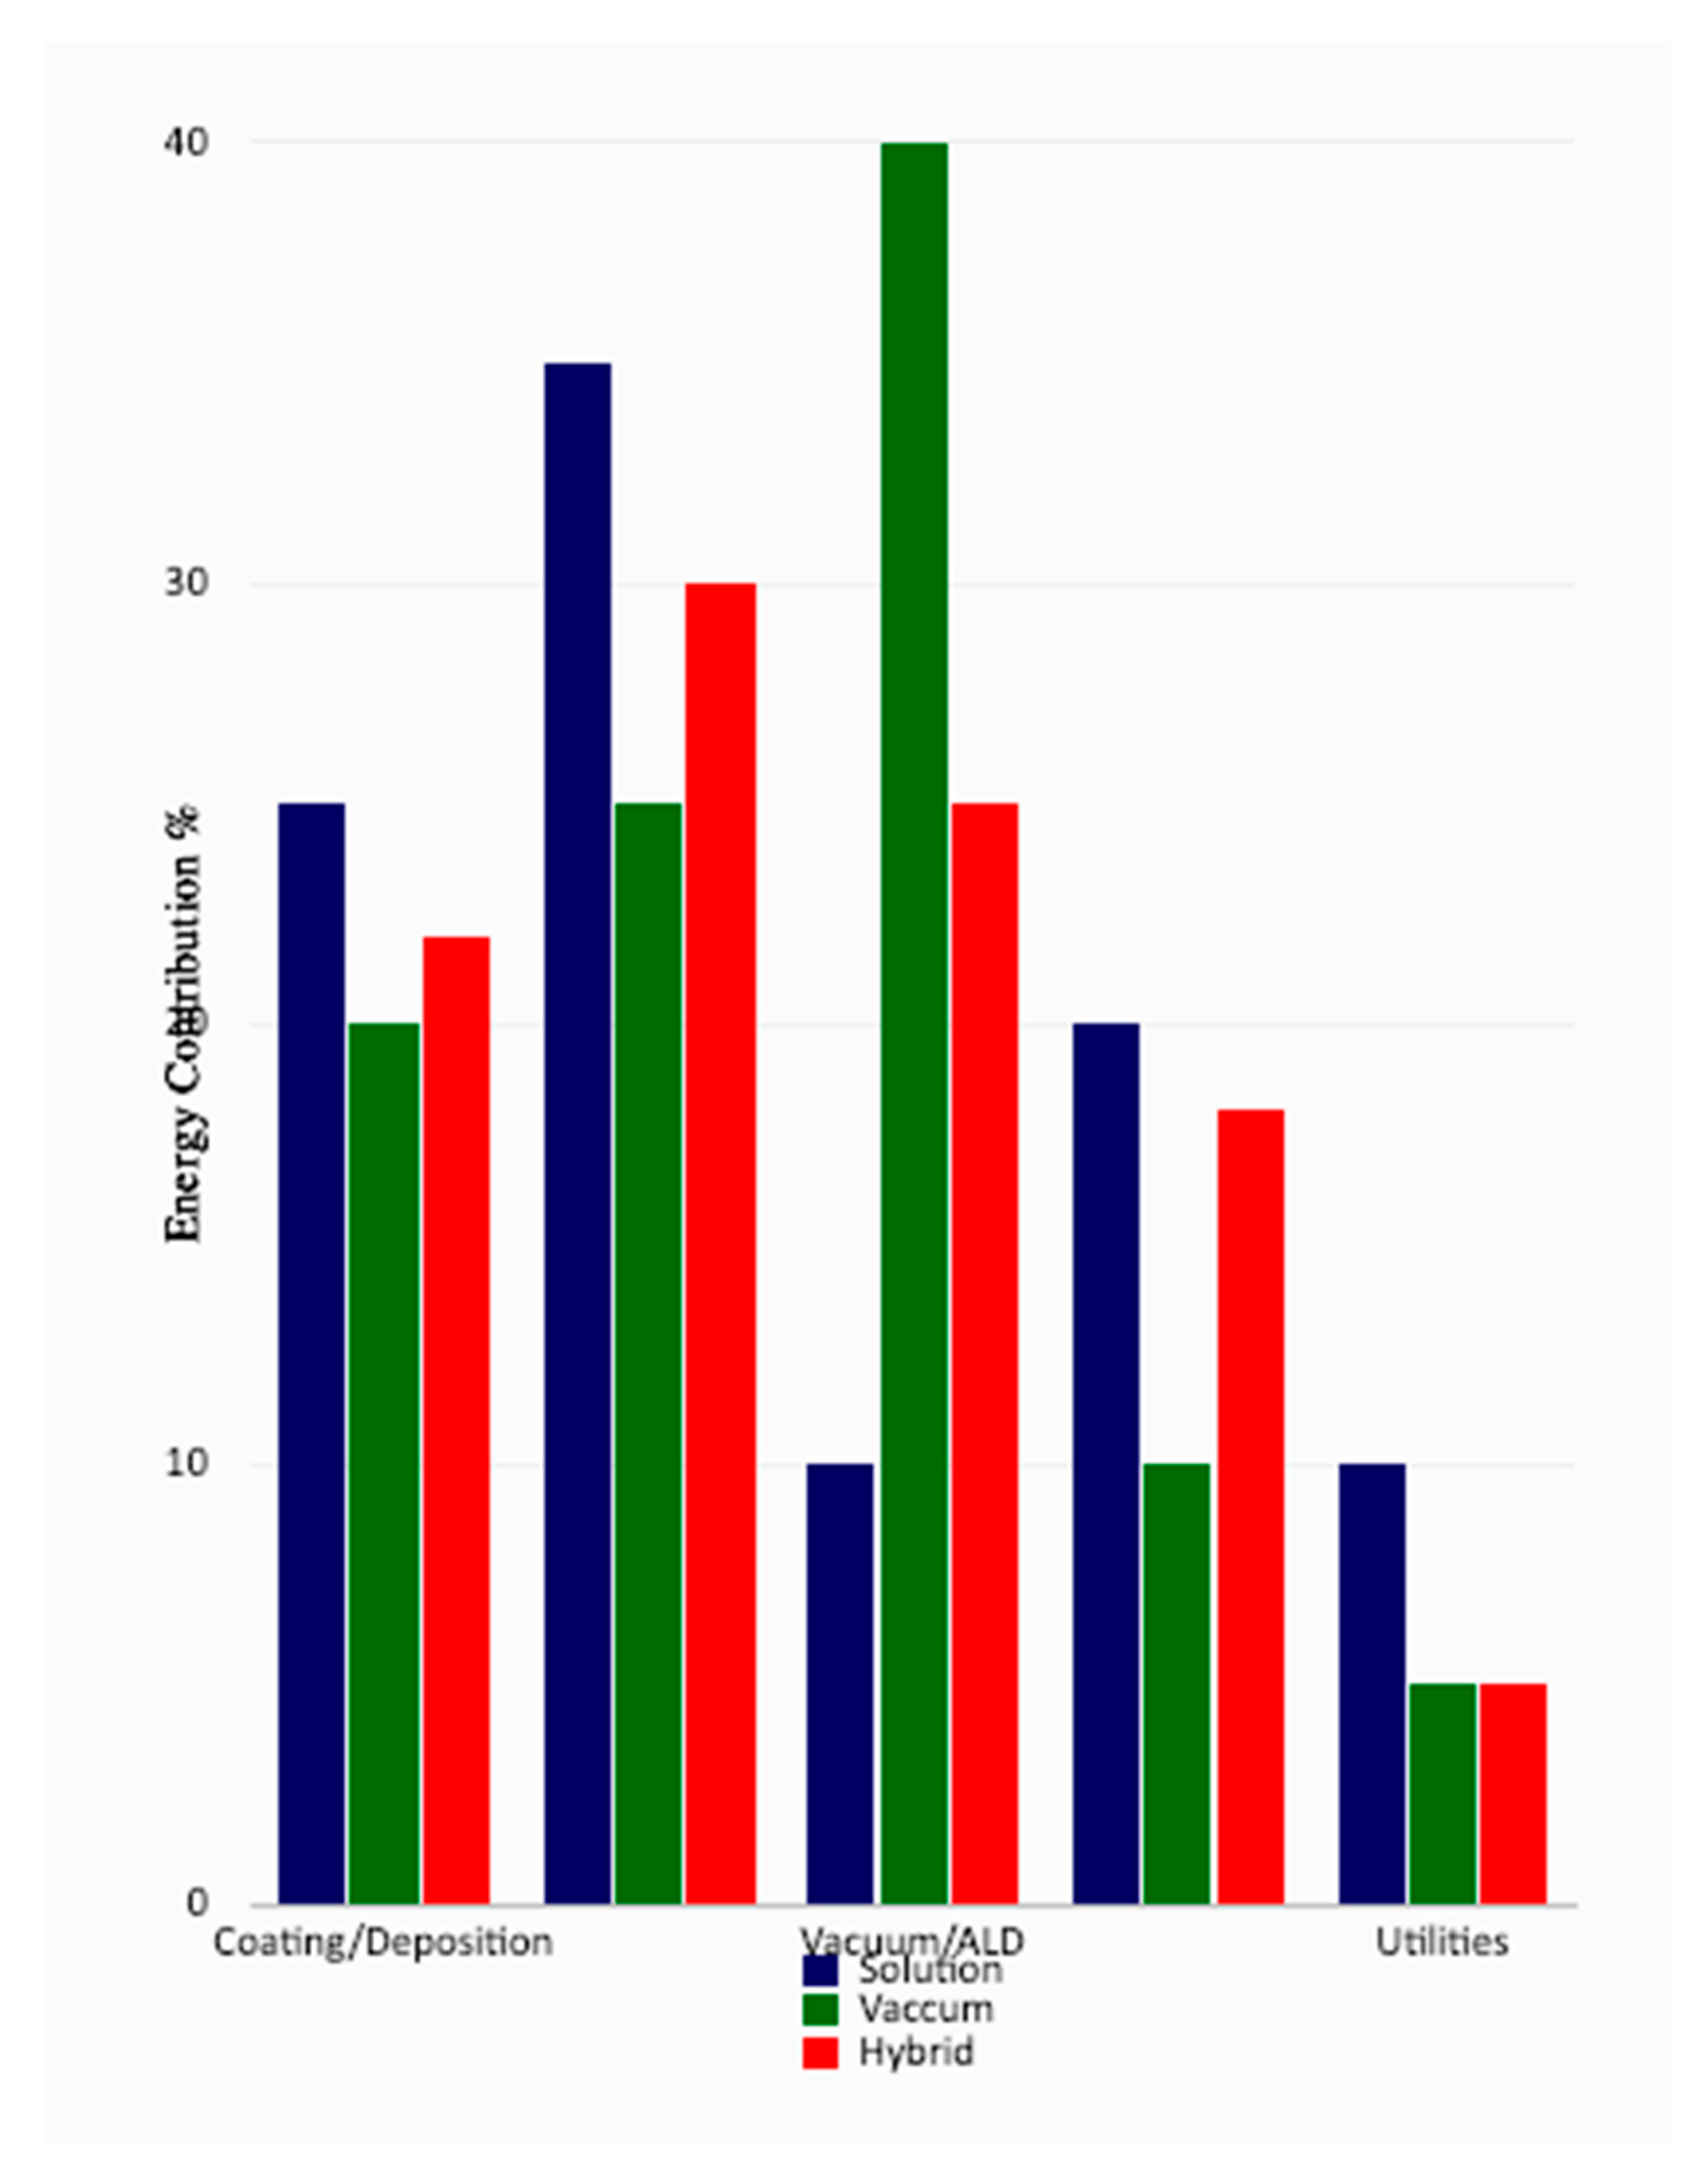
Figure 5.
Critical materials risk and substitution map for next-generation PV technologies. Panels summarize: (a) supply-risk indices for Ag, In, Sn, and Au; (b) environmental-impact scores including mineral scarcity and toxicity; (c) current versus future recycling/recovery efficiencies; and (d) substitution pathways including Ag→Cu/Al metallization, In→AZO/SnO₂ TCOs, and closed-loop Pb recovery. The figure integrates evidence from criticality analyses, recycling studies, and prospective assessments across crystalline-Si, thin-film, and perovskite PV systems [5,19,21,22,27,28,29,30,31,32,54,70,76,77,78,79,80].
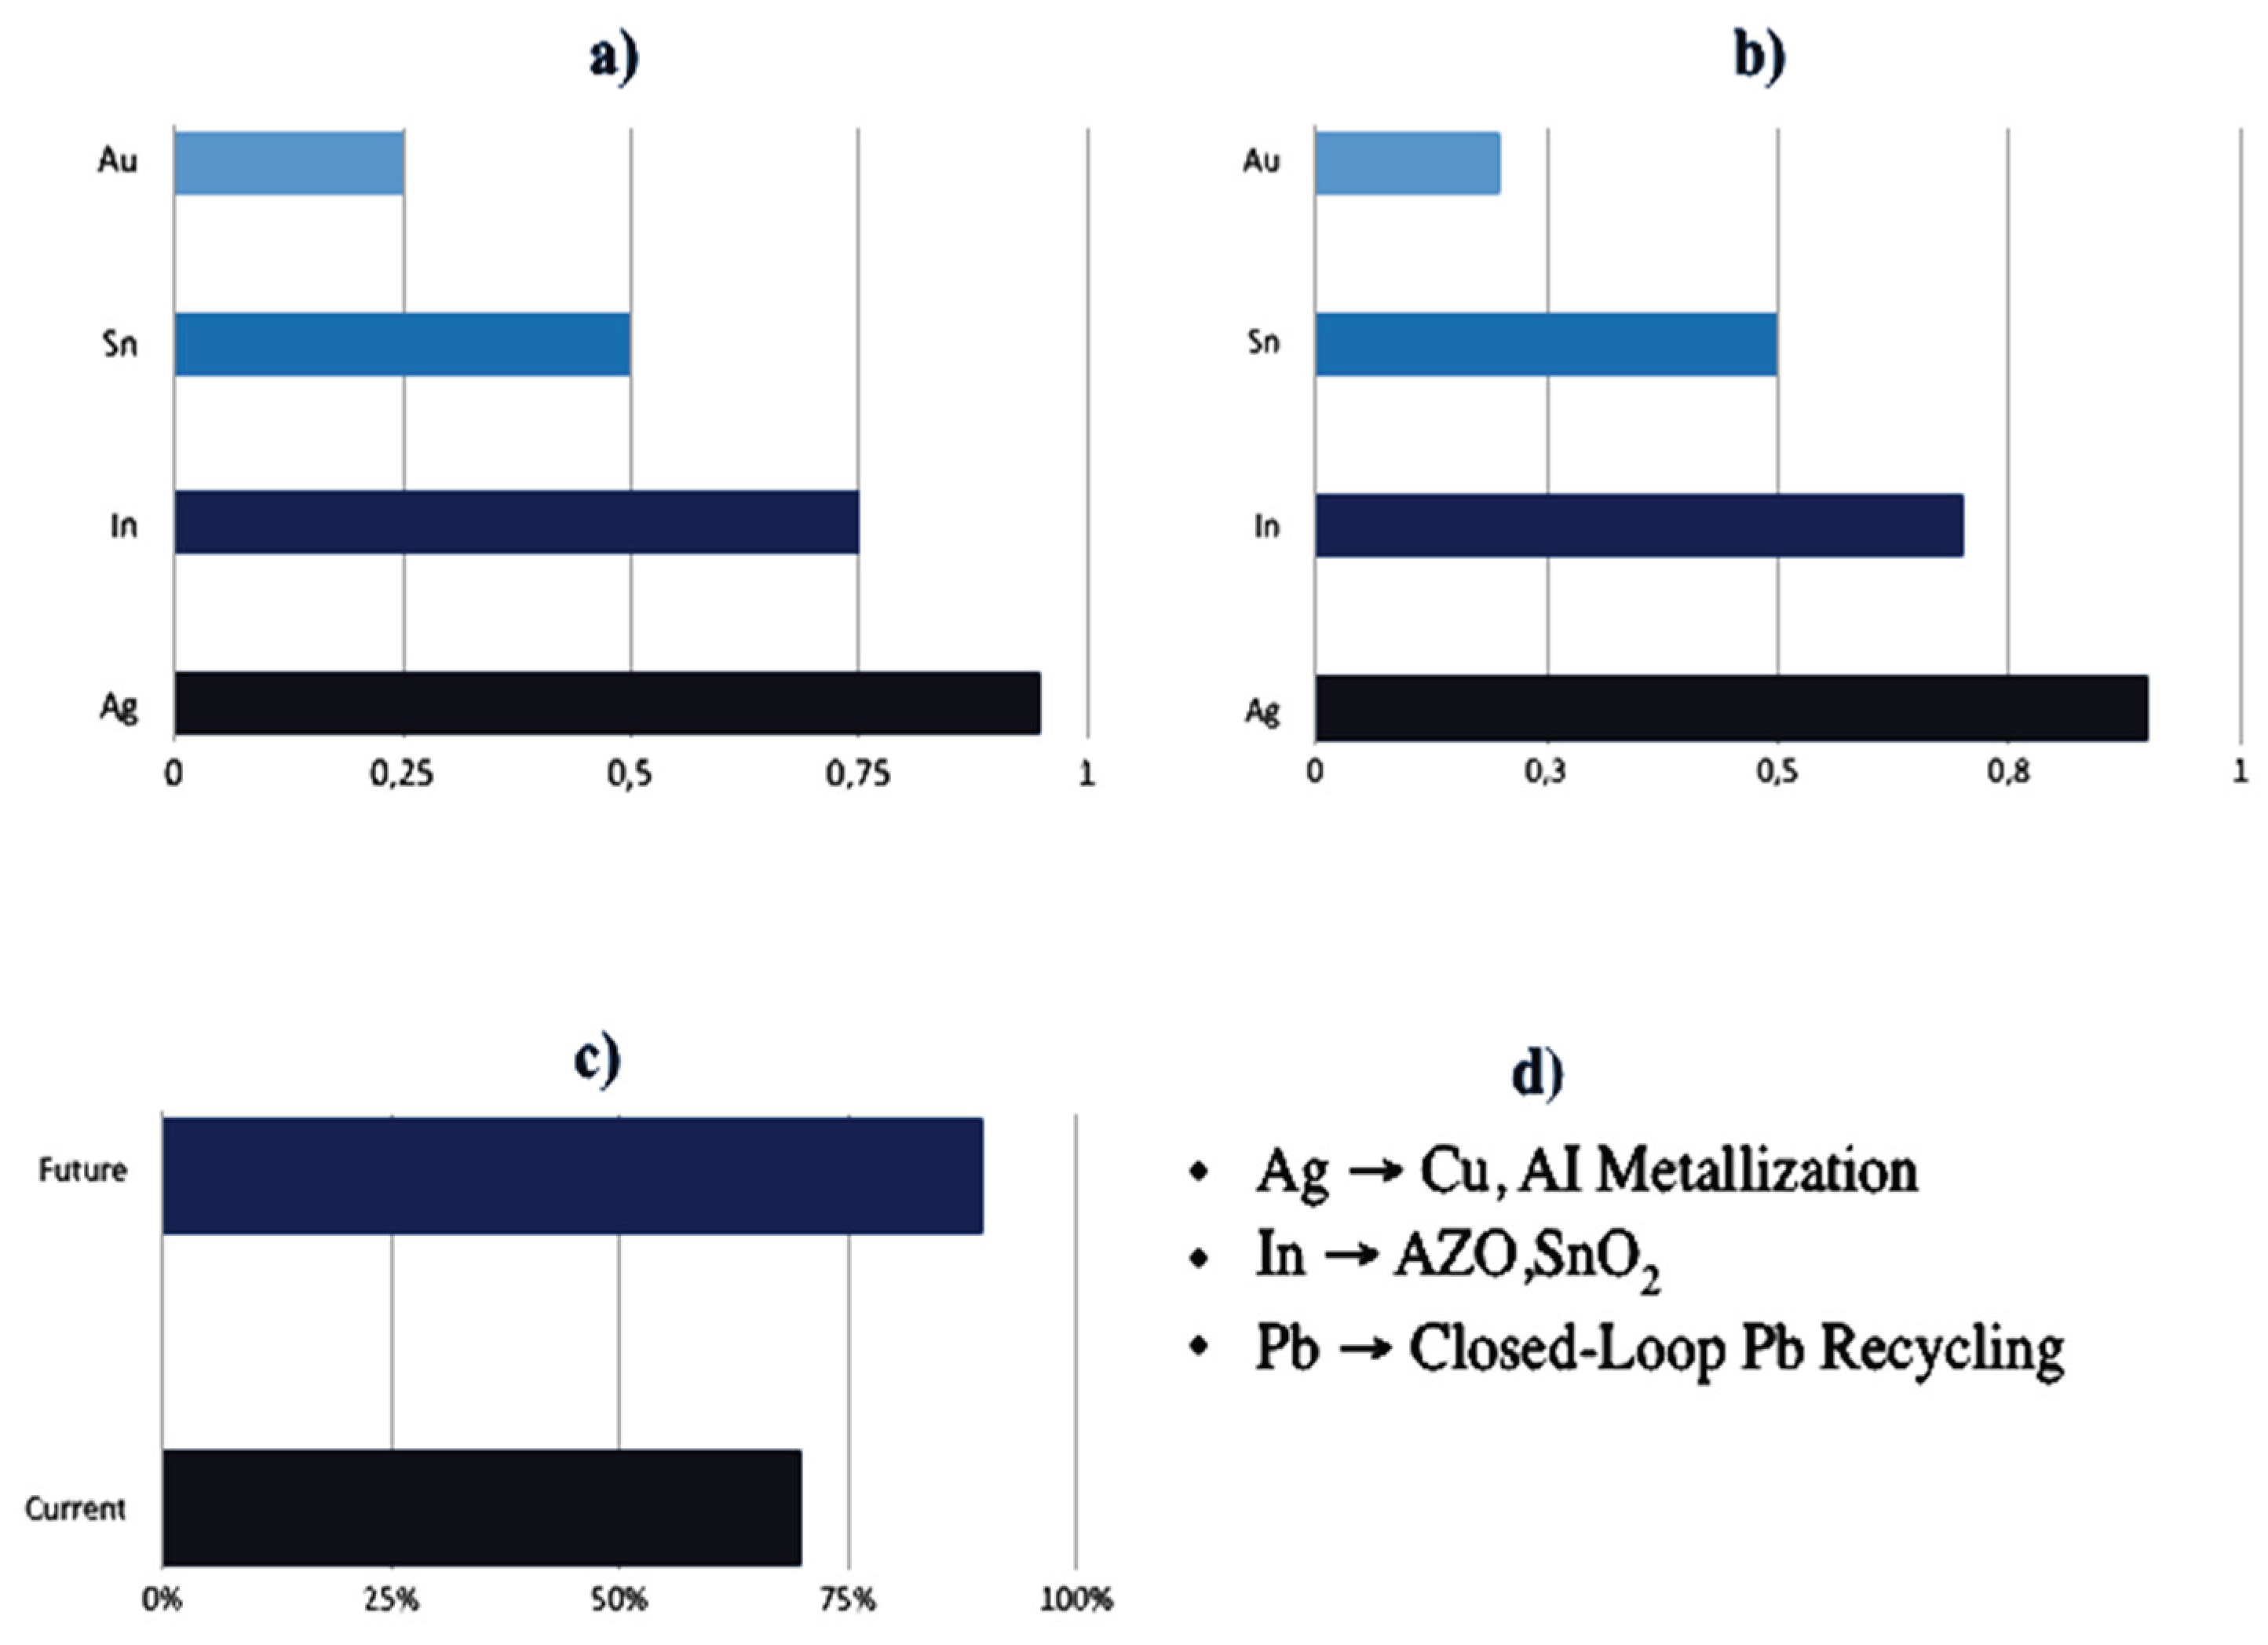
Table 1.
Data-quality classification and uncertainty ranges for process-level photovoltaic LCIs. Tiers 1-3 correspond respectively to measured industrial/pilot data, scaled laboratory inventories, and modeled or averaged literature data. Values represent energy intensity (MJ m⁻²) ranges after normalization (Section 4.1). Coefficients of variation (CoV) reflect propagated Monte Carlo uncertainty following [23,24,26,48,56,57].
| Process Family | Data-Quality Tier 1(Industrial/Pilot) | Tier 2(Lab→Pilot Scaled) | Tier 3(Literature/Model) | Dominant Uncertainty Drivers | Typical CoV (%) | Representative Data Sources |
|---|---|---|---|---|---|---|
| Solution-processed(slot-die, blade, inkjet) | Measured energy ≈ 200-250 MJ m⁻² | 250-400 MJ m⁻² | 300-500 MJ m⁻² | Solvent recovery η, annealing temperature, substrate mass | 30-60% | [12,15,16,42,45,52] |
| Vacuum-processed(ALD, sputter, evaporation) | 150-200 MJ m⁻² | 200-350 MJ m⁻² | 250-400 MJ m⁻² | Chamber heating, pump idle power, throughput | 20-50% | [17,37,38,53,54] |
| Hybrid thin-film/tandem | 220-280 MJ m⁻² | 300-380 MJ m⁻² | 350-450 MJ m⁻² | Encapsulation mass, yield, interface recombination losses | 25-45% | [12,32,40,42,55] |
| Encapsulation/lamination | 40-70 MJ m⁻² | 60-100 MJ m⁻² | 80-120 MJ m⁻² | Curing route, barrier foil, curing temperature | 15-30% | [12,38,39,44] |
| Ancillary/utilities (HVAC, vacuum, power electronics) | 10-20% of total energy | 15-25% | 20-30% | Grid mix, duty cycle, maintenance schedule | 10-25% | [26,37,39,54,56,57] |
Table 2.
Required reporting requirements for transparent, reproducible, and comparable process-level PV LCAs.
Table 2.
Required reporting requirements for transparent, reproducible, and comparable process-level PV LCAs.
| Category | Required Reporting Items | Why It Matters | Applies to | Sources |
|---|---|---|---|---|
| Functional unit (FU) | 1 m² active area and 1 kWp; module efficiency, active/total area ratio; yield to FU | Misaligned FUs can shift results by >×10; active-area normalization enables lab→pilot translation | All | [3,8,12,48] |
| System boundary | Foreground steps (substrate prep, deposition/coating, drying/anneal, metallization, encapsulation) vs. background (electricity mix, gases, solvents); explicit exclusions (HVAC, vacuum idle) | Boundary gaps drive hidden variance; explicit foreground/back-ground splits enable harmonization | All | [3,24,26] |
| Electricity | Grid mix (region, year), carbon intensity, on-site generation; tool idle vs. loaded power; duty cycles | Top driver of GWP; 2-4× swings across regions; idle time is a frequent hotspot | All | [2,24,48,66,67,81,82,86,87] |
| Process LCIs (per step) | Energy (MJ/m²), gases/solvents (kg/m²), consumables, rejects/yield, tool setpoints (T, t, P) | Enables step-wise attribution and meta-analysis | Solution, vacuum, hybrid lines | [12,17,42,85] |
| Solvent management | Solvent identity, recovery efficiency (%), losses, abatement | Major driver in wet lines; recovery is a first-order lever | Solution lines | [12,15,16,42] |
| Vacuum equipment | Pumping scheme, chamber volume, base pressure, cycle times, idle energy | Throughput-sensitive; chamber/pump energy dominates per m² | Vacuum lines | [17,56] |
| Annealing/drying | Heating method (furnace vs. photonic), setpoints, line speed, thermal losses | Often the single largest energy step; ecodesign is essential | All | [12,38] |
| Encapsulation & substrates | Glass/foil types, barrier performance, curing route (UV/thermal), mass per m² | Shifts GWP by double digits; constrains EoL options | All | [12,32,40,42] |
| Data tier & pedigree | Tier (1-3), measurement vs. model, TRL, vintage; uncertainty ranges | Enables uncertainty propagation and fair weighting | All | [24,26,60] |
| Scenario levers | Grid-carbon pathways, solvent recovery, Ag reduction, yield/throughput | Transparent sensitivity; supports prospective results | All | [24,48,69,70,81,82,86,87] |
| BOS and power electronics | Inverter rating, lifetime, replacement, efficiency | BOS can be non-trivial in system LCAs | Systems | [37,48,84] |
| EoL modeling | Collection, transport, process flows, recovery yields (Si, Ag, glass, Al), credits/allocation | Determines circularity benefits; can reduce GWP by ~40-60% | All | [30,32,71,72,73,74,75,88,89,90,91,92] |
Disclaimer/Publisher’s Note: The statements, opinions and data contained in all publications are solely those of the individual author(s) and contributor(s) and not of MDPI and/or the editor(s). MDPI and/or the editor(s) disclaim responsibility for any injury to people or property resulting from any ideas, methods, instructions or products referred to in the content. |
© 2025 by the authors. Licensee MDPI, Basel, Switzerland. This article is an open access article distributed under the terms and conditions of the Creative Commons Attribution (CC BY) license (https://creativecommons.org/licenses/by/4.0/).
Copyright: This open access article is published under a Creative Commons CC BY 4.0 license, which permit the free download, distribution, and reuse, provided that the author and preprint are cited in any reuse.


