
Submitted:
25 November 2025
Posted:
27 November 2025
You are already at the latest version
Abstract
Asia presently houses some of the top and dynamic economies in the world. These nations have also experienced a high rate of fintech adoption within their banking sectors. This paper examines the impact of fintech adoption and integration on the efficiency and stability of banks in 9 Asian countries, using panel data from 85 banks spanning 11 years from 2014 to 2024. The paper first analyzes the impact of fintech on banks across all selected countries and then, on a stratified basis, divides them into three categories: developed economies, large economies, and emerging countries. We use NPL and PLL as proxies for risk, efficiency ratios, and the cost-to-income ratio as efficiency measures, and the stability ratio and Z-score as indicators of stability. Ordinary least squares and fixed-effect techniques have been applied to estimate the results. Results show that fintech adoption reduces bank risk, presents mixed effects on efficiency, and strongly supports bank stability. Moreover, total assets and ROA consistently demonstrate lower risk, higher efficiency, and greater stability. Based on the findings, this research suggests that policymakers must adopt strategies to maximize the benefits.
Keywords:
fintech adoption
; risk
; efficiency
; stability
; Asia
1. Introduction
Over the last couple of decades, the global financial sector has undergone significant changes in the composition of financial products, service delivery methods, and client bases [1]. Indeed, financial services have become technologically advanced through a diverse set of innovations, including mobile banking platforms, automated teller machines (ATMs), digital wallets, and online banking. Their introduction has significantly improved the financial accessibility, convenience, and operational efficiency [2] of financial institutions, including banks. This has also helped overcome the geographical and infrastructural barriers, allowing individuals in remote or underserved regions to participate in the financial system. Although there remains a level of security concern, the digital transformation of the banking industry is considered one of the significant innovations of the 20th century. The introduction of advanced artificial intelligence (AI)- supported financial technology (Fintech) promises to take financial sector development far ahead.
Banks, especially commercial banks, which are at the center of the global financial landscape, have also undergone a digital transformation of their operations through fintech. This digitization, facilitated by numerous fintech innovations, has played a crucial role in expanding the service net to include many previously unbanked individuals [3]. According to the World Bank, approximately 1.2 billion adults gained access to a formal banking institution, and among them, nearly 35 percent are connected through mobile banking [4]. Also, digitalization has played a crucial role in enhancing transaction speed, expanding the range of services offered, and extending coverage to a broader geographical area. Gomber et al. [5] argued that the adoption of digital banking technologies has enabled banks to serve a wide range of customers at a lower cost. Furthermore, fintech has enhanced the customer experience by offering personalized services, real-time analytics, and automated advisory solutions, thereby increasing customer satisfaction and loyalty [6]. At the same time, Fintech has also helped to improve banks’ financial risk management through AI-driven fraud detection, encryption, and biometric authentication [7]. Studies also found that fintech enhances innovation and competitiveness, allowing banks to develop new products such as peer-to-peer lending, robo-advisory services, and seamless cross-border payments, thereby increasing revenue streams and market share [8,9]
Recognizing the benefits of wider technology adoption, the banking industry has actively partnered with fintech companies through mergers, acquisitions, and integrations. For example, in October 2025, HSBC proposed a $13.6 billion offer to acquire the remaining 36.5% of Hang Seng Bank, valuing it at $37 billion and strengthening its presence in Hong Kong [10]. In April 2025, Columbia Banking System acquired Pacific Premier Bank for $2.92 billion to expand its Pacific Northwest footprint and enhance digital services [11]. In 2024, UniCredit acquired digital bank Aion Bank to boost its digital offerings [12], and Robinhood acquired fintech startup Pluto to improve personalized financial planning and AI-driven investment tools [12]. That same year, Pagaya acquired Theorem, a provider of digital asset management solutions, to expand AI-driven investment capabilities [12]. Additionally, Revolut announced a $670 million investment in India in October 2025 to grow its local operations and fintech offerings [13], while FIS acquired Amount, a Chicago-based digital account origination platform, further strengthening its banking technology solutions [14].
However, there are examples of fintech failures. For instance, in 2022, HSBC launched an international payments app, Zing. By 2024, it had accumulated US$87.5 million; unfortunately, HSBC closed it by the end of that year. It was called a “Huge Mistake” by JPMorgan’s CEO when it acquired fintech startup Frank for about $175 million. Solid was a fintech startup in Palo Alto that raised nearly US$81 million at one point. Despite reporting profitability in 2022, it filed for bankruptcy in April 2025 due to compliance costs and its inability to raise additional capital. Volt was the first full-fledged neo-bank in Australia. In June 2022, it announced it would shut down and return its license [15].
The previous illustrations demonstrate that when some financial institutions earn substantial profits, others may lose their entire investment in a fintech project. This phenomenon affects customers, companies, financial institutions, regulatory frameworks, and societal dynamics, influencing various aspects of the banking sector [16]. Therefore, a relevant question is: what is the impact of fintech on banks’ efficiency and stability? However, the literature offers somewhat contradictory evidence regarding the relationship between fintech adoption and bank performance. While studies [17] found little difference between them, [18] indicated that the banking industry is significantly affected by fintech, which may not impact profitability. A study [19] evaluates the impact of fintech on banking performance and customer satisfaction in the US market. By sampling 100 banks, they found that fintech adoption increases customer satisfaction and improves cost efficiency. Another study [20] investigates the effect of fintech adoption on bank financial performance, using regression analysis across 60 countries. They found a more notable positive impact in developed countries, with a weaker relationship in developing countries. Thesis [21] explores the impact of fintech integration on Jordanian banks. Analyzing a sample of 13 commercial banks over 10 years, they concluded that fintech integration has a positive effect on the financial performance and stability of banks.
After identifying a gap in the literature, this research builds on and extends the existing body of work by providing new evidence on how fintech adoption and integration affect the efficiency and stability of selected Asian countries. The context of this study is important for several reasons. First, East and Southeast Asia are considered global fintech leaders; for example, China, Singapore, and Indonesia have become major fintech hubs. Alipay and WeChat Pay dominate the Chinese market, while GrabPay is prominent in Singapore. Meanwhile, Malaysia, Vietnam, and Thailand are recognized as the fastest-growing fintech economies [22]. India is also emerging as a major player in fintech, with the foundation of digital payments being the Unified Payments Interface (UPI), valued for its speed and convenience. PhonePe and Google Pay are the two leading companies in the market. These rapid developments create a rich context for studying fintech. Second, this region has become a key area for venture capital investment. For instance, Southeast Asia recorded US$8.9 billion in fintech investments in 2022 [23] and US$6.0 billion in 2023 [24]. The fintech market in India is projected to grow from a valuation of USD 44.12 billion in 2025 to USD 95.30 billion by 2030, with a strong 16.65% compound annual growth rate (CAGR) [25]. Third, the region’s diverse economic makeup, which includes China and India—two of the world’s second and fourth largest economies—as well as developed countries like Japan, South Korea, and Singapore, along with emerging economies such as Malaysia, Indonesia, and Vietnam, makes it a noteworthy area of research.
The authors of the research assess that this paper should contribute to the existing literature in the following ways:
Firstly, it offers a comprehensive analysis of the banking sectors in this region, along with the current state of fintech adoption among the area’s financial institutions. It will also deepen our understanding by examining fintech’s role in stabilizing and increasing the efficiency of banks in this region.
Secondly, the ongoing debates on the pace of fintech integration in emerging economies address whether these countries should align their fintech adoption strategies with global trends or take a more cautious, context-specific approach. The research will guide whether rapid adoption or a more gradual integration of fintech is appropriate, based on each country’s unique economic and institutional circumstances.
Finally, this study adds value by providing a comparative analysis of fintech adoption across different banking systems in East and Southeast Asia. By examining various regulatory environments, market conditions, and consumer behaviors, the research reveals regional differences in fintech implementation and its impact on banking practices. This comparative perspective will help policymakers and industry leaders craft more tailored strategies to boost fintech adoption and maximize its benefits in their respective countries.
The paper is structured as follows: Section 2 reviews the current literature relevant to fintech adoption, efficiency, and stability, and develops hypotheses based on this discussion. Section 3 provides a detailed description of the data and methods used in this research. Section 4 presents the results, followed by conclusions and recommendations in Section 5.
2. Literature Review
The influence of fintech on bank performance is becoming an increasingly important topic of research. This necessitates a comprehensive investigation and analysis of research on fintech adoption and its impact on banking performance across regions [26]. Therefore, the literature related to this field is also expanding in both pace and scope. This section of the paper examines various aspects of banking’s adoption of fintech and their performance, to identify the research gap this paper seeks to fill.
2.1. Fintech Adoption Theories
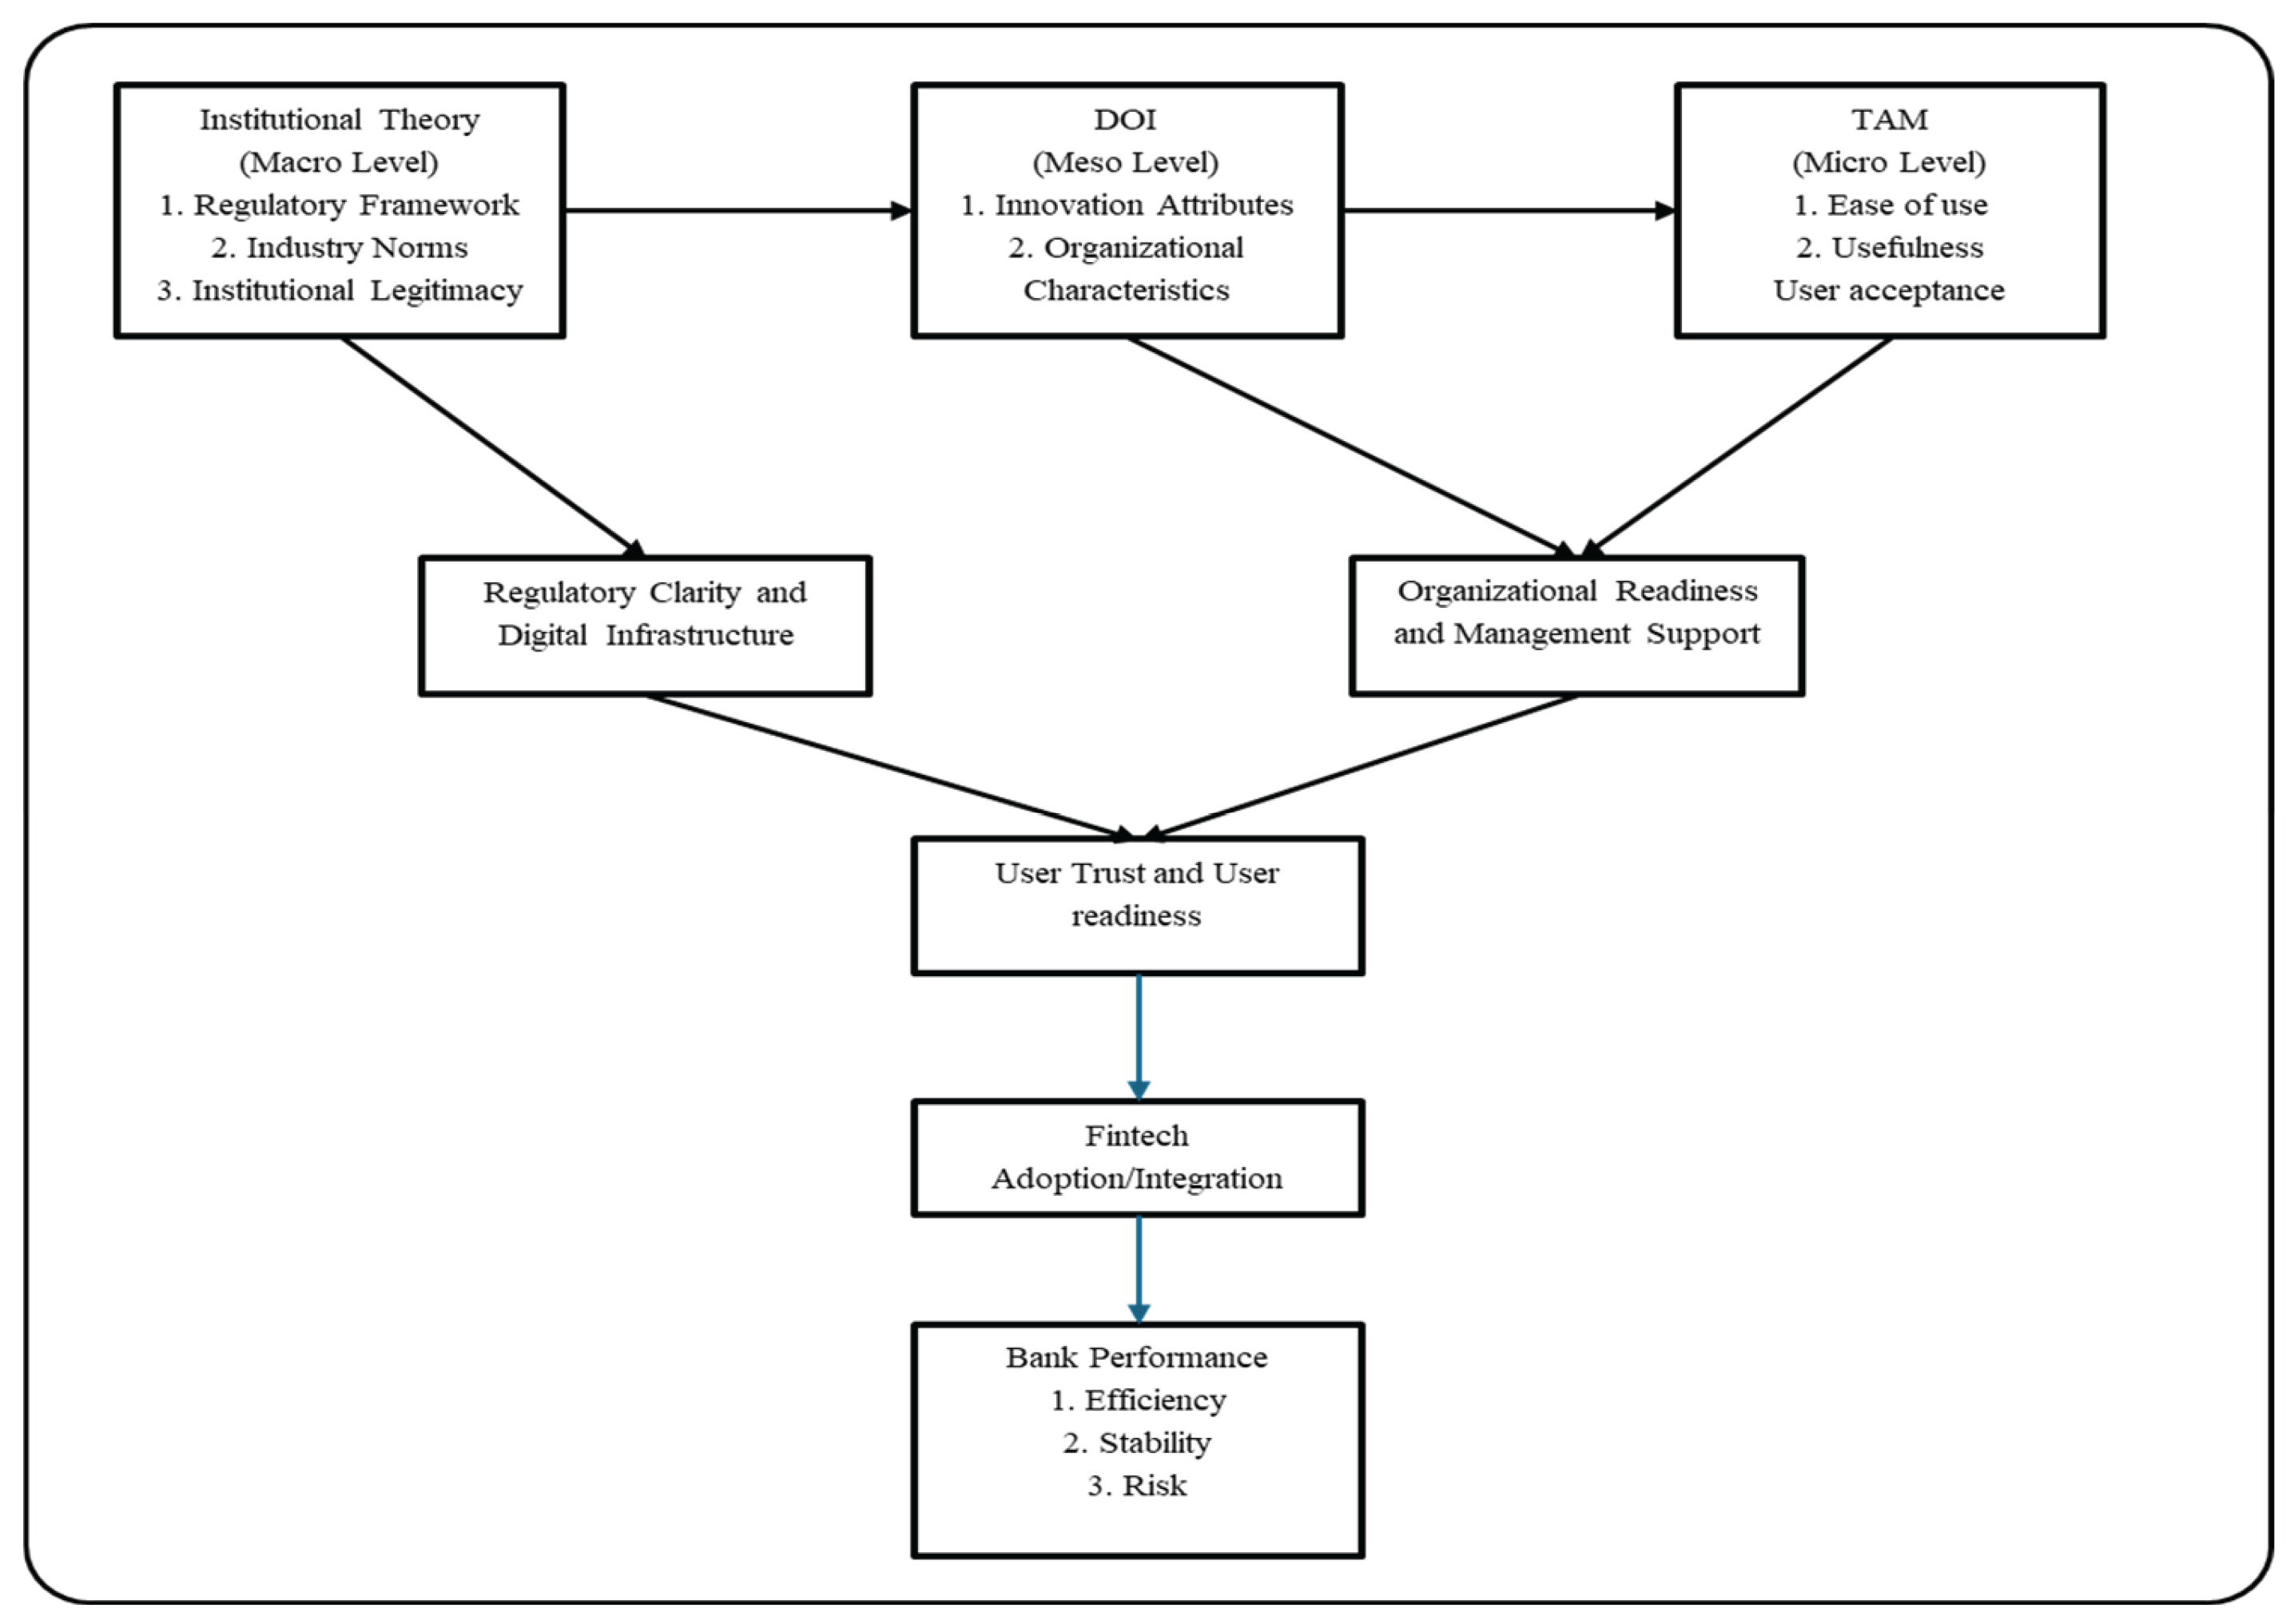
Several studies have examined the alignment of fintech adoption with prominent adoption theories, including the Institutional Theory, the Diffusion of Innovation (DOI), and the Technology Acceptance Model (TAM).
2.1.1. Institutional Theory
The Institutional Theory primarily emphasizes the role that formal and informal institutions can play in shaping an organization’s decision to adopt or reject new innovations in the pursuit of institutional legitimacy. Examples of these institutions include laws, regulatory frameworks, governmental bodies, industry norms, cultural factors, traditions, and religious beliefs [27]. In the context of fintech adoption, governments and regulatory bodies play a critical role. Without adequate institutional support, a bank, one of the most regulated and essential industries in any economy, cannot effectively integrate new technologies or services into its operations.
For example, China actively encourages banks and other financial institutions to adopt fintech innovations; however, in Bangladesh, it does not legally recognize cryptocurrency as a form of currency. Whether a country promotes or restricts the adoption of new technologies largely depends on its institutional support and regulatory framework. Regulatory frameworks are designed for economic benefits, which also applies to fintech. Fintech adoption and integration often result in greater operational efficiency, financial stability, and competitiveness. This relationship is well-documented in recent research. For instance, research such as [28] examined fintech adoption in China through the lens of regulatory governance. Their findings demonstrate that favorable institutional and regulatory conditions promote the adoption of fintech among banks, ultimately leading to significant improvements in organizational performance.
2.1.2. Diffusion of Innovation
The Diffusion of Innovation (DOI) theory provides a meso-level view that emphasizes firm-level decision-making. According to DOI, the adoption of technological innovation within firms is mainly influenced by two key factors: the features of the innovation itself and the traits of the adopting organization [3]. As mentioned earlier, fintech is one of the most transformative innovations of this century, reducing financial exclusion. In fact, by including previously unbanked populations, fintech enhances the efficiency of financial institutions. Additionally, since the financial sector is at the heart of this technological shift, DOI theory closely relates to fintech adoption as a means to improve institutional efficiency, especially in banking.
2.1.3. Technology Acceptance Model
The Technology Acceptance Model offers a micro-level perspective, focusing on individual user behavior and perceptions. TAM highlights two key concepts: perceived ease of use and perceived usefulness. The adoption of technology is ultimately driven by these factors, which influence a user’s attitude toward and intention to use it. When users see a new technology as both easy to use and more beneficial than existing systems, this alignment between user needs and technological capabilities often encourages organizations to adopt such innovations quickly. A similar trend can be seen in the banking industry, where the adoption of online and mobile banking—designed for ease of use and seamless integration with existing systems—illustrates how user perceptions accelerate fintech adoption. For instance, in online loans, the convenience of applying via digital platforms, fast application processes, and minimal paperwork all contribute to the perception of ease of use [29]. As a result, banks adopt fintech solutions not only to stay competitive but also to meet evolving customer expectations proactively.
2.2. Fintech Adoption and Bank Performance
2.2.1. Relationship Between Fintech Adoption and Risk
A bank’s main business is accepting short-term deposits from households and providing long-term loans to business owners. Spread interest is the primary source of income for banks. Since banks accept short-term deposits and offer long-term loans, they need to maintain sufficient liquid assets to meet customer demand and lend as much as possible to maximize earnings. Holding a large amount of idle cash costs banks money and allows them to make large, long-term loans, which increases the risk of liquidity shortages. Therefore, accurate predictions are essential for banks to maintain optimal cash levels and reduce risk. Research [30] found that fintech tools, such as AI-driven credit scoring, big data analytics, and alternative data sources, help depositors and borrowers assess risk more accurately. Fintech reduces manual errors and operational delays, making inter-bank transfer settlements faster and easier [31]. Real-time payments and cash flow tracking through fintech platforms help banks monitor liquidity and manage liabilities, significantly reducing their risk. Based on the above discussion, we can develop the following hypothesis:
H1.
Fintech adoption negatively affects bank liquidity risk.
Figure 1.
Conceptual Framework: Fintech Adoption and Bank Performance.
2.2.2. The Relationship Between Fintech Adoption and Efficiency
Fintech has emerged as a transformative force within the banking industry. Its adoption enhances bank efficiency in several ways. Fintech simplifies and streamlines routine and standardized tasks, making them more effective and less labor-intensive. For instance, loan applications, client onboarding, and compliance checks are usually time-consuming, but through fintech, they can now be completed online without physical involvement. These services can operate 24/7, removing time constraints and reducing operational costs, thereby boosting overall efficiency.
Moreover, fintech enhances financial performance by facilitating optimal liquidity management, reducing transaction costs, and streamlining processing times. Multiple studies highlight the efficiency gains linked to fintech. For example, Fang [32] demonstrates that fintech enhances traditional bank performance by increasing profits, reducing costs, and raising both interest and non-interest income. Similarly, [33] argues that fintech not only modernizes the banking sector but also allows banks to respond more effectively to market demands. The above discussion helps us to draw the following hypothesis.
H2.
Fintech adoption positively affects bank efficiency.
2.2.3. The Relationship Between Fintech Adoption and Stability
The integration of fintech into banking operations has also played a significant role in promoting financial stability. It enables better risk management, provides timely access to finance, supports regulatory compliance, and enhances resilience during crises. Advanced technologies, such as Artificial Intelligence (AI), Machine Learning (ML), and the Internet of Things (IoT), enhance fraud detection by monitoring live transactions, identifying anomalies, and facilitating quicker responses to potential threats [34].
Furthermore, fintech platforms such as online and mobile banking expand service access to underserved areas. This broader reach helps financial institutions diversify their portfolios, thus reducing exposure to systemic risk [35]. Fintech tools also support regulatory adherence through mechanisms such as Know Your Customer (KYC) protocols and Anti-Money Laundering (AML) practices, thereby reducing non-compliance risks and contributing to overall stability. Even during times of crisis, fintech allows banks to maintain uninterrupted operations through digital channels such as mobile wallets and online banking. Based on these observations, we propose the following hypothesis.
H3.
Fintech adoption positively affects bank stability.
3. Methodology
3.1. Model Selection and Variables
We propose the following empirical model to test three hypotheses:
Here, Risk, Profitability, and Efficiency are the dependent variables in Models 1, 2, and 3, respectively. The literature has shown that there is no perfect indicator of bank risk. Nevertheless, several proxies have been used in the current literature to measure bank risk, such as non-performing loans [36,37,38], provision for loan loss (PLL) [39,40], Leverage Ratio [41,42], and Capital Adequacy Ratio (CAR) [43,44]. For this research, we will use NPL and PLL as proxies for risk because NPL measures the proportion of loans that are not being collected from borrowers as agreed. A higher NPL ratio indicates greater credit risk. On the other hand, PLL measures the amount kept aside for expected loan losses as a proportion of total loans. High provisions can indicate greater perceived risk in the loan portfolio.
Efficiency is defined as the ratio of outputs to inputs within the firm. In the current literature, several proxies have been used as efficiency measures, for instance, the Cost to Income Ratio (CIR) [36,45,46], the Operating Expense to Operating Income (ETI) [47], and the Return on Equity (ROE) [48]. Current research employed CIR and efficiency ratio; the rationale for using these two variables is that CIR measures operational efficiency. A lower ratio indicates that the banks are managing their operating costs effectively. On the other side, a higher CIR ratio indicates banks have failed to maintain their operating efficiency. In the same way, efficiency (EFF) measures the cost of generating each additional unit of income. A higher EFF ratio signals better cost management and operational efficiency, as the bank can control costs while generating revenue.
A firm’s stability is its ability to meet its financial obligations. The prior study attempted to identify the actual measurements that indicate a tendency toward bankruptcy. However, some researchers measure stability in different ways. For example, the Z-score is a measure of stability, which is considered one of the effective determinants of bankruptcy [50]. Conversely, research also used the Solvency ratio as a proxy of stability [49]. The solvency ratio indicates whether the firm can fulfill its current financial obligations. It can be calculated as the immediate cash available over the immediate cash obligation. Therefore, this research also uses the Z-score and the solvency ratio as proxies for stability.
On the right side of Equations (1)–(3), we used the fintech index as the independent variable. Several methods are commonly employed in recent fintech research, including text mining [51,52], text disclosure analysis [53], and fintech component scoring [54]. However, when these methods extract fintech-related keywords from news, corporate reports, or online sources, a significant limitation of text mining is media-driven bias: institutions mentioned more frequently in fintech-related news may appear highly fintech-active, even when their actual adoption level is limited. This can result in systematic measurement errors.
Similarly, text disclosure analysis, which counts fintech-related keywords in annual reports, faces challenges from selective disclosure bias. Firms vary widely in how much they voluntarily disclose, and fintech terminology may be used inconsistently across banks and countries. Meanwhile, component-based indices are more structured and conceptually sound, but they rely heavily on the availability of detailed fintech indicators. In practice, many banks do not fully disclose key digital metrics, such as mobile banking user numbers, transaction volumes, and channel-specific usage data. Cross-country differences in disclosure standards further restrict comparability.
Given these limitations, this study develops a Weighted Scoring-based Fintech Adoption Index that is transparent, reproducible, and applicable across different banking systems. The index is structured around three key dimensions of fintech adoption: Digital Access, Digital Transaction Options, and Customer Interface. Within these dimensions, eight observable, publicly verifiable indicators were developed (see Table 1). Each indicator is assigned an equal weight. Based on the level of fintech adoption, each item is scored as 0.00 (no adoption), 0.50 (partial adoption), or 1.00 (full adoption).
The Fintech Adoption Index for banks is calculated using the following formula:
where FNT represents the fintech index of bank i at time t, Score refers to the score assigned to each indicator, and Weight is equally distributed across all indicators. Because all indicators are weighted equally, the relative weight remains constant over time.
3.1. Data Collection and Description
Initially, we planned to collect data from 104 local banks across nine Asian countries. However, due to data limitations, we could only obtain information for 92 banks. After addressing missing data for different banks across various years, our final sample included 85 banks, distributed as follows: China (16), South Korea (7), Japan (17), Malaysia (8), Vietnam (8), Thailand (6), Indonesia (8), Singapore (2), and India (13) over 11 years from 2014 to 2024. A list of the sample banks is included in the Appendix . All data were collected from the Bloomberg terminal.
In addition to the specific bank’s dataset, we included the natural logarithm of total assets and return on assets (ROA) as bank-specific control variables. At the country level, we used the percentage of internet users, domestic credit to the private sector by banks (as a percentage of GDP), and GDP growth as control variables.
For our analysis and comparison of selected Asian banks, we have divided all nine countries into three categories. Reg-1 included three developed countries: Japan, Korea, and Singapore. Next, we grouped Reg-2 across the three major Asian economies: China, India, and Indonesia. The remaining three emerging countries, Malaysia, Thailand, and Vietnam, have been termed as Reg-3. To make a robust analysis we used bot OLS and Random effect regression analysis in this research. This research employed statistical software STATA to run the regression.
Table 2 shows the descriptive statistics for all 89 banks across nine Asian countries. Throughout the research, we mainly used ratio analysis to compare banks across these countries; however, the values are reported in millions of local currencies. The fintech index has a mean of 0.837 and a standard deviation of 0.124, indicating moderate adoption among the sample banks. From the table, we also see that the NPL ratio is 2.230%, with a standard deviation of 2.622% and a minimum of 0.010%, while the average NPL is 1.024%. The standard deviation of 1.180% reflects banks’ expected loan losses. Efficiency ratios have a mean of 50.244 and a standard deviation of 14.055, suggesting significant variation in operational efficiency across banks. The mean cost-to-income ratio (CIR) is 1.418, with a standard deviation of 1.273, indicating heterogeneity in expense management.
The mean stability ratio (STB) is 2.484, with a standard deviation of 4.106, while the average Z-score is 4.931, with a standard deviation of 3.479, indicating variation in capitalization and risk-absorption capacity across banks. Total assets (log) have a mean of 4.177 and a standard deviation of 0.713. Return on assets (ROA) averages 0.808%, with a standard deviation of 0.743%, reflecting differences in profitability among banks. Digital infrastructure, measured as the percentage of internet users, has a mean of 68.85% and a standard deviation of 24.36, indicating moderate digital penetration across the sampled countries but significant differences among them. Domestic credit provided by private banks (DCPB) averages 105.718% of GDP (SD = 40.256), while GDP growth averages 3.923% (SD = 3.365), indicating that the banks in the countries examined are not homogeneous.
4. Findings and Discussion
4.1. Correlation Among Variables
Table 3 shows the correlation matrix among key banking indicators. Fintech adoption exhibits weak negative correlations with NPL (-0.022) and PLL (-0.007), suggesting that greater fintech adoption may help reduce credit risk. In terms of operational efficiency, fintech is also weakly negatively correlated with EFF (-0.124) and CIR (-0.064), indicating that fintech might lead to better efficiency and lower operational costs. Regarding bank stability, fintech shows a slight positive correlation with STB (0.118) and Z-score (0.044), suggesting that banks using fintech may be somewhat more stable and better capitalized, though the effects are minimal. Additionally, fintech is positively correlated with the log of total assets (0.255), showing that larger banks are more likely to adopt digital innovations. In contrast, the correlation with profitability (0.004) is negligible, pointing to a limited immediate impact on earnings.
Among the control variables, fintech adoption shows a moderately strong positive correlation with Internet penetration (0.439), highlighting the importance of digital infrastructure in spreading fintech. The correlations with domestic credit provided by private banks (0.038) and GDP growth (-0.137) are weak, indicating that fintech adoption is independent mainly of overall credit levels and might even grow during periods of slower economic growth, as banks invest in digital solutions.
On the other hand, PLL and NPL are highly positively correlated (0.660), indicating that higher loan loss provisions are strongly associated with higher non-performing loans, and vice versa. EFF and CIR also show a strong positive correlation (0.660), reflecting that banks with higher efficiency ratios tend to have proportionally higher operating costs relative to income, likely due to structural operational factors.
Bank size (Log of TA) shows moderate positive correlations with Z-score (0.277), suggesting that larger banks tend to be slightly better capitalized. Profitability is positively correlated with Z-score (0.342), indicating that more profitable banks are also more financially stable. Additionally, Internet penetration is also positively correlated with EFF (0.283) and CIR (0.299), indicating that better digital infrastructure is associated with higher operational activity and cost structures.
4.1. Regression Result
A total of 6 tables have been prepared to present the regression results. Table 4 and Table 5 examine the relationship between fintech and bank risk, while Table 6 and Table 7 examine the relationship between fintech and bank efficiency. Table 8 and Table 9 show the relationship between fintech and stability.
4.1.1. Fintech Adoption and Risk
Table 4 illustrates the relationship between fintech adoption and the risk level of selected banks in Asia. The regression results for non-performing loans indicate that fintech adoption significantly affects NPLs across Asian banks, although the direction and magnitude vary by region. For all selected Asian banks, the OLS model shows a strong negative relationship (β = -4.60, p < 0.01), suggesting that higher fintech adoption reduces NPLs, supporting the view that digital financial technologies enhance credit assessment, monitoring, and risk management. The results supported the current literature [55], which indicated that fintech reduces financial risk by improving borrower assessment and transaction reliability.
At the regional level, the effect varies. In Reg-1, fintech adoption is positively associated with NPLs (β = 1.8697, p < 0.01), suggesting that in highly developed digital banking markets, fintech expansion may initially increase lending risk, possibly due to aggressive credit extension strategies or experimental fintech products. These findings align with recent research [65], which concludes that in more mature or developed markets, fintech adoption may not always reduce risk (NPL). In Reg-2, fintech shows a substantial adverse effect (β = -5.3796, p < 0.01), highlighting its effective role in reducing credit risk in emerging markets. In Reg-3, the coefficient for fintech is negative but not statistically significant (β = -1.7914), suggesting a negligible impact in this region.
Random-effects models reinforce these findings. For all banks, fintech remains significantly negative (β = -1.8286, p < 0.01), confirming its overall risk-reducing effect. In Reg-1, the positive coefficient (β = 1.656, p < 0.01) aligns with the OLS result. Similarly, in Reg-2, fintech continues to reduce NPLs (β = -4.0403, p < 0.01), while in Reg-3, the effect is positive but not significant (β = 0.4844).
Control variables also affect NPLs. Total assets (TAA) are negatively associated with NPLs across all regions except Reg-3, suggesting that larger banks manage credit risk more effectively. ROA is negatively related to NPLs across all regions, indicating that more profitable banks tend to have fewer NPLs. Internet penetration slightly reduces NPLs, but this effect is only significant in OLS models. GDP growth has a limited impact, being significant only in Reg-3.
Table 5 examines the relationship between fintech adoption and PLL, a key risk component. For all selected Asian banks, fintech adoption has a strong negative relationship in both OLS (β = -2.0049, p < 0.01) and Random Effects models (β = -2.2983, p < 0.01), indicating that banks with higher fintech integration tend to hold lower provisions for expected loan losses, likely due to improved credit assessment and monitoring same findings presented by literature [56]
Regionally, the impact varies. In Reg-1, fintech adoption is negative but not significant, implying a limited effect in developed markets. In Reg-2, Fintech shows mixed results: OLS (β = 0.0838) and Random Effects (β = -0.5419, p < 0.05), suggesting moderate reductions in credit provisioning. In Reg-3, Fintech adoption is strongly negative and significant (OLS β = -2.2983, p < 0.01; RE β = -1.4174, p < 0.01), demonstrating that in emerging Southeast Asian markets, Fintech substantially enhances credit risk management; this conclusion is also supported by existing research [57].
Control variables further influence PLL. Total assets (TAA) are negatively related to PLL across regions except Reg-1, indicating that larger banks manage expected losses better. ROA is generally negative, though in some developed countries the relationship is reversed, reflecting more substantial income buffers and disciplined credit practices. Internet penetration moderately decreases PLL, but the difference is not significant. GDP growth is negatively related to PLL and statistically significant in Reg-2, but not in Reg-1 and Reg-3, highlighting the cyclical effects of economic expansion on provisioning.
Based on the above findings, we can conclude that fintech adoption generally helps reduce credit risk among selected Asian banks, as shown by lower non-performing loans (NPL) and provisions for loan losses (PLL). A similar conclusion [58] also highlights that greater digital integration tends to better manage credit exposures. This supports our alternative hypothesis. However, the impact varies by region; in developed markets [59], fintech adoption sometimes coincides with higher NPLs, possibly due to innovative lending strategies or experimental products. Similarly, studies [60] also indicate that fintech increases banks’ risk. Conversely, in emerging markets, it significantly reduces credit risk. Overall, fintech enhances credit assessment, monitoring, and provisioning, making banks more resilient to loan defaults, as recent studies [54] also suggest.
4.1.2. Fintech Adoption and Efficiency
Table 6 shows the relationship between fintech adoption and bank efficiency. Among selected Asian banks, fintech adoption has a strong impact on efficiency in the OLS model (β = 7.168, p < 0.05) and the Random Effects model (β = 2.3142); however, significance is only found in the OLS model. Regionally, the effects vary, as in [66]. In Reg-1, coefficients are large but not statistically significant (OLS β = 6.3876; RE β = 7.4675, p < 0.10), indicating a limited direct influence on efficiency. In Reg-2, fintech significantly lowers efficiency according to the OLS model (β = -10.7273, p < 0.01), which could reflect short-term operational disruptions or adjustment costs. In Reg-3, the OLS effect is negative and significant (β = -1.4174, p < 0.01), whereas the Random Effects model shows a negative but statistically non-significant relationship (β = -3.7359).
Among controls, NPL shows mixed effects on efficiency, significantly reducing it in Reg-1. PLL consistently has substantial adverse effects. Stability and Z-score negatively impact efficiency in Asia and Reg-2. TAA consistently improves efficiency, with large negative coefficients such as β = -6.6986 (p < 0.01) in Asia and β = -9.4176 (p < 0.01) in Reg-2. ROA strongly decreases efficiency across all regions (β = -10.646, p < 0.01 in Asia; β = -25.68, p < 0.01 in Reg-1).
Table 7 shows the link between fintech adoption and CIR. In Asia, fintech adoption significantly raises CIR in both OLS (β = 0.9348, p < 0.05) and Random Effects (β = 1.0131, p < 0.05), suggesting that digital initiatives might initially increase operating costs compared to income, as supported by Singh [67]. Regionally, in Reg-1, fintech has a positive but not significant effect (OLS β = 0.9139; RE β = 1.3383), indicating a minor impact on mature banking systems. In Reg-2, effects are small and not significant (OLS β = -0.4494; RE β = -0.0568). In Reg-3, fintech significantly lowers CIR (OLS β = -2.0976; RE β = -1.6745, p < 0.05), pointing to cost efficiencies in emerging markets, as noted in current research [68,69].
Control variables influence CIR as well. PLL negatively affects CIR. TAA and ROA consistently reduce CIR, indicating that larger, more profitable banks manage costs more efficiently. Internet penetration shows region-specific effects but is generally not significant.
Based on the findings regarding efficiency, we observed that the impact of fintech adoption on efficiency is mixed. Selected Asian banks can improve operational efficiency through digital technologies [61]. However, they may initially increase operating costs due to implementation and integration challenges [62]. The cost-to-income ratio (CIR) reflects these dynamics, with some regions experiencing higher costs during early adoption phases. Larger and more profitable banks seem better able to absorb these costs, maintaining efficiency gains, whereas smaller or emerging banks might face short-term disruptions. Overall, fintech adoption has limited potential to improve efficiency and cost management, contrary to [63]; therefore, these findings do not support our second hypothesis.
4.1.3. Fintech Adoption and Stability
Table 8 investigates the relationship between fintech adoption and bank stability. Regionally, effects are also heterogeneous. In Reg-1, fintech has a positive and significant impact in the Random Effects model (β = 2.0528, p < 0.01) but not in the OLS model (β = 1.5527), suggesting mixed results across developed markets. In Reg-2, OLS indicates a strong positive effect (β = 2.3473, p < 0.05), implying fintech adoption enhances stability in emerging markets. In Reg-3, fintech effects are mixed: adverse and significant under OLS (β = -11.7936, p < 0.05) but positive in Random Effects (β = 6.6921, p < 0.10).
Control variables reveal additional insights. Higher NPL reduces stability, while efficiency slightly decreases it in Asia (OLS β = 0.0403; RE β = -0.0791, p < 0.01). CIR positively relates to stability (OLS β = 0.3073, p < 0.05; RE β = 0.1587, p < 0.05), suggesting that better cost management supports stability. Internet penetration positively correlates with stability, highlighting the role of digital infrastructure.
Table 9 examines fintech adoption and Z-score, a key stability measure. For the Asian sample, fintech has a strong and significant effect under both OLS (β = 3.07, p < 0.01) and Random Effects (β = 2.2752, p < 0.01), suggesting that digital banking adoption enhances overall financial stability. Regionally, Reg-1 shows a positive effect in Random Effects (β = 2.0528, p < 0.01) but not in OLS (β = 1.5527), indicating mixed results in developed markets. Reg-2 results are mixed and not significant. In Reg-3, fintech is strongly positive in OLS (β = 8.7327, p < 0.01) but weak and not significant in Random Effects (β = 0.3491).
Among control variables, NPL and CIR reduce the Z-score, while ROA and TAA increase it across Asia. Internet penetration has a small positive effect, while domestic credit by private banks (DCPB) and GDP growth show mixed effects across regions.
Fintech adoption generally enhances bank stability and Z-score indicators, boosting overall financial resilience. In the nine selected countries, banks’ digital banking technologies help improve risk management, reduce costs, and increase capitalization, thereby supporting stability [64]. Regional effects differ between developed and emerging markets; in developed markets, the stability impact may be moderate or mixed due to mature systems, while in emerging markets, fintech adoption often significantly improves stability outcomes. This supports our third hypothesis.
Control factors such as profitability, size, and efficiency interact with fintech adoption to influence stability. Overall, the evidence suggests that digital transformation contributes positively to bank stability, although market context and bank-specific characteristics moderate its effect.
4.1.3. Endogeneity Test
Panel data require controlling for endogeneity to accurately analyze the impact of fintech adoption on banks’ risk, efficiency, and stability. It occurs when the independent variable is highly correlated with unobserved variables, resulting in biased and inconsistent regression estimates. Therefore, this study applies robust regression techniques (the S-estimator) following recent research [49] to address these issues.
Table 10 shows the endogeneity analysis; the results indicate that fintech reduces NPL, consistent with our findings. At the same time, fintech increases PLL, meaning banks enhance their loan-loss provisions as digital systems improve risk detection, which supports our conclusion for large economies. For efficiency, fintech has a strong positive effect, significantly raising EFF and lowering CIR, confirming a mixed impact on efficiency. Regarding stability, fintech negatively affects STB, indicating improved resilience, but its impact on Z-score is positive yet not significant. Overall, the findings demonstrate that fintech lowers risk, has no direct effect on efficiency, and somewhat enhances aspects of bank stability. This aligns with our detailed findings.
5. Conclusions and Policy Recommendation
Fintech is no longer just a buzzword; it has become a vital part of our everyday lives. The world is rapidly adopting fintech, a trend the banking industry closely follows. Driven by this change, this research aims to analyze how fintech adoption impacts banks’ risk, efficiency, and stability. To achieve this, the study gathered data from 85 local banks listed on major stock exchanges across nine Asian countries.
Bank risk was measured using Non-Performing Loans and Provision for Loan Losses. The results show that fintech adoption significantly reduces bank risk in certain Asian countries, particularly in larger economies such as China, India, and Indonesia, as well as in emerging markets such as Malaysia, Thailand, and Vietnam. However, in developed nations such as Japan, Korea, and Singapore, fintech adoption appears to increase bank risk. This indicates that in mature economies, fintech encourages greater competition, leading banks to lend more aggressively and, consequently, increasing NPLs, PLLs, and overall risk exposure.
Efficiency was assessed using both the efficiency ratio and the cost-to-income ratio. The regression results show mixed outcomes regarding the link between fintech adoption and bank efficiency. In Asia, fintech integration is positively associated with efficiency, suggesting that greater fintech adoption improves overall operational effectiveness, especially in developed countries where banks benefit from mature infrastructure. On the other hand, in large and emerging economies, fintech adoption negatively affects efficiency. This is likely due to the additional investments required for onboarding new clients and integrating fintech components, which increase operational costs. Additionally, lower financial literacy in these regions may further hinder bank efficiency.
Bank stability was evaluated using Z-scores and the Stability ratio. The link between fintech adoption and stability differs across countries. In Asia, stability ratios show a negative relationship, indicating that fintech adoption increases short-term cash obligations. Conversely, Z-scores in the same region indicate a positive relationship, suggesting improved overall stability. Similar trends appeared in both mature developed and emerging markets, although large economies showed the opposite effect. Overall, the results indicate that fintech integration improves risk management and stability but does not necessarily lead to efficiency gains.
Analyzing bank-specific variables, total assets show a negative link with risk and a positive link with both efficiency and stability. This suggests that larger banks tend to have lower risk while maintaining higher efficiency and stability. Similar patterns were observed with Return on Assets (ROA): banks with higher profitability exhibited lower financial risk, greater efficiency, and stability.
At the national level, internet penetration is linked to higher bank risk, while loans issued by private banks tend to have lower risk exposure. Both internet use and private bank lending positively influence efficiency and stability. Conversely, GDP growth does not seem to affect bank risk, efficiency, or stability directly.
Based on the findings of this study, several policy recommendations can be made to optimize the benefits of fintech adoption in the banking sector. First, regulators should encourage banks in large and emerging economies to adopt fintech gradually while ensuring robust risk management frameworks to prevent a rise in NPLs and PLLs. Second, central banks and financial authorities should implement guidelines that promote responsible lending practices in highly competitive, fintech-driven markets. Third, governments should invest in financial literacy programs, especially in emerging economies, to improve customer understanding and reduce inefficiencies associated with onboarding new fintech users. Fourth, policymakers should promote collaboration between fintech firms and traditional banks to foster innovation while sharing the associated risk. Seventh, internet infrastructure expansion and digital access policies should be aligned with banking regulations to maximize efficiency and stability gains without increasing risk exposure. Finally, governments and central banks should provide targeted support to smaller banks, enabling them to adopt fintech effectively and thereby enhance overall competitiveness and stability in the banking sector. This research covers only domestic banks; the results may not reflect those of foreign banks in the same region, which will be addressed in future research.
Author Contributions
Conceptualization, B.M.K and U.H.; Methodology, U.H; Formal analysis, U.H.; Writing original draft, B.M.K and U.H.; Writing—review & editing, B.M.K.; Supervision, B.M.K. All authors have read and agreed to the published version of the manuscript.
Funding
This research received no external funding, though one has received an APU subsidy for applying for the JSPS fund.
Data Availability Statement
The dataset is available upon request from the authors.
Conflicts of Interest
The authors declare no conflict of interest.
Appendix A. Selected Bank List
| Country | Banks | BBG Ticker |
| China | Ping An Bank | 000001 CH Equity |
| Bank of Ningbo | 002142 CH EQUITY | |
| Shanghai Pudong Development Bank (SPDB) | 600000 CH Equity | |
| Huaxia Bank | 600015 CH Equity | |
| China Merchants Bank (CMB) | 600036 CH Equity | |
| Jiangsu Bank | 600919 CH EQUITY | |
| China Industrial Bank | 601166 CH EQUITY | |
| Bank of Beijing | 601169 CH Equity | |
| Agricultural Bank of China (ABC) | 601288 CH Equity | |
| Bank of Communications (BoCom) | 601328 CH Equity | |
| China Everbright Bank | 601818 CH Equity | |
| China Construction Bank (CCB) | 601939 CH Equity | |
| Bank of China (BOC) | 601988 CH Equity | |
| China Guangfa Bank | 601993 CH EQUITY | |
| China CITIC Bank | 601998 CH Equity | |
| Industrial and Commercial Bank of China (ICBC) | 610398 CH EQUITY | |
| Indonesia | BCA (Bank Central Asia) | BBCA IJ Equity |
| Bank Negara Indonesia (BNI) | BBNI IJ Equity | |
| Bank Danamon | BDMN IJ Equity | |
| Bank Mandiri | BMRI IJ Equity | |
| Bank CIMB Niaga | BNGA IJ Equity | |
| Bank Permata | BNLI IJ Equity | |
| Panin Bank | PNBN IJ Equity | |
| Bank Rakyat Indonesia (BRI) | BBRI IJ Equity | |
| India | Axis Bank | AXSB IN Equity |
| Bank of Baroda | BOB IN Equity | |
| Canara Bank | CANBK IN Equity | |
| Federal Bank | FB IN Equity | |
| HDFC Bank | HDFCB IN Equity | |
| ICICI Bank | ICICIBC IN Equity | |
| IDBI Bank | IDBI IN Equity | |
| Indusind Bank | IIB IN Equity | |
| Indian Bank | INBK IN Equity | |
| Kotak Mahindra Bank | KMB IN Equity | |
| Punjab National Bank | PNB IN Equity | |
| RBL Bank | RBK IN Equity | |
| Yes Bank | YES IN Equity | |
| Japan | Shinsei Bank, Ltd. | 8303 JT Equity |
| MUFG Bank (Mitsubishi UFJ Financial Group) | 8306 JT Equity | |
| Resona Holdings, Inc. | 8308 JT Equity | |
| Tokyo Star Bank, Ltd. | 8309 JT Equity | |
| Sumitomo Mitsui Financial Group, Inc. | 8316 JT Equity | |
| Chiba Bank, Ltd. | 8331 JT Equity | |
| The Bank of Yokohama, Ltd. | 8332 JT Equity | |
| Gunma Bank, Ltd. | 8334 JT Equity | |
| Keiyo Bank, Ltd. | 8336 JT Equity | |
| Yamagata Bank, Ltd. | 8344 JT Equity | |
| Fukuoka Financial Group, Inc. | 8354 JT Equity | |
| Kinki Osaka Bank | 8360 JT Equity | |
| Hokuriku Bank | 8362 JT Equity | |
| The Shiga Bank, Ltd. | 8366 JT Equity | |
| The Seibu Shinkin Bank | 8368 JT Equity | |
| The San-in Godo Bank, Ltd. | 8381 JT Equity | |
| Mizuho Financial Group, Inc. | 8411 JT Equity | |
| Korea | NH Investment & Securities | 005940 KS Equity |
| Industrial Bank of Korea (IBK) | 024110 KS Equity | |
| Shinhan Bank | 055550 KS Equity | |
| Hana Bank (Hana Financial Group) | 086790 KS Equity | |
| Kookmin Bank (KB Financial Group) | 105560 KS Equity | |
| DGB Financial Group | 139130 KS Equity | |
| Woori Bank | 316140 KS Equity | |
| Malaysia | Alliance Bank Malaysia Berhad | ABMB MK Equity |
| Alliance Bank Malaysia Berhad | ABMB MK Equity | |
| Bank Islam Malaysia Berhad | BIMB MK Equity | |
| CIMB Group Holdings | CIMB MK Equity | |
| Hong Leong Bank | HLBK MK Equity | |
| Malayan Banking Berhad (Maybank) | MAY MK Equity | |
| Public Bank Berhad | PBK MK Equity | |
| RHB Bank Berhad | RHBBank MK Equity | |
| Singapore | DBS Group Holdings | DBS SP Equity |
| Oversea-Chinese Banking Corporation (OCBC) | OCBC SP Equity | |
| Thailand | Bank of Ayudhya (Krungsri) | BAY TB EQUITY |
| Bangkok Bank | BBL TB EQUITY | |
| Kasikornbank | KBANK TB EQUITY | |
| Krung Thai Bank | KTB TB EQUITY | |
| Siam Commercial Bank (SCB) | SCB TB EQUITY | |
| United Overseas Bank (Thailand) | UOBT TB EQUITY | |
| Vietnam | ACB (Asia Commercial Bank) | ACB VN EQUITY |
| BIDV (Bank for Investment and Development of Vietnam) | BID VN EQUITY | |
| VietinBank | CTG VN EQUITY | |
| MB Bank (Military Bank) | MBB VN EQUITY | |
| Shinhan Bank Vietnam | SHB VN EQUITY | |
| Sacombank | STB VN EQUITY | |
| Techcombank | TCB VN EQUITY | |
| Vietcombank (Vietnam Joint Stock Commercial Bank) | VCB VN EQUITY |
References
- Lagna, A.; Ravishankar, M.N. Making the world a better place with fintech research. Inf Syst J 2022, 32, 61–102. [Google Scholar] [CrossRef]
- Belanche, D.; Casaló, L.V.; Flavián, C. Artificial intelligence in FinTech: understanding robo-advisors adoption among customers. Ind Manag Data Syst 2019, 119, 1411–1430. [Google Scholar] [CrossRef]
- Uddin, H.; Barai, M.K. Will digital revolution be disruptive for inclusive finance in Bangladesh? The case of the microfinance industry. — 2022, 909–923.
- Appaya, S. Financial inclusion through digital innovation. J Bank Finance 2021, 45, 56–68. [Google Scholar]
- Gomber, P.; Kauffman, R.J.; Parker, C.; Weber, B.W. On the fintech revolution: interpreting the forces of innovation, disruption, and transformation in financial services. J Manage Inf Syst 2018, 35, 220–265. [Google Scholar] [CrossRef]
- Sahay, M.R.; von Allmen, M.U.E.; Lahreche, M.A.; Khera, P.; Ogawa, M.S.; Bazarbash, M.; Beaton, M.K. The promise of fintech: Financial inclusion in the post COVID-19 era. International Monetary Fund 2020.
- Arner, D.W.; Barberis, J.N.; Buckley, R.P. The emergence of RegTech 2.0: From know your customer to know your data. 2016.
- Philippon, T. The fintech opportunity. National Bureau of Economic Research, 2016. [Google Scholar]
- Lee, I.; Shin, Y.J. Fintech: Ecosystem, business models, investment decisions, and challenges. Business Horizons 2018, 61, 35–46. [Google Scholar] [CrossRef]
- Reuters. HSBC proposes privatization of Hang Seng Bank. Reuters 2025. 2025.
- S&P Global. Columbia Banking System acquires Pacific Premier Bank. S&P Global 2025.
- Finovate. Top fintech acquisitions of 2024. Finovate 2024.
- The Economic Times. Revolut invests $670M in India. Economic Times, 2025.
- FIS Global. FIS acquires Amount. FIS Global 2025.
- Euronews Next. Australia’s Volt Bank shuts down after failing to raise capital. Euronews, 2022.
- Elia, G.; Stefanelli, V.; Ferilli, G.B. Investigating the role of Fintech in the banking industry: what do we know? Eur J Innov Manag 2023, 26, 1365–1393. [Google Scholar] [CrossRef]
- Kayed, S.; Alta’any, M.; Meqbel, R.; Khatatbeh, I.N.; Mahafzah, A. Bank FinTech and bank performance: evidence from an emerging market. J Financ Report Account 2025, 23, 518–535. [Google Scholar] [CrossRef]
- Keliuotytė-Staniulėnienė, G.; Smolskytė, G. Possibilities for financial technology development and its impact on banking profitability in Lithuania. Econ Cult 2019, 16, 12–23. [Google Scholar] [CrossRef]
- Liu, F.H.; Thompson, B.S.; Harris, J.L. Financing forest restoration: green FinTech and nature-based solutions. Finance and Space 2025, 2, 159–187. [Google Scholar] [CrossRef]
- Lee, J.; Kim, S. FinTech adoption and bank performance: evidence from South Korea. J Bank Finance 2021, 130, 105–120. [Google Scholar]
- Dasilas, A.; Karanović, G. The impact of FinTech firms on bank performance: evidence from the UK. EuroMed journal of business. 2025, 20, 244–58. [Google Scholar] [CrossRef]
- Lee, I.; Shin, Y.J. FinTech: ecosystem and challenges. Business Horizons 2018, 61, 35–46. [Google Scholar] [CrossRef]
- CB Insights. Southeast Asia fintech investment drops. CB Insights, 2023. [Google Scholar]
- Dealroom. Fintech investment in Southeast Asia. Dealroom, 2023. [Google Scholar]
- Mordor Intelligence. India fintech market size. Mordor Intelligence, 2025. [Google Scholar]
- Pandey, D.K.; Hassan, M.K.; Kumari, V.; Zaied, Y.; Rai, V. Mapping FinTech in banking: a bibliometric review. Res Int Bus Finance 2024, 67, 102116. [Google Scholar] [CrossRef]
- Holmes, R.M.; Miller, T.; Hitt, M.A.; Salmador, M.P. Informal/formal institutions and FDI. J Manage 2013, 39, 531–566. [Google Scholar]
- Wang, R.; Liu, J.; Luo, H. Fintech development and bank risk taking in China. Eur J Finance 2021, 27, 397–418. [Google Scholar] [CrossRef]
- Trisanti, T. Analyze TAM influence on fintech lending. J Ekonomi dan Bisnis 2024, 18, 103–112. [Google Scholar] [CrossRef]
- Cornelli, G.; Frost, J.; Gambacorta, L.; Rau, R.; Wardrop, R.; Ziegler, T. Fintech and big tech credit: database. BIS Working Paper 2020, 887. [Google Scholar]
- Arner, D.W.; Barberis, J.; Buckey, R.P. FinTech, RegTech and financial regulation. Nw J Int’l L & Bus 2016, 37, 371. [Google Scholar]
- Fang, L.; Li, X.; Subrahmanyam, A.; Zhang, K. FinTech innovation and bank efficiency. SSRN 2023.
- Mohamed, et al. Fintech modernizes banking sector. — 2025.
- Kamal, A.; Ali, M.S.; Khan, M.M.S. Fintech and financial stability. Global Econ Review 2022, 7, 33–40. [Google Scholar] [CrossRef]
- Safiullah, M.; Paramati, S.R. FinTech firms and bank stability. Electron Commerce Res 2024, 24, 453–475. [Google Scholar] [CrossRef]
- Hasan, R.; Uddin, H.; Miah, M.D. Bank regulatory capital and risk/efficiency. Asian Rev Accounting 2025.
- Lv, S.; Du, Y.; Liu, Y. How do fintechs impact profitability? FinTech 2022, 1, 155–163. [Google Scholar] [CrossRef]
- Arnone, M.; Costantiello, A.; Leogrande, A.; Naqvi, S.; Magazzino, C. Financial innovation and NPLs. FinTech 2024, 3, 496–536. [Google Scholar] [CrossRef]
- Nguyen, P.D. Non-performing loans and profitability: Vietnam. Macroecon Finance Emerg Mark Econ 2025, 18, 399–419. [Google Scholar]
- Petrović, D.; Dasilas, A.; Karanović, G. Risk-adjusted efficiency index. J Risk Finance 2025, 26, 485–515. [Google Scholar] [CrossRef]
- Zhang, X.; Zhang, W.; Lee, C.C. Bank leverage and systemic risk. Int J Finance Econ 2025, 30, 1450–1474. [Google Scholar] [CrossRef]
- Acosta-Smith, J.; Grill, M.; Lang, J.H. Leverage ratio and stability. J Financ Stability 2024, 74, 100833. [Google Scholar] [CrossRef]
- Snobar, R.A.A.; Al Hanini, E.A. Capital adequacy and earnings quality. Int J Prof Bus Rev 2025, 10, 3. [Google Scholar]
- Miao, W.; Ma, Y.; Xu, H. Diminishing effect of capital adequacy. N Am J Econ Finance 2025, —, 102495.
- Ischak, S.A.; Maarif, M.S.; Hermadi, I.; Asikin, Z. Banking efficiency Indonesia. Economies 2024, 12. [Google Scholar]
- Tariku, T.; Mersha, D. Financial technology and profit efficiency. J Sci Technol Arts Res 2025, 14, 15–30. [Google Scholar]
- Buchory, H.A. Banking profitability determinants. J Finance Bank Review 2023, 8. [Google Scholar]
- Shi, X.; Yu, W. Risk management efficiency via PCA-DEA. Math Probl Eng 2021, 2021, 7306322. [Google Scholar] [CrossRef]
- Uddin, H.; Barai, M.K.; Uddin, H.; Barai, M.K. Impact of Capital Structure on Firm’s Efficiency and Stability: An Empirical Analysis of Manufacturing Firms. Global Business Review 2025. (accepted).
- Miah, M.D.; Uddin, H. Islamic vs conventional banks: efficiency & stability. Future Business J 2017, 3, 172–185. [Google Scholar]
- Pham, T.T.; Suleman, M.T.; Man, Y. FinTech adoption in global banking. SSRN 2025.
- Liu, Q.; Chan, K.-C.; Chimhundu, R. Fintech research mapping. Financial Innovation 2024, 10. [Google Scholar] [CrossRef]
- Kakinuma, Y. Text mining and index construction. SSRN 2024.
- Chand, S.A.; Singh, B.; Narayan, K.; Chand, A. FinTech and risk in small island states. J Risk Financ Manag 2025, 18, 366. [Google Scholar] [CrossRef]
- Wan, Q.; Cui, J. Fintech in agricultural supply chain. arXiv 2024. [Google Scholar]
- Wu, W.; Lin, X. Bank fintech and corporate debt. Int J Financ Stud 2025, 13, 68. [Google Scholar] [CrossRef]
- Deng, L.; Lv, Y.; Liu, Y.; Zhao, Y. Fintech and bank risk-taking in China. Risks 2021, 9, 99. [Google Scholar] [CrossRef]
- Al-Shari, H.A.; Lokhande, M.A. Risks of adopting FinTech. Cogent Bus Manag 2023, 10, 2174242. [Google Scholar] [CrossRef]
- Wang, Y.; Xiuping, S.; Zhang, Q. Can fintech improve bank efficiency? Res Int Bus Finance 2021, 55, 101338. [Google Scholar] [CrossRef]
- Elekdag, S.; Emrullahu, D.; Naceur, S.B. Does fintech increase bank risk taking? J Financ Stability 2025, 76, 101360. [Google Scholar] [CrossRef]
- Banna, H.; Hassan, M.K.; Bataineh, H. Bank efficiency and fintech inclusive finance. J Islamic Monet Econ Finance 2023, 9, 1–16. [Google Scholar] [CrossRef]
- Frost, J. Economic forces behind fintech adoption. Technol Revolution in Financial Services 2020, 838, 70–89. [Google Scholar]
- Verma, S.S.; Sreenu, N.; Kushwaha, G.S. FinTech and bank efficiency. J Innov Sustain RISUS 2025, 16, 94–106. [Google Scholar] [CrossRef]
- Pierri, M.N.; Timmer, M.Y. Tech before fintech and stability. IMF 2020.
- Elekdag, M.S.; Emrullahu, D.; Naceur, S.B. FinTech and risk taking. IMF 2024.
- Khan, H.H.; Kutan, A.M.; Qureshi, F. Fintech integration and bank efficiency. Finance Res Lett 2024, 67, 105772. [Google Scholar] [CrossRef]
- Singh, R.; Malik, G.; Jain, V. Impact of FinTech adoption on profitability. Int J Manage Pract 2021, 14, 411–427. [Google Scholar]
- Wang, L.; Zheng, Y.; Hu, J.; Deng, Q. Fintech and efficiency in joint-stock banks. Financial Eng Risk Manag 2023, 6, 157–161. [Google Scholar]
- Nguyen, T.T.T. Fintech and profitability/stability in emerging countries. J Organ Behav Res 2025, 10, 12–19. [Google Scholar] [CrossRef]

Table 1.
Fintech index questionnaire.
| Question | Dimensions | Score |
|---|---|---|
| 1. Does the bank have its own mobile banking app? | Digital Banking | 0 / 0.5 / 1 |
| 2. Does the bank offer online banking via a web portal? | Digital Banking | 0 / 0.5 / 1 |
| 3. Does the bank allow online account opening? | Digital Banking | 0 / 0.5 / 1 |
| 4. Does the bank accept online loan or credit applications? | Digital Banking | 0 / 0.5 / 1 |
| 5. Does the bank support digital wallets or contactless payments? | Digital Payments | 0 / 0.5 / 1 |
| 6. Does the bank offer instant or real-time payment services? | Digital Payments | 0 / 0.5 / 1 |
| 7. Does the bank use AI chatbots or digital assistants for customers? | Customer Interface | 0 / 0.5 / 1 |
| 8. Does the bank provide a personalized online analytics tool (e.g., spending insights, budgeting, investment tracking)? | Customer Interface | 0 / 0.5 / 1 |
Table 2.
Descriptive statistics.
| Variables | Obs. | Mean | Std Dev | Min | Max |
|---|---|---|---|---|---|
| Fintech | 935 | 0.837 | 0.124 | 0.556 | 0.938 |
| Non-Performing Loan Ratio | 935 | 2.230 | 2.622 | 0.010 | 27.470 |
| Provision of Loan Loss Ratio | 935 | 1.024 | 1.180 | 0.000 | 15.651 |
| Efficiency Ratio | 935 | 50.244 | 14.055 | 22.706 | 116.843 |
| Cost to Income Ratio | 935 | 1.418 | 1.273 | 0.364 | 15.464 |
| Stability Ratio | 935 | 2.484 | 4.106 | 0.008 | 36.757 |
| Z-Score | 935 | 4.931 | 3.479 | -2.974 | 16.342 |
| Total Assets | 935 | 4.177 | 0.713 | 2.496 | 6.022 |
| ROA | 935 | 0.808 | 0.743 | -6.839 | 3.735 |
| INTERNET | 935 | 68.850 | 24.363 | 13.500 | 98.021 |
| DCPB | 935 | 105.718 | 40.256 | 30.560 | 194.166 |
| GDP | 935 | 3.923 | 3.365 | -6.100 | 9.800 |
Table 3.
Correlation matrix.
| 1 | 2 | 3 | 4 | 5 | 6 | 7 | 8 | 9 | 10 | 11 | 12 | |
|---|---|---|---|---|---|---|---|---|---|---|---|---|
| 1. Fintech | 1.000 | |||||||||||
| 2. NPL | -0.022 | 1.000 | ||||||||||
| 3. PLL | -0.007 | 0.660 | 1.000 | |||||||||
| 4. EFF | -0.124 | -0.017 | -0.295 | 1.000 | ||||||||
| 5. CIR | -0.064 | -0.088 | -0.264 | 0.660 | 1.000 | |||||||
| 7. STB | 0.118 | -0.129 | 0.044 | -0.047 | 0.044 | 1.000 | ||||||
| 8. Z-Score | 0.044 | -0.365 | -0.290 | -0.267 | -0.201 | -0.016 | 1.000 | |||||
| 9. Log of TA | 0.255 | -0.151 | -0.167 | -0.280 | -0.138 | -0.032 | 0.277 | 1.000 | ||||
| 10. ROA | 0.004 | -0.417 | -0.323 | -0.381 | -0.270 | -0.036 | 0.342 | -0.058 | 1.000 | |||
| 11. INTERNET | 0.439 | -0.351 | -0.500 | 0.283 | 0.299 | 0.187 | 0.140 | 0.259 | -0.203 | 1.000 | ||
| 12. DCPB | 0.038 | 0.041 | 0.012 | 0.017 | 0.031 | -0.042 | 0.020 | -0.059 | -0.029 | 0.070 | 1.000 | |
| 13. GDP | -0.137 | 0.057 | 0.145 | -0.420 | -0.290 | -0.020 | 0.088 | 0.024 | 0.265 | -0.423 | -0.030 | 1.000 |
Table 4.
Non-Performing Loan Ratio (NPL) regression analysis.
| OLS | Random Effect | |||||||
|---|---|---|---|---|---|---|---|---|
| Variables | Asia | Reg-1 | Reg-2 | Reg-3 | Asia | Reg-1 | Reg-2 | Reg-3 |
| 1. FNT | -4.6008*** | 1.8697*** | -5.3796*** | -1.7914 | -1.8286*** | 1.656*** | -4.0403*** | 0.4844 |
| 2. EFF | -0.0198*** | -0.0093** | -0.0063 | 0.0538*** | -0.022*** | -0.0073** | 0.0304 | 0.0292*** |
| 3. CIR | -0.136* | 0.0166 | -0.3193 | -0.2773** | -0.0467 | 0.0055 | -0.2731 | -0.3271*** |
| 4. STB | -0.0576*** | -0.037*** | -0.4642*** | 0.0107 | -0.0436** | -0.0136** | -0.2738*** | -0.0114 |
| 5. ZSC | -0.1097*** | -0.0045 | -0.1676*** | -0.1142*** | 0.0137 | 0.0093 | -0.0336 | -0.0991** |
| 6. TAA | -0.488*** | -0.3886*** | -0.5829** | 1.5805*** | -0.9462*** | -0.3344*** | -1.2281*** | 1.1919*** |
| 7. ROA | -1.8676*** | -0.2926* | -2.2898*** | -0.0492 | -1.8779*** | -0.6928*** | -2.1102*** | -0.1495 |
| 8. INT | -0.0525*** | -0.0333*** | -0.0315** | -0.0254*** | -0.0057 | -0.0037 | -0.0045 | -0.0077 |
| 9. DCPB | 0.0014 | 0.0006 | 0.0007 | -0.0004 | 0.0032*** | -0.0001 | 0.0074** | -0.0009 |
| 10. GDP | -0.0063 | -0.0163 | 0.0013 | -0.0756*** | 0.0144 | 0.0154 | 0.004 | -0.0114 |
| 11. Constant | 14.1273*** | 5.5188*** | 15.0606*** | -1.9721 | 10.0974*** | 2.6973*** | 12.1323*** | -2.1694 |
| 12. R2 | 0.4709 | 0.5582 | 0.5641 | 0.4433 | 0.3114 | 0.4594 | 0.532 | 0.3916 |
| 13. Obs. | 850 | 260 | 370 | 220 | 850 | 260 | 370 | 220 |
Table 5.
provisions for loan loss Ratio (PLL) regression analysis.
| OLS | Random Effect | |||||||
| Variables | Asia | Reg-1 | Reg-2 | Reg-3 | Asia | Reg-1 | Reg-2 | Reg-3 |
| 1. FNT | -2.0049*** | -0.0536 | -5.3796*** | -1.7914 | -1.8286*** | 1.656*** | -4.0403*** | 0.4844 |
| 2. EFF | -0.0352*** | 0.004** | -0.0063 | 0.0538*** | -0.022*** | -0.0073** | 0.0304 | 0.0292*** |
| 3. CIR | -0.0286 | -0.0157* | -0.3193 | -0.2773** | -0.0467 | 0.0055 | -0.2731 | -0.3271*** |
| 4. STB | 0.0235*** | 0.0232*** | -0.4642*** | 0.0107 | -0.0436** | -0.0136** | -0.2738*** | -0.0114 |
| 5. ZSC | -0.0245*** | -0.0098* | -0.1676*** | -0.1142*** | 0.0137 | 0.0093 | -0.0336 | -0.0991** |
| 6. TAA | -0.3515*** | -0.0159 | -0.5829** | 1.5805*** | -0.9462*** | -0.3344*** | -1.2281*** | 1.1919*** |
| 7. ROA | -0.9021*** | 0.4255*** | -2.2898*** | -0.0492 | -1.8779*** | -0.6928*** | -2.1102*** | -0.1495 |
| 8. INT | -0.0304*** | -0.0019 | -0.0315** | -0.0254*** | -0.0057 | -0.0037 | -0.0045 | -0.0077 |
| 9. DCPB | 0.0003 | 0.0001 | 0.0007 | -0.0004 | 0.0032*** | -0.0001 | 0.0074** | -0.0009 |
| 10. GDP | -0.036*** | -0.0179** | 0.0013 | -0.0756*** | 0.0144 | 0.0154 | 0.004 | -0.0114 |
| 11. Constant | 8.6126*** | 0.0774 | 15.0606*** | -1.9721 | 10.0974*** | 2.6973*** | 12.1323*** | -2.1694 |
| 12. R2 | 0.6615 | 0.3866 | 0.5641 | 0.4433 | 0.3114 | 0.4594 | 0.532 | 0.3916 |
| 13. Obs. | 850 | 260 | 370 | 220 | 850 | 260 | 370 | 220 |
Table 6.
Efficiency Ratio (EFF) regression analysis.
| OLS | Random Effect | |||||||
| Variables | Asia | Reg-1 | Reg-2 | Reg-3 | Asia | Reg-1 | Reg-2 | Reg-3 |
| 1. FNT | 7.168** | 6.3876 | -5.3796*** | -1.7914 | -1.8286*** | 1.656*** | -4.0403*** | 0.4844 |
| 2. NPL | 0.306* | -2.5987** | -0.0063 | 0.0538*** | -0.022*** | -0.0073** | 0.0304 | 0.0292*** |
| 3. PLL | -6.8668*** | 3.178 | -0.3193 | -0.2773** | -0.0467 | 0.0055 | -0.2731 | -0.3271*** |
| 4. STB | -0.1494* | -0.0531 | -0.4642*** | 0.0107 | -0.0436** | -0.0136** | -0.2738*** | -0.0114 |
| 5. ZSC | -0.526*** | -0.2059 | -0.1676*** | -0.1142*** | 0.0137 | 0.0093 | -0.0336 | -0.0991** |
| 6. TAA | -6.6986*** | -3.186*** | -0.5829** | 1.5805*** | -0.9462*** | -0.3344*** | -1.2281*** | 1.1919*** |
| 7. ROA | -8.8905*** | -28.774*** | -2.2898*** | -0.0492 | -1.8779*** | -0.6928*** | -2.1102*** | -0.1495 |
| 8. INT | -0.0232 | 0.1797 | -0.0315** | -0.0254*** | -0.0057 | -0.0037 | -0.0045 | -0.0077 |
| 9. DCPB | -0.0034 | 0.0182 | 0.0007 | -0.0004 | 0.0032*** | -0.0001 | 0.0074** | -0.0009 |
| 10. GDP | -0.8774*** | 0.1165 | 0.0013 | -0.0756*** | 0.0144 | 0.0154 | 0.004 | -0.0114 |
| 11. Constant | 95.7577*** | 71.32*** | 15.0606*** | -1.9721 | 10.0974*** | 2.6973*** | 12.1323*** | -2.1694 |
| 12. R2 | 0.5588 | 0.485 | 0.5641 | 0.4433 | 0.3114 | 0.4594 | 0.532 | 0.3916 |
| 13. Obs | 850 | 260 | 370 | 220 | 850 | 260 | 370 | 220 |
Table 7.
Cost-to-Income Ratio (CIR) regression analysis.
| OLS | Random Effect | |||||||
| Variables | Asia | Reg-1 | Reg-2 | Reg-3 | Asia | Reg-1 | Reg-2 | Reg-3 |
| 1. FNT | 0.9348** | 0.9139 | -0.4494 | -2.0976 | 1.0131** | 1.3383 | -0.0568 | -1.6745** |
| 2. NPL | -0.0121 | 0.0149 | -0.0086 | 1.6474*** | -0.0041 | 0.0339 | -0.0052 | 0.0094 |
| 3. PLL | -0.4054*** | -0.4643 | -0.2043*** | -7.2221*** | -0.3602*** | -0.979** | -0.2586*** | -0.1681** |
| 4. STB | 0.0093 | 0.0285 | -0.097*** | 0.1756 | 0.0102 | 0.0478* | -0.1406*** | 0.0019 |
| 5. ZSC | -0.0617*** | -0.1066*** | -0.004 | -0.5544* | -0.0468** | -0.1102** | 0.0098 | -0.0263* |
| 6. TAA | -0.3357*** | -0.3818* | -0.4631*** | -9.2631*** | -0.3814*** | -0.3394 | -0.5302*** | -0.2996** |
| 7. ROA | -0.5386*** | -1.0877** | -0.3526*** | -12.9382*** | -0.538*** | -0.7132 | -0.4992*** | -0.4304*** |
| 8. INT | 0.0051* | 0.0511* | 0.0035 | -0.0341 | 0.0091*** | 0.0361 | 0.0077** | -0.0097** |
| 9. DCPB | 0.0006 | 0.0055* | -0.0013 | 0.0107* | 0.0006 | 0.0037 | -0.0014 | 0.0006 |
| 10. GDP | -0.0325** | -0.0089 | 0.0171 | 0.0217 | 0.0041 | 0.0014 | 0.0191 | 0.01 |
| 11. Constant | 3.1191*** | -0.7465 | 3.9479*** | 101.4455*** | 2.6953*** | 0.244 | 4.004*** | 4.5295*** |
| 12. R2 | 0.2895 | 0.0976 | 0.2039 | 0.553 | 0.2885 | 0.1241 | 0.2178 | 0.1942 |
| 13. Obs | 850 | 260 | 370 | 220 | 850 | 260 | 370 | 220 |
Table 8.
Stability Ratio (STB) regression analysis.
| OLS | Random Effect | |||||||
| Variables | Asia | Reg-1 | Reg-2 | Reg-3 | Asia | Reg-1 | Reg-2 | Reg-3 |
| 1. FNT | -0.563 | -0.1641 | 2.3473** | -11.7936*** | -1.2102 | -5.1755** | 0.2098 | 6.6921* |
| 2. NPL | -0.3651*** | -3.5169*** | -0.1362*** | -0.0237 | -0.061 | -2.1667*** | -0.0429 | -0.2336 |
| 3. PLL | 1.1313*** | 8.1576*** | -0.265*** | 1.2762** | -0.3804** | 4.7469*** | -0.4287*** | 0.5477 |
| 4. EFF | -0.0403** | -0.0332 | -0.1132*** | 0.0743* | -0.0791*** | -0.078** | -0.0735*** | 0.0732* |
| 5. CIR | 0.3073** | 0.2941* | 0.1561 | -0.223 | 0.1587** | 0.3362** | -0.1563* | 0.1521 |
| 6. TAA | -0.7348*** | -2.8406*** | -1.0401*** | -0.5535 | -0.4107 | -2.8355*** | -0.4174 | 0.5844 |
| 7. ROA | -0.0604 | -0.9704 | -1.2156*** | 0.1647 | -1.3907*** | -1.8764 | -1.3928*** | 1.1726 |
| 8. INT | 0.0599*** | 0.2568*** | 0.0453*** | -0.0552** | 0.021*** | 0.2869*** | 0.0228*** | 0.0734*** |
| 9. DCPB | -0.0057* | -0.0126 | -0.0014 | -0.0056 | -0.0036* | 0.0005 | -0.0031** | -0.0077** |
| 10. GDP | 0.084* | 0.3716** | 0.0045 | -0.0414 | 0.0105 | 0.2432** | 0.0081 | 0.0215 |
| 11. Constant | 3.3054 | -2.9226 | 9.331*** | 13.1655** | 9.2718*** | -1.6083 | 8.0279*** | -12.2125* |
| 12. R2 | 0.1165 | 0.5208 | 0.5364 | 0.1015 | 0.0955 | 0.5048 | 0.4582 | 0.184 |
| 13. Obs | 850 | 260 | 370 | 220 | 850 | 260 | 370 | 220 |
Table 9.
Z-Score (ZSC) regression analysis.
| OLS | Random Effect | |||||||
| Variables | Asia | Reg-1 | Reg-2 | Reg-3 | Asia | Reg-1 | Reg-2 | Reg-3 |
| 1. FNT | 3.07*** | 1.5527 | -3.2687* | 8.7327*** | 2.2752*** | 2.0528*** | 0.6646 | 0.3491 |
| 2. NPL | -0.2075*** | -0.0704 | -0.3271*** | -0.4955*** | 0.0696*** | 0.1504 | 0.0288 | -0.0095 |
| 3. PLL | -0.233 | -1.8911*** | 0.467** | -1.7005*** | 0.3476*** | -0.2276 | 0.4462*** | -0.0522 |
| 4. EFF | -0.0338*** | -0.0039 | -0.074** | -0.0225 | -0.0208*** | -0.008 | 0.0173 | -0.0242** |
| 5. CIR | -0.3147*** | -0.3277*** | 0.1372 | -0.4203 | 0.0281 | -0.04* | 0.0319 | 0.1148 |
| 6. TAA | 0.8694*** | -0.2402 | 1.1129*** | 3.8674*** | 0.485* | -0.0442 | 0.8827** | 0.2447 |
| 7. ROA | 0.944*** | 3.169*** | 1.5023*** | 0.476 | 1.7141*** | 5.1452*** | 1.7083*** | 2.0806*** |
| 8. INT | 0.0241*** | 0.1312*** | -0.017 | 0.0284 | 0.0075** | 0.0182 | -0.0047 | -0.0089 |
| 9. DCPB | 0.0039 | 0.0215*** | -0.0081* | 0.0011 | 0.0005 | 0.0009 | -0.0021 | 0.0015* |
| 10. GDP | 0.0146 | -0.0793 | 0.0659 | -0.1179** | 0.0327*** | 0.0065 | 0.0046 | 0.0541*** |
| 11. Constant | -0.7177 | -9.3167* | 5.3821 | -12.6824*** | -0.1395 | 0.0824 | -2.0846 | 3.2391 |
| 12. R2 | 0.275 | 0.1964 | 0.4013 | 0.4748 | 0.1053 | 0.1221 | 0.2059 | 0.115 |
| 13. Obs | 850 | 260 | 370 | 220 | 850 | 260 | 370 | 220 |
Table 10.
Results from S-estimator regression analysis.
| Risk | Efficiency | Stability | ||||
|---|---|---|---|---|---|---|
| NPL | PLL | EFF | CIR | STB | ZSC | |
| L_FNT | -0.6109* | 0.3523*** | 6.0647* | -0.1814** | -0.4042** | 1.4819 |
| NPL | -- | -- | 0.3383 | 0.011 | -0.0084** | -0.0678*** |
| PLL | -- | -- | -4.6025*** | -0.0237 | 0.0133 | -0.171*** |
| EFF | -0.0144*** | -0.0118*** | -- | -- | -0.0428* | -0.1221*** |
| CIR | 0.0141 | 0.0041 | -- | -- | 0.1278 | -0.8073* |
| STB | -0.0951* | 0.0881*** | -1.8822*** | -0.0333*** | -- | -- |
| ZSC | -0.0223* | -0.011** | -0.2876*** | -0.0055** | -- | -- |
| TAA | -0.2817*** | -0.0512* | -8.5472*** | -0.1815*** | 0.1593*** | 0.5329** |
| ROA | -0.1703** | -0.0382 | -5.7539*** | -0.0355* | 0.0491 | 0.9476 |
| INT | -0.0048 | -0.0173*** | 0.0381 | 0.0018*** | 0.0101*** | 0.0053 |
| DCPB | -0.0017* | -0.0007 | -0.015** | 0 | -0.0005 | 0.0059*** |
| GDP | 0.0093 | 0.0033 | -0.5332*** | -0.0006 | 0.0157* | -0.0053 |
| _cons | 4.8988*** | 2.4445*** | 103.7104*** | 1.7704*** | -0.0271 | 5.6246*** |
Disclaimer/Publisher’s Note: The statements, opinions and data contained in all publications are solely those of the individual author(s) and contributor(s) and not of MDPI and/or the editor(s). MDPI and/or the editor(s) disclaim responsibility for any injury to people or property resulting from any ideas, methods, instructions or products referred to in the content. |
© 2025 by the authors. Licensee MDPI, Basel, Switzerland. This article is an open access article distributed under the terms and conditions of the Creative Commons Attribution (CC BY) license (http://creativecommons.org/licenses/by/4.0/).
Copyright: This open access article is published under a Creative Commons CC BY 4.0 license, which permit the free download, distribution, and reuse, provided that the author and preprint are cited in any reuse.


