
Submitted:
25 November 2025
Posted:
28 November 2025
You are already at the latest version
Abstract
Cassava plants’ response to waterlogging must be monitored in an accurate and timely manner to mitigate the adverse effects of waterlogging stress. Under waterlogging conditions, root hypoxia reduces water uptake and stomatal closure limits transpiration, which often results in increased leaf temperature due to reduced evaporative cooling. However, how this relationship changes in cassava leaves under waterlogged conditions remains poorly known. This study hypothesized that a cooler canopy is more critical for better performance under waterlogging stress in various cassava genotypes. Two cassava cultivars were subjected to twelve days of waterlogging. Results revealed a significant decrease in photosynthetic rate, stomatal conductance, and transpiration, and an increase in leaf temperature and ΔT, reflecting impaired stomatal regulation and reduced evaporative cooling. Strong negative correlations between ΔT and photosynthetic parameters were observed presenting ΔT as a reliable, nondestructive indicator of cassava’s physiological responses under hypoxic conditions. Findings indicate that maintaining cooler canopies may contribute to enhanced tolerance and survival under waterlogging. ΔT can be used as a practical screening tool for identifying and selecting waterlogging-tolerant cassava genotypes. However, further studies involving contrasting cultivars and additional parameters such as leaf relative water content, and leaf anatomy are recommended to validate and strengthen reported findings.
Keywords:
leaf temperature
; waterlogging stress
; cassava
; stomatal conductance
; photosynthesis
; genotypic tolerance
1. Introduction
A substantial gap separates current food production from the quantity required to feed the global population in 2050 [1]. Feeding an estimated 10–11 billion people by 2050 with shrinking natural resources, particularly land, is one of the greatest challenges facing humanity [2]. In sub-Saharan Africa, the population is projected to increase by >120%. Within this region, cassava (Manihot esculenta) is the second most important source of calories, providing ~30% of the daily dietary energy per person. Because of its starchy roots, cassava is widely used for starch extraction, animal feed, and feedstock production in China and other Southeast Asian countries [3]. Cassava is typically grown as an upland crop with a long maturation period of 8-12 months, which often overlaps with the rainy season. However, in West and central Africa, it is preferred for inland valleys during the dry season, where it benefits from residual soil moisture [4]. Inland valleys, as described by Andriesse, L. Ofresco [5], comprise the upper reaches of river systems, including valley bottoms, their hydromorphic fringes, and adjacent upland slopes. Because these valleys offer better water availability throughout the growing season compared to the surrounding uplands, they hold strong potential for intensified and sustainable land use [6].
Climate change is exerting a serious toll on human life, largely due to human activities [1]. To date, global mean surface temperature (GMST) has risen by ~1 °C and, if current warming trends persist, is projected to increase by 1.5 °C by 2050 and by 2 °C by the end of the 21st century [7]. These changes are expected to intensify the frequency of extreme climatic events, such as floods, drought, hailstorms, salinity, and heat stress (More, V Ravi [1].
Among these stresses, waterlogging stress poses a particular threat. Once soils become saturated, root and microbial activity rapidly deplete oxygen in the rhizosphere [8]. Under anaerobic conditions, plants undergo various survival responses, including changes in physiology, anatomy, and morphology to adapt to the anoxic environment (Koslowski and Pallardy [9,10]). Waterlogging alters plant water relations and carbon fixation at the physiological level. Leaf water content, which depends on root uptake capacity and leaf transpiration, is affected by such stress. Setter, Waters [11] indicated that waterlogging leads to a reduction in plant water content mainly due to the inhibition of root water uptake resulting from oxygen deprivation. A reduction in leaf water content frequently influences physiological and metabolic processes within the leaf (Popescu and Popescu [12]. Leaf water deficit primarily influences stomatal aperture, leading to reduced transpiration and gas exchange. Consequently, reduction in photosynthesis and transpiration rates associated with decreased leaf water content have been documented across several crop species, such as sorghum [13], maize [14], olives [15], and hibiscus [16].
Our previous investigation demonstrated an 82.6% decline in a net photosynthetic rate (Pn), which was associated with a 96.7% reduction in stomatal conductance (gs) and a 21% decrease in transpiration rate (E). In three-month-old cassava plants, Pn, gs, and E exhibited progressive reductions with increasing durations of waterlogging, whereas the soil plant analysis development (SPAD) value did not exhibit any significant differences compared to the control across all Observations periods. Conversely, the variable to maximum fluorescence ratio (Fv/Fm) exhibited a significant decline three days following treatment, after which a recovery phase was observed. This observation is likely due to light deexcitation rather than chlorophyll degradation, as SPAD values remained unchanged, indicating no chlorophyll breakdown or photoreceptor damage under waterlogging [17]. We concluded that cassava demonstrates a functional stay-green phenotype characterized by stable SPAD values, photosynthetic nitrogen use efficiency, and both stomatal and nonstomatal limitations that regulate photosynthesis under waterlogging [17]. Therefore, precise and timely monitoring of plant responses to waterlogging is essential to alleviate its detrimental impacts, particularly on cassava production [13]. Blum, Mayer [18] assessed canopy temperature in wheat and identified a strong correlation between canopy temperature and leaf water content. Leaf temperature is strongly associated with plant water status, as it is regulated by water loss through transpiration [19]. Under water deficit conditions, alterations in leaf water content and transpiration are often indirectly manifested through variations in leaf temperature (Leopold, Sun [20]. Although a correlation exits between leaf water content and temperature, leaf temperature is additionally influenced by both transpiration rate and ambient air temperature [21]. Hence, the temperature differential between the leaf temperature and the surrounding air (ΔT) may serve as a more precise indicator of leaf water status than leaf temperature alone [22]. Elevated transpiration rates coupled with reduced stomatal conductance contribute to lower leaf temperatures [19], thereby resulting in a greater ΔT [23]. Thus, ΔT has been extensively employed as a tool for monitoring leaf gas exchange and water status. Wang, Zhang [13] further demonstrated that waterlogging reduces leaf relative water content (RWC), free water content, and leaf gas exchange parameters, while also inducing anatomical modifications, all of which are associated changes in leaf temperatures and ΔT. These results indicate that ΔT may serve as a reliable indicator of plant water status and photosynthetic adjustments under waterlogging. According to Pineda, Barón [24] increases in leaf temperatures may results from stomatal closure , which represents a nonspecific plant defense response to both abiotic and biotic stresses. Temperatures elevations may also arise from a reduced capacity for water evaporation or from vegetation that indeed, temperature raises may be due to stomatal closure, which is on its own an unspecific mechanism of plant defense against both abiotic and vegetation loss [25].Consequently, abiotic stressors such as drought, soil salinity, or extreme ambient temperatures have been reported to elevate canopy temperature [24], a consideration of particular importance under natural conditions where such stressors are difficult to quantify or mitigate.
Moreover, leaf temperature measurement has been suggested as a cost-effective, indirect criterion for selecting plant genotypes with resistance to drought [19] and heat stress. However, its application to cassava, particularly under waterlogging conditions, remains unknown. Leaf temperature is indirectly associated with stomatal conductance and carbon exchange [26], and photosynthetic activity is influenced by elevated leaf temperature, either alone or in conjunction with drought, as a result of reduced stomatal conductance (Pradhan, Aher [27]. Furthermore, under suboptimal soil water conditions, higher ΔT and crop yield have been linked to increased stomatal conductance and enhanced water use efficiency [28].
In over-research, major crops and cereals, the relationship between leaf temperature changes and photosynthetic performance has been studied. However, these relationship changes remain poorly unknown in under-researched cassava crops, especially in clarifying the anaerobic response under waterlogged conditions. The objectives of this study were to: 1) evaluate changes in leaf gas exchange, photosynthetic performance, and growth parameters in cassava during the early growth stage under waterlogging; 2) determine the relationship between leaf temperature, ΔT and gas exchange parameters in cassava; 3) elucidate the effects of waterlogging stress on leaf temperature and test the hypothesis that maintaining cooler canopy is essential for improved performance of different cassava genotypes under waterlogging stress. Plants exhibiting cooler canopies are able to more effectively regulate stomatal conductance, resulting in lower leaf temperatures to ambient conditions (Ginkel, MV [29]. Timely and precise monitoring of cassava leaf temperature, ΔT, and leaf gas exchange parameters can facilitate the development of strategies to mitigate waterlogging stress. This study aims to establish a novel approach for identifying waterlogging-tolerant genotypes to support future breeding programs. Aligning our findings to similar studies online, although in different crops (Sorghum) [13] and stress (Drought) [19] act to reinforce ΔT utility as a nondestructive indicator of stress (waterlogging) response. The proposal of this index (ΔT) will enable a wide range of future research.
2. Materials and Methods
2.1. Study Site, and Plant Materials
The study was done in a greenhouse at Kagoshima University, Faculty of Agriculture. The average daily temperature and humidity during the experimental period were 28.04 °C and 81.56%, respectively. Two cassava cultivars (Tokunoshima-white and Tokunoshima-yellow) were used; the two cassava cultivars were sourced from cassava grown at Kizuna farm in Tokunoshima, Kagoshima prefecture[30]. From the peer-reviewed literature, IAC-576-70, Brazalian cultivar developed for high starch content by Agricultural Institute of Campinas (IAC), state of Sao Paulo, Brazil was introduced to Kagoshima to provide for use in biomass production in temperate regions, later renamed Tokunoshima Brazil [31]. Also, TME-7 cassava variety with low levels of cyanogenic glycosides was introduced from the International Institute of Tropical Agriculture (IITA), Nigeria renamed Tokunoshima native. Tokunoshima native has been cultivated in Tokunoshima for a long time [32], while Tokunoshima Brazil introduced from Brazil. However, the exact circumstances, timing of their introduction and botanist who identified those cassava plants are unknown. The names of these two cassava cultivars (Tokunoshima-white and Tokunoshima-yellow) used in this study were given by local producers at Kizuna farm, and their origin were assumed to be from those introduced cassava line from Brazil and Nigeria. Those cultivars were introduced as scion to Ibusuki Botanical experimental station, attached to the faculty of Agriculture, Kagoshima University (Ibusuki City, Kagoshima prefecture) in 2008, and have been cultivated in the field and greenhouse [31].
2.2. Experimental Design
Cassava stem cuttings (20 cm in length) were obtained from freshly harvested plants and immersed in a Hyponica nutrient solution for 24 h to enhance shoot and root development. The treated cuttings were subsequently planted in small polythene bag containing sawdust as the propagation medium. After a 60-day growth period, six seedlings each per polyethene bag and per cultivar were selected based on their SPAD values and transplanted into small buckets containing a soil mixture of loam and sand in a 4:1 ratio (v/v). The transplanted seedlings were acclimatized for two weeks before the initiation of treatments.
A total of twelve buckets containing uniform cassava seedlings were selected for the experiment. Six buckets per cultivar were maintained under well-watered (WW) conditions by daily irrigation to field capacity with free drainage (control treatment), whereas the remaining six buckets were subjected to waterlogging (WL) by sealing the drainage holes and maintaining a water level of 3-5 cm above the soil surface. The treatments were applied for a period of 12 days. The experiment was arranged in a completely randomized design (CRD) with three replicates.
2.3. Data Collection
2.3.1. Microclimate Data
The microclimate data, including average daily air temperature and relative humidity, as well as soil temperature and moisture content, were monitored using a sensor (5TE, METER Group Inc., USA) equipped with a data logger (RTR-503, T&D Corporation, Japan). The average daily air temperature and relative humidity were used to calculate air vapor pressure deficit (VPDair), which varied between 1.42 and 3.19 kPa (average 2.39 kPa).
2.3.2. Leaf gas Exchange Parameters
A portable gas exchange system (LI- 6,400XT Inc., Lincoln, NE, USA) was used for measuring Leaf gas exchange parameters, such as Pn, E, gs, and intercellular CO2 concentration (Ci), and leaf temperatures. Measurements were taken from the central leaflet of the youngest fully expanded leaf on one plant/replicate (n = 1) at 75 days after planting (DAP). Prior to dat collection, leaves were acclimated to a saturating light intensity of 1,500 µmol m−2 s−1 and a CO2 concentration of 400 µmol mol−1 inside the cuvette until steady states for Pn and gs were obtained. The block temperature was maintained to 28 °C, with a vapor pressure deficit (VPD) corresponding to an airflow rate of 500 µmol s−1.Values of gs and Ci were obtained from the data points collected at 400 µ mol−1 (CO2). Photosynthetic water-use efficiency (PWUE) was calculated by dividing Pn by E at this same CO2 concentration, while ΔT was calculated according to Jones [33], using the following formula:
ΔT = Leaf Temperature − Air Temperature
Leaf gas exchange parameters and leaf temperature were measured before treatment (0 DAT), then periodically at four-day intervals (4, 8, and 12 DAT) on the same plant leaves per replicate on a clear day between 8:00 and 11:00 AM.
2.3.3. Fv/Fm Measurement
AquaPen (AP 100-P, Photon Systems Instruments, Czech Republic) was used to measured Fv/Fm under dark adaptive conditions on fully developed leaves. Fv/Fm ratio, which is the maximum yield of PSII photochemistry, was obtained by applying actinic light through the instrument’s quantum yield protocol. Chlorophyll fluorescence measurements were carried out concurrently with leaf gas exchange assessments. Three replicates per treatment were used for Fv/Fm data collection. Fv/Fm were collected from three biological replicates per treatment at 0, 4, 8, and 12 DAT on the same plant leaves per replicate per treatment.
2.3.4. Soil Plant Analysis Development (SPAD)
A SPAD meter (SPAD502; Konica Minolta) was utilized to record the SPAD values from three plants per treatment on the same day as the leaf gas exchange assessment. SPAD values were recorded at three consecutive positions along the leaf of the youngest fully expanded leaf of each plant. The same leaves used for chlorophyll fluorescence measurements were used for SPAD value measurement. SPAD values were measured at 0, 4, 8, and 12 DAT on the same plant leaves per replicate per treatment.
2.3.5. Morphological Data
Morphological data, including plant height, number of leaves per plant, and number of branches per plant, were counted. Plant height was measured from the base of the stem to the highest point of a shoot using a tape measure. The number of leaves per plant and branches was counted manually per plant for each treatment. These morphological data were collected at 0, 4, 8, and 12 DAT on the same plant per replicate per treatment.
2.4. Statistical Analyses
An analysis of variance (ANOVA) was conducted with IBM SPSS Statistics (Version 30.0.0.0 [172]) using a univariate analysis of variance to determine single and interaction effects of the treatment day interval (treatment duration) (D0–12) and treatment (WW and WL). The mean results of replicates per treatment were compared using Turkey’s HSD test at p < 0.05. Pearson’s correlation matrix analysis was conducted to test correlations between parameters using the multi-environment trial analysis package (Metan) V1,19.0 in R version 4.4.0. All results are presented as means of three replicates ± standard deviation.
3. Results
3.1. Growth Environments, Average Daily Temperature, Daily Percentage of Relative Humidity, Soil Temperature, and Daily Soil Moisture Content, with Bulk Electric Conductivity
The temperature and relative humidity ranged from 20 °C to 31.51 °C and 56.0–97.0%, with an average of 28.0 °C and 81.6%, respectively, during the experimental period (Figure 1a). The average soil temperature for Tokunoshima-yellow cultivar buckets under WW and WL conditions was 20.7 –30.0 °C and 20.5 –29.8 °C, with averages of 26.8 °C and 26.8 °C, respectively. Meanwhile, the average soil temperature for Tokunoshima-white cultivar buckets under WW and WL conditions was 20.8 –30.4 °C and 21 –30.6 °C, with averages of 27.1 °C and 27.4 °C, respectively. The percentage difference between the WW and WL treatment buckets was 1.3% for the Tokunoshima-white cultivar and −0.01% for the Tokunoshima-yellow cultivar (Figure 1b).
The average soil moisture content for the Tokunoshima-yellow cultivar under WW and WL conditions was 0.15–0.30 and 0.19–0.30 m3/m, with averages of 0.22 and 0.26 m3/m3, respectively. The average soil moisture content for the Tokunoshima-white cultivar under WW and WL conditions was 0.15–0.30 and 0.19–0.30 m3/m3, with averages of 0.22 and 0.29 m3/m3, respectively. The percentage differences between the WW and WL buckets were 24.14% for the Tokunoshima-yellow cultivar and 10.34% for the Tokunoshima-white cultivar (Figure 1c).

Table 1.
ANOVA results of the effect of waterlogging duration on morphological traits (plant height, number of branches, and number of leaves), photosynthetic traits (SPAD and Fv/Fm), and leaf gas exchange parameters (Pn, gs, E, Ci, and PWUE) of cassava cultivars at the early growth stage.
Table 1.
ANOVA results of the effect of waterlogging duration on morphological traits (plant height, number of branches, and number of leaves), photosynthetic traits (SPAD and Fv/Fm), and leaf gas exchange parameters (Pn, gs, E, Ci, and PWUE) of cassava cultivars at the early growth stage.
| Parameters | Cultivars (C) | Treatment (Trt) | Treatment duration (TrtD) | C x Trt | TrtD x Trt |
|---|---|---|---|---|---|
| Plant height | ns | *** | ns | ns | ** |
| Number of leaves | * | *** | ns | ns | ** |
| Number of branches | ns | ns | * | ns | ns |
| SPAD Value | *** | * | ** | ns | ns |
| Fv/Fm Values | ns | *** | * | ns | * |
| Photosynthetic rate | ns | *** | *** | ns | *** |
| Stomatal conductance | ns | *** | *** | ns | *** |
| Transpiration rate | ns | *** | *** | ns | ** |
| Intercellular CO2 concentration | ns | ns | * | ns | ** |
| PWUE | ns | ns | ** | ns | *** |
| Leaf temperature | ns | *** | *** | ns | ** |
| ΔT | ns | *** | *** | ns | ** |
Note * p < 0.05, **p < 0.01, ***p < 0.001, ns, not significant.
3.2. Effect of Waterlogging Treatment on Leaf Temperature and ΔT
The effects of waterlogging on leaf temperature and ΔT are presented in Figure 2a and b. The waterlogging treatment and waterlogging duration significantly affected leaf temperature and ΔT (p< 0.001); the interaction of treatment and waterlogging duration also significantly affected leaf temperature and ΔT (p< 0.01) (Table 1). Meanwhile, no significant difference was observed between the two cassava cultivars (Table 1). The leaf temperature of the two cassava cultivars increased immediately under waterlogging treatment at 4, 8, and 12 DAT compared to the WW condition (Figure 2a). The same trend was observed for ΔT in the two cassava cultivars (Figure 2b). The average leaf temperature increased by 27.2%, 14.7%, and 24.0% in the Tokunoshima-white cultivar and 27.5%, 10.2%, and 15.3% in the Tokunoshima-yellow cultivar under WL conditions at 4, 8, and 12 DAT, respectively (Figure 2a). The average ΔT value increased by 3.2%, 1.7%, and 2.1% in the Tokunoshima-yellow cultivar and 4.0%, 2.2%, and 3.6% in the Tokunoshima-white cultivar at 4, 8, and 12 DAT compared to WW conditions (Figure 2b). Additionally, the effects of leaf temperature and ΔT on cassava cultivars increased under WL conditions with the duration of treatment (Figure 2a, b).
3.3. Effect of Waterlogging on Photosynthetic Traits (Pn, E, gs, and PWUE)
The immediate effects of waterlogging on the photosynthetic traits, Pn, E, gs, Ci, and PWUE, of the two cassava cultivars at the early growth stage are presented in Figure 3a–e. The Pn values of the two waterlogged cultivars displayed significant differences between treatment durations (p < 0.001), treatment (p < 0.001), and the interaction between TrtD and waterlogging (p < 0.001) (Table 1). However, the two cultivars did not differ between treatments (Table 1, Figure 3a). The Pn values of waterlogged Tokunoshima-white and Tokunoshima-yellow cultivars decreased by 75.1% and 60% respectively, compared to WW cultivars at 4 DAT. The Tokunoshima-yellow cultivar exhibited the largest reduction of Pn values by 99.9% at 12 DAT compared with the Tokunoshima-white cultivar (99.2%) (Figure 3a).
Similarly, the E values of the waterlogged cultivars displayed significant differences between TrtD (p < 0.001), waterlogging treatment (p < 0.001), and the interaction between duration and waterlogging treatment (p < 0.001) (Table 1). However, the cultivars did not differ among treatments (Table 1, Figure 3b). The E values of the waterlogged Tokunoshima-white and Tokunoshima-yellow cultivars decreased by 76% and 71%, respectively, compared to WW cultivars at 4 DAT. The Tokunoshima-white cultivar exhibited the largest reduction of E values by 96.8% at 12 DAT compared with the Tokunoshima-yellow cultivar (94.7%) (Figure 3b).
Additionally, the gs values of the waterlogged cultivars exhibited significant differences between TrtD (p< 0.001), waterlogging treatment (p< 0.001), and the interaction between duration and waterlogging treatment (p< 0.001) (Table 1). However, the cultivars did not differ among the treatments (Table 1, Figure 3c). The gs values of the waterlogged Tokunoshima-white and Tokunoshima-yellow cultivars decreased by 82% and 82.8%, respectively, compared to WW cultivars at 4 DAT. The Tokunoshima-white cultivar exhibited the largest reduction of gs values by 97.8% at 12 DAT compared with the Tokunoshima-yellow cultivar (96.2%) (Figure 3c).
The Ci values of the waterlogged cultivars displayed a significant difference between TrtD (p < 0.05) and the interaction between TrtD and waterlogging treatment (p < 0.01) (Table 1). However, the waterlogging treatment did not have a significant impact on Ci, and the cultivars did not display differences among treatments (Table 1, Figure 3d). The Ci values of the waterlogged Tokunoshima-white and Tokunoshima-yellow cultivars decreased by 13.8% and 47.9%, respectively, compared to WW cultivars at 4 DAT, which corresponded to their largest reduction of Ci values (Figure 3d).
The PWUE values of the waterlogged cultivars displayed a significant difference between TrtD (p <0.01) and the interaction between TrtD and waterlogging treatment (p< 0.001) (Table 1). However, the waterlogging treatment did not display a significant difference, and the cultivars did not differ among treatments (Table 1, Figure 3e). The PWUE values of waterlogged Tokunoshima-white and Tokunoshima-yellow cultivars increased by 60.1% and 28.1%, respectively, compared to WW cultivars at 4 DAT. The Tokunoshima-yellow cultivar exhibited the largest reduction of PWUE values by 99.1% at 12 DAT compared with the Tokunoshima-white cultivar (71.8%) (Figure 3e).
These results revealed that the effects of WL treatment on the Pn, E, gs, Ci, and PWUE values of two cassava cultivars at the early growth stage were cultivar-specific, and the effects increased with the waterlogging duration (Figure 3a–e).
3.4. Effect of WL Treatment on Photosynthetic Traits (SPAD and Fv/Fm)
The immediate effects of WL treatment on Fv/Fm and SPAD values of cassava cultivars at the early growth stage are presented in Figure 4a and b. The Fv/Fm values of the two cultivars were significantly affected by WL treatment (p < 0.001) and TrtD (p< 0.05) (Table 1). Additionally, the interaction between TrtD and waterlogging treatment significantly affected Fv/Fm (p< 0.05) (Table 1). The cultivars did not differ between treatments (Table 1, Figure 4a). The Fv/Fm values of the WL Tokunoshima-white and Tokunoshima-yellow cultivars decreased by 0% and 4.6%, respectively, compared to those of WW cultivars at 4 DAT. The Tokunoshima-white cultivar exhibited the largest reduction of Fv/Fm values by 7.6% at 12 DAT compared with the Tokunoshima-yellow cultivar (3.4%) (Figure 4a).
The SPAD values of the two WL cultivars displayed significant differences between TrtD (p < 0.01), waterlogging treatment (p < 0.05), and cultivars (p < 0.001) (Table 1, Figure 4b). However, the interaction between TrtD and WL treatment did not statistically differ from the WW treatment (Table 1, Figure 4b). The SPAD values of WL Tokunoshima-white and Tokunoshima-yellow cultivars decreased by 2.8% and 10%, respectively, compared to WW cultivars at 4 DAT. The Tokunoshima-yellow cultivar exhibited the largest reduction of SPAD values by 14.4% at 8 DAT compared with the Tokunoshima-white cultivar (10.3%). The effects of WL treatment on Fv/Fm and SPAD values of the two cassava cultivars at the early growth stage were cultivar-specific, and the damage increased with the TrtD (Figure 4a, b).
3.5. Effect of WL Treatment on Morphological Traits (Plant Height, Number of Branches, and Number of Leaves)
The immediate effects of various WL treatments on plant height, number of branches, and number of leaves of cassava cultivars at the early growth stage are presented in Figure 5a–c. The plant height of the two cultivars was significantly affected by WL treatment at 4 DAT (p< 0.001), 8 DAT (p< 0.03), and 12 DAT (p< 0.01), respectively (Table 1). However, the TrtD did not significantly affect plant height (Table 1). In contrast, the interaction of TrtD and waterlogging treatment had a significant effect (p< 0.01) (Table 1). The plant heights of WL Tokunoshima-white and Tokunoshima-yellow cultivars decreased by 40.5% and 25.5% at 4 DAT, respectively, compared to WW cultivars. The Tokunoshima-white cultivar exhibited the largest reduction of plant height of 51.1% compared to 40.5% for the Tokunoshima-yellow cultivar at 12 DAT compared to WW conditions (Figure 5a).
The number of branches per plant was not significantly affected by WL treatment at all treatment durations or by the interaction between treatment duration and waterlogging treatment (Table 1, Figure 5B). The cultivars did not display difference between treatments (Table 1, Figure 5B). However, the treatment duration did not have a significant effect (p< 0.05) compared with WW cultivars (Table1, Figure 5B). The number of branches per plant of WL Tokunoshima-white and Tokunoshima-yellow cultivars decreased by 14.3% and 25% at 4 DAT, respectively, compared to WW cultivars. Tokunoshima-yellow cultivar exhibited the largest reduction in the number of branches by 25% at 4 DAT compared with Tokunoshima-white cultivar with 14.3% compared with WW treated cultivars (Figure 5b).
Finally, the number of leaves per plant of both cultivars was significantly (p< 0.001) affected by WL treatment at 8 and 12 DAT but was not significant at 4 DAT. However, the effect of treatment duration on the number of leaves per plant was not statistically significant (Table 1). The effect of the interaction of treatment duration and condition had a significant effect (p < 0.01), and cultivars were significantly different (p < 0.05) (Table 1). The number of leaves per plant of WL Tokunoshima-white and Tokunoshima-yellow cultivars decreased by 26.4% and 6%, respectively, compared to those of WW cultivars. The Tokunoshima-white cultivar exhibited the largest reduction in the number of leaves per plant with 56.3% at 12 DAT compared with 50% for the Tokunoshima-yellow cultivar (Figure 5c).
The WL treatment had a nonsignificant effect on the number of branches and leaves at 4 DAT for the two cassava cultivars at the early growth stage; however, it had a significant effect on plant height at 4, 8 and 12 DAT. The damage of WL treatment and treatment duration on plant height and number of leaves increased with the treatment duration (Figure 5a–c).
3.6. Relationships Between Morphological Parameters, Leaf Gas Exchange, and Photosynthetic Parameters
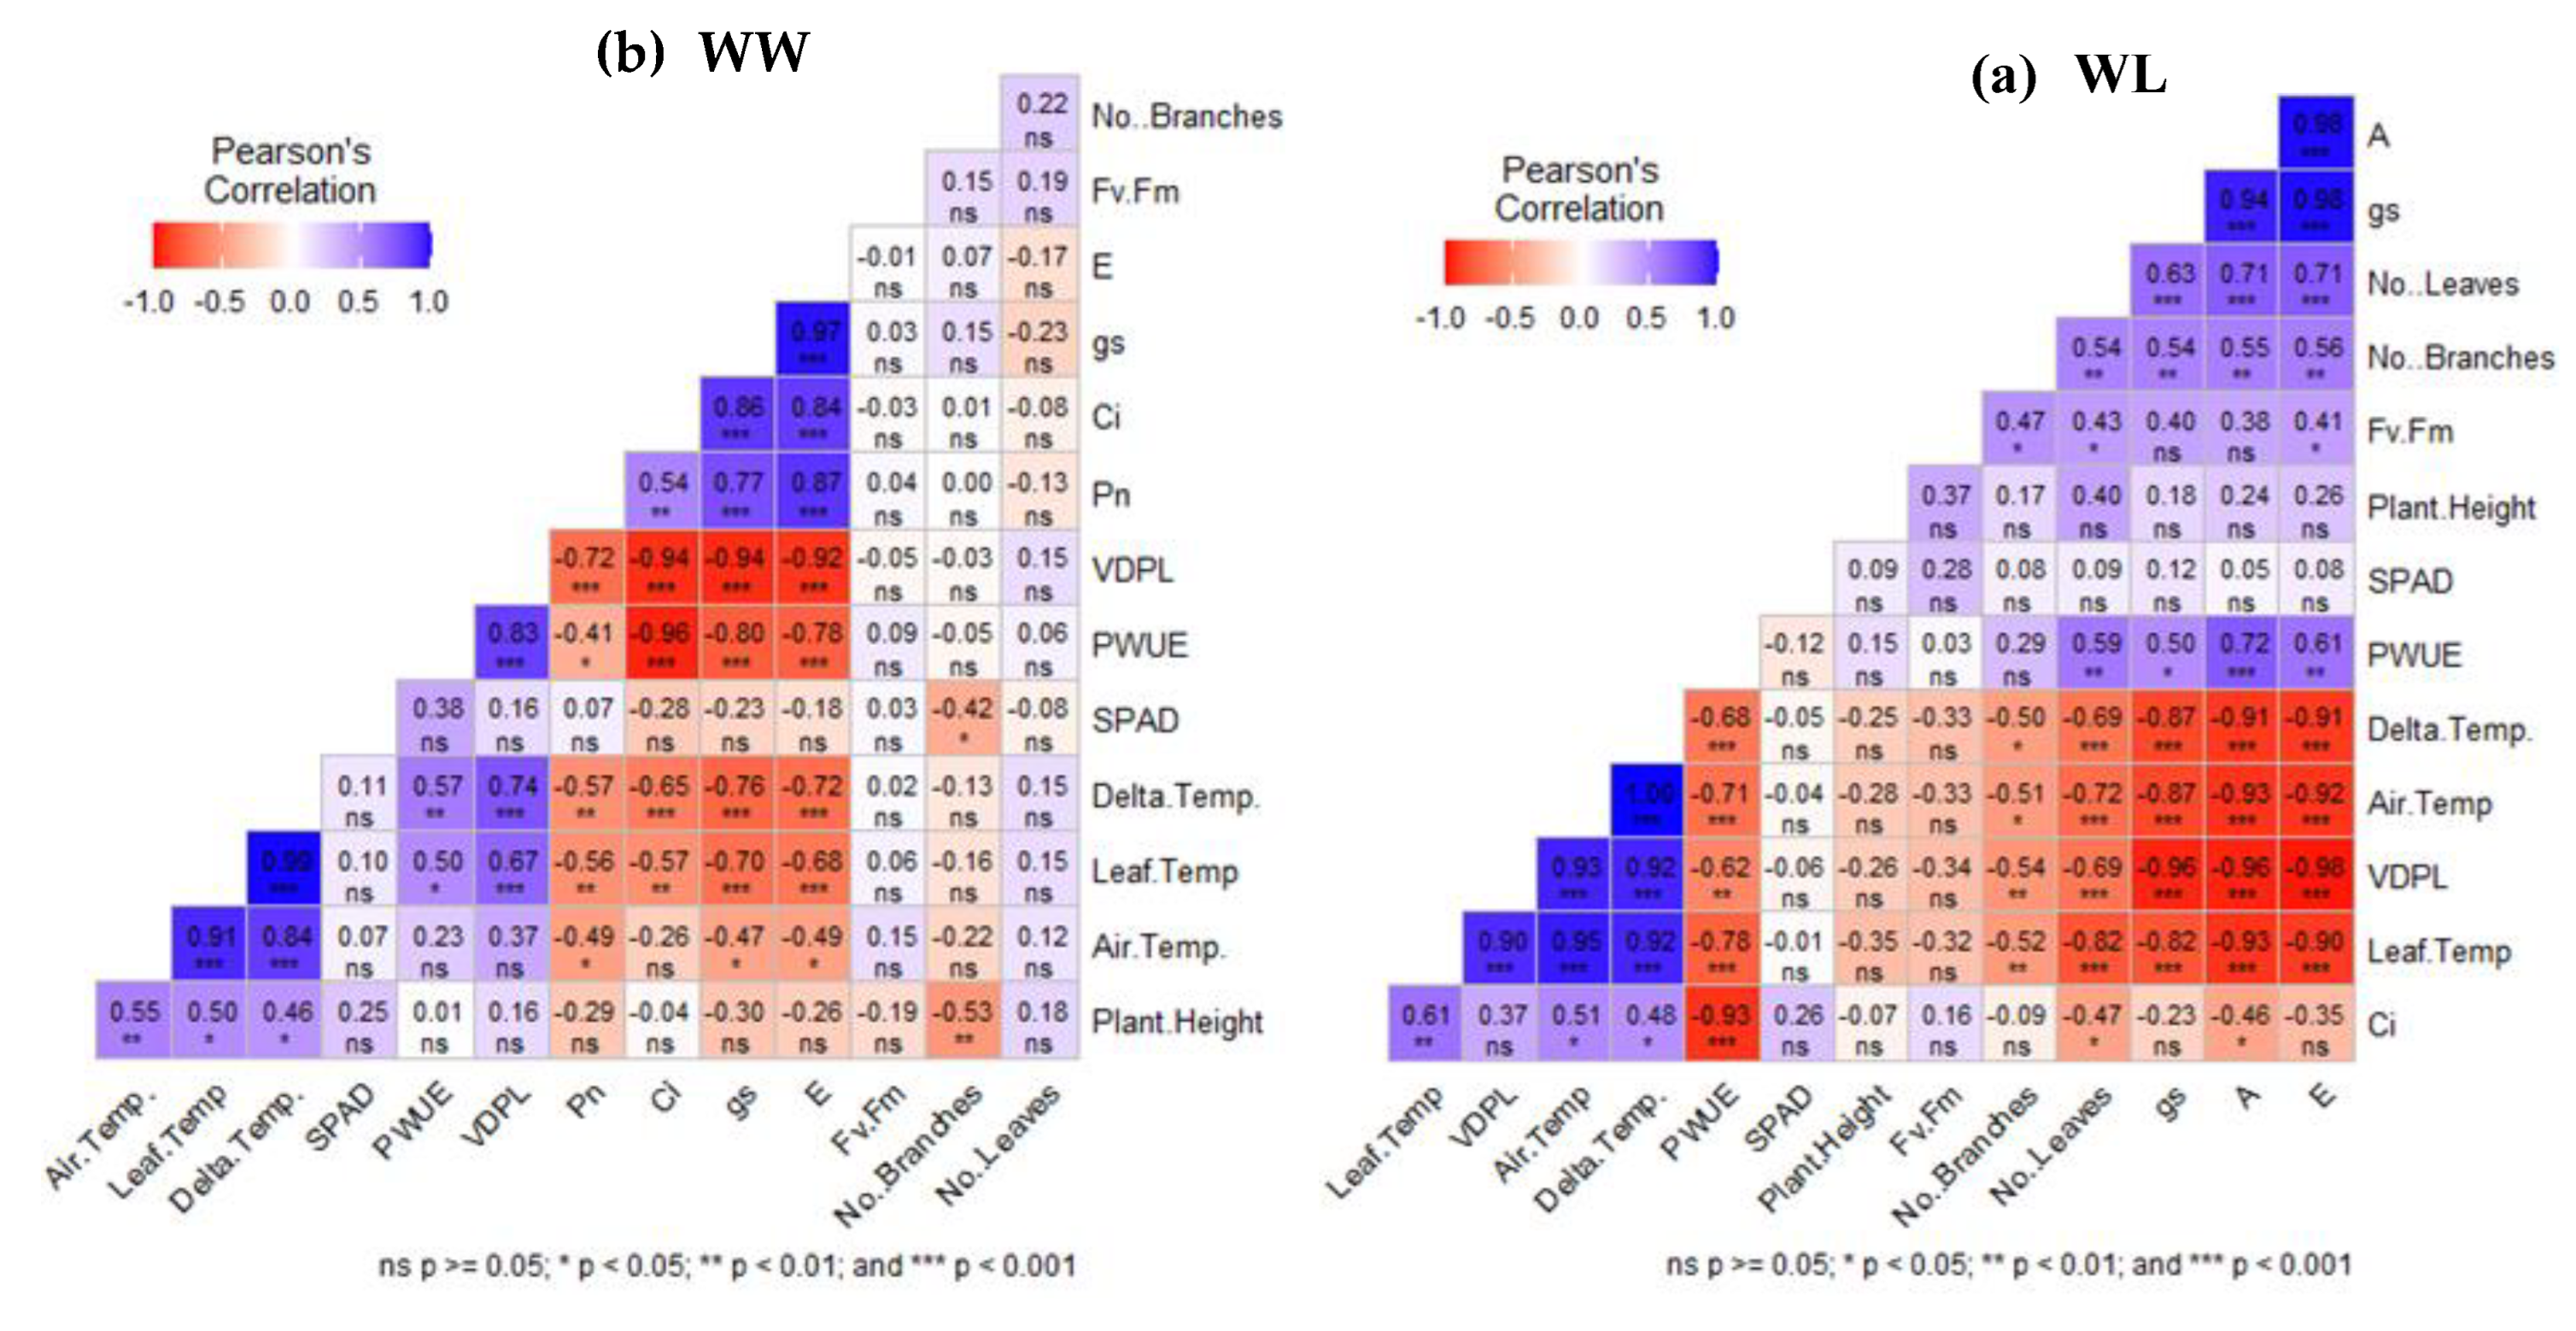
Figure 6 presents the results of Pearson’s correlation matrix analysis of morphological parameters, leaf gas exchange, and photosynthetic parameters of the two cassava cultivars under WW (a) and WL (b) conditions. The results of the WW treatment revealed that the leaf gas exchange parameters (Pn, E, gs, and Ci) are significantly and positively correlated with each other. However, a weak and moderately negative nonsignificant correlation was observed between SPAD, FV/Fm, PWUE, leaf temperature, and ΔT (Figure 6a). Similarly, leaf gas exchange parameters (Pn, E, gs, and Ci) under WL treatment were significantly and positively correlated to each other. However, Pn, E, and gs were not significantly correlated with Ci, SPAD, and Fv/Fm, and SPAD was not significantly correlated with Fv/Fm. Leaf temperatures and ΔT were significantly and negatively correlated with Pn, E, gs, and PWUE (Figure 6b). However, Ci was moderately correlated with leaf temperatures and ΔT (Figure 6b).
4. Discussion
When root growth and function are impaired by waterlogging, shoot growth and function are also restricted. In this study, waterlogging effects on morphological parameters, including plant height, number of branches, and number of leaves, were evaluated. At 4 DAT, reductions in the number of branches and leaves were not statistically significant, whereas plant height was significantly affected. With longer waterlogging durations (8 and 12 DAT), significant reductions were observed in plant height and number of leaves (Figure 5A–C). The severity of damage to cassava cultivars during early growth increased with waterlogging duration, consistent with findings by Huang, Gao [34], who reported that prolonged waterlogging intensified stress effects in maize. These results indicate that 12 days of waterlogging significantly reduced cassava plant height but had no effect on the number of branches. The number of leaves began to decline from 8 DAT onward. The reduction in plant height and leaf number after 12 days of waterlogging can be attributed to decreased cell proliferation and expansion, as well as delayed leaf unfolding, which were shown to be inhibited by water stress (Alves and Setter [35]. Similarly, Ledent [36] reported that prolonged drought reduced leaf number and size while enhancing the retention of already expanded leaves, and Suárez and Mederos [37] noted that leaf production and longevity are varietal traits strongly influenced by environmental conditions. In cassava, leaf loss is considered a strategy to conserve water [38,39]. Furthermore, Aina, Dixon [40] demonstrated that plant height is sensitive to water deficit, with reductions of up to 47% under drought in greenhouse and field conditions. These findings highlight the heightened sensitivity of cassava to excess water, reflected primarily in reductions in plant height and leaf number. Therefore, plant height and leaf number, rather than branch number, may serve as reliable parameters for evaluating waterlogging tolerance in cassava during the vegetative growth stage.
To evaluate the photosynthetic ability of cassava plants under waterlogging, chlorophyll content and Fv/Fm were measured. SPAD values, which indicate relative chlorophyll content, were used to assess chlorophyll degradation. Results revealed significant differences in SPAD values among treatment durations (p < 0.01), waterlogging treatment (p < 0.05), and cultivars (p < 0.001) (Table 1, Figure 4b). Changes in soil chemical properties under waterlogging may have influenced SPAD values, potentially explaining the observed responses. Notably, cassava can maintain higher PNUE under nitrogen-deficient conditions induced by waterlogging. This finding is consistent with Cruz, P.R. Mosquim [41], who reported that cassava can acclimate to nitrogen starvation, an adaptation linked to its evolution in environments with inherently low nitrogen availability.
Fv/Fm was used as a reliable indicator of photo-inhibitory impairment in plants under environmental stresses, including waterlogging. According to Long , Humphries S [42], the Fv/Fm ratio is a key parameter for detecting damage to photosystem II (PSII) and identifying the occurrence of photoinhibition. In this study, Fv/Fm values exhibited no significant differences between treatments, except at 12 DAT (Figure 4A). The decline in Fv/Fm value at 12 DAT may reflect the sensitivity of the photosynthetic apparatus to waterlogging. Low oxygen concentrations are known to trigger hypoxia-related metabolism, including the induction involved in anaerobic fermentation, sugar utilization, and antioxidant defense [43,44]. The stability of PSII at 0, 4, and 8 DAT suggests that oxidative stress was limited during early waterlogging, which may be attributed to effective ROS scavenging and the absence of chlorophyll degradation, as supported by SPAD data (Figure 4b). Nishizawa, Yabuta [45] reported that ROS scavengers reduce oxidative damage under abiotic stress while Chen, Y. [46] found that 6 days of waterlogging significantly increased the activities of superoxide dismutase, catalase, and peroxidase in cassava leaves and roots. Collectively, these findings suggest that cassava may possess mechanisms that allow metabolism adjustment and PSII protection under short-term anaerobic conditions. However, further studies are needed to elucidate the specific mechanisms underlying this tolerance.
Under waterlogging, root hypoxia reduces water uptake, and stomatal closure limits transpiration, which often results in increased leaf temperature due to reduced evaporative cooling [13]. In this study, leaf temperature and ΔT in two cassava cultivars increased under waterlogging at 4, 8, and 12 DAT compared to well-watered plants (Figure 2a, b). Increased leaf temperature and ΔT under waterlogging cause physiological stress due to impaired transpiration and stomatal regulation (Figure 3b, c). The changes were more obvious in the Tokunoshima-white cultivar, suggesting that it was more sensitive to waterlogging than the Tokunoshima-yellow cultivar. This result was consistent with Pan, Jiang [47] who reported that, leaf temperature was higher in the sensitive genotypes than that in the tolerant genotypes after waterlogging. The increased leaf temperature (Figure 2a) and decreased stomatal conductance and transpiration rate (Figure 3b, c) under waterlogging suggest that waterlogged plants regulate stomatal aperture to conserve relative water content under stress. A similar finding was reported by Utsumi, Utsumi [48], who suggested that the stomatal conductance and transpiration rate in leaves of acetic acid-treated plants decreased due to higher leaf temperatures compared to control plants to maintain relative water content and avoid drought. Surendar, Devi [49] found increases of 2 –3 °C in leaf temperature under water deficit relative to control conditions. Our results are further supported by Siddique, Hamid [50], who demonstrated that water stress substantially decreased leaf water potential, relative water content, and transpiration rate, with a concomitant increase in leaf temperature. According to Nelson and Bugbee [51], ΔT can reduce the influence of air temperature changes on leaf temperatures based on the monitoring of leaf water status.
We also observed that the leaf gas exchange parameters of cassava were affected by waterlogging. A significant decrease in Pn, E, and gs was observed at 4 DAT (Figure 3a–c), indicating that the channel for water and CO2 exchange was restricted. According to Ahmed, Nawata [52], the earliest response of plant species to waterlogging is stomatal closure, which limits gas exchange and decreases A and E in many plant species, including tomato (Solanum lycopersicum L.) [53], cassava [17], sorghum [54], and wheat (Triticum aestivum L.) [55]. This data suggests that the reduced gs is responsible for the decreased Pn and E in the evaluated cassava cultivars during early growth under waterlogging. Bansal and Srivastava [56] reported that 6 days of waterlogging reduced the chlorophyll content of leaves in pigeon pea. A similar observation was reported in sorghum after 12 days of waterlogging [54]. During photosynthesis, chlorophyll serves as a crucial pigment to absorb light energy. Kawamitsu [57] demonstrated that SPAD values are highly correlated with the leaf chlorophyll content. At 4 DAT, a significant decrease in SPAD values was observed in cassava cultivars under waterlogging (Figure 4b). However, no significant correlation was found between Pn and SPAD values (Figure 6a, b). Thus, reduced photosynthesis during the early growth of waterlogged cassava cultivars could be attributed to increased leaf temperatures and decreased gs and E. In this study, the effect of waterlogging on gs and E increased with increased treatment duration, resulting in the same trend as Pn (Figure 3a–c). The leaf temperature of WL cassava cultivars was significantly higher than that of WW cultivars at 4, 8, and 12 DAT (Figure 2a). These findings aligned with similar leaf temperature-based study on differential response of growth and photosynthesis in diverse cotton genotypes under hypoxia stress by Pan, Jiang [47], who reported that, leaf temperature was higher in the sensitive genotypes than that in the tolerant genotypes after waterlogging, which means that the tolerant plants could maintain a stable metabolic environment to avoid anoxia stress damage in the roots.
Furthermore, Pearson’s correlation matrix analysis revealed that leaf temperatures and ΔT were negatively correlated with Pn (−0.93, p < 0.001; −0.91, p < 0.001), gs (−0.82, p < 0.001; −0.87, p < 0.001), and E (−0.90, p < 0.001; −0.91, p < 0.001) under waterlogging treatment compared to Pn (−0.56, p < 0.01; −0.57, p < 0.01), gs (−0.70, p < 0.001; −0.76, p < 0.001), and E (−0.68, p < 0.001; −0.72, p < 0.001) under well-watered treatment (Figure 6 a, b). This result indicates that increased leaf temperatures and ΔT lead to decreased leaf gas exchange parameters (Pn, gs, and E). These results align with Wang, Zhang [13], who reported significant relationships among ΔT, RWC, and gas exchange parameters (E and Pn). Additionally, the results aligned with Djanaguiraman, Prasad [58] and Luan, H [59], who reported that increased leaf temperature caused by water deficit creates unfavorable conditions for plants; the abnormal leaf temperature will disturb the physiological metabolism, destroy the chloroplast structure, and decrease Pn. Surendar, Devi [49] also found a significant negative correlation between leaf temperature and photosynthetic rate. Based on our findings, we deduce that ΔT is closely related to leaf water content and gas exchange parameters, representing a real-time response supported by highly significant correlations. Therefore, ΔT can serve as a reliable index for assessing the water status and performance of cassava leaves under waterlogging. Moreover, given its convenience, real-time measurement, and nondestructive nature, we recommend ΔT as an important tool for monitoring cassava responses to waterlogging. This recommendation was aligned with similar recommendation by Guo, Xu [60] who recommended that, ΔT as an effective indicator for monitoring changes in sorghum leaves under alkaline stress and evaluating the alkali tolerance of different sorghum germplasm. In addition, Wang, Zhang [13] reported that, ΔT had a certain correlation with leaf water status and leaf photosynthesis characteristics and could be used as an indicator to evaluate the waterlogging tolerance of sorghum. Study by Mohammadian, [61] concluded that ΔT is a more sensitive and easier method to use for measuring the extent of water stress in sugar beet . According to Garrity and O’Toole [62], ΔT can be used as a screening tool in selecting genotypes for water stress resistance. All these previous literatures were reinforcing ΔT utility as a nondestructive indicator of stress response.
Results on PWUE at 4 DAT under waterlogging (Figure 3e) indicate a strategy to maintain carbon gain while minimizing water loss. PWUE results at 4 DAT suggest that waterlogged cassava plants retained relative water content by regulating stomatal aperture to reduce water loss while sustaining some photosynthetic activity. This finding aligns with Santos, Endres [63], who reported that under drought conditions, stomatal closure reduces transpiration (E) and increases PWUE, especially when photosynthesis remains more active than transpiration. This boost in PWUE (Figure 3e) often reflects a strategy to maintain carbon gain while minimizing water loss. Therefore, the statistically significant decrease in Pn, E, and gs of waterlogged cassava cultivars at 4 DAT and the negative correlation between Pn, gs, E, and PWUE and leaf temperature and ΔT (Figure 6 a, b) indicate that as leaves become hotter than the air, these physiological functions are still actively responding, although in a stressed or compensatory manner. The strong negative correlation between Pn, E, gs, and PWUE under waterlogging suggests a survival or compensatory mechanism, maintaining carbon gain despite harsh hypoxia conditions. Increased ΔT often correlates with reduced leaf RWC, photosynthetic performance, and transpiration, especially in waterlogging-sensitive cultivars [13]. Thus, ΔT could serve as a useful real-time, nondestructive indicator of plant water and photosynthetic status.
5. Conclusions
Plant responses to waterlogging must be monitored in an accurate and timely manner to mitigate the adverse effects of waterlogging, especially on cassava production. The main objective of this study was to identify the relationship between cassava leaf temperatures and ΔT and leaf gas exchange parameters, as well as to understand the effects of waterlogging on leaf temperature. Key results indicated that waterlogging stress markedly reduced photosynthetic rate, stomatal conductance, and transpiration rate in cassava, while increasing leaf temperature and ΔT, reflecting impaired stomatal regulation and reduced evaporative cooling. Strong negative correlations between ΔT and photosynthetic parameters (Pn, E, gs, and PWUE) further suggested that ΔT can serve as a reliable, nondestructive indicator of cassava’s physiological responses under hypoxic conditions. Maintaining cooler canopies may therefore contribute to improved tolerance and survival under waterlogged conditions. ΔT offers strong potential as a practical parameter for rapid screening and selection of waterlogging-tolerant cassava genotypes. However, validation across a wider range of cultivars and integration with additional parameters, such as leaf RWC, free water content, and anatomical traits, is recommended to strengthen its application in breeding programs. In conclusion, ΔT offers a simple and effective tool to guide agronomic practices, breeding and crop improvement strategies for enhancing cassava resilience under waterlogging stress. This is so unique in the sense that it handles a special under researched root crop called cassava and tries to clarify the anaerobic response under waterlogged conditions.
Author Contributions
L.A.: Conceptualization, methodology, data collection, Data curation, formal analysis, writing, Editing, proofreading and experiment management, T.N.: helped with data collection, A.T. and I.S. helped with data collection and proofreading, Peter Ssenyonga and Rael Chepkoech: proofreading and editing, J.-I. S.: Conceptualization, methodology, experiment administration, supervision, reviewing, editing and proofreading. All authors read and approved of the final manuscript.
Funding
This study was funded by the United Graduate School of Agricultural Sciences, Kagoshima University, Kagoshima City, Japan and Agricultural Networking (Agri-Net) program of Japan International cooperation Agency (JICA).
Institutional Review Board Statement
Not applicable.
Informed Consent Statement
Not applicable.
Data Availability Statement
The data that supports the findings of this study are available in Figshare at https://doi.org/10.6084/m9.figshare.30362716.
Acknowledgments
We would like to thank the United Graduate School of Agricultural Sciences, Kagoshima University, Kagoshima, Japan for carrying out funding for this study and Agricultural Networking (Agri-Net) program of Japan International cooperation Agency (JICA) for providing scholarship to the first author which allowed him to undertake this study, and Kizuna farm in Tokunoshima, Kagoshima prefecture for provision of the experimental materials (Tokunoshima-white and Tokunoshima-yellow cassava cultivars) . We also would like to thank Enago (www.enago.jp) for the valuable comments and English language review that greatly improved the manuscript.
Conflicts of Interest
The authors have no competing interests to declare that are relevant to the content of this article.
References
- More, S. , J,, et al., The quest for high yielding drought tolerant cassava variety. Journal of Pharmacognosy and Phytochemistry 2020, 2020(SP6): p. 433-439.
- Stromquist, N.P. World Development Report 2019: The changing nature of work: By the World Bank. Washington, DC, World Bank, 2019, 151 pp. ISBN 978-1-4648-1342-9 (hbk). ISBN 978-1-4648-1328-3 (pbk), ISBN 978-1-4648-1356-6 (eBook) 2019, Springer. [CrossRef]
- Nguyen, T.L.T., S. H. Gheewala, and S. Garivait, Full chain energy analysis of fuel ethanol from cassava in Thailand. Environmental Science & Technology, 2007. 41(11): p. 4135-4142.
- Carsky, R. , et al., Response of selected crop associations to groundwater table depth in an Inland Valley. Field Crops Research, 1993. 34(1): p. 1-13.
- Andriesse, W. , et al., multiscale characterization of inland valley agro-ecosystems in west Africa. Netherlands Journal of Agricultural Science 1994. 42(2): p. 159–179.
- Ekanayake, I. , J,, et al., Improved-cassava-for-inland-valley-agro-ecosystems., in Proc. 5th Symp. ISTRC-AB,. 1994, ReseaerchGate. p. 204-208.
- Zhai, P. , et al., Global Warming of 1.5 C. An IPCC Special Report on the impacts of global warming of 1.5 C above pre-industrial levels and related global greenhouse gas emission pathways, in the context of strengthening the global response to the threat of climate change, sustainable development, and efforts to eradicate poverty. Sustainable Development, and Efforts to Eradicate Poverty, 2018: p. 32.
- Ponnamperuma, F.N. , Effects of flooding on soils. In ‘Flooding and plant growth’.(Ed. TT Kozlowski) pp. 9–45. 1984, Academic Press: New York.
- Koslowski, T.T. and S.G. Pallardy, Effects of flooding on water, carbohydrate and mineral relations., in In Flooding and Plant Growth, T.T. Koslowski, Editor. 1984, Academic Press Inc.: Orlando, Florida.
- Voesenek, L.A.C.J. and C.W.P.M. Blom, Growth responses of Rumex species in relation to submergence and ethylene. Plant Cell Environ, 1989. 12(433): p. 439.
- Setter, T. , et al., Review of wheat improvement for waterlogging tolerance in Australia and India: the importance of anaerobiosis and element toxicities associated with different soils. Annals of Botany, 2009. 103(2): p. 221-235.
- Popescu, M. and G.C. Popescu, Diurnal changes in leaf photosynthesis and relative water content of grapevine. Current Trends in Natural Sciences, 2014. 3(6): p. 74-81.
- Wang, W. , et al., The leaf-air temperature difference reflects the variation in water status and photosynthesis of sorghum under waterlogged conditions. Plos One, 2019. 14(7): p. e0219209.
- Feng, X. and G. Zhou, Relationship of leaf water content with photosynthesis and soil water content in summer maize. Acta Ecologica Sinica, 2018. 38(1): p. 177-185.
- Giorio, P., G. Sorrentino, and R. d’Andria, Stomatal behaviour, leaf water status and photosynthetic response in field-grown olive trees under water deficit. Environmental and Experimental Botany, 1999. 42(2): p. 95-104.
- Egilla, J., F. Davies Jr, and T. Boutton, Drought stress influences leaf water content, photosynthesis, and water-use efficiency of Hibiscus rosa-sinensis at three potassium concentrations. Photosynthetica, 2005. 43(1): p. 135-140.
- Aquilino, L. , et al., Photosynthetic function analysis under rhizosphere anaerobic conditions in early-stage cassava. Photosynth Res, 2025. 163(4): p. 42.
- Blum, A., J. Mayer, and G. Gozlan, Infrared thermal sensing of plant canopies as a screening technique for dehydration avoidance in wheat. Field Crops Research, 1982. 5: p. 137-146.
- Brahmesh, R. , BR, Kiran BO, Somanagouda B Patil, Ashwathama VH, Canopy temperature in Sorghum under drought stress: Influence of gas-exchange parameters. Journal of Cereal Research, 2022. 14 (2): p. 81- 85.
- Leopold, A.C., W. Q. Sun, and I. Bernal-Lugo, The glassy state in seeds: analysis and function. Seed Science Research, 1994. 4(3): p. 267-274.
- Liu YunPeng, L.Y. , et al., Diurnal variation in leaf-air temperature difference and leaf temperature difference and the hybrid difference in maize under different drought stress. 2014.
- Dhıllon, R. , et al., A continuous leaf monitoring system for precision irrigation management in orchard crops. Tarım Makinaları Bilimi Dergisi, 2014. 10(4): p. 267-272.
- Rajarajan, et al., Differential responses of sorghum genotypes to drought stress revealed by physio-chemical and transcriptional analysis.. Molecular Biology Reports, 2021. 48: p. 2453-2462.
- Pineda, M., M. Barón, and M.-L. Pérez-Bueno, Thermal Imaging for Plant Stress Detection and Phenotyping. Remote Sensing, 2020. 13(1): p. 68.
- Jones, H.G. , Use of thermography for quantitative studies of spatial and temporal variation of stomatal conductance over leaf surfaces. Plant, Cell & Environment, 1999. 22(9): p. 1043-1055.
- Anderegg, J. , et al., Temporal trends in canopy temperature and greenness are potential indicators of late-season drought avoidance and functional stay-green in wheat. Field Crops Research, 2021. 274: p. 108311.
- Pradhan, A. , et al., Cooler canopy leverages sorghum adaptation to drought and heat stress. Scientific Reports, 2022. 12(1): p. 4603.
- Balota, et al., Morphological and physiological traits associated with canopy temperature depression in three closely related wheat lines.. Crop Science, 2008. 48: p. 1897-1910.
- Ginkel, et al. Complementing the breeder’s eye with canopy temperature measurements. in International symposium on wheat yield potential: Challenges to International wheat breeding, . 2006. Mexico.
- Yabuta, et al., The Productivity of Cassava (Manihot esculenta Crantz) in Kagoshima, Japan, Which Belongs to the Temperate Zone. agronomy, 2021.
- Minami, S.Y., S.; Tominaga, K.; Yamamoto, Y.; Nakanouchi, A.; Ik, K.; Ishikawa, D.; Ishiguro, E.; Hakoyama, S. , The productivity of cassava (Manihot esculenta Crantz) in Kagoshima, prtevailing a temperate zone in East Asia I. growth, dry matter production and yield.. Japan Journal of Crop sciences 2020. 89: p. 277 -287.
- Minota, et al., Comparison of Three Cassava (Manihot esculenta Crantz) Strains with the Growth, Plant Type and Yield in Kagoshima Prefecture, Japan..Exp.Farm Fac.Agr.KagoshimaUniv., 2013. 35: p. 1-6.
- Jones, H.G. , Use of infrared thermometry for estimation of stomatal conductance as apossible aid to irrigation scheduling. Agricultural and Forest Meteorology 1999. 95: p. 139-149.
- Huang, C. , et al., Effects of waterlogging at different stages and durations on maize growth and grain yields. Agricultural Water Management, 2022. 261: p. 107334.
- Alves, A.A. and T.L. Setter, Response of cassava leaf area expansion to water deficit: cell proliferation, cell expansion and delayed development. Ann Bot, 2004. 94(4): p. 605-13.
- Ledent, J. , Deficit hidrico y crecimiento de las plantas: Respuestas al deficit hidrico: Comportamiento morfofisiologico/Modelado del crecimiento de las plantas: Manual. 2002.
- Suárez, L. and V. Mederos, Apuntes sobre el cultivo de la yuca (Manihot esculenta Crantz). Tendencias actuales. Cultivos tropicales, 2011. 32(3): p. 27-35.
- León, P.R. , et al., Caracterización ecofisiológica de cuatro clones de yuca del banco de germoplasma del INIA-CENIAP. Agronomía Tropical, 2014. 64(1-2): p. 97-105.
- Vandegeer, R. , et al., Drought adversely affects tuber development and nutritional quality of the staple crop cassava (Manihot esculenta Crantz). Functional Plant Biology, 2012. 40(2): p. 195-200.
- Aina, O.O., A. G.O. Dixon, and E.A. Akinrinde, Effect of soil moisture stress on growth and yield of cassava in Nigeria. Pakistan Journal of Biological Sciences, 2007. 10: p. 3085 -3090.
- Cruz, J.L. , et al., Photosynthesis impairment in cassava leaves in response to nitrogen deficiency. Plant and Soil, 2003.
- Long, S. , Humphries S, and F. PG., Photoinhibition of photosynthesis innature.. Annual Review of Plant Physiology and Plant Molecular Biology 1994. 45: p. 633–662.
- Blokhina, O., E. Virolainen, and K.V. Fagerstedt, Antioxidants,Oxidative Damage and Oxygen Deprivation Stress: a Review Annals of Botany, 2003. 91: p. 179-194.
- Chang, W.W.P. , et al., Patterns of Protein Synthesis and Tolerance of Anoxia in Root Tips of Maize Seedlings Acclimated to a Low-Oxygen Environment, and Identification of Proteins by Mass Spectrometry. Plant Physiology, 2000. 122: p. 295-317.
- Nishizawa, A., Y. Yabuta, and S. Shigeoka, Galactinol and raffinose constitute a novel function to protect plants from oxidative damage. Plant Physiol, 2008. 147(3): p. 1251-63.
- Chen, et al., Transcriptomic profiling suggests candidate molecular responses to waterlogging in cassava. PLoS One, 2022. 17(1): p. e0261086.
- Pan, R. , et al., Differential response of growth and photosynthesis in diverse cotton genotypes under hypoxia stress. Photosynthetica, 2019. 57(3): p. 772-779.
- Utsumi, Y. , et al., Acetic Acid Treatment Enhances Drought Avoidance in Cassava (Manihot esculenta Crantz). Front Plant Sci, 2019. 10: p. 521.
- Surendar, K.K. , et al., Effect of Water Stress on Leaf Temperature, Transpiration Rate, Stomatal Diffusive Resistance and Yield of Banana. Plant Gene and Trait, 2013.
- Siddique, M., A. Hamid, and M. Islam, Drought stress effects on water relations of wheat. Botanical Bulletin of Academia Sinica, 2000. 41.
- Nelson, J.A. and B. Bugbee, Analysis of Environmental Effects on Leaf Temperature under Sunlight, High Pressure Sodium and Light Emitting Diodes. PLoS One, 2015. 10(10): p. e0138930.
- Ahmed, S. , et al., Alterations in photosynthesis and some antioxidant enzymatic activities of mungbean subjected to waterlogging. Plant science, 2002. 163: p. 117-123.
- Else, A. , et al., Stomatal Closure in Flooded Tomato Plants lnvolves Abscisic Acid and a Chemically Unidentified Anti-Transpirant in Xylem Sap. Plant physiology, 1996. 112(112).
- Zhang, R.D. , et al., Changes in photosynthesis, chloroplast ultrastructure, and antioxidant metabolism in leaves of sorghum under waterlogging stress. Photosynthetica, 2019. 57(4): p. 1076-1083.
- Zheng, C. , et al., Effects of salt and waterlogging stresses and their combination on leaf photosynthesis, chloroplast ATP synthesis, and antioxidant capacity in wheat. Plant Sci, 2009. 176(4): p. 575-82.
- Bansal, R. and J.P. Srivastava, Effect of waterlogging on photosynthetic and biochemical parameters in pigeonpea. Russian Journal of Plant Physiology, 2015. 62(3): p. 322-327.
- Kawamitsu, Y. , Effects of nitrogen supply on growth characteristics and leaf photosynthesis in sugarcane. Sci Bull. Coll. Agr. Univ. Ryukyus, 1999. 46: p. 1-14.
- Djanaguiraman, M. , et al., High-Temperature Stress and Soybean Leaves: Leaf Anatomy and Photosynthesis. Crop Science, 2011. 51(5): p. 2125-2131.
- Luan, et al., Morpho-anatomical and physiological responses to waterlogging stress in different barley (Hordeum vulgare L.) genotypes. Plant Growth Regulation., 2018. 85(5): p. 399-409.
- Guo, J.J. , et al., Effect of short-term combined alkaline stress on antioxidant metabolism, photosynthesis, and leaf-air temperature difference in sorghum. Photosynthetica, 2022. 60(2): p. 200-211.
- Mohammadian, R. , et al., The effects of early season drought on stomatal conductance, leaf-air temperature difference and prolione accumulation in sugar beet Genotypes. J. Agric. Sci. Technol., 2001. 3: p. 181-192.
- Garrity, D.P. and J.C. O’Toole, Selection for reproductive stage drought avoidance in rice, using infrared thermometry. Agronomy Journal, 1995. 87(4): p. 773-779.
- Santos, C.M.D. , et al., Photosynthetic capacity and water use efficiency in Ricinus communis (L.) under drought stress in semi-humid and semi-arid areas. An Acad Bras Cienc, 2017. 89(4): p. 3015-3029.
Figure 1.
Average temperature and average relative humidity (A) Soil temperature (B) and Soil moisture content (C) during experimental duration.
Figure 1.
Average temperature and average relative humidity (A) Soil temperature (B) and Soil moisture content (C) during experimental duration.
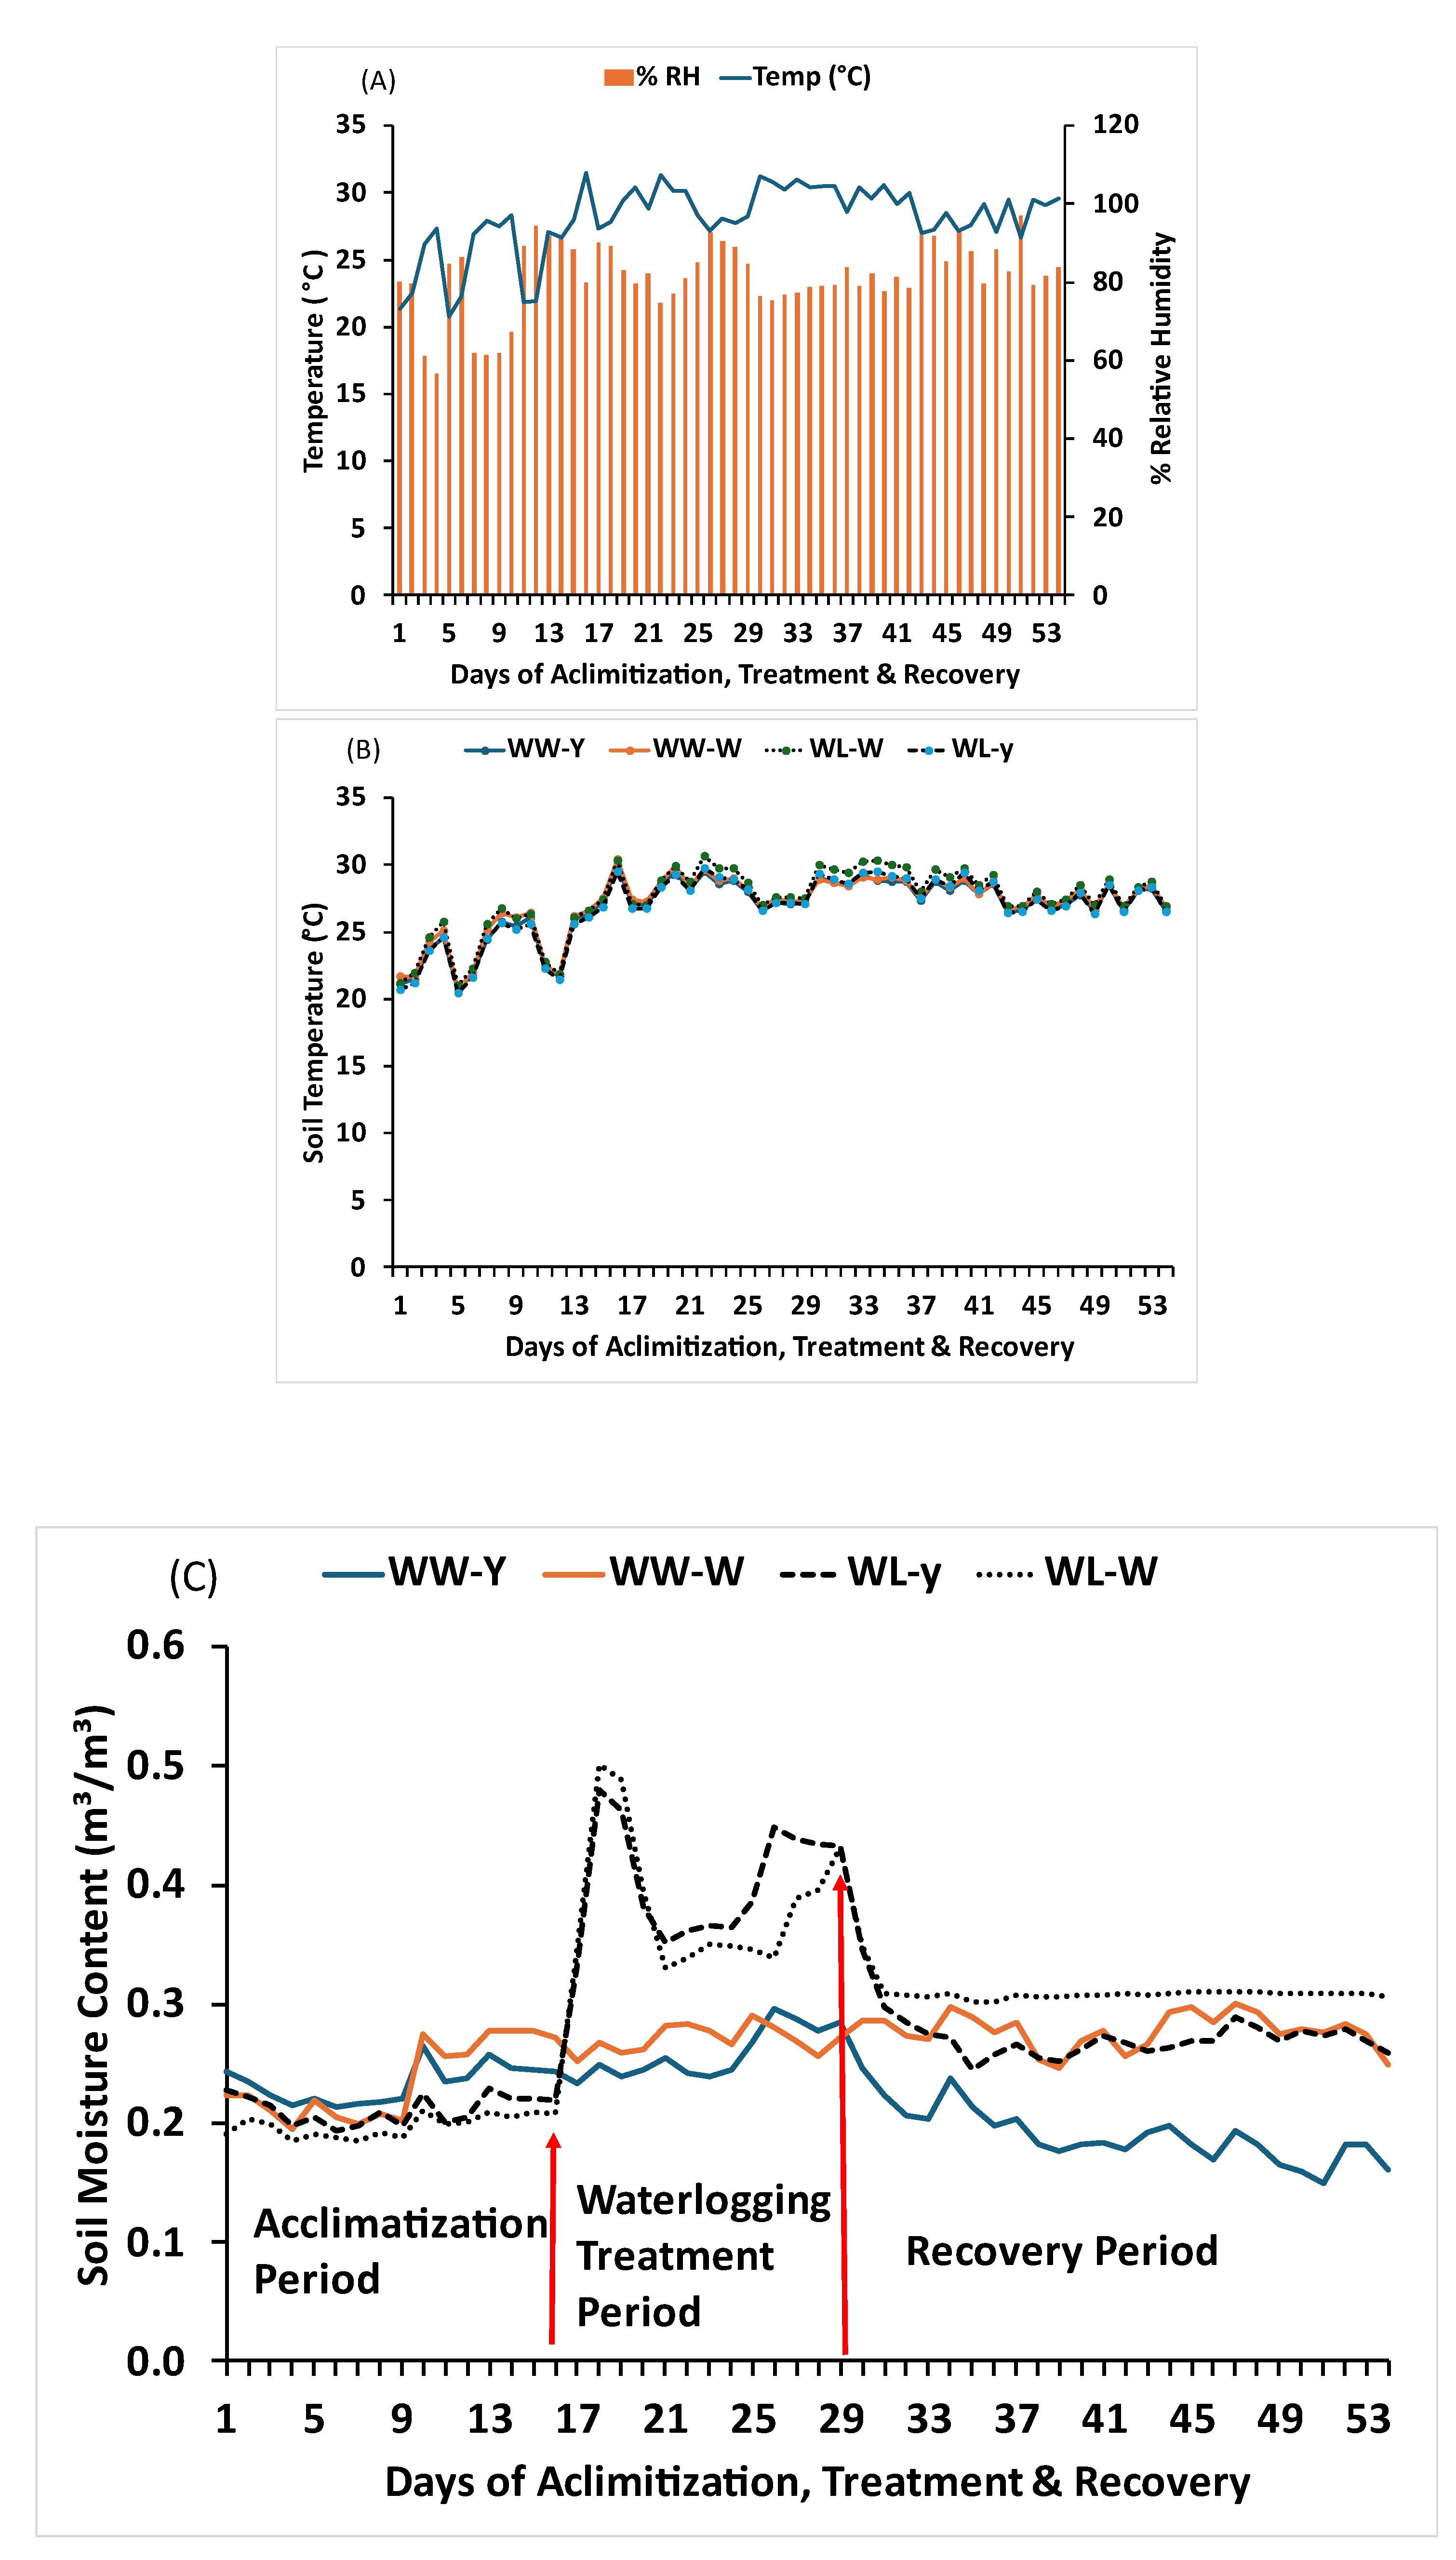
Figure 2.
Effects of waterlogging durations on the leaf temperature (A) and difference of Leaf and air temperatures (B) of two cassava cultivars. Uppercase letters on top of bars indicate significant differences between waterlogging durations, while lower case indicate differences among the waterlogging treatment.
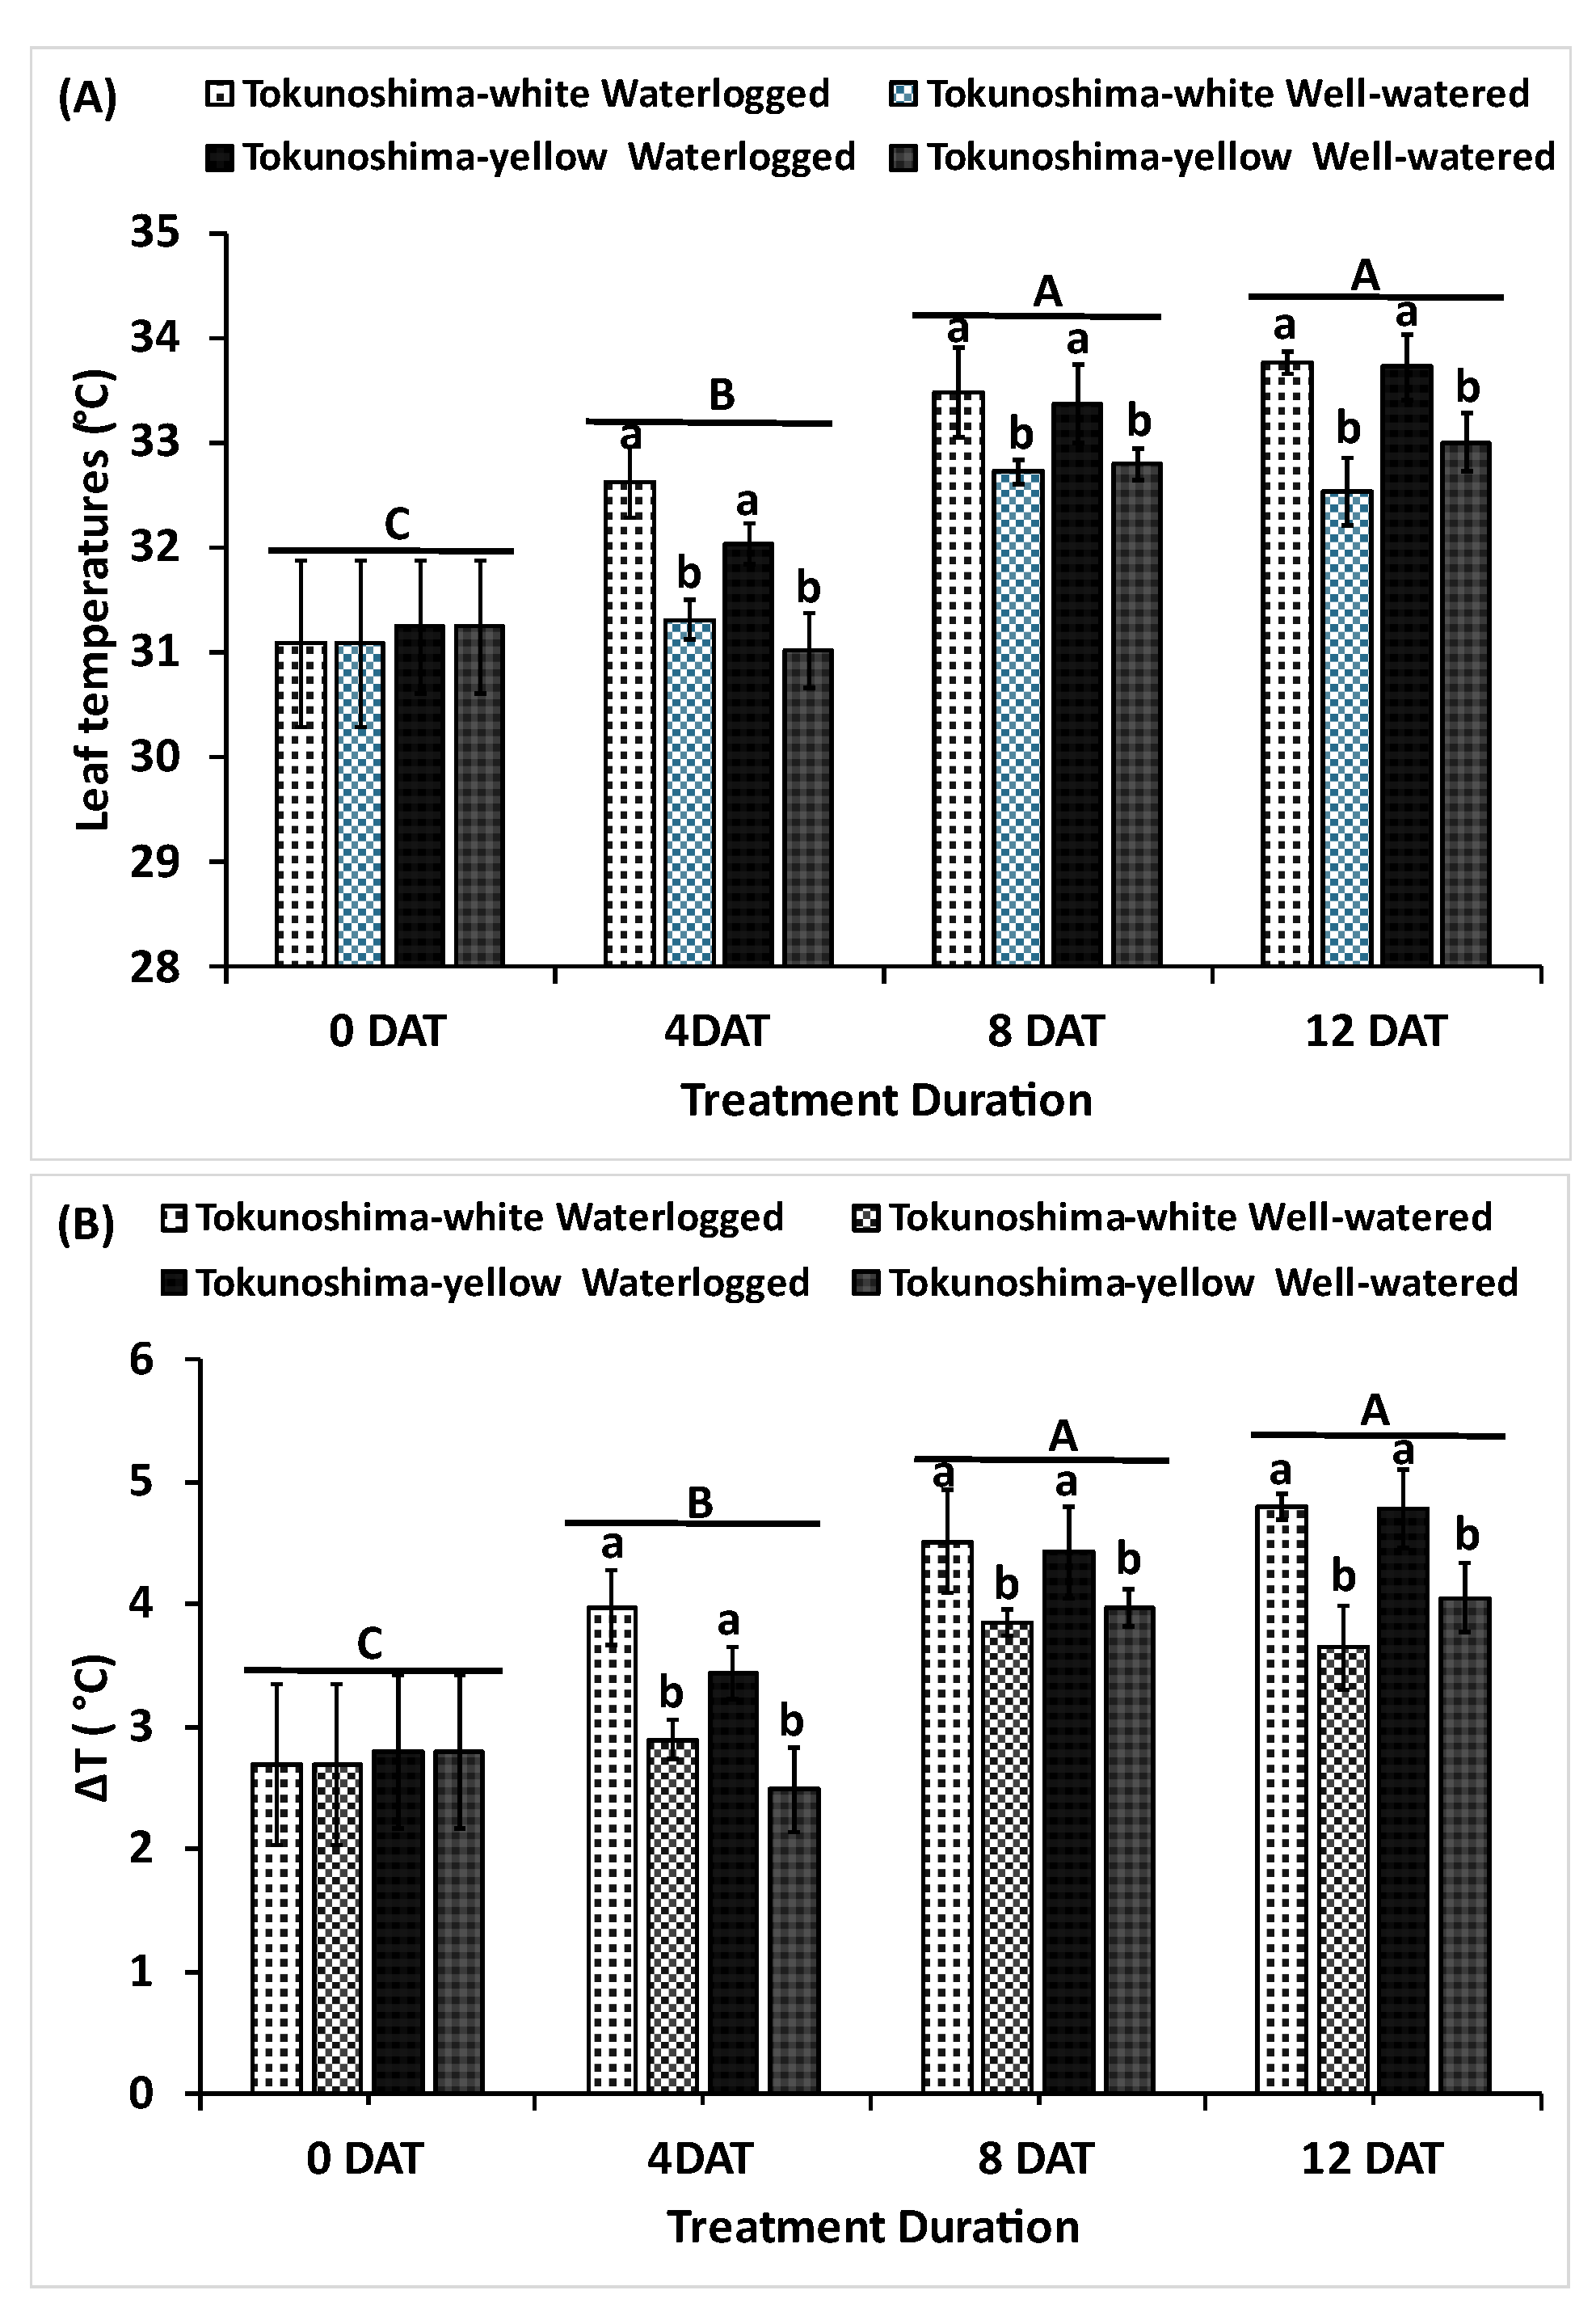
Figure 3.
Effects of various waterlogging durations on Photosynthetic rate (A), Transpiration rate (B), Stomatal conductance (C), Intercellular CO2 Concentration (Ci) (D) and PWUE (E) at early growth stage of cassava cultivars. Uppercase letters on top of bars indicate significant differences between waterlogging durations, while lower case indicate differences among the waterlogging treatment.
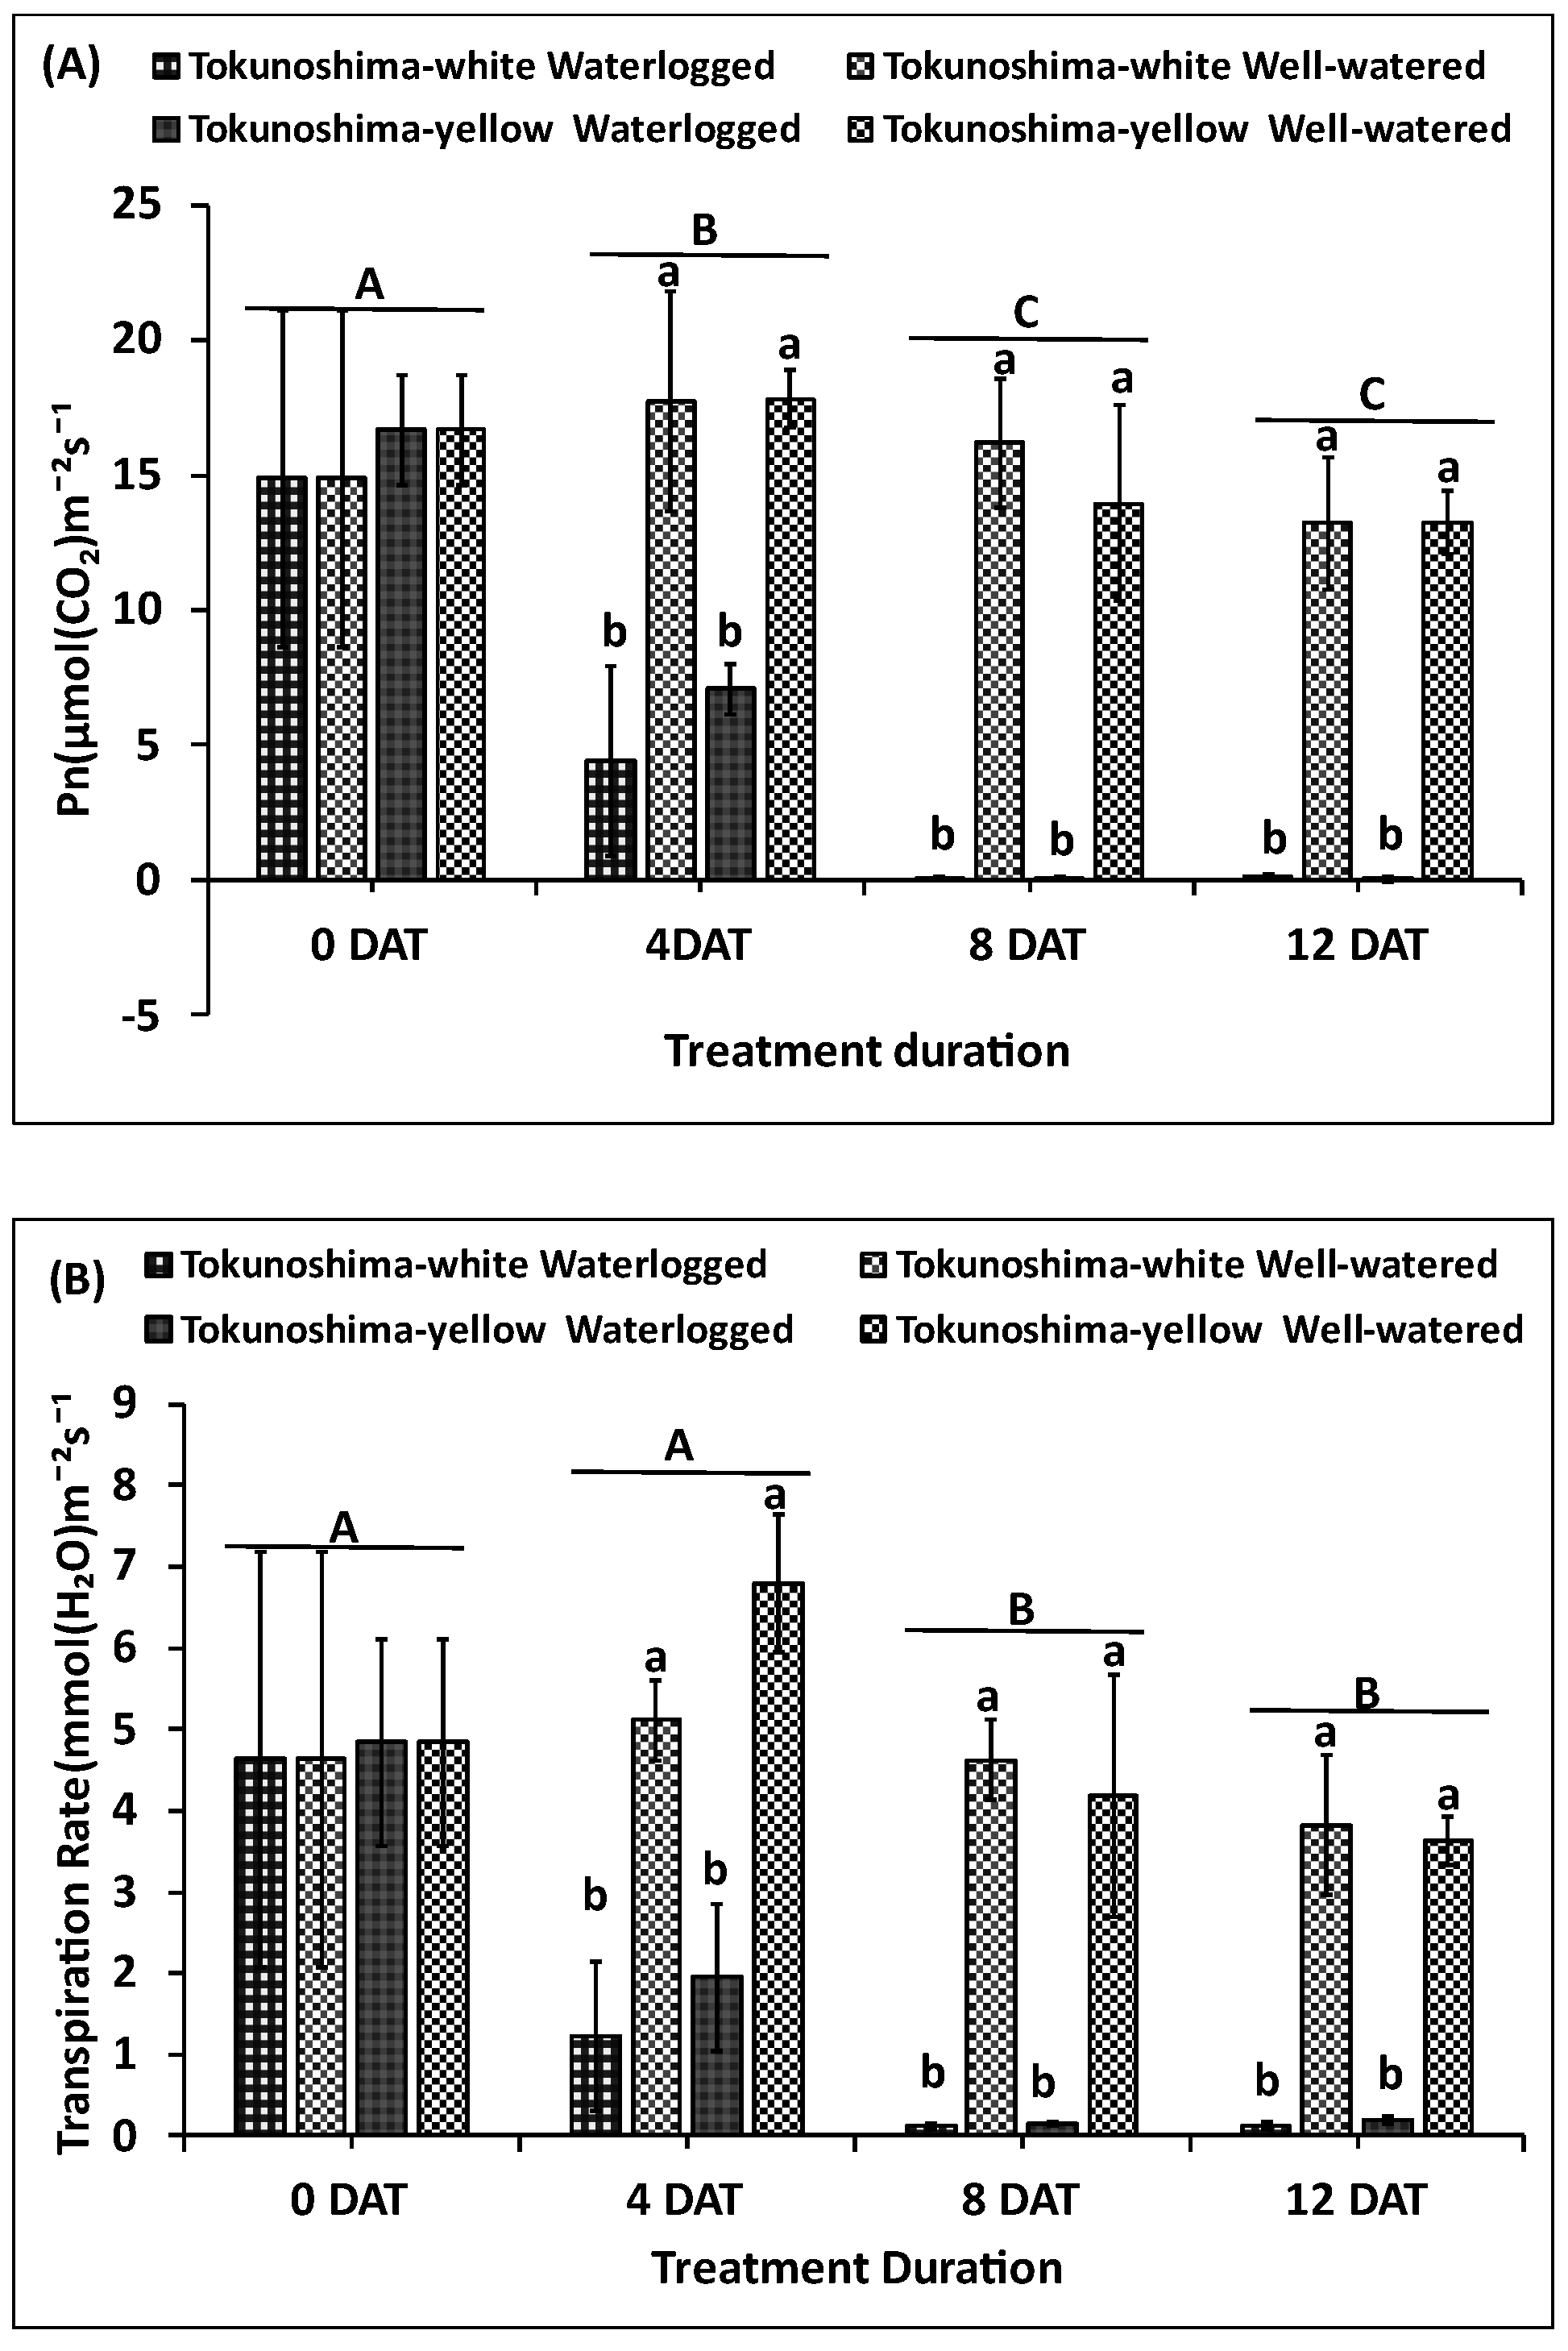
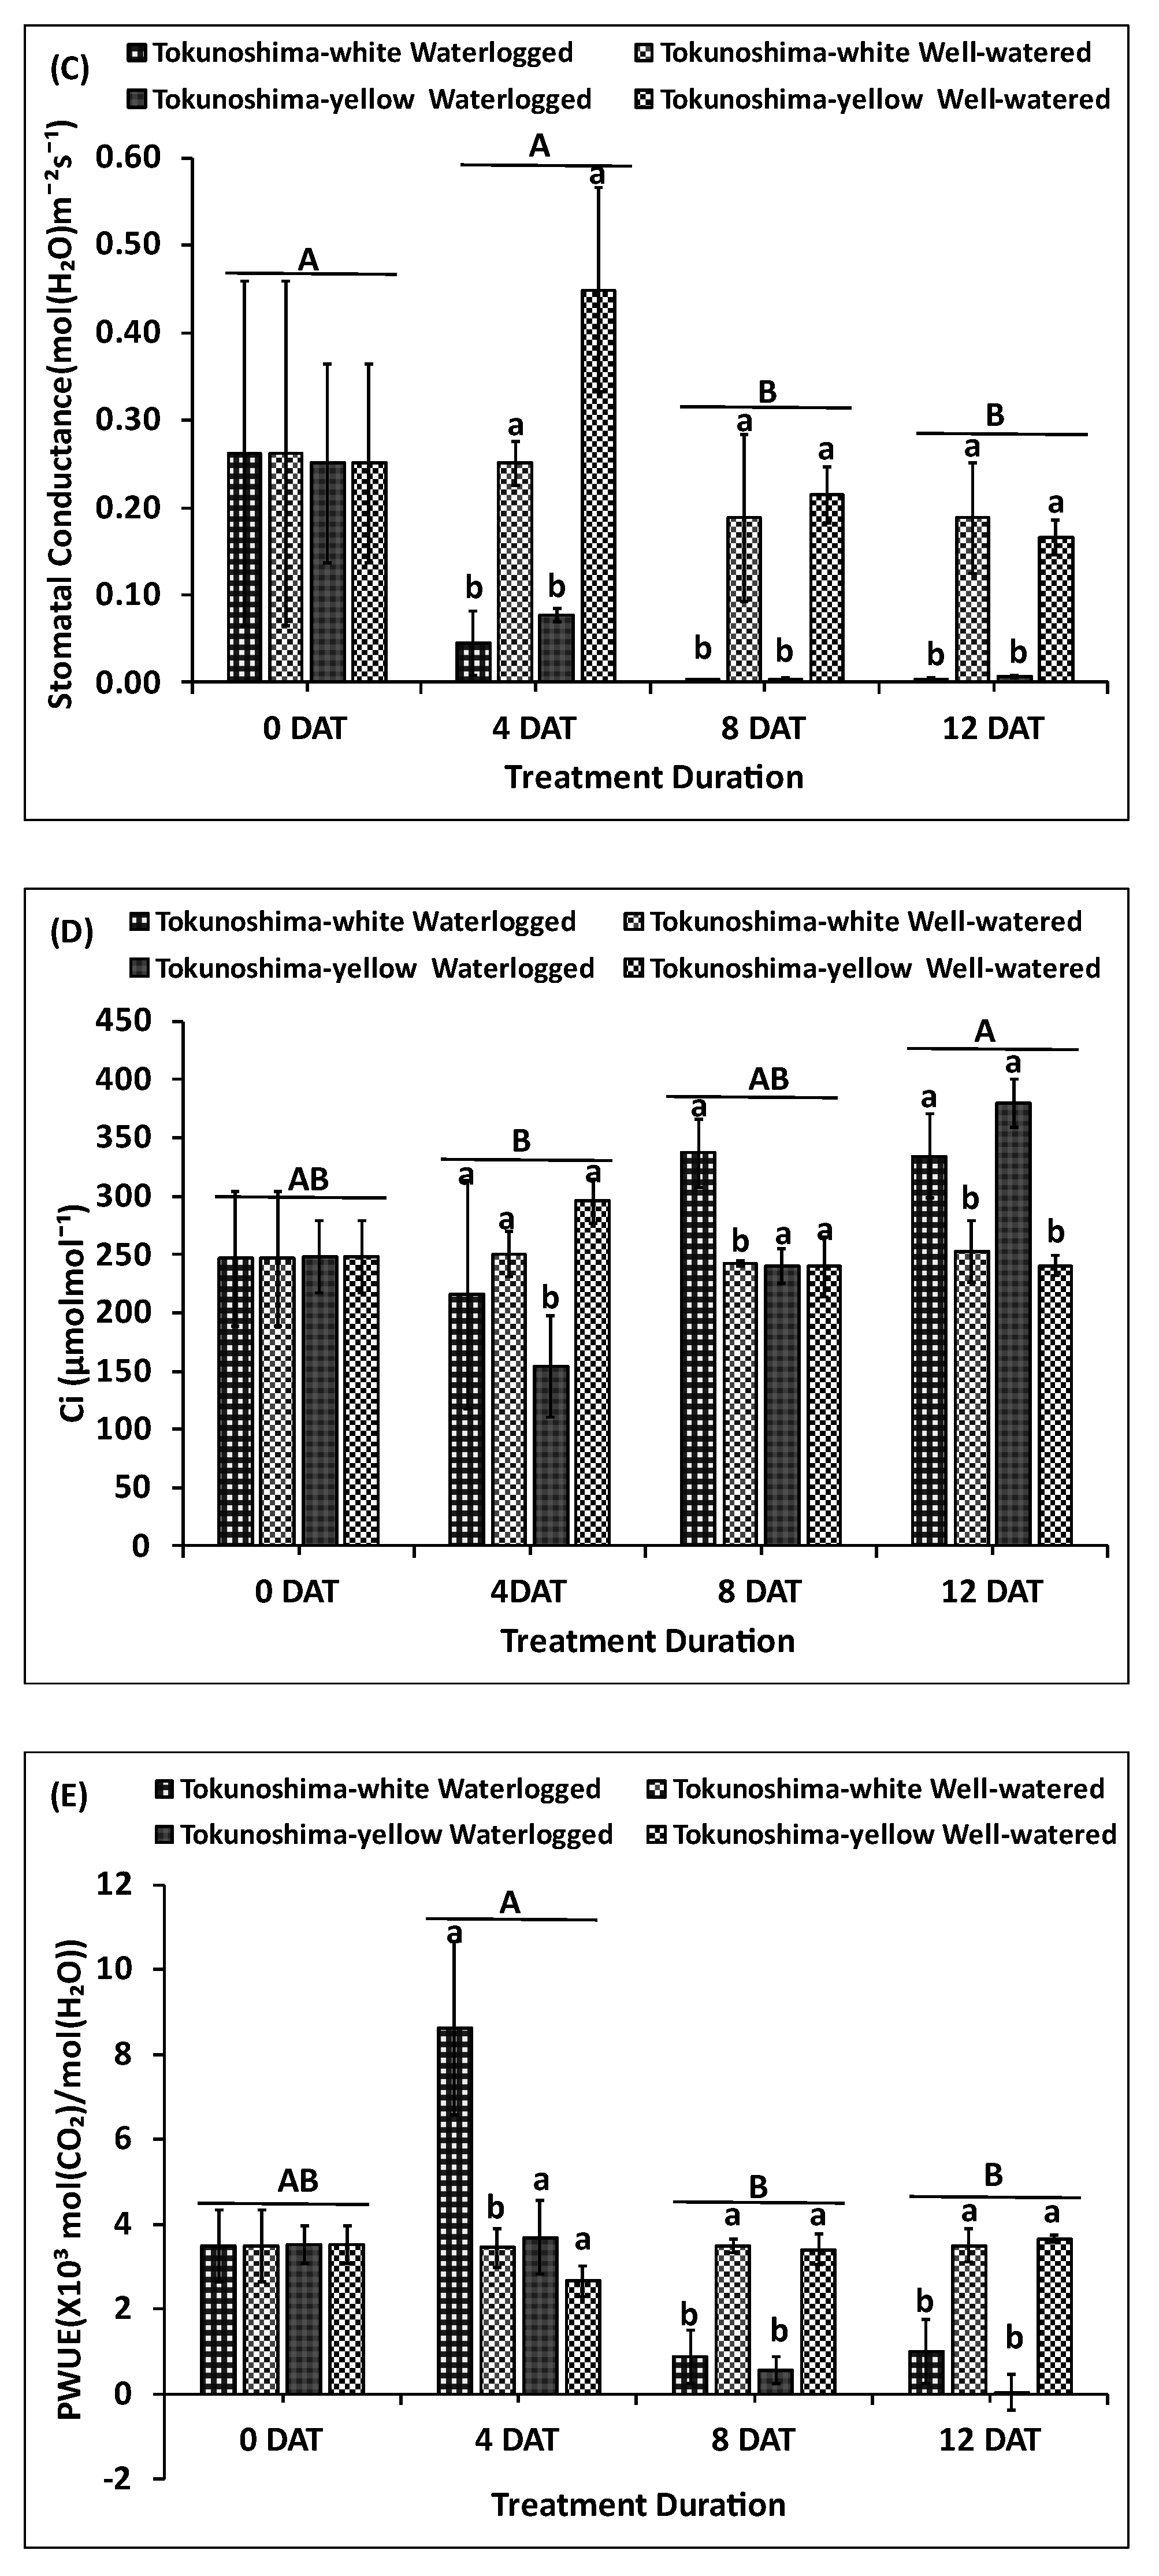
Figure 4.
Effects of various waterlogging durations on Fv/Fm (A), SPAD values (B), at early growth stage of cassava cultivars. Uppercase letters on top of bars indicate significant differences between waterlogging durations, while lower case indicate differences among the waterlogging treatment.
Figure 4.
Effects of various waterlogging durations on Fv/Fm (A), SPAD values (B), at early growth stage of cassava cultivars. Uppercase letters on top of bars indicate significant differences between waterlogging durations, while lower case indicate differences among the waterlogging treatment.
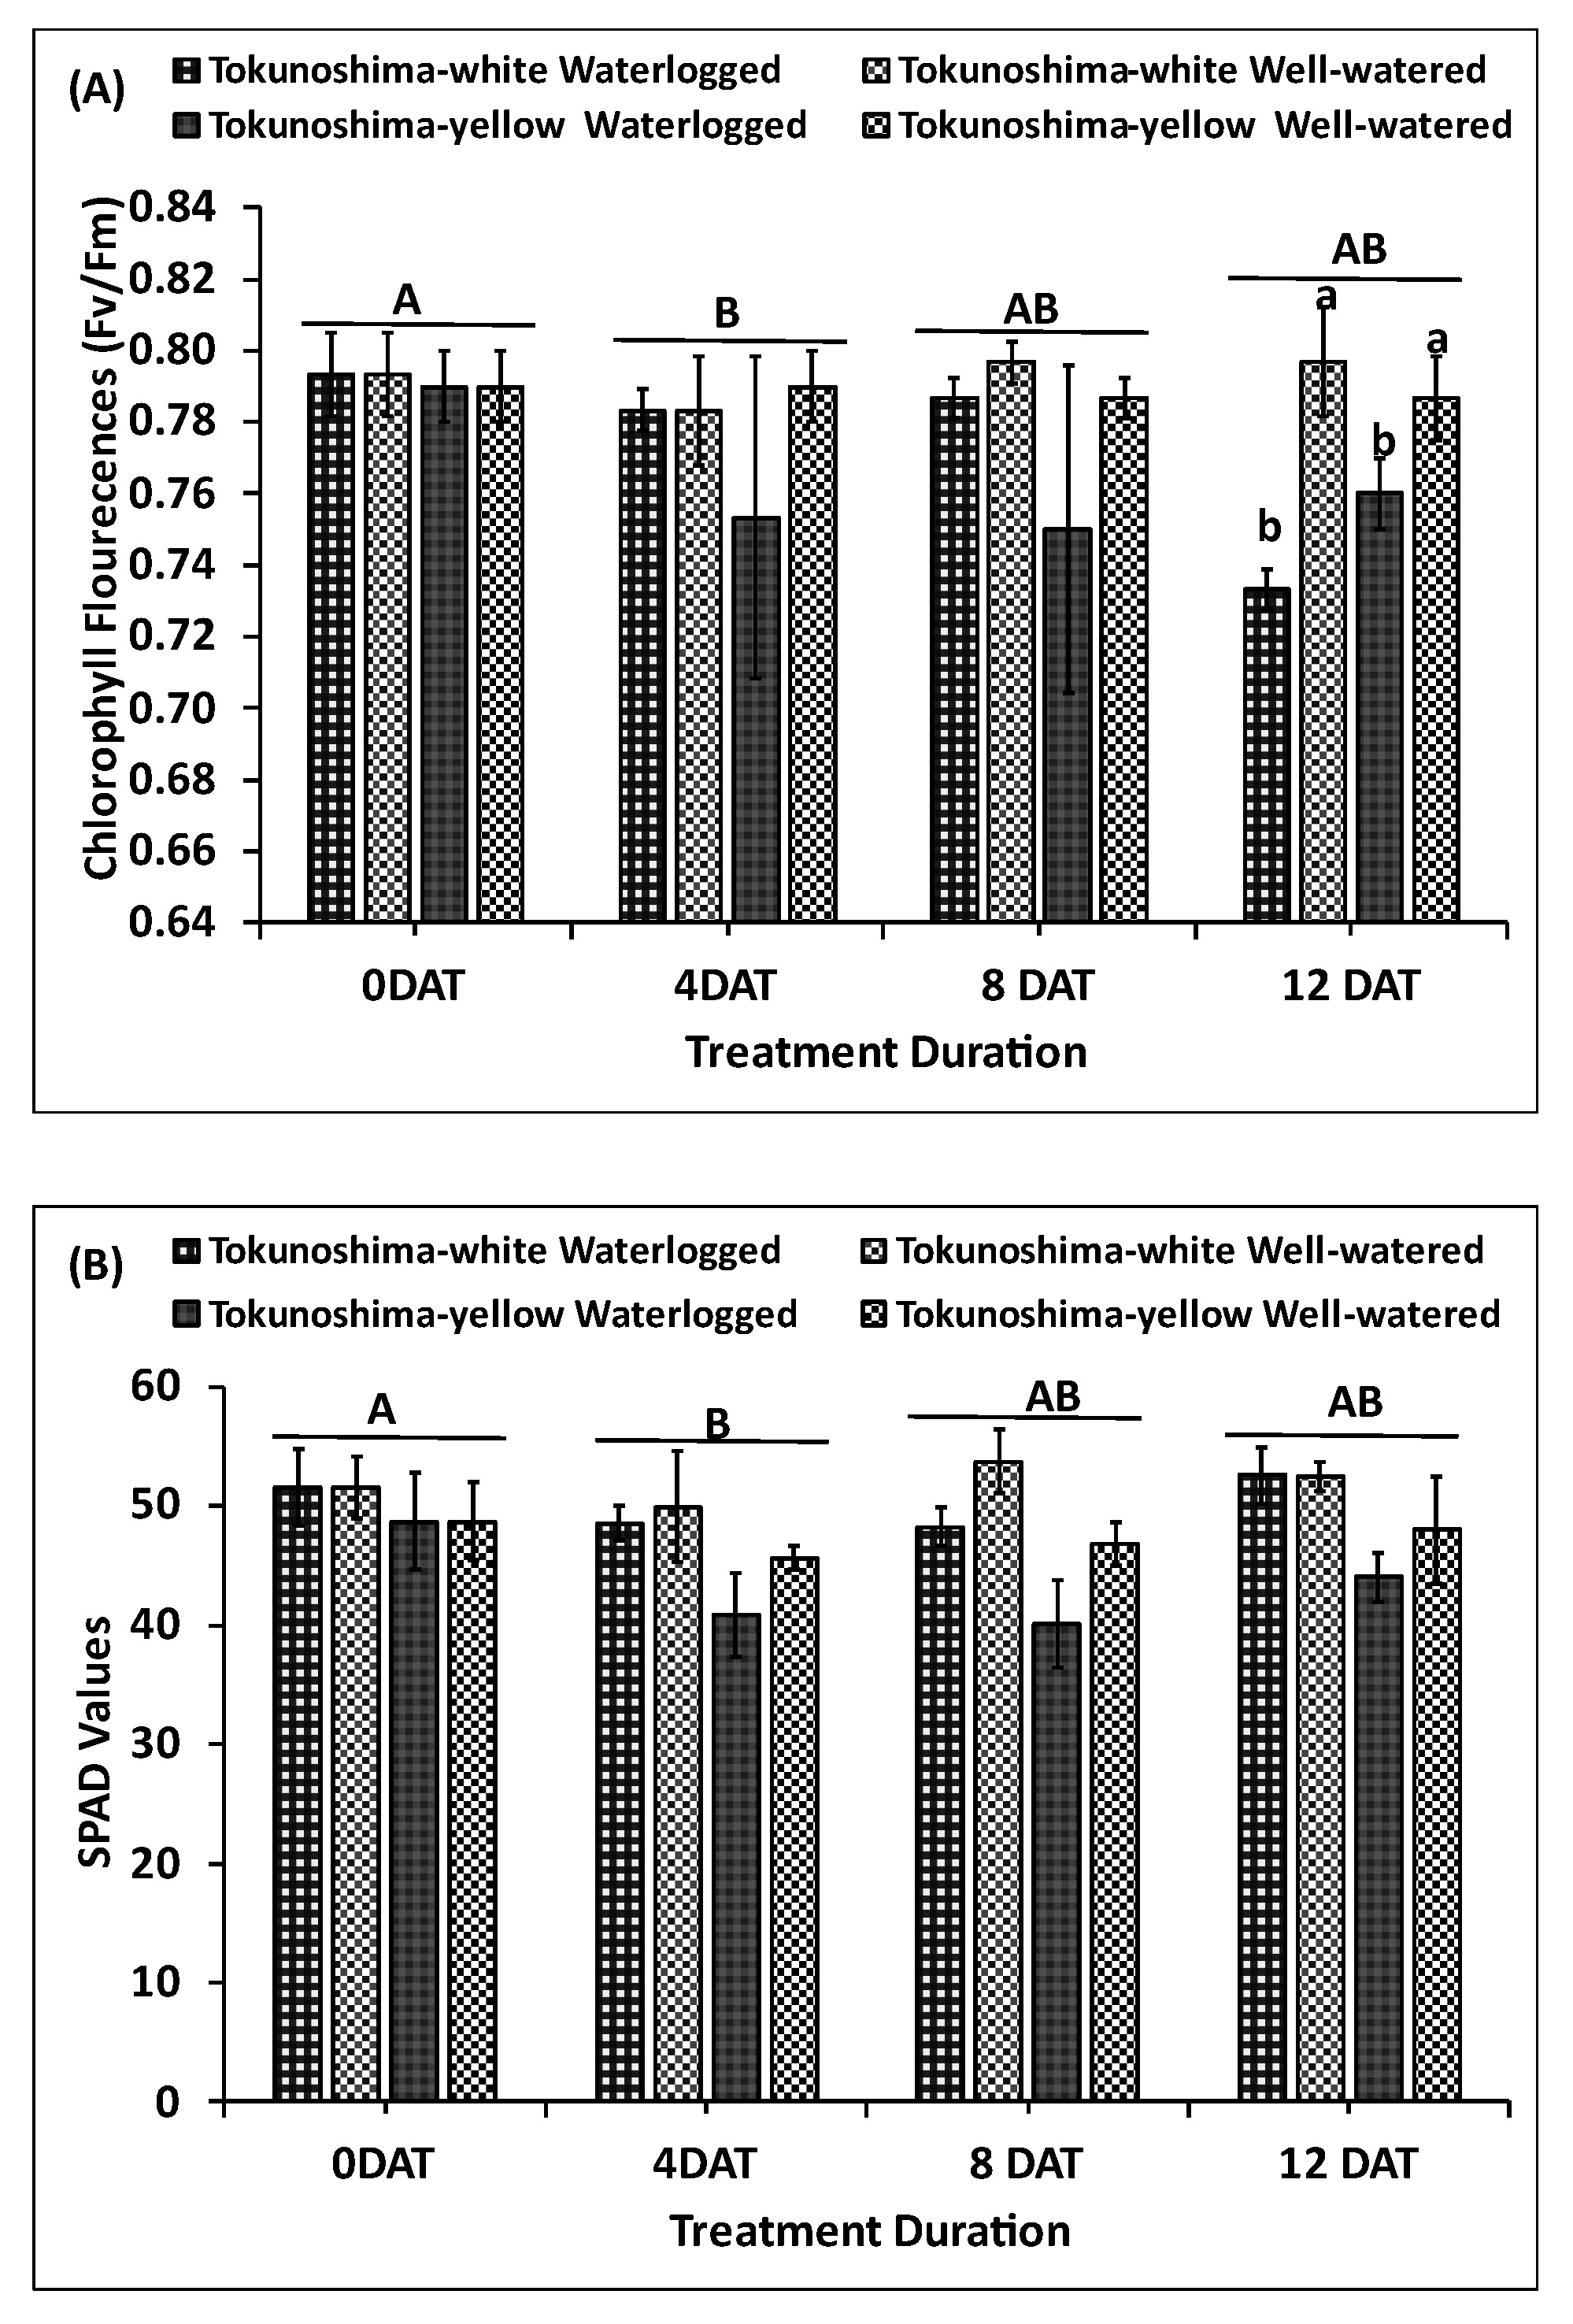
Figure 5.
Effects of various waterlogging durations on Plant Height (A), Number of Branches (B), and number of Leaves (C) at early growth stage of cassava cultivars. Uppercase letters on top of bars.
Figure 5.
Effects of various waterlogging durations on Plant Height (A), Number of Branches (B), and number of Leaves (C) at early growth stage of cassava cultivars. Uppercase letters on top of bars.
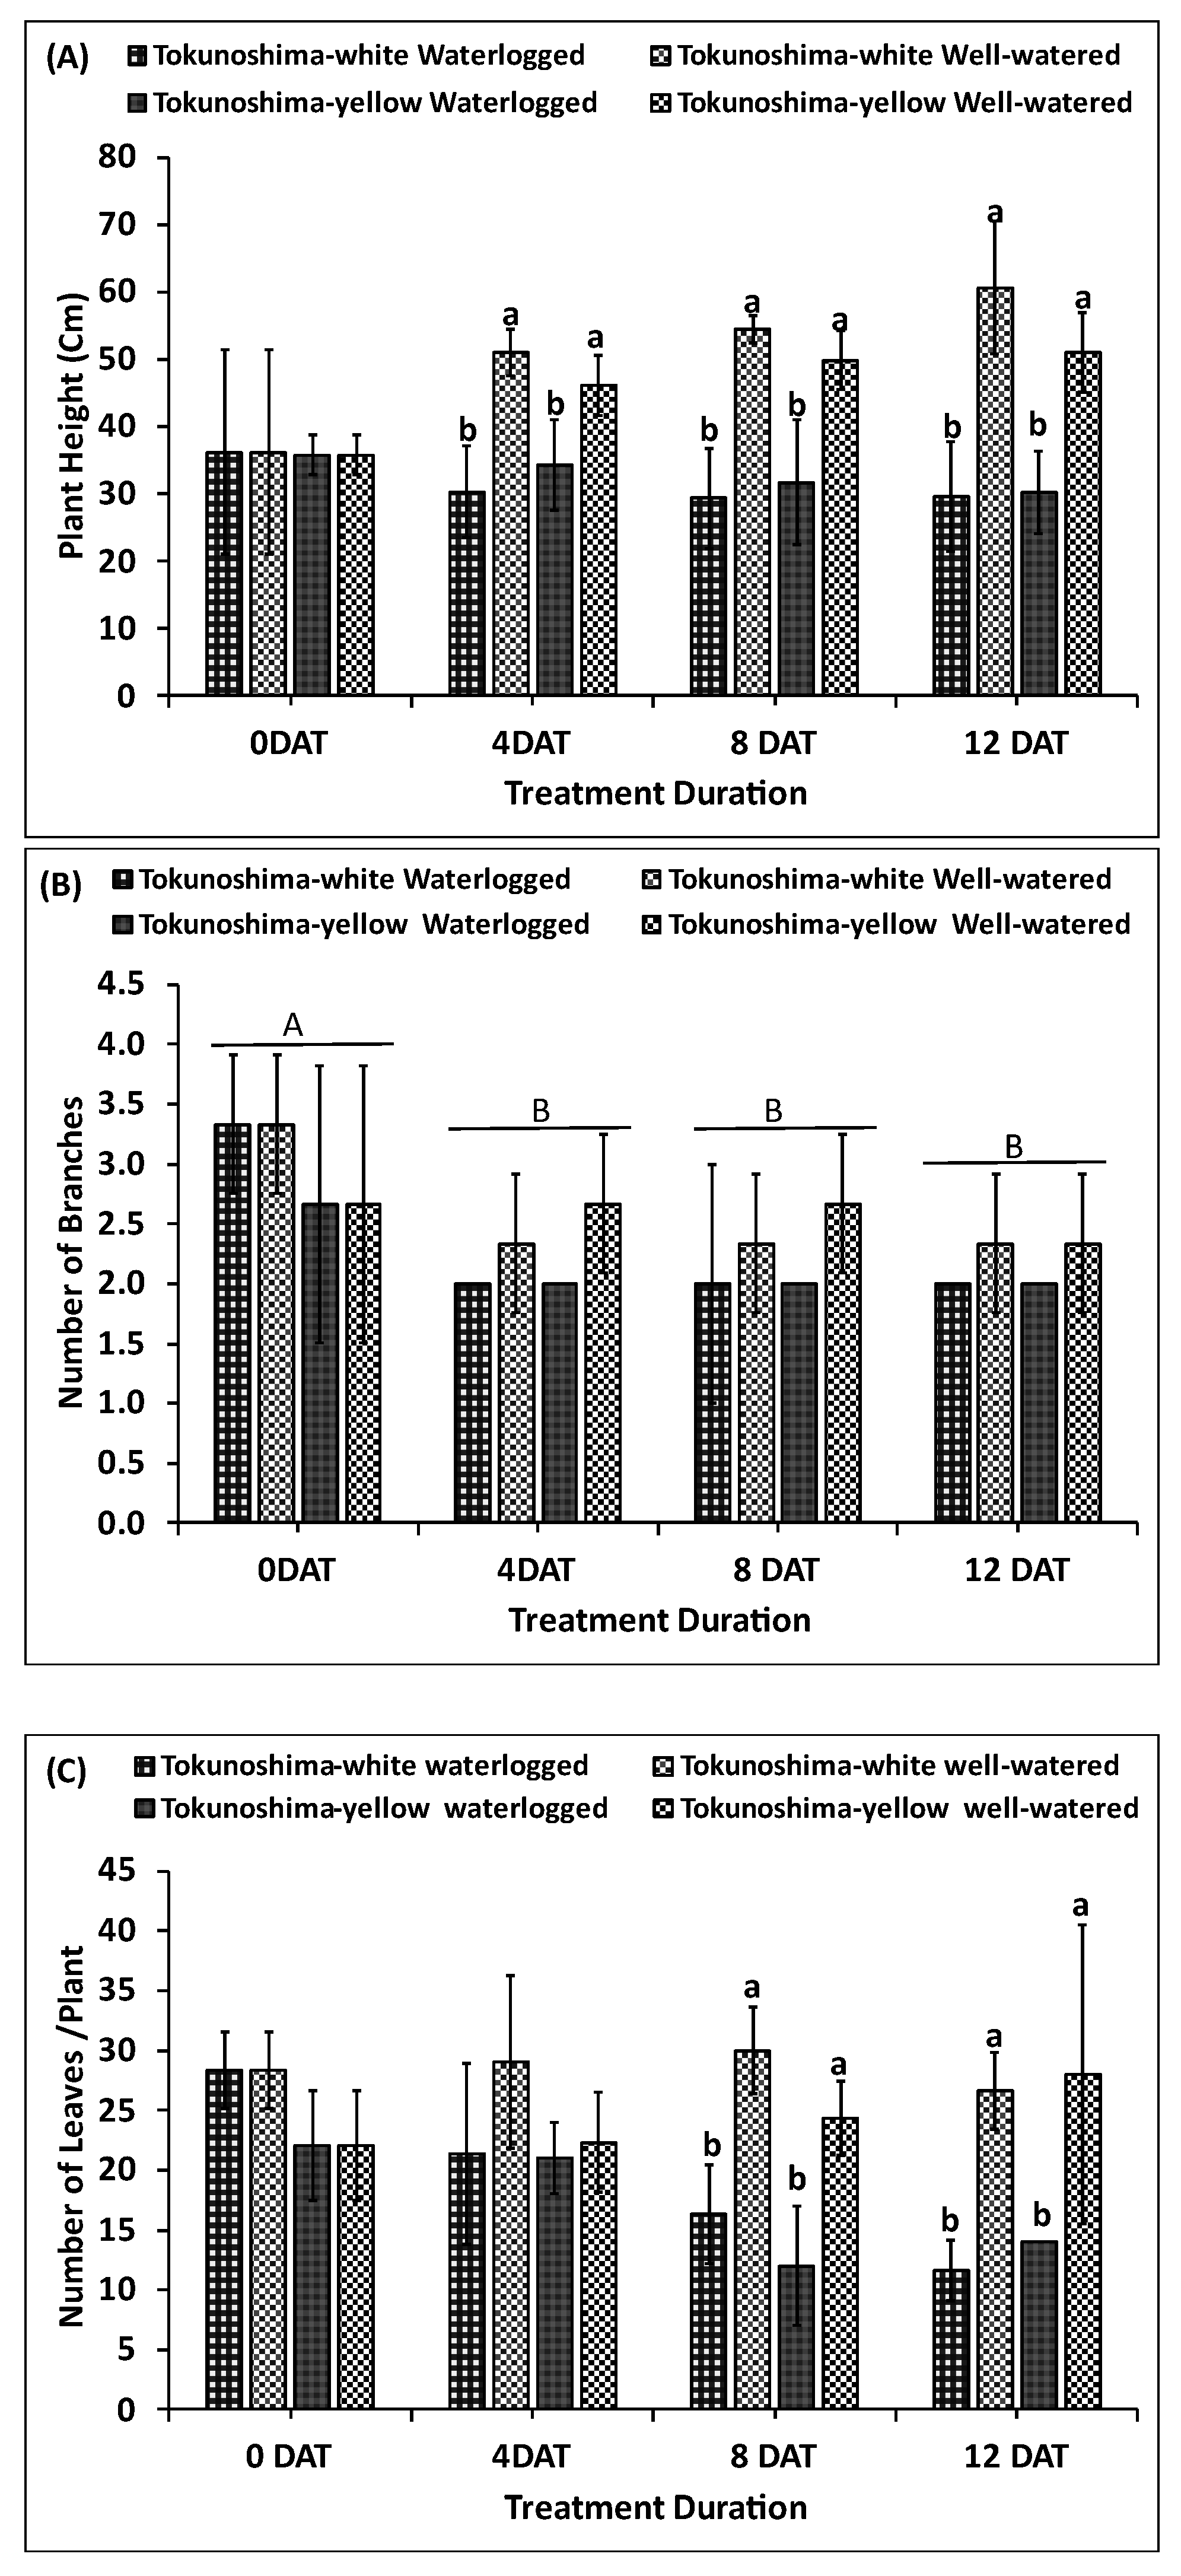
Figure 6.
Pearson’s correlation matrix of the changes in morphological parameters, leaf gas exchange and photosynthetic related parameters of the two cassava cultivars under well-watered treatments.
Figure 6.
Pearson’s correlation matrix of the changes in morphological parameters, leaf gas exchange and photosynthetic related parameters of the two cassava cultivars under well-watered treatments.
Disclaimer/Publisher’s Note: The statements, opinions and data contained in all publications are solely those of the individual author(s) and contributor(s) and not of MDPI and/or the editor(s). MDPI and/or the editor(s) disclaim responsibility for any injury to people or property resulting from any ideas, methods, instructions or products referred to in the content. |
© 2025 by the authors. Licensee MDPI, Basel, Switzerland. This article is an open access article distributed under the terms and conditions of the Creative Commons Attribution (CC BY) license (http://creativecommons.org/licenses/by/4.0/).
Copyright: This open access article is published under a Creative Commons CC BY 4.0 license, which permit the free download, distribution, and reuse, provided that the author and preprint are cited in any reuse.


