Submitted:
26 November 2025
Posted:
26 November 2025
You are already at the latest version
Abstract
This study investigates the mechanisms of topographic steering and the resultant track morphology of typhoon-like vortices over complex terrain. Leveraging a dynamic model based on potential vorticity (PV) conservation, we conducted a comprehensive sensitivity analysis over both an idealized bell-shaped mountain and the realistic topography of Taiwan. Results indicate that a triad of controls governs track evolution: vortex intensity (α), terrain geometry (dhB*/dt*), and interaction time (impinging angle γ). To quantify predictability, we introduce the Track Divergence Percentage (td), which partitions the phase space into distinct Track Diverging (TDZ) and Converging (TCZ) Zones. While idealized simulations established this fundamental structure, realistic experiments incorporating vortex decay revealed that orographic complexity and shallow approach angles (<145°) lead to regimes of hyper-sensitivity and "terrain capture." These findings establish a unified quantitative framework for understanding track bifurcation and looping, offering crucial insights for assessing forecast uncertainty in mountainous regions.
Keywords:
topographic steering
; typhoon track prediction
; track morphology
; potential vorticity
; track predictability
; complex terrain
; terrain capture
; sensitivity analysis
1. Introduction
1.1. Research Background and Motivation
1.1.1. Challenges of Typhoon Track Forecasting over Complex Terrain
Accurate prediction of tropical cyclone tracks remains a central challenge in atmospheric science, especially when storms interact with complex terrain. Over open oceans, track forecasts have improved steadily as understanding of vortex–environment interaction and data assimilation techniques has advanced [1,2,3]. Once a typhoon approaches steep islands or coastal mountain ranges, however, forecast errors often increase, and track behavior becomes more erratic [4,5,6]. Taiwan, with the Central Mountain Range (CMR) rising above 3 km, is a prime example of a natural laboratory where the flow is strongly constrained by orography and where even small changes in storm structure or approach path can lead to significant differences in landfall location, rainfall distribution, and societal impact [4,5,7].
Long-term climatological analyses have documented diverse track behaviors in the vicinity of Taiwan, including continuous crossings, discontinuous crossings, sharp northward or southward deflections, and looping or quasi-stationary tracks [4,5,8,9,10,11,12,13,14,15,16,17]. Continuous tracks typically maintain a coherent vortex as the typhoon skirts or crosses the CMR, often exhibiting cyclonically curved paths around the mountains [10,18]. Discontinuous tracks, in contrast, are characterized by the breakdown of the original vortex and the formation of a secondary low-pressure center on the lee side, which can abruptly replace the original center and produce a jump in the observed track [13,19]. Looping or stalling behavior has also been reported in cases where the storm interacts strongly with coastal terrain and mesoscale flow features, leading to complex track morphology that are difficult to anticipate in operational settings [12,13,16]. These behaviors underscore that, over complex terrain, typhoon tracks are not simply passive trajectories embedded in the large-scale flow, but the outcome of nonlinear multi-scale interactions between the vortex and the underlying mountains.
1.1.2. Topographic Steering Mechanisms and Track Uncertainty
A large body of work has identified several mechanisms by which terrain can influence typhoon motion, yet the combined effect of these mechanisms on forecast uncertainty remains poorly quantified. Orographic blocking and channeling can substantially reorganize the low-level flow and effective steering current. Observational and numerical studies around Taiwan have shown that the CMR can act as a barrier, deflecting tracks upstream of landfall, and can induce strong, terrain-parallel jets that favor southward or northward bending near the east coast [4,20,21,22]. Idealized and real-case simulations indicate that the magnitude and sign of deflection depend on storm intensity, size, and impinging angle, as well as on the detailed geometry of the terrain [10,11,12,18,19,22,23,24,25,26].
In parallel, topographic beta drift provides a more systematic steering tendency associated with sloping terrain. Studies of barotropic vortices over isolated topography and β planes demonstrate that vortices tend to drift toward higher terrain, in a manner analogous to planetary beta drift [27,28,29,30,31,32]. Laboratory experiments and rotating tank models have visualized this drift and clarified the role of depth-varying potential vorticity (PV) in controlling the vortex's self-propagation [28,30,33]. When combined with orographic blocking and channeling, the topographic beta drift tends to bias motion toward the northwest in the Taiwan region. It helps explain why specific approach paths repeatedly lead to preferred deflection directions [10,19,32,34,35,36].
Vorticity–terrain interaction forms a third pillar of the problem, linking internal storm structure to track evolution. Numerical experiments show that island terrain and associated surface friction, orographic lifting, and diabatic heating can redistribute vorticity, alter the size and asymmetry of the core, and even generate secondary vortices that drive discontinuous or looping tracks [11,12,16,23,24,37,38,39]. The response depends strongly on intensity, radius of maximum wind, and structural integrity: small, weak vortices are easily deformed and diverted, whereas large, intense storms tend to maintain coherent cores and exhibit more modest deflections for the same terrain configuration [18,21,24,38,39]. These internal adjustments add another layer of nonlinearity: track outcomes can change qualitatively when the storm crosses thresholds in intensity or structure, even if the environmental flow and terrain are unchanged.
From a forecasting perspective, these mechanisms directly translate into uncertainty. Ensemble and case-study analyses have shown that track errors often increase when a typhoon nears Taiwan and other mountainous regions, with ensemble members diverging into distinct regimes such as “north-side passage”, “south-side passage”, or “stall and loop” scenarios, where small initial differences can lead to significant changes in the integrated track [40,41,42,43]. PV-based diagnostics and theoretical work further indicate that small differences in PV tendency and steering flow can project onto large changes in the integrated track, especially near regime boundaries [32,41,44,45,46,47,48]. Yet most of these studies either emphasize individual mechanisms or focus on specific cases, making it difficult to generalize how track morphology and forecast sensitivity emerge from the combined dynamics.
1.1.3. PV-Based Dynamic Modeling and Motivation for This Study
Motivated by this gap, Chen [35] developed an innovative PV-based dynamic model that explicitly incorporates topographic steering into a compact set of governing parameters. By introducing the topographic adjusting parameter and the meridional adjusting velocity, the model links vortex intensity, environmental rotation, and terrain geometry to an effective topographic steering field [35]. The formulation is grounded in the classical PV framework for vortex motion [27,32,44,45,46,47,48] and is informed by laboratory evidence for vortex motion over topography [28,30,34,49,50]. Using idealized and realistic topography, Chen [35] showed that the model can reproduce many observed features of typhoon track deflection over Taiwan, including sensitivity to intensity, approach angle, and terrain slope.
At the same time, Chen [35] also highlighted critical open questions. The original model primarily examined representative deflection scenarios and focused on reproducing individual tracks, leaving the broader track morphology—continuous versus discontinuous crossings, northward versus southward paths, looping behavior—and the associated sensitivity structure in parameter space only partially explored. Furthermore, while the roles of vortex intensity, approach angle, and topographic steepness were qualitatively clarified, there is still no systematic map of where topographic steering leads to robust, convergent track outcomes versus highly uncertain, divergent ones. In other words, the field still lacks a quantitative framework that connects the known topographic mechanisms to explicit measures of track sensitivity and predictability over complex terrain.
These considerations motivate the present extension of the dynamic model [35] toward a more comprehensive exploration of track morphology and sensitivity. Building on the same PV-based foundation and the key mechanisms synthesized in earlier work [4,10,11,12,13,16,18,19,21,22,23,24,25,28,30,32,36,40,41,46,47], this study aims to treat typhoon-like vortices over idealized and realistic topography as a dynamical system whose track outcomes occupy a structured parameter space. By doing so, we seek to identify the regimes in which track morphology is controlled, the thresholds at which it bifurcates, and the conditions under which forecast uncertainty becomes intrinsically large. This research background and motivation provide the context for the model development and experiments described later in this paper.
1.2. Objectives and Contribution
1.2.1. Research Objectives
The overarching objective of this study is to develop a quantitative framework for diagnosing and interpreting typhoon track sensitivity over complex terrain, building on the PV-based dynamic model introduced by Chen [35]. Rather than focusing solely on individual case studies, we treat typhoon-like vortices over mountains as a dynamical system whose track outcomes occupy a structured parameter space. Within this perspective, the first goal is to construct a track sensitivity diagnostic based on a track divergence percentage, denoted as , which measures the fraction of trajectories that diverge beyond a prescribed tolerance when small perturbations are applied to initial vortex or environmental conditions. This diagnostic provides a compact, quantitative summary of the track's sensitivity to initial uncertainties across different combinations of vortex intensity, approach geometry, and terrain shape.
The second goal is to identify and quantify the spatial structure of track predictability in terms of distinct dynamical regimes. Specifically, we seek to delineate a Track Diverging Zone (TDZ), in which is high and trajectories rapidly spread apart; a Track Converging Zone (TCZ), in which is low and trajectories cluster tightly; and a Boundary Track (BT) that separates these regimes and behaves as a separatrix in the phase space of possible tracks. By mapping TDZ, TCZ, and BT in both physical and parameter space, we aim to connect intuitive notions of “high-risk” and “robust” track scenarios to explicit dynamical features of the model solutions.
A third goal is to clarify the controlling roles of vortex intensity, impinging angle, and terrain geometry in shaping track morphology. Using systematic parameter sweeps, we investigate how these factors govern transitions between continuous and discontinuous crossings, northward versus southward deflections, and the onset of looping or quasi-stationary behavior. We examine how variations in intensity and approach angle modulate the relative importance of blocking, channeling, topographic beta drift, and vorticity–terrain interaction within the unified dynamic framework.
The fourth goal is to compare predictability characteristics over idealized and realistic topography. Idealized bell-shaped mountains provide a clean setting to isolate fundamental mechanisms and to construct a baseline map of TDZ, TCZ, and BT. Realistic Taiwan topography, with multiple ridges and asymmetric slopes, is then used to assess how these idealized patterns are deformed, fragmented, or reinforced in a more complex setting. This comparison allows us to separate generic features of vortex–terrain interaction from those that are specific to the Taiwan orography.
Finally, a central objective of this work is to provide a theoretical basis for improving typhoon track forecasting over complex terrain. By linking measurable or forecastable storm characteristics (such as intensity and approach angle) and known topographic features to , TDZ/TCZ/BT structure, and track morphology, the proposed framework is intended to inform forecasters about situations in which track forecasts are intrinsically more or less reliable. In doing so, the study contributes a bridge between dynamical understanding and practical predictability assessment for landfalling typhoons in mountainous regions.
1.2.2. Paper Organization
The remainder of this paper is organized as follows. Section 2 reviews and extends the PV-based dynamic model of Chen [35], introduces the governing equations and nondimensional parameters. Section 3 presents a suite of numerical experiments over an idealized bell-shaped mountain, in which we systematically vary vortex intensity, impinging angle, and terrain geometry to explore track morphology and defines the track divergence percentage to map the associated TDZ, TCZ, and BT structures. Section 4 applies the extended model to realistic Taiwan topography and typhoon-like vortices, comparing the resulting track patterns and predictability structure with those obtained over the idealized mountain and highlighting similarities and differences that arise from real-world terrain complexity. Section 5 summarizes the main findings, discusses their implications for typhoon track forecasting and hazard assessment over complex terrain, and outlines directions for future work.
2. Theoretical Framework of the Dynamic Model
This study builds upon the dynamic model for strong cyclonic vortex motion over topography developed by Chen [35], extending the theoretical framework to investigate track sensitivity under varying vortex and terrain configurations. The model, grounded in potential vorticity (PV) conservation on a β-plane, provides a mechanistic understanding of how topographic forcing modulates vortex trajectories through the generation of meridional adjusting velocity (MAV).
2.1. Governing Equations and Key Assumptions
Following Chen [35], the motion of a strong cyclonic vortex over variable bottom topography is governed by the conservation of potential vorticity [47]:
where represents the PV, with being the Coriolis parameter, the beta parameter, the relative vorticity, and the total fluid depth. Here, denotes the unperturbed depth, the free surface depression induced by the vortex, and the bottom topography (Figure 1).
The model employs several key assumptions: (1) the vortex is strong with Rossby number , (2) the vortex can be approximated as having uniform core vorticity within radius , (3) free surface depression and topographic variations are small compared to the unperturbed depth (), and (4) the vortex maintains its structural integrity during terrain interaction.
Introducing non-dimensional variables with characteristic scales based on vortex radius , maximum azimuthal velocity , and topographic height , the non-dimensional PV conservation becomes:
with non-dimensional PV:
The four non-dimensional parameters governing the system are: the vortex Rossby number , the planetary Beta number , the topographic Beta number , and the vortex Beta number .
) and the impinging angle (). (b) Cross-sectional view showing the key physical parameters: unperturbed fluid depth (), topographic height (), maximum mountain height (), and free surface depression (). The vortex velocity is updated from to via the terrain-induced Meridional Adjusting Velocity, .
2.2. Meridional Adjusting Velocity and Track Evolution
The core innovation of Chen [35] is the derivation of the meridional adjusting velocity (MAV) that quantifies terrain-induced track deflection. As shown in Figure 1(a), the vortex velocity at time step consists of the current velocity and the MAV component :
Through PV conservation analysis, assuming constant vortex intensity and structure over short time intervals, the meridional displacement is found to be:
where the topographic adjustment parameter α is defined as:
Notably, the parameter α quantifies the intrinsic sensitivity of the vortex to topographic forcing.
The MAV for realistic finite-size vortices becomes:
where is the vortex rotation timescale. The MAV is thus proportional to both α and the rate of change of topographic height () along the vortex path.
2.3. Physical Interpretation and Key Findings from Chen [35]
The dynamic model reveals that vortex track deflection results from the interplay between three fundamental factors: (1) vortex intensity through α, (2) terrain geometry through , and (3) interaction duration. On windward slopes where , vortex compression generates negative MAV causing southward deflection. Conversely, on leeward slopes where , vortex stretching produces positive MAV driving northward recovery, creating characteristic S-shaped trajectories.
Chen [35] demonstrated that the magnitude of this deflection is governed by a triad of controls: vortex intensity (via α), topographic geometry (via ), and the impinging angle (via ) which determines the interaction time. The present study leverages this powerful framework to conduct a comprehensive sensitivity analysis, exploring how these controls shape track morphology and predictability in detail.
He also demonstrated that stronger vortices (larger α) experience more pronounced deflections, steeper terrain gradients amplify MAV magnitude, and shallower approach angles increase deflection through extended terrain interaction. The model successfully reproduced observed typhoon track behaviors including continuous and discontinuous tracks, providing a quantitative framework for understanding topographic steering mechanisms.
3. Fundamental Steering Mechanisms and Track Morphology over Idealized Terrain
To isolate the fundamental physical principles governing the interaction between a typhoon-like vortex and topography, we first conduct a series of experiments using an idealized, bell-shaped mountain. This idealized approach is a well-established methodology in geophysical fluid dynamics, allowing for a controlled investigation of specific mechanisms by minimizing the confounding effects of multi-scale complexities inherent in real-world terrain (e.g., [10,11,12,24,25]). The primary objective of this section is to perform a comprehensive sensitivity analysis within this simplified framework. By systematically varying the three core control parameters identified by the dynamic model—vortex intensity (α), impinging angle (γ), and terrain geometry ()—we aim to build a foundational understanding of how these factors collectively shape track morphology. The insights gained here will establish a baseline predictability structure, including the identification of divergent and convergent track regimes, which will serve as a crucial theoretical benchmark for the more complex, realistic simulations presented in Section 4.
3.1. Idealized Terrain Configuration and Experimental Design
3.1.1. Idealized Topography Settings
To systematically investigate track sensitivity, we first employ an idealized three-dimensional bell-shaped mountain, which serves as a clean experimental testbed. The terrain height, , is defined by the bell-shaped mountain equation following Lin et al. [10] and Chen [35]:
Following Lin et al. [10] with slight adjustments to simulate Taiwan's general characteristics, the mountain's center (, ) is located at 121°E, 23.5°N. The zonal () and meridional () half-widths are 40 km and 120 km, respectively. The shape parameter () is set to 2, the maximum height () is 3000 m, and the major axis orientation angle () is set to 15° (Figure 2a) to approximate Taiwan's northeast-southwest topographic alignment.
Figure 2(a) presents the topographic contours with solid and dashed lines representing 100 m and 1000 m elevations respectively. The terrain exhibits elliptical symmetry with steeper gradients in the x-direction due to the smaller half-width . Figure 2(b) displays latitudinal cross-sections from to at intervals, revealing systematic variations in terrain characteristics.
The northernmost profile (AA', ) shows minimal elevation (< 500 m), representing the terrain's northern periphery with gentle slopes. Profiles BB' () and CC' () exhibit increasing peak elevations approaching 2000 m, with symmetric rises from both east and west. The central profile DD' () captures the maximum elevation of 3000 m, displaying the steepest gradients with slopes exceeding near the peak. Southern profiles EE' () and FF' () show progressive elevation decrease while maintaining substantial relief. The southernmost profile GG' () returns to gentle topography similar to the northern boundary.
This idealized configuration creates controlled conditions for examining fundamental vortex-terrain interaction mechanisms. The terrain's meridional variation in elevation and gradient steepness enables systematic investigation of how different topographic characteristics influence track deflection. The elliptical shape with prescribed orientation allows exploration of approach angle effects while maintaining geometric simplicity for physical interpretation.
3.1.2. Typhoon-like Vortex Initialization
Four typhoon-like vortices (S1-S4) are configured to span a range of intensities representative of moderate typhoons commonly observed in the Western North Pacific (e.g., [1,3,43]). Initial conditions include core vorticity , maximum wind speed with corresponding radius , uniform unperturbed depth , and initial translation speed . The dynamic model employs a 150-second time step with terrain gradients calculated on a 250 m grid. The impinging angle γ, defined as the angle between the vortex motion and the normal to the terrain's central axis (Figure 1a), varies from 195° to 125° to explore the full spectrum from near-perpendicular to ultra-shallow approaches. Table 1 summarizes the experimental parameters and key derived quantities including the topographic adjusting parameter α for each configuration.
), radius of maximum wind (), and core relative vorticity (). Also listed are key non-dimensional parameters derived from these characteristics: the vortex Rossby number () and the topographic adjustment parameter (α). The experimental configuration for each set of simulations is defined by the impinging angle (γ) and the initial latitudinal spacing between scanned tracks (Δy). Temporal parameters include the total simulation time (ΣT) and the approximate time of landfall (). The primary diagnostic outputs, the maximum () and minimum () track divergence percentages, are also presented.
| Figure | Vortex | (deg) | (hrs) | (hrs) | ||||||||
| 3(a) | S1 | 40 | 200 | 0.0004 | 3.7 | 32.1 | 195 | 0.125 | 20.83 | 12.50 | 151 | -62 |
| 3(b) | S2 | 40 | 150 | 0.0005 | 4.9 | 55.3 | 195 | 0.125 | 20.83 | 13.00 | 347 | -84 |
| 3(c) | S3 | 30 | 100 | 0.0006 | 5.5 | 92.4 | 195 | 0.125 | 20.83 | 13.25 | 616 | -89 |
| 3(d) | S4 | 30 | 75 | 0.0008 | 7.3 | 160.9 | 195 | 0.125 | 20.83 | 13.58 | 1128 | -98 |
| 3(e) | S1 | 40 | 200 | 0.0004 | 3.7 | 32.1 | 170 | 0.125 | 22.92 | 12.62 | 140 | -61 |
| 3(f) | S2 | 40 | 150 | 0.0005 | 4.9 | 55.3 | 170 | 0.125 | 22.92 | 13.42 | 358 | -84 |
| 3(g) | S3 | 30 | 100 | 0.0006 | 5.5 | 92.4 | 170 | 0.125 | 22.92 | 13.88 | 738 | -92 |
| 3(h) | S4 | 30 | 75 | 0.0008 | 7.3 | 160.9 | 170 | 0.125 | 22.92 | 14.54 | 1410 | -100 |
| 4(a) | S1 | 40 | 200 | 0.0004 | 3.7 | 32.1 | 145 | 0.125 | 31.25 | 15.75 | 195 | -69 |
| 4(b) | S2 | 40 | 150 | 0.0005 | 4.9 | 55.3 | 145 | 0.125 | 31.25 | 17.42 | 667 | -92 |
| 4(c) | S3 | 30 | 100 | 0.0006 | 5.5 | 92.4 | 145 | 0.125 | 31.25 | 18.33 | 1180 | -99 |
| 4(d) | S4 | 30 | 75 | 0.0008 | 7.3 | 160.9 | 145 | 0.125 | 31.25 | 19.5 | 983 | -100 |
| 4(e) | S1 | 40 | 200 | 0.0004 | 3.7 | 32.1 | 125 | 0.125 | 50.00 | 24.58 | 462 | -87 |
| 4(f) | S2 | 40 | 150 | 0.0005 | 4.9 | 55.3 | 125 | 0.125 | 50.00 | 28.83 | 2029 | -100 |
| 4(g) | S3 | 30 | 100 | 0.0006 | 5.5 | 92.4 | 125 | 0.125 | 50.00 | 30.67 | 2770 | -100 |
| 4(h) | S4 | 30 | 75 | 0.0008 | 7.3 | 160.9 | 125 | 0.125 | 50.00 | 32.92 | 0 | -100 |
| 9(a) | S3 | 30 | 100 | 0.0006 | 5.5 | 92.4 | 195 | 0.120 | 16.67 | 6.38 | 2456 | -96 |
| 9(b) | S3 | 30 | 100 | 0.0006 | 5.5 | 92.4 | 170 | 0.160 | 16.67 | 7.08 | 7034 | -99 |
| 9(c) | S3 | 30 | 100 | 0.0006 | 5.5 | 92.4 | 145 | 0.160 | 20.83 | 9.46 | 637 | -89 |
| 9(d) | S3 | 30 | 100 | 0.0006 | 5.5 | 92.4 | 125 | 0.260 | 33.33 | 16.54 | 2057 | -96 |
| * For comparison, all parameters are calculated with reference to a latitude of 22°N. | ||||||||||||
3.2. Analysis of Track Sensitivity to Vortex Intensity, Structure, and Landing Position
Figure 3 presents a comprehensive sensitivity analysis of typhoon-like vortex tracks traversing the idealized bell-shaped mountain under varying vortex intensities and impinging angles. Panels (a)-(d) display the scanned trajectories for vortices S1-S4 approaching at a fixed impinging angle of 195°, while panels (e)-(h) show corresponding tracks for an impinging angle of 170°. For each vortex configuration, 31 parallel tracks are initialized at 123°E longitude, spanning from 21.65°N to 25.40°N (panels a-d) and 20.95°N to 24.70°N (panels e-h) with a latitudinal spacing of 0.125°. The computational durations are 20.83 hours and 22.92 hours for the 195° and 170° cases, respectively. The open pink circles mark locations of maximum dimensionless topographic height change rate (), while blue crosses indicate minimum values, providing crucial insights into the vortex-topography interaction dynamics.
The physical interpretation of , as established in Equation (12) of the PV-based dynamic model of Chen [35], represents the rate of vortex thickness compression or stretching during terrain traversal. On windward slopes where , vortex compression induces a negative MAV, resulting in southward deflection. Conversely, on leeward slopes where , vortex stretching generates a positive MAV, driving northward deflection [10,18]. This differential forcing on the windward and leeward sides is the fundamental mechanism responsible for the characteristic S-shaped trajectories, a dynamic response consistent with the principles of potential vorticity conservation over variable-depth flows and the concept of topographic beta drift [27,28,29,30,31]. The spatial distribution of these extrema reveals that maximum occurs where the vortex motion aligns with the local terrain gradient (upslope motion), while minimum values occur where these vectors oppose each other (downslope motion).
According to the theoretical framework established by Equations (6) and (7), the topographic adjusting parameter α increases proportionally with vortex intensity , amplifying the terrain's steering effect [18,22,25,38,39]. This amplification becomes particularly pronounced when vortices approach the mountain center, where steeper terrain gradients maximize the magnitude of [11]. The synergistic enhancement of both α and produces substantially intensified MAV responses. This mechanism is clear in the stronger vortices S3 and S4 (panels c, d, g, h), where tracks making landfall from the northeastern sector exhibit dramatic cyclonic deflection along the mountain ridge. These vortices demonstrate pronounced southward veering as they ascend the windward slopes, with deflection magnitudes significantly exceeding those of weaker vortices S1 and S2, consistent with idealized and real-case simulations of typhoon deflection along Taiwan’s Central Mountain Range and similar barriers [8,9,10,11,12,16,18,19,20,21,22,23,25].
A striking feature of the strongly deflected tracks is their subsequent anticyclonic recovery upon reaching the southern, relatively flat terrain regions. As these vortices transition to areas of reduced topographic variation, abruptly decreases to its most negative values, generating strong positive MAV that drives rapid northward adjustment. This recovery mechanism ultimately redirects the vortices toward their original westward heading through an anticyclonic turning motion, completing the characteristic S-shaped trajectory documented in Chen [35] and consistent with earlier idealized simulation of cyclone-terrain interaction [10,12,19,24].
A comparative analysis across Figure 3 reveals the critical roles of vortex intensity and impinging angle. The weaker vortices, S1 and S2, exhibit much less pronounced deflections due to their smaller α values (32.1 and 55.3, respectively, as shown in Table 1), resulting in a subdued MAV response even when encountering steep terrain. Their tracks appear more passive, conforming gently to the topographic contours. In contrast, the stronger vortices S3 and S4 (α = 92.4 and 160.9) display a highly dynamic response. This finding, where stronger vortices (associated with larger α values in our model) experience more significant deflections, is consistent with numerous idealized and real-case simulation studies which have also demonstrated a positive correlation between vortex intensity and the magnitude of topographic steering (e.g., [9,18,22,23,24,37,39]).
Comparing the 195° cases (panels 3a-d) with the 170° cases (panels 3e-h), the shallower impinging angle (170°) clearly enhances the track deflection. This is because a shallower approach prolongs the interaction time between the vortex and the steepest parts of the mountain. This relationship between shallower approach angles and amplified track deflection has been a robust finding in previous numerical studies [12,13,14,41,42], which attribute it to the extended residence time of the vortex within the region of strong orographic forcing.
More precisely, a shallower approach allows the MAV to act over a longer duration and accumulate a greater meridional displacement. Consequently, the southward deflections and subsequent northward recoveries are sharper and more pronounced for the 170° cases (e.g., compare Figure 3d with 3h), underscoring the dynamic interplay between vortex characteristics, approach geometry, and topographic forcing as captured by the model. This enhanced sensitivity aligns with the findings in Section 3 of Chen [35], where shallower impinging angles were shown to amplify track curvature through prolonged exposure to terrain gradients. The spatial distribution of extrema also shifts with impinging angle, with the 170° cases showing more dispersed patterns of compression and stretching zones, indicating more complex vortex-terrain interactions.
) on the windward slope, while blue crosses indicate locations of maximum stretching () on the leeward slope.
Furthermore, the track evolution patterns demonstrate clear evidence of the topographic beta effect, where vortices exhibit preferential drift directions based on the combined influence of terrain slope and vortex circulation [31,32,33,34,35,36]. Northern landing tracks generally maintain more zonal trajectories due to weaker terrain interaction, while southern tracks experience enhanced meridional displacement through the coupling of stronger terrain gradients with the vortex's inherent dynamics. This meridional variability underscores the critical importance of accurate landfall position prediction for operational forecasting, as small uncertainties in initial position can lead to substantially different track outcomes, particularly for intense vortices approaching at oblique angles.
3.3. Extended Analysis of Track Sensitivity under Shallower Impinging Angles
Figure 4 extends the sensitivity analysis to shallower impinging angles, presenting scanned trajectories for vortices S1-S4 at 145° (panels a-d) and 125° (panels e-h). The computational domains are adjusted southward to accommodate the enhanced deflections expected from more oblique approaches, with initial latitudes ranging from 19.50°N to 23.375°N for 145° cases (31 tracks) and 16.125°N to 20.75°N for 125° cases (38 tracks). The extended computational periods of 31.25 hours and 50.00 hours, respectively, reflect the prolonged terrain interaction times characteristic of shallower approach angles.
The most striking feature in Figure 4 is the systematic intensification of track deflection with decreasing impinging angle, particularly evident when compared to the 195° and 170° cases in Figure 3. At 145° (panels a-d), all vortices exhibit pronounced southward veering during windward ascent, with the deflection magnitude scaling proportionally with vortex intensity. The stronger vortices S3 and S4 demonstrate dramatic track clustering and convergence toward the southern terrain boundary, indicating that the topographic steering effect has become the dominant control on vortex motion. This behavior directly reflects the enhanced meridional adjusting velocity (MAV) response arising from the extended exposure to positive values during the prolonged upslope traverse.
The 125° cases (panels e-h) represent near-critical conditions where topographic influence overwhelms the vortex's intrinsic westward motion. For the strongest vortex S4 (panel h), tracks originating from central and northern positions undergo extreme southward deflection, with some trajectories deviating by more than 3° latitude before executing sharp anticyclonic recovery. This extreme response emerges from the multiplicative interaction between the large topographic adjusting parameter (α = 160.9 for S4) and the sustained high values of encountered during the extended oblique ascent. The spatial distribution of extrema (pink circles and blue crosses) reveals that vortices at shallower angles experience these extreme values over longer distances, amplifying the integrated steering effect.
A critical distinction between Figure 3 and Figure 4 lies in the track morphology evolution. While Figure 3 shows relatively smooth S-shaped curves, Figure 4 exhibits increasingly sharp angular deflections, particularly at track inflection points. This morphological transition indicates a regime shift from gradual topographic modulation (high impinging angles) to abrupt terrain-forced redirection (low impinging angles). The transition is most evident in comparing the same vortex across different angles: S3 at 195° (Figure 3c) shows gentle curvature, while S3 at 125° (Figure 4g) displays sharp, almost discontinuous direction changes. This evolution aligns with the theoretical framework in Chen [35], where the MAV response becomes increasingly nonlinear as the product of α and approaches critical values.
The track density patterns reveal another important characteristic: as impinging angle decreases, the initially parallel tracks exhibit increasing divergence after terrain interaction. This divergence is minimal for weak vortices (S1, S2) but becomes substantial for strong vortices (S3, S4), indicating that the sensitivity to initial position increases nonlinearly with both vortex intensity and obliqueness of approach. This finding has significant implications for track predictability, suggesting that forecast uncertainty amplifies dramatically for intense typhoons approaching terrain at shallow angles, consistent with ensemble and idealized studies highlighting enhanced spread for oblique landfall scenarios [12,20,41,42].
3.4. Synthesis of Track Morphology Controls
The comprehensive results presented in Figure 3 and Figure 4 allow for the deconstruction of typhoon track morphology over complex terrain into three primary controlling factors, all intrinsically linked to the parameters of the dynamic model.
3.4.1. Vortex Intensity Control (α-Modulation)
The topographic adjusting parameter α, which scales with vortex intensity according to Equation (6), fundamentally determines the vortex's susceptibility to terrain steering. Weak vortices (S1, α = 32.1) maintain quasi-linear trajectories across all impinging angles, exhibiting only modest deflections even under prolonged terrain exposure. In contrast, strong vortices (S4, α = 160.9) experience dramatic track alterations, with deflection magnitudes increasing super-linearly with decreasing impinging angle. This intensity control creates a bifurcation in track behavior: below a critical α threshold (approx. 30), vortices largely maintain their environmental steering, while above this threshold, topographic influence dominates the trajectory.
3.4.2. Terrain Geometry Control (
-Forcing):
The instantaneous terrain forcing, quantified by , provides the immediate driver for track deflection through the MAV mechanism, consistent with PV-based interpretations of vortex motion over variable depth and topography [26,27,28,29,30,31,47] and the dynamic model formulation of Chen [35]. The spatial gradients of terrain height create distinct compression (positive ) and stretching (negative ) zones that systematically deflect vortex tracks southward and northward, respectively. The magnitude of depends on both the local terrain gradient and the vortex's instantaneous velocity vector, creating a dynamic feedback where track deflection modifies the subsequent terrain encounter angle, thereby altering future values. This terrain geometry control aligns with studies emphasizing the role of mountain height, steepness, and shape in modulating topographic forcing [11,12,19,25,28]. This feedback mechanism explains the observed track convergence patterns, where neighboring trajectories cluster toward preferential pathways determined by the terrain's geometric configuration [8,9,10,11,12,15,18,19,20,21,22,23,25,37,41,42].
3.4.3. Temporal Integration Control (Residence Time Effect)
The impinging angle (γ) modulates the cumulative impact of the topographic forcing by controlling the duration of the vortex-terrain interaction. A shallower angle forces a longer path across the terrain, extending the time over which the MAV can act on the vortex and reinforcing the residence-time control on track deflection documented in previous idealized and real-case studies [12,20,21,22,41,42]. This integration of the MAV over time is crucial, consistent with previous studies showing that shallower approach angles lead to more pronounced deflections due to prolonged terrain interaction [12,13,14,24,27,28,29]. A brief but strong forcing (steep angle, central landing) may produce a notable "S" curve, as seen in Figure 3. However, a sustained, strong forcing (shallow angle, central landing) allows for the accumulation of a massive meridional displacement, ultimately leading to the extreme looping behavior observed in Figure 4, similar to the looping tracks documented in observational studies [13].
These three control mechanisms operate synergistically, with their combined effect determining the final track morphology. The observed S-shaped trajectories emerge from the sequential action of these controls: initial southward deflection driven by positive during windward ascent (modulated by α), followed by northward recovery from negative during leeward descent, with the overall deflection magnitude controlled by the residence interaction time. This mechanistic understanding provides a robust framework for predicting typhoon track responses to complex terrain under varying approach conditions.
3.5. A Diagnostic Framework for Track Sensitivity: The Track Divergence Percentage
3.5.1. Track Sensitivity Zones Identification by Track Divergence Percentage
To quantitatively diagnose the spatial evolution of track sensitivity, we introduce a novel metric, the track divergence percentage (), defined in Equation (9) as:
where represents the inter-track spacing at time and is the initial spacing between adjacent tracks. By calculating for each pair of adjacent scanned tracks at every time step and applying spatial interpolation, contour plots of are generated.
Figure 5 presents the scanned tracks of vortex S3 at 170° impinging angle overlaid with the corresponding distribution. For analytical clarity, we define the boundary track (BT) as the trajectory where approaches zero, indicated by the solid brown path in Figure 5. This critical trajectory effectively partitions the track ensemble into two distinct dynamical regimes with fundamentally different predictability characteristics.
North of the BT, tracks exhibit positive values, indicating systematic divergence during terrain interaction. Most remarkably, in the post-terrain region of central-western domain, maximum adjacent track spacing amplifies to over seven times the initial separation (), defining what we term the Track Diverging Zone (TDZ). Tracks entering the TDZ originate from northeastern landfall positions, identifying this region as characterized by extreme sensitivity to initial conditions. From a forecasting perspective, this represents a zone of catastrophic predictability loss, where minute pre-landfall position uncertainties cascade into dramatic post-terrain trajectory differences. This behavior directly reflects the nonlinear amplification of the MAV response when vortices encounter steep terrain gradients at specific approach geometries, as predicted by Equation (7).
Conversely, south of the BT, negative values prevail, with tracks exhibiting pronounced convergence and even overlap in the post-terrain phase, defining the Track Converging Zone (TCZ). These converging trajectories originate from eastern landfall positions and demonstrate remarkably low sensitivity to initial perturbations. The TCZ represents a predictability enhancement zone where pre-landfall position uncertainties collapse into highly concentrated post-terrain corridors. This convergence mechanism arises from the systematic southward steering during windward ascent followed by constrained recovery paths dictated by the terrain geometry, effectively funneling diverse initial trajectories toward common exit channels.
). Blue contours represent positive (divergence), while red dashed contours represent negative (convergence). The solid brown path indicates the Boundary Track (BT), which separates the Track Diverging Zone (TDZ) from the Track Converging Zone (TCZ).
The BT itself represents a dynamical separatrix in the phase space of vortex trajectories, delineating the transition between divergent and convergent track behaviors. Physically, the BT corresponds to the trajectory experiencing critical balance between competing steering influences: tracks slightly north encounter terrain configurations that amplify initial perturbations through positive feedback between track position and gradients, while tracks slightly south experience negative feedback that dampens perturbations. This bifurcation in track behavior emerges naturally from the nonlinear interaction between the topographic adjusting parameter α and the spatial heterogeneity of terrain forcing .
3.5.2. Control Parameters of Track Sensitivity: Impinging Angle Effects
Figure 6 extends this analysis across impinging angles, presenting distributions for vortex S3 at 195°, 170°, 145°, and 125°. The systematic evolution with decreasing impinging angle reveals fundamental changes in the predictability landscape. At near-perpendicular approach (195°, panel a), the TDZ and TCZ remain relatively localized, with maximum divergence percentages around 500%. The BT maintains a relatively straight configuration, indicating weak sensitivity to the approach angle at this regime.
As the impinging angle decreases to 170° (panel b), the TDZ expands significantly both in spatial extent and magnitude, with peak values exceeding 700%. The BT develops pronounced curvature, reflecting the increased complexity of the vortex-terrain interaction at oblique approaches. The TCZ simultaneously intensifies, showing stronger convergence rates that approach -90% in regions where tracks nearly overlap.
The 145° case (panel c) represents a transitional regime where the TDZ begins to dominate the northern half of the domain, while the TCZ compresses into a narrow band along the southern terrain boundary. The BT exhibits sharp meridional displacement during terrain crossing, indicating highly localized transitions between divergent and convergent behaviors. This configuration suggests that predictability becomes increasingly binary: tracks either experience extreme divergence or strong convergence, with minimal intermediate behavior.
) structure for vortex S3 with varying impinging angles over idealized terrain: (a) 195°, (b) 170°, (c) 145°, and (d) 125°. As the impinging angle becomes shallower, the divergence in the TDZ is dramatically amplified, while the convergence in the TCZ becomes more concentrated.
At the shallowest angle of 125° (panel d), the predictability landscape undergoes qualitative transformation. The TDZ extends across most of the computational domain, with only a small TCZ remaining in the extreme south. The BT shifts dramatically southward and develops complex oscillatory structure, reflecting the dominance of terrain-induced instabilities at this critical angle. Maximum values approach 2700%, indicating that adjacent tracks can separate by 27 times their initial spacing. This extreme sensitivity emerges from the prolonged exposure to terrain gradients, allowing small differences in encountered along slightly different paths to accumulate into massive trajectory divergence through the MAV mechanism.
The physical mechanism underlying this angle-dependent evolution relates directly to the residence time within regions of strong gradients. At shallower angles, vortices traverse the steepest terrain sections more slowly, allowing greater time for the exponential growth of perturbations in sensitive regions. The positive feedback between track position and subsequent terrain encounter becomes increasingly dominant, as expressed through the nonlinear coupling between α and in the dynamic model framework. This explains why the TDZ preferentially expands with decreasing impinging angle while the TCZ contracts, ultimately suggesting that oblique typhoon approaches to mountainous terrain inherently possess lower predictability than perpendicular approaches.
These findings have profound implications for operational forecasting, indicating that track uncertainty is not uniformly distributed but exhibits strong spatial structure determined by the interplay between vortex characteristics, approach geometry, and terrain configuration. The identification of TDZ and TCZ provides a quantitative framework for assessing forecast confidence and allocating computational resources in ensemble prediction systems [4,39,40,41,42,48].
3.6. The Kinematic Signature of Track Sensitivity: Vortex Drifting Speed
To provide an alternative physical perspective on the dramatic changes in track morphology and predictability, we analyze the spatiotemporal evolution of the vortex drifting speed, , for vortex S3 across the four impinging angles.
Vortex Drifting Speed Evolution and Its Connection to Track Morphology
Figure 7 provides complementary insights into the track morphology evolution through analysis of vortex drifting speed during terrain interaction for vortex S3 across impinging angles of 195°, 170°, 145°, and 125°. Panels (a)-(d) overlay acceleration/deceleration zones on the scanned tracks (A denoting acceleration regions, D denoting deceleration regions), while panels (e)-(h) present the meridional distribution of drifting speeds, color-coded by landfall latitude: blue for latitudes below 22.5°N, red for 22.5°N-24.5°N, and green for latitudes above 24.5°N.
. Tracks are color-coded by their landfall latitude: south of 22.5°N (blue), between 22.5°N and 24.5°N (red), and north of 24.5°N (green).
For the near-perpendicular approach at 195° (Figure 7a, e), the vortex exhibits a relatively straightforward speed evolution pattern. The southward MAV on the windward slope accelerates the vortex along its westward trajectory, reaching maximum drifting speeds exceeding three times the initial velocity near the terrain ridge. Upon crossing the ridge, the northward MAV on the leeward slope decelerates the vortex, eventually restoring speeds to near-initial values as terrain influence wanes. This simple acceleration-deceleration cycle reflects minimal conflict between the MAV direction and the vortex's primary westward motion, consistent with the moderate track deflections observed at this angle.
The oblique approach cases (170°, 145°, 125°) reveal fundamentally different dynamics characterized by multiple speed extrema. Initially, the southward MAV opposes the northward component of the oblique approach velocity, creating a deceleration zone D that reduces drifting speed to a windward minimum near 121.5°E (green dashed lines in Figure 7b-d). This deceleration phase represents the dynamic competition between terrain-induced steering and the vortex's environmental flow, with the MAV gradually overwhelming the northward velocity component. Subsequently, as the vortex aligns with the terrain contours, the MAV transitions to enhancing forward motion, accelerating the vortex to peak speeds near the ridge at approximately 121°E (purple dashed lines). The leeward descent introduces another deceleration phase reaching a secondary minimum near 120.5°E (green dashed lines), before gradual recovery to ambient speeds.
The meridional stratification of speed profiles (panels e-h) reveals critical connections to the track sensitivity patterns identified through the analysis. Tracks landfalling north of 24.5°N (green curves) maintain relatively uniform speed profiles with modest variations, corresponding to the weak terrain interaction and low sensitivity characteristic of northern approaches. These tracks traverse regions of gentle terrain gradients, experiencing minimal forcing and consequently exhibiting stable, predictable speed evolution, consistent with observations that vortices passing north of major terrain features maintain more coherent trajectories [6,8,10].
In stark contrast, tracks landfalling between 22.5°N-24.5°N (red curves) display extreme speed variations, with peak velocities reaching 5-13 m/s at the shallowest angles. These tracks correspond precisely to the TDZ identified in the analysis, where adjacent trajectories experience maximum divergence. The pronounced speed variations directly correlate with the intense gradients encountered when traversing the steepest terrain sections. The multiplicative effect of large α values (92.4 for S3) and extreme produces MAV magnitudes comparable to or exceeding the vortex's translation speed, fundamentally altering the force balance and creating conditions for chaotic trajectory evolution.
Tracks landfalling below 22.5°N (blue curves) exhibit intermediate speed variations but with notable phase coherence, aligning with the TCZ characteristics. Despite experiencing significant speed modulation, these tracks maintain similar acceleration-deceleration patterns, explaining their convergent behavior in the post-terrain phase. The systematic nature of speed evolution in this region reflects the dominance of terrain steering over initial condition variations, enhancing predictability despite complex dynamics.
The evolution from 195° to 125° reveals a critical transition in the speed profile morphology. At 195°, the single-peaked structure indicates linear response to terrain forcing. As the angle decreases, the emergence of multiple extrema signals nonlinear dynamics, with the windward deceleration phase becoming increasingly pronounced. At 125° (Figure 7h), some tracks exhibit near-stagnation points where drifting speed approaches 4 m/s, less than 70% of the initial velocity. These stagnation regions correspond to critical points where the MAV nearly cancels the vortex's translation velocity, creating conditions for abrupt trajectory changes and contributing to the extreme track divergence observed in the TDZ.
3.7. Conclusions: A Unified Framework for Track Predictability
The comprehensive analysis of track morphology, divergence patterns, and speed evolution establishes a unified framework for understanding typhoon track predictability over complex terrain. Three fundamental control mechanisms emerge as governing factors [4,5,6,7,10,11,12,13,14,15,16,18,19,20,21,22,23,25,37,38,39,48].
3.7.1. Vortex Intensity Control (α-Modulation)
The topographic adjusting parameter α fundamentally determines the magnitude of speed variations and track deflections. For vortex S3 with α = 92.4, the terrain forcing becomes sufficiently strong to induce speed variations exceeding 300% of the initial velocity. This intense modulation creates conditions for nonlinear trajectory evolution, where small differences in initial position or approach angle cascade into dramatically different outcomes. The α parameter effectively sets the threshold between predictable quasi-linear responses (low α) and chaotic nonlinear behaviors (high α), providing a quantitative framework for the intensity-dependent track sensitivity documented in previous studies [9,22,23,24].
3.7.2. Terrain Geometry Control (
-Forcing):
The instantaneous terrain gradient determines the local MAV magnitude and direction, directly controlling acceleration/deceleration patterns. The spatial heterogeneity of creates a complex force field that channels vortex motion along preferential pathways. Regions of maximum correspond to speed extrema and trajectory inflection points, representing critical junctures where predictability breaks down. The sign reversal of between windward and leeward slopes generates the characteristic S-shaped trajectories, with the curvature intensity scaling with the gradient magnitude.
3.7.3. Temporal Integration Control (Residence Time Effect)
The impinging angle governs the duration of exposure to terrain forcing, acting as an amplifier for both speed variations and track deflections. Shallower angles exponentially increase residence time within high regions, allowing greater accumulation of MAV-induced displacement. This temporal integration transforms moderate instantaneous forcing into extreme cumulative effects, explaining why the TDZ expands dramatically at oblique approaches. The residence time control also explains the phase relationship between speed evolution and track morphology: longer exposure allows multiple acceleration-deceleration cycles that compound trajectory uncertainty.
These three controls operate synergistically to determine track predictability. The BT emerges as the critical trajectory where the three controls achieve delicate balance—sufficient α to induce significant response, optimal exposure to maximize steering without inducing instability, and appropriate residence time to accumulate meaningful deflection without triggering divergent behavior. North of the BT, the controls combine destructively, amplifying perturbations through positive feedback and creating the TDZ. South of the BT, the controls combine constructively, channeling diverse trajectories toward common pathways and establishing the TCZ, in agreement with observed regime-dependent track behaviors and forecast bust regions for typhoons interacting with Taiwan and other mountainous islands [4,5,6,7,10,11,12,13,14,15,16,18,19,20,21,22,23,25,37,38,39,48].
This unified framework provides quantitative metrics for assessing typhoon track forecast uncertainty in complex terrain, with direct applications to ensemble prediction systems and risk assessment. The identification of critical thresholds in α, , and residence time enables a priori estimation of predictability based on observable vortex characteristics and approach geometry, potentially revolutionizing operational forecasting strategies for landfalling typhoons.
4. Application to Taiwan's Complex Topography: From Theory to Reality
4.1. Analysis of Taiwan Island Topography: Comprehensive Terrain Characteristics
Figure 8 presents a detailed topographic analysis of Taiwan Island through orthogonal perspectives: eight latitudinal cross-sections spanning the island's width (Figure 8a-b) and eight longitudinal profiles along the CMR axis from west to east (Figure 8c-d). This comprehensive terrain characterization establishes the foundation for understanding typhoon-topography interactions in subsequent dynamic model simulations, particularly for typhoons approaching from the western Pacific.
4.1.1. Latitudinal Cross-Sectional Analysis
The following topographic analysis is based on Taiwan's digital elevation model, with characteristics consistent with those documented in observational and climatological studies of typhoon-terrain interactions over the island [5,6,7,8,9]. The latitudinal transects (AA' through HH' in Figure 8a,b) reveal systematic north-south variations in Taiwan's topographic structure that fundamentally influence typhoon behavior. The northernmost section AA' (25°N) exhibits relatively subdued topography with maximum elevations below 2000 m. The terrain rises gently from the eastern coast, reaches a broad plateau, then descends gradually toward the western plains. This modest topographic relief generates minimal terrain-induced forcing for vortices traversing this latitude. Section BB' (24.5°N) marks the onset of substantial topography, with peaks approaching 2500 m. The profile reveals Taiwan's characteristic east-west asymmetry: a steep eastern escarpment rising from sea level to ridge crest within 20 km, followed by a gradual 40-km western descent. This asymmetry creates differential patterns, with intense compression on eastern windward slopes and prolonged stretching on western leeward slopes.
The central sections CC' (24.2°N) and DD' (23.8°N) traverse the CMR's highest elevations, exceeding 3500 m. These profiles exhibit the most dramatic topographic gradients, with eastern slopes rising at angles approaching 20°. The CC' profile displays multiple peaks creating complex terrain with secondary ridges and valleys that induce localized vorticity perturbations. This central CMR region has been identified in observational studies as the primary zone for substantial track deflections and discontinuous track behaviors [5,6,8,9,10,13,14], where continuous and discontinuous track classifications are most evident.
The DD' section maintains similar maximum elevation but exhibits a narrower mountain width, concentrating topographic forcing into a confined meridional extent. Sections EE' (23.5°N) and FF' (23.2°N) represent the southern-central CMR, maintaining substantial elevations (3000-3500 m) with a broadening mountain massif. The EE' profile reveals a distinctive double-peak structure—a primary summit near 121°E and secondary peak around 121.3°E, separated by a 2000-m col. This configuration generates complex MAV patterns as vortices navigate multiple terrain features.
The southern sections GG' (22.7°N) and HH' (22.3°N) show progressive elevation reduction to approximately 2500 m and 2000 m respectively. However, these profiles maintain steep eastern gradients, ensuring continued strong forcing. The HH' section exhibits the broadest mountain width, with elevated terrain extending over 50 km east-to-west, potentially leading to extended vortex residence times.
4.1.2. Longitudinal CMR Profile Analysis
The longitudinal profiles (AA' through HH' in Figure 8c,d) oriented along the CMR axis from west to east reveal critical along-ridge variability affecting meridional vortex deflection, particularly for typhoons approaching from the eastern Pacific.
The westernmost profiles AA' (120.3°E) and BB' (120.5°E) capture the leeward western foothills where vortices exit after ridge crossing. Profile AA' shows modest elevations below 2000 m with gentle undulations over 20-30 km scales. Profile BB' exhibits slightly higher elevations approaching 2500 m centrally, with pronounced peaks and valleys that modulate post-terrain vortex recovery.
Profiles CC' (120.7°E) and DD' (120.9°E) traverse the western CMR slopes and secondary ridges. The CC' profile reveals complex topography with multiple 3000-m peaks between 23.5°N and 24.5°N, creating alternating compression-stretching zones for southward-deflected vortices. Profile DD' maintains similar complexity with dramatic elevation variations—deep valleys below 2000 m between 3500-m peaks—potentially channeling vortex motion along specific corridors.
The east-central profiles EE' (121.1°E) and FF' (121.3°E) capture terrain near the main CMR crest. Profile EE' demonstrates the dramatic central ridge system with sustained elevations above 3000 m and peaks approaching 4000 m between 23°N and 24°N. Sharp elevation variations of 1500-2000 m over 10-15 km create intense, rapidly varying fields. Profile FF' shows similar characteristics with a characteristic sawtooth pattern of peaks and saddles defining the CMR summit region.
The easternmost profiles GG' (121.5°E) and HH' (121.7°E) represent the critical windward slopes where typhoons first encounter Taiwan's topography. Profile GG' reveals the abrupt rise from sea level to over 3000 m, with steepest gradients between 22.5°N and 24°N—elevation gains exceeding 3000 m within horizontal distances under 20 km. This profile captures the primary terrain barrier confronting approaching typhoons. Profile HH' shows immediate coastal mountains with elevations generally below 2000 m but maintaining steep gradients from the coastline, creating the strongest initial forcing that drives characteristic southward track deflection.
4.1.3. Implications for Dynamic Model Application
The comprehensive topographic analysis reveals several critical features directly influencing vortex behavior through the dynamic model mechanism:
Eastern Barrier Configuration: The abrupt elevation rise from the Pacific coast (profiles GG' and HH') creates extreme values immediately upon landfall, initiating strong southward MAV that fundamentally alters typhoon trajectories. This eastern wall effect is most pronounced between 23°N and 24.5°N, corresponding to the latitude band of maximum track sensitivity.
East-West Asymmetry: The consistent pattern of steep eastern slopes and gradual western descents across all latitudes creates asymmetric forcing patterns. Approaching vortices experience rapid compression during eastern ascent followed by prolonged stretching during western descent, generating the characteristic S-shaped trajectories predicted by the dynamic model.
Meridional Gradient Structure: The north-to-south decrease in maximum elevation—from over 3500 m centrally to below 2000 m in the extreme south—creates latitude-dependent forcing strength. This gradient contributes to the formation of track divergence zones (TDZ) and track convergence zones (TCZ) through differential MAV generation.
Ridge Complexity: The multiple peaks, cols, and valleys along the CMR axis introduce high-frequency perturbations to the field. These rapid topographic variations can trigger track instabilities, particularly for strong vortices with large α values, contributing to the sensitivity patterns observed in scanned trajectory analyses.
Terrain Width Modulation: The meridional variation in mountain width—narrowest in central regions (CC', DD') and broadest in the south (GG', HH')—directly impacts vortex residence time within the high zone. Extended residence times at oblique approach angles allow greater MAV accumulation, amplifying track deflection and sensitivity.
This detailed topographic characterization provides the essential foundation for interpreting complex vortex behaviors when the dynamic model is applied to realistic Taiwan terrain, establishing the physical basis for track predictability assessments in subsequent analyses. The identified features—particularly the steep eastern escarpment and the CMR's central barrier—have been documented as dominant controls on typhoon track deflections in observational analyses [4,5,6,7,8,9,10] and numerical studies [2,11,12,19,24,25,34], establishing Taiwan's CMR as a primary driver of track morphology diversity.
4.2. Experimental Design for Dynamic Model Application to Taiwan
The systematic investigation of typhoon track sensitivity over Taiwan's complex topography employs a comprehensive experimental framework designed to explore the full spectrum of vortex-terrain interactions. The experiments utilize vortex S3 from the idealized terrain studies (Section 3.1-3.4) as the representative typhoon-like vortex, with initial parameters of , , and , corresponding to a moderate-intensity typhoon with topographic adjusting parameter α = 92.4.
Four distinct impinging angles are selected to span the range from near-perpendicular to ultra-critical approaches: 195°, 170°, 145°, and 125°. For each angle, 17 parallel tracks are initialized to provide comprehensive spatial coverage of possible landfall positions. All tracks begin at 122.5°E longitude, ensuring consistent approach distances to Taiwan's eastern coast. The southern boundary of each track ensemble is positioned strategically based on the expected meridional deflection at each angle: 22.75°N for 195°, 22.10°N for 170°, 21.60°N for 145°, and 19.0°N for 125°. This southward shift for shallower angles anticipates the enhanced southward deflection documented in the idealized studies.
The latitudinal spacing between adjacent tracks varies with impinging angle to maintain adequate resolution while capturing the full range of track behaviors. Spacing increases from 0.12° for the 195° case to 0.26° for the 125° case, reflecting the greater meridional extent of track deflection at shallower angles. This variable spacing ensures that both the TDZ and TCZ are adequately resolved for the track divergence percentage () analysis.
Computational duration is adjusted according to the expected terrain transit time at each angle. The near-perpendicular cases (195° and 170°) require 16.67 hours of simulation time, sufficient for vortices to completely traverse Taiwan's width of approximately 150 km at typical translation speeds of 6-8 m/s. The oblique approaches require extended simulations: 20.83 hours for 145° and 33.33 hours for 125°, accommodating the longer path lengths and potential looping behaviors identified in preliminary tests.
A critical innovation in these experiments is the incorporation of vortex intensity evolution during terrain interaction. In reality, typhoons typically weaken during land interaction due to surface friction, reduced moisture supply, and terrain-induced disruption of the circulation, as documented in observational studies of typhoons crossing Taiwan [6,7]. To capture this effect while maintaining model simplicity, an exponential decay model is implemented:
where is the initial vortex intensity and is the decay timescale. A decay timescale of = 15 hours is selected based on observational studies of typhoon intensity evolution over Taiwan. This produces realistic weakening rates: the vortex retains approximately 40% of its initial intensity after 15 hours and only 14% after 30 hours, consistent with observed typhoon decay over land. This decay formulation is consistent with the observed intensity evolution of historical typhoons documented in Taiwan's typhoon database [5,6,9], where substantial weakening typically occurs within 12-18 hours of landfall over the CMR.
The intensity decay directly modulates the topographic adjusting parameter α through its dependence on vortex intensity (Equation 6 or Equation 10 in Chen [35]). As the vortex weakens, α decreases proportionally, reducing the MAV response to terrain gradients. This creates a time-dependent sensitivity where early terrain encounters produce stronger deflections than later interactions, adding realism to the track evolution and potentially explaining some of the complex behaviors observed in actual typhoon tracks.
The experimental matrix enables systematic exploration of how approach angle modulates the fundamental control mechanisms identified in the theoretical framework: vortex intensity control through α(t), terrain geometry control through , and temporal integration control through residence time. The 195° cases isolate the terrain geometry effect with minimal residence time amplification. The 170° and 145° cases explore the transition regime where residence time effects become significant. The 125° cases probe the ultra-critical regime where temporal integration dominates and traditional predictability concepts break down.
This experimental design provides the foundation for the comprehensive analyses presented in Section 4.3-4.6, enabling quantitative assessment of how Taiwan's realistic topography modifies the idealized predictions and revealing emergent phenomena not captured by simplified terrain representations. The systematic variation of approach angle with consistent vortex characteristics isolates the role of interaction geometry, while the inclusion of intensity decay adds critical realism for comparison with observed typhoon behaviors.
4.3. Track Morphology and Predictability over Taiwan: The 195° Case Study
An analysis of the track morphology in Figure 9a reveals features that are both consistent with and divergent from the idealized case. The overall S-shaped deflection is clearly present, reaffirming the fundamental steering mechanism of the dynamic model. The initial southward turn is a direct response to the powerful column compression (large positive ) induced by the steep eastern slopes of the CMR, a signature feature of upstream track deflection extensively documented in both observational and modeling studies [8,20]. However, unlike the smooth trajectories in the idealized simulation, the tracks over Taiwan exhibit fine-scale oscillations. This increased variability is a direct consequence of the CMR's ruggedness. As detailed in the topographic analysis (Section 4.1), the CMR's spine is not a uniform ridge but a series of peaks and saddles, causing the local experienced by the vortex to fluctuate rapidly, thereby impressing these oscillations onto the tracks. Furthermore, the northward recovery on the lee side is visibly more subdued than in Figure 6a. This is attributable to the inclusion of vortex intensity decay. By the time the vortex reaches the western slopes, its strength and associated topographic adjusting parameter (α) have diminished, resulting in a weaker MAV response to the column stretching and thus a damped northward correction.
Despite these morphological differences, a comparative analysis reveals that the fundamental sensitivity structure identified in the idealized framework is remarkably robust and provides a convincing interpretation of the realistic simulation. By visually inspecting the spacing of adjacent tracks in Figure 9a, one can clearly identify a northern region of path divergence and a southern region of path convergence. This confirms the existence of a TDZ and a TCZ, separated by a conceptual BT, even in the presence of complex terrain. The underlying control mechanism remains the same: landfall location. Tracks originating in the north, which make landfall over the topographically complex northeastern flank of the CMR (corresponding to zonal profiles CC' and DD'), are subjected to the most intense and spatially variable topographic forcing. This inherent instability in the forcing mechanism amplifies small initial separations, leading to the low predictability characteristic of the TDZ. Conversely, tracks making landfall further south along the central-eastern coast (profiles EE' and FF') encounter a more uniform channeling effect from the main mountain barrier, which suppresses initial perturbations and funnels the tracks together into the highly predictable TCZ. This landfall-dependent sensitivity structure is consistent with the diverse track morphologies documented in Taiwan's typhoon database [5,6,9], where northward-deflecting tracks, southward-deflecting tracks, and intermediate behaviors are observed to correlate strongly with the initial approach latitude and encounter with the central CMR [8,9,10].
This section initiates the analysis of vortex tracks over realistic terrain by focusing on the 195° impinging angle scenario for vortex S3, as shown in Figure 9a. The primary objective is to rigorously test the applicability of the sensitivity framework—including the concepts of the TDZ, TCZ, and BT—which was developed using an idealized mountain (Figure 6a). By comparing the outcomes of these two simulations, we can discern the fundamental controls that persist in complex terrain and identify the modulations introduced by real-world orography and physics.
In conclusion, the idealized (Figure 6a) and realistic (Figure 9a) simulations offer powerful, complementary insights. The idealized case was instrumental in isolating and defining the core theoretical framework of track sensitivity, demonstrating that a simple geometric barrier is sufficient to create a highly structured phase space of predictability (TDZ/TCZ/BT). The realistic simulation validates this framework, showing its robustness in a far more complex environment. Critically, the realistic case adds essential layers of understanding: it demonstrates how small-scale topographic ruggedness introduces track variability and how physical processes like intensity decay can systematically alter the track morphology, particularly by damping the lee-side recovery. The synergy between these two analyses provides a comprehensive and physically consistent understanding of typhoon track dynamics over Taiwan.
4.4. Amplified Steering and Modulated Sensitivity: The 170° Case Study
Shallowing the impinging angle to 170° (Figure 9b) serves to amplify the topographic steering effects, providing a more stringent test of the dynamic model and the sensitivity framework established in the idealized simulations (Figure 6b). This section analyzes the resulting track morphology and predictability, focusing on how the increased interaction time interacts with Taiwan's complex orography and the physics of vortex decay.
The track morphology in Figure 9b immediately reveals a substantially more pronounced southward deflection compared to the 195° case. The trajectories conform tightly to the complex coastal geometry of the CMR, a clear indication of a more dominant terrain-induced MAV. This intensification is a direct consequence of the prolonged interaction time, which allows the MAV, driven by the persistent column compression () on the windward slope, to exert its influence over a greater duration, accumulating a larger meridional displacement. While the smooth, idealized terrain in Figure 6b produces a correspondingly smooth family of curves, the rugged spine of the CMR impresses fine-scale oscillations upon the realistic tracks in Figure 9b. This is a clear signature of the rapidly fluctuating local topography (as seen in the along-axis profiles of Section 4.1) and represents a key departure from the idealized scenario. Furthermore, the vortex spends more time over land, leading to more significant intensity decay by the time it reaches the lee side, further weakening the already-damped northward recovery.
From the perspective of predictability, the fundamental structure of a northern TDZ and a southern TCZ remains remarkably robust, validating the core tenets of the sensitivity framework. This bifurcation aligns with observed forecast bust patterns for typhoons approaching Taiwan at oblique angles, where ensemble members often diverge into distinct northward-passage versus southward-passage scenarios [40,41,42]. A visual comparison between the track spacing in Figure 9b and the explicit contours in the idealized case (Figure 6b) confirms this. The northernmost tracks, which interact with the most complex and elevated sections of the northeastern CMR, clearly diverge upon crossing the island, signifying a region of low predictability. The southern tracks are once again funneled into a narrow corridor, a manifestation of the terrain 'channeling effect' that enhances predictability for south-side passages [22].
However, the manifestation of these zones is significantly modulated by the realistic orography. The TDZ in Figure 9b is not a smooth, expanding fan as in the idealized case; instead, it appears as a more concentrated zone of divergence in the immediate lee of the highest peaks, distorted by the specific shape of the mountain range. The TCZ is also more geographically constrained, tightly bound by the southern tail of the CMR.
In essence, the 170° case study provides a crucial bridge between theory and reality. It confirms that the "interaction time" control mechanism, isolated in the idealized experiments, is a primary driver of track deflection magnitude in the real world. The idealized simulation (Figure 6b) provides the clean, theoretical benchmark, demonstrating how sensitivity and deflection should scale with a shallower impinging angle. The realistic simulation (Figure 9b) shows this scaling in action, but with the critical additions of track oscillations due to topographic ruggedness and a further-damped lee-side recovery due to enhanced intensity decay. This validates the sensitivity framework's utility while highlighting the indispensable role of detailed topography and physics in capturing the true complexity of vortex motion.
4.5. Terrain Channeling and the Emergence of Hyper-Sensitivity: The 145° Case Study
The simulation with a 145° impinging angle (Figure 9c) marks a transition toward a regime where the terrain's influence becomes overwhelmingly dominant, forcing the vortex into a path that deviates profoundly from its initial heading. This section contrasts the complex, realistic outcomes with the clean theoretical benchmark of the idealized simulation (Figure 6c) to explore the limits of predictability and the emergence of extreme track morphologies.
The track morphology in Figure 9c is characterized by a powerful "channeling" effect. The initial southward deflection is so pronounced that the vortex trajectories are forced into a path nearly parallel to the CMR's primary axis for a significant duration. This dramatic response is the culmination of the three control mechanisms acting in concert: the vortex's high intrinsic sensitivity (α), the intense topographic forcing () from the steep eastern slopes, and, critically, the prolonged interaction time afforded by the shallow impinging angle. The sustained, powerful negative MAV effectively overrides the vortex's own propagation tendency, steering it southward along the mountain barrier. As in previous cases, the ruggedness of the CMR imparts fine-scale variability onto these channeled tracks. The lee-side northward recovery is almost entirely suppressed. Having spent a considerable time over land, the vortex is significantly weakened by the time it clears the southern end of the CMR, leaving it with insufficient strength to generate a meaningful positive MAV for a northward course correction.
When analyzed through the lens of the sensitivity framework, the 145° case reveals a system pushed to the edge of its predictability structure. While the conceptual division into a northern TDZ and a southern TCZ still holds, their characteristics are dramatically altered compared to the idealized case (Figure 6c). The TDZ, which originates from landfalls on the far northeastern coast, now represents a zone of hyper-sensitivity. This regime corresponds to the conditions under which historical typhoons have exhibited looping or quasi-stationary behavior near northeastern Taiwan [13,16,23], where complex vortex-terrain interactions lead to extreme track uncertainty. The idealized simulation shows a peak of over 900%, and the visual track separation in the realistic case (Figure 9c) suggests a divergence of a similar or even greater magnitude. In this regime, the slightest initial perturbation in landfall position is amplified into a massive, almost chaotic divergence in the final track. The prolonged, non-linear interaction with the complex terrain means that the final path is exquisitely sensitive to the precise sequence of peaks and valleys the vortex encounters.
Conversely, the TCZ becomes a zone of extreme convergence. A wide swath of initial tracks south of the BT are not just funneled together; they are forced onto nearly identical paths, effectively erasing any memory of their initial separation. The CMR acts as a remarkably effective 'attractor,' collapsing a broad range of initial conditions into a single, highly predictable outcome, a behavior consistent with ensemble forecast studies that show strong path convergence for certain landfall scenarios [39,40].
The comparison between the idealized and realistic simulations for the 145° angle is profoundly insightful. The idealized case (Figure 6c) provides the theoretical upper bound, demonstrating the immense potential for track divergence and convergence that is inherent in the dynamics of vortex-terrain interaction. The realistic simulation (Figure 9c) confirms that this potential is fully realized in the real world. More importantly, it demonstrates how the introduction of realistic complexity—topographic ruggedness and vortex decay—does not break the fundamental predictability structure but instead pushes it to its extremes, creating zones of hyper-sensitivity alongside zones of near-perfect predictability. This bifurcation in track behavior underscores the immense challenge and critical importance of accurate landfall prediction for typhoons approaching complex terrain at shallow angles, a scenario that has been repeatedly identified as a primary source of track forecast errors in operational settings over Taiwan [3,4,39,40].
4.6. Terrain Capture and the Breakdown of Predictability: The 125° Case Study
The 125° impinging angle simulation (Figure 9d) represents the ultimate expression of terrain dominance over vortex motion. In this extreme scenario, the concept of a simple "deflection" is insufficient; instead, we witness a phenomenon best described as terrain capture. This final case study provides a stark illustration of the system's behavior at the outer limits of its parameter space, offering a final, powerful synthesis by comparing it with its idealized counterpart (Figure 6d).
The track morphology in Figure 9d is extraordinary. The vortex is almost immediately captured by the terrain-induced flow, funneled into a narrow corridor, and advected southward along the entire length of the CMR. The initial heading of the vortex becomes almost irrelevant as the sustained, powerful negative MAV completely overwhelms its intrinsic propagation. A key difference from the idealized case (Figure 6d), which featured a dramatic cyclonic loop consistent with some observed cases of terrain-induced looping [13], is the conspicuous absence of such a feature in the realistic simulation. This divergence is explained by the critical role of vortex intensity decay. In the idealized, constant-intensity simulation, the vortex retained enough strength to eventually "break free" from the terrain's grip and execute a turn. In the realistic case, the prolonged journey over land causes such significant weakening that by the time the vortex reaches the southern tip of Taiwan, it has lost the dynamic strength required to initiate a course correction. This decay-modulated behavior helps explain why observed looping tracks [13,23] are typically associated with stronger typhoons that can maintain sufficient intensity during prolonged terrain interaction, whereas weaker systems undergo passive advection along the terrain corridor. It simply continues on its southward path, a passive tracer in the flow it helped to create.
Analyzing this scenario through the sensitivity framework reveals a complete polarization of predictability. The concept of a TDZ is pushed to its absolute limit. The idealized simulation (Figure 6d) shows a exceeding 2200%, and the explosive separation of the northernmost tracks in the realistic case (Figure 9d) suggests that predictability for these landfalls effectively collapses. The final track becomes so acutely sensitive to the initial interaction with the complex northern CMR that forecasting its path becomes practically impossible. Any uncertainty, no matter how small, will lead to wildly different outcomes.
Simultaneously, the TCZ becomes a singularity of predictability. The vast majority of initial tracks are not merely guided but are aggressively forced onto a single, near-identical path along the coast. The CMR acts as an exceptionally powerful attractor, erasing nearly all information about the vortex's initial latitude. For this wide range of landfall scenarios, the track is almost perfectly predictable: it will travel south along the coast of Taiwan.
The comparison between the idealized (Figure 6d) and realistic (Figure 9d) simulations serves as a capstone for this entire study. The idealized case brilliantly isolated the fundamental dynamics that allow for terrain capture and looping, providing the "proof-of-concept" for such extreme behavior. The realistic simulation demonstrates how this capture mechanism manifests in the real world, but critically, it reveals how additional physics—namely, vortex intensity decay—can fundamentally alter the outcome, replacing a dynamic loop with a passive advection. This final comparison encapsulates the core message of the paper: while the fundamental principles of topographic steering, as elucidated by the idealized framework, are robust and universal, the precise manifestation of typhoon track morphology in the real world is a complex interplay between these core dynamics, the intricate details of the terrain, and the evolving physics of the vortex itself.
5. Conclusions
This study has systematically investigated the mechanisms of topographic steering and the resulting track morphology of typhoon-like vortices, leveraging the dynamic model of [35]. By conducting a comprehensive sensitivity analysis, first over an idealized mountain to isolate fundamental principles and then over the complex topography of Taiwan to test and extend these principles, we have bridged the gap between fundamental theory and real-world complexity. The comparison yields profound insights into the nature of vortex-terrain interaction and the inherent structure of its predictability.
5.1. A Unified Framework for Topographic Steering: From Idealized Principles to Realistic Complexity
The comprehensive results from both idealized and realistic simulations converge to validate a unified framework for understanding typhoon track morphology. This framework, systematically developed through the idealized experiments (Section 3), is governed by a triad of interconnected controls intrinsically linked to the dynamic model [35]: (1) vortex intensity control (via the α parameter), which determines the system's sensitivity to topographic forcing (Section 3.4.1); (2) terrain geometry control (via the field), which provides the instantaneous steering force through the MAV mechanism (Section 3.4.2); and (3) temporal integration control (the residence time effect, modulated by γ), which governs the cumulative impact of that force over the interaction duration (Section 3.4.3).
The idealized experiments were instrumental in isolating these controls and establishing the fundamental structure of predictability through the track divergence percentage () diagnostic framework (Section 3.5). This framework partitions the track phase space into a TDZ, where adjacent tracks diverge exponentially with values exceeding 700% (Figure 5 and Figure 6), a TCZ, where tracks collapse onto nearly identical paths with approaching -100%, and a separating BT that acts as a dynamical separatrix between these regimes [10,11,12,18,19,20,21,22,23,24,25,35].
The application to Taiwan's complex terrain demonstrates the remarkable robustness of this core framework, as the macro-scale division of predictability persists. However, realistic complexity profoundly modulates this structure. The rugged, multi-peaked nature of the CMR introduces a rapidly fluctuating forcing field, impressing high-frequency oscillations onto the tracks and creating localized "sensitivity cascades" not seen in the idealized case. These findings provide a theoretical foundation for understanding the diverse track morphologies documented in Taiwan's typhoon database [5,6,9], including continuous and discontinuous tracks [8,9,10,14], northward and southward deflections [8,11,12,20,21,22], looping behaviors [13,16,23] often associated with "terrain capture" events [13,16,23,24], and the channeling effects observed along the CMR [12,22,24].
Furthermore, the critical inclusion of vortex intensity decay (Section 4.2, Equation 10) introduces a fundamental asymmetry not captured in the idealized simulations, systematically damping the lee-side recovery as documented in the realistic Taiwan simulations (Figure 9). This decay formulation, based on observational studies of typhoon weakening over Taiwan's terrain [6,7], creates a time-dependent α(t) that weakens progressively during terrain interaction. In the most extreme, shallow-angle cases (γ = 125°, Figure 9d), this combination of realistic topographic complexity and prolonged interaction with intensity decay pushes the system into regimes of hyper-sensitivity, where predictability effectively collapses ( exceeding 2000%), alongside zones of near-perfect deterministic channeling ( approaching -100%). This reveals that real-world track morphology is not just a simple reflection of fundamental principles but an emergent property of their complex, nonlinear interaction with multi-scale orography [4,10,11,12,18,19,20,21,22,23,24,25] and evolving vortex physics [6,7].
5.2. Evaluation of the Track Sensitivity Framework and Implications for Forecasting
The track divergence percentage () framework, systematically developed through idealized terrain experiments (Section 3.5, Figure 5 and Figure 6), proves to be a powerful diagnostic tool for quantifying predictability. Its primary strength lies in successfully identifying regions of high and low predictability that correlate directly with major topographic features and in providing a clear physical linkage between track divergence and the MAV mechanism expressed in Equations (6-7) [35].
However, the application to Taiwan's complex terrain (Section 4, Figure 9) highlights critical limitations and necessary extensions of the idealized framework. The discrete, multi-scale nature of realistic terrain transforms the sharp BT observed in idealized simulations (Figure 5 and Figure 6) into a diffuse "Boundary Zone" in realistic cases, creating nested sensitivity structures not captured by the simple TDZ/TCZ classification. The extreme values observed in realistic simulations—exceeding 4000% for the 125° impinging angle case (Figure 9d, Table 1)—point to nonlinear amplification mechanisms and discrete topographic "decision points" (e.g., saddles, ridge junctions along the CMR) that go beyond the framework's basic assumptions [10,11,12,18,23]. This implies that predictability assessments in complex terrain must become scale-dependent, recognizing that large-scale corridor prediction may remain viable even as the specific track becomes chaotic [4,12,20,24].
These findings have profound implications for operational forecasting [1,2,3]. The framework establishes that track uncertainty is not uniformly distributed but is highly structured by the interplay of vortex characteristics, approach geometry, and terrain configuration [32,41,44,45,46,47,48]. The identification of critical angle thresholds provides crucial guidance for forecast strategy, suggesting a paradigm shift from deterministic track prediction to probabilistic corridor assessment for oblique and critical approaches. These insights are particularly relevant for improving typhoon track forecasts over Taiwan, where operational forecast errors often increase dramatically near landfall [3,4], and where the TDZ-TCZ framework can provide physical guidance for interpreting ensemble spread and assessing forecast confidence [39,40,41,42,43]. The TDZ and TCZ concepts provide a physical basis for interpreting ensemble spreads, enabling forecasters to distinguish between physically-expected divergence and model uncertainty. Ultimately, this enhanced understanding enables more informed uncertainty quantification and risk assessment, improving disaster preparedness for regions threatened by complex terrain.
Looking ahead, a critical avenue for future research involves extending this dynamic framework to incorporate diabatic heating and baroclinic effects. Since orographic rainfall significantly modifies potential vorticity generation and distribution [11,48], integrating these thermodynamic processes could further refine the boundaries of the TDZ and TCZ. Such an extension would bridge the gap between purely dynamic steering mechanisms and the full-physics complexity of real storms, ultimately moving towards a real-time, regime-dependent risk assessment tool for disaster prevention.
Funding
This research was funded by the National Natural Science Foundation of China, under Grant No. 42275064.
Institutional Review Board Statement
Not applicable.
Informed Consent Statement
Not applicable.
Data Availability Statement
Data are unavailable due to privacy or ethical restrictions.
Acknowledgments
H.-C.C. expresses sincere gratitude to Professors Chin-Chou Chu and Chien-Cheng Chang of National Taiwan University for their invaluable guidance and support during the foundational stages of this research. H.-C.C. is also deeply indebted to the late Shih-Ting Wang of the Central Weather Administration of Taiwan; his pioneering research on typhoons in Taiwan served as the profound inspiration for this study and continues to guide its direction. Special thanks are extended to Hung-Chi Kuo and Yu-Heng Tseng of National Taiwan University for their enlightening discussions that inspired the further extension and practical application of this framework. Finally, H.-C.C. appreciates Kwan-Tun Lee of National Taiwan Ocean University for his valuable insights and feedback.
Conflicts of Interest
The authors declare no conflicts of interest.
References
- Kepert, J.D. Tropical Cyclone Structure and Dynamics. In World Scientific Series on Asia-Pacific Weather and Climate; WORLD SCIENTIFIC, 2010; Vol. 4, pp. 3–53 ISBN 978-981-4293-47-1.
- Lin, Y.-L. Mesoscale Dynamics; 1st ed.; Cambridge University Press, 2007; ISBN 978-0-521-00484-8.
- Chan, J.C.L.; Kepert, J.D. Global Perspectives on Tropical Cyclones: From Science to Mitigation; World Scientific Series on Asia-Pacific Weather and Climate; WORLD SCIENTIFIC, 2010; Vol. 4; ISBN 978-981-4293-47-1.
- Wu, C.-C.; Kuo, Y.-H. Typhoons Affecting Taiwan: Current Understanding and Future Challenges. Bull. Amer. Meteor. Soc. 1999, 80, 67–80. [Google Scholar] [CrossRef]
- Shieh, S.L.; Wang, S.T.; Cheng, M.D.; Yeh, T.C. Tropical cyclone tracks over Taiwan and its vicinity for the one hundred years 1897 to 1996; Central Weather Bureau: Taipei, 1998; p. 497. [Google Scholar]
- Wang, S.T. An integrated study of the impact of the orography in Taiwan on the movement, intensity, structure, wind and rainfall distribution of invading typhoons; Chinese National Science Council: Taipei, 1992; p. 285.
- Brand, S.; Blelloch, J.W. Changes in the Characteristics of Typhoons Crossing the Island of Taiwan. Mon. Wea. Rev. 1974, 102, 708–713. [Google Scholar] [CrossRef]
- Yeh, T.-C.; Elsberry, R.L. Interaction of Typhoons with the Taiwan Orography. Part I: Upstream Track Deflections. Mon. Wea. Rev. 1993, 121, 3193–3212. [Google Scholar] [CrossRef]
- Yeh, T.-C.; Elsberry, R.L. Interaction of Typhoons with the Taiwan Orography. Part II: Continuous and Discontinuous Tracks across the Island. Mon. Wea. Rev. 1993, 121, 3213–3233. [Google Scholar] [CrossRef]
- Lin, Y.-L.; Han, J.; Hamilton, D.W.; Huang, C.-Y. Orographic Influence on a Drifting Cyclone. J. Atmos. Sci. 1999, 56, 534–562. [Google Scholar] [CrossRef]
- Lin, Y.-L.; Ensley, D.B.; Chiao, S.; Huang, C.-Y. Orographic Influences on Rainfall and Track Deflection Associated with the Passage of a Tropical Cyclone. Mon. Wea. Rev. 2002, 130, 2929–2950. [Google Scholar] [CrossRef]
- Lin, Y.-L.; Chen, S.-Y.; Hill, C.M.; Huang, C.-Y. Control Parameters for the Influence of a Mesoscale Mountain Range on Cyclone Track Continuity and Deflection. Journal of the Atmospheric Sciences 2005, 62, 1849–1866. [Google Scholar] [CrossRef]
- Yeh, T.-C.; Hsiao, L.-F.; Chen, D.-S.; Huang, K.-N. A Study on Terrain-Induced Tropical Cyclone Looping in East Taiwan: Case Study of Typhoon Haitang in 2005. Nat Hazards 2012, 63, 1497–1514. [Google Scholar] [CrossRef]
- Peng, L.; Wang, S.-T.; Shieh, S.-L.; Cheng, M.-D.; Yeh, T.-C. Surface Track Discontinuity of Tropical Cyclones Crossing Taiwan: A Statistical Study. Monthly Weather Review 2012, 140, 121–139. [Google Scholar] [CrossRef]
- Gong, Y.; Li, Y.; Zhang, D.-L. A Statistical Study of Unusual Tracks of Tropical Cyclones near Taiwan Island. Journal of Applied Meteorology and Climatology 2018, 57, 193–206. [Google Scholar] [CrossRef]
- Huang, K.-C.; Wu, C.-C. The Impact of Idealized Terrain on Upstream Tropical Cyclone Track. Journal of the Atmospheric Sciences 2018, 75, 3887–3910. [Google Scholar] [CrossRef]
- Jian, G.-J.; Teng, J.-H.; Wang, S.-T.; Cheng, M.-D.; Cheng, C.-P.; Chen, J.-H.; Chu, Y.-J. An Overview of the Tropical Cyclone Database at the Central Weather Bureau of Taiwan. TAO 2022, 33, 26. [Google Scholar] [CrossRef]
- Huang, C.-Y.; Chen, C.-A.; Chen, S.-H.; Nolan, D.S. On the Upstream Track Deflection of Tropical Cyclones Past a Mountain Range: Idealized Experiments. Journal of the Atmospheric Sciences 2016, 73, 3157–3180. [Google Scholar] [CrossRef]
- Lin, Y.-L.; Chen, S.-H.; Liu, L. Orographic Influence on Basic Flow and Cyclone Circulation and Their Impacts on Track Deflection of an Idealized Tropical Cyclone. Journal of the Atmospheric Sciences 2016, 73, 3951–3974. [Google Scholar] [CrossRef]
- Hsu, L.-H.; Su, S.-H.; Fovell, R.G.; Kuo, H.-C. On Typhoon Track Deflections near the East Coast of Taiwan. Mon. Wea. Rev. 2018, 146, 1495–1510. [Google Scholar] [CrossRef]
- Hsu, L.-H.; Kuo, H.-C.; Fovell, R.G. On the Geographic Asymmetry of Typhoon Translation Speed across the Mountainous Island of Taiwan. Journal of the Atmospheric Sciences 2013, 70, 1006–1022. [Google Scholar] [CrossRef]
- Wu, C.-C.; Li, T.-H.; Huang, Y.-H. Influence of Mesoscale Topography on Tropical Cyclone Tracks: Further Examination of the Channeling Effect. Journal of the Atmospheric Sciences 2015, 72, 3032–3050. [Google Scholar] [CrossRef]
- Chang, W.-J. The Orographic Effects Induced by an Island Mountain Range on Propagating Tropical Cyclones. Mon. Wea. Rev. 1982, 110, 1255–1270. [Google Scholar] [CrossRef]
- Bender, M.A.; Tuleya, R.E.; Kurihara, Y. A Numerical Study of the Effect of Island Terrain on Tropical Cyclones. Mon. Wea. Rev. 1987, 115, 130–155. [Google Scholar] [CrossRef]
- Huang, Y.-H.; Wu, C.-C.; Wang, Y. The Influence of Island Topography on Typhoon Track Deflection. Monthly Weather Review 2011, 139, 1708–1727. [Google Scholar] [CrossRef]
- Adem, J. A Series Solution for the Barotropic Vorticity Equation and Its Application in the Study of Atmospheric Vortices. TellusA 1956, 8, 364–372. [Google Scholar] [CrossRef]
- Carnevale, G.F.; Kloosterziel, R.C.; Van Heijst, G.J.F. Propagation of Barotropic Vortices over Topography in a Rotating Tank. J. Fluid Mech. 1991, 233, 119–139. [Google Scholar] [CrossRef]
- Schär, C.; Smith, R.B. Shallow-Water Flow Past Isolated Topography. Part II: Transition to Vortex Shedding. J. Atmos. Sci. 1993, 50, 1401–1412. [Google Scholar] [CrossRef]
- Masuda, A.; Marubayashi, K.; Ishibashi, M. A Laboratory Experiment and Numerical Simulation of an Isolated Barotropic Eddy in a Basin with Topographic β. J. Fluid Mech. 1990, 213, 641. [Google Scholar] [CrossRef]
- Kuo, H.-C.; Williams, R.T.; Chen, J.-H.; Chen, Y.-L. Topographic Effects on Barotropic Vortex Motion: No Mean Flow. J. Atmos. Sci. 2001, 58, 1310–1327. [Google Scholar] [CrossRef]
- Chan, J.C.L. The Physics of Tropical Cyclone motion. Annu. Rev. Fluid Mech. 2005, 37, 99–128. [Google Scholar] [CrossRef]
- Chen, H.-C.; Leu, J.-H.; Lin, Y.-L.; Liu, H.-P.; Huang, C.-L.; Chen, H.-S.; Lan, T.-S. Cyclonic Motion and Structure in Rotating Tank: Experiment and Theoretical Analysis. Sensors and Materials 2021, 33, 2385. [Google Scholar] [CrossRef]
- Chen, H.-C. Interaction of Barotropic Vortices over Topography Based on Similarity Laws: Rotating Tank Experiment and Shallow-Water Simulation. Arab J Geosci 2022, 15, 276. [Google Scholar] [CrossRef]
- Chen, H.-C. Sensitivity Analysis of Strong Cyclone Track Deflection over Isolated Topography: Exploring the Impact of Vortex Impinging Direction and Strength. In Proceedings of the ECAS 2023; MDPI, November 27 2023; p. 1. [Google Scholar]
- Chen, H.-C. An Innovative Dynamic Model for Predicting Typhoon Track Deflections over Complex Terrain. Atmosphere 2024, 15, 1372. [Google Scholar] [CrossRef]
- Smith, R.B.; Smith, D.F. Pseudoinviscid wake formation by mountains in shallow-water flow with a drifting vortex. J. Atmos. Sci. 1995, 52, 436–454. [Google Scholar] [CrossRef]
- Tang, C.K.; Chan, J.C.L. Idealized Simulations of the Effect of Taiwan and Philippines Topographies on Tropical Cyclone Tracks. Quart J Royal Meteoro Soc 2014, 140, 1578–1589. [Google Scholar] [CrossRef]
- Tang, C.K.; Chan, J.C.L. Idealized Simulations of the Effect of Taiwan Topography on the Tracks of Tropical Cyclones with Different Sizes. Quart J Royal Meteoro Soc 2016, 142, 793–804. [Google Scholar] [CrossRef]
- Lin, Y.-F.; Wu, C.-C.; Yen, T.-H.; Huang, Y.-H. Typhoon Fanapi (2010) and Its Interaction with Taiwan Terrain—Evaluation of the Uncertainty in Track, Intensity and Rainfall Simulations. J. Meteorol. Soc. Jpn. Ser. II 2020, 98, 93–113. [Google Scholar] [CrossRef]
- Wu, C.-C.; Lien, G.-Y.; Chen, J.-H.; Zhang, F. Assimilation of Tropical Cyclone Track and Structure Based on the Ensemble Kalman Filter (EnKF). Journal of the Atmospheric Sciences 2010, 67, 3806–3822. [Google Scholar] [CrossRef]
- Lin, Y.-L.; Savage, L.C. Effects of Landfall Location and the Approach Angle of a Cyclone Vortex Encountering a Mesoscale Mountain Range. Journal of the Atmospheric Sciences 2011, 68, 2095–2106. [Google Scholar] [CrossRef]
- Liu, L.; Lin, Y.-L.; Chen, S.-H. Effects of Landfall Location and Approach Angle of an Idealized Tropical Cyclone over a Long Mountain Range. Front. Earth Sci. 2016, 4. [Google Scholar] [CrossRef]
- Holland, G.J. An Analytic Model of the Wind and Pressure Profiles in Hurricanes. Mon. Wea. Rev. 1980, 108, 1212–1218. [Google Scholar] [CrossRef]
- Chan, J.C.L.; Williams, R.T. Analytical and Numerical Studies of the Beta-Effect in Tropical Cyclone Motion. Part I: Zero Mean Flow. J. Atmos. Sci. 1987, 44, 1257–1265. [Google Scholar] [CrossRef]
- Wu, L.; Wang, B. A Potential Vorticity Tendency Diagnostic Approach for Tropical Cyclone Motion. Mon. Wea. Rev. 2000, 128, 1899–1911. [Google Scholar] [CrossRef]
- Chan, J.C.L.; Ko, F.M.F.; Lei, Y.M. Relationship between Potential Vorticity Tendency and Tropical Cyclone Motion. J. Atmos. Sci. 2002, 59, 1317–1336. [Google Scholar] [CrossRef]
- Pedlosky, J. Geophysical Fluid Dynamics; Springer New York: New York, NY, 1987; ISBN 978-0-387-96387-7. [Google Scholar]
- Chan, J.C.L. Physical Mechanisms Responsible for Track Changes and Rainfall Distributions Associated with Tropical Cyclone Landfall. In Oxford Handbook Topics in Physical Sciences; Oxford Handbooks Editorial Board, Ed.; Oxford University Press, 2017 ISBN 978-0-19-069942-0.
- Chen, H.-C.; Leu, J.-H.; Liu, Y.; Xie, H.-S.; Chen, Q. A Validated Study of a Modified Shallow Water Model for Strong Cyclonic Motions and Their Structures in a Rotating Tank. Mathematical Problems in Engineering 2021, 1–15. [Google Scholar] [CrossRef]
Figure 1.
Schematic of the dynamic model illustrating the interaction between a strong cyclonic vortex and isolated topography, adapted from Chen [35]. (a) Plan view showing the vortex approaching the terrain, characterized by its major axis orientation (
Figure 1.
Schematic of the dynamic model illustrating the interaction between a strong cyclonic vortex and isolated topography, adapted from Chen [35]. (a) Plan view showing the vortex approaching the terrain, characterized by its major axis orientation (
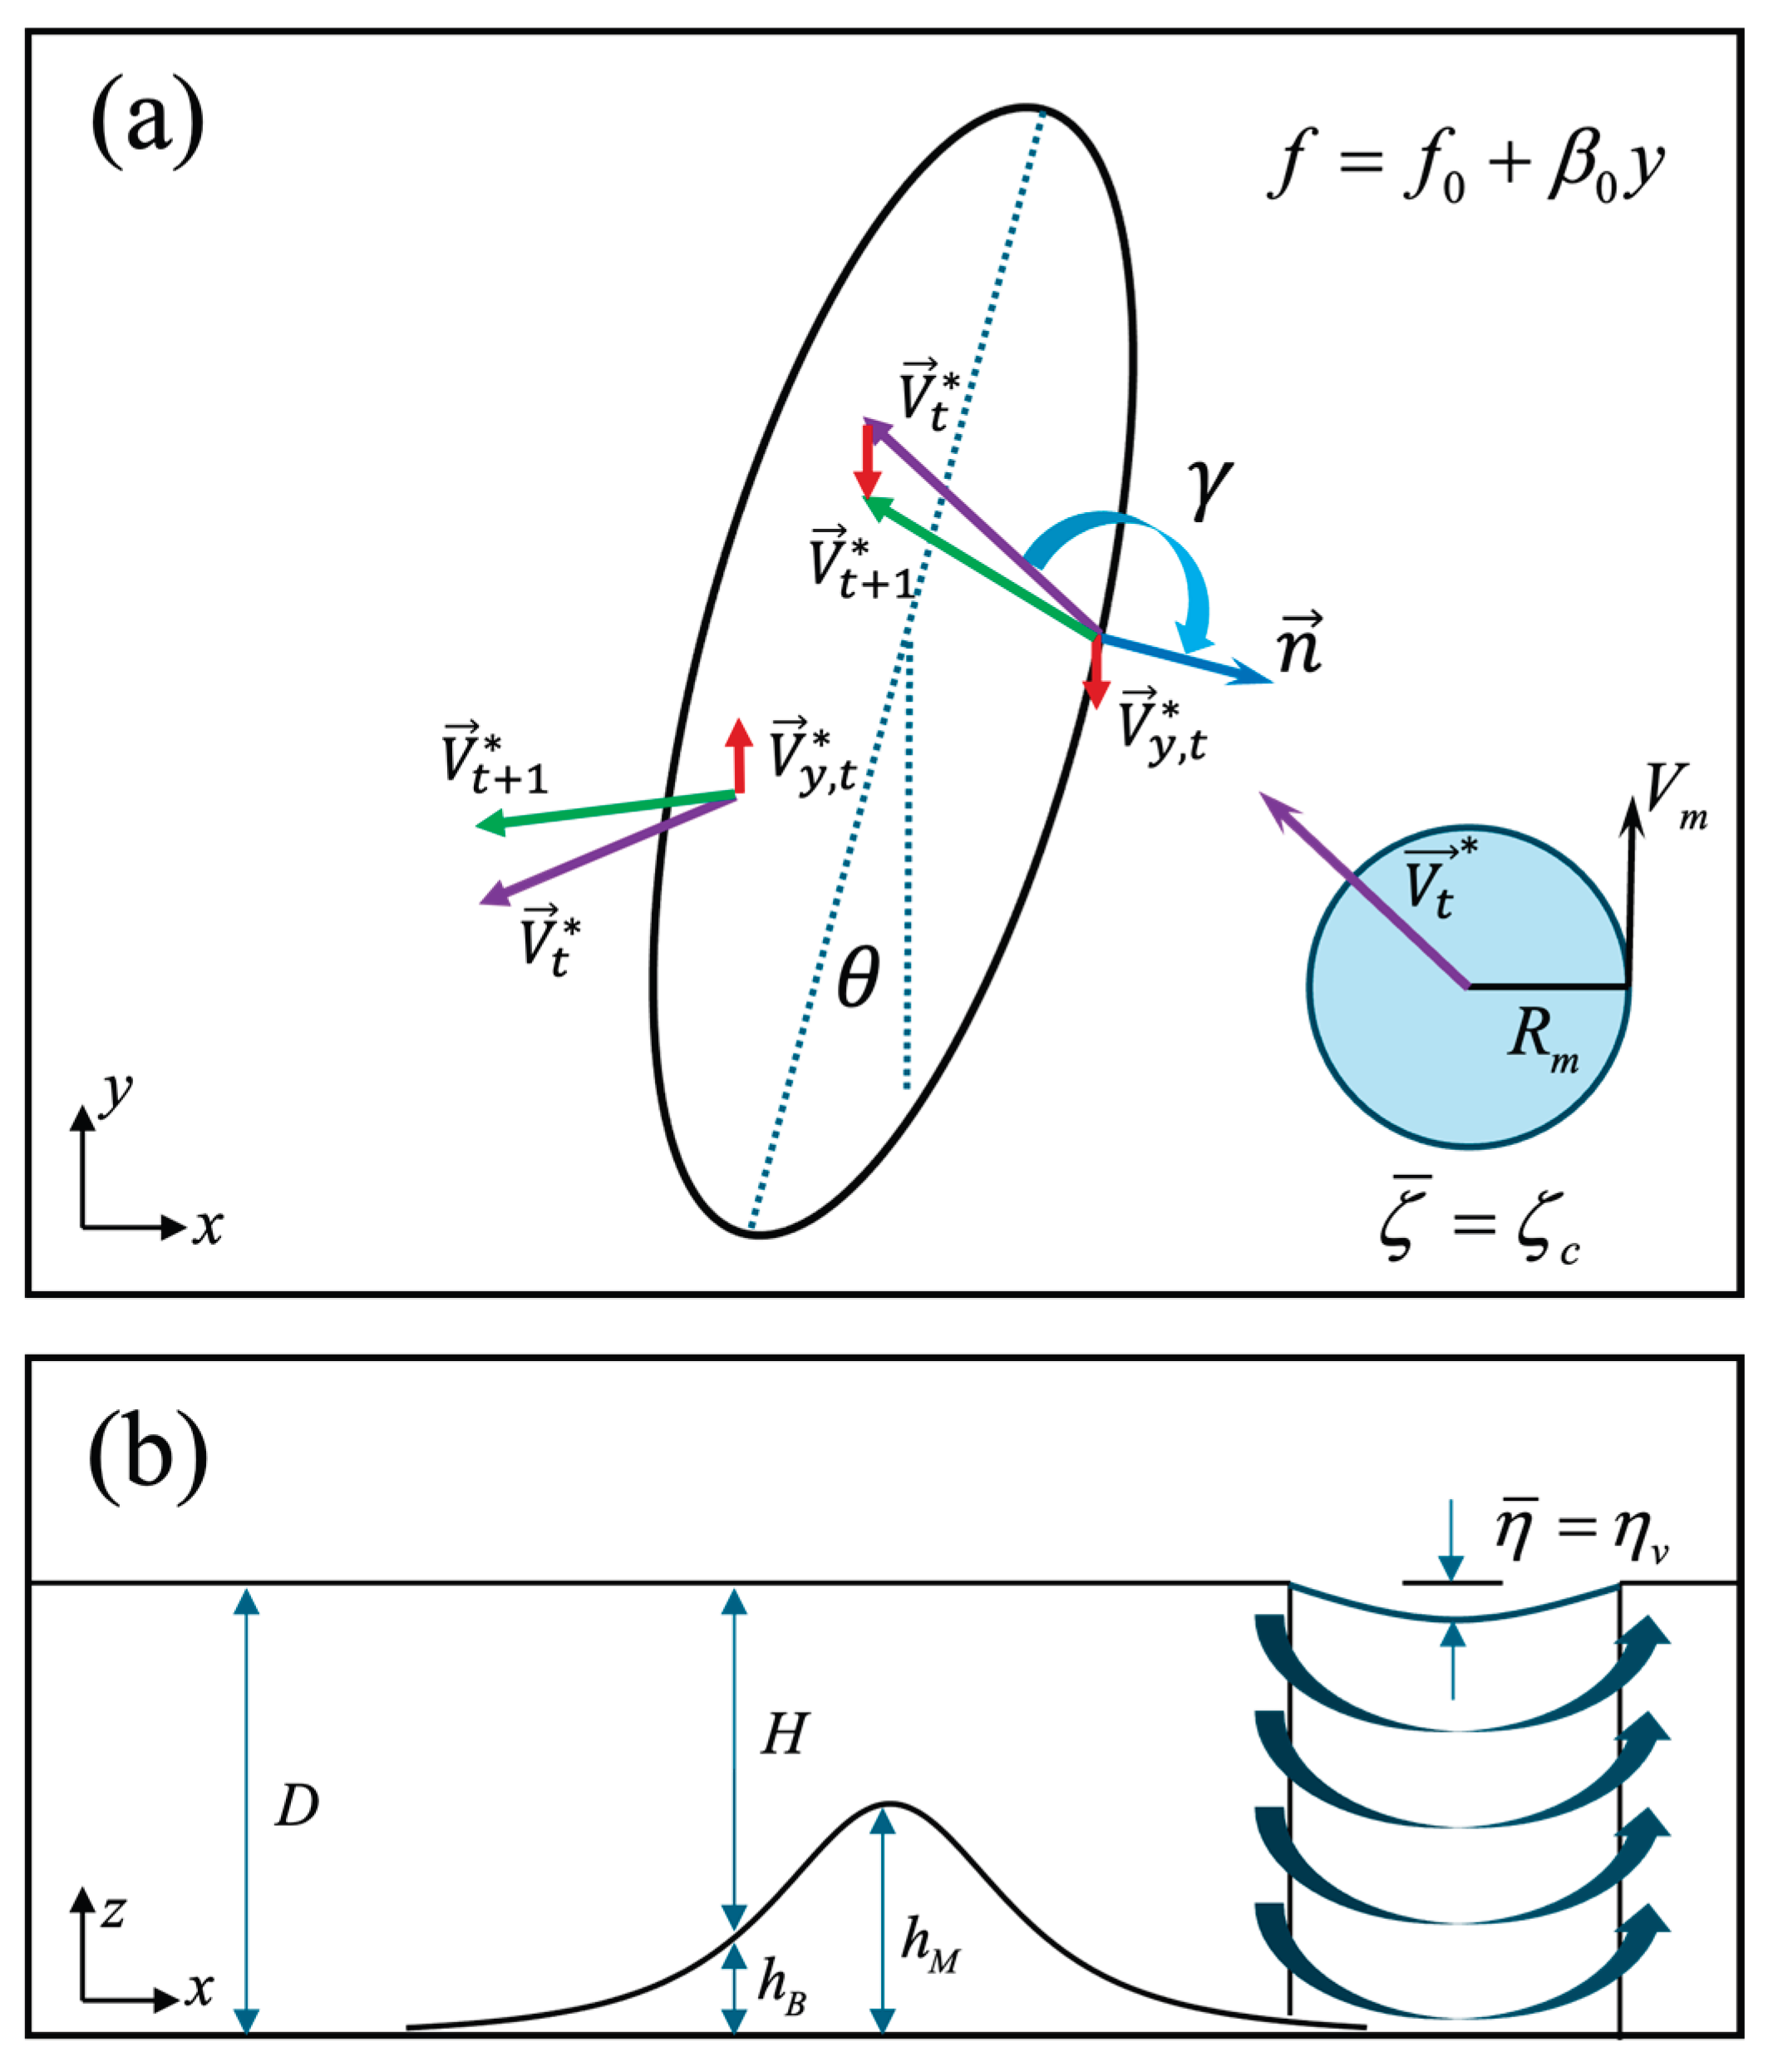
Figure 2.
(a) Topographic contours of the three-dimensional bell-shaped mountain used in the idealized simulations. Solid and dashed black lines represent 100 m and 1000 m elevation intervals, respectively. The major axis is oriented at 15° to simulate the general alignment of Taiwan's Central Mountain Range. (b) Latitudinal cross-sectional profiles of the idealized terrain at the indicated latitudes (AA' to GG'), showing a smooth, symmetric structure with the steepest slopes near the central axis.
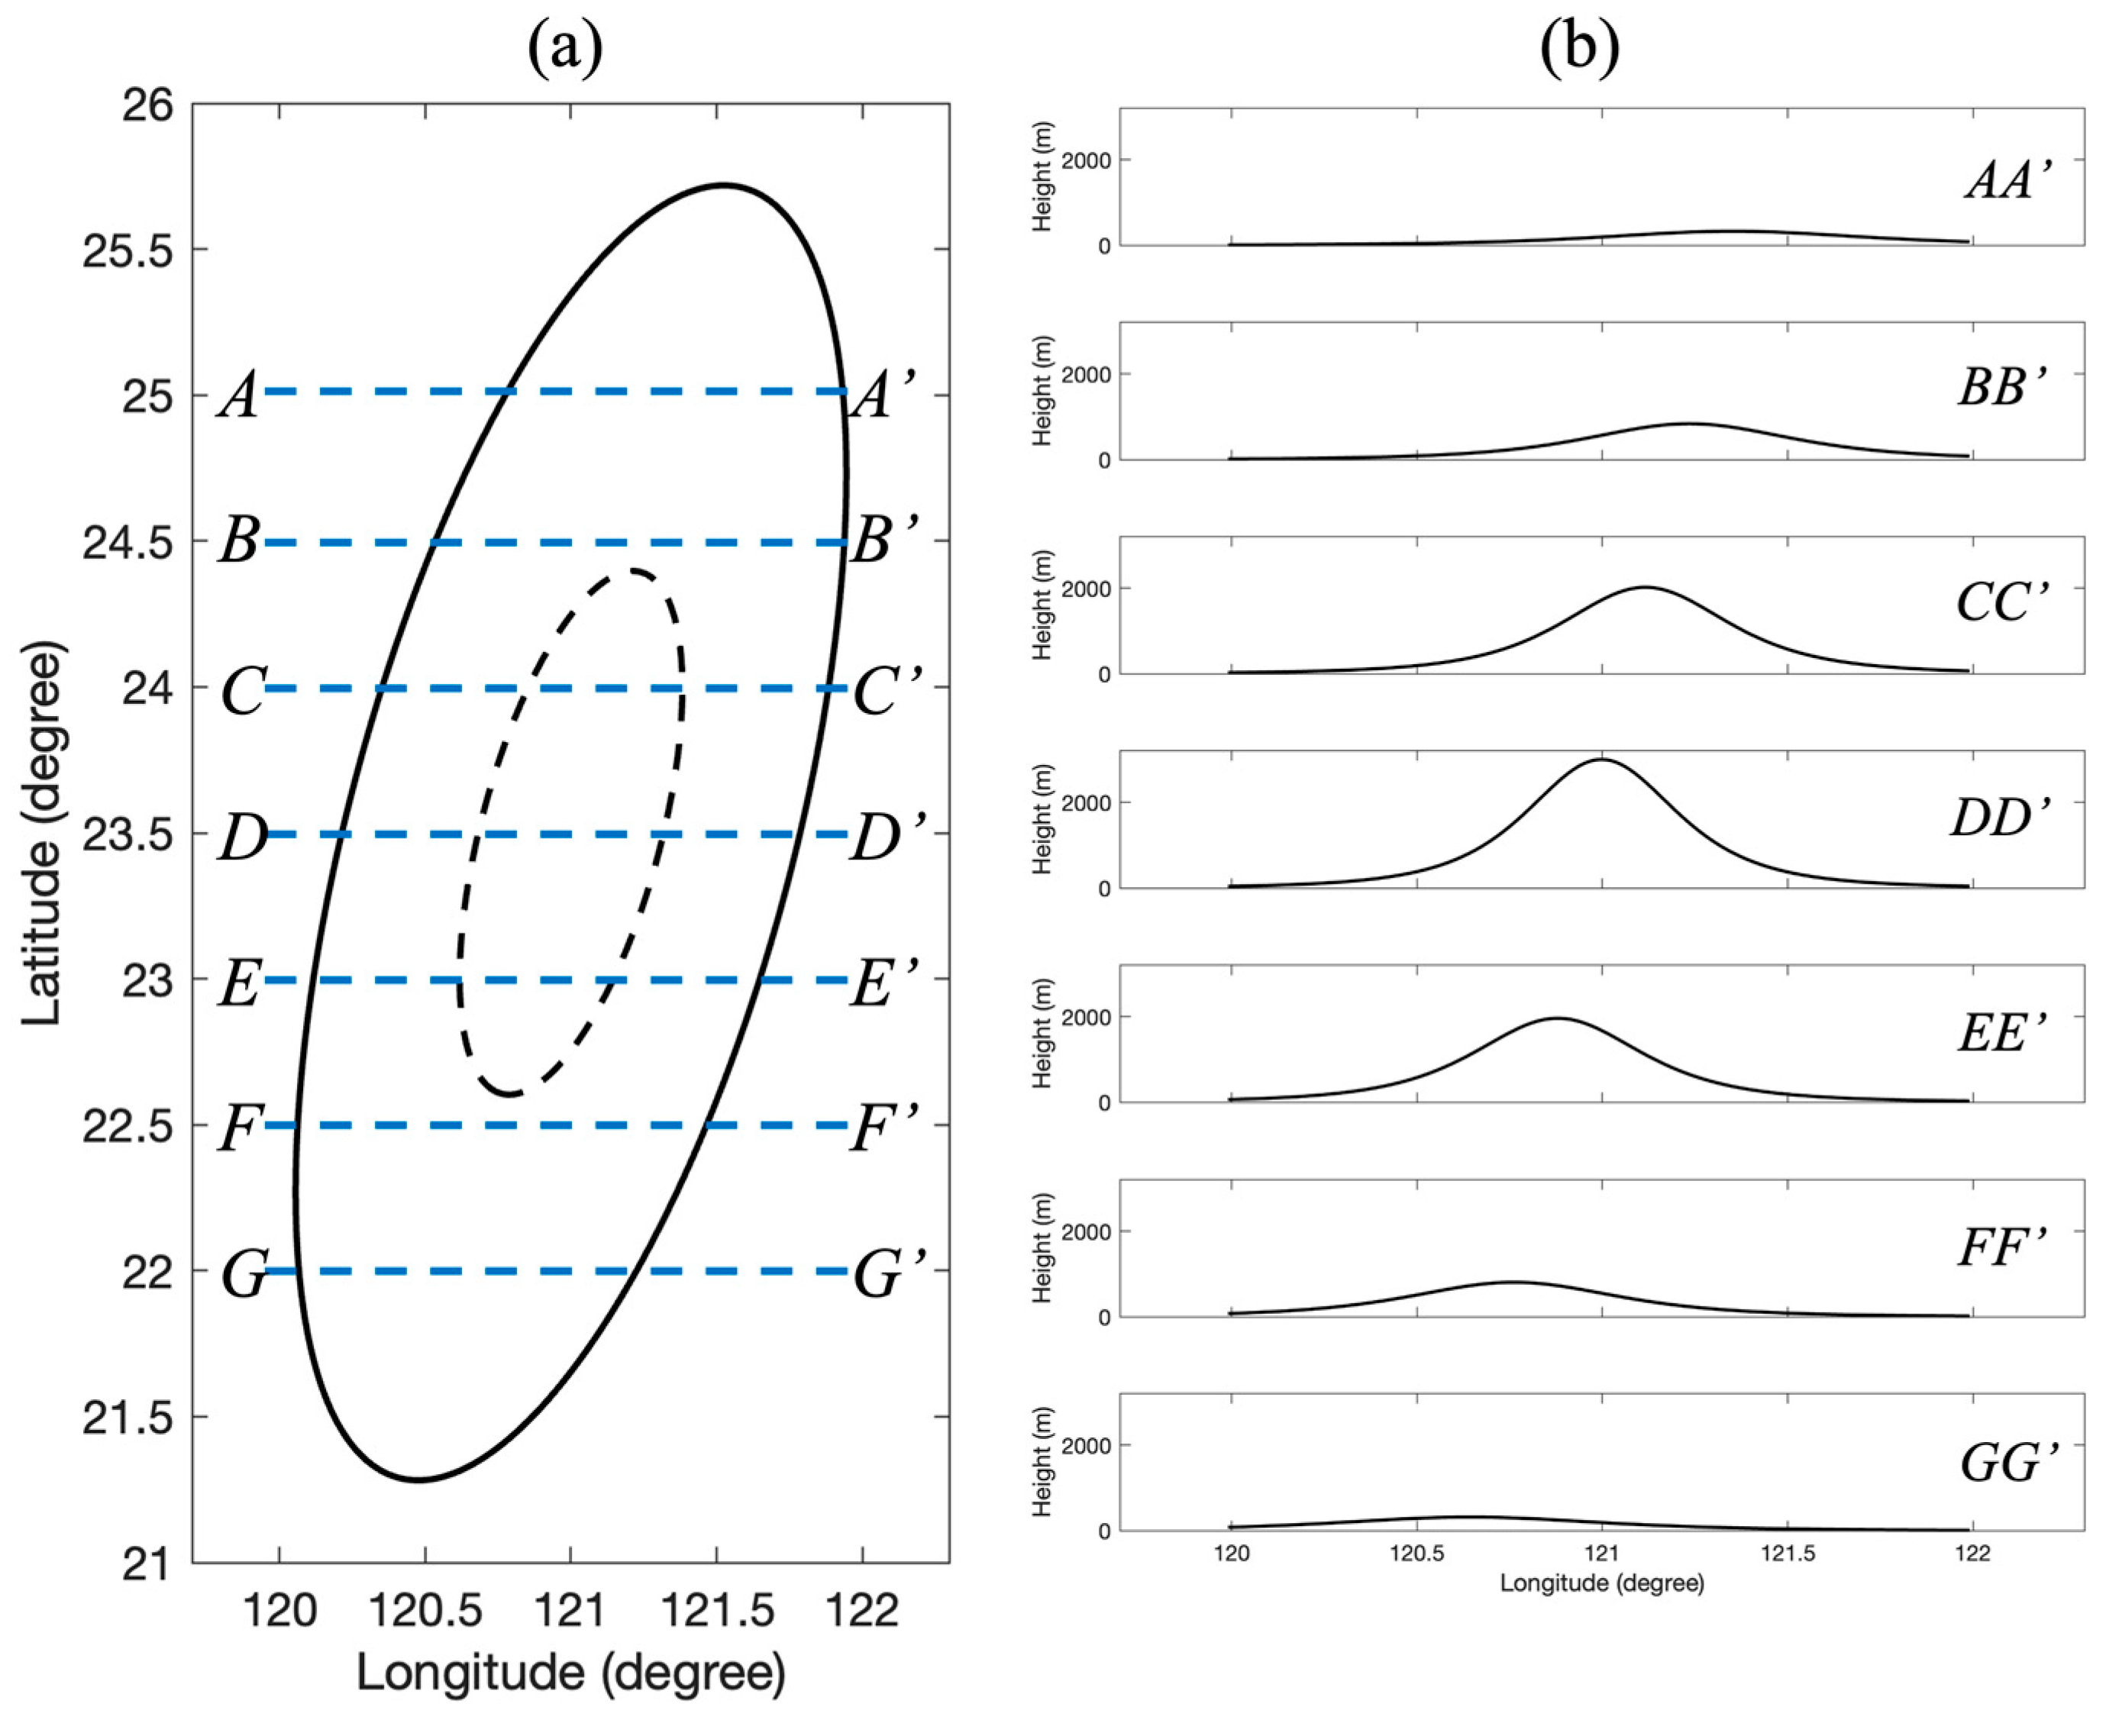
Figure 3.
Scanned tracks of vortices S1–S4 over the idealized mountain for impinging angles of (a–d) 195° and (e–h) 170°. Each panel displays 31 tracks originating from different latitudes. Pink circles mark the locations of maximum vortex column compression (
Figure 3.
Scanned tracks of vortices S1–S4 over the idealized mountain for impinging angles of (a–d) 195° and (e–h) 170°. Each panel displays 31 tracks originating from different latitudes. Pink circles mark the locations of maximum vortex column compression (
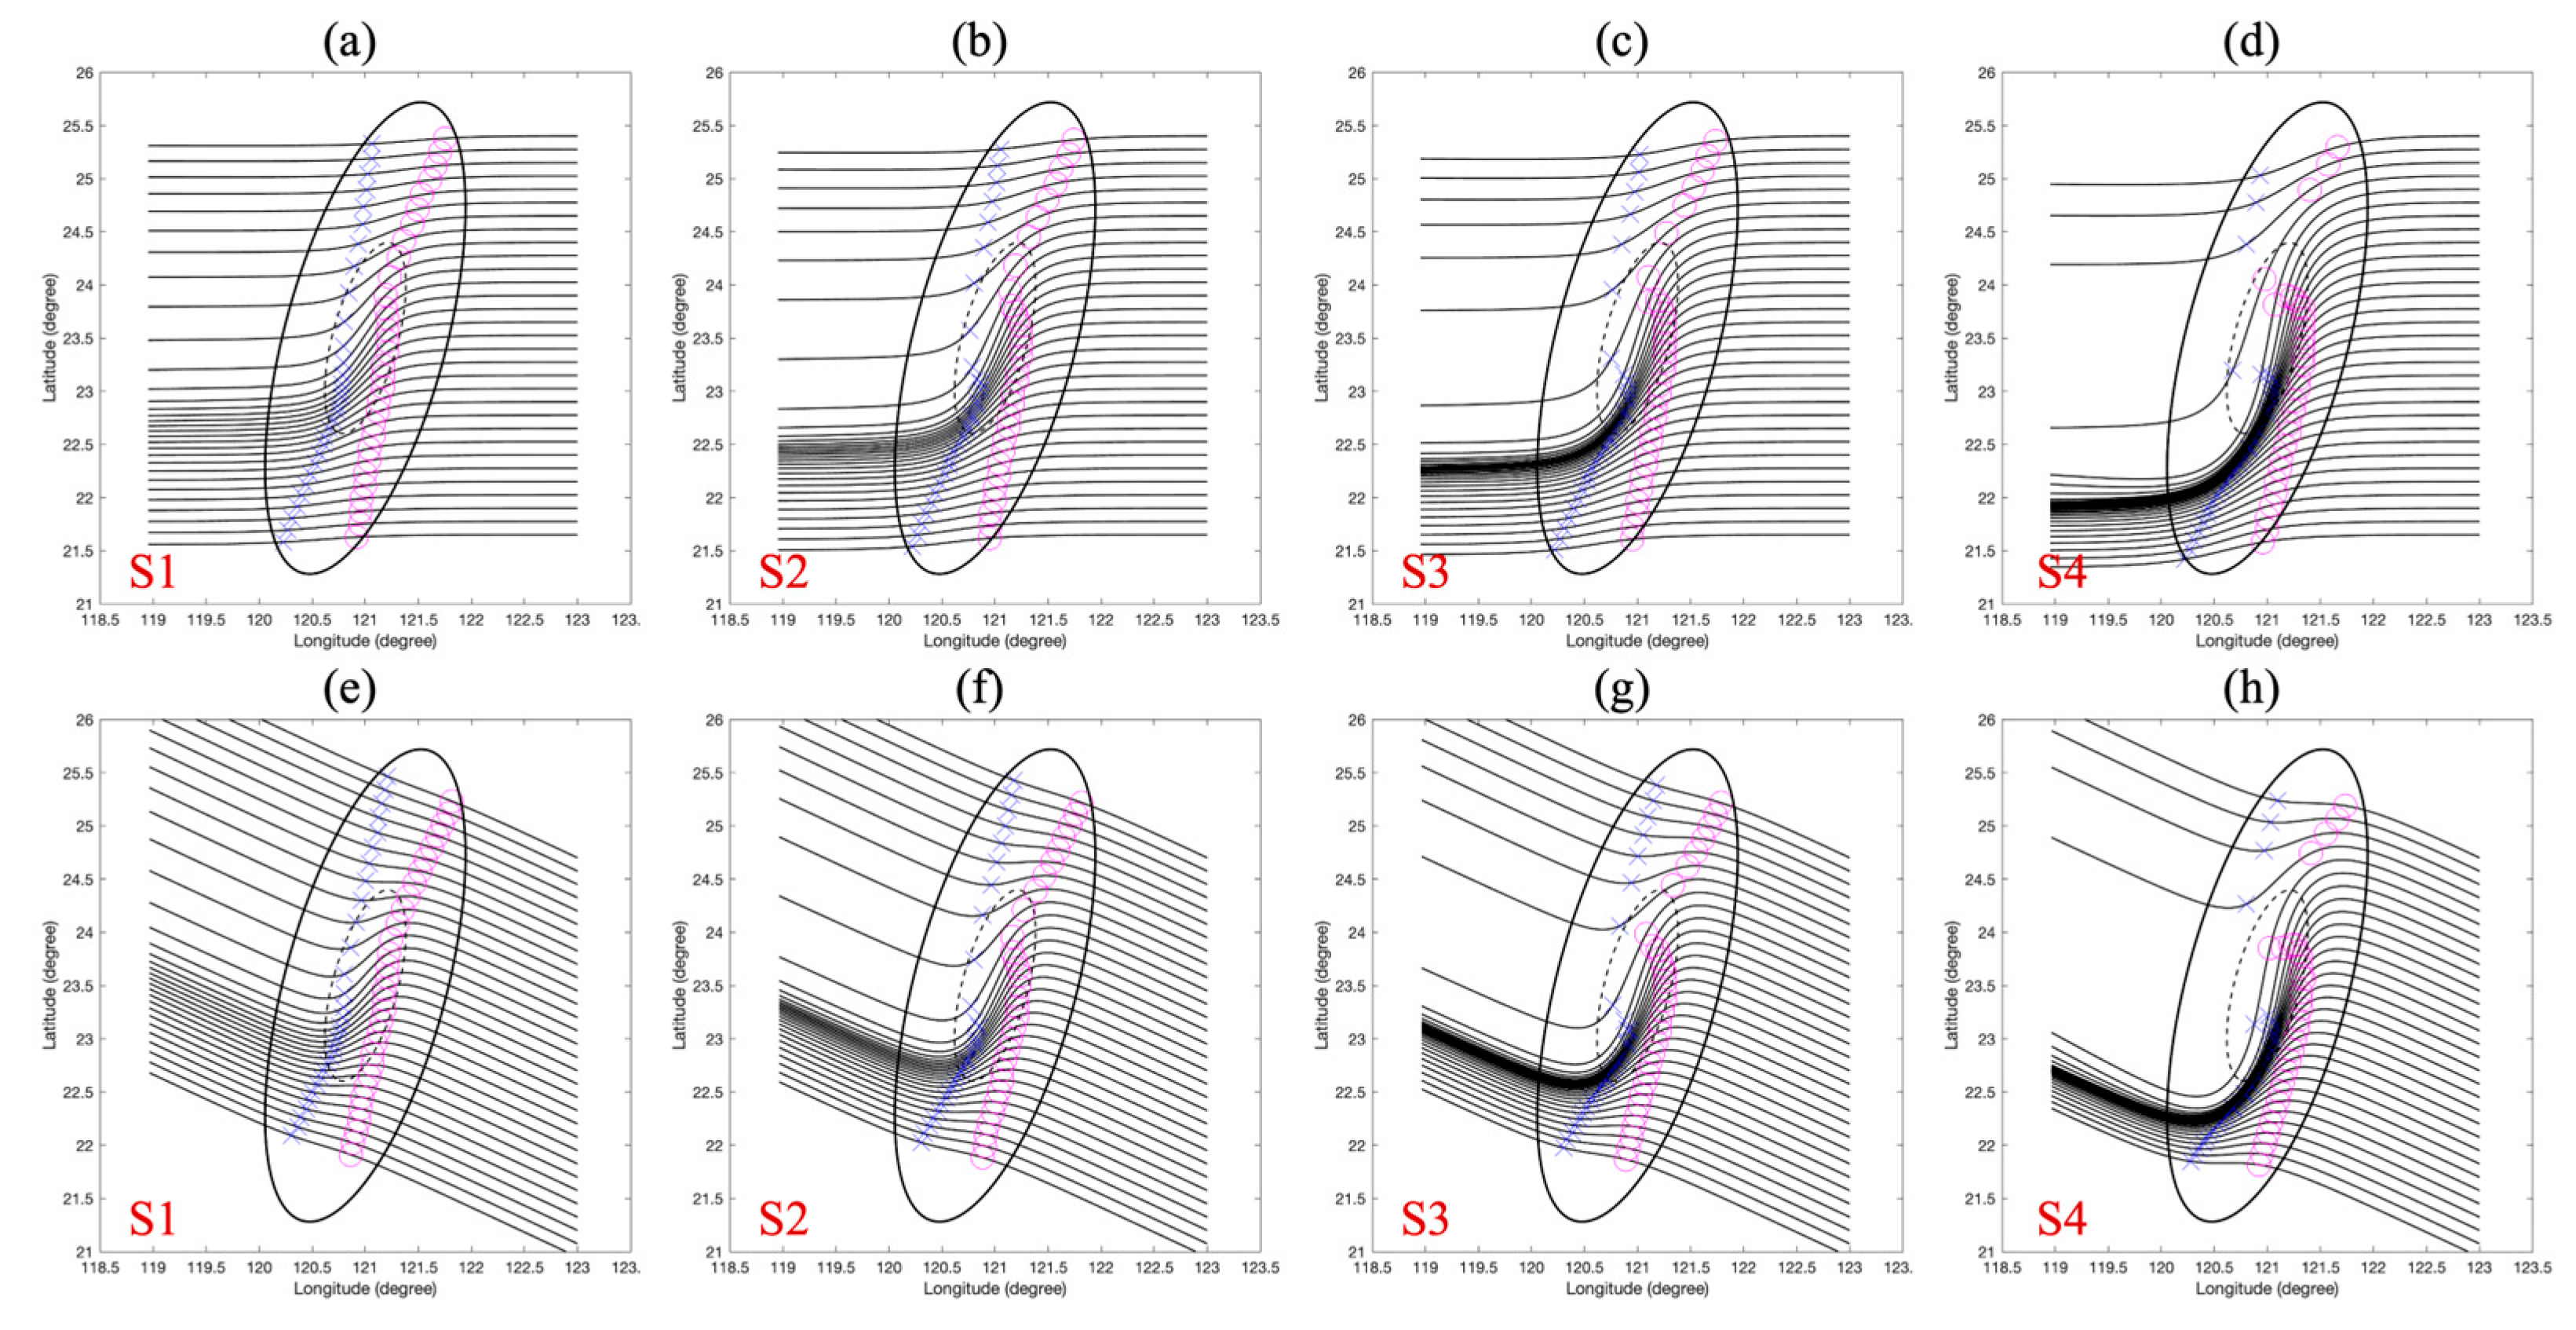
Figure 4.
Same as Figure 3, but for shallower impinging angles of (a–d) 145° and (e–h) 125°. The prolonged interaction time at these oblique angles leads to more extreme track morphologies, including terrain-induced cyclonic looping for the stronger vortices.
Figure 4.
Same as Figure 3, but for shallower impinging angles of (a–d) 145° and (e–h) 125°. The prolonged interaction time at these oblique angles leads to more extreme track morphologies, including terrain-induced cyclonic looping for the stronger vortices.
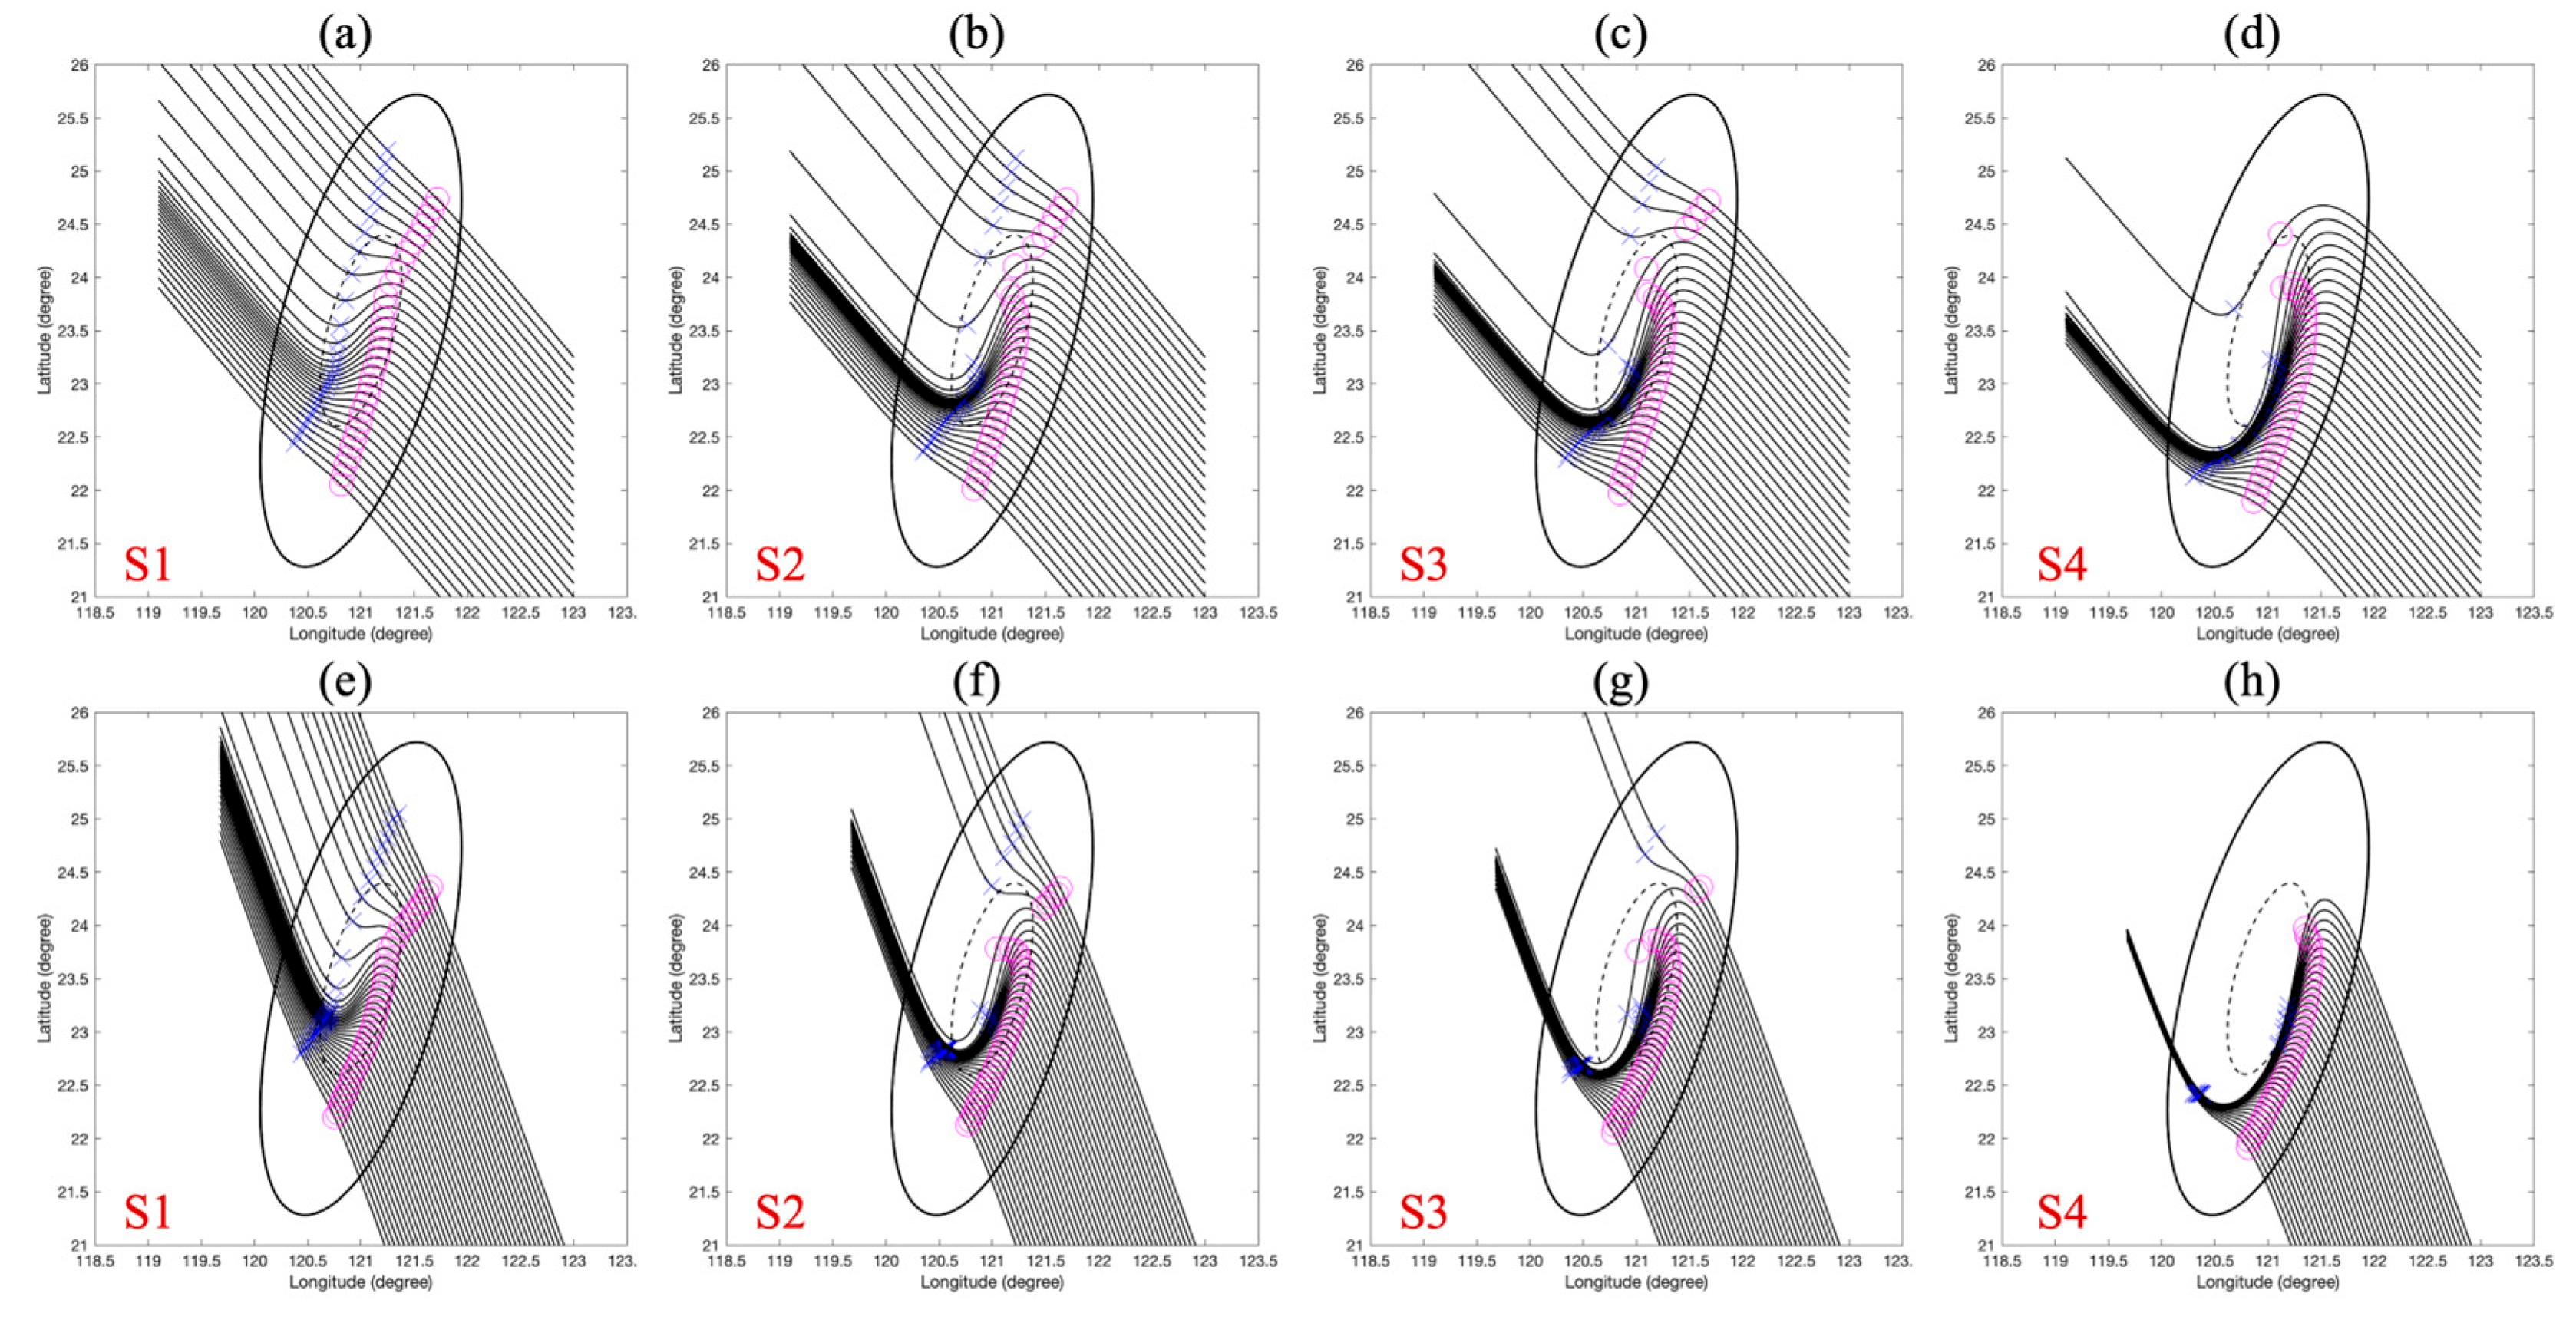
Figure 5.
The structure of track predictability for vortex S3 at a 170° impinging angle over idealized terrain. The underlying scanned tracks (black lines) are overlaid with isopleths of the track divergence percentage (
Figure 5.
The structure of track predictability for vortex S3 at a 170° impinging angle over idealized terrain. The underlying scanned tracks (black lines) are overlaid with isopleths of the track divergence percentage (
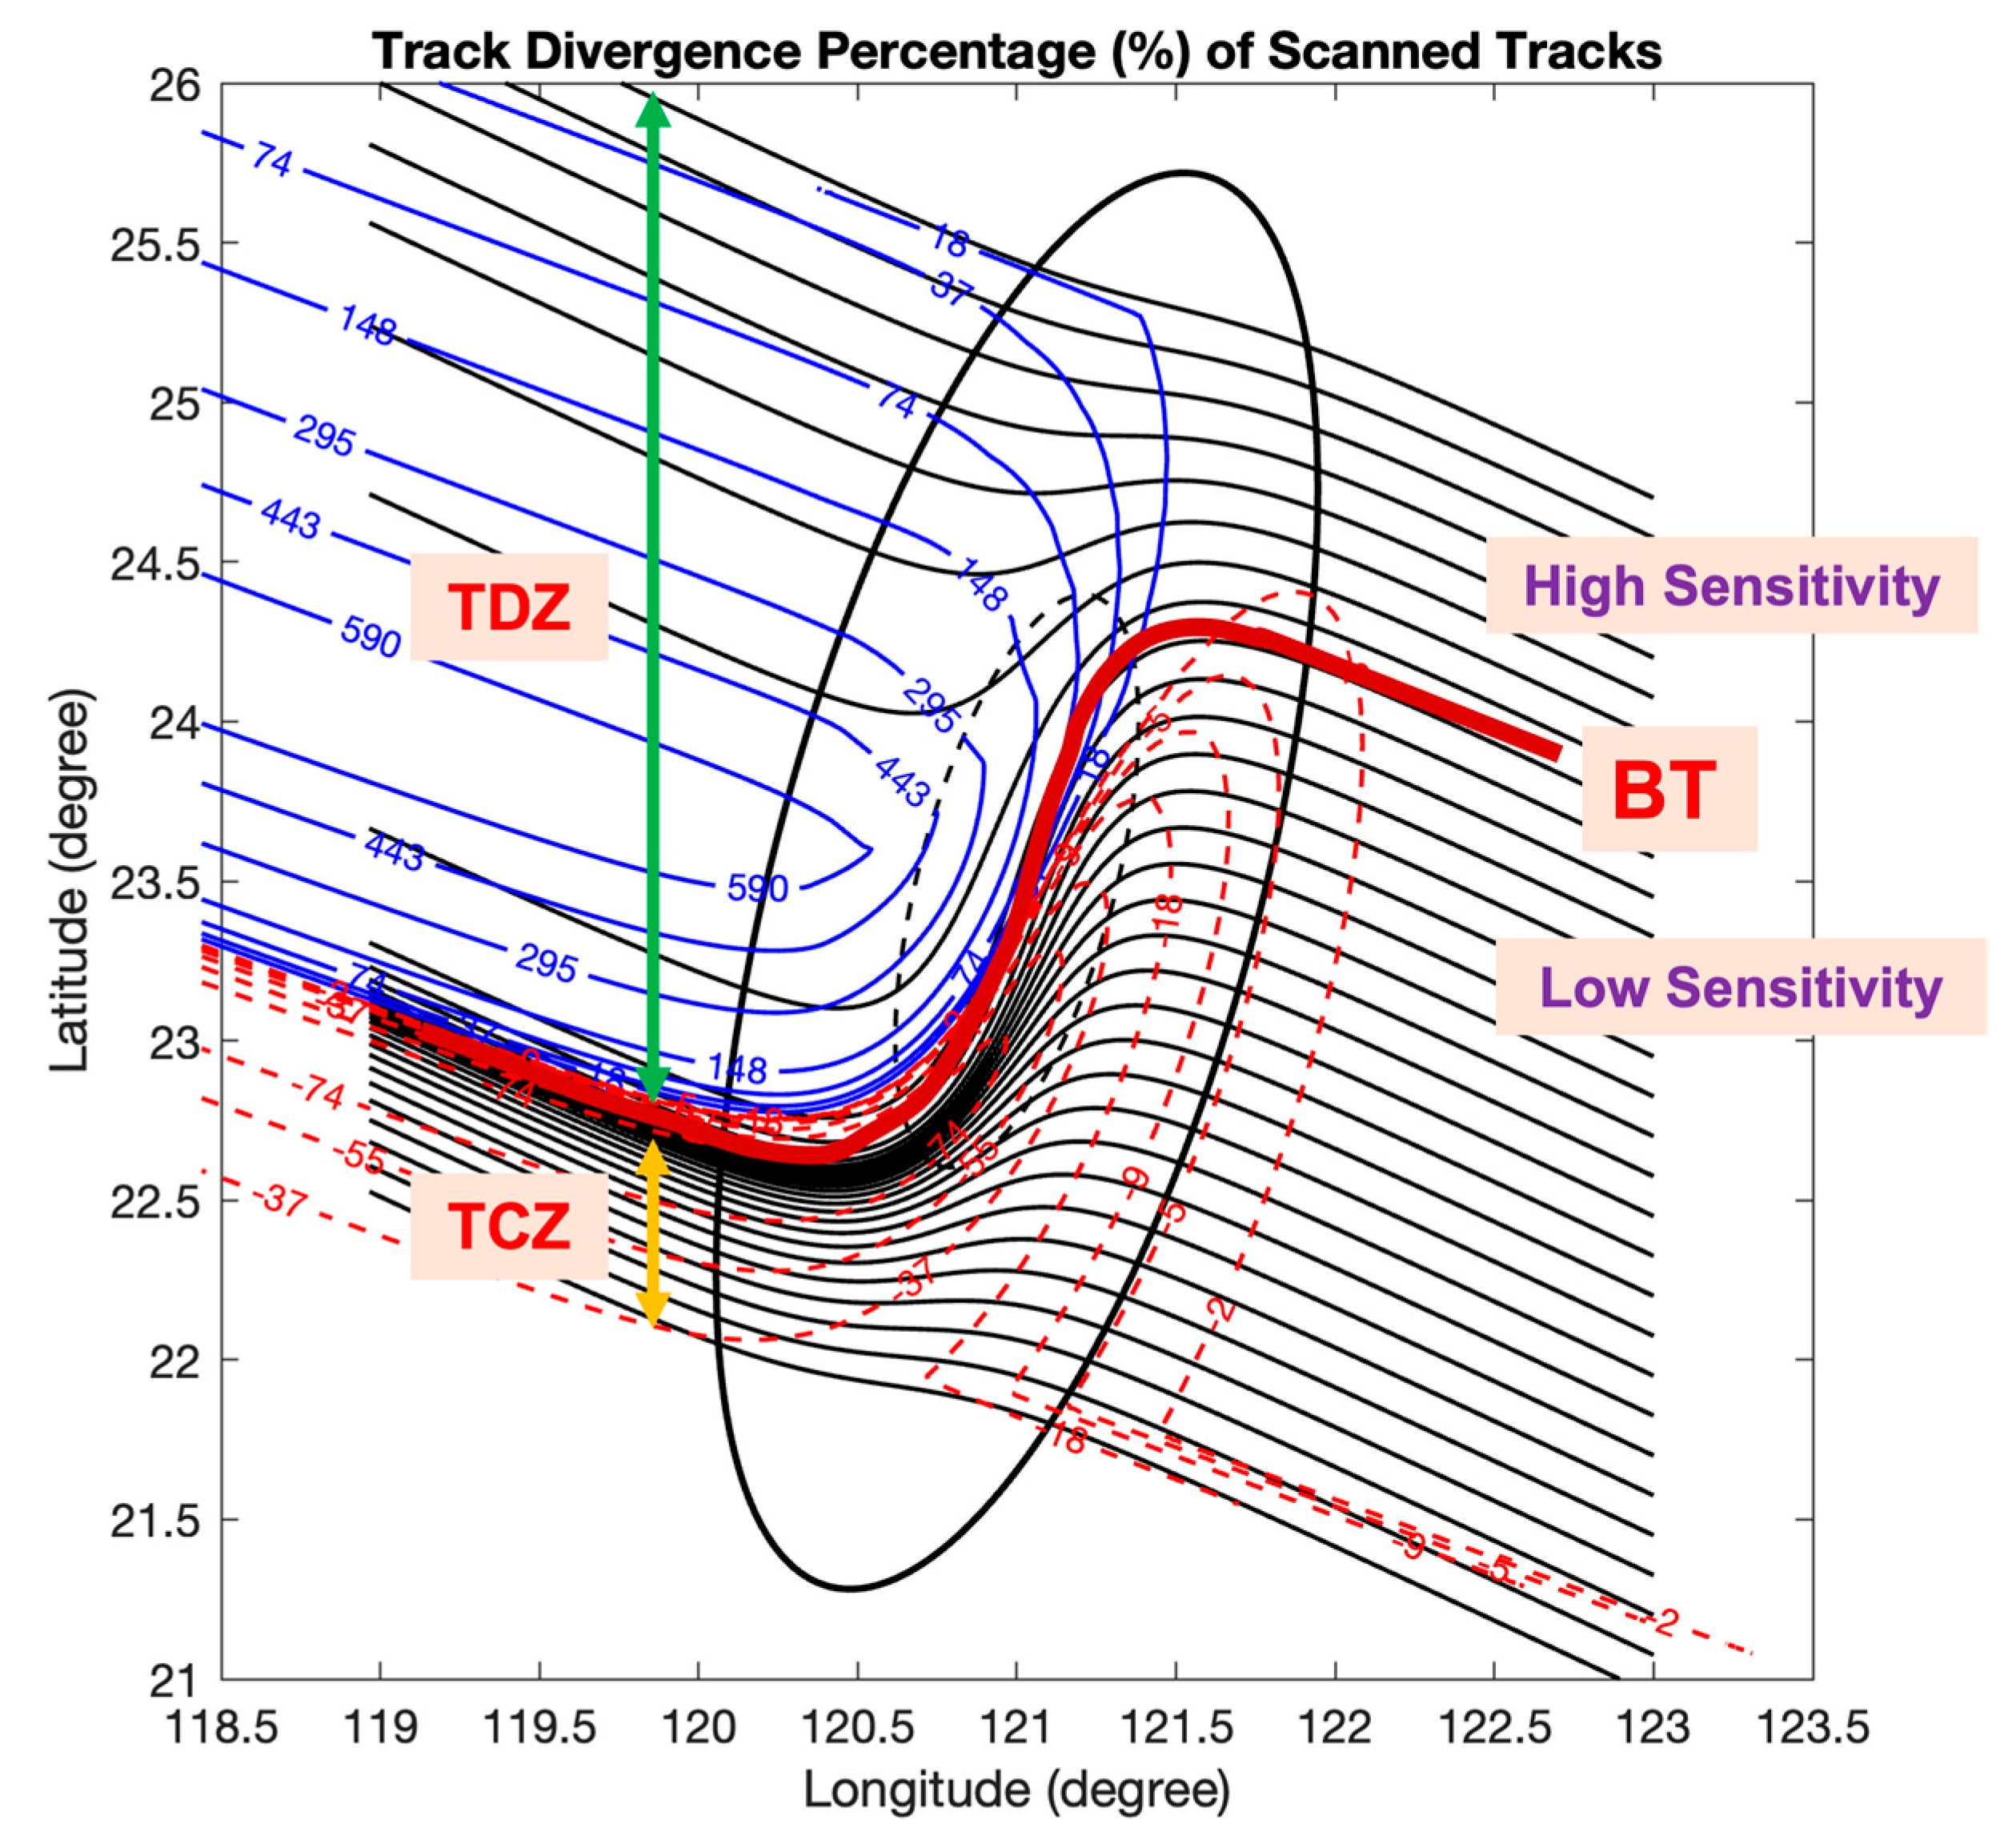
Figure 6.
Evolution of the track divergence percentage (
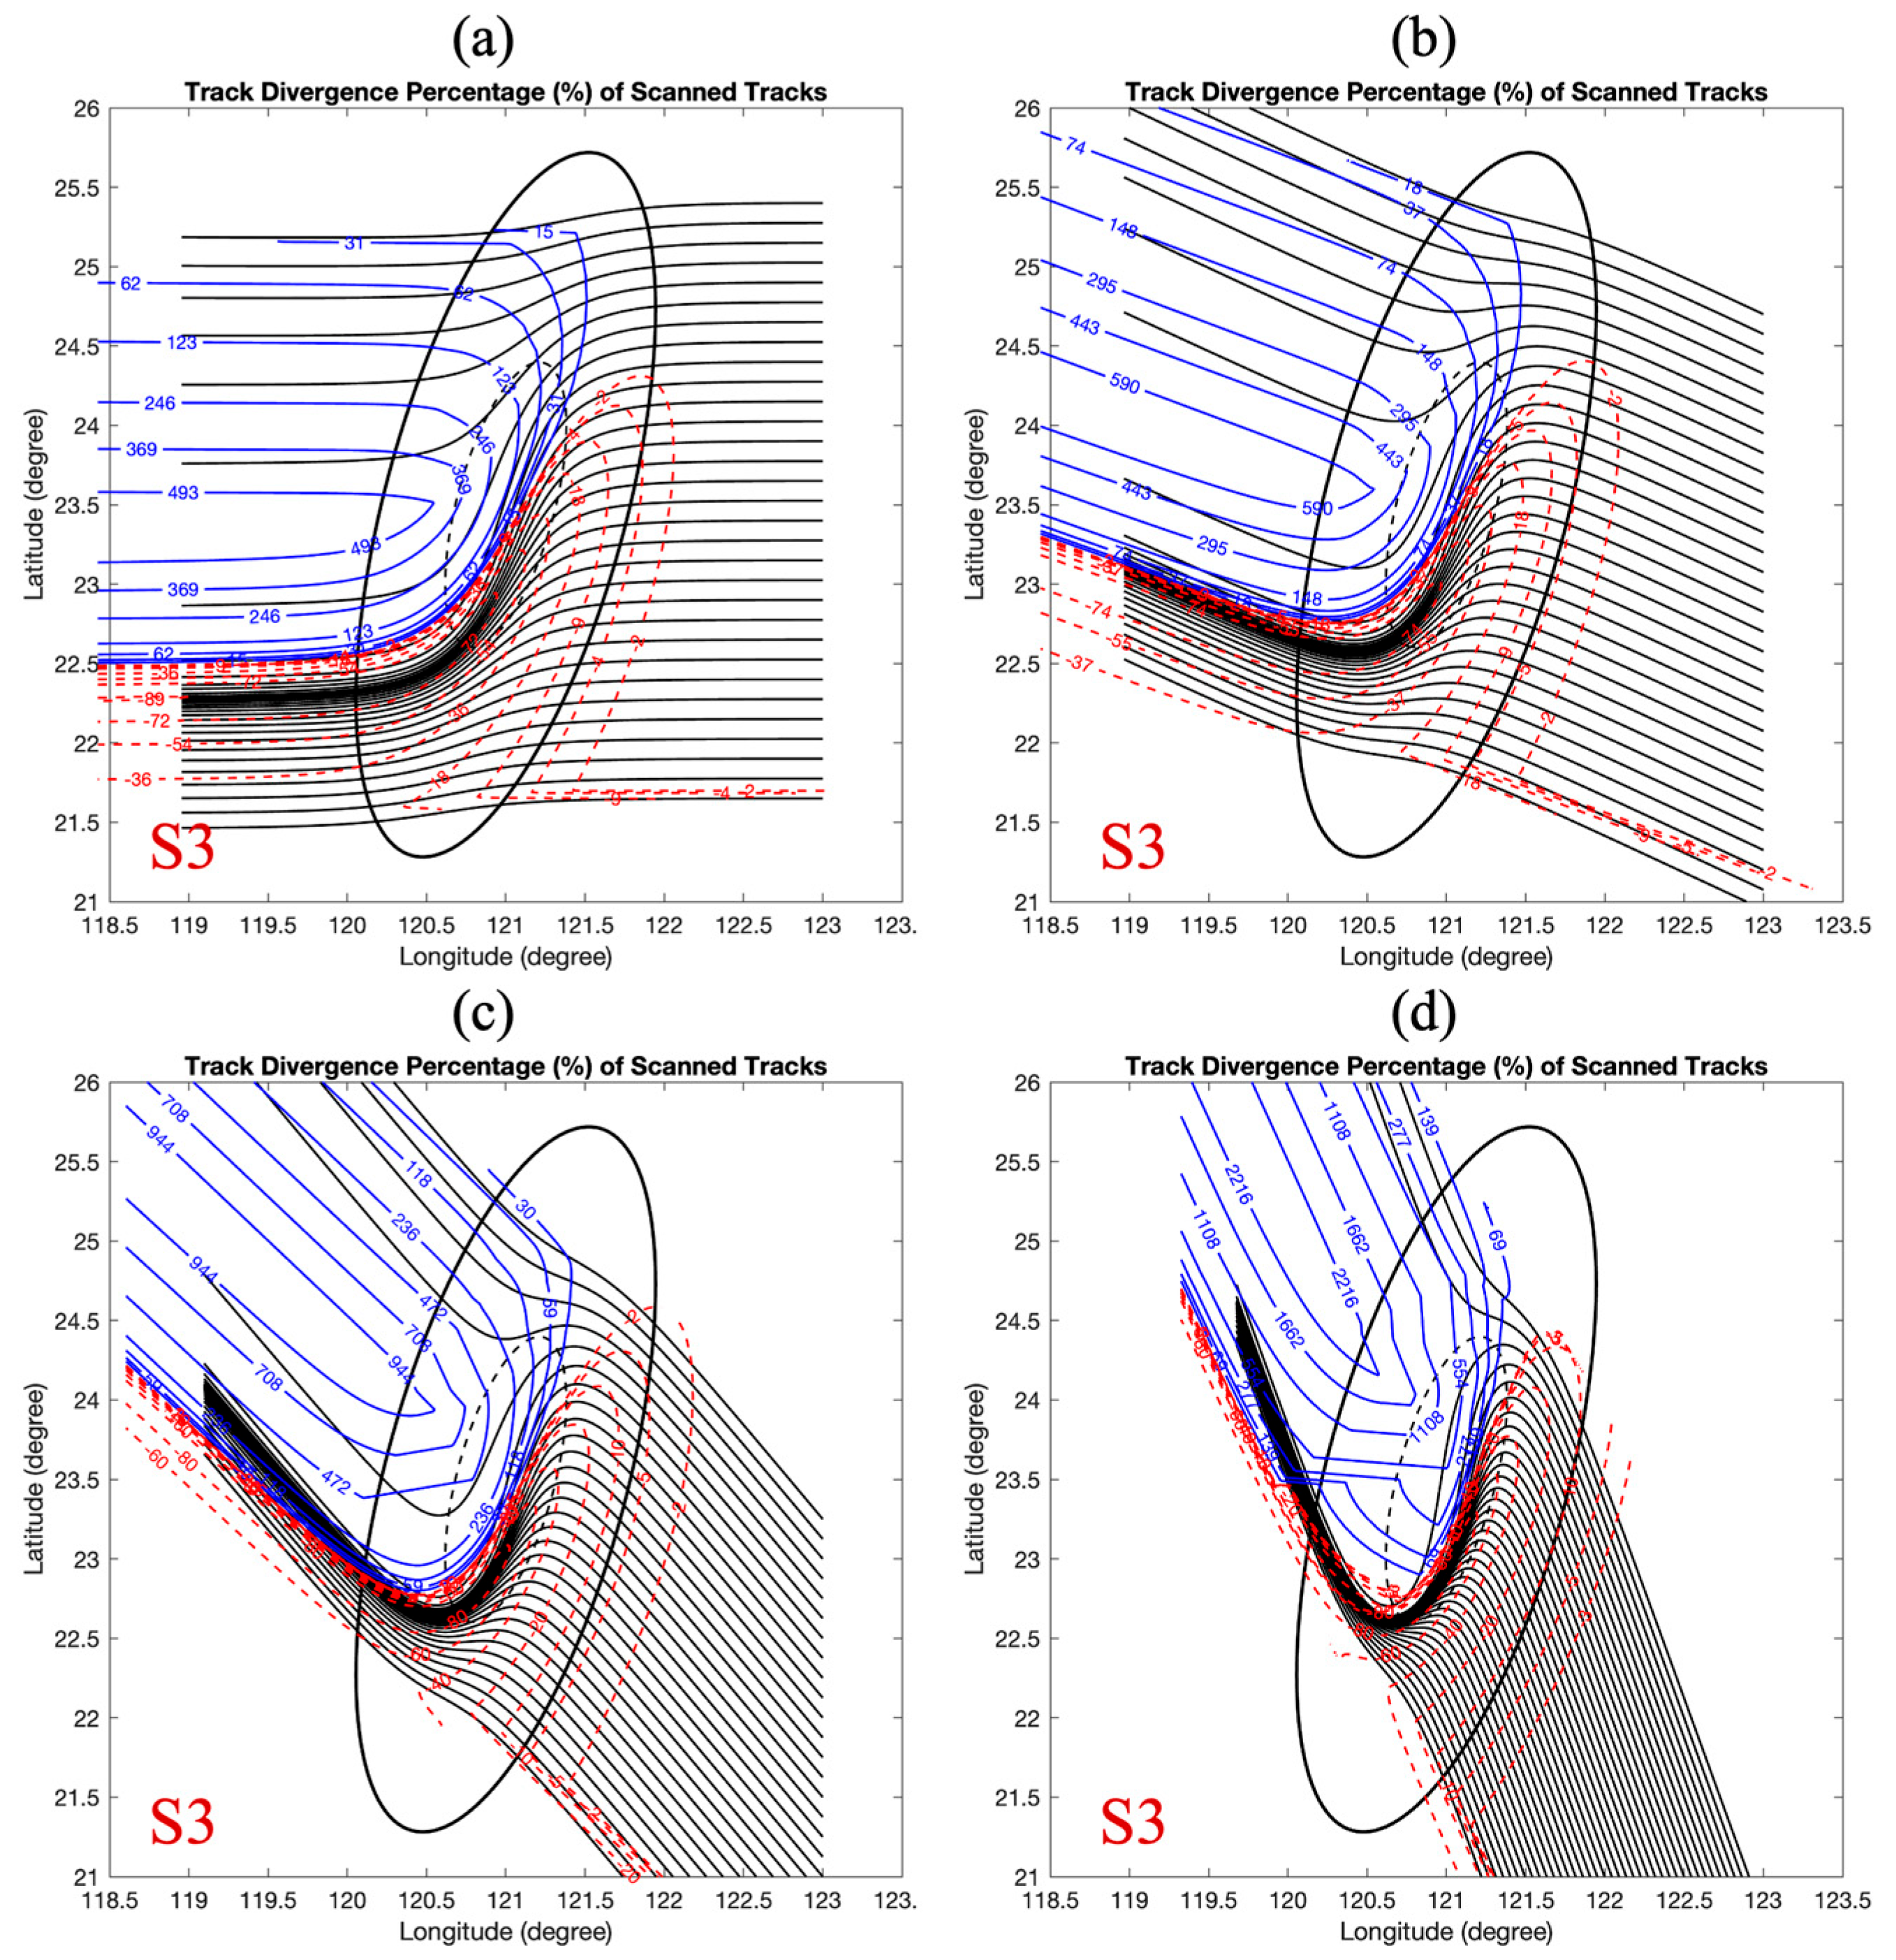
Figure 7.
Kinematic analysis of the scanned tracks for vortex S3 at impinging angles of (a, e) 195°, (b, f) 170°, (c, g) 145°, and (d, h) 125°. The top panels (a–d) show the scanned tracks with regions of acceleration (A) and deceleration (D) marked. The bottom panels (e–h) show the longitudinal profiles of the vortex drifting speed,
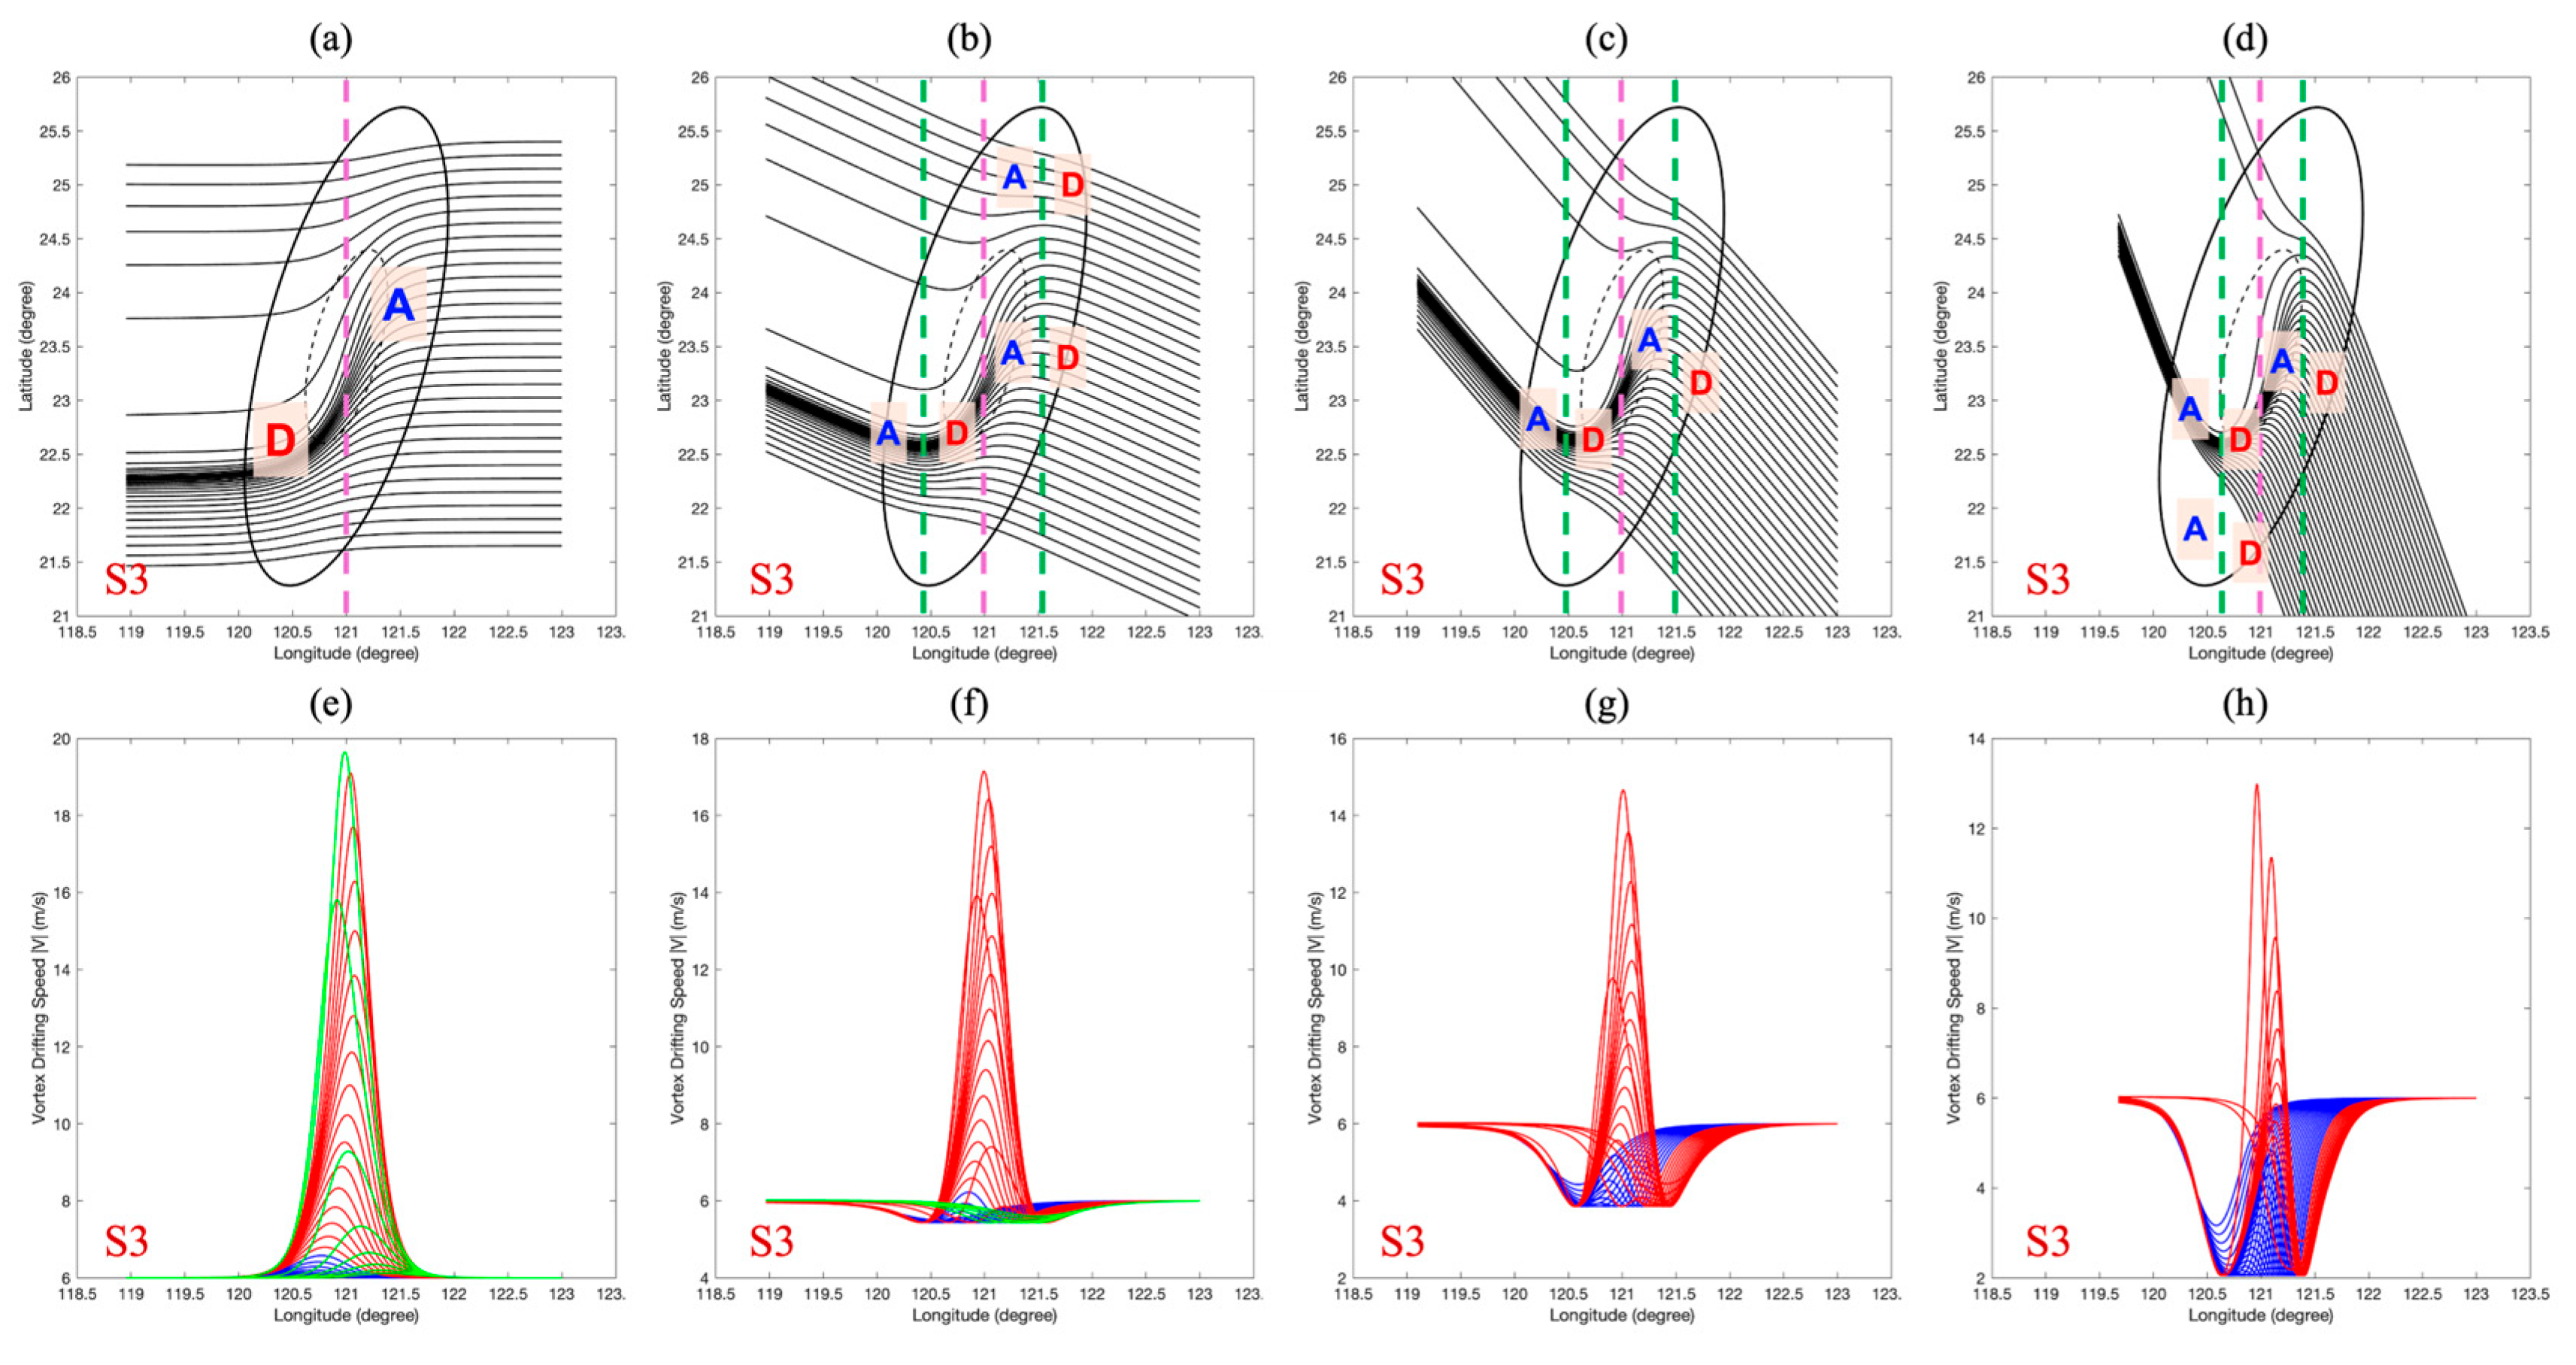
Figure 8.
Figure 8. Topography of Taiwan Island. (a) Zonal (latitudinal) cross-sections (AA' to HH') and (b) their corresponding elevation profiles, highlighting the steep eastern escarpment. (c) Along-axis cross-sections parallel to the Central Mountain Range (CMR) and (d) their corresponding elevation profiles, revealing the rugged, multi-peaked nature of the mountain spine.
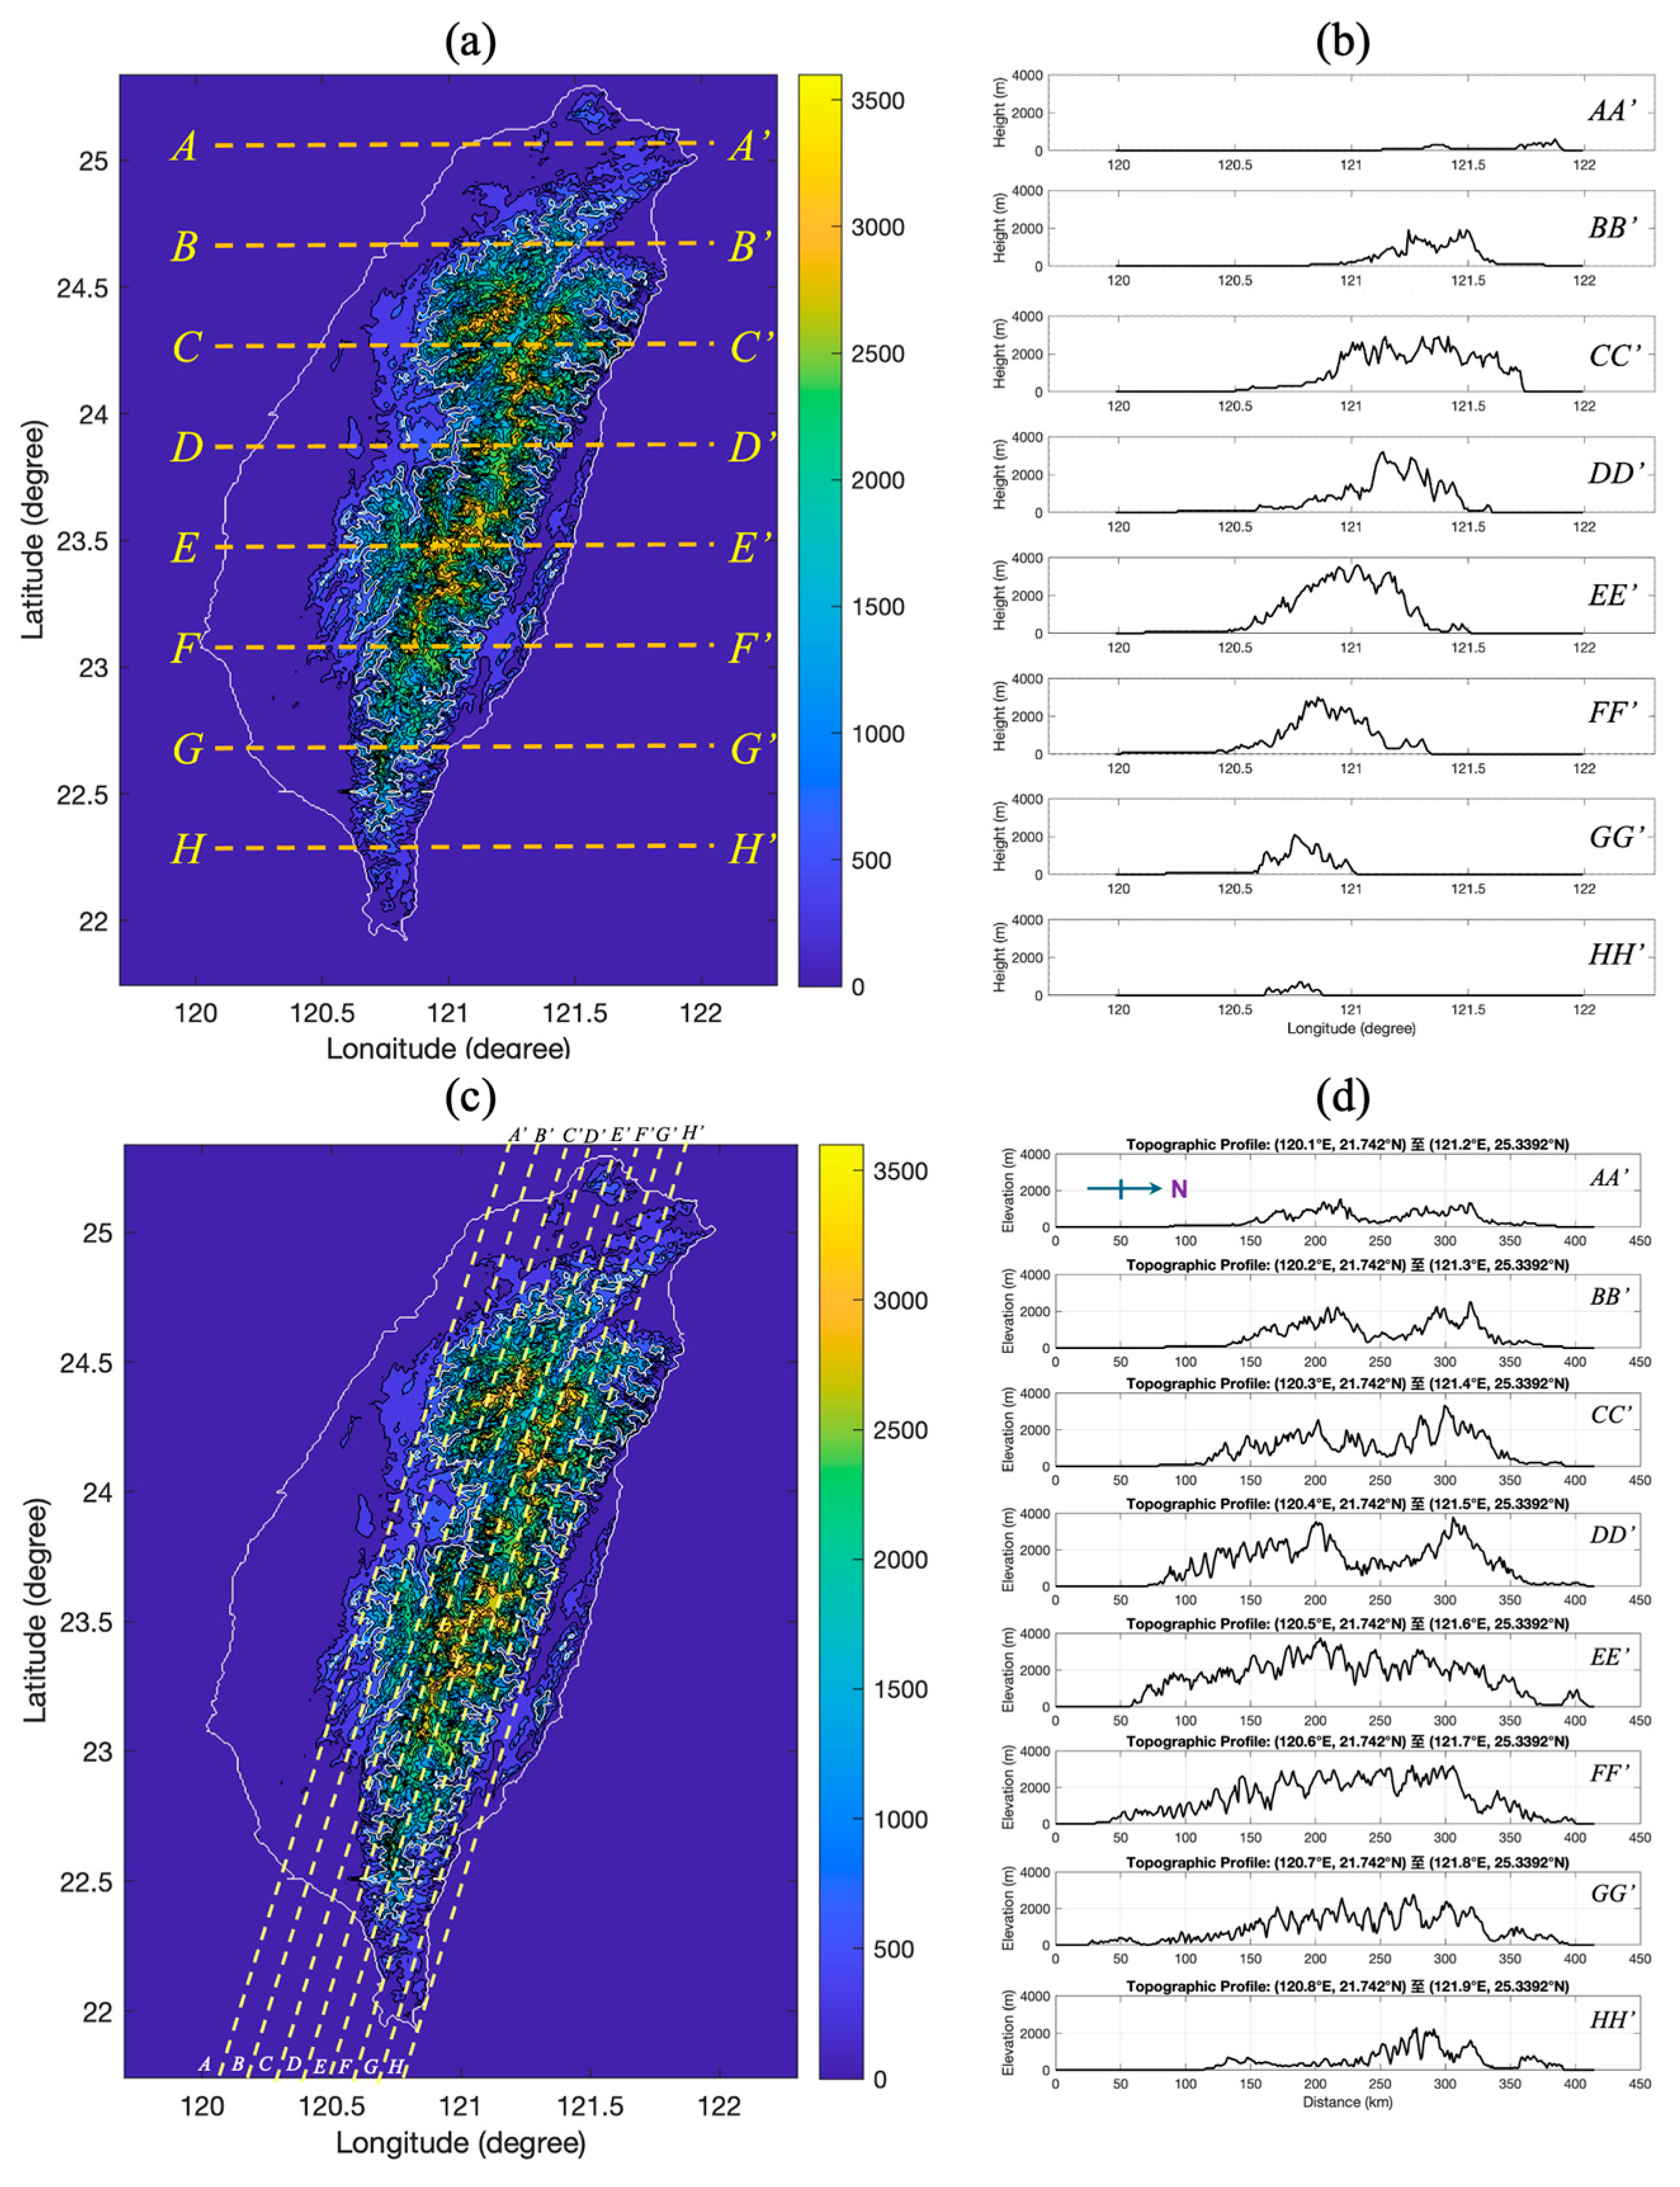
Figure 9.
Figure 9. Scanned tracks of the decaying vortex S3 interacting with the realistic topography of Taiwan at four different impinging angles: (a) 195°, (b) 170°, (c) 145°, and (d) 125°. The tracks exhibit fine-scale oscillations due to the rugged terrain and a damped lee-side recovery due to the inclusion of intensity decay.
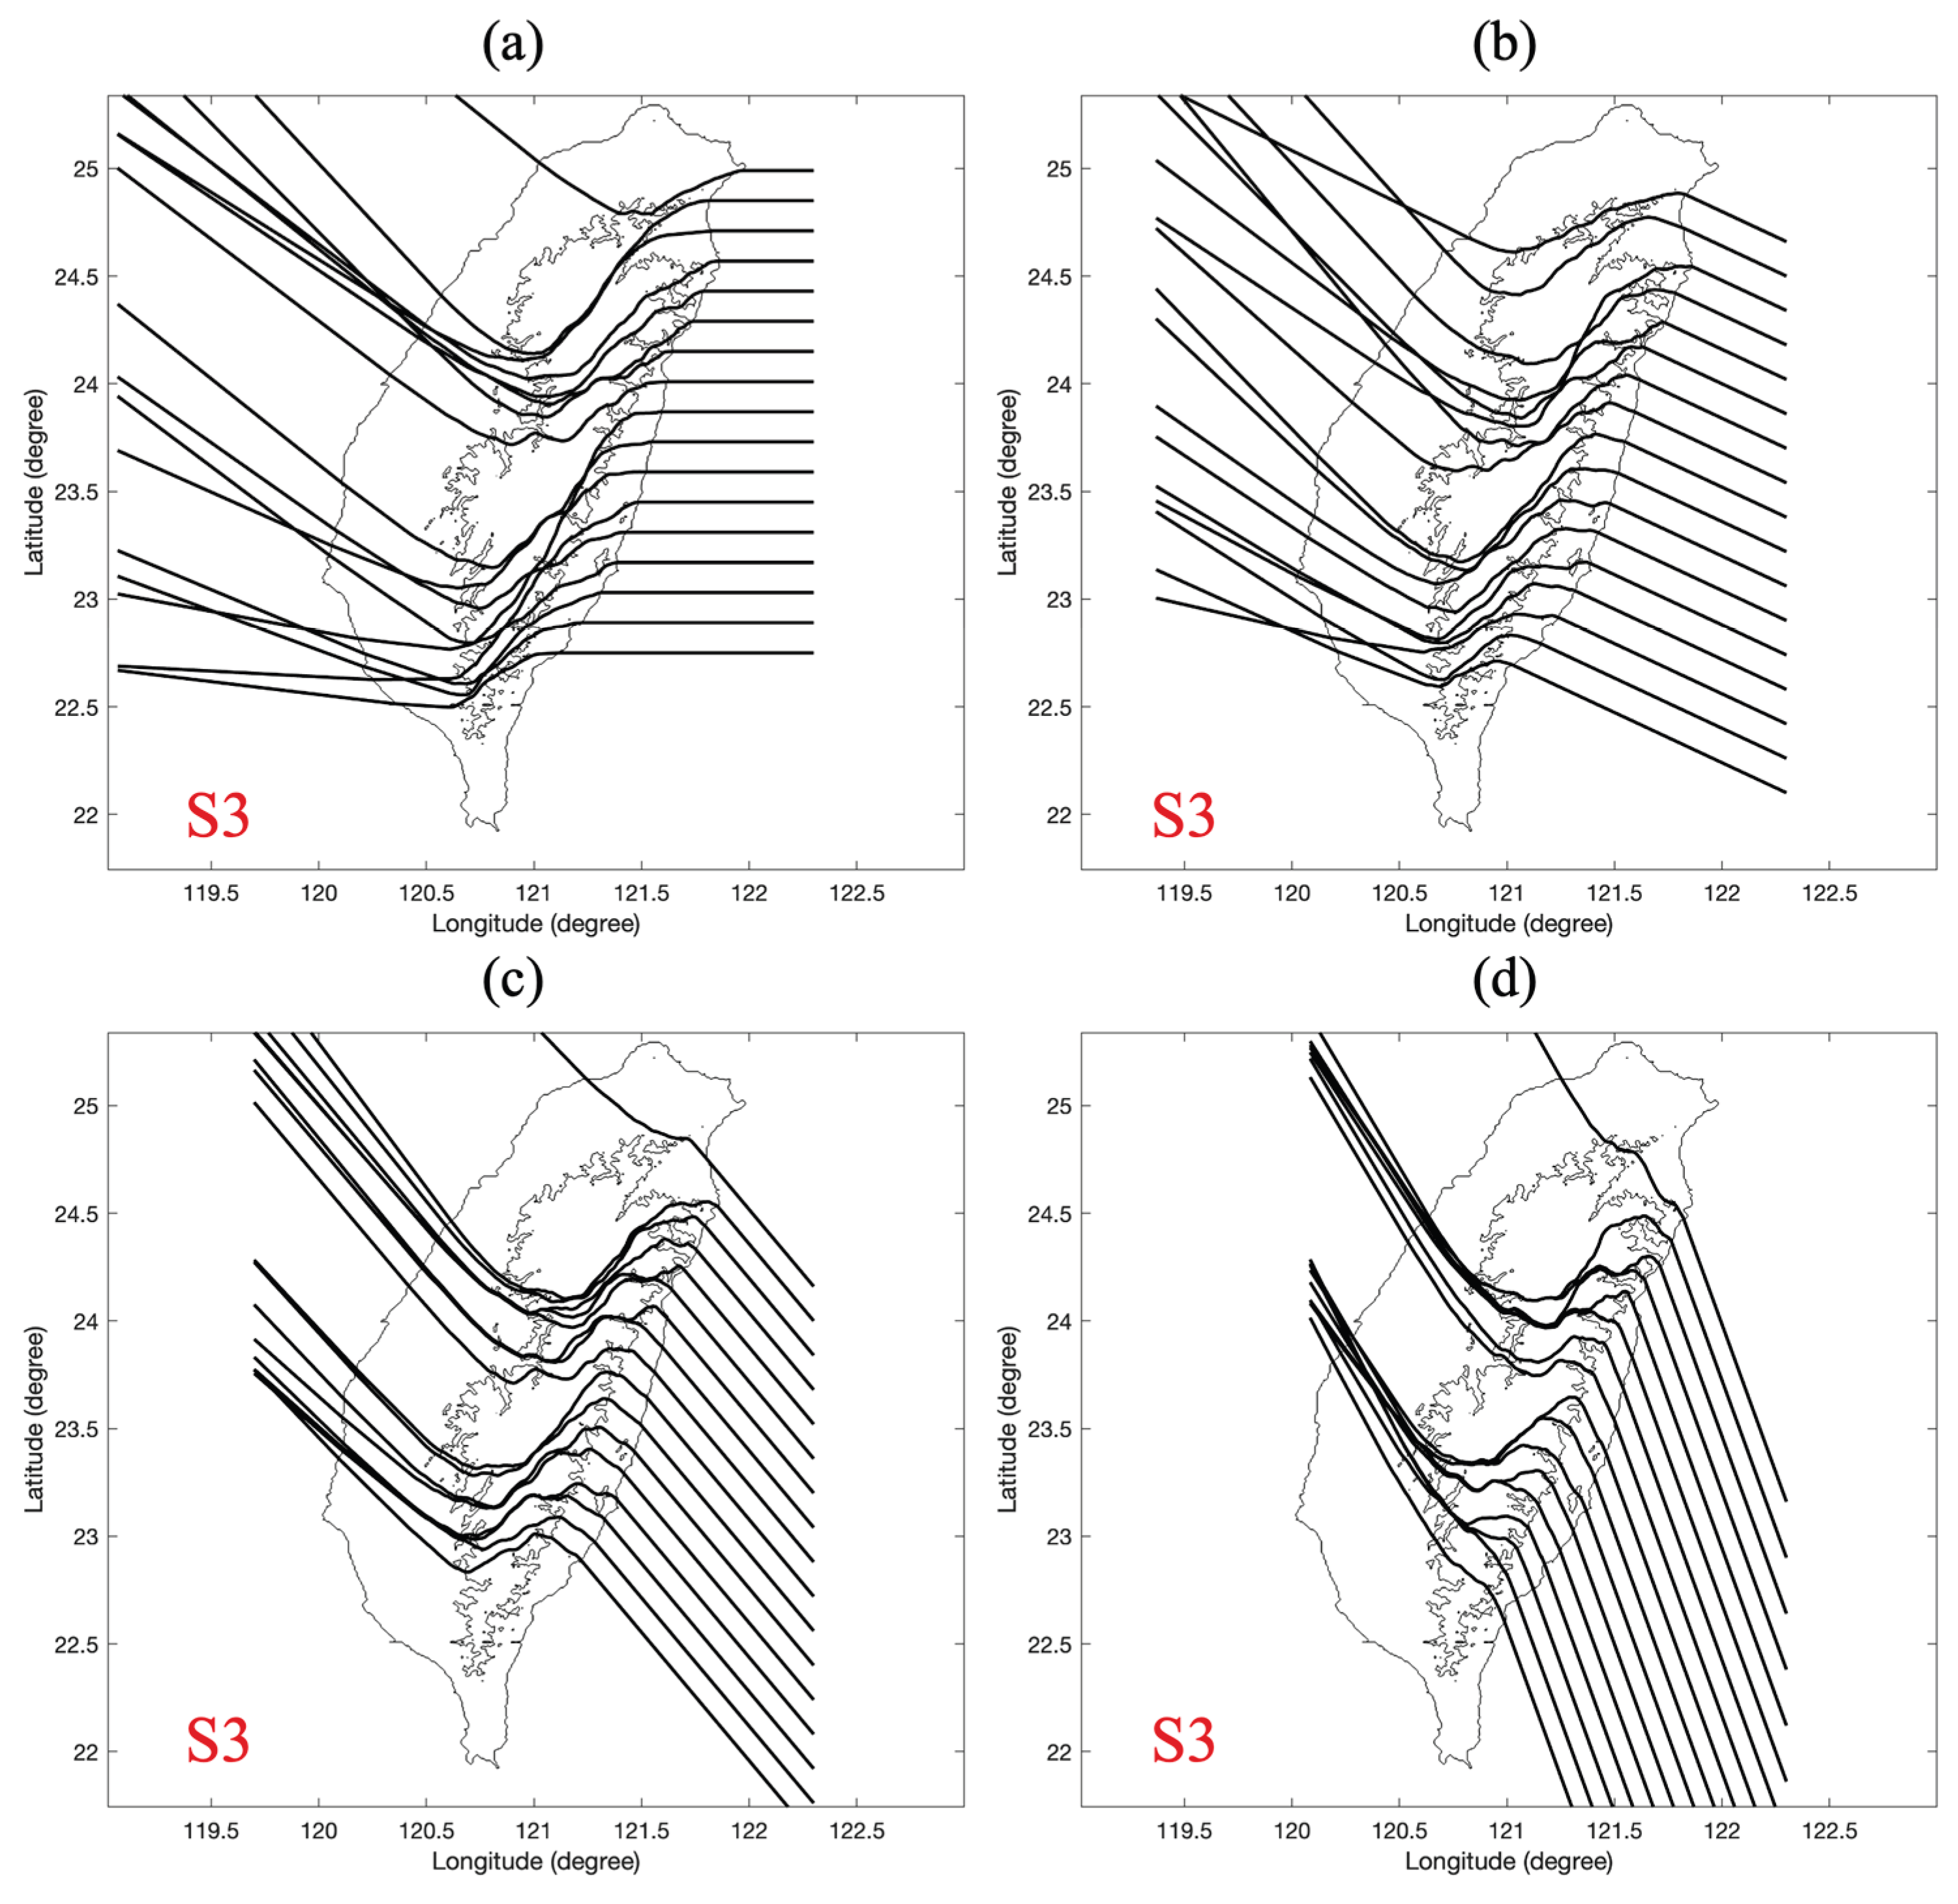

Disclaimer/Publisher’s Note: The statements, opinions and data contained in all publications are solely those of the individual author(s) and contributor(s) and not of MDPI and/or the editor(s). MDPI and/or the editor(s) disclaim responsibility for any injury to people or property resulting from any ideas, methods, instructions or products referred to in the content. |
© 2025 by the authors. Licensee MDPI, Basel, Switzerland. This article is an open access article distributed under the terms and conditions of the Creative Commons Attribution (CC BY) license (http://creativecommons.org/licenses/by/4.0/).
Copyright: This open access article is published under a Creative Commons CC BY 4.0 license, which permit the free download, distribution, and reuse, provided that the author and preprint are cited in any reuse.


