
Submitted:
26 November 2025
Posted:
27 November 2025
You are already at the latest version
Abstract
This study introduces an integrated Life Cycle Assessment–Multi-Criteria Decision Analysis–Nash Equilibrium (LCA–MCDA–NE) framework to assess the feasibility of hydrogen energy storage (HES) in Philippine island grids. It starts with a cradle-to-gate LCA of hydrogen production across various electricity mix scenarios, from die-sel-dominated Small Power Utilities Group (SPUG) systems to high-renewable config-urations, quantifying greenhouse gas emissions. These impacts are normalized and in-tegrated into an MCDA framework that considers four stakeholder perspectives: Regu-latory (PRF), Developer (DF), Scientific (SF), and Local Social (LSF). Attribute utilities for Maintainability, Energy Efficiency, Geographic–Climatic Suitability, and Regulatory Compliance inform a 2×2 strategic game where net utility gain (Δ) and switching costs (C₁, C₂) influence adoption behavior. The findings indicate that the baseline Nash Equilibrium favors non-adoption due to limited utility gains and high switching barriers. However, enhancements in Main-tainability and reduced costs can shift this equilibrium toward adoption. The LCA results show meaningful decarbonization occurs only when low-carbon generation exceeds 60% of the electricity mix. This integrated framework highlights that successful HES de-ployment in remote grids relies on stakeholder coordination, reduced risks, and access to low-carbon electricity, offering a replicable model for emerging economies.
Keywords:
hydrogen energy storage
; Nash equilibrium
; multi-criteria decision analysis
; sustainability transition
; island grids
; Philippines
1. Introduction
Island and off-grid power systems across the Philippine archipelago face persistent challenges, including reliability issues, high generation costs, and dependence on imported diesel fuel [1,2,3,4,5]. Many remote communities are supplied by Small Power Utilities Group (SPUG) facilities, which primarily rely on diesel generators. These facilities experience frequent supply disruptions, maintenance burdens, and elevated greenhouse gas (GHG) emissions [2]. This reliance on fossil fuel-based generation hinders progress toward national clean energy goals and limits the potential for integrating variable renewable energy (VRE) resources.
Hydrogen energy storage (HES) has gained international attention as a potential long-duration storage option for remote and island systems. Research worldwide indicates that hydrogen can enhance flexibility, support the integration of VRE, and reduce carbon emissions. However, its environmental performance varies significantly depending on the production pathways [6,7,8,9,10,11]. Life Cycle Assessment (LCA) studies consistently show that hydrogen's climate impact relies heavily on the carbon intensity of the electricity used for electrolysis. Systems powered by diesel or coal produce markedly higher GHG emissions than those powered by renewable energy [7,8,9,10]. These insights are vital for the Philippines, where many island grids still depend on diesel.
Evaluating energy storage options in the Philippines requires consideration of diverse stakeholder priorities. Multi-Criteria Decision Analysis (MCDA) studies highlight how technical, economic, and environmental attributes—such as maintainability, efficiency, geographic suitability, and social acceptance—affect technology preferences among policymakers, developers, technical experts, and local communities [11,12,13,14]. Research in the Philippines further shows that public acceptance of hydrogen is influenced by perceptions of safety, institutional trust, and familiarity with emerging technologies [15]. These findings underscore the importance of a multidimensional assessment framework.
In addition to stakeholder valuations, strategic interactions and coordination significantly influence technology adoption outcomes. Game-theoretic studies in energy systems reveal that even when low-carbon technologies offer clear benefits, misaligned incentives, switching risks, and coordination failures can hinder adoption [16,17,18,19,20]. These behavioral and institutional dynamics are particularly relevant in archipelagic contexts, where infrastructure decisions involve multiple actors with varying interests.
Despite advances in LCA, MCDA, and game-theoretic research, three major gaps remain in the Philippine hydrogen literature. First, the environmental implications of hydrogen production in diesel-reliant island grids have not been adequately explored. Second, no existing studies capture stakeholder heterogeneity in evaluating hydrogen energy storage. Third, the interaction between environmental performance (LCA), stakeholder-derived utilities (MCDA), and strategic coordination behavior (Nash Equilibrium) has not been previously analyzed.
To address these gaps, this study develops an integrated Life Cycle Assessment–Multi-Criteria Decision Analysis–Nash Equilibrium (LCA–MCDA–NE) framework for assessing hydrogen energy storage adoption in Philippine island grids. LCA quantifies cradle-to-gate GHG emissions under various electricity mix scenarios that reflect SPUG and transition pathways [7,8,9,10,21,22,23,24,25,26,27,28,29]. MCDA captures stakeholder valuations across four frameworks: Policy/Regulatory (PRF), Developer (DF), Scientific/Technical (SF), and Local Social (LSF), drawing from both Philippine and international studies [11,12,13,14,15,30]. Nash Equilibrium modeling evaluates how net utility gains and switching costs shape strategic adoption behavior between developers and communities [16,17,18,19,20].
By integrating environmental impacts, stakeholder priorities, and strategic behavior, this study provides a unified decision-support tool tailored to the Philippine island context. The framework identifies conditions under which hydrogen becomes environmentally advantageous, socially aligned, and strategically viable, supporting evidence-based policymaking for clean energy transitions in remote and archipelagic regions.
This article makes three key contributions to the literature on hydrogen and energy systems by introducing an integrated framework designed for islanded power systems in emerging economies that combines Life Cycle Assessment (LCA), Multi-Criteria Decision Analysis (MCDA), and Nash Equilibrium, explicitly linking environmental performance with stakeholder utilities and adoption behaviors. It quantifies the conditions under which hydrogen energy storage can be both environmentally beneficial, in terms of Global Warming Potential (GWP), and strategically stable, highlighting the significance of upstream decarbonization and improvements in maintainability. Furthermore, the article presents a decision-support tool for regulators, developers, and communities to evaluate hydrogen deployment in remote grids, which is also applicable to other archipelagic and off-grid regions.
2. Materials and Methods
2.1. Overall Theoretical and Analytical Framework
This study utilizes an integrated framework combining Life Cycle Assessment (LCA), Multi-Criteria Decision Analysis (MCDA), and Nash Equilibrium (NE) to assess the adoption of hydrogen energy storage (HES) in island grids of the Philippines [1,2,3,4,5]. The framework integrates environmental assessment, stakeholder preference modeling, and strategic interaction analysis to capture the various factors influencing technology adoption.
The analytical structure comprises three interconnected components. First, LCA quantifies the cradle-to-gate greenhouse gas (GHG) emissions associated with hydrogen production under different electricity-mix scenarios that reflect diesel-dominated Special Purpose Utilities Group (SPUG) grids and possible clean-energy transitions [7,8,9,10,21,22,23,24,25,26,27,28,29]. Second, MCDA evaluates technology features using the specific weights and performance scores assigned by stakeholders, drawing on both Philippine and international studies [11,12,13,14,15,30]. Third, Nash Equilibrium (NE) modeling examines the strategic behavior of two key decision-makers: developer/financial stakeholders (Player 1) and scientific/local social stakeholders (Player 2), focusing on their utilities and switching costs [16,17,18,19,20].
The integration of these components is sequential: LCA results contribute to the environmental performance scores used in MCDA, the MCDA utilities generate Δ values for the NE payoff matrix, and the NE analysis determines whether hydrogen adoption can achieve a stable outcome.
2.2. Life Cycle Assessment (LCA)
The life cycle assessment (LCA) quantifies the climate impacts of hydrogen production for grid-scale storage, following the ISO 14040/14044 framework [21,22]. The functional unit is defined as 1 kg of hydrogen produced, in line with international standards for hydrogen LCA studies [7,8,9,10,25,26,27,28,29]. This systematic approach allows for a comprehensive evaluation of the environmental implications of hydrogen generation processes.
The system encompasses five primary stages: electricity supply, water treatment, electrolysis, compression, and storage. Among these, electricity supply emerges as the dominant contributor to greenhouse gas (GHG) emissions in hydrogen production, a finding supported by previous LCA studies [7,8,9,10]. The assessment considers various electrolysis technologies, including alkaline, polymer electrolyte membrane (PEM), and anion exchange membrane (AEM) pathways, which have been extensively documented in the literature regarding their life-cycle profiles [25,26,27,28,29].
To evaluate GHG emissions from hydrogen production, different electricity mix scenarios are considered, ranging from present SPUG conditions, which predominantly rely on diesel generation [1,2,3,4,5], to transitional scenarios that incorporate renewable sources such as solar and wind, and finally to low-carbon configurations aligned with long-term decarbonization strategies [23,24]. Emission factors for electricity generation, electrolysis, and compression are derived from established hydrogen LCA studies to aggregate GHG emissions across the various stages [7,8,9,10,25,26,27,28,29]. These emissions contribute to the computation of global warming potential (GWP), serving as a crucial environmental performance input for multi-criteria decision analysis (MCDA).
2.3. Multi-Criteria Decision Analysis (MCDA)
In the context of MCDA (Multi-Criteria Decision Analysis), four stakeholder frames are prominently utilized in both Philippine and international energy planning research: Policy/Regulatory Frame (PRF), Developer/Financial Frame (DF), Scientific/Technical Frame (SF), and Local Social Frame (LSF) [11,12,13,14,15,30]. These frames are essential for understanding the diverse perspectives that influence energy decisions. To guide the analysis, three core attributes—Maintainability, Energy Efficiency, and Geographic–Climatic Suitability—have been selected, drawing on insights from previous studies focused on energy storage technologies [11,12,13,14]. Normalized performance scores are then computed using min-max scaling, enabling the evaluation of utilities and better decision-making in energy planning.
The utilities of technology j are computed using:
where: Wi = MCDA weight for attribute i
pi,j = normalized performance score of technology j
Net utility gain (Δ) is:

Table 1.
Summary of weights assigned by stakeholders for three core attributes: Maintainability, Energy Efficiency, and Geographic–Climatic Suitability, as derived from the MCDA results [20].
Table 1.
Summary of weights assigned by stakeholders for three core attributes: Maintainability, Energy Efficiency, and Geographic–Climatic Suitability, as derived from the MCDA results [20].
| Attribute | LSF | SF | DF | PRF |
| Geographic-Climatic Suitability | 0.041 | 0.029 | 0.007 | 0.008 |
| Energy Efficiency | 0.048 | 0.027 | 0.010 | 0.007 |
| Maintainability | 0.055 | 0.024 | 0.007 | 0.007 |
A positive Δ indicates that stakeholders prefer hydrogen. At the same time, a negative Δ signifies that the incumbent remains more attractive. MCDA outputs feed directly into the NE payoff matrix.
The weights presented in Table 2 were obtained from earlier MCDA research on grid-scale storage technologies in the Philippines [20,27]. In that study, preferences were gathered from four stakeholder groups—PRF, DF, SF, and LSF—using structured questionnaires and subsequently normalized through min-max scaling. This paper uses published weights as inputs to the integrated LCA–MCDA–NE framework.
2.4. Nash Equilibrium (NE) Game-Theoretic Modelling
In this analysis, we model two primary players: Player 1, representing developers and regulatory stakeholders, and Player 2, encompassing scientific and local social entities. Each player faces a strategic decision: switch to hybrid energy systems (HES) or maintain their current approach. This framework applies established game-theoretic principles commonly used in sustainable energy research, enabling a systematic exploration of the interactions and decisions involved in transitioning to HES [16,17,18,19,20].
The payoff structure incorporates several crucial factors: baseline utility (α), the change in utility (Δ), switching costs for each player (C₁, C₂), and a miscoordination penalty (P) [16,17,18,19,20]. In the baseline diesel-dominated scenario, we set the switching costs to C₁ = 0.05 and C₂ = 0.03, and the miscoordination penalty to P = 0.05. These values reflect the associated costs and penalties relevant to our analysis. Expected utilities for mixed strategies are derived from well-established Nash Equilibrium (NE) formulations (see formula 3) that balance potential payoffs based on each player's decisions. By equating expected utilities across strategies, we can ascertain equilibrium adoption probabilities. In this mixed-strategy framework, ( p ) represents the probability that Player 1 (the Developer or Financial and Regulatory stakeholder) chooses to adopt hydrogen (labeled as S), while ( 1 - p ) represents the probability of maintaining the status quo (labeled as NS). Similarly, ( q ) denotes the probability that Player 2 (the Scientific or Technical, and Local Social stakeholders) chooses to adopt hydrogen (S), with ( 1 - q ) representing the probability of non-adoption (NS). These probabilities are utilized to calculate expected utilities based on the weighted payoff outcomes indicated in the payoff matrix. Ultimately, the integration of Life Cycle Assessment (LCA) with Multi-Criteria Decision Analysis (MCDA) informs the calculation of Δ, while the NE framework elucidates the stability of adoption behaviors, providing a comprehensive behavioral and environmental assessment of HES suitability for island microgrids.
The expected utility for the Developer when using mixed strategies is expressed as follows:
UDev(p, q) = pqUS,S + p(1-q)US,NS + (1-p)qUNS,S + (1-p)(1-q)UNS,NS
3. Results
3.1. Life Cycle Assessment (LCA) Results
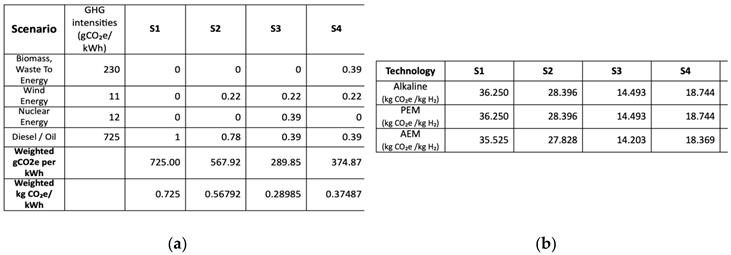
Life Cycle Assessment (LCA) results show significant differences in the greenhouse gas (GHG) intensity of hydrogen production across various electricity mix scenarios that reflect the conditions of Philippine island grids [7,8,9,10,21,22,23,24,25,26,27,28,29]. These five electricity mix scenarios (S1–S5), summarized in Table 2, range from a diesel-only SPUG baseline to low-carbon mixes incorporating wind, biomass/waste-to-energy, and nuclear imports. Under the diesel-dominated Small Power Utilities Group (SPUG) baseline, hydrogen production has the highest global warming potential (GWP), primarily due to the carbon intensity of the electricity used for electrolysis. Transitioning to scenarios that include a higher proportion of wind energy reduces GWP accordingly. Low-carbon scenarios, which are characterized by energy mixes dominated by renewable sources or including nuclear imports, achieve the lowest GWP values. This demonstrates that hydrogen provides substantial climate benefits only when the upstream electricity supply is significantly decarbonized. These findings align with international LCA studies, highlighting that the electricity mix is the key factor influencing hydrogen's environmental performance.
3.2. MCDA Attribute Performance and Stakeholder Utilities
The MCDA results reveal differing valuations among stakeholders for Maintainability, Energy Efficiency, and Geographic–Climatic Suitability [11,12,13,14,15]. Maintainability consistently receives high importance from Policy/Regulatory (PRF) and Developer/Financial (DF) stakeholders, who are concerned about technical reliability and operational risks in remote locations. In contrast, Scientific/Technical (SF) stakeholders prioritize Energy Efficiency, while Local Social (LSF) stakeholders place greater emphasis on Geographic–Climatic Suitability, given the diverse terrain and climatic conditions of island communities.
Hydrogen performs moderately well in terms of Geographic–Climatic Suitability, but it scores lower in Maintainability and Efficiency due to current technological limitations and supply-chain challenges. As a result, the utility values indicate only small or slightly negative net utility gains (Δ) for hydrogen under baseline conditions, which helps explain stakeholders' hesitancy.
3.3. Nash Equilibrium (NE) Payoff Matrix and Baseline Equilibrium
The baseline payoff matrix indicates that both players achieve higher expected utilities when they coordinate on non-adoption (NS, NS) rather than adopting hydrogen. This is primarily due to modest Δ values and significant switching costs (C₁ and C₂) [16,17,18,19,20]. Although the (S, S) option offers some positive utility, it is insufficient to overcome the switching barriers in the diesel-based life-cycle assessment (LCA) scenario. As a result, the Nash Equilibrium under baseline conditions favors non-adoption.
On the other hand, miscoordination outcomes (S, NS, or NS, S) yield the lowest payoffs, as they incur penalties for project delays, community resistance, and developer risk exposure. This situation underscores the importance of coordinated decisions—where both parties either adopt or do not adopt—consistent with the concepts found in coordination games within the energy literature [16,17,18,19,20].
Figure 1.
(a) The Nash Equilibrium Payoff Matrix illustrates the strategic choices of Player 1 (PRF + DF) and Player 2 (LSF + SF) between Hydrogen (S) and Status Quo (NS). Payoffs are influenced by switching costs (C1 = 0.05, C2 = 0.03) and a miscoordination penalty (P = 0.05). Optimal coordination (S, S) yields the highest payoffs: 0.3318 for Player 1 and 0.3238 for Player 2. Miscoordination results in lower payoffs: (S, NS) at 0.1364 and 0.2818; (NS, S) at 0.3038 and 0.2154; and (NS, NS) at 0.1864 and 0.2654. The matrix highlights the importance of coordinated strategies in maximizing outcomes in Hydrogen Energy Storage deployment. (b) The Nash Equilibrium Payoff Matrix for Player 1 (PRF + DF) and Player 2 (LSF + SF) illustrates the strategic choices between Hydrogen (S) and Non-Switch or Status Quo (NS), with payoffs affected by Global Warming Potential (GWP).
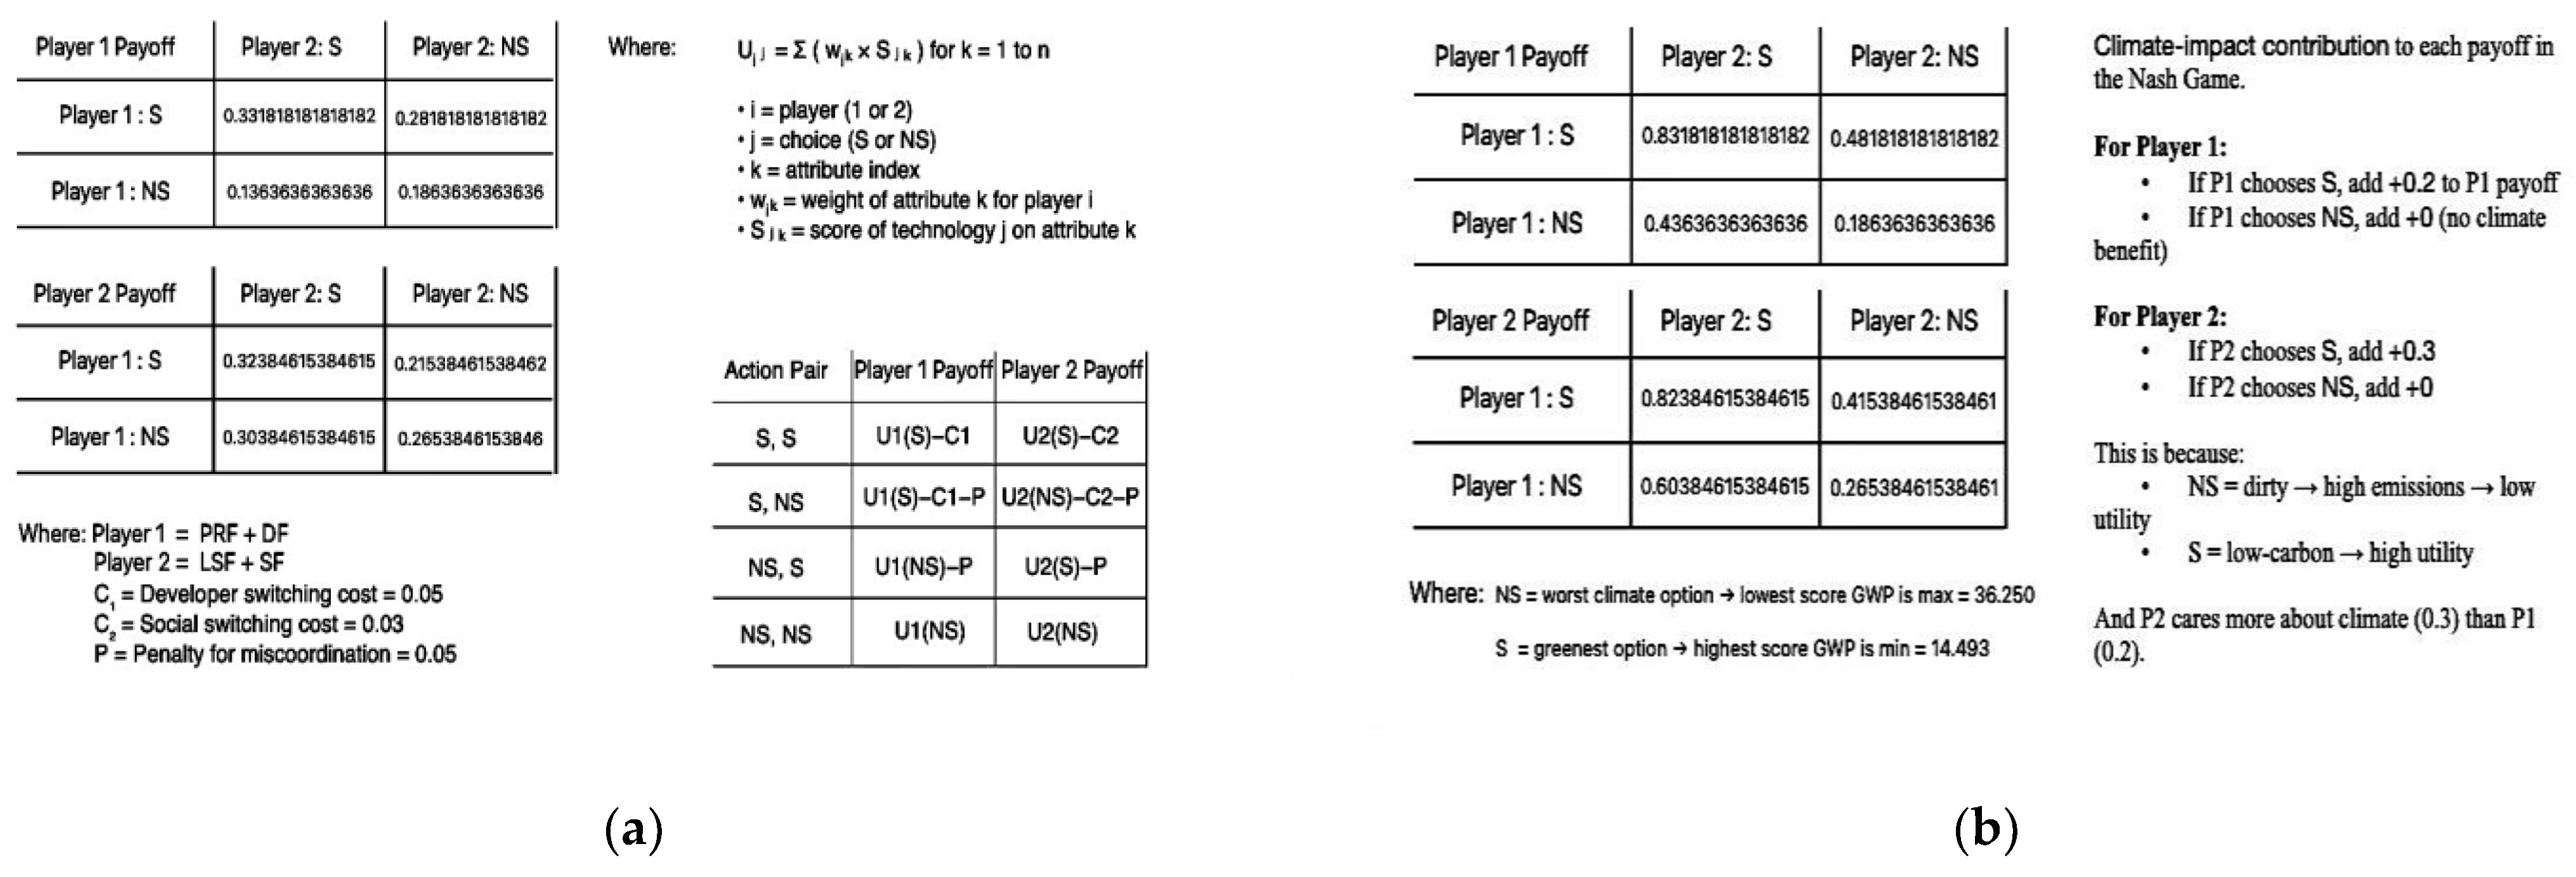
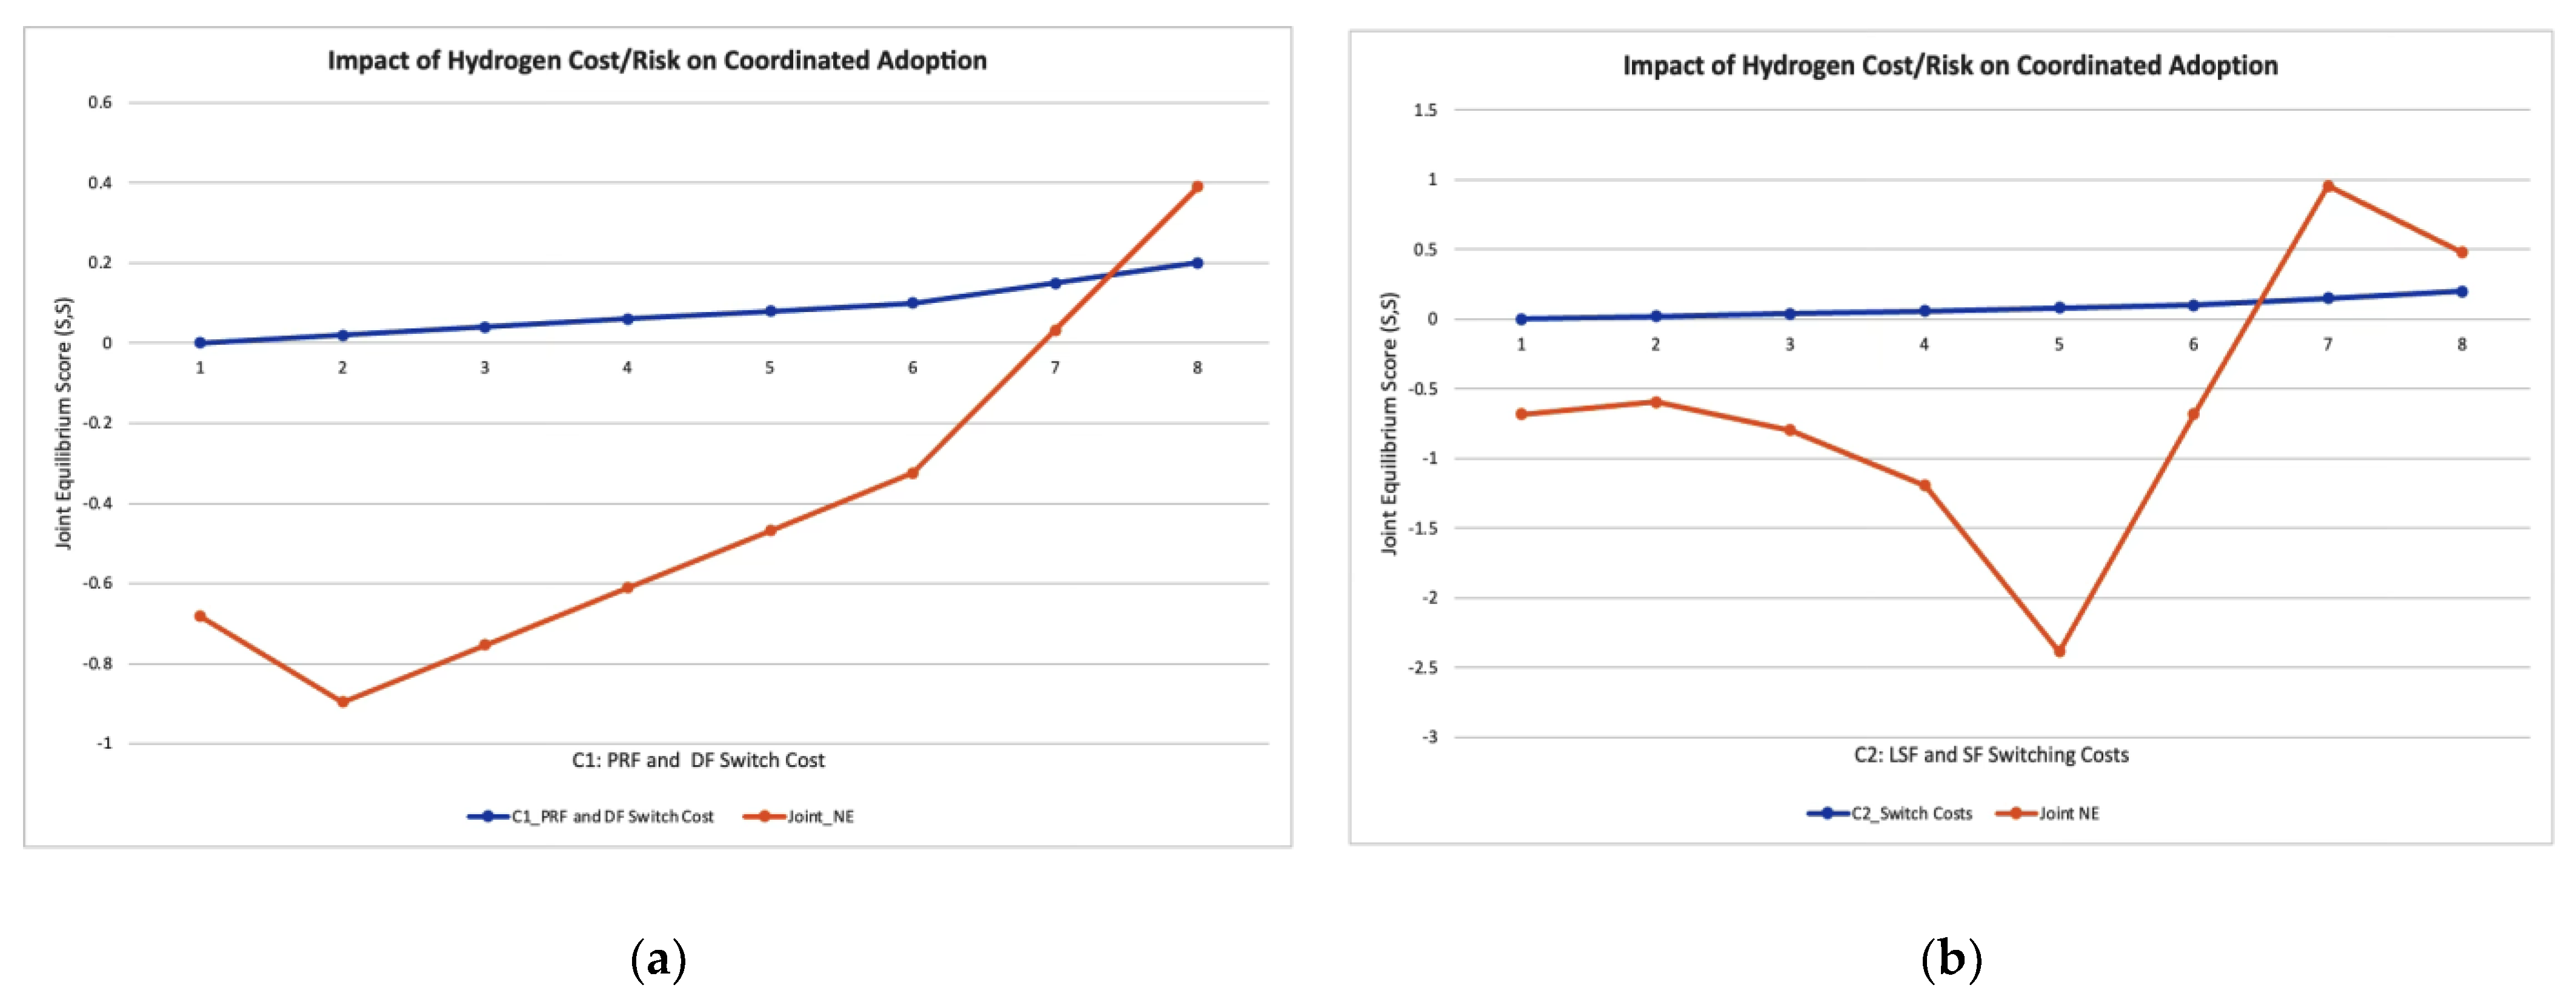
Figure 2.
(a) Shows that when switching costs and perceived risks for hydrogen are high, the equilibrium outcome tends toward non-adoption. However, as policy support and learning in technology reduce these costs, the Nash Equilibrium shifts toward coordinated adoption of hydrogen, consistent with the preferences revealed by the MCDA results [20]. (b) The impact of social-scientific switching costs (C₂) on hydrogen adoption under the Nash Equilibrium framework reveals that at low switching costs (C₂ < 0.08), social resistance leads to a dominant non-adoption equilibrium. A transition occurs around C₂ ≈ 0.10, where social hesitation lessens, allowing for coordination. Stable positive adoption is observed at higher acceptance levels (C₂ ≈ 0.15–0.20), indicating that hydrogen technologies become viable when social trust and acceptance meet required thresholds alongside technical and economic readiness.
3.4. Attribute Sensitivity and Convergence Behavior
Sensitivity analysis indicates that increases in the Maintainability score significantly increase the change (Δ) across different stakeholder perspectives, thereby shifting incentives toward adopting hydrogen. Adoption of hydrogen becomes feasible once the Maintainability score exceeds a critical threshold. This highlights the significance of operational familiarity, component reliability, and maintenance support capacity, especially in island environments.
On the other hand, Energy Efficiency has a more gradual effect on equilibrium outcomes. While improvements in energy efficiency do increase Δ, they require larger gains to significantly influence the equilibrium. Geographic and Climatic Suitability strongly impacts LSF stakeholders but has a lesser effect on PRF and DF groups, suggesting that these groups value local environmental and terrain factors differently.
Overall, these findings demonstrate that enhancing maintainability and efficiency—whether through technological advancements, capacity building, or supply chain improvements—can substantially change the incentives for adopting hydrogen.
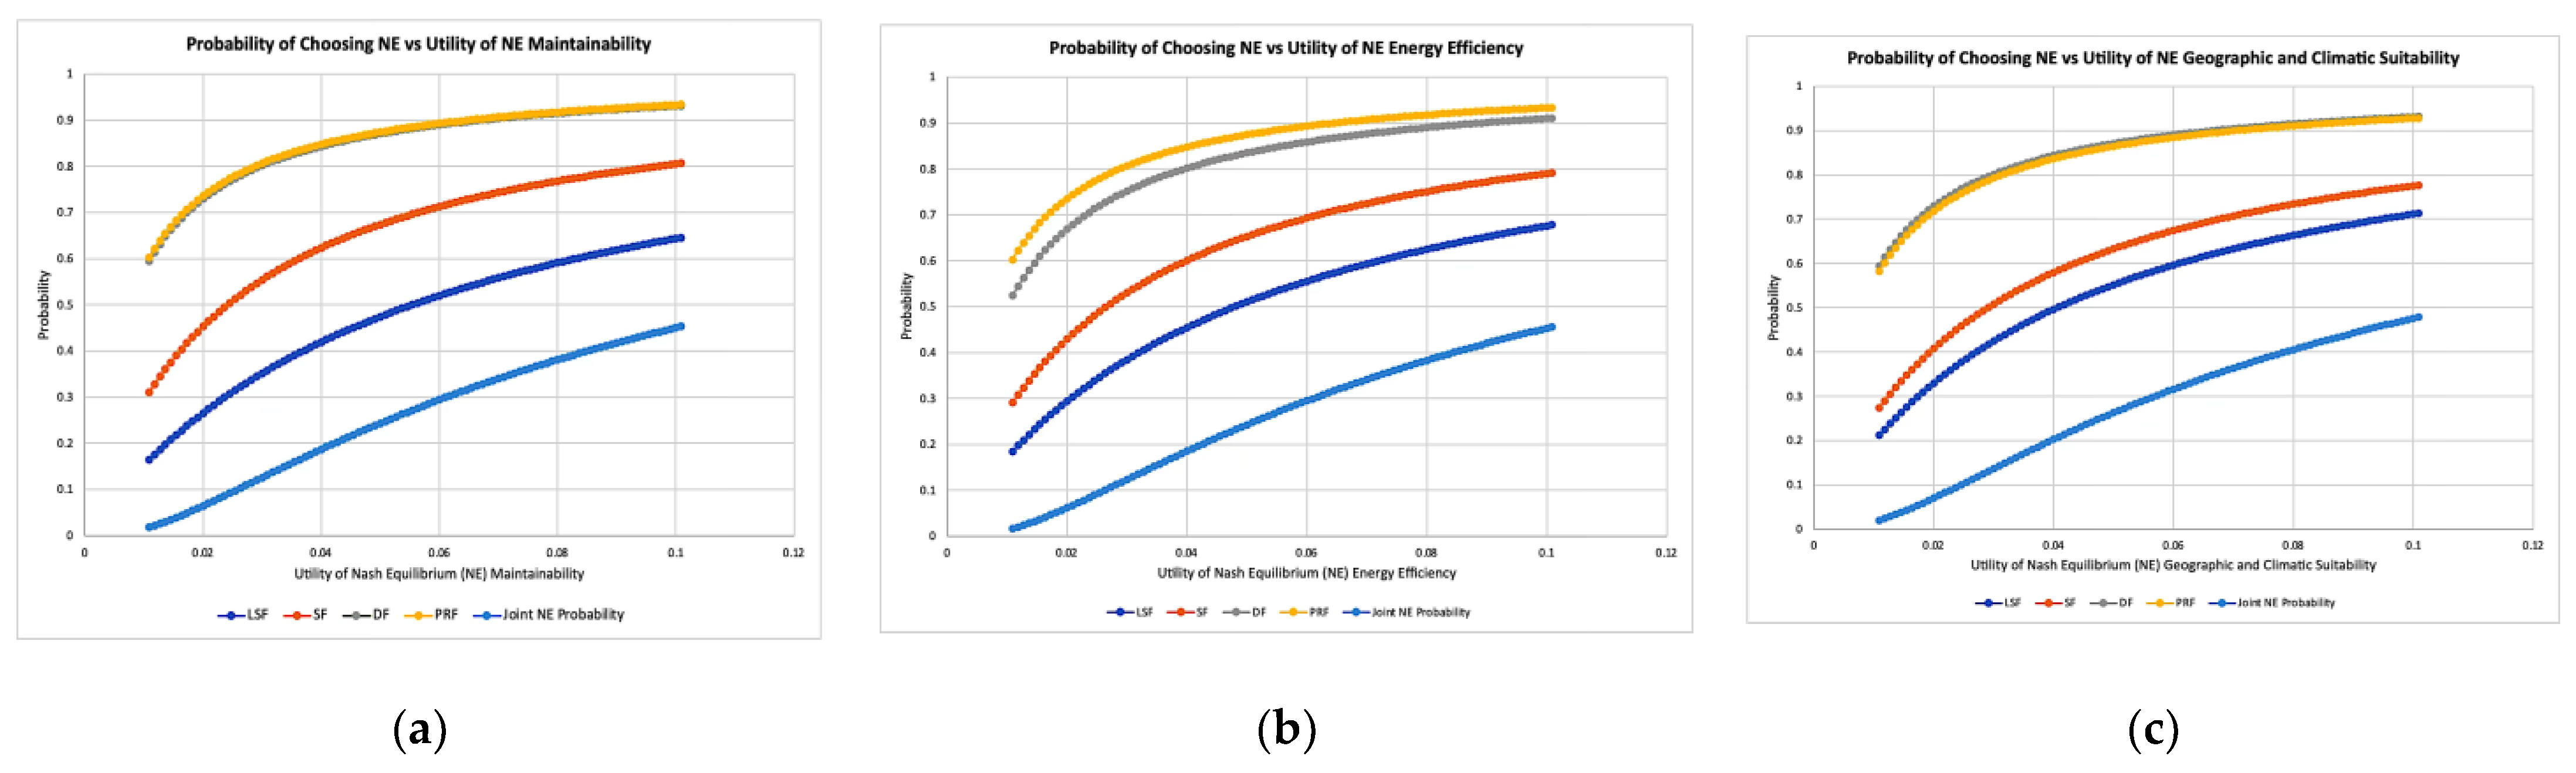
Figure 3.
(a) This figure describes the increasing maintainability utility at the Nash Equilibrium, which drives stakeholder alignment, with the PRF showing over 90% support at a utility of 0.12. At the same time, the LSF indicates cautious, gradual responses. (b) This figure shows that as utility from Energy Efficiency increases, PRF and DF stakeholders rapidly align with Nash Equilibrium strategies, surpassing 90% support before reaching UNE = 0.10. (c) This figure shows PRF's strong alignment with policy incentives for site suitability, achieving over 90% agreement at a utility of 0.10, while LSF responds more cautiously to local concerns.
3.5. Integrated LCA-MCDA-NE Scenario Results
Integrating Life Cycle Assessment (LCA), Multi-Criteria Decision Analysis (MCDA), and NE results indicates that adopting hydrogen becomes favorable only in scenarios with cleaner electricity sources. In transition scenarios, the change (Δ) increases as the Global Warming Potential (GWP) decreases, thereby reducing the environmental penalties in the MCDA evaluation. Under low-carbon scenarios, the (S,S) payoff increases sufficiently, allowing hydrogen adoption to reach a stable equilibrium.
In contrast, when hydrogen is produced using electricity from fossil-heavy sources, negative or marginal Δ values reinforce the non-adoption equilibrium. These findings are consistent with LCA literature, which highlights that the climate benefits of hydrogen are not inherent; they depend on upstream energy sources [7,8,9,10]. Additionally, these results align with game-theoretic insights, suggesting that strategic adoption relies on both technology performance and stakeholder coordination [16,17,18,19,20].
3.6. International Contextualization
The findings are consistent with previous research on remote and island energy systems worldwide. Studies focused on island microgrids and off-grid communities highlight the importance of customized technology assessment frameworks that incorporate environmental, technical, and social factors [1,2,3,4,5,6,11,12,13,14,15,30]. Life Cycle Assessment (LCA) studies consistently demonstrate that the electricity mix significantly impacts the environmental performance of hydrogen [7,8,9,10,21,22,23,24,25,26,27,28,29]. Additionally, game-theoretic analyses indicate that the adoption of hydrogen energy storage not only depends on technical and environmental advantages but also on the alignment of incentives and the reduction of switching risks [16,17,18,19,20].
Overall, these integrated results suggest that hydrogen energy storage can become a viable option for island grids in the Philippines, provided that environmental impacts are minimized, technology performance is enhanced, and stakeholder collaboration is achieved.
4. Discussion
4.1. Interpretation of LCA Findings in the Philippine Island-Grid Context
The LCA (Life Cycle Assessment) results indicate that hydrogen's environmental performance is highly dependent on the carbon intensity of the electricity used for electrolysis [7,8,9,10,21,22,23,24,25,26,27,28,29]. In diesel-dependent off-grid (SPUG) systems [1,2,3,4,5], hydrogen production is associated with high global warming potential (GWP) values because electricity contributes the majority of upstream emissions. This finding reinforces the idea that hydrogen produced with fossil-based electricity is not inherently a low-carbon solution. Instead, it can shift emissions upstream while providing limited benefits for decarbonization.
In the Philippines, where many island systems heavily rely on diesel, this emphasizes the urgent need to expand renewable energy sources before hydrogen can emerge as an effective climate mitigation strategy. Transition scenarios reveal that GWP decreases incrementally as the share of solar and wind energy increases, indicating that hydrogen becomes progressively cleaner as power grids decarbonize. Low-carbon scenarios yield the most favorable environmental outcomes, underscoring the strategic link between hydrogen deployment and renewable energy development. These findings are consistent with international LCA studies that identify the electricity mix as the primary factor influencing hydrogen’s climate performance [7,8,9,10].
4.2. Stakeholder Dynamics and Technology Preferences
The results of the Multi-Criteria Decision Analysis (MCDA) show that different stakeholders place varying levels of importance on technology attributes [11,12,13,14,15]. Among policy-makers and developers, maintainability emerges as the primary concern. This is largely due to operational risks, limited technical support, and logistical challenges in remote settings. Lower maintainability scores partly explain the negative or minimal change values associated with hydrogen technologies, which, in turn, reduce the incentives for adoption.
LSF stakeholders place greater value on Geographic-Climatic Suitability, reflecting their sensitivity to environmental conditions and the diverse terrain across the Philippine islands. In contrast, Scientific/Technical Framework (SF) stakeholders focus more on Energy Efficiency, which aligns with their concerns regarding system performance and energy losses. These differing priorities underscore the need for tailored engagement strategies that address the specific concerns of each stakeholder group.
4.3. Strategic Coordination and the Persistence of Non-Adoption
Modeling confirms that, even when hydrogen offers some technical or environmental advantages, high switching costs (C₁ and C₂) and coordination challenges can result in a stable outcome in which adoption does not occur [16,17,18,19,20]. In the baseline diesel scenario, the (NS,NS) outcome prevails because the Δ values are not high enough to overcome these switching barriers. Situations of miscoordination lead to the lowest payoffs, highlighting the importance of aligned decisions and coordinated actions.
These results underscore that adoption decisions are not driven solely by technology. Behavioral, institutional, and risk-related factors can overshadow technical benefits, especially in contexts with limited experience, infrastructure gaps, and safety concerns. Therefore, even positive techno-economic evaluations may not lead to adoption without stakeholder alignment.
4.4. Pathways to a Positive Adoption Equilibrium
Sensitivity analysis indicates that improvements in maintainability and energy efficiency can shift incentives toward adopting hydrogen. These improvements may result from technological advancements, capacity-building initiatives, supply chain development, or enhanced maintenance support. Additionally, reducing switching costs through financial incentives, regulatory support, or community engagement can increase the value of adopting hydrogen and change equilibrium outcomes.
In scenarios with low-carbon electricity, the value of adopting hydrogen becomes sufficiently positive, leading to a stable equilibrium. This suggests that deploying renewable energy and adopting hydrogen are mutually reinforcing strategies. As islands decarbonize their electricity supply, hydrogen becomes increasingly attractive from both an environmental and strategic perspective.
4.5. Implications for Policy and Planning
These findings emphasize several priority areas for policymakers and planners. First, the deployment of hydrogen should be aligned with the expansion of renewable energy to ensure genuine climate benefits. Second, implementing capacity-building programs and maintenance support structures can help alleviate stakeholder concerns about operational risks. Third, targeted policies, such as incentives, guarantees, or risk-sharing mechanisms, can lower switching costs and promote coordinated adoption.
Finally, incorporating environmental assessments, stakeholder valuations, and strategic considerations into decision-making frameworks can provide a more realistic and comprehensive foundation for evaluating emerging technologies such as hydrogen. This integrated approach helps identify the conditions under which hydrogen becomes viable, supporting evidence-based planning for clean energy transitions in remote and archipelagic regions.
5. Conclusion
This study developed an integrated Life Cycle Assessment–Multi-Criteria Decision Analysis–Nash Equilibrium (LCA–MCDA–NE) framework to evaluate the feasibility of deploying hydrogen energy storage (HES) in the island grids of the Philippines. The findings demonstrate that hydrogen's environmental performance, stakeholder acceptability, and strategic viability are highly dependent on upstream electricity sources, the perceived performance of the technology, and coordinated stakeholder action.
The LCA results indicate that hydrogen produced under diesel-dominated conditions in the Small Power Utilities Group (SPUG) has high Global Warming Potential (GWP), limiting its climate benefits. Significant decarbonization only occurs when hydrogen production is powered by low-carbon electricity sources, such as grids that are largely renewable or supported by nuclear energy. These results align with international LCA literature, highlighting that the electricity mix is the primary determinant of hydrogen's climate impact [7,8,9,10,21,22,23,24,25,26,27,28,29].
The MCDA findings reveal varying stakeholder priorities concerning Maintainability, Energy Efficiency, and Geographic–Climatic Suitability [11,12,13,14,15]. The baseline performance scores show marginal or negative net utility gains for hydrogen, which explains stakeholder hesitance given the current technological and institutional conditions. Furthermore, the Nash Equilibrium modeling indicates that switching costs and coordination challenges lead to a stable non-adoption equilibrium in the baseline scenarios [16,17,18,19,20]. Even when moderate technical benefits exist, adoption remains unlikely without aligned incentives and reduced risks.
The integrated results indicate that hydrogen becomes a viable and stable option only under cleaner electricity scenarios, combined with improved maintainability, enhanced efficiency, and reduced switching barriers. These findings emphasize the interdependence of energy transition strategies: expanding renewable energy strengthens hydrogen's environmental and strategic value, while training, capacity building, and policy support enhance stakeholder alignment.
Overall, the study concludes that hydrogen energy storage is not inherently the optimal solution for Philippine island grids, but it can become viable under specific environmental, technical, and social conditions. The LCA–MCDA–NE framework provides a comprehensive decision-support tool that captures these multidimensional dynamics and can guide policymakers, developers, and communities in evaluating emerging energy technologies. Future research could incorporate techno-economic cost modeling, dynamic adoption pathways, and real-world demonstration data to enhance further decision-making for clean energy transitions in remote and archipelagic regions.
Author Contributions
Conceptualization, A.G.P.; Methodology, A.G.P.; Formal analysis, A.G.P.; Investigation, A.G.P.; Data curation, C.L.V.C.; Writing—original draft, A.G.P.; Writing—review & editing, C.L.V.C., K.J.R.Y. and R.L.d.L.; Visualization, A.G.P., K.J.R.Y. and R.L.d.L.; Supervision, K.J.R.Y. and R.L.d.L.; Project administration, R.L.d.L. All authors have read and agreed to the published version of the manuscript.
Funding
This research was funded by the UP System Enhanced Creative Work and Research Grant (ECWRG 2022-1-4R) and by the Department of Science and Technology-Engineering Research and Development for Technology (DOST-ERDT).
Data Availability Statement
The data for the LCA, MCDA, and Nash Equilibrium models used in this study can be obtained from the corresponding author upon reasonable request.
Acknowledgments
The author expresses heartfelt gratitude to the University of the Philippines Diliman for fostering an academic environment that nurtured critical inquiry and intellectual growth throughout this research. Sincere thanks are extended to colleagues and mentors for their guidance, insightful discussions, and technical expertise, which refined the clarity and direction of this work. Appreciation is also given to individuals and institutions whose published studies and prior research laid the groundwork for the Life Cycle Assessment, Multi-Criteria Decision Analysis, and Nash Equilibrium modeling approaches explored here, contributing to the broader field of clean energy research. Special thanks to Carmencita Garcia Palanca and Alfredo C. Palanca, who offered encouragement and moral support during the writing and analysis stages, reminding the author that meaningful research is both a technical and personal journey. Ultimately, this work is dedicated to the communities in remote and island regions facing ongoing energy challenges, whose experiences have inspired the pursuit of practical, evidence-based solutions and have highlighted the human purpose behind scientific inquiry.
Conflicts of Interest
The authors declare no conflict of interest.
References
- Salac, A.C.; Somera, J.D.C.; Castro, M.T.; Divinagracia-Luzadas, M.F.; Danao, L.A.M.; Ocon, J.D. Off-Grid Electrification Using Renewable Energy in the Philippines: A Comprehensive Review. Smart Cities 2024, 7, 1007–1043. [CrossRef]
- Meschede, H.; Esparcia, E.A., Jr.; Holzapfel, P.; Bertheau, P.; Ang, R.C.; Blanco, A.C.; Ocon, J.D. On the transferability of smart energy systems on off-grid islands using cluster analysis – A case study for the Philippine archipelago. Appl. Energy 2019, 251, 113290. [CrossRef]
- Castro, M.T.; Pascasio, J.D.A.; Delina, L.L.; Balite, P.H.M.; Ocon, J.D. Techno-economic and financial analyses of hybrid renewable energy system microgrids in 634 Philippine off-grid islands: Policy implications on public subsidies and private investments. Energy 2022, 257. [CrossRef]
- Groppi, D.; Pfeifer, A.; Garcia, D.A.; Krajačić, G.; Duić, N. A review on energy storage and demand side management solutions in smart energy islands. Renew. Sustain. Energy Rev. 2021, 135, 110183. [CrossRef]
- DOE), D.o.E., Philippine Energy Plan 2018-2040. 2018, Government Report: DOE: Taguig City Philippines.
- Abeleda Jr, J.M.A. and R. Espiritu, The status and prospects of hydrogen and fuel cell technology in the Philippines. Energy Policy, 2022. 162.
- Osman, A.I.; Nasr, M.; Mohamed, A.R.; Abdelhaleem, A.; Ayati, A.; Farghali, M.; Al-Muhtaseb, A.H.; Al-Fatesh, A.S.; Rooney, D.W. Life cycle assessment of hydrogen production, storage, and utilization toward sustainability. WIREs Energy Environ. 2024, 13. [CrossRef]
- Maniscalco, M.P.; Longo, S.; Cellura, M.; Miccichè, G.; Ferraro, M. Critical Review of Life Cycle Assessment of Hydrogen Production Pathways. Environments 2024, 11, 108. [CrossRef]
- Zubiria, A.; Menéndez, Á.; Grande, H.-J.; Meneses, P.; Fernández, G. Multi-Criteria Decision-Making Problem for Energy Storage Technology Selection for Different Grid Applications. Energies 2022, 15, 7612. [CrossRef]
- Oskouei, M.Z.; Şeker, A.A.; Tunçel, S.; Demirbaş, E.; Gözel, T.; Hocaoğlu, M.H.; Abapour, M.; Mohammadi-Ivatloo, B. A Critical Review on the Impacts of Energy Storage Systems and Demand-Side Management Strategies in the Economic Operation of Renewable-Based Distribution Network. Sustainability 2022, 14, 2110. [CrossRef]
- Yang, K.; Guo, Y.; Fu, X. Opinion on intra-provincial medium and long-term electricity market considering available transmission capacity. Front. Energy Res. 2023, 11. [CrossRef]
- Chen, S.; Bravo-Melgarejo, S.; Mongeau, R.; Malavolti, E. Adopting and diffusing hydrogen technology in air transport: An evolutionary game theory approach. Energy Econ. 2023, 125. [CrossRef]
- Nishitsuji, Y.; Masaya, S. Game Theory Approach of Stakeholder Decisions in Natural Hydrogen Exploration. Fifth EAGE Global Energy Transition Conference & Exhibition (GET 2024). LOCATION OF CONFERENCE, NetherlandsDATE OF CONFERENCE; pp. 1–5.
- Valente, A.; Iribarren, D.; Dufour, J. Life cycle assessment of hydrogen energy systems: a review of methodological choices. Int. J. Life Cycle Assess. 2016, 22, 346–363. [CrossRef]
- Gandiglio, M.; Marocco, P.; Bianco, I.; Lovera, D.; Blengini, G.; Santarelli, M. Life cycle assessment of a renewable energy system with hydrogen-battery storage for a remote off-grid community. Int. J. Hydrogen Energy 2022, 47, 32822–32834. [CrossRef]
- Egeland-Eriksen, T.; Hajizadeh, A.; Sartori, S. Hydrogen-based systems for integration of renewable energy in power systems: Achievements and perspectives. Int. J. Hydrogen Energy 2021, 46, 31963–31983. [CrossRef]
- ołądek, M., et al., Energy-Economic Assessment of Islanded Microgrid with Wind Turbine, Photovoltaic Field, Wood Gasifier, Battery, and Hydrogen Energy Storage. Sustainability, 2022. 14(19).
- Al-Abri, Z.M.; Alawasa, K.M.; Al-Abri, R.S.; Al-Hinai, A.S.; Awad, A.S.A. Multi-Criteria Decision-Making Approach for Optimal Energy Storage System Selection and Applications in Oman. Energies 2024, 17, 5197. [CrossRef]
- Kozłowska, J. Methods of Multi-Criteria Analysis in Technology Selection and Technology Assessment: A Systematic Literature Review. Eng. Manag. Prod. Serv. 2022, 14, 116–137. [CrossRef]
- Palanca, A.G.; Chao, C.L.V.; Subosa, B.N.F.; Yap, K.J.R.; de Leon, R.L. Evaluating Technology Attributes of Grid-Size Electricity Energy Storage for Palawan: A Multi-Criteria Analysis Study. E3S Web of Conferences, 2025. 643.
- Tourinho, T.C.; Serra, E.G.; Araújo, O.Q. A life cycle framework for comparative analysis of power generation technologies based on prioritized sustainable development goals. Energy Convers. Manag. 2024, 326. [CrossRef]
- Wang, G.; Chao, Y.; Cao, Y.; Jiang, T.; Han, W.; Chen, Z. A comprehensive review of research works based on evolutionary game theory for sustainable energy development. Energy Rep. 2022, 8, 114–136. [CrossRef]
- Huang, F.; Fan, H.; Shang, Y.; Wei, Y.; Almutairi, S.Z.; Alharbi, A.M.; Ma, H.; Wang, H. Research on Renewable Energy Trading Strategies Based on Evolutionary Game Theory. Sustainability 2024, 16, 2671. [CrossRef]
- Rebitzer, G., et al., Life cycle assessment part 1: framework, goal and scope definition, inventory analysis, and applications. Environ Int, 2004. 30(5): p. 701–20.
- Pryshlakivsky, J.; Searcy, C. Fifteen years of ISO 14040: a review. J. Clean. Prod. 2013, 57, 115–123. [CrossRef]
- Estévez, R.A.; Espinoza, V.; Oliva, R.D.P.; Vásquez-Lavín, F.; Gelcich, S. Multi-Criteria Decision Analysis for Renewable Energies: Research Trends, Gaps and the Challenge of Improving Participation. Sustainability 2021, 13, 3515. [CrossRef]
- Palanca, A.G.; Chao, C.L.V.; Yap, K.J.R.; de Leon, R.L. Bridging the Gap: Public Perception and Acceptance of Hydrogen Technology in the Philippines. Sustainability 2025, 17, 324. [CrossRef]
- Wang, K.; Cheng, L.; Yin, M.; Zhang, K.; Wang, R.; Zhang, M.; Sun, R. Evolutionary Game Theory in Energy Storage Systems: A Systematic Review of Collaborative Decision-Making, Operational Strategies, and Coordination Mechanisms for Renewable Energy Integration. Sustainability 2025, 17, 7400. [CrossRef]
- Online, A. [cited 2025 November 16, 2025]; Available from: https://www.irena.org/publications/2020/Dec/Green-hydrogen-cost-reduction.
- Cheng, L.; Zhang, M.; Huang, P.; Lu, W. Game-Theoretic Approaches for Power-Generation Companies’ Decision-Making in the Emerging Green Certificate Market. Sustainability 2024, 17, 71. [CrossRef]
- Bareiß, K.; de la Rua, C.; Möckl, M.; Hamacher, T. Life cycle assessment of hydrogen from proton exchange membrane water electrolysis in future energy systems. Appl. Energy 2019, 237, 862–872. [CrossRef]
- Koj, J.C.; Zapp, P.; Wieland, C.; Görner, K.; Kuckshinrichs, W. Life cycle environmental impacts and costs of water electrolysis technologies for green hydrogen production in the future. Energy, Sustain. Soc. 2024, 14, 1–26. [CrossRef]
- Kim, K.-M.; Kim, D. Life Cycle Assessment of Greenhouse Gas Emissions in Hydrogen Production via Water Electrolysis in South Korea. Sustainability 2024, 16, 11010. [CrossRef]
- Wei, X.; Sharma, S.; Waeber, A.; Wen, D.; Sampathkumar, S.N.; Margni, M.; Maréchal, F.; Van Herle, J. Comparative life cycle analysis of electrolyzer technologies for hydrogen production: Manufacturing and operations. Joule 2024, 8, 3347–3372. [CrossRef]
- Brauns, J.; Turek, T. Alkaline Water Electrolysis Powered by Renewable Energy: A Review. Processes 2020, 8, 248. [CrossRef]
- Miller, H.A.; Bouzek, K.; Hnat, J.; Loos, S.; Bernäcker, C.I.; Weissgaerber, T.; Röntzsch, L.; Meier-Haack, J. Green hydrogen from anion exchange membrane water electrolysis: a review of recent developments in critical materials and operating conditions. Sustain. Energy Fuels 2020, 4, 2114–2133. [CrossRef]
Table 2.
(a) Electricity-mix scenarios (S1–S5) for hydrogen production in Philippine island grids, showing the share of each generation technology and the resulting grid carbon intensity. Values under S1–S5 denote the fractional share of each technology in the electricity mix (summing to 1.0 per scenario). Scenario definitions are as follows: S1 = diesel-only SPUG baseline (100% diesel); S2 = diesel–wind transitional mix (~78% diesel, 22% wind); S3 = diesel–wind–nuclear low-carbon mix (~39% diesel, 22% wind, 39% nuclear); S4 = diesel–biomass/waste-to-energy–wind mix (~39% diesel, 39% biomass/WtE, 22% wind); S5 = diesel–wind hybrid with equal shares (50% diesel, 50% wind). (b) GWP (kg CO₂e/kg H₂) for Alkaline, PEM, and AEM electrolyzers under five electricity-mix scenarios, calculated as the grid carbon intensity multiplied by the technology's electricity requirement. (50 kWh/kg H₂ for Alkaline [32,31] and PEM [32,33,34] ; 49 kWh/kg H₂ for AEM [35,36]).
Disclaimer/Publisher’s Note: The statements, opinions and data contained in all publications are solely those of the individual author(s) and contributor(s) and not of MDPI and/or the editor(s). MDPI and/or the editor(s) disclaim responsibility for any injury to people or property resulting from any ideas, methods, instructions or products referred to in the content. |
© 2025 by the authors. Licensee MDPI, Basel, Switzerland. This article is an open access article distributed under the terms and conditions of the Creative Commons Attribution (CC BY) license (http://creativecommons.org/licenses/by/4.0/).
Copyright: This open access article is published under a Creative Commons CC BY 4.0 license, which permit the free download, distribution, and reuse, provided that the author and preprint are cited in any reuse.


