
Submitted:
26 November 2025
Posted:
26 November 2025
You are already at the latest version
Abstract
Urban lakes, as critical components of urban ecosystems, provide essential ecological services but face water quality deterioration due to rapid urbanization and associated land use changes. This study investigated the temporal and spatial characteristics and evolution mechanisms of water quality in Wuhan city lakes, with a focus on the Great East Lake basin (GELB), a typical urban lake cluster in the middle Yangtze River basin, encompassing six key lakes: East Lake (EL), Sha Lake (SL), Yangchun Lake (YCL), North Lake (NL), Yan East Lake (YEL), and Yan West Lake (YWL). The spa-tio-temporal variation of water quality was studied by analyzing monthly water en-vironment data from 2017 to 2023. The surrounding land use data of 2020 and the corresponding year's water quality data were integrated and examined to assess the impact of land use on major pollutants. The results showed that SL had the best water quality, EL, YEL, and YWL exhibited similar water quality evaluation results, while YCL and NL had the worst water quality. Seasonal variations in water quality were observed, influenced by the ecological functions of lakes and surrounding land use. Notably, understanding these seasonal dynamics provides insights into nutrient cycle operations and their effective management under varying climatic conditions. In ad-dition, the correlation between chlorophyll-a concentration and nutrient elements in urban lakes was not consistent, with some lakes showing significant negative correla-tions. The water quality of urban lakes is influenced by both land use and human management. Land use analysis indicated high impervious surfaces in EL, SL, and YCL exacerbated runoff-driven nutrient loads, YEL's nitrogen elevation from agricultural runoff, and NL's pollution from historical industrial discharge. This study highlights the urgent need for targeted water management strategies to mitigate the impact of urbanization on water quality and provide a scientific basis for effective governance and ecological restoration in rapidly urbanizing areas around the world. By adopting an integrated approach combining water quality assessments with land use data, this research offers valuable insights for sustainable urban lake management.
Keywords:
urban lakes
; water quality evolution
; land use
; water quality index (WQI)
; water pollution
1. Introduction
Urban lakes, defined as freshwater bodies situated predominantly within urban landscapes, shaped by anthropogenic pressures such as impervious surfaces and altered hydrology, and serving as crucial ecological and recreational assets that enhance urban resilience [1,2], play an irreplaceable role in maintaining ecological security and promoting socio-economic development [3]. These lakes, often referred to as the lungs of urban environments, not only provide crucial drinking water sources and recreational spaces for urban residents but also serve as essential habitats for various flora and fauna, thereby supporting biodiversity [4]. The presence of urban lakes significantly enhances urban livability through their ecological services, including climate regulation, biodiversity maintenance, and mitigation of the urban heat island effect. The interconnectedness of these water bodies with their surroundings underscores their importance in urban planning and management. However, against the backdrop of rapid global urbanization, the deterioration of urban lake water quality has become increasingly severe, posing a significant threat to both aquatic ecological security and human well-being [5]. This decline adversely affects not only the aesthetic and recreational value of these water bodies but also the health of local ecosystems and communities.
According to the United Nations Environment Programme (UNEP) Global Environment Outlook report, approximately 40% of urban lakes worldwide are at risk of eutrophication, with frequent algal blooms leading to deteriorated water quality that endangers aquatic biodiversity and, through food chain amplification effects, compromises the safety of urban drinking water. Such environmental changes can result in the loss of aquatic species, making ecosystems less resilient and reducing their capacity to provide essential services [6]. This alarming trend highlights the urgent need for enhanced protection and restoration of urban lakes. The implications of poor water quality extend beyond ecological impacts. Therefore, it is imperative to not only assess the current state of urban lake water quality but also to understand the underlying factors driving its deterioration.
Land use patterns serve as direct representations of urban spatial expansion, and their evolution profoundly affects the spatial and temporal distribution of pollutants in lakes. The expansion of impervious surfaces associated with urban growth significantly increases the volume and velocity of stormwater runoff, which in turn elevates the transport of pollutants into lakes [7,8]. This runoff often carries a mix of heavy metals, nutrients, organic debris, fuels, oils, mineral parts and so on, leading to a cascade of environmental issues. Different land use types, such as residential, commercial, agricultural, and industrial zones, exert varying pressures on water quality, and impervious urban surfaces often disproportionately increase pollutant loads [9,10]. Furthermore, the consequences of land use change are not uniform, as some areas may experience more intense urbanization pressures than others, resulting in a complex map of pollutant sources and impacts [11]. This spatial heterogeneity necessitates that water quality management strategies be founded on a precise understanding of the land use-water quality response mechanisms.
This study chooses Wuhan as a typical case, as its urban lake system embodies both typical and representative characteristics. Wuhan’s unique geographical position as a critical hub in central China, along with its extensive lake network, makes it a compelling case for studying urban lake dynamics. As a core city in the Yangtze River Economic Belt, Wuhan has been experiencing rapid urbanization while facing water environment governance challenges similar to those of other global megacities. Rapid economic growth and population influx have intensified the pressure on water resources, leading to conflicts between development and environmental sustainability [12,13]. This study aims to reveal (1) the temporal and spatial trends of water quality changes and the results of water quality assessments in urban lakes, (2) the relationship between chlorophyll-a and other water quality indicators in urban lakes, and (3) the intrinsic mechanisms of lake water quality evolution in the context of urbanization, while proposing effective management strategies through detailed analysis. The findings will not only provide a scientific basis for water environment management in the urban agglomeration of the middle reaches of the Yangtze River but also offer theoretical references for water ecological protection in rapidly urbanizing regions worldwide. This cross-scale research paradigm, based on complex systems theory, will promote a strategic shift in urban lake management from end-of-pipe treatment to source control. Such an approach emphasizes preventative measures and sustainable urban planning practices, ensuring the long-term health of urban lakes and the myriad benefits they offer to urban communities.
2. Materials and Methods
2.1. Study Area
The study focuses on the Greater East Lake Basin (GELB) in Wuhan, China, a metropolitan region renowned for its complex aquatic ecosystems (Figure 1). Situated at the confluence of the Yangtze and Han Rivers in central China, Wuhan exhibits a distinctive urban landscape where lakes and rivers form intricate hydrological networks. Wuhan has a subtropical climate, with hot and humid summers, mild winters, and distinct seasonal changes [14]. The region is characterized by abundant rainfall, with an annual average of approximately 1260 mm, predominantly during the summer monsoon season from May to September, which may lead to increased surface runoff and an augmented pollutant load entering the lakes [4]. To capture these seasonal hydrological dynamics in water quality analysis, January and July were selected as representative months for the dry season (November–March) and rainy season (June–August), respectively. The GELB is situated in the central urban area of Wuhan, boasting a high population density and a prosperous business environment. The urban lakes within it fulfill diverse habitat functions and play crucial ecological roles. As a significant industrial and commercial hub, Wuhan has witnessed rapid urbanization in recent decades, exerting increasing pressure on its aquatic ecosystems. To mitigate these impacts, comprehensive water quality management measures, including the Great East Lake Ecological Water Network Project initiated in 2009 and the Yangtze River Protection and Restoration Battle Plan launched in 2019, have been implemented to reduce nutrient loads and enhance ecological resilience in GELB lakes,, contributing to significant water quality improvements in recent years. The dynamic interplay between economic development and environmental sustainability makes the GELB in Wuhan an ideal location for investigating the impacts of urbanization and land use on the water quality of urban lakes.
The GELB in Wuhan City, a typical urban lake cluster in the middle Yangtze River basin, encompasses six key lakes: East Lake (EL, 114°23′48″E, 30°33′57″N, 31.75 km2), Sha Lake (SL, 114°18′36″E, 30°33′55″N, 3.08 km2), Yangchun Lake (YCL, 114°25′6″E, 30°36′49″N, 0.58 km2), North Lake (NL, 114°30′49.91″E, 30°36′8.21″N, 1.94 km2), Yan East Lake (YEL, 114°32′54″E, 30°32′15″N, 9.17 km2), and Yan West Lake (YWL, 114°28′42″E, 30°34′23″N, 14.2 km2). This basin exhibits a unique dual natural-artificial coupling pattern, with hydraulic connectivity between lakes maintained through channels and pumping stations, yet water exchange is constrained by anthropogenic regulation. The Dongsha Lake system (EL-SL-YCL) is significantly impacted by high-density urban development, confronting challenges such as eutrophication, pollutant accumulation, and diminished hydrodynamic conditions. In contrast, the Beihu Lake system (NL-YEL-YWL) features NL receiving long-term industrial effluent from Qingshan District, while YEL and YWL, primarily deepwater lakes, serve as critical ecological barriers. Complex water source interactions within the basin result in intricate pollutant migration pathways. Investigating the current status of water pollution and land-use-driven impacts in the Greater East Lake Basin’s urban lakes can provide valuable insights for ecological restoration strategies and dynamic water resource management in similar urban lake clusters.
2.2. Data Sources
This study utilized monthly water quality data from the GELB spanning from 2017 to 2023 (yielding a total of approximately 504 observations across the six lakes), which were obtained from the Wuhan Municipal Water Affairs Authority. These data include key water quality indicators such as water temperature (WT, °), pH, chlorophyll a (Chl-a, μg/L),total nitrogen (TN, mg/L), total phosphorus (TP, mg/L), ammonia nitrogen (NH3-N, mg/L) and chemical oxygen demand (COD, mg/L), which are critical for assessing the ecological health of urban lakes. Additionally, land use data (1m×1m) of 2020 were sourced from School of Remote Sensing at Wuhan University, as detailed in Section 2.3.3, providing a comprehensive overview of land use and their potential impacts on the basin, with a resolution and accuracy surpassing all publicly available open-source datasets, enabling precise analysis of urbanization and land use influences on lake water quality. In fact, the 2020 land use data serves as a representative snapshot of conditions across the study period (2017-2023), effectively capturing the spatial heterogeneity in land cover surrounding urban lakes. It was specifically paired with contemporaneous (2020) water quality measurements to facilitate a robust analysis of their interrelationships.
2.3. Methods
2.3.1. Water Quality Index (WQI) Assessment
To evaluate the water quality of urban lakes in the GELB, the Water Quality Index (WQI) assessment method was employed, which is a widely recognized tool for simplifying complex water quality data into a single value that reflects overall aquatic ecosystem health. This study prioritized parameters critical to ecological integrity, including Chl-a as a proxy for algal biomass, TN, TP, and NH3-N as nutrient indicators, and COD measuring oxidative contaminant loads [15] (Table 1). The weights were assigned based on their relative ecological significance in urban lake systems, informed by expert judgment and literature[15,16]. Each parameter was assigned a weight according to its importance and was normalized to a scale from 0 to 100, where elevated scores denote superior water quality conditions. The calculation formula of WQI is shown in Equation (1).
where is the normalized sub-index for parameter i (ranging from 0 to 100), is the weight for parameter i, and i is the number of parameters.
The composite WQI score enables temporal categorization of aquatic health across five hierarchical classes: “Excellent” (91–100), “Good” (71–90), “Moderate” (51–70), “Low” (26–50), and “Bad” (0–25) [16]. This stratified system facilitates intuitive interpretation of long-term trends in lake ecosystem stability by translating complex hydrochemical data into actionable insights.
2.3.2. Correlation Analysis
Correlation analysis is a statistical method used to assess linear and non-linear relationships between variables. In this study, Spearman correlation analysis was conducted using RStudio to evaluate relationships between Chl-a and other water quality parameters across the six urban lakes in GELB from 2017 to 2023, using monthly data to compare interrelationships among water quality factors, particularly the interactions between Chl-a and nutrient concentrations (TN, TP, NH3-N), across different lakes without considering temporal variations. The analysis aimed to determine whether controlling these pollutants could effectively mitigate algal blooms, thereby providing evidence-based insights for urban lake management and water pollution remediation. Correlation results are quantified using correlation coefficients and significance levels, with p-values computed and reported. Significant correlations are denoted in Figure 4 using “**” for p < 0.01 and “*” for p < 0.05. Generally, the larger the absolute value of the correlation coefficient, the stronger the relationship between the two variables.
2.3.3. Land Coverage
Based on the 1-meter resolution land cover data from the School of Remote Sensing and Information Engineering, Wuhan University, nine main land use types in the highly urbanized central area of Wuhan: Surface water (SW), forest vegetation (FV), building vegetation (BV), park vegetation (PV), road vegetation (RV), urban buildings (UB), rural buildings (RB), urban roads (UR, including roads and sidewalks), and bare land (BL) were identified (Figure 1). A buffer zone within 500 meters of urban lakes was selected as the study area to assess land use and calculate the areas of different land use types. The percentage of each land use type was calculated as the ratio of its area to the total area after excluding water bodies. Moreover, Impervious surfaces (IS), defined as urban features such as buildings and roads that restrict water infiltration and increase surface runoff and pollutant migration, were quantified in this study as the aggregate percentage of UB, RB, and UR, reflecting their combined contribution to runoff-driven pollutant loads in the GELB lakes. Although a single-year (2020) high-resolution (1m×1m) land use dataset was utilized, the analysis focuses on spatial heterogeneity in land use patterns across the six urban lakes in the GELB to evaluate urbanization effects, capturing lake-specific impacts such as urban development in the Dongsha Lake system. The land use data year was selected to align temporally with the 2017–2023 water quality dataset, ensuring consistency for assessing land use-water quality relationships. During the period from 2017 to 2023, land use changes within these urban watersheds were minimal, and thus not the primary focus of our study.
2.3.4. Redundancy Analysis (RDA)
Redundancy Analysis (RDA) is a multivariate statistical technique designed to investigate linear relationships between response variables (e.g., environmental metrics like water quality parameters) and explanatory variables (e.g., land use categories) [9]. It constructs constrained ordination axes that maximize the variance explained in the response data by the predictors, making it ideal for ecological and environmental studies, such as assessing how land cover influences pollutant dynamics in urban lakes. Typically, the first two axes account for >90% of variance, confirming model robustness, though multicollinearity must be checked via variance inflation factors.
3. Results and Discussion
3.1. Temporal and Spatial Variation Characteristics of Major Pollutants
3.1.1. Inter-Annual Variation Feature
The analysis of the annual variation trends of crucial pollutants across six urban lakes in Wuhan from 2017 to 2023 reveals significant temporal patterns in the water quality indicators (Figure 2). The COD levels were notably high in 2018, with NL exhibiting the highest mean concentration of 38.0 mg/L during this period (Figure 2). Over the years, COD concentrations have shown a consistent decrease, particularly after 2020, reflecting the effectiveness of sewage interception and ecological restoration efforts, which improved water exchange and reduced organic pollutant loads. TP concentrations peaked in 2018 across various lakes, followed by a general decline. Notably, this reduction became more pronounced after 2020, driven by phosphorus control measures, including wetland restoration and runoff management, under frameworks such as the Yangtze River Protection and Restoration Battle Plan. However, the TP concentration in NL and YCL increased significantly, indicating the need for lake-specific management adjustments and suggesting that other factors, such as industrial effluents in NL and urban runoff in YCL, may contribute to water quality deterioration. The trend for TN closely mirrored that of TP, with concentrations reaching their highest levels in 2018 before gradually decreasing in subsequent years, reflecting nitrogen pollution control through upgraded sewage treatment systems and ecological buffer zones in GELB. Similarly, NH3-N concentrations peaked in 2018 or 2019, and have shown a decreasing trend since then in most lakes (except for EL and YCL), highlighting significant improvements in ammonia nitrogen pollution levels. The fluctuations in Chl-a concentrations exhibit significant variability compared to other water quality parameters in the lakes, demonstrating considerable instability over time. Among the studied lakes, only SL shows a notable decreasing trend in Chl-a levels, likely due to localized ecological restoration and water quality management in SL, while NL and YCL display a significant increasing trend. This contrasting behavior highlights the diverse dynamics of algal growth and nutrient interactions across different lakes, emphasizing the need for tailored management strategies to address site-specific challenges.
3.1.2. Seasonal Variation Feature
The Water Quality Index (WQI) evaluation results for the six urban lakes in Wuhan, based on monthly water quality data from 2017 to 2023 obtained from the Wuhan Municipal Water Affairs Authority for January (dry season) and July (rainy season) (Figure 3), highlighting the complex interplay between hydrological conditions and ecosystem responses. Lakes such as EL, SL, YEL, and YWL exhibited improved water quality in the dry season compared to the rainy season,, which has also been found in other studies [17], likely due to their greater exposure to non-point source pollution, including urban runoff for EL and SL and agricultural runoff for YEL and YWL, relative to point source pollution, leading to lower nutrient inputs during periods of reduced rainfall. This improvement can be attributed to reduced external runoff, which minimizes the influx of pollutants, and the stabilization of aquatic ecosystems under lower hydrological stress [18]. The dry season’s calm conditions also facilitate the settling of suspended solids and the degradation of organic pollutants, contributing to higher WQI values. In contrast, NL and YCL demonstrate enhanced water quality during the rainy season. The increase in the concentration of water quality parameters in dry seasons of urban river has also been studied [19]. Wastewater discharge significantly increases pollutant concentrations, particularly in the dry season, due to limited water volume [20]. However, increased water volume in the rainy season likely dilutes these pollutants, enhancing the natural resilience of these ecosystems to seasonal flooding [21]. Floodwaters may also flush out accumulated contaminants, temporarily improving water quality [19]. However, this improvement is often short-lived, as prolonged flooding can introduce new pollutants from surrounding areas, underscoring the need for targeted management strategies to mitigate flood-related impacts. The contrasting seasonal patterns in WQI values across the lakes underscore the importance of considering temporal hydrological variations in water quality management. For instance, lakes that perform better during the dry season may benefit from measures that control external pollutant inputs and enhance ecosystem stability, while those showing improved conditions during the rainy season may require strategies to manage floodwater quality and mitigate post-flood pollution. These findings emphasize the need for adaptive, season-specific management approaches to address the dynamic nature of urban lake ecosystems and ensure sustainable water quality improvements.
3.1.3. Spatial Distribution of Crucial Pollutants
The concentrations of TP and NH3-N in EL remain consistently high (elevated relative to Class III standards, NH3-N ≤ 1.0 mg/L, TP ≤ 0.05 mg/L), indicating poor water quality and severe pollution. Despite some progress in recent years, stronger management efforts are still needed to further reduce pollutant levels. In contrast, NL shows significant improvement in water quality, with lower concentrations of COD, TP, TN, and NH3-N, suggesting that management strategies are effective and that the lake has a strong ecological recovery capacity. YEL has maintained relatively stable water quality indicators since 2019, with relatively low concentrations of NH3-N and TP, indicating effective water quality management measures. YEL experienced a slight peak in NH3-N and TN concentrations in 2020, but overall, the levels have remained relatively stable over the years. SL exhibits relatively good water quality, with low levels of major pollutants, indicating that effective management measures have maintained its good condition. On the other hand, YCL shows higher concentrations of pollutants, a slower rate of improvement, and a certain degree of rebound, highlighting the need for enhanced management efforts in the area. Overall, the spatial distribution patterns of key pollutants reveal differences in water quality indicators among the lakes, providing important insights for future water quality management and ecological protection efforts.
3.2. Water Quality Evaluation
3.2.1. Single Factor Evaluation Method
The analysis of COD concentrations across the six major lakes in the GELB reveals a consistent declining trend overall. Since 2020, the COD levels in most lakes have generally adhered to Class III water quality standards. However, YCL presents an exception, experiencing an increase in COD levels over the past two years. Notably, between 2017 and 2020, the COD concentration in NL was significantly higher compared to the other lakes. Fortunately, it has decreased substantially and has maintained levels below 20 mg/L since 2020. In terms of TP concentrations, all six lakes in the GELB have significantly exceeded acceptable limits. Only SLand YEL have managed to meet the Class III water quality standards for total phosphorus in recent years, indicating some success in pollution management. In contrast, TP levels in the other lakes remain excessively high, particularly in NL, which has seen a substantial increase in total phosphorus levels since 2021. When examining NH3-N concentrations, NL stands out with the highest levels of ammonia nitrogen among the six lakes. Nonetheless, there have been noticeable improvements in recent years. Since 2020, the other lakes have generally managed to meet Class III water quality standards for ammonia nitrogen, reflecting effective management strategies. The concentrations of TN in the six major lakes also exhibit a consistent declining trend. However, overall levels remain high, well above Class III water quality standards, with NL recording the highest total nitrogen concentration, closely followed by YCL. Overall, the water quality indicators for the six major lakes in the GELB have maintained a relatively stable condition since 2020, though fluctuations within certain ranges are evident. Nevertheless, the concentrations of TP and TN remain a concern due to their relatively high levels. In examining Chl-a concentrations, the patterns among the six major lakes vary significantly. All lakes exhibit notably high levels of Chl-a, with NL and YWL showing similar trends of relative stability prior to 2020, which was followed by a marked increase thereafter. The remaining four lakes, however, display considerable interannual fluctuations, although, in general, Chl-a concentrations have shown a slight decline.
3.2.2. WQI
The analysis of the spatial distribution patterns of crucial pollutants among the six urban lakes reveals significant differences in water quality indicators, reflecting the varying degrees of pollution and management effectiveness in each lake. Based on the Water Quality Index (WQI) values (Figure 2), the water quality assessment of the lakes indicates that SL has the best water quality, while YCL and NL exhibit the worst conditions. The relative rankings of WQI values for EL, YEL, and YWL have varied over time, with the three lakes showing similar WQI levels by 2023. From a spatial perspective, significant differences in WQI values were observed among the various lakes. The superior water quality of SL underscores the efficacy of governance measures, such as prohibiting sewage discharge into the lake. YEL displayed considerable variability in its WQI over time and space, emphasizing the influence of external factors on its water quality. The WQI values for NL and YCL remain relatively low, signifying higher levels of pollution and suboptimal water quality management outcomes, potentially attributable to their smaller lake sizes and limited self-purification capacities. On a temporal scale, the WQI of most lakes (SL, EL, NL and YCL) has shown an overall increasing trend, indicating continuous improvement in water quality over the years. The WQI of EL was initially lower than that of YWL and YEL but has since risen to a comparable level with both. In particular, although the WQI values for NL and YCL have remained notably low, they are nonetheless showing positive gains. In contrast, WQI of YWL exhibited a downward trend, signaling a deterioration in water quality, with persistent challenges impeding its recovery. Therefore, a more targeted management approach is required to enhance its overall water quality.
3.3. Correlation Analysis of Water Quality Parameters
In this study, we conducted a correlation analysis of water quality parameters across six urban lakes in Wuhan, with a particular focus on the relationships between Chl-a and other key water quality factors (Figure 4). The analysis revealed significant patterns that highlight the role of nutrients and organic pollutants in driving algal growth and eutrophication, while also identifying unique characteristics of individual lakes that necessitate tailored management strategies.
In EL, SL and YEL, Chl-a exhibited strong positive correlations with TP and TN, reflecting the critical role of these nutrients in promoting algal growth. Specifically, elevated TP and TN concentrations were found to significantly enhance eutrophication, leading to increased Chl-a levels [22]. These findings underscore the importance of monitoring and controlling nitrogen and phosphorus inputs in urban water bodies to prevent ecological issues associated with eutrophication, such as algal blooms and oxygen depletion [23]. The strong Chl-a-TP correlations in these lakes highlight the need for targeted phosphorus reduction measures, including improved wastewater treatment and restrictions on agricultural runoff [18]. Chl-a also showed a positive correlation with COD in several lakes. This relationship suggests that increased organic pollution may provide additional resources for algal growth, potentially exacerbating eutrophication [17]. However, the rise in organic pollutants also poses a risk of oxygen depletion, as microbial decomposition of organic matter consumes dissolved oxygen. This dual effect emphasizes the importance of integrated pollution control strategies that address both nutrient and organic pollutant inputs to maintain water quality and ecosystem health.
In YCL, the correlations between Chl-a and other water quality factors were relatively weak, indicating that algal growth in this lake may be influenced by factors other than nutrient availability, such as hydrological conditions or external pollution sources. This finding suggests that management strategies for YCL should focus on comprehensive monitoring and adaptive measures to address its unique environmental context. In contrast, NL and YWL exhibited significant negative correlations between Chl-a and TN as well as NH3-N. These unexpected relationships may indicate complex interactions between nutrient dynamics, algal growth, and other environmental factors, such as microbial activity or sediment-water interactions [6]. Further research is needed to elucidate the underlying mechanisms and determine whether these correlations reflect causal relationships or are influenced by external variables.
The variability in Chl-a correlations across the six lakes underscores the importance of adopting lake-specific management strategies. For EL, SL, and YEL, where strong Chl-a-TP and Chl-a-TN correlations were observed, priority should be given to nutrient control measures, such as reducing agricultural runoff, upgrading wastewater treatment facilities, and implementing phosphorus removal technologies. In SL, additional attention should be paid to managing organic pollution to mitigate the risks of oxygen depletion. For YCL, a more holistic approach is needed, focusing on comprehensive monitoring and adaptive management to address its unique environmental conditions. Finally, the unexpected negative correlations in NL and YWL warrant further investigation to better understand the underlying mechanisms and inform targeted management actions.
3.4. Analysis of Water Pollution Causes Based on Land Use
The three lakes (EL, SL and YCL) in the Dongsha Lake basin exhibit relatively high impervious surface (IS) coverage in their surrounding areas, particularly SL (Table 2). Notably, all three lakes lack rural residential structures due to their central urban location. Among these water bodies, EL and SL demonstrate the lowest forest vegetation coverage. However, this deficiency is partially offset by extensive road-adjacent greenery and building-integrated vegetation, which compensate for the lack of natural permeable surfaces. In contrast, the Beihu Lake basin features urban lakes with generally lower impervious surface ratios, each possessing distinct characteristics. NL historically received significant industrial wastewater discharge from Wuhan Iron and Steel Corporation prior to 2021. YEL, situated away from the urban core, maintains superior natural environmental conditions with minimal impervious surfaces and partial coverage of rural settlements. YWL, located at the urban fringe, exhibits spatial heterogeneity: some areas show high population density while others retain relatively pristine natural environments.
With the exception of SL, where anthropogenic protection measures have maintained relatively good water quality, all other urban lakes exhibit suboptimal water conditions. The smallest lakes, YCL and NL, registered the lowest WQI scores and better water quality during the rainy season, indicating accelerated water quality deterioration in smaller urban water bodies. This phenomenon correlates with reduced self-purification capacity and insufficient ecological protection prioritization. Seasonal WQI analysis reveals SL’s stable water quality with minimal seasonal variation, despite having the highest impervious surface ratio. Effective sewage control measures appear to mitigate anthropogenic impacts, though significant positive correlations between Chl-a and nutrient levels suggest potential algae proliferation induced by controlled wastewater discharge [11]. In contrast, YCL exhibits severe pollution across all indicators except NH3-N, underscoring urgent protection needs. Post-2021 improvements in NL water quality correlate with enhanced dilution effects during rainy periods, reflecting effective pollutant flushing from its forested catchment. The 2020-2023 WQI dataset shows comparable index values for EL, YWL and YEL, with EL alone demonstrating pronounced seasonal variability, superior dry-season quality contrasts with marked rainwater pollution. This pattern aligns with EL’s urban context, where intensive construction, road networks, and human activities contribute to both point-source and non-point-source contamination [24]. The YEL’s persistent TN elevation above Class III water standards, coupled with high Chl-a concentrations and adjacent agricultural developments, implies agricultural runoff impacts. YWL’s elevated pollutant profile, exacerbated by greater urban infrastructure density, reinforces the hypothesis that urbanization intensifies aquatic pollution through synergistic anthropogenic pressures [25]. These findings collectively emphasize the critical role of land use patterns and management strategies in determining urban lake water quality trajectories.
To further investigate the driving effects of land use on urban water bodies and validate the accuracy of our land use impact analysis, we employed Redundancy Analysis (RDA). Due to limitations in the number of lakes with available data, we used our own in situ water quality measurements from January (winter) and June (summer) 2020, with sampling points primarily distributed across urban rivers and lakes in the Dongsha watershed. Seasonal water quality data served as response variables, while land use types—including urban roads (UR), surface water (SW), vegetation (VG), urban buildings (UB), and bare land (BL)—were treated as explanatory variables. The results showed that Axis 1 and Axis 2 explained 96.38% and 98.56% of the variance, respectively, demonstrating the feasibility of the RDA approach. The RDA results are presented in Figure 5. In summer, VG, UR, and UB ranked as the top three contributors to explanatory variance, primarily due to abundant rainfall scouring surfaces and transporting pollutants from VG and UR into urban water bodies, which accounts for the positive correlations observed between these land use types and water quality parameters. In winter, SV, UB, and UR were the leading contributors, with SV exhibiting negative correlations to pollutant concentrations, indicating that larger water surface areas mitigate pollution levels owing to enhanced self-purification capacity. Urban buildings ranked second, as reduced winter rainfall shifted the dominant pollution source to point-source emissions from these structures.
4. Discussion
In conclusion, the water quality evolution of urban lakes in Wuhan is significantly influenced by land use changes and the pressures of rapid urbanization. This study highlights the complex interactions among key water quality indicators over different temporal scales, revealing that while some lakes demonstrate improvements, others still face critical pollution challenges. This study elucidates water quality dynamics in six GELB lakes in Wuhan (2017–2023). Inter-annual trends (2017–2023) reveal that COD, TP, TN, and NH3-N concentrations generally declined in recent years due to ecological restoration, sewage interception, and phosphorus control measures, though some lakes, such as YCL, exhibited rising pollutant levels (e.g., TP, NH3-N) after 2021, driven by urban runoff. Chl-a levels showed significant variability with no clear trend, except for a notable reduction in SL due to localized management. WQI evaluations indicate better water quality in EL, YEL, YWL, and SL during the dry season (January) due to reduced non-point source pollution (urban runoff for EL, SL; agricultural runoff for YEL, YWL), while NL and YCL improve in the rainy season (July) via dilution of pollutants. Spearman correlation analysis confirms strong positive Chl-a–TP and Chl-a–TN correlations in EL, SL, and YEL, driving eutrophication, while NL and YWL show negative Chl-a–TN/NH3-N correlations, suggesting complex nutrient dynamics. YCL’s weak correlations indicate other influences, such as hydrological conditions. The results indicate a pressing need for comprehensive management strategies tailored to the unique circumstances of each lake.
Land use analysis highlights that high impervious surfaces (IS, comprising UB, RB, UR) in EL, SL, and YCL exacerbate runoff-driven TP and NH3-N loads, while YEL’s TN elevation reflects agricultural runoff and NL’s pollution stems from historical industrial discharges. SL’s stable water quality, despite high IS, reflects effective sewage control. To quantitatively validate these driving forces, a Redundancy Analysis (RDA) was performed. The RDA model provided powerful quantitative evidence, confirming the critical and seasonally distinct roles of different land use types. Specifically, in summer, pollutant loads were primarily driven by rainfall-driven runoff from vegetated areas (VG), urban roads (UR), and buildings (UB). Conversely, in winter, with reduced runoff, pollution was more strongly associated with point-source emissions from urban buildings, while larger surface water (SV) areas exhibited a mitigating effect due to enhanced self-purification capacity. These findings underscore that effective management requires a dynamic approach, targeting runoff pathways in the summer and point sources in the winter.
By addressing the nuanced challenges presented by urbanization, this study not only contributes to local ecological restoration efforts in Wuhan but also offers a framework for similar urban lake management challenges faced by cities around the world. However, the study has limitations, including the reliance on a 2017–2023 water quality dataset, which may not fully capture long-term trends. Additionally, the focus on a limited number of lakes may restrict the generalizability of findings to other urban aquatic systems. Future research should focus on long-term monitoring and evaluation of implemented management strategies to ensure sustainable outcomes for urban aquatic ecosystems.
5. Conclusions
This section is not mandatory but can be added to the manuscript if the discussion is unusually long or complex.
6. Patents
This section is not mandatory but may be added if there are patents resulting from the work reported in this manuscript.
Author Contributions
Conceptualization, H.Z., Y.H. and X.Z.; formal analysis, Y.H. and H.Z.; writing—original draft preparation, Y.H. and H.Z.; writing—review and editing, Y.H., Q.C. and X.Z.; project administration, Q.C. and X.Z.; funding acquisition, Y.H. and X.Z. All authors have read and agreed to the published version of the manuscript.
Funding
This research was funded by POWERCHINA Chengdu Engineering Corporation Limited, grant number P57323 and Hubei Key R&D Project, grant number 2021BCA128.
Institutional Review Board Statement
Not applicable.
Informed Consent Statement
Not applicable.
Data Availability Statement
The data that support the findings of this study are available from the authors upon reasonable request.
Acknowledgments
Comments from the anonymous reviewers are appreciated.
Conflicts of Interest
The authors declare no conflict of interest.
References
- Costadone, L.; Sytsma, M.D.; Costadone, L.; Sytsma, M.D. Lake and Reservoir Management Identification and Characterization of Urban Lakes across the Continental United States. Lake Reserv. Manag. 2022, 38, 126–138. [Google Scholar] [CrossRef]
- Wang, X.; Cheng, Y. Urban Lake Health Assessment Based on the Synergistic Perspective of Water Environment and Social Service Functions. 2024, 2400144, 1–15. [CrossRef]
- Li, B.; Wan, H.; Cai, Y.; Peng, J.; Li, B.; Jia, Q.; Yuan, X.; Wang, Y.; Zhang, P.; Hong, B.; et al. Human Activities Affect the Multidecadal Microplastic Deposition Records in a Subtropical Urban Lake, China. Sci. Total Environ. 2022, 820. [Google Scholar] [CrossRef]
- Dou, Y.; Yu, X.; Liu, L.; Ning, Y.; Bi, X.; Liu, J. Effects of Hydrological Connectivity Project on Heavy Metals in Wuhan Urban Lakes on the Time Scale. Sci. Total Environ. 2022, 853, 158654. [Google Scholar] [CrossRef] [PubMed]
- Weyhenmeyer, G.A.; Chukwuka, A.V.; Anneville, O.; Brookes, J.; Carvalho, C.R.; Cotner, J.B.; Grossart, H.P.; Hamilton, D.P.; Hanson, P.C.; Hejzlar, J.; et al. Global Lake Health in the Anthropocene: Societal Implications and Treatment Strategies Earth’s Future. Earth’s Futur. 2024, 1–24. [Google Scholar] [CrossRef]
- Wang, L.; Shao, H.; Guo, Y.; Bi, H.; Lei, X.; Dai, S.; Mao, X.; Xiao, K.; Liao, X.; Xue, H. Ecological Restoration for Eutrophication Mitigation in Urban Interconnected Water Bodies: Evaluation, Variability and Strategy. J. Environ. Manage. 2024, 365, 121475. [Google Scholar] [CrossRef]
- Wei, T.; Wijesiri, B.; Jia, Z.; Li, Y.; Goonetilleke, A. Re-Thinking Classical Mechanistic Model for Pollutant Build-up on Urban Impervious Surfaces. Sci. Total Environ. 2019, 651, 114–121. [Google Scholar] [CrossRef]
- Jia, Z.; Chang, X.; Duan, T.; Wang, X.; Wei, T.; Li, Y. Water Quality Responses to Rainfall and Surrounding Land Uses in Urban Lakes. J. Environ. Manage. 2021, 298, 113514. [Google Scholar] [CrossRef]
- Wu, Y.; Wang, X.; Kollányi, L.; Zhang, J.; Bai, T. Analyzing and Forecasting Water-Land Dynamics for Sustainable Urban Developments: A Multi-Source Case Study of Lake Dianchi’s Environmental Challenges (China). Ecol. Indic. 2024, 166. [Google Scholar] [CrossRef]
- Zheng, L.; Jiang, C.; Chen, X.; Li, Y.; Li, C.; Zheng, L. Combining Hydrochemistry and Hydrogen and Oxygen Stable Isotopes to Reveal the Influence of Human Activities on Surface Water Quality in Chaohu Lake Basin. J. Environ. Manage. 2022, 312, 114933. [Google Scholar] [CrossRef] [PubMed]
- Wang, X.; Yang, Y.; Wan, J.; Chen, Z.; Wang, N.; Guo, Y.; Wang, Y. Water Quality Variation and Driving Factors Quantitatively Evaluation of Urban Lakes during Quick Socioeconomic Development. J. Environ. Manage. 2023, 344, 118615. [Google Scholar] [CrossRef]
- Xia, P.; Peng, J.; Gu, T.; Yu, S.; Xu, Z. Lake-Related Ecosystem Services Facing Social – Ecological Risks. People Nat. 2025, 734–751. [Google Scholar] [CrossRef]
- Muhammad, H.; Irfan, A.; Muhammad, K.; Latif, I.; Komal, B.; Chen, S. Understanding the Dynamics of Natural Resources Rents, Environmental Sustainability, and Sustainable Economic Growth: New Insights from China. Environ. Sci. Pollut. Res. 2022, 58746–58761. [Google Scholar] [CrossRef]
- Zhang, H.; Liu, Z.; Xu, J.; Yang, J.; Zhang, X. The Driving Mechanism of Diverse Land Use Types on Dissolved Organic Matter Characteristics of Typical Urban Streams from Wuhan City. J. Environ. Manage. 2024, 370, 122906. [Google Scholar] [CrossRef] [PubMed]
- Wu, T.; Wang, S.; Su, B.; Wu, H.; Wang, G. Understanding the Water Quality Change of the Yilong Lake Based on Comprehensive Assessment Methods. Ecol. Indic. 2021, 126, 107714. [Google Scholar] [CrossRef]
- Varol, M. Use of Water Quality Index and Multivariate Statistical Methods for the Evaluation of Water Quality of a Stream Affected by Multiple Stressors: A Case Study. Environ. Pollut. 2020, 266, 115417. [Google Scholar] [CrossRef] [PubMed]
- Wang, J.; Fu, Z.; Qiao, H.; Liu, F. Assessment of Eutrophication and Water Quality in the Estuarine Area of Lake Wuli, Lake Taihu, China. Sci. Total Environ. 2019, 650, 1392–1402. [Google Scholar] [CrossRef]
- Naranjo, R.C.; Niswonger, R.G.; Smith, D.; Rosenberry, D.; Chandra, S. Linkages between Hydrology and Seasonal Variations of Nutrients and Periphyton in a Large Oligotrophic Subalpine Lake. J. Hydrol. 2019, 568, 877–890. [Google Scholar] [CrossRef]
- Liu, Y.; Wu, X.; Qi, W. Assessing the Water Quality in Urban River Considering the Influence of Rainstorm Flood: A Case Study of Handan City, China. Ecol. Indic. 2024, 160. [Google Scholar] [CrossRef]
- Wang, Y.; Thompson, A.M.; Selbig, W.R. Predictive Models of Phosphorus Concentration and Load in Stormwater Runoff from Small Urban Residential Watersheds in Fall Season. J. Environ. Manage. 2022, 315, 115171. [Google Scholar] [CrossRef]
- Liu, J.; Zhang, X.; Wu, B.; Pan, G.; Xu, J.; Wu, S. Spatial Scale and Seasonal Dependence of Land Use Impacts on Riverine Water Quality in the Huai River Basin, China. Environ. Sci. Pollut. Res. 2017, 24, 20995–21010. [Google Scholar] [CrossRef]
- Li, B.; Yang, G.; Wan, R.; Xu, L. Chlorophyll a Variations and Responses to Environmental Stressors along Hydrological Connectivity Gradients: Insights from a Large Floodplain Lake. Environ. Pollut. 2022, 307, 119566. [Google Scholar] [CrossRef] [PubMed]
- Qin, B.; Zhou, J.; Elser, J.J.; Gardner, W.S.; Deng, J.; Brookes, J.D. Water Depth Underpins the Relative Roles and Fates of Nitrogen and Phosphorus in Lakes. Environ. Sci. Technol. 2020, 54, 3191–3198. [Google Scholar] [CrossRef] [PubMed]
- Han, Q.; Tong, R.; Sun, W.; Zhao, Y.; Yu, J.; Wang, G.; Shrestha, S.; Jin, Y. Anthropogenic Influences on the Water Quality of the Baiyangdian Lake in North China over the Last Decade. Sci. Total Environ. 2020, 701, 134929. [Google Scholar] [CrossRef] [PubMed]
- Zheng, Y.; Yu, J.; Wang, Q.; Yao, X.; Yue, Q.; Xu, S. What Drives the Changing Characteristics of Phytoplankton in Urban Lakes: Climate, Hydrology, or Human Disturbance? J. Environ. Manage. 2024, 351, 119966. [Google Scholar] [CrossRef]
Figure 1.
Map of the six urban lakes in Wuhan City, with land use types indicated by color-coded legends: Surface water (SW), forest vegetation (FV), building vegetation (BV), park vegetation (PV), road vegetation (RV), urban buildings (UB), rural buildings (RB), urban roads (UR, including roads and sidewalks), and bare land (BL).
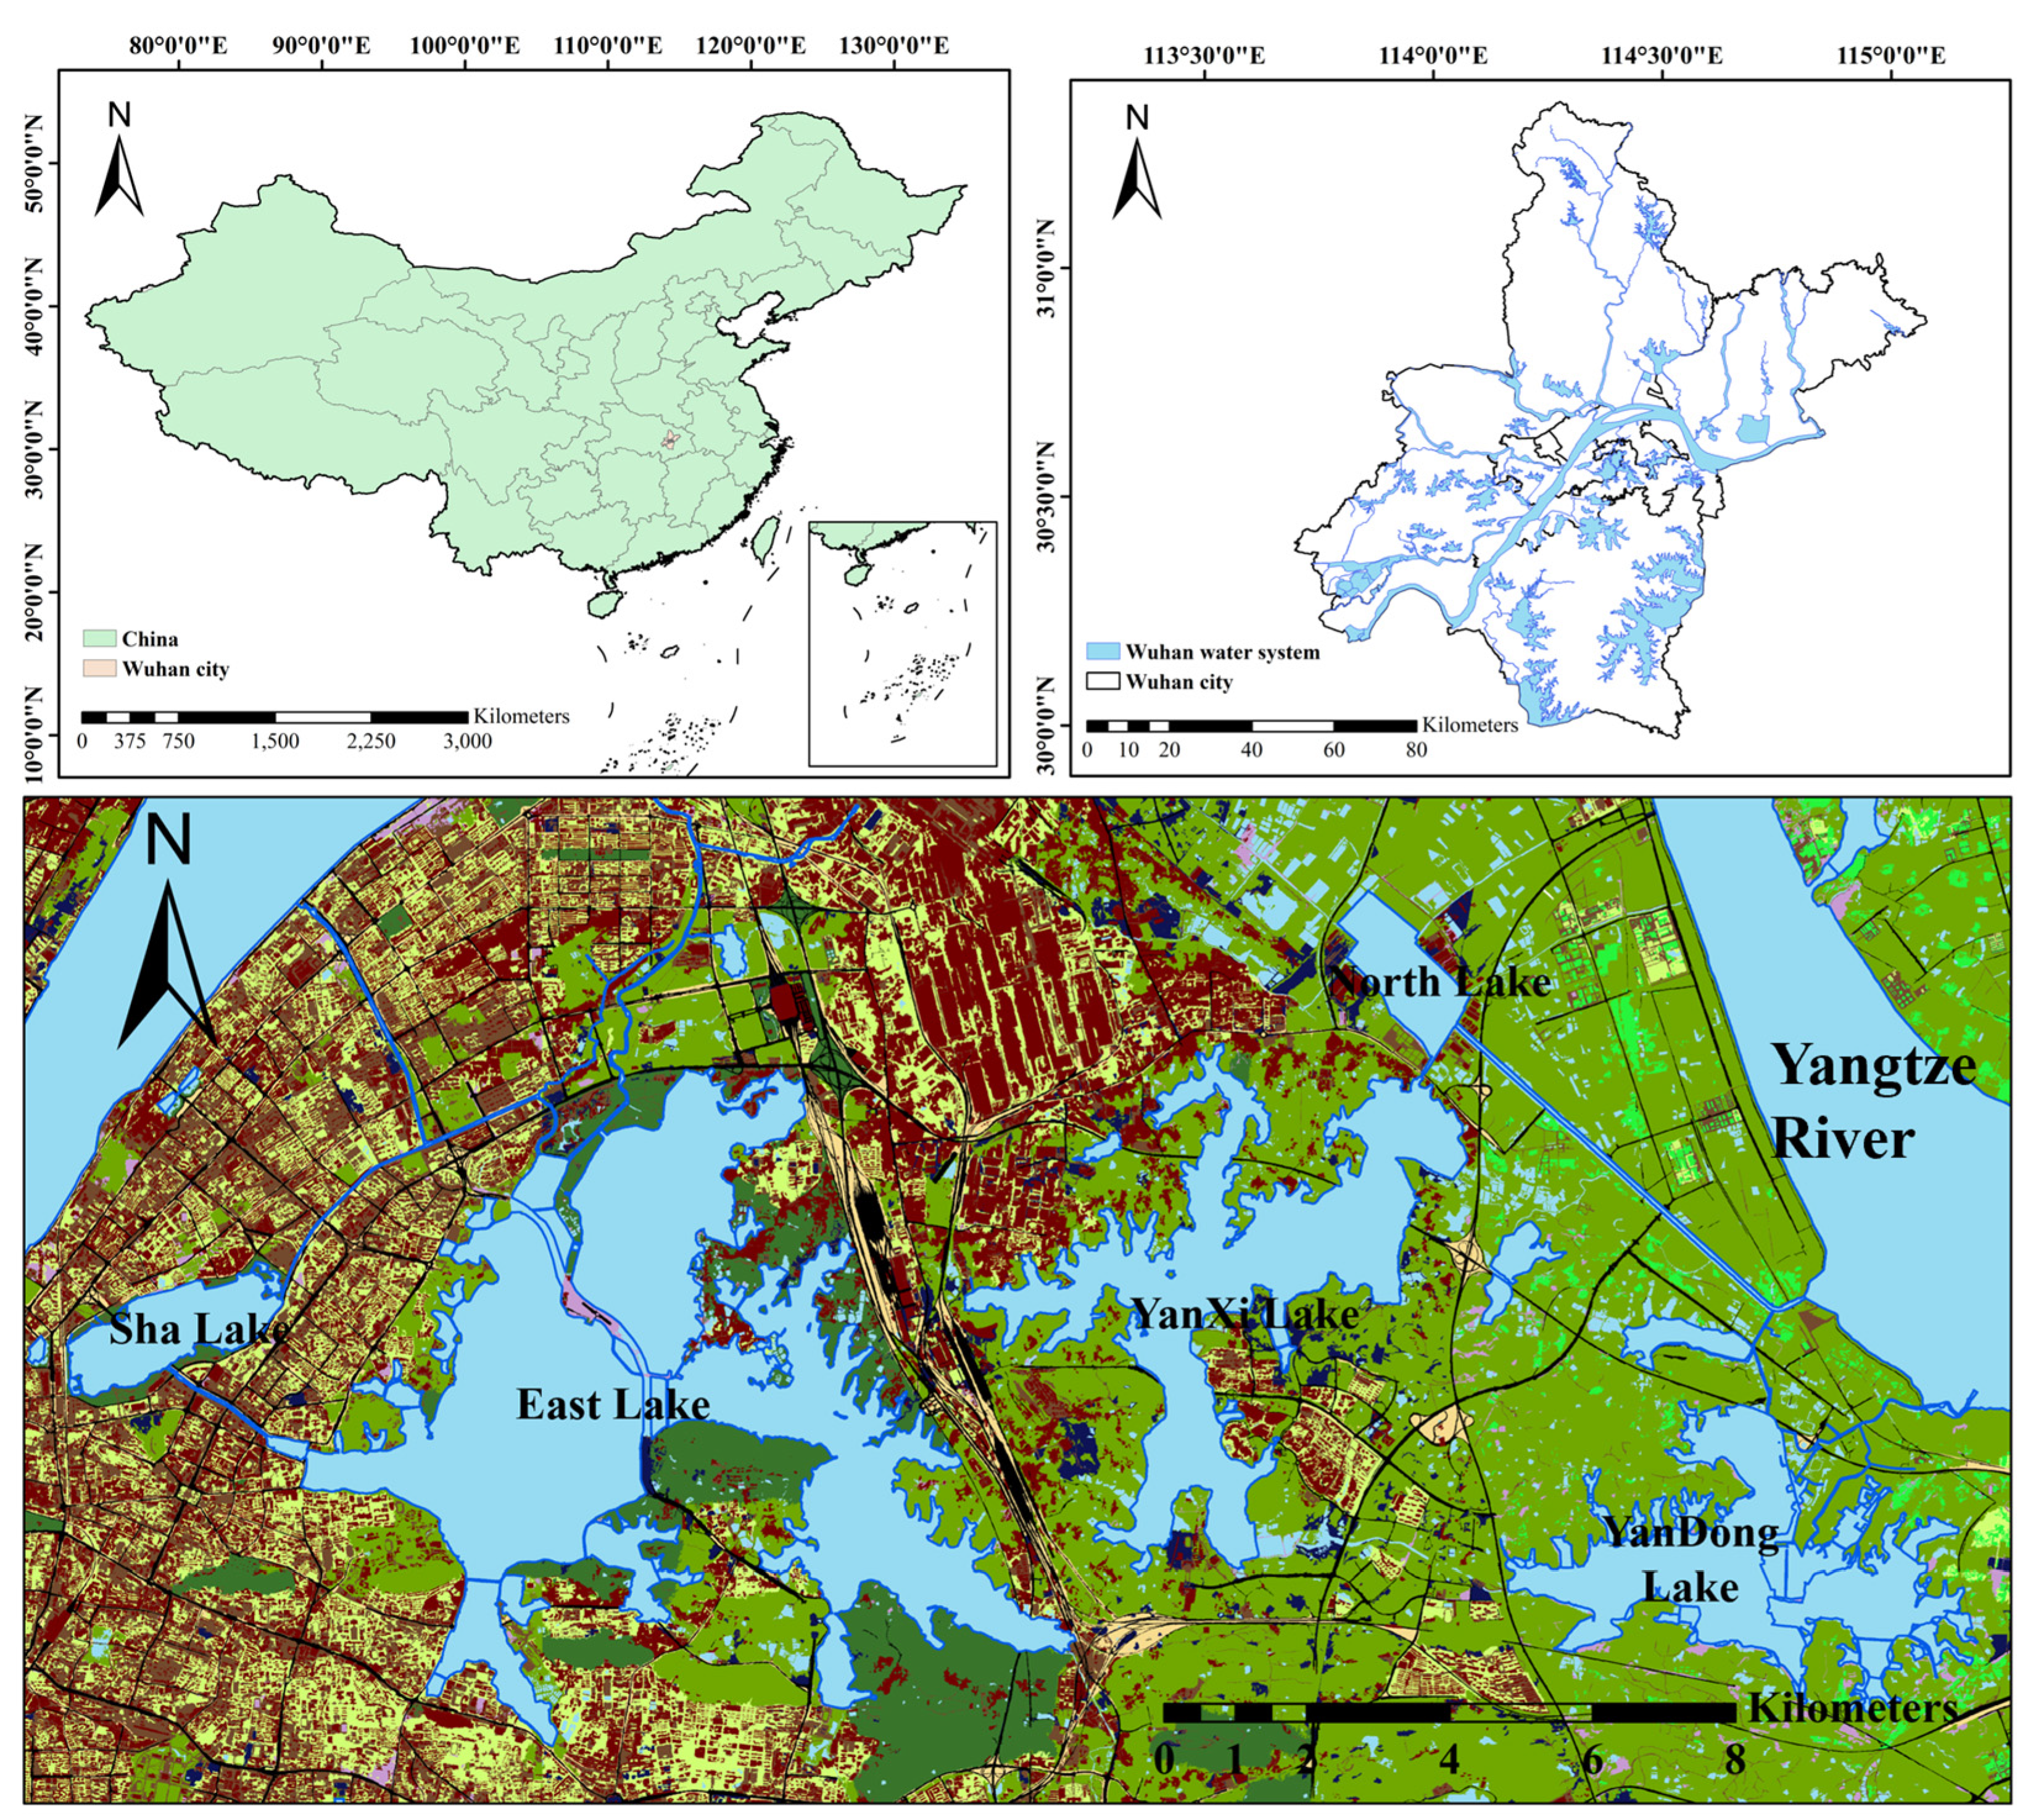
Figure 2.
Temporal variation of pollutant concentrations and WQI results in urban lakes.
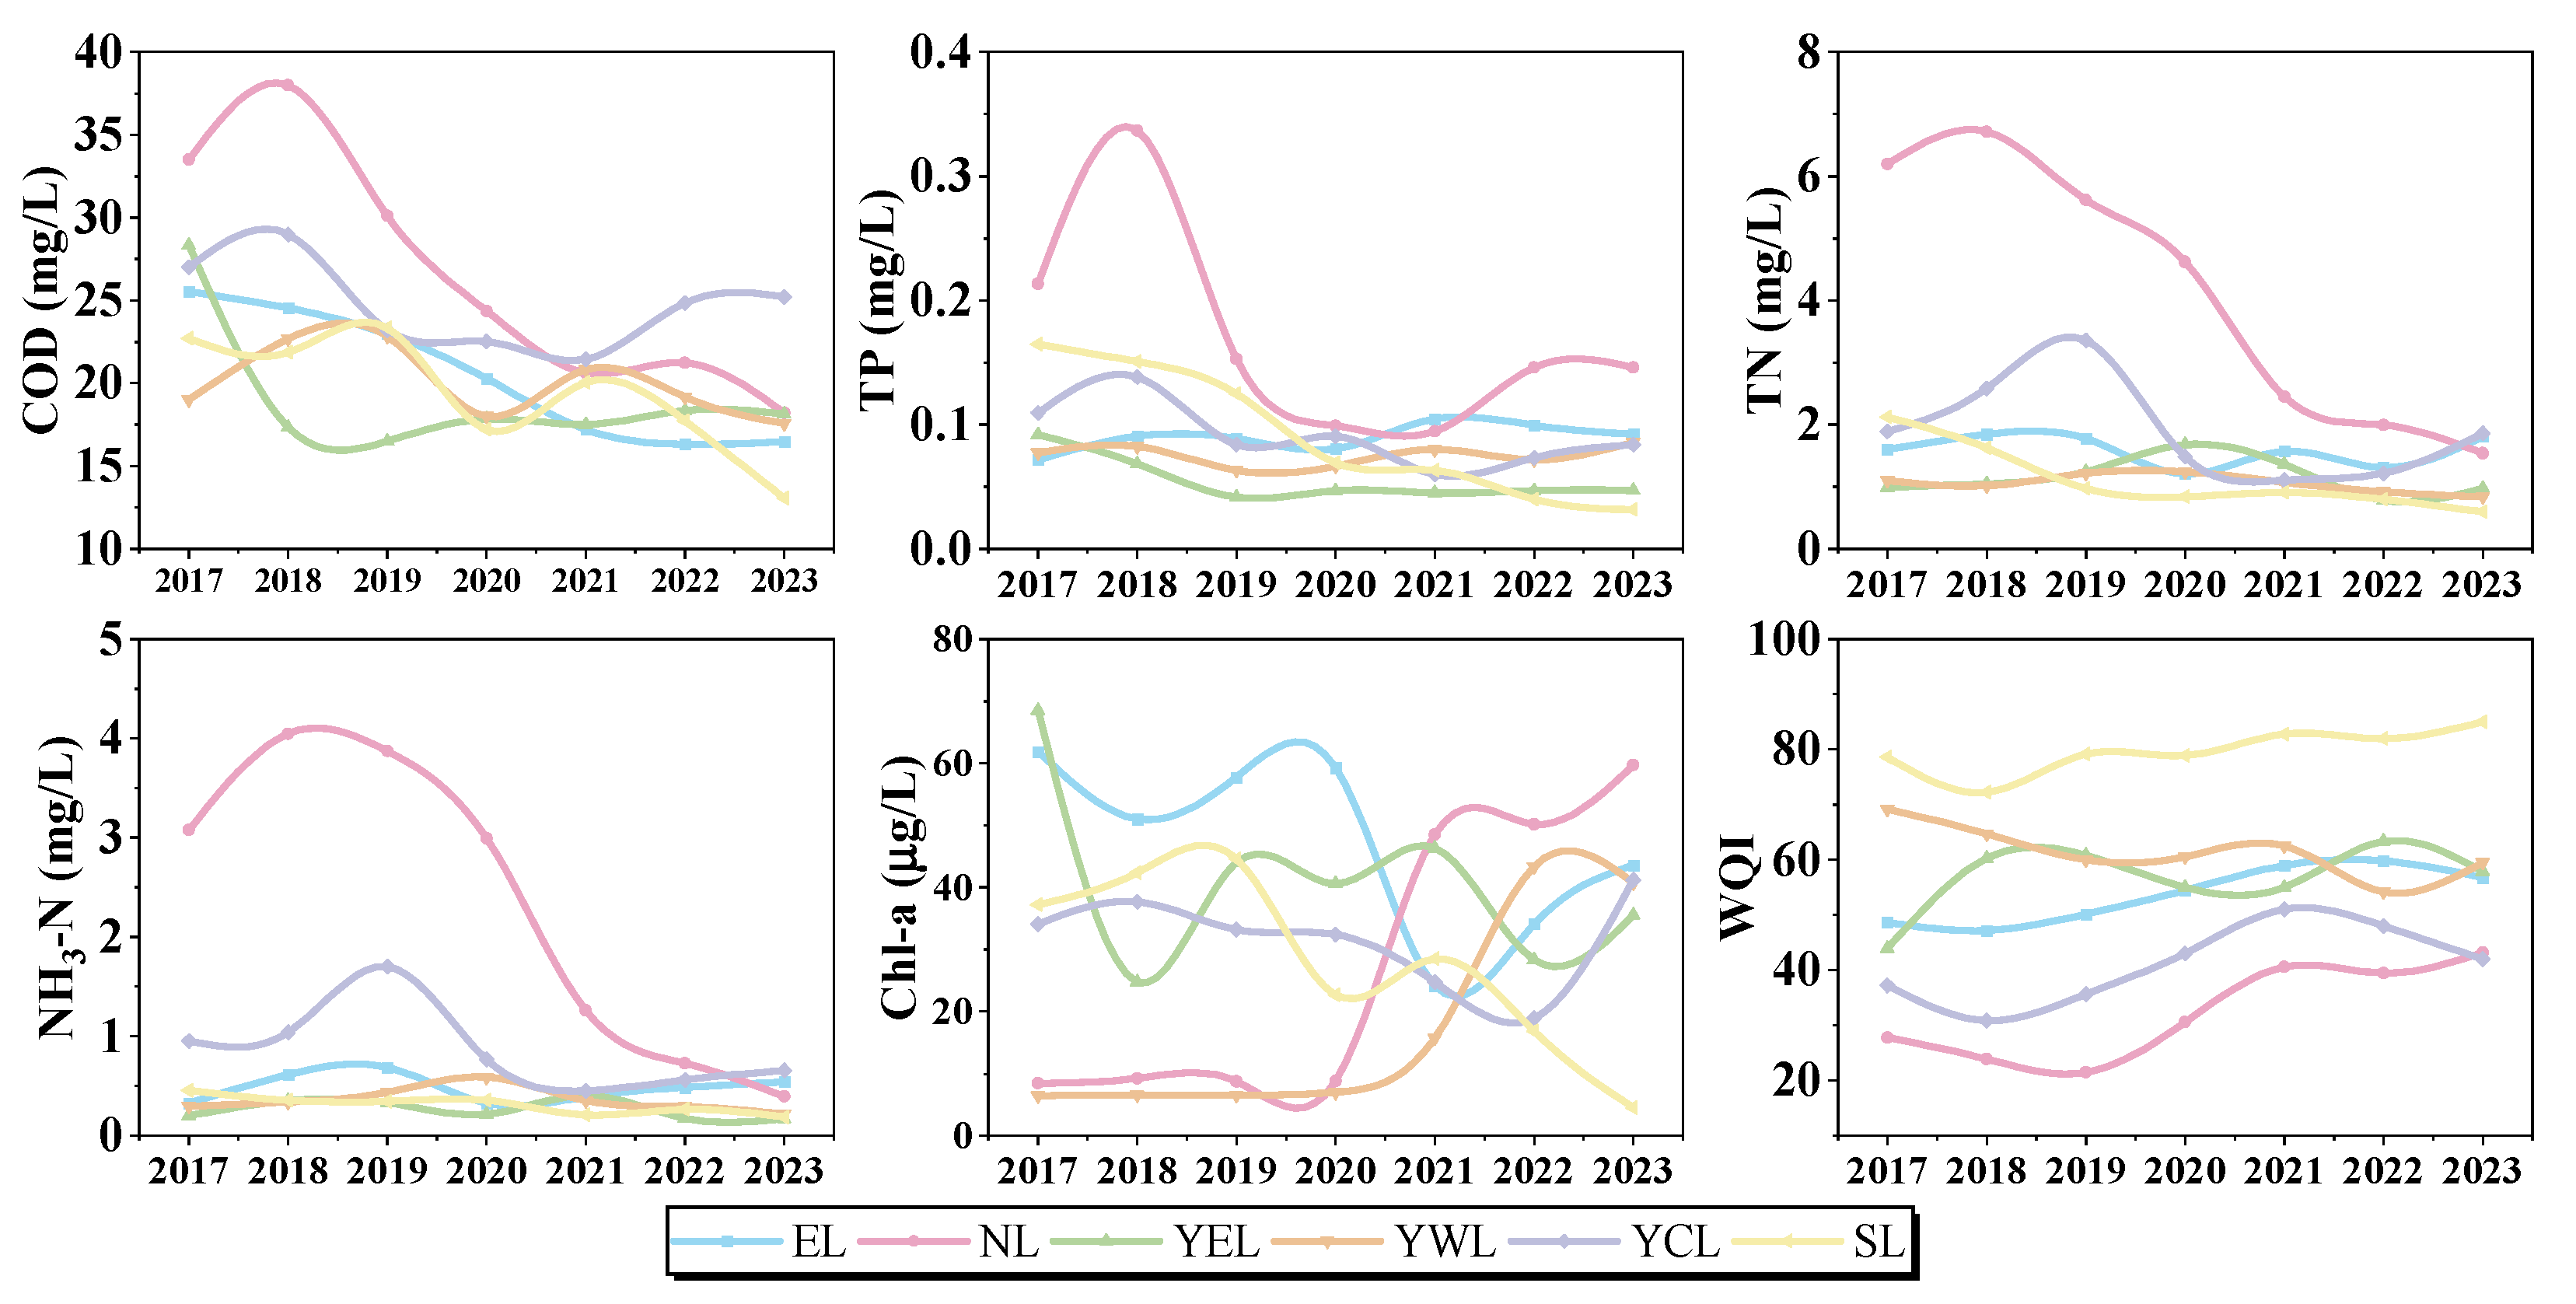
Figure 3.
Comparison of WQI values for each urban lake from 2017 to 2023, arranged from left to right by year for dry season (January) and rainy season (July).
Figure 3.
Comparison of WQI values for each urban lake from 2017 to 2023, arranged from left to right by year for dry season (January) and rainy season (July).
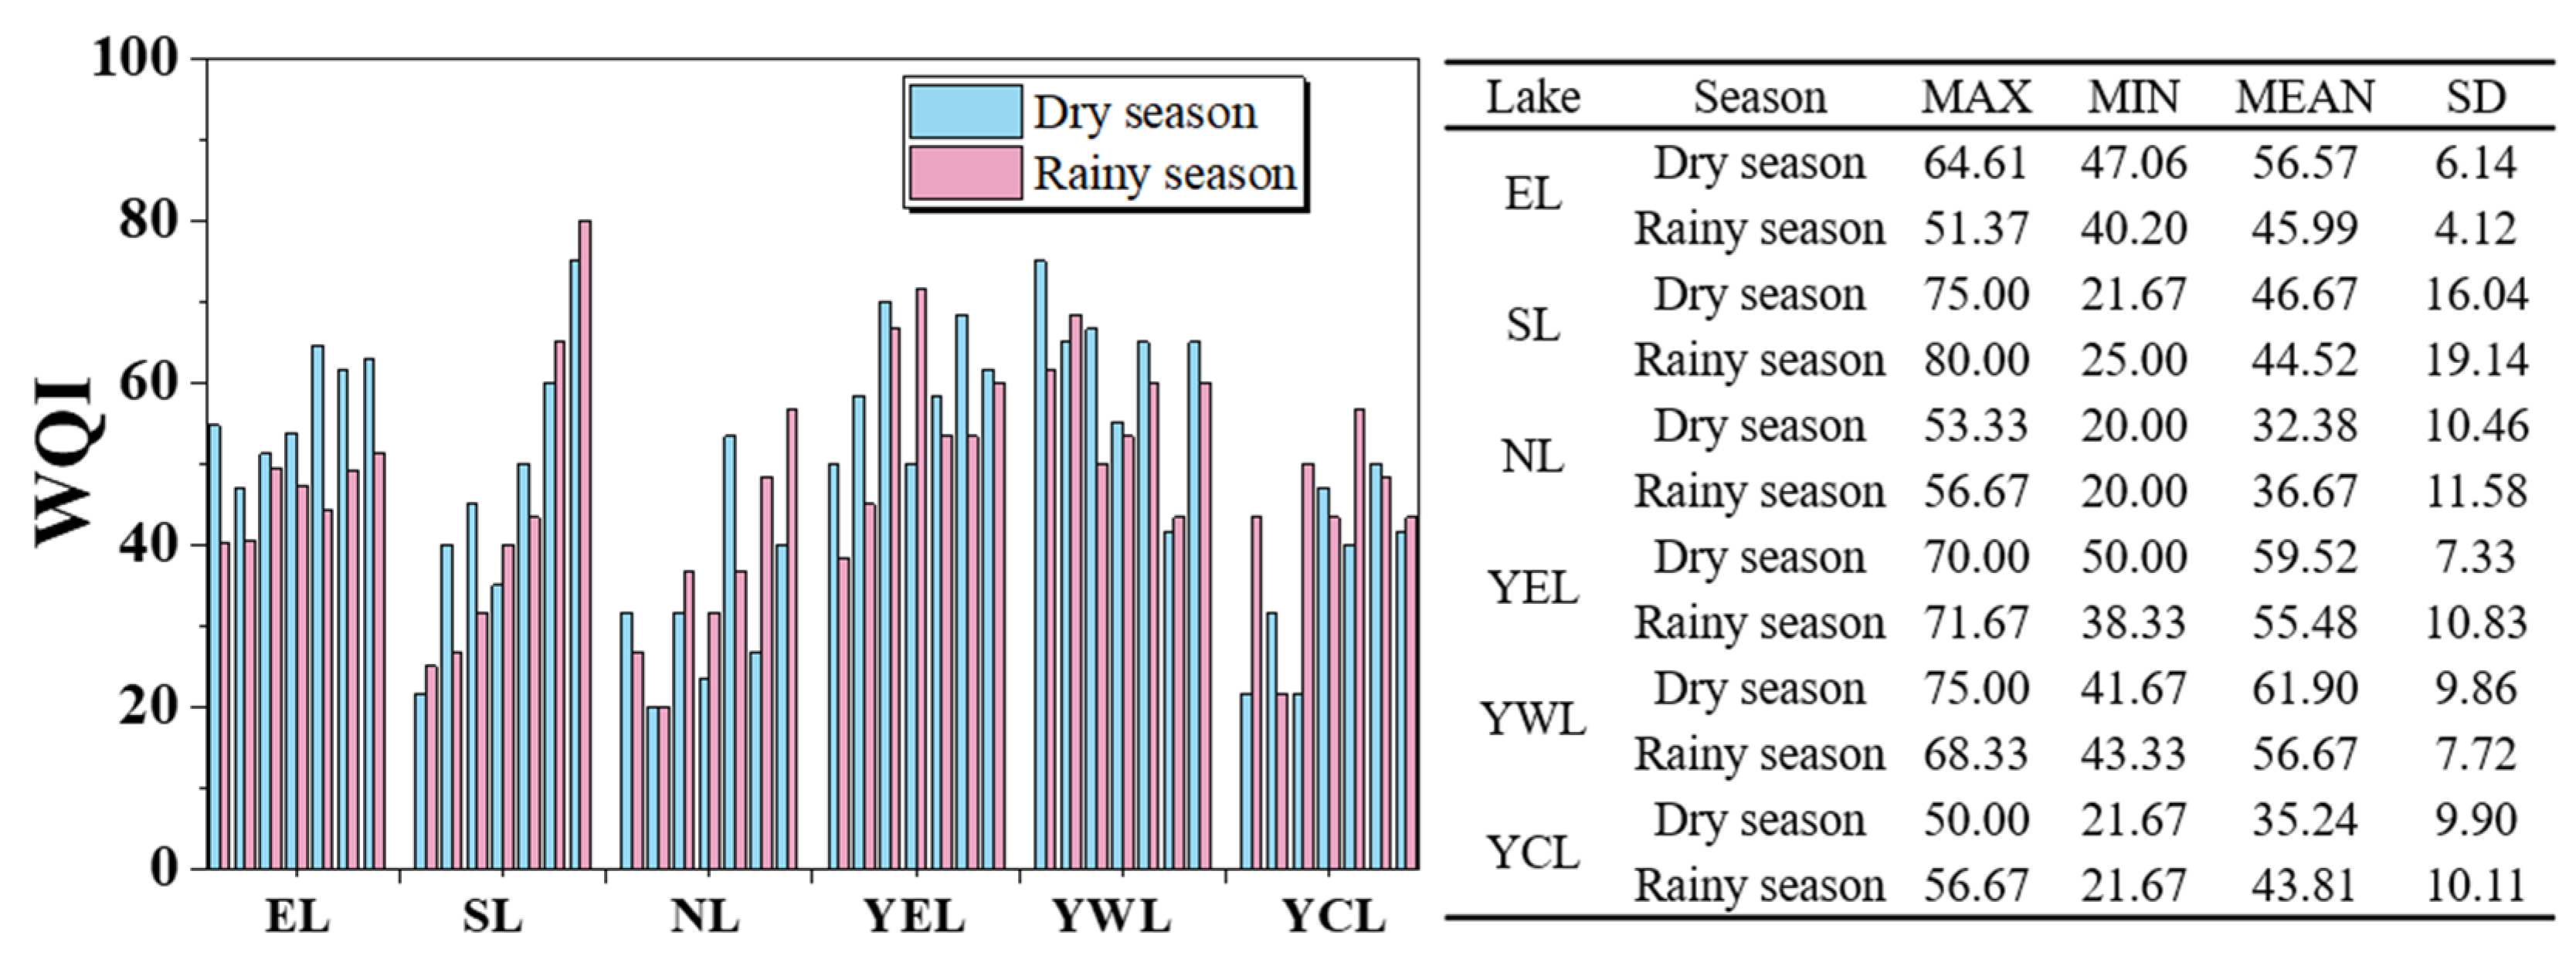
Figure 4.
Correlation analysis of water quality factors in urban lakes (a)EL, (b)SL, (c)YCL, (d)NL, (e)YEL, (f)YWL.
Figure 4.
Correlation analysis of water quality factors in urban lakes (a)EL, (b)SL, (c)YCL, (d)NL, (e)YEL, (f)YWL.
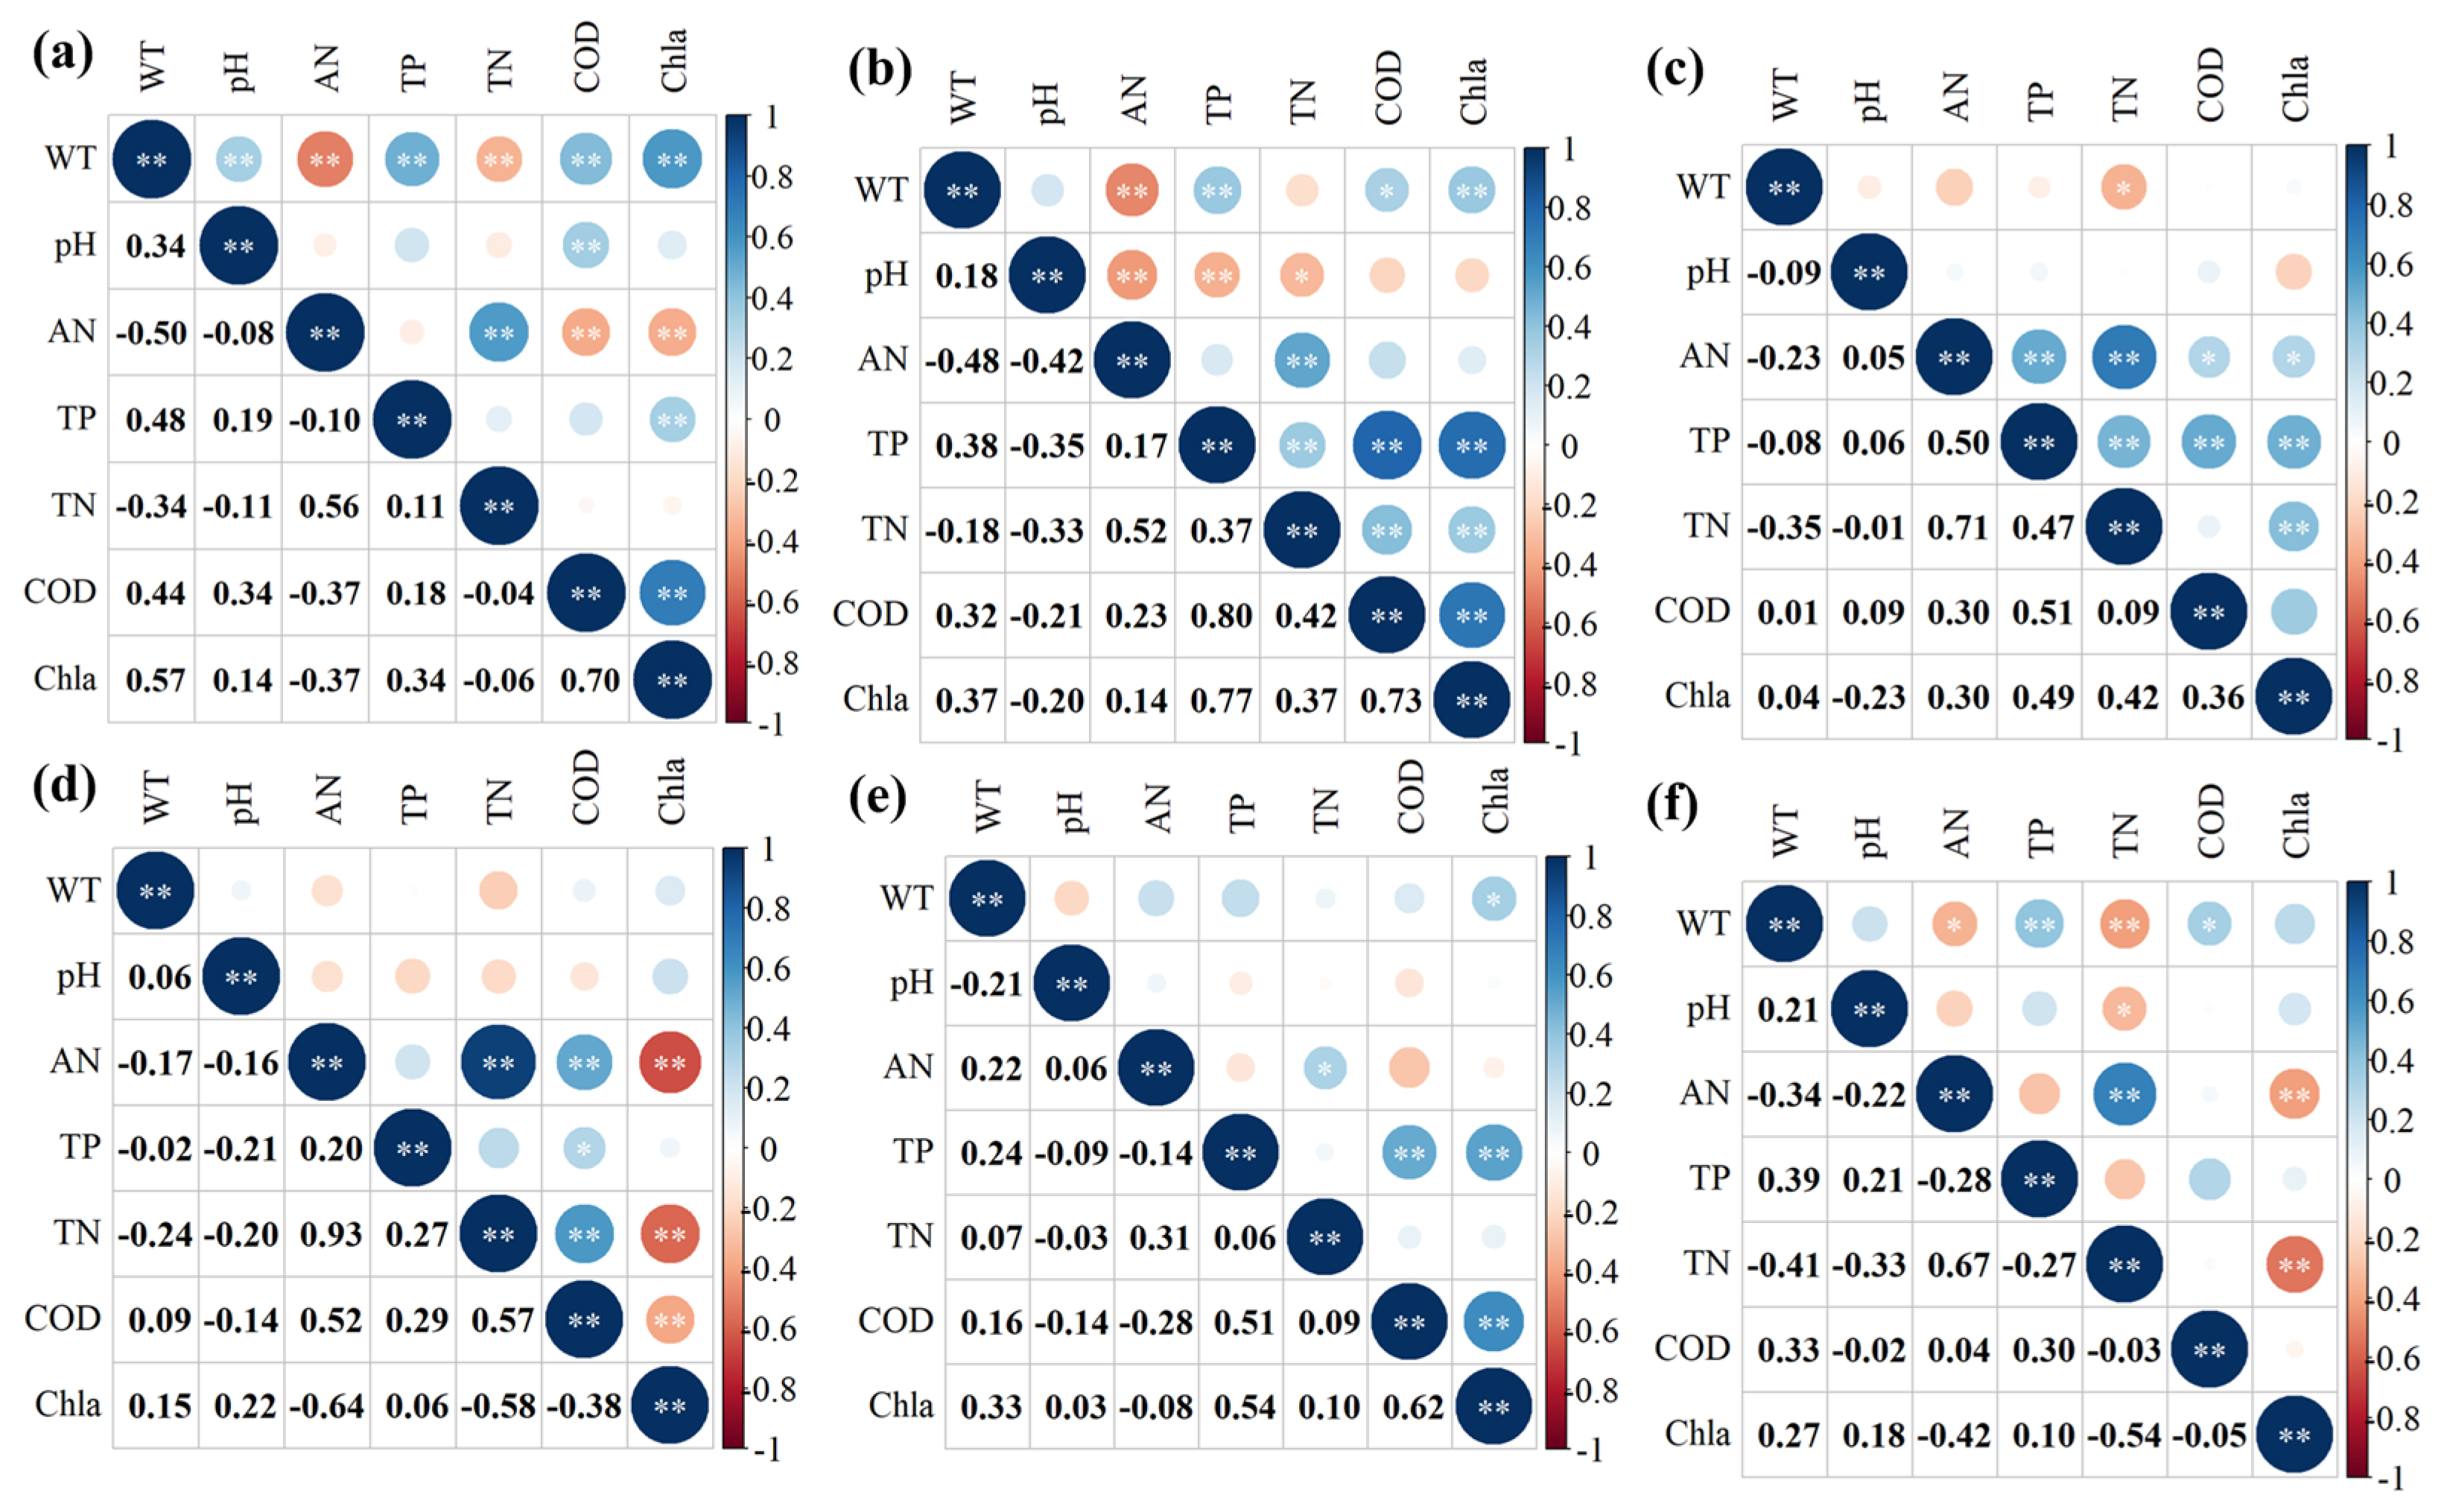
Figure 5.
Measured data points and RDA result graph. (a) Sampling point map, (b) The top three interpretable parameters, (c)-(d) RDA results for summer and winter.
Figure 5.
Measured data points and RDA result graph. (a) Sampling point map, (b) The top three interpretable parameters, (c)-(d) RDA results for summer and winter.
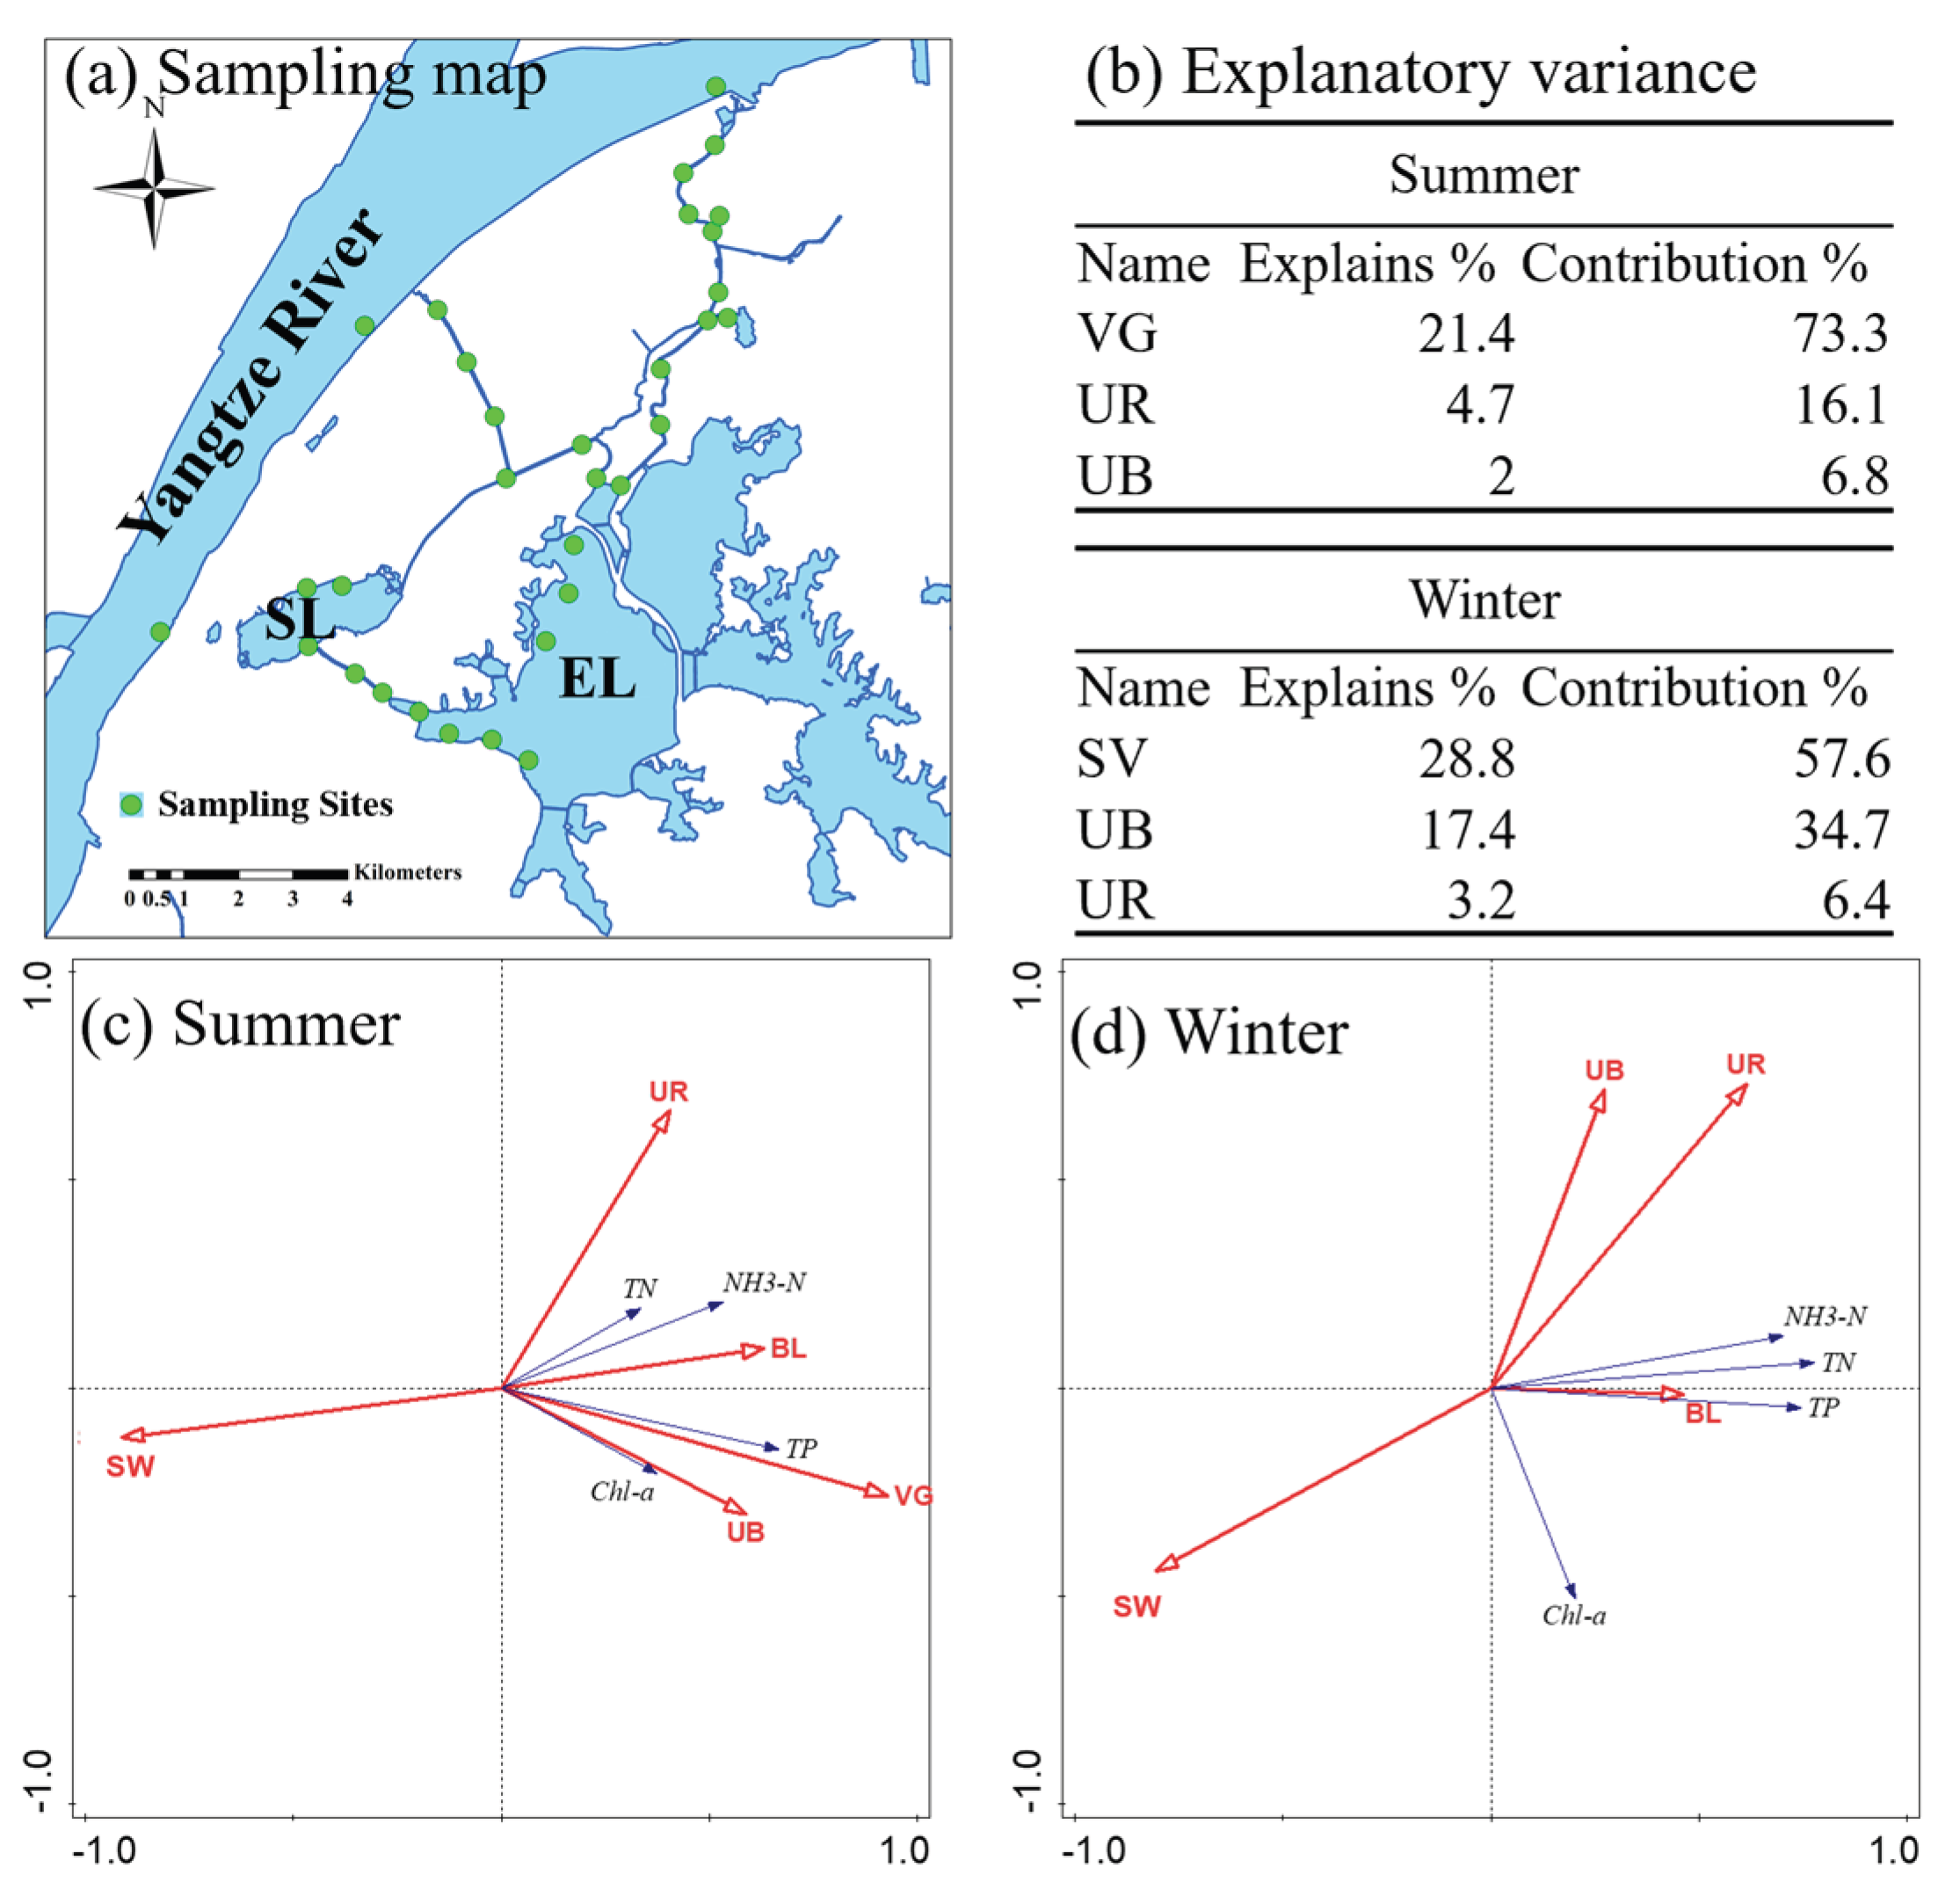

Table 1.
The normalization values and weights of water quality parameters used in the WQI calculation in this study.
Table 1.
The normalization values and weights of water quality parameters used in the WQI calculation in this study.
| Paramater | Weight | 100, I | 80, II | 60, III | 40, IV | 20, V | 0, worse than V |
| COD | 3 | <15 | <18 | <20 | <30 | <40 | ≥40 |
| TP | 1 | <0.02 | <0.1 | <0.2 | <0.3 | <0.4 | ≥0.4 |
| TN | 2 | <0.2 | <0.5 | <1.0 | <1.5 | <2.0 | ≥2.0 |
| NH3-N | 3 | <0.15 | <0.5 | <1 | <1.5 | <2 | ≥2.0 |
| Chl-a | 3 | <1 | <10 | <15 | <40 | <50 | ≥50 |
Table 2.
Percentage of land use types within a 500m buffer zone of urban lakes.
| Lakes | FR | BV | PV | RV | UB | RB | UR | BL | IS |
| EL | 21.68% | 11.17% | 29.71% | 2.91% | 15.13% | 0.00% | 15.04% | 4.37% | 30.17% |
| SL | 3.34% | 16.38% | 16.66% | 5.99% | 16.39% | 0.00% | 39.08% | 2.16% | 55.48% |
| YCL | 50.31% | 4.92% | 2.91% | 8.84% | 9.22% | 0.00% | 22.13% | 1.67% | 31.35% |
| NL | 65.06% | 0.07% | 0.00% | 0.79% | 12.58% | 0.20% | 12.31% | 8.99% | 25.09% |
| YEL | 84.03% | 1.00% | 0.00% | 0.16% | 0.11% | 4.15% | 2.49% | 8.06% | 6.75% |
| YWL | 65.89% | 3.54% | 0.51% | 0.73% | 16.24% | 0.19% | 7.01% | 5.90% | 23.44% |
Disclaimer/Publisher’s Note: The statements, opinions and data contained in all publications are solely those of the individual author(s) and contributor(s) and not of MDPI and/or the editor(s). MDPI and/or the editor(s) disclaim responsibility for any injury to people or property resulting from any ideas, methods, instructions or products referred to in the content. |
© 2025 by the authors. Licensee MDPI, Basel, Switzerland. This article is an open access article distributed under the terms and conditions of the Creative Commons Attribution (CC BY) license (http://creativecommons.org/licenses/by/4.0/).
Copyright: This open access article is published under a Creative Commons CC BY 4.0 license, which permit the free download, distribution, and reuse, provided that the author and preprint are cited in any reuse.


