
Submitted:
26 November 2025
Posted:
26 November 2025
You are already at the latest version
Abstract
Biochar is recognized for its ability to improve soil chemical, physical, and biological properties, thereby enhancing crop productivity. However, the effects of biochar on photosynthetic and transpiration traits in rice crop–soil systems, particularly through the lens of on-site data subjected to Box–Cox transformation, remain insufficiently explored. To address this, a two-factor randomized block design experiment was conducted using the rice cultivar Nanjiang 9108 at the Agricultural Meteorology Experimental Station of Nanjing University of Information Science and Technology over the 2022–2023 growing seasons. This study investigated changes in leaf photosynthetic and transpiration parameters under combined applications of biochar (0, 15, and 30 t/ha) and nitrogen fertilizer (0, 180, 225, and 300 kg/ha). Application of the Box–Cox transformation substantially improved data normality and variance homogeneity, enabling the development of a robust predictive model linking net photosynthetic rate to environmental factors. A two-way ANOVA further revealed that both the high nitrogen (300 kg/ha) with high biochar (30 t/ha) treatment and the conventional nitrogen (225 kg/ha) with moderate biochar (15 t/ha) treatment significantly enhanced rice photosynthetic and transpiration performance. Of particular note, the N225B15 treatment effectively balancing yield objectives with ecological considerations, which is recommended as an optimal fertilization strategy for sustainable rice production. These results underscore the synergistic role of moderate biochar and nitrogen inputs in improving key physiological traits of rice, supporting higher crop yields.
Keywords:
biochar fertilizer
; nitrogen
; photosynthetic characteristics
; transpiration characteristics
; data transformation
1. Introduction
Rice (Oryza sativa L.) is a principal global food crop, playing a pivotal role in ensuring food security for over half of the world’s population [1]. With the global population projected to reach 9.7 billion by 2050, increasing rice yield and stability has become a paramount challenge, especially in the context of climate change and resource constraints [2]. Photosynthesis and transpiration are two fundamental physiological processes that directly determine rice growth and productivity [3]. Photosynthesis provides the foundational material and energy for yield formation, while transpiration drives nutrient transport and regulates leaf temperature, jointly influencing water and nutrient use efficiency [4]. Therefore, precisely quantifying and optimizing these physiological traits is essential for enhancing rice productivity.
Biochar, a carbon-rich solid material produced through the pyrolysis of biomass under oxygen-limited conditions, has emerged as a promising soil amendment and fertilizer carrier in sustainable agriculture [5]. Its high porosity, extensive specific surface area, and abundant functional groups enable biochar to improve soil structure, enhance water retention, increase nutrient availability, and stimulate microbial activity [6]. Recent studies have demonstrated that biochar application significantly enhances soil quality and crop performance. For instance, biochar combined with organic fertilizers increases the abundance of functional microorganisms and improves agroecosystem multifunctionality [7]. Furthermore, modified biochar can immobilize beneficial bacteria, facilitating nutrient release and positively shaping soil microbial community structure and activity [8].
The application of biochar-based fertilizers has shown substantial potential in improving rice growth and soil health. Combining biochar with reduced chemical fertilization not only maintains but often enhances crop yield while ameliorating soil biological properties and fertilizer utilization efficiency [9,10]. Specifically, in paddy systems, biochar application improves soil pore structure, thereby promoting root development and increasing rice productivity [11]. Long-term field experiments have confirmed that biochar, when applied with nitrogen fertilizer, improves soil quality and sustains grain yield, as observed in semiarid environments [12]. Recent research further indicates that biochar combined with no-tillage practices enhances the yield and grain quality of ratoon rice [13].
A key mechanism behind biochar-induced yield improvement lies in its positive effects on photosynthetic performance. For example, peanut shell biochar increases rice yield in saline-alkali paddy fields by regulating leaf ion concentrations and significantly enhancing the photosynthesis rate [14]. Under alternate wetting and drying irrigation, biochar application improves rice growth performance and nutrient use efficiency, partly attributable to improved photosynthetic characteristics [15]. Simultaneously, biochar significantly influences rice water relations and transpiration regulation. Studies on upland rice have shown that eucalyptus biochar increases total transpirable soil water, alters the soil water threshold, and modifies the transpiration response to water deficit, thereby improving water use efficiency under drought stress [16]. This suggests that biochar can help rice maintain a more stable transpiration rate and mitigate the negative impacts of water scarcity [17].
Despite these documented benefits, a significant research gap persists. Many field studies on biochar’s effects on rice physiology report data that violate the key assumptions of parametric statistical analyses, namely independence, normality, and homogeneity of variances [18]. The reliance on raw, often non-normal data can lead to biased estimates and reduce the robustness of conclusions regarding the effects of field treatments [19]. The Box-Cox transformation provides a powerful, family-based approach to normalize skewed data and stabilize variances, thereby improving the validity and reliability of subsequent parametric tests like ANOVA [20]. Its application in agricultural and plant physiological research remains limited but is critical for deriving accurate inferences from complex field experiments.
Therefore, the objectives of this study were: (1) to apply the Box-Cox transformation to normalize in-situ measured photosynthetic and transpiration data from a paddy system amended with different biochar fertilizers, and (2) to quantitatively evaluate the effects of these amendments on rice photosynthetic efficiency, transpiration regulation, and water use efficiency. This statistical approach will provide a more rigorous basis for optimizing biochar application strategies and advancing sustainable rice production systems.
2. Materials and Methods
2.1. Experimental Design
The experiment was conducted in 2022 and 2023 at a site located at 32°12′N, 118°42′E. The soil at the site was characterized as gray mottled hydric paddy soil. Biochar utilized in the study was produced from rice straw. The rice cultivar employed was Nanjing 9108. Detailed information regarding its growth stages is presented in Table 1, while daily air temperature and precipitation data throughout the growth period of rice are illustrated in Figure 1.
This study used a randomized block design with two factors. For nitrogen fertilizer (pure N), four levels were set: N0 (no nitrogen), N180 (reduced nitrogen at 180 kg/hm2), N225 (conventional nitrogen at 225 kg/hm2), and N300 (high nitrogen at 300 kg/hm2). For biochar, three levels were used: B0 (no biochar), B15 (low biochar at 15 t/hm2), and B30 (high biochar at 30 t/hm2). This created 12 treatment combinations. Each plot was 40 m2 (8×5 m). Before fertilization, plots were separated by field ridges, covered with black plastic film, and partitioned with boards to prevent water and fertilizer mixing between treatments. Field management and pest control followed local high - yield rice - growing standards.
2.2. Measurement Indices and Methods
SPAD value measurement: From the tillering stage of rice to the milky stage, the SPAD-502plus chlorophyll meter was used for measurement. Five healthy main stems were randomly selected in each plot. For the tillering stage, the flag leaf was chosen, while for other stages, the fully expanded sword leaf was selected. The SPAD values were measured at the upper 1/3, middle, and lower 1/3 of the sword leaf. The average of the three measurements was taken as the SPAD value for the leaf. Measurements were taken every seven days, and records were maintained.
Measurement of Photosynthetic Parameters: During each growth stage of rice, photosynthetic characteristics were measured on 5 representative rice plants in each plot using a portable photosynthesis system (Licor-6400, LI-COR Inc., USA) between 9:00 and 11:00 a.m. on sunny days. The measurements included the net photosynthetic rate (Pn), transpiration rate (Tr), stomatal conductance (Gs), and intercellular CO2 concentration (Ci) of each flag leaf. For each index, 6 sets of data were recorded at the middle part of the leaf.
2.3. Box-Cox Transformation
Two - factor ANOVA requires data independence, normality, and homogeneity of variances. However, the data from this experiment were found to not meet these prerequisites.
A two - factor randomized block design was used in the experiment. Treatments were randomly assigned to plots, which were isolated using field ridges, black plastic film, and partition boards to prevent water and fertilizer contamination between plots. These measures ensured data independence to some extent.
Normality requires that data follow a normal distribution. To test normality, the Shapiro-Wilk test was applied to leaf SPAD values, Pn, Tr, Gs, Ci, and WUE data across treatments and periods. The small sample size made the Shapiro-Wilk test (P>0.05) more suitable, but some data didn’t meet normal - distribution requirements.
Homogeneity of variance means that the variances of data in each treatment group should be approximately equal. The Levene test method is used to detect the status of homogeneity of variance. Levene test is a method for testing whether the variances among two or more samples are homogeneous. In 1974, it was extended so that the data transformation of the original data can use not only the absolute difference between the data and the arithmetic mean, but also the absolute difference between the data and the median and the trimmed mean, thus broadening its application.
The data of this experiment were tested by the Levene test method (P>0.05). It was found that most of the data were heterogeneous in variance based on the mean value, while most of them were homogeneous in variance based on the median. Considering that the mean value can be significantly affected by extreme values in the data. In field observation data, due to environmental factors, measurement errors, etc., extreme numerical points may appear. These extreme values will increase the variance calculated based on the mean value, making it easier to draw the conclusion of heterogeneous variance. The median, on the other hand, is the value in the middle position after arranging the data in ascending or descending order. It is not affected by extreme values. In field observation data, the median will not change due to extreme values, and it can more robustly reflect the true situation of the central tendency and degree of dispersion of the data. Therefore, in the Levene test, it is more likely to draw the conclusion of homogeneous variance [21].
Since the data do not meet the requirements of normality and homogeneity of variance, data transformation methods such as logarithmic transformation and square - root transformation are carried out to attempt to improve the distribution characteristics of the data, so as to meet the conditions of two - factor analysis of variance. This ensures the accurate exploration of the changes in the photosynthetic and transpiration characteristics of rice after applying different proportions of carbon and nitrogen, and provides a theoretical basis for the effective management of the rice growth and development process.
Box-Cox transformation is a mathematical method commonly used in data statistical processing by which a non-normally distributed time series could be transformed to normal one [22]. The Box- Cox transformation takes the form:
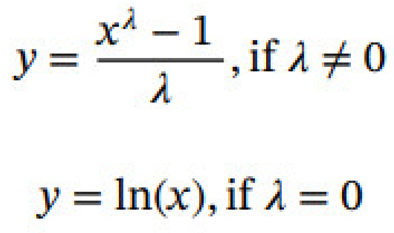
where x is the original value in a given dataset, and λ is the comfiguration parameter. The selection of an optimal λ is the initial step in the Box-Cox procedure, which aims to achieve the best possible normal distribution for the new variable y. The value of the λ often varies between –5 and 5. This procedure is frequently accomplished by employing the maximum likelihood method.
Box-Cox transformation significantly improved data normality and variance homogeneity based on the median (Table 2, 3). However, the data of net photosynthetic rate (Pn) and intercellular CO2 concentration (Ci) at the maturity stage in 2022, as well as Pn at the grain filling and ripening stage and Ci at the maturity stage in 2023, still failed to meet the prerequisites for two-way ANOVA after various transformation methods. Considering that only a few periods of Pn and Ci indicators did not meet the prerequisites for two-way ANOVA, the data of periods that did not meet the conditions were abandoned, while the data of each period of other indicators all met the requirements for two-way ANOVA. The transformed data were subjected to two-way ANOVA using IBM SPSS Statistics 26.

Table 2.
Normality of measured indices at each growth stage of rice after Box-Cox transformation.
| Year | measurement index | Tillering |
Jointing and booting |
Heading and flowering |
Filling | Maturity |
| 2022 | Chlorophyll SPAD value | 0.218 | 0.841 | 0.411 | 0.201 | 0.448 |
| Net photosynthetic rate (Pn) | 0.631 | 0.195 | 0.149 | 0.650 | 0.001 | |
| Transpiration rate (Tr) | 0.959 | 0.229 | 0.886 | 0.617 | 0.918 | |
| Stomatal conductance (Gs) | 0.056 | 0.401 | 0.869 | 0.115 | 0.233 | |
| Intercellular CO2 concentration (Ci) | 0.464 | 0.056 | 0.569 | 0.828 | 0.004 | |
| Water use efficiency (WUE) | 0.356 | 0.972 | 0.853 | 0.810 | 0.662 | |
| 2023 | Chlorophyll SPAD value | 0.265 | 0.073 | 0.909 | 0.064 | 0.205 |
| Net photosynthetic rate (Pn) | 0.081 | 0.662 | 0.637 | 0.014 | 0.380 | |
| Transpiration rate (Tr) | 0.537 | 0.602 | 0.394 | 0.521 | 0.232 | |
| Stomatal conductance (Gs) | 0.528 | 0.502 | 0.670 | 0.519 | 0.118 | |
| Intercellular CO2 concentration (Ci) | 0.817 | 0.895 | 0.584 | 0.886 | 0.031 | |
| Water use efficiency (WUE) | 0.340 | 0.854 | 0.592 | 0.994 | 0.588 |
Table 3.
Homogeneity of variance of measured indices after Box-Cox transformation.
| Year | measurement index | Tillering |
Jointing and booting |
Heading and flowering |
Filling | Maturity |
| 2022 | Chlorophyll SPAD value | 0.961 | 0.903 | 0.840 | 0.637 | 0.940 |
| Net photosynthetic rate (Pn) | 0.674 | 0.341 | 0.586 | 0.447 | 0.628 | |
| Transpiration rate (Tr) | 0.540 | 0.426 | 0.733 | 0.944 | 0.880 | |
| Stomatal conductance (Gs) | 0.489 | 0.650 | 0.870 | 0.957 | 0.778 | |
| Intercellular CO2 concentration (Ci) | 0.346 | 0.876 | 0.999 | 0.650 | 0.540 | |
| Water use efficiency (WUE) | 0.173 | 0.432 | 0.984 | 0.183 | 0.502 | |
| 2023 | Chlorophyll SPAD value | 0.865 | 0.720 | 0.842 | 0.466 | 0.978 |
| Net photosynthetic rate (Pn) | 0.625 | 0.844 | 0.985 | 0.893 | 0.943 | |
| Transpiration rate (Tr) | 0.454 | 0.885 | 0.913 | 0.995 | 0.972 | |
| Stomatal conductance (Gs) | 0.641 | 0.909 | 0.993 | 0.975 | 0.848 | |
| Intercellular CO2 concentration (Ci) | 0.558 | 0.903 | 0.689 | 0.864 | 0.965 | |
| Water use efficiency (WUE) | 0.988 | 0.891 | 0.983 | 0.979 | 0.980 |
3. Results
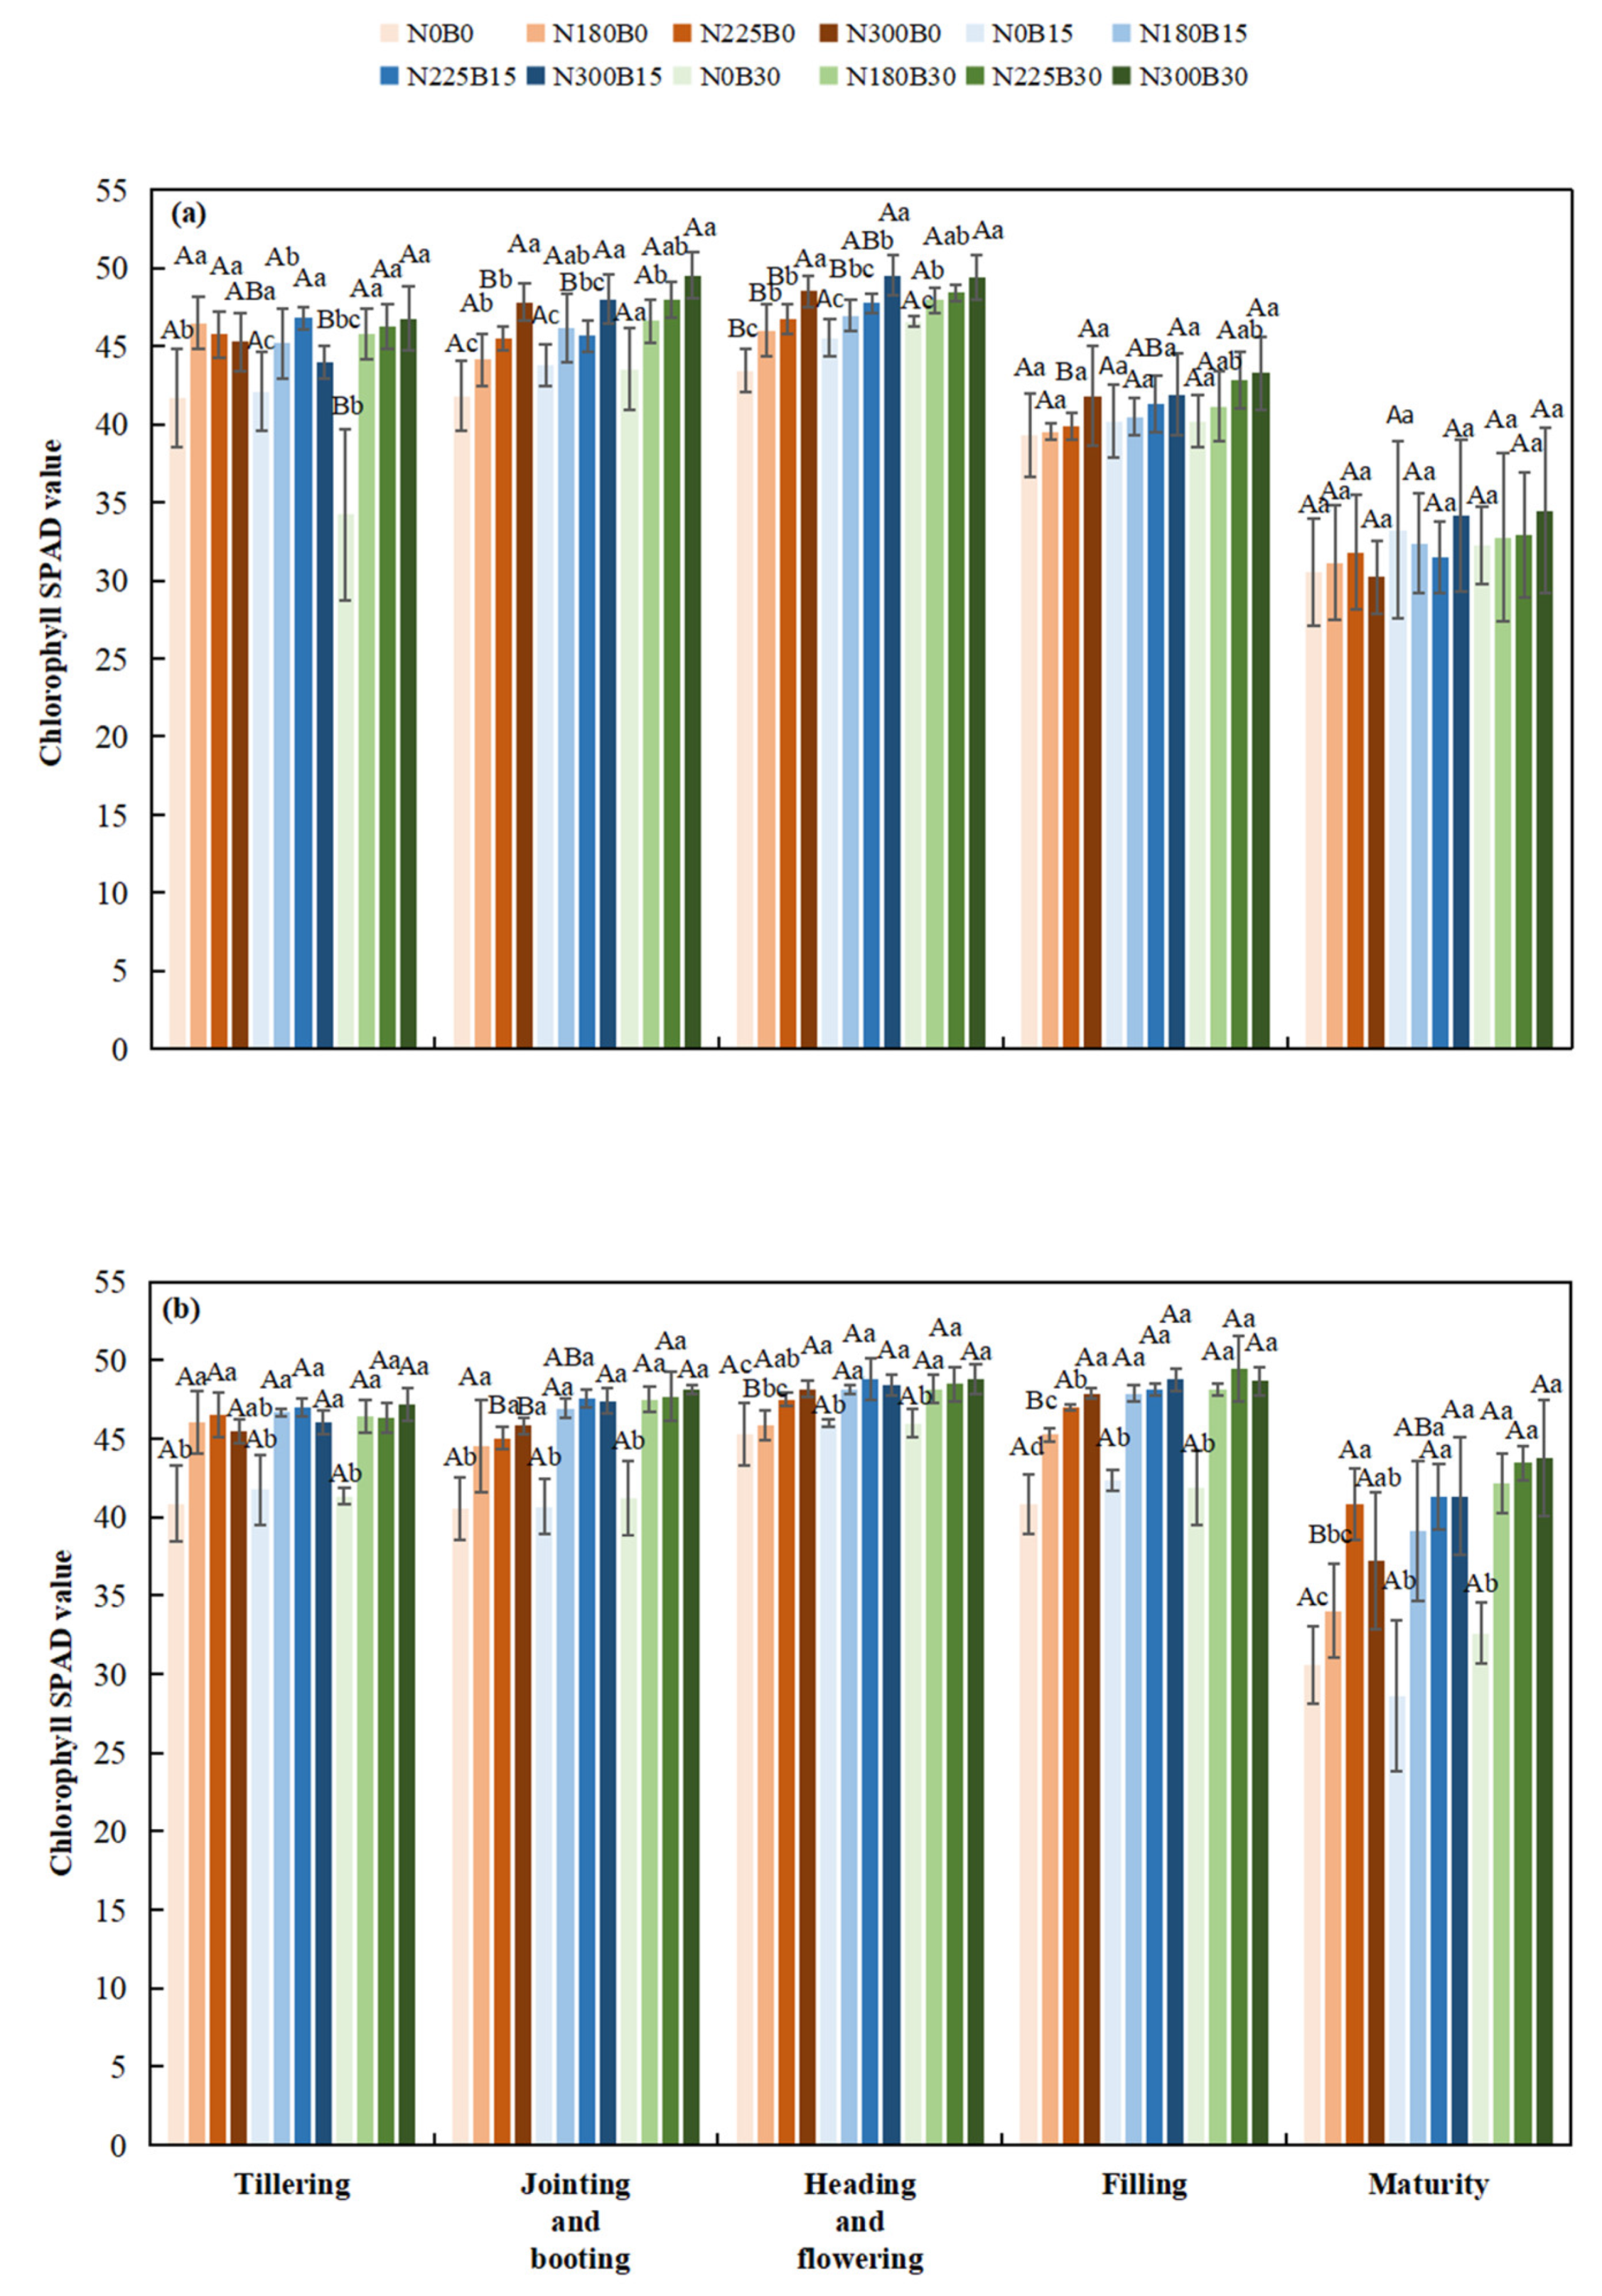
3.1. Effects of Biochar Fertilizer Application on Chlorophyll SPAD Value
The SPAD values of rice exhibited a biphasic pattern throughout its developmental stages. Initially, SPAD values increased beginning at the tillering stage, reaching their maximum during the heading to flowering or milky stages, followed by a subsequent decline as the rice approached maturation.
At the tillering stage, under the same nitrogen level, SPAD values increased as the biochar fertilizer level rose from B0 to B15 and B30. For instance, SPAD values for N180B15 and N180B30 were higher than those for N180B0. During heading - flowering, SPAD values remained relatively high in groups with biochar fertilizer, and in some cases, increased with higher biochar fertilizer levels. In milky and grain - filling stages and maturity stage, SPAD values decreased more slowly in treatments with biochar fertilizer, with some combinations still showing a slight advantage.
At the tillering and jointing-booting stages, the nitrogen level had an extremely significant effect on the SPAD value, and the SPAD value increased significantly with the increase in nitrogen level. The SPAD values of N225B0 and N300B0 treatments were higher than those of N0B0 and N180B0 treatments in these two stages. At the heading and flowering stage and filling stage, the SPAD values under high nitrogen treatments (N225, N300) mostly remained at a high level, while those under low nitrogen and nitrogen-free treatments (N0, N180) were relatively low. At the maturity stage, the SPAD values of all nitrogen treatments decreased, but the decrease was greater in nitrogen-free or low nitrogen treatments (N0, N180).
Biochar fertilizer had a significant effect on the SPAD value of rice at the jointing-booting stage in 2022 and 2023, and at the filling and maturity stages in 2023. Nitrogen had an extremely significant effect on the SPAD value of rice at the tillering, jointing-booting, and heading-flowering stages in 2022 and 2023, being a key factor affecting this value. The interaction between biochar and nitrogen had no significant effect on the SPAD value of rice in most cases, except for a significant effect at the tillering stage in 2022. Nitrogen-containing treatments (N180B0, N225B0, N300B0) had higher SPAD values than nitrogen-free treatments (N0B0) in most growth stages. Compared with pure nitrogen-containing treatments, nitrogen-containing treatments with biochar fertilizer addition (B15, B30) also showed differences in SPAD values
Figure 2.
Chlorophyll SPAD Values During Different Rice Growth Stages in 2022(a) and 2023(b).
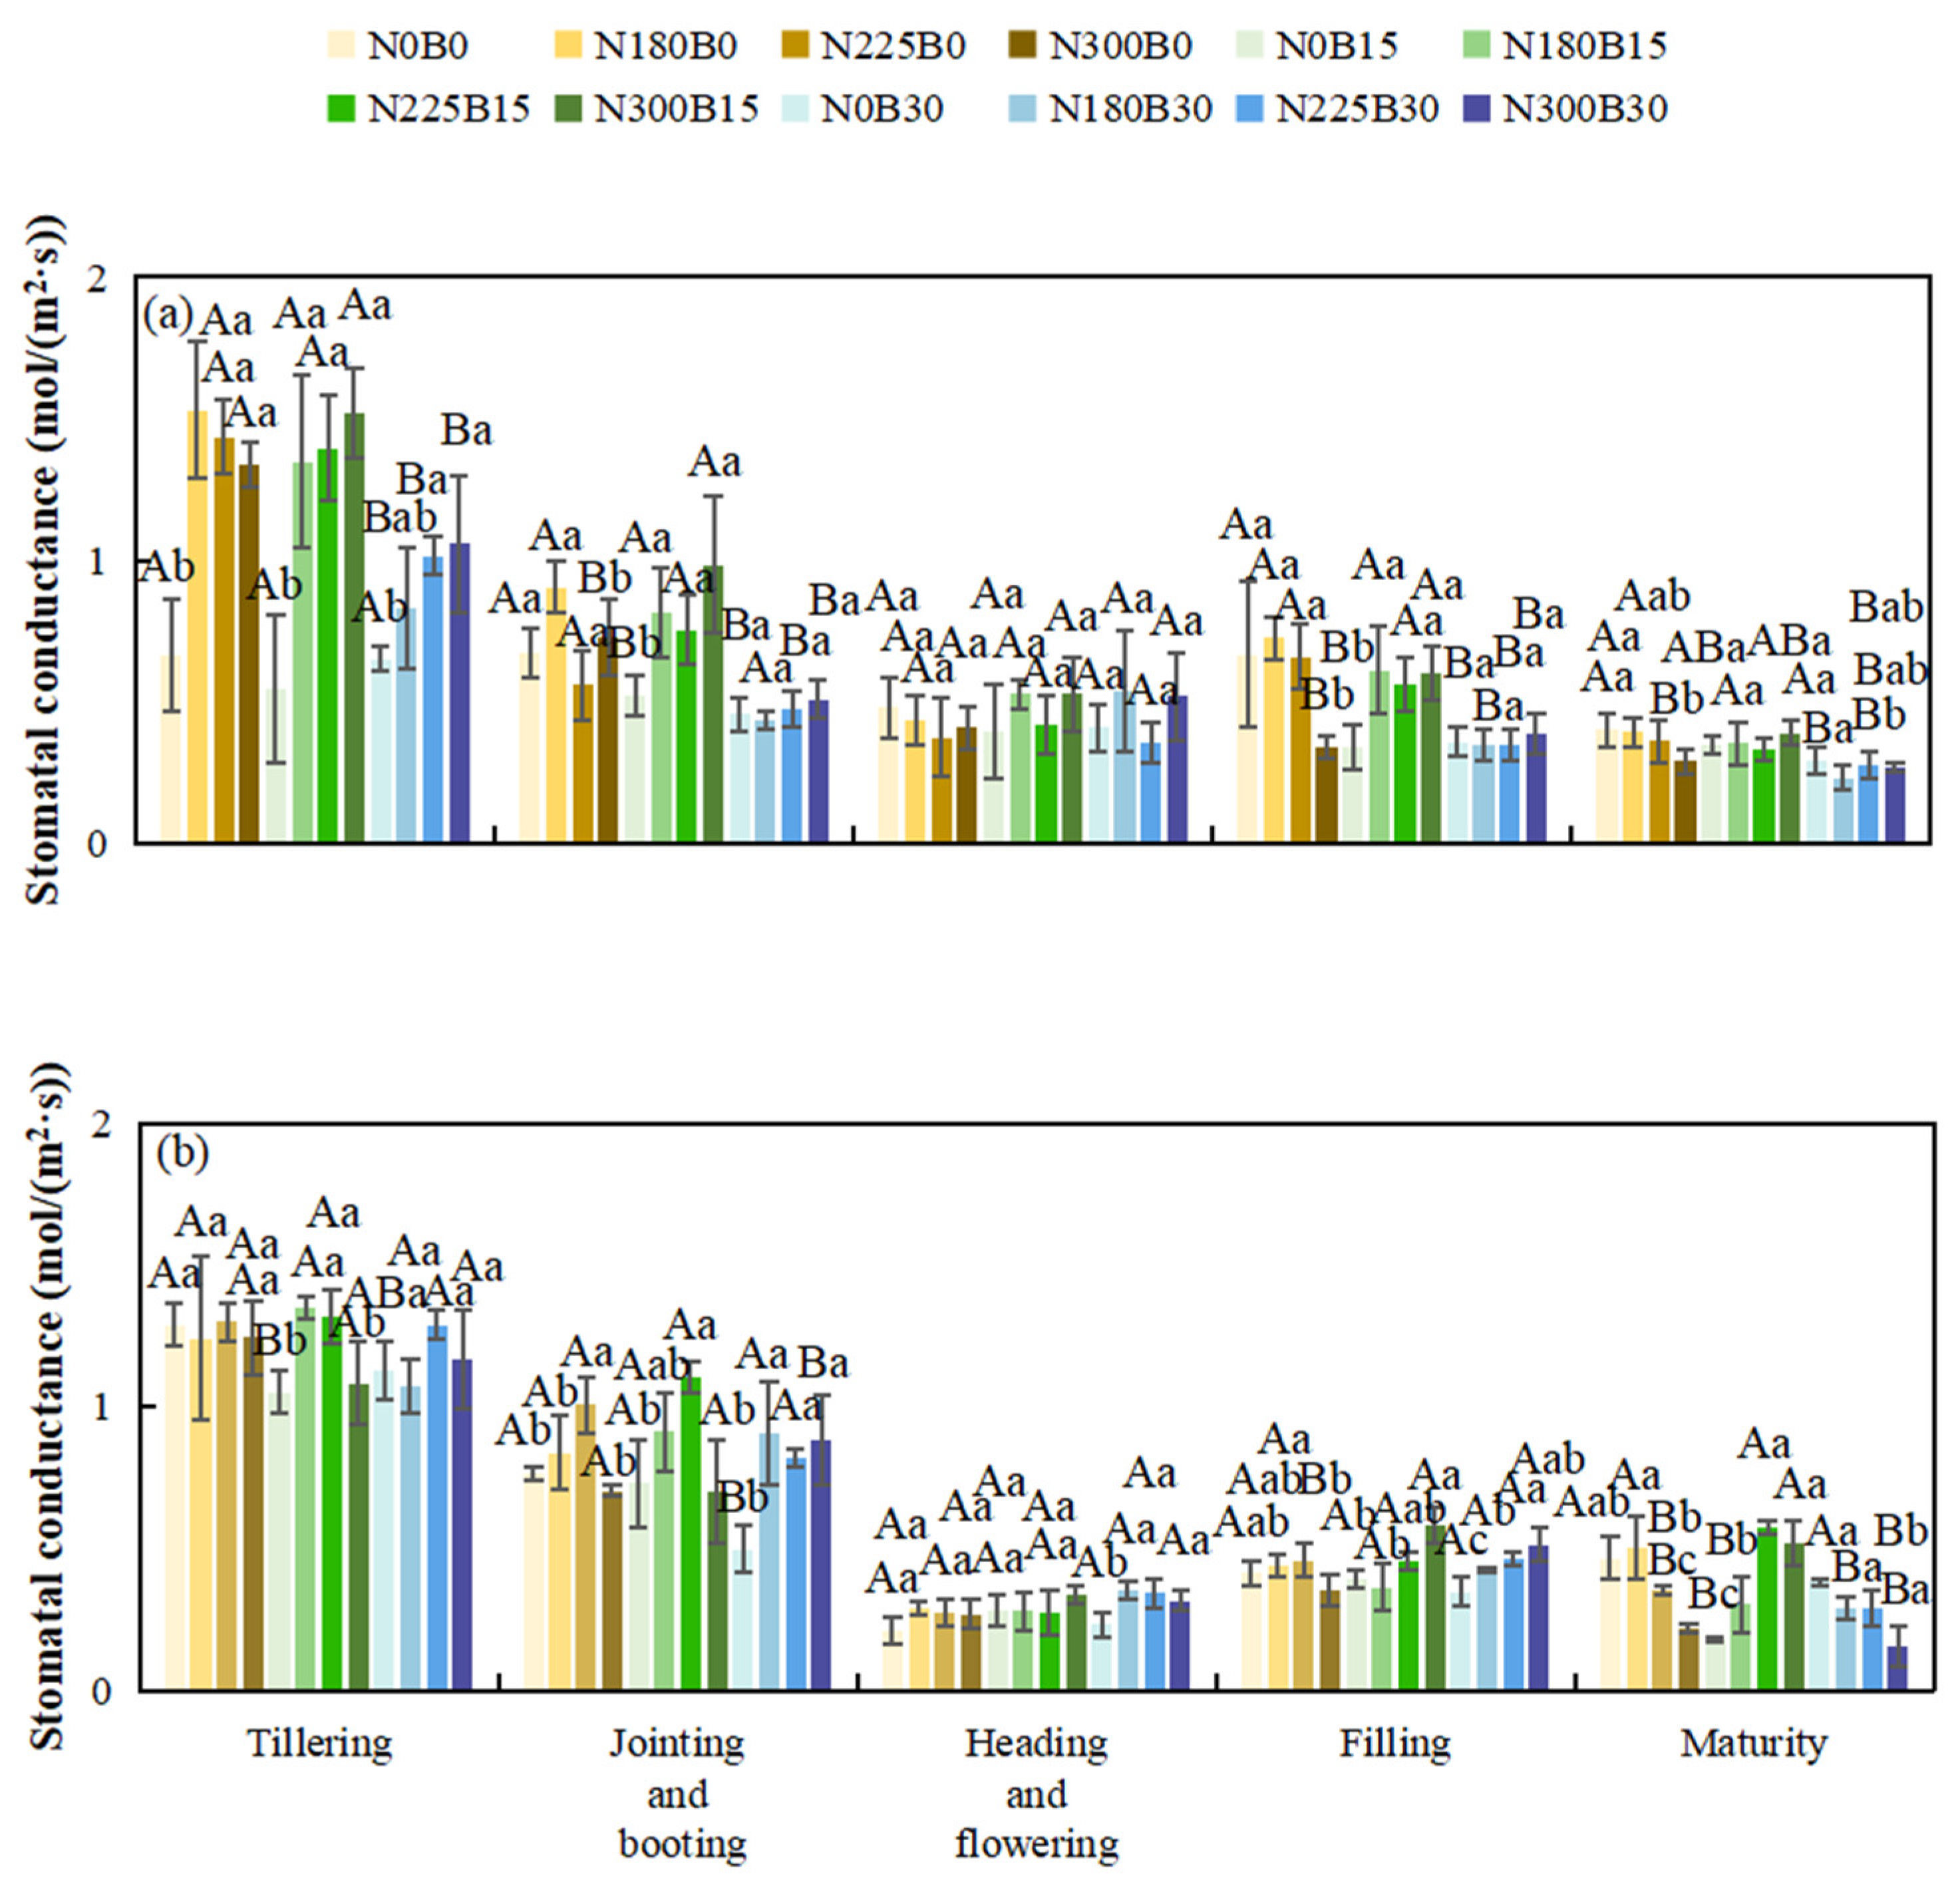
3.2. Effects of Biochar Fertilizer Application on Stomatal Conductance
Throughout the entire growth cycle of rice, stomatal conductance initially remains relatively elevated, subsequently exhibits fluctuations, and ultimately declines as the plant reaches maturity.
During the tillering phase, under the same nitrogen levels, comparing different biochar fertilizer levels (N0B0, N0B15, N0B30), stomatal conductance varies with increasing biochar levels. Under N180, N225, and N300, the B15 treatment shows relatively high stomatal conductance. During the jointing and booting phase, differences in stomatal conductance are significant across biochar levels, with B15 having higher values under N180 and N225. At the flowering stage, stomatal conductance fluctuates across biochar levels, but B15 is more stable and higher. During grain filling, under N180 and N225, B15 maintains higher stomatal conductance. In the maturity stage, stomatal conductance decreases across all biochar levels, yet B15 remains higher than B0 and B30.
Under the same biochar level, as nitrogen levels increase during the tillering phase, stomatal conductance is higher under N225 and N300 in some biochar treatments. During jointing and booting, differences in stomatal conductance are significant across nitrogen levels, with N225 and N300 being higher in some biochar treatments. At the flowering stage, stomatal conductance fluctuates but is more stable and higher under N225 and N300. During grain filling, N225 and N300 show higher stomatal conductance. In the maturity stage, stomatal conductance decreases across nitrogen levels, but remains higher under N225 and N300 than under N0 and N180.
In 2022, biochar significantly affects stomatal conductance during tillering, jointing and booting, and grain filling and ripening. Nitrogen also has significant effects during these stages, and their interaction is significant as well. In 2023, nitrogen significantly impacts stomatal conductance during jointing and booting, flowering, grain filling and ripening, and maturity. The interaction between biochar and nitrogen is significant during jointing and booting, grain filling and ripening, and maturity.
Figure 5.
Stomatal Conductance of Rice at Different Growth Stages in 2022(a) and 2023(b).
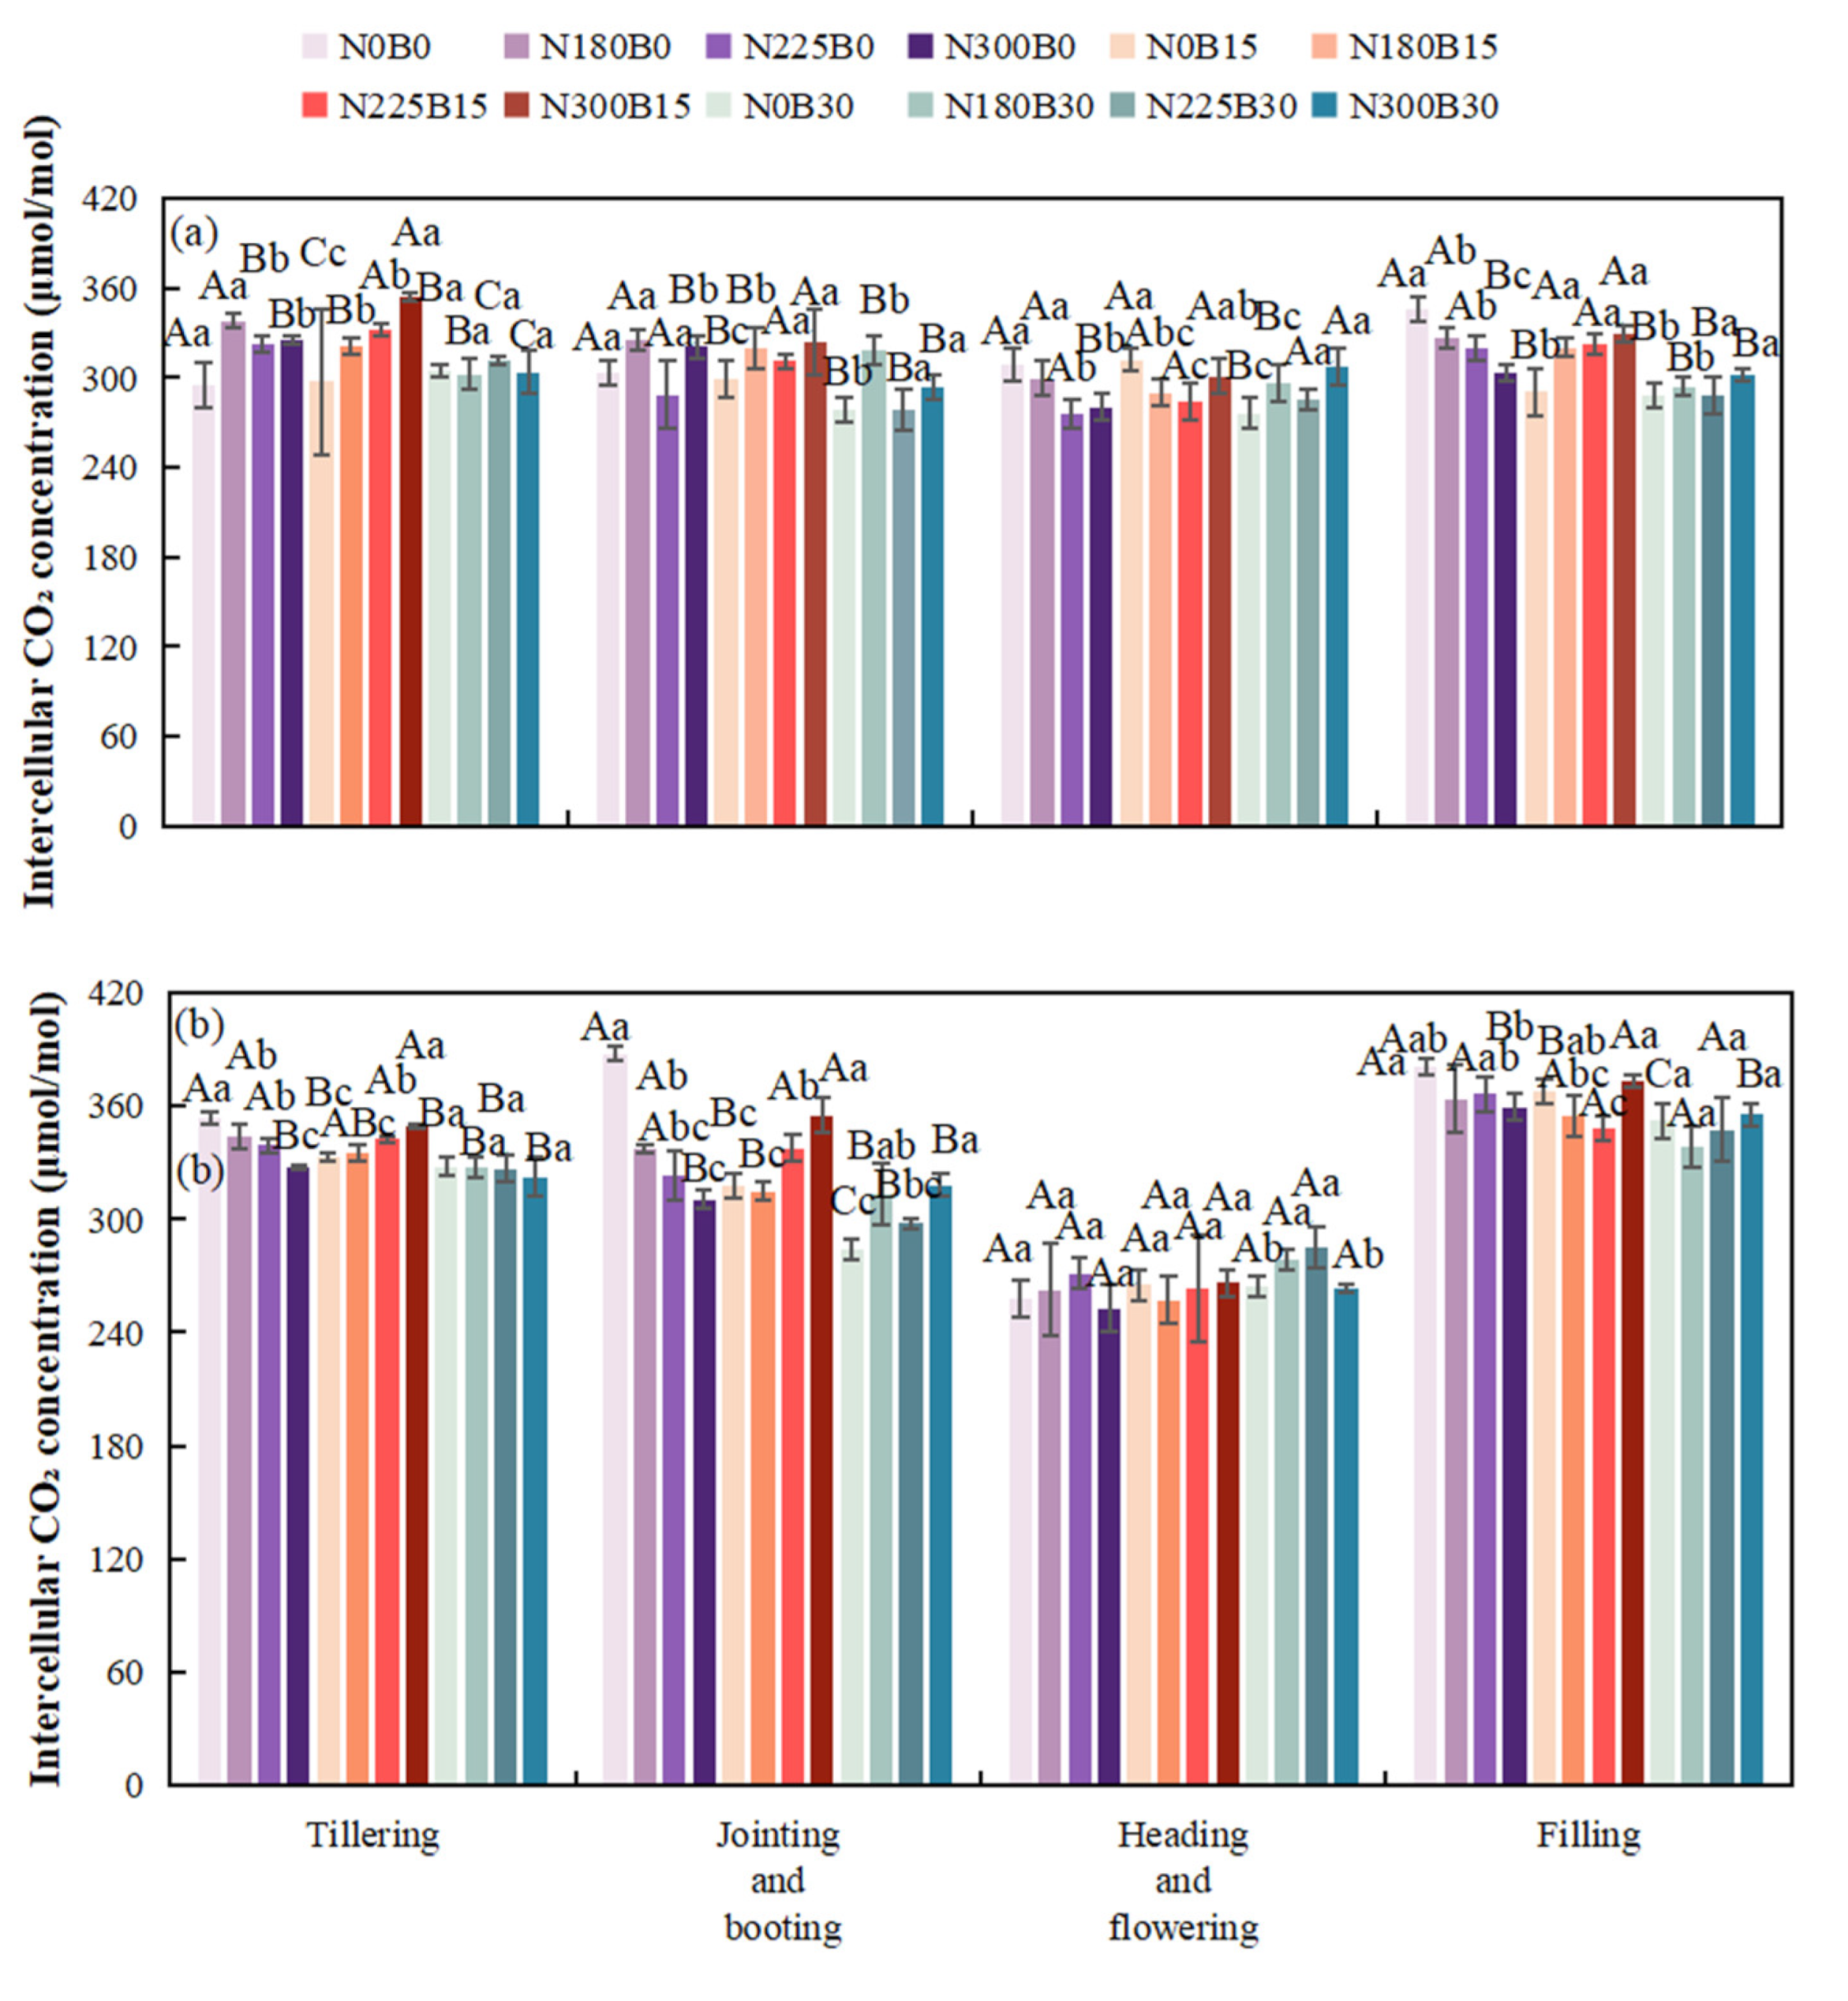
3.3. Effects of Biochar Fertilizer Application on Intercellular CO2 Concentration
During the early growth stage, at a constant nitrogen level, variations in biochar fertilizer application lead to fluctuations in intercellular CO2 concentration. Specifically, under the N0 treatment, the intercellular CO2 concentrations observed in N0B15 and N0B30 differ significantly from those in N0B0 during both the tillering and jointing-booting stages. Notably, during the jointing-booting stage, characterized by vigorous rice growth, the differences in biochar application at the same nitrogen level continue to impact intercellular CO2 concentration. Similarly, under the N225 treatment, intercellular CO2 concentrations in N225B15 and N225B30 differ from those in N225B0. In the late growth stage, biochar contributes to enhanced soil fertility and improved water retention, thereby creating a more stable environment for rice development and influencing the accumulation and translocation of photosynthetic products.
Under the same biochar fertilizer level during the tillering stage, increasing nitrogen levels lead to differences in intercellular CO2 concentration. During the jointing-booting stage, as rice nitrogen demand increases, there are significant differences in intercellular CO2 concentration among N180B15, N225B15, and N300B15. During the flowering and grain-filling stages, both excessive and insufficient nitrogen can affect physiological processes.
Biochar fertilizer has a highly significant impact on intercellular CO2 concentration in 2022, except during the flowering stage, and in 2023 during the tillering and grain-filling-ripening stages, making it one of the major influencing factors. Nitrogen has a significant or highly significant impact on intercellular CO2 concentration in 2022 during the flowering stage and in 2023 during the grain-filling-ripening stage. The interaction between biochar and nitrogen has a highly significant impact on intercellular CO2 concentration in 2022, except during the grain-filling-ripening stage, and in 2023 during the tillering stage.
Figure 6.
Intercellular CO2 Concentration of Rice at Different Growth Stages in 2022(a) and 2023(b).
Figure 6.
Intercellular CO2 Concentration of Rice at Different Growth Stages in 2022(a) and 2023(b).
3.4. Effects of Biochar Fertilizer Application on Transpiration Rate
During the developmental stages of rice, the transpiration rate exhibits an initial increase followed by a subsequent decline, attaining its peak during the jointing and booting phases before progressively decreasing. Although variations are observed across different treatment conditions, the general pattern remains consistent.
When examining different levels of biochar fertilizer application, the transpiration rate shows an increasing trend as the biochar level goes from B0 to B15 and B30 in some treatment combinations. Under certain B30 treatment combinations during the tillering and jointing and booting stages, the transpiration rate is relatively high. However, during the flowering, grain filling, and maturation stages, the influence of biochar fertilizer levels becomes complex and does not follow a simple increasing or decreasing pattern. As the nitrogen level increases from N0 to N180, N225, N300, in the tillering and jointing and booting stages, some treatment combinations under high nitrogen levels have a higher transpiration rate. After the flowering stage, the impact of nitrogen levels on the transpiration rate weakens gradually, and the differences among nitrogen treatments reduce.
In different years, the effects of biochar - fertilizer, nitrogen, and their interactions on the transpiration rate of rice vary. Biochar - fertilizer has a significant or extremely significant impact on the transpiration rate of rice during the tillering stage and the jointing - booting stage in 2022, and during the tillering stage, the jointing - booting stage, and the filling - ripening stage in 2023. Nitrogen has a significant or extremely significant impact on the transpiration rate of rice during the tillering stage and the filling - ripening stage in 2022, and during the jointing - booting stage and the filling -ripening stage in 2023.
Figure 4.
Transpiration Rate of Rice at Different Growth Stages in 2022 (a)and 2023(b).
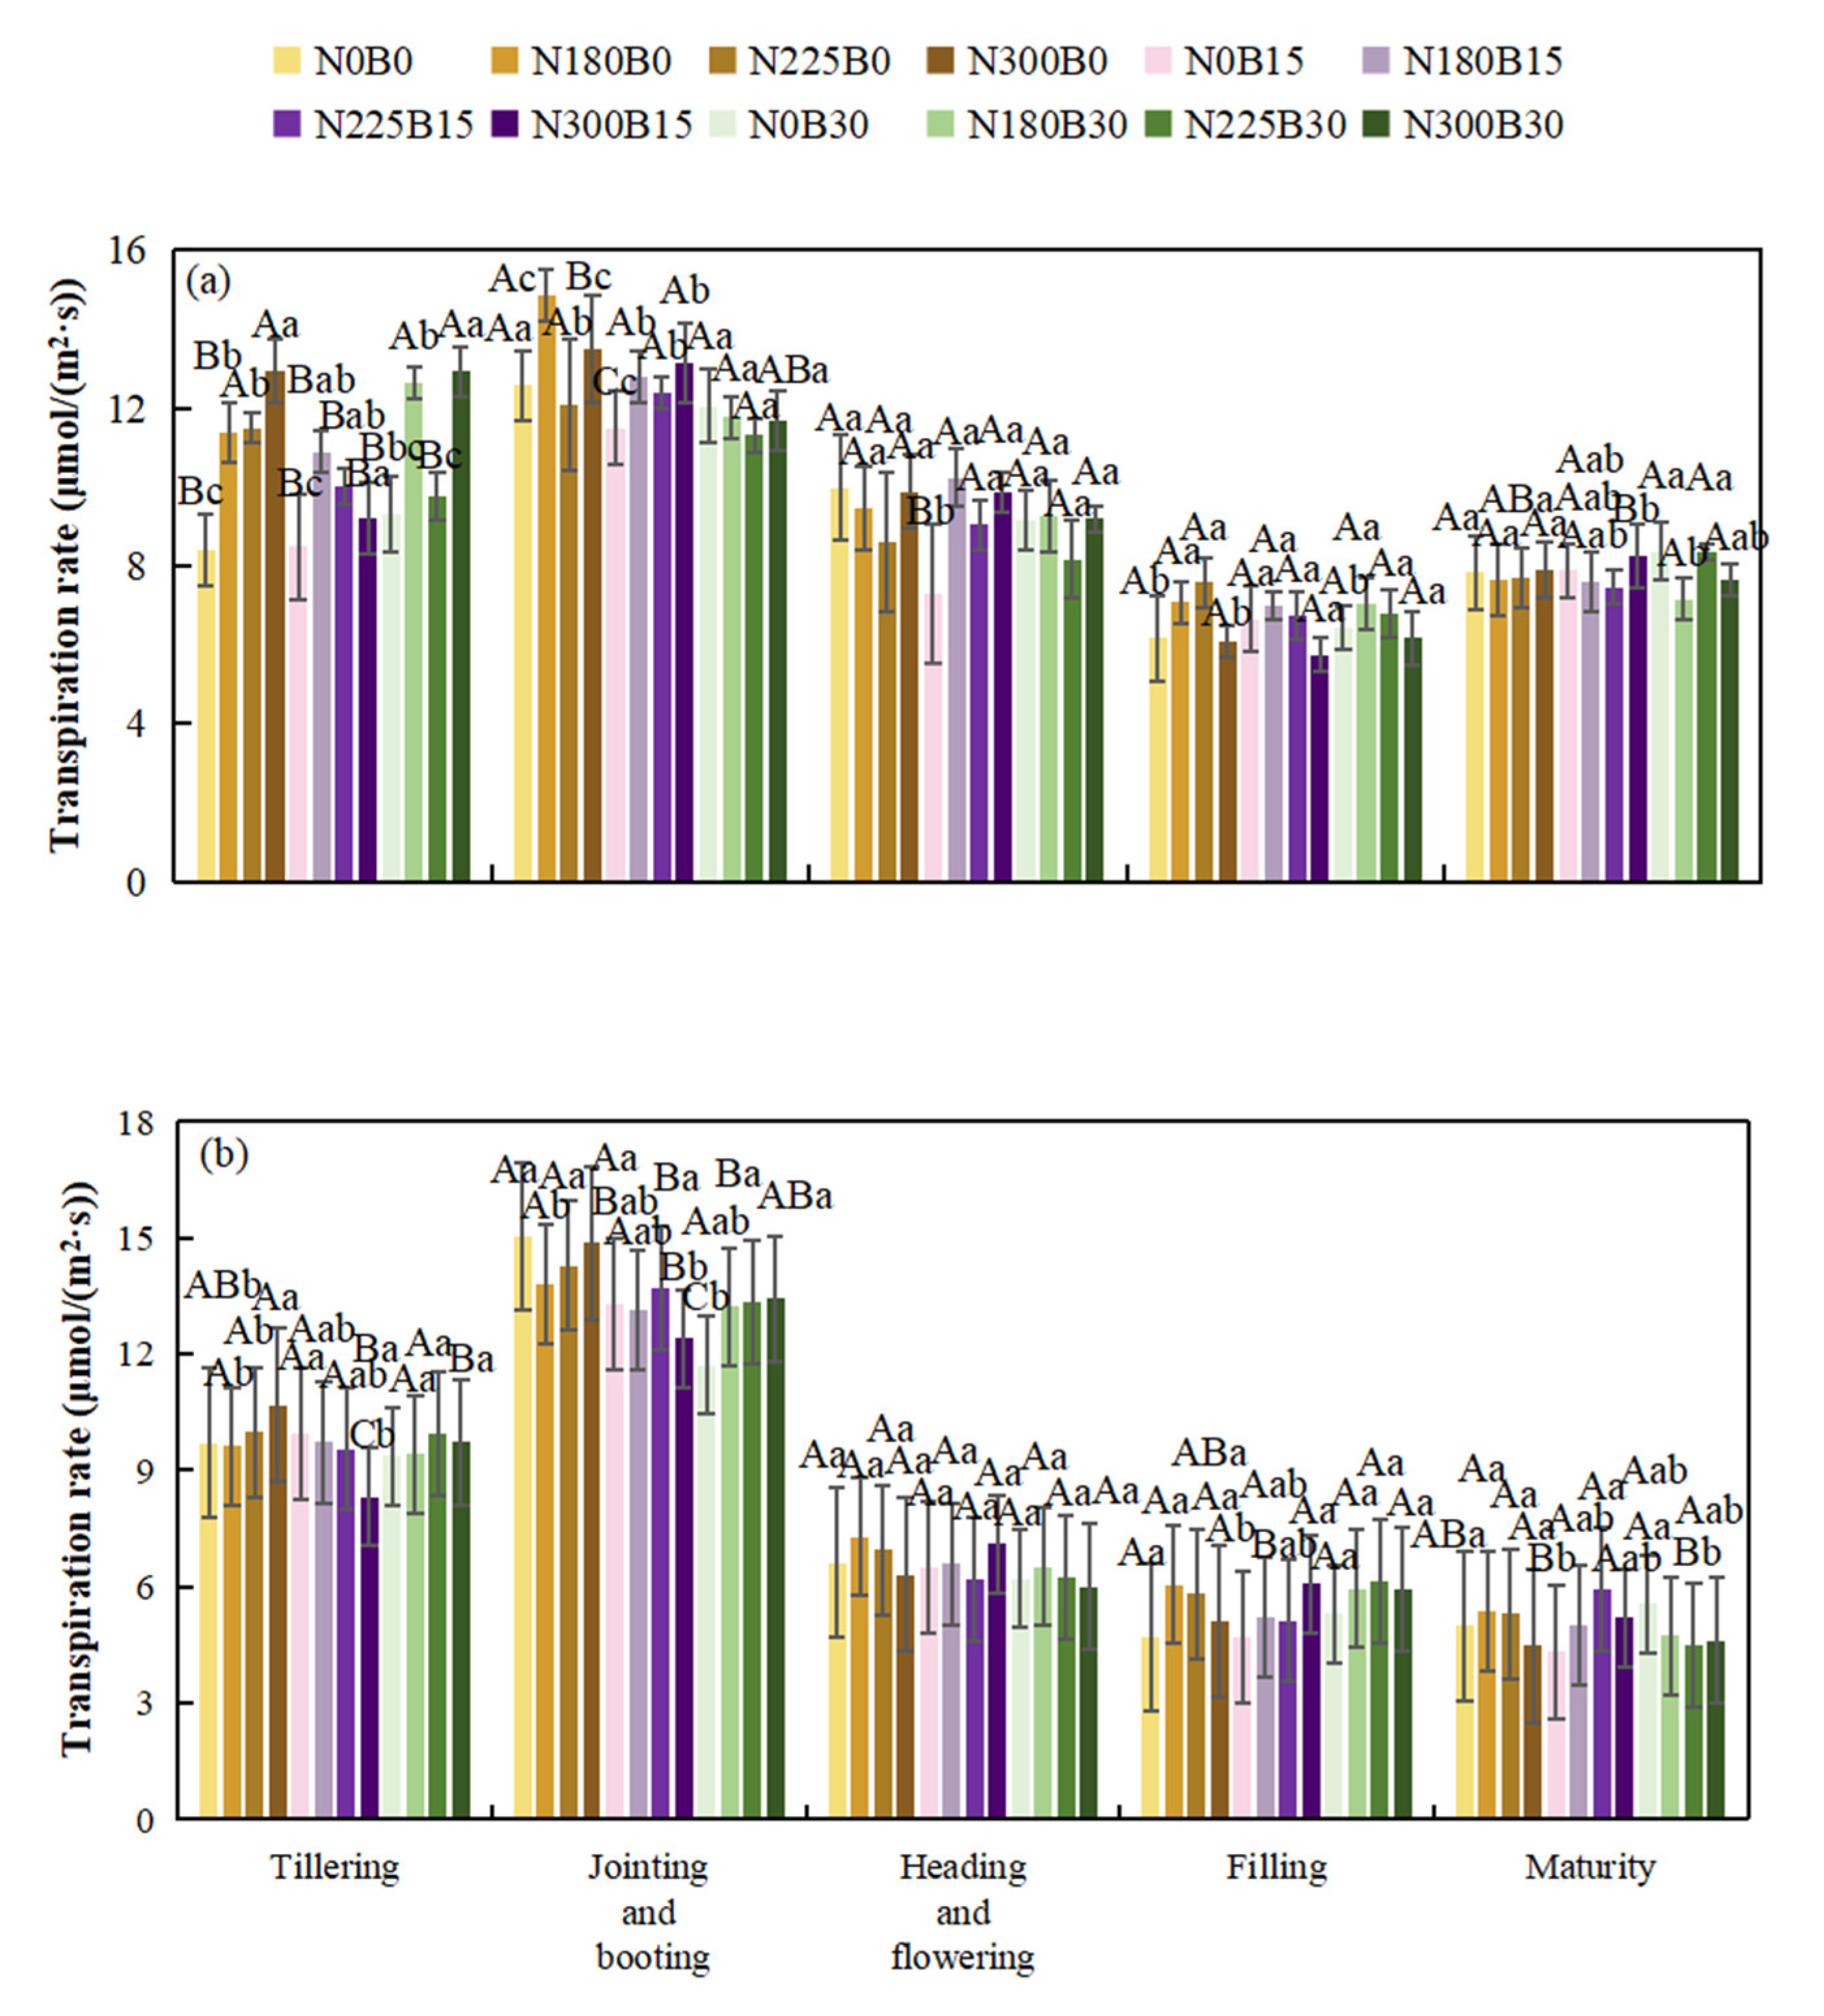
The interaction between biochar and nitrogen has a significant or extremely significant impact on the transpiration rate of rice during the tillering stage and the jointing - booting stage in 2022, and during the tillering stage, the jointing - booting stage, and the maturity stage in 2023. The nitrogen - containing treatments (N180B0, N225B0, N300B0) have a higher transpiration rate than the nitrogen - free treatment (N0B0) in most growth stages. Compared with the simple nitrogen - containing treatments, the nitrogen - containing treatments with the addition of biochar - fertilizer (B15, B30) show differences in transpiration rate. Nitrogen and biochar interact with each other and jointly affect the transpiration rate of rice.
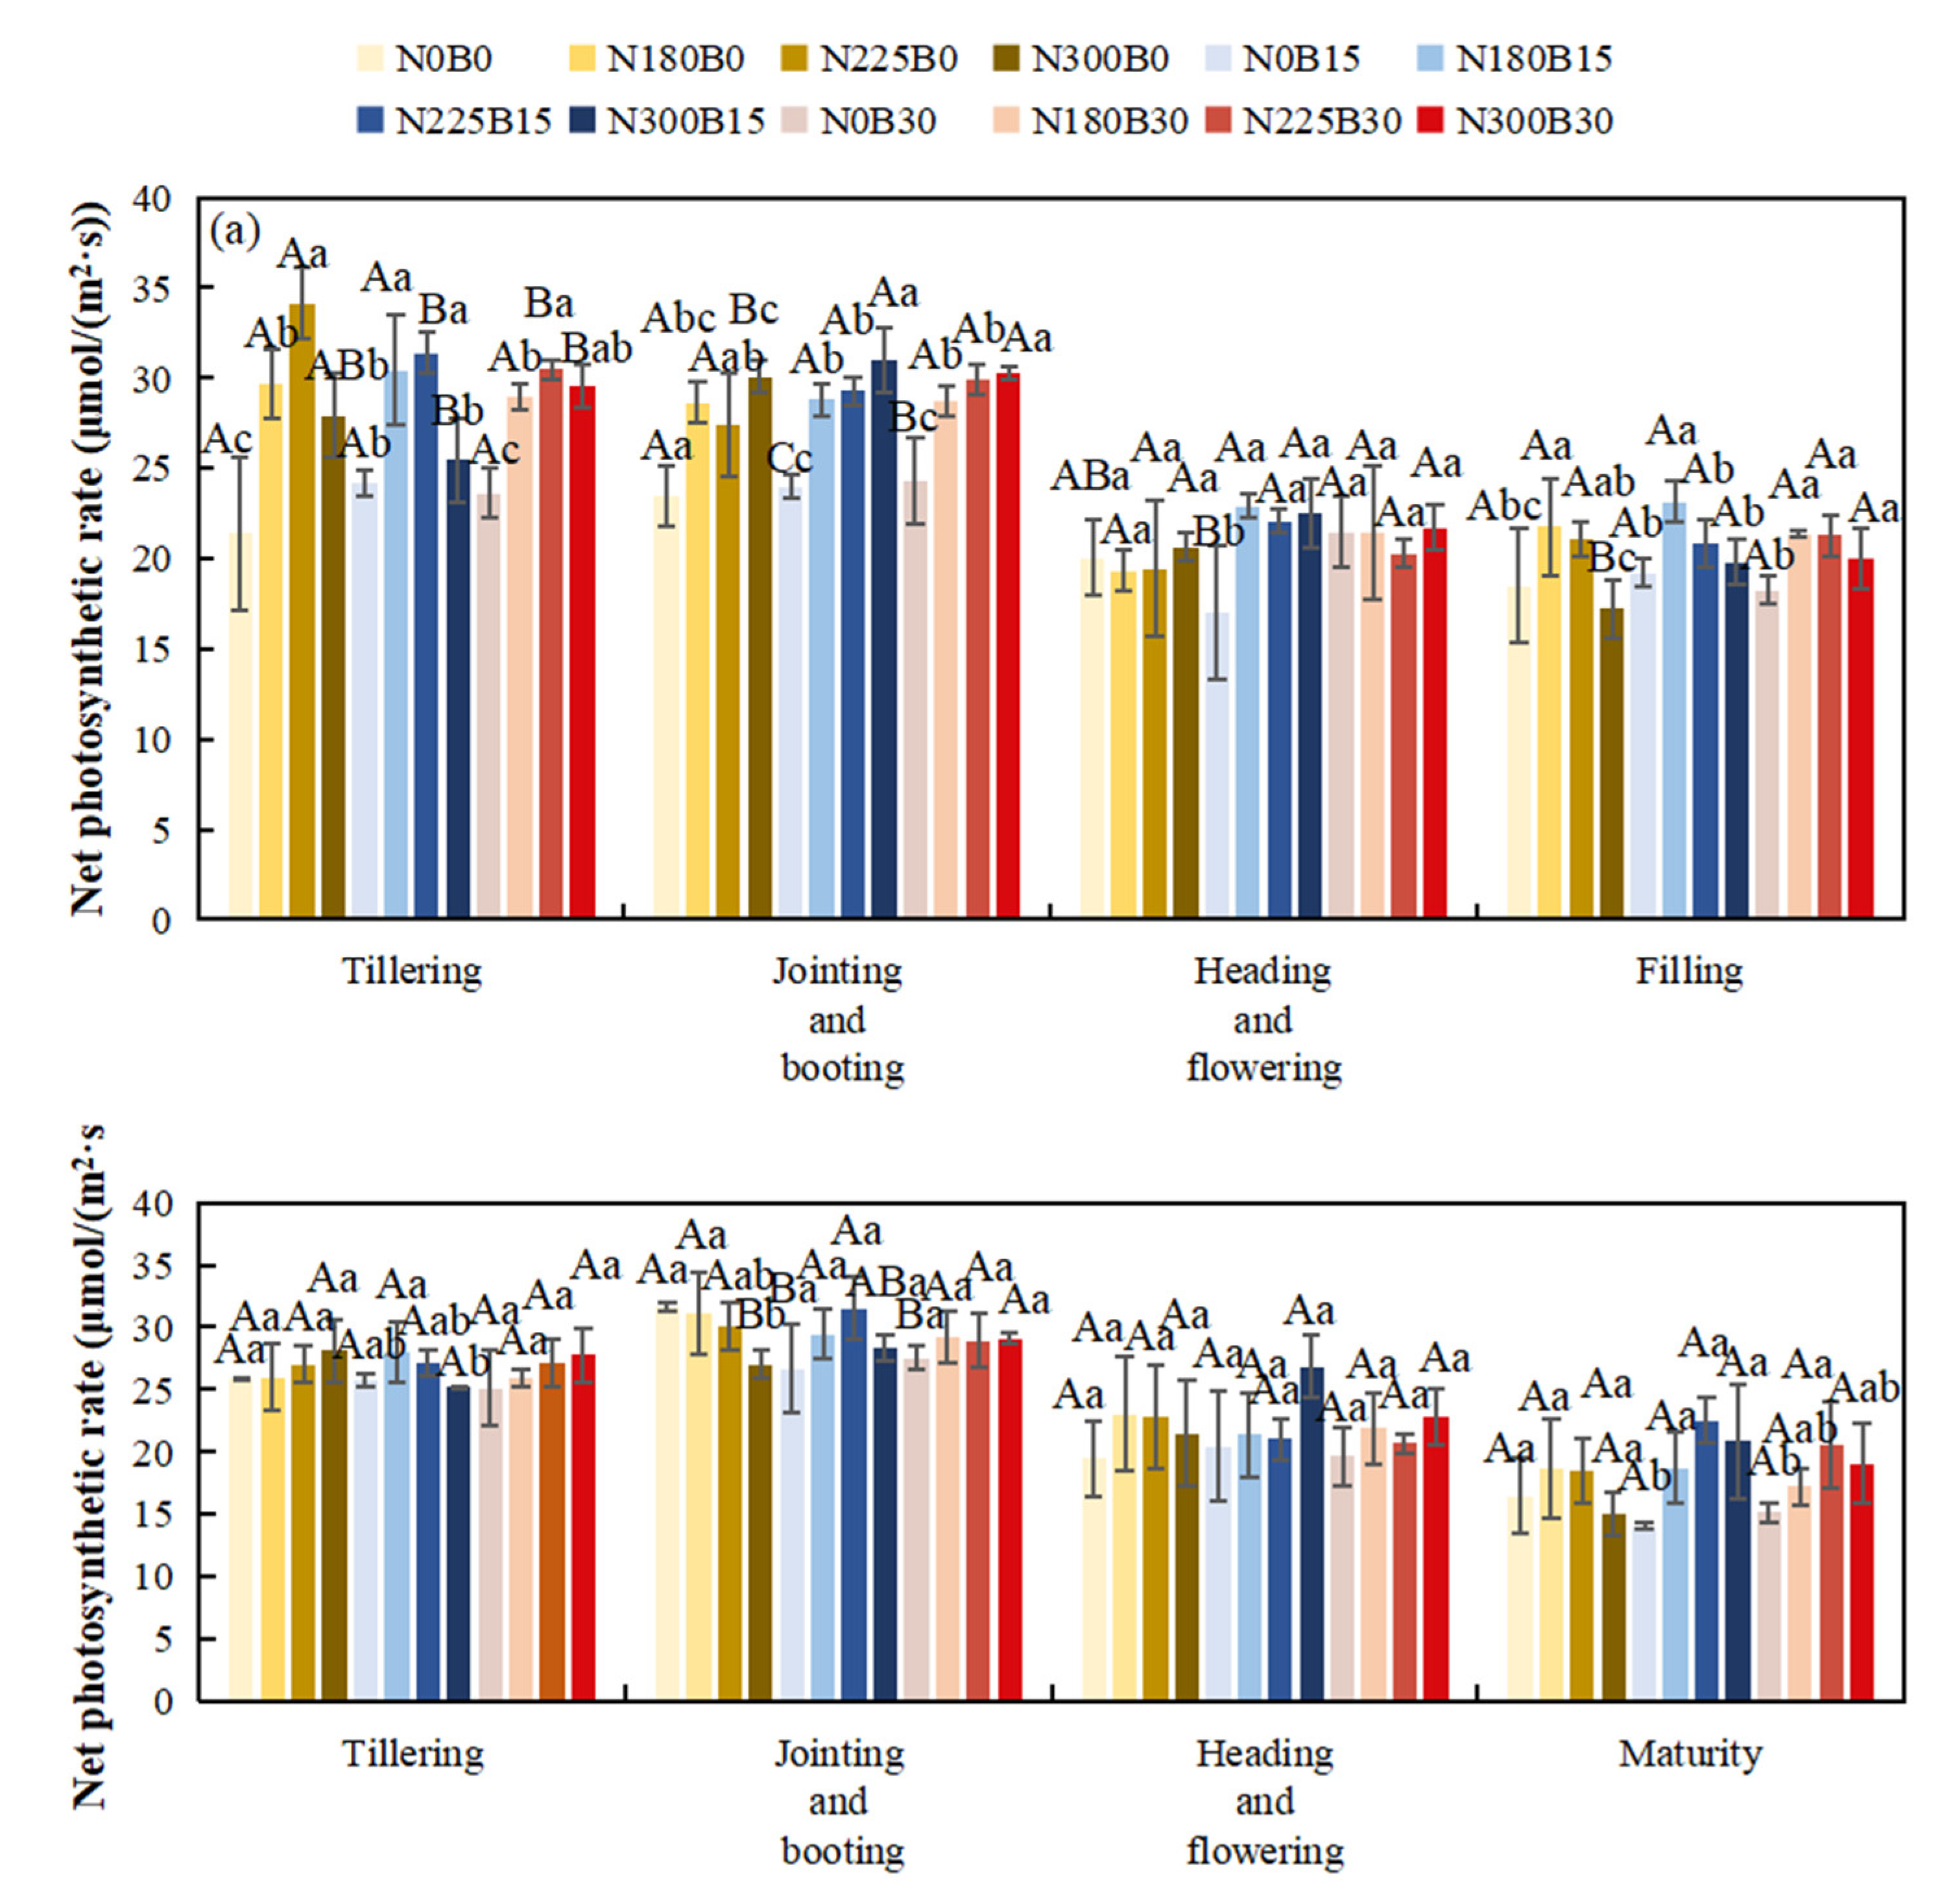
3.5. Effects of Biochar Fertilizer Application on Net Photosynthetic Rate
The net photosynthetic rate of rice exhibited an initial increase followed by a subsequent decrease throughout its developmental stages. Specifically, it progressively rose beginning at the tillering stage, reached its maximum at the jointing to panicle development stages, and subsequently declined as the crop approached maturation.
At the tillering stage under the same nitrogen level, with the biochar level increasing from B0 to B15 and B30, the NPR of some treatments increased. For example, compared with N180B0, N180B15 and N180B30 showed a certain increase in NPR. During the heading-flowering stage, the difference in NPR among different biochar treatments was relatively small, but the NPR of biochar-applied treatments was slightly higher than that of treatments without biochar. In the grain-filling and maturity stages, the NPR of all treatments decreased overall, and the difference among different biochar levels further narrowed, but some biochar-applied treatments still showed a slight advantage.
At the tillering and jointing-booting stages, with the nitrogen level increasing from N0 to N225, the NPR of some treatments also increased. Treatments N225B0, N225B15, and N225B30 showed significantly higher NPR than N0B0. During the heading-flowering stage, the NPR under high nitrogen treatments (N225, N300) mostly remained at a high level, while that under low nitrogen (N180) and nitrogen-free (N0) treatments was relatively low. In the grain-filling and maturity stages, the NPR of all nitrogen treatments decreased, but the decline was more significant in nitrogen-free or low nitrogen treatments (N0, N180).
The effects of biochar and nitrogen on rice NPR varied significantly across different years. Nitrogen had significant or extremely significant effects on rice NPR at the tillering, jointing-booting, and grain-filling stages in 2022, and at the maturity stage in 2023. The interaction effect between biochar and nitrogen only significantly affected rice NPR at the tillering and jointing-booting stages in 2022, and the interaction was not significant in most cases. Nitrogen-containing treatments (N180B0, N225B0, N300B0) had higher NPR than the nitrogen-free treatment (N0B0) in most growth stages. Compared with pure nitrogen-containing treatments, nitrogen-containing treatments with biochar addition (B15, B30) showed different NPR performances. Biochar and nitrogen interacted synergistically to promote the photosynthetic capacity of rice and increase the net photosynthetic rate.
Using stepwise regression analysis and significance testing, establish the optimal fitting equation between net photosynthetic rate Pn and environmental factors (Table 4). The correlation between each equation reached a highly significant level. After removing some variables, under the B0N0 treatment, the air temperature Ta showed a highly significant positive correlation with the net photosynthetic rate Pn, and the saturated water vapor pressure difference VPD showed a highly significant negative correlation with the net photosynthetic rate Pn. The fitting optimization degree reached 0.561; Under B0N180 treatment, there is a highly significant positive correlation between air temperature and net photosynthetic rate, a significant positive correlation between solar effective radiation and net photosynthetic rate, and a highly significant negative correlation between saturated water vapor pressure difference and net photosynthetic rate; Under the treatment of B0N225, there is a highly significant positive correlation between air temperature Ta and net photosynthetic rate Pn, and a highly significant negative correlation between saturated vapor pressure difference VPD and net photos synthetic rate Pn; Under B0N300 treatment, air temperature and relative humidity were significantly positively correlated with net photosynthetic rate, while intercellular CO2 concentration was significantly negatively correlated with net photosynthetic rate; Under B15N0 treatment, the net photosynthetic rate showed a highly significant positive correlation with air temperature, a significant negative correlation with atmospheric CO2 concentration, and a highly significant negative correlation with saturated water vapor pressure difference; Under the treatment of B15N180, B15N225, and B15N300, the net photosynthetic rate showed a highly significant positive correlation with air temperature and a highly significant negative correlation with saturated water vapor pressure difference; Under B30N0 treatment, the net photosynthetic rate showed a highly significant positive correlation with air temperature and relative humidity, and a highly significant negative correlation with intercellular CO2 concentration; Under B30N180 treatment, the net photosynthetic rate showed a highly significant positive correlation with air temperature, a significant negative correlation with atmospheric CO2 concentration, and a highly significant negative correlation with saturated water vapor pressure difference; Under B30N225 and B30N300 treatments, the net photosynthetic rate showed a highly significant positive correlation with air temperature and relative humidity.
Figure 3.
Net Photosynthetic Rates During Different Rice Growth Stages in 2022(a) and 2023(b).
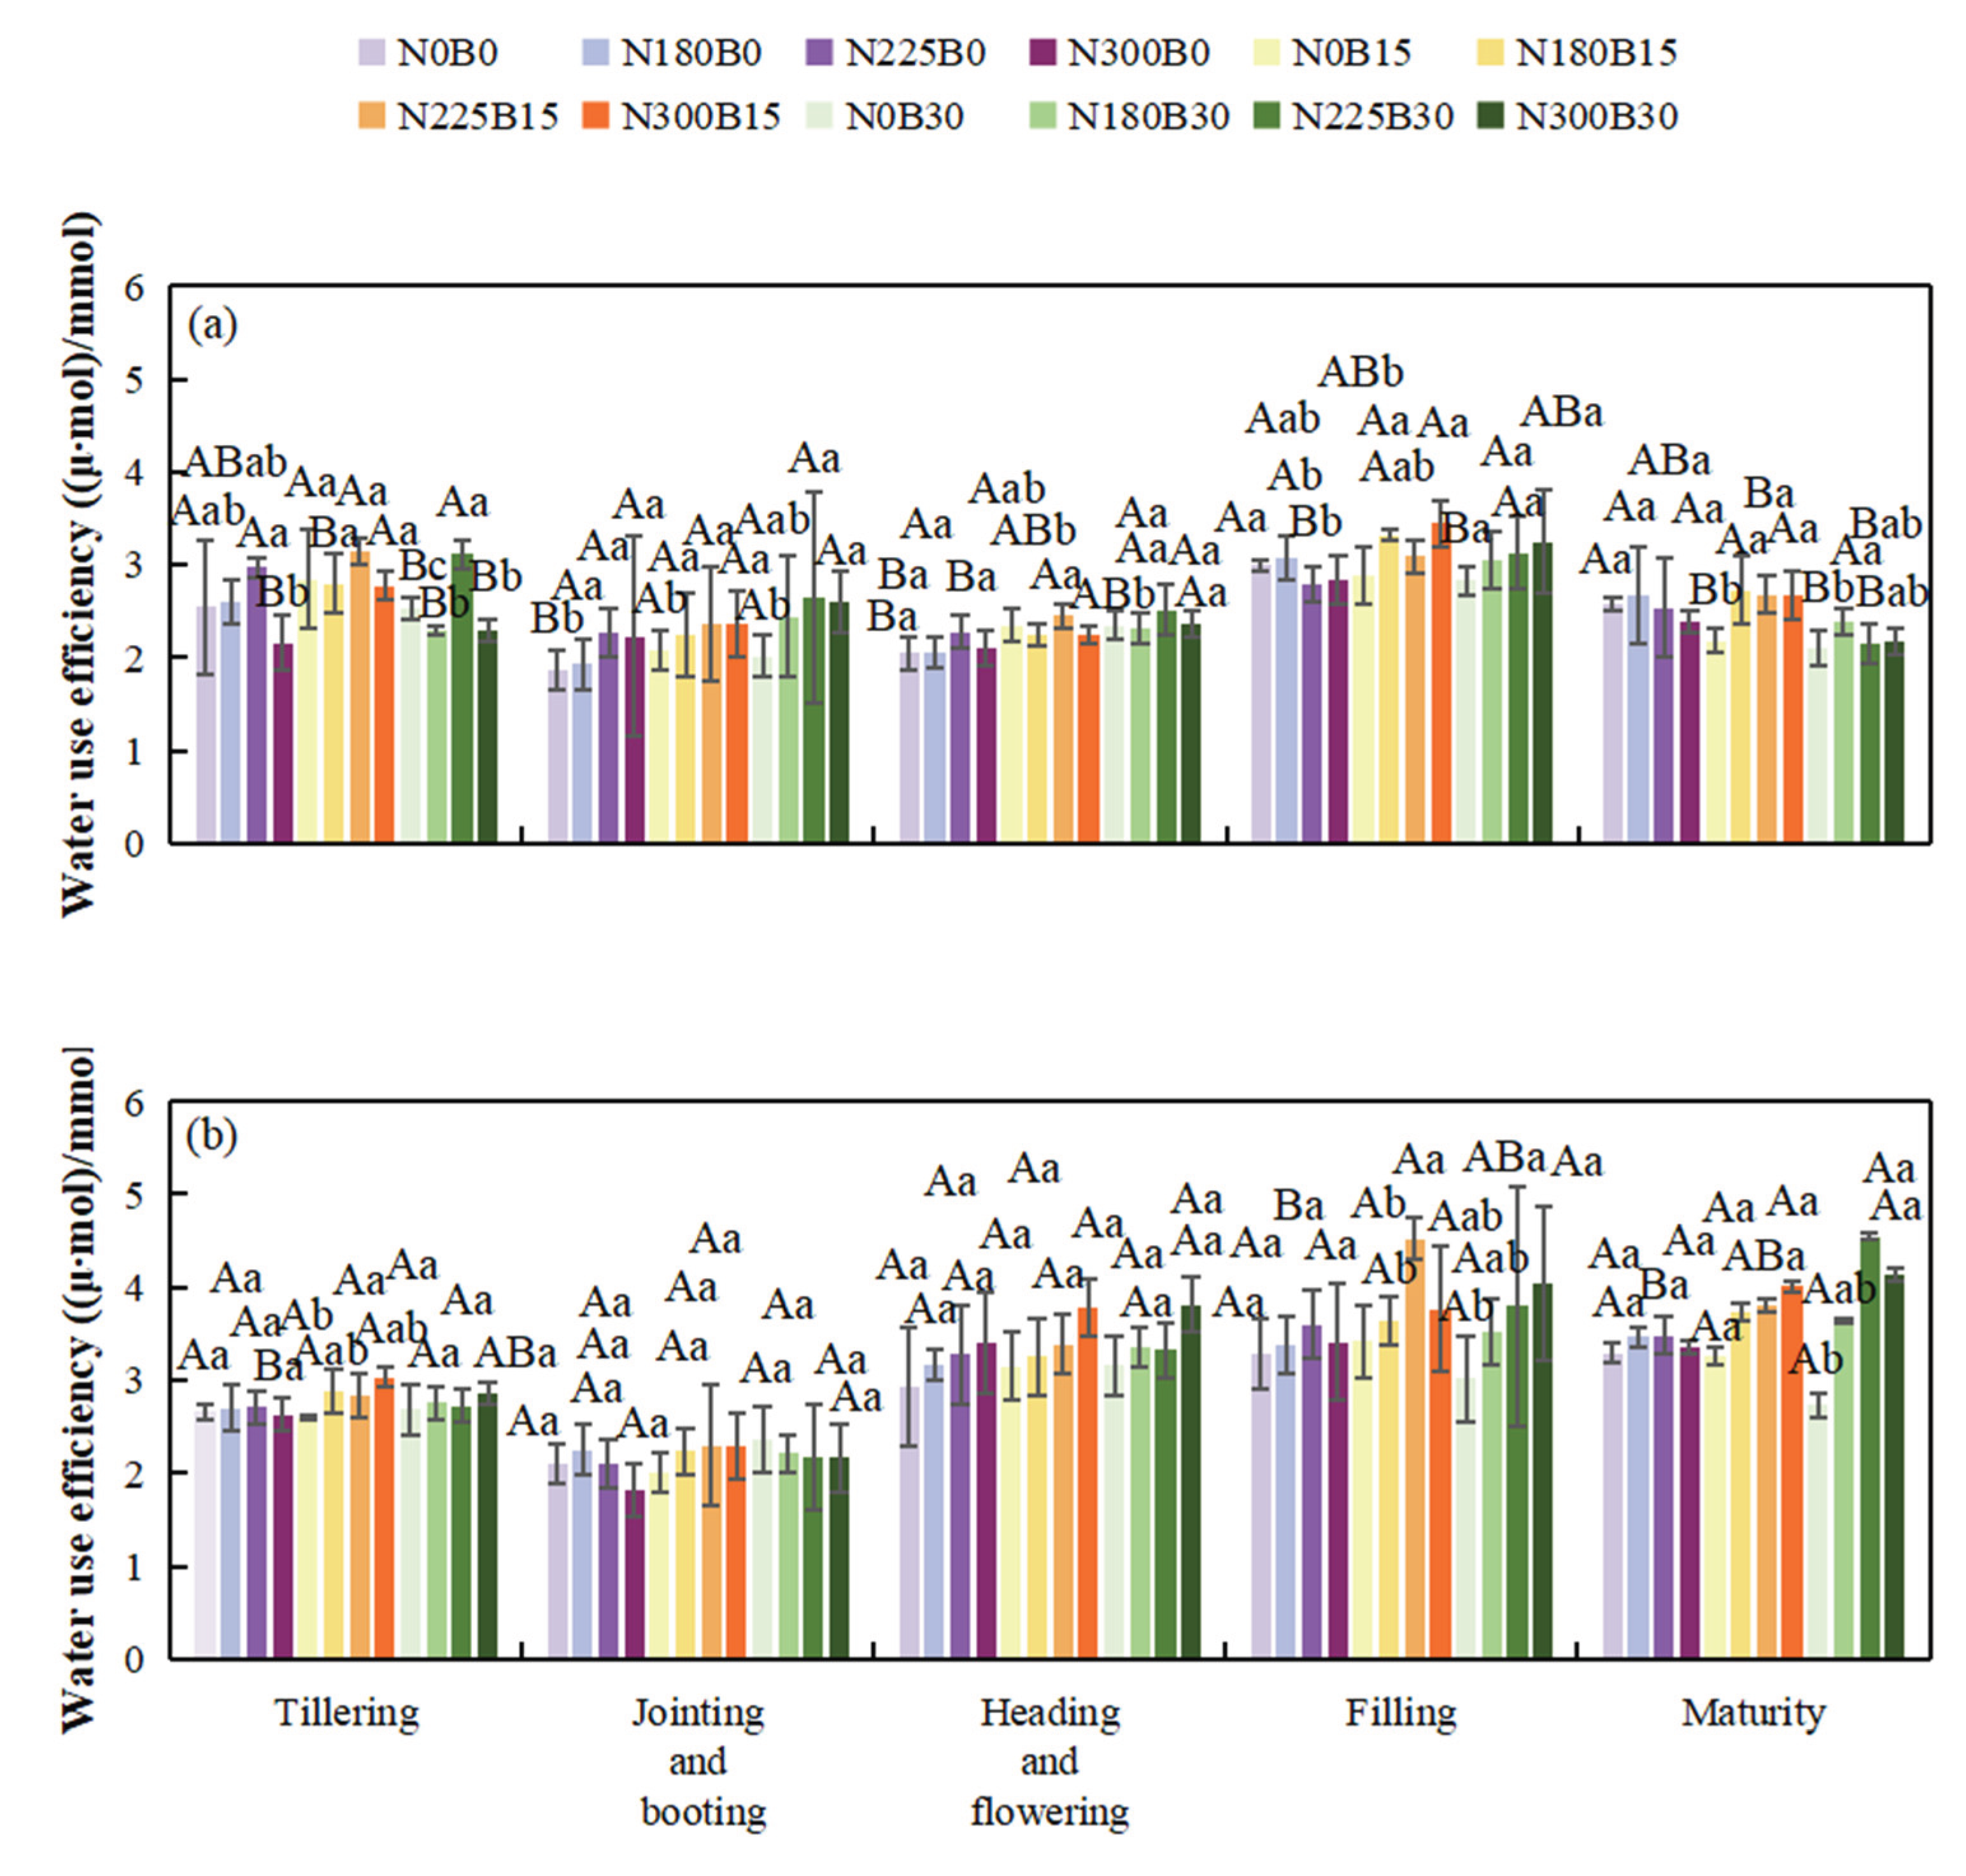
3.6. Effects of Biochar Fertilizer Application on Water Use Efficiency
The water use efficiency (WUE) of rice exhibits a temporal pattern characterized by an initial decline, followed by an increase, and subsequently another decline over the course of the growth period, maintaining comparatively elevated levels during the grain-filling stage.
During the tillering stage, under the same nitrogen level, increasing biochar fertilizer from B0 to B15 and B30 leads to varying changes in WUE. Under N0, the WUE of N0B15 and N0B30 differs from that of N0B0. In the jointing-booting stage, when rice grows rapidly and water demand increases, the WUE of N180B15 and N180B30 differs from that of N180B0 under N180 treatment. During the flowering and grain-filling stages, WUE fluctuates with different biochar fertilizer levels. Some high biochar treatments enhance soil water supply stability, improving WUE during these stages. In the maturity stage, differences in biochar fertilizer treatments continue to affect WUE, reflecting biochar sustained regulation of water use throughout the rice growth period.
Under the same biochar fertilizer level during the tillering stage, increasing nitrogen levels from N0 to N180, N225, and N300 changes WUE, allowing more efficient water use for photosynthesis and thus influencing WUE. In the jointing-booting stage, as rice nitrogen demand rises, nitrogen levels significantly impact WUE, with noticeable differences in the WUE of N180B15, N225B15, and N300B15. During the flowering and grain-filling stages, excessive or insufficient nitrogen can imbalance rice growth and affect water use, while appropriate nitrogen levels improve WUE. In the maturity stage, nitrogen participates in regulating rice senescence and nutrient reallocation, impacting water absorption and use.
In 2022, biochar significantly impacts WUE during the tillering, flowering, and maturity stages, while nitrogen has a significant or highly significant impact during the tillering, jointing-booting, flowering, and maturity stages. Their interaction significantly affects WUE during the tillering, jointing-booting, and grain-filling-ripening stages. In 2023, biochar and nitrogen only significantly impact WUE during the grain-filling-ripening stage, with no significant effects observed in most other periods.
Figure 7.
Water Use Efficiency of Rice at Different Growth Stages in 2022(a) and 2023(b).
4. Discussion
Chlorophyll SPAD values serve as a reliable, non-destructive proxy for leaf chlorophyll content, which is fundamentally linked to nitrogen (N) availability, a key constituent of chlorophyll molecules [23]. Our findings demonstrate that biochar amendment, particularly in combination with nitrogen fertilization, significantly enhanced chlorophyll SPAD values in rice leaves. This aligns with the understanding that biochar improves the soil environment and nutrient retention capacity. The porous structure and extensive specific surface area of biochar facilitate the adsorption and stabilization of nitrogen, thereby increasing its bioavailability for plant uptake and supporting chlorophyll biosynthesis. For instance, Zhang et al. (2021) reported that biochar significantly enhanced nitrogen retention in karst soils and altered the community of nitrifying functional microbes, which could indirectly promote nitrogen availability for plants [24]. Furthermore, high nitrogen supply provides the necessary substrates for chlorophyll synthesis, and the synergistic effect with biochar likely creates a more favorable rhizospheric environment for nutrient acquisition.
The net photosynthetic rate (Pn), a critical indicator of plant photosynthetic efficiency, was markedly improved under combined biochar and nitrogen treatments. This enhancement can be attributed to multiple factors. Firstly, nitrogen is a vital component of key photosynthetic enzymes and Rubisco reaction. Adequate N supply promotes the synthesis and activity of these enzymes, thereby enhancing photosynthetic carbon assimilation capacity. Hou et al. found that interactive effects of nitrogen and potassium significantly influenced photosynthetic nitrogen allocation and photosynthesis in rice leaves [25]. Secondly, biochar amendment improves soil physical properties, such as structure and porosity, which optimizes root growth and enhances the efficiency of water and nutrient uptake [26]. This improved belowground environment provides a solid material foundation for aboveground photosynthetic processes. Thirdly, biochar has been shown to influence stomatal behavior. Chen et al. observed that biochar application maintained photosynthesis in cabbage under salt stress by regulating stomatal parameters [27]. Our results are consistent with Yeboah et al., who reported that nitrogen-enriched biochar improved the photosynthetic capacity of spring wheat in a semiarid environment [28].
Stomatal conductance (Gs) and transpiration rate (Tr) were significantly influenced by both nitrogen levels and biochar addition. Nitrogen availability affects stomatal development and function. High nitrogen supply can increase stomatal density and aperture, leading to higher Gs and consequently accelerating transpirational water loss [29,30]. Biochar-based fertilizers, renowned for their high water-holding capacity, improve soil moisture conditions [31]. Lustosa Carvalho et al. demonstrated that biochar amendment significantly enhanced water retention in tropical sandy soils [32]. Under conditions of adequate soil moisture maintained by biochar, roots can absorb and transport water more effectively to meet the demands of leaf transpiration. Moreover, emerging evidence suggests that biochar can alter soil microbial community structure and function, potentially influencing the synthesis and signaling of plant hormones involved in stomatal regulation [33]. Farhangi and Torabian reported that biochar increased plant growth-promoting hormones and helped alleviate salt stress in common bean seedlings, which could indirectly affect stomatal behavior [34].
The interplay between photosynthesis and transpiration directly impacts water use efficiency (WUE). High nitrogen levels boost photosynthetic CO2 fixation, potentially lowering intercellular CO2 concentration (Ci). Biochar addition improves soil moisture availability and root water uptake, allowing plants to maintain photosynthetic activity with potentially improved water utilization [35]. Wan et al. found that biochar increased carbon and nitrogen retention in the soil-plant system and enhanced plant growth and water-use efficiency in maize under reduced irrigation [36]. Furthermore, biochar-induced shifts in microbial communities may influence plant hormone synthesis that regulate stomatal aperture, optimizing the trade-off between CO2 influx and water vapor efflux. Parasar and Agarwala highlighted the crucial role of biochar-microbe-soil tripartite interactions in regulating soil C and N budgets, which underpins soil sustainability and plant performance [37].
Numerous studies have corroborated that appropriate nitrogen fertilization significantly increases chlorophyll content and net photosynthetic rate in rice [38]. The positive impacts of biochar on soil properties and plant growth have been extensively documented [26]. For instance, Schulz et al. reported positive effects of composted biochar on plant growth and soil fertility [39]. However, the magnitude and direction of these effects can vary considerably depending on soil type, crop genotype, biochar properties, application rate, and environmental conditions. In acidic soils, biochar’s role in ameliorating soil pH can be particularly significant, profoundly influencing rice growth and physiology. Shi et al. reviewed the mechanisms by which biochar ameliorates soil acidity [40]. Genotypic differences among rice varieties also lead to varying responses to nitrogen and biochar. Some genotypes exhibit higher sensitivity or responsiveness to high nitrogen inputs, while others, such as certain indigenous varieties, may demonstrate better adaptability in biochar-amended soils. Aparna et al. studied genotypic differences in photosynthetic nitrogen use efficiency and nitrogen use efficiency in rice under different N levels [41], and Jebastin et al. appraised physiological parameters of indigenous rice varieties influenced by biochar [42].
In our experiment, the combination of low biochar application rate (B15) with conventional nitrogen fertilization (N225) proved most effective in enhancing the photosynthetic and transpiration characteristics of rice. This finding is partially consistent with Ali et al., who concluded that biochar combined with nitrogen fertilizer enhanced physiological and morphological traits of rice by improving soil physio-biochemical properties [43]. However, they identified a different optimal combination (B30 with N135) for improving soil health and rice yield. This discrepancy highlights the context-dependent nature of biochar effects. Differences in experimental conditions, such as soil type and distinct initial fertility, climatic factors between years or locations, rice cultivars used, and the specific properties of the biochar applied, can significantly influence the optimal application rates and the resulting agronomic outcomes [44]. Our results underscore that lower biochar application rates, when combined with conventional nitrogen, can be highly effective for improving rice physiology in our specific experimental setting, potentially offering a more economically viable and resource-efficient strategy for farmers.
5. Conclusions
The present study showed that SPAD value, net photosynthetic rate, and transpiration rate all increased initially and then decreased, peaking during the heading and flowering stages. Stomatal conductance was relatively high at the tillering stage, fluctuated, and declined as the plants matured. Intercellular CO2 concentration decreased initially, reached its lowest level at heading and flowering, and then increased. Water use efficiency first decreased, then increased, and finally declined again, while remaining relatively high during grain filling.
Among the treatments, N300B30 resulted in the highest chlorophyll SPAD value and net photosynthetic rate. Combinations of high nitrogen (N300, N225) and high biochar (B30) significantly enhanced transpiration rate across multiple growth stages. High nitrogen (N300, N225) with low biochar (B15) sustained relatively high stomatal conductance throughout all growth stages. The N300B15 treatment was most effective and stable in elevating intercellular CO2 concentration and improving water use efficiency.
Overall, the N225B15 treatment achieved the optimal balance of photosynthetic and transpiration performance, combined with cost-effectiveness, making it the most advantageous option for practical field application.
Author Contributions
Conceptualization, Y.J., Z.F. and Z.Z.; methodology, Z.X.; formal analysis, Y.J. and Z.X.; investigation, Y.J. and S.Y.; data curation, Z.Z. and S.Y.; writing—original draft preparation, Y.J. and Z.X.; writing—review and editing, Y.J., Z.Z. and Z.F.; funding acquisition, Y.J. All authors have read and agreed to the published version of the manuscript.
Funding
The research was supported by a project of the Department of Science and Technology in Jiangsu Province (No. BE2023400), and the National Natural Science Foundation Program (grant number: 42575208).
Data Availability Statement
The original contributions presented in this study are included in the article material. Further inquiries can be directed to the corresponding author.
Acknowledgments
The authors are grateful to Li Yucong and Ran Chuyu for their help in the field experiment. The authors are grateful to the four anonymous reviewers for their constructive and useful comments.
Conflicts of Interest
The authors declare no conflicts of interest.
References
- Mohidem, N.A.; Hashim, N.; Shamsudin, R.; Che Man, H. Rice for food security: revisiting its production, diversity, rice milling process and nutrient content. Agriculture (Switzerland) 2022, 12 (6), 741.
- Shen, Y.; Man, J. Changes in rice yield and yield stability in China during the past six decades. Journal of the Science of Food and Agriculture 2020, 100 (15), 3560 - 3569.
- Thakur, A.K.; Uphoff, N.; Stoop, W.A. Photosynthesis and transpiration rates of rice cultivated under the system of rice intensification and the effects on growth and yield. Agronomy Journal 2009, 101 (6), 1644 - 1653.
- Christine Beusch. Biochar as a Soil Amelior: How biochar properties benefit soil fertility—a review. Journal of Geoscience and Environment Protection 2021, 10.
- Lehmann, J.; Joseph, S. Biochar production technologies from agricultural waste, its utilization in agriculture and current global biochar market: a comprehensive review. Agronomy for Sustainable Development 2015, 35 (4), 801 - 816.
- Desjardins, S.M.; Ter-Mikaelian, M.T.; Chen, J. Cradle-to-gate life cycle analysis of slow pyrolysis biochar from forest harvest residues in Ontario, Canada. Resources, Conservation and Recycling 2024, 196, 106416. [Google Scholar] [CrossRef]
- Hu, W.; Zhang, Y.; Rong, X.; et al. Biochar and organic fertilizer applications enhance soil functional microbial abundance and agroecosystem multifunctionality. Biochar 2024, 6, 3. [Google Scholar] [CrossRef]
- Jie, C.; Sun, Q.; Liu, L. Modified biochar-immobilized Bacillus spp. for the release of nutrients and its response to soil microbial community activity and structure. Industrial Crops and Products 2025, 225, 120466. [Google Scholar] [CrossRef]
- Zhang, M.; Liu, Y.; Wei, Q.; Liu, L.; Gu, X.; Gou, J.; Wang, M. Chemical fertilizer reduction combined with biochar application ameliorates the biological property and fertilizer utilization of pod pepper. Agronomy 2023, 13(6), 1616. [Google Scholar] [CrossRef]
- Agarwal, H.; Kashyap, VH. ;Mishra A, Bordoloi S, Singh PK, Joshi NC. Biochar-based fertilizers and their applications in plant growth promotion and protection. 3 Biotech 2022, 12 (6), 136.
- An, N.; Zhang, L.; Liu, Y.X.; Shen, S.; Li, N.; Wu, Z.C.; Yang, J.F.; Han, W.; Han, X.R. Biochar application with reduced chemical fertilizers improves soil pore structure and rice productivity. Chemosphere 2022, 298, 134304. [Google Scholar] [CrossRef]
- Zhang, Y.; Li, H.; Wang, X.; et al. Combined application of biochar with nitrogen fertilizer improves soil quality and reduces soil respiration whilst sustaining wheat grain yield in a semiarid environment. Agriculture, Ecosystems & Environment 2017, 247, 319–327. [Google Scholar]
- Wang, Y.; Zhang, X.; Zhang, H.; et al. Biochar application in combination with no tillage enhanced yield and grain quality of ratoon rice. Agriculture 2024, 14(8), 1407. [Google Scholar] [CrossRef]
- Li, X.; Wang, L.; Zhang, F. et al. Application of Peanut Shell Biochar Increases Rice yield in saline-alkali paddy fields by regulating leaf ion concentrations and photosynthesis rate. Soil Science Society of America Journal 2024, 88 (3), 678 - 689.
- Wang, Y.; Zhang, H.; Li, M.; et al. Rice Growth Performance, Nutrient use efficiency and changes in soil properties influenced by biochar under alternate wetting and drying irrigation. Agriculture, Ecosystems & Environment 2024, 339, 108213. [Google Scholar]
- Chen, G.; Li, H.; Zhang, Y. et al. Transpiration response of upland rice to water deficit changed by different levels of eucalyptus biochar. Plant and Soil 2023, 488 (1 - 2), 123 - 135.
- Pereira, R.G.; Madari, B.E.; Carvalho, M.N. Transpiration response of upland rice to water deficit changed by different levels of eucalyptus biochar. Biochar 2012, 2012 (1), 716 - 721.
- Hartono, E.; Willems, O.; Bai, X.; Wood, B.; Rekaya, R.; Aggrey, S. Effect of Transformation of Non-Normal Fitness Trait Data on the Estimation of Genetic Parameters in Turkeys. Journal of Animal Breeding and Genetics. 2025,142. 10.1111/jbg.12935.
- Webster, R.; Lark, R. ;. Analysis of variance in soil research: Examining the assumptions. European Journal of Soil Science. 2019,70. 990-1000. 10.1111/ejss.12804.
- Osborne J. W. Improving your data transformations: Applying the Box- Cox transformation [J]. Practical Assessment Research & Evaluation, 2010, 15:9. https://doi:10.7275/QBPC-GK17.
- Emmanuel Ehnon Gongnet, Romaric Vihotogbé, Codjo Emile Agbangba, Tranquillin Affossogbé, Koye Djondang and Romain Glèlè Kakaï, Impact of BoxCox transformation technique on the Bayesian maximum entropy (BME) prediction accuracy, JP Journal of Biostatistics 25(1) (2025), 127-144. [CrossRef]
- Othman A., R.; Yin T., S.; Keselman H., J. Robust Modifications of the Levene and O’Brien tests for spread[J]. Journal of modern applied statistical methods: JMASM, 2012, 11(1):54-68. [CrossRef]
- Xiong, D.; Chen, J.; Yu, T.; et al. SPAD-based leaf nitrogen estimation is impacted by environmental factors and crop leaf characteristics. Sci Rep 2015, 5, 13389. [Google Scholar] [CrossRef]
- Meng Z.; Liu, Y.; Wei.; Gou J. Biochar enhances the retention capacity of nitrogen fertilizer and affects the diversity of nitrifying functional microbial communities in karst soil of southwest China. Ecotoxicology and Environmental Safety 2021.
- Hou, W.; Tränkner, M.; Lu, J. Interactive effects of nitrogen and potassium on photosynthesis and photosynthetic nitrogen allocation of rice leaves. BMC Plant Biol 2019, 19, 302.
- Lehmann, J.; Rillig, M.C.; Thies, J.; Masiello, C.A.; Hockaday, W.C.; Crowley, D. Biochar effects on soil biota – A review. Soil Biology and Biochemistry 2011, 43 (9), 1812 - 1836.
- Chen, R.; Zheng, L.; Zhao, J.; Ma, J.; Li, X. Biochar application maintains photosynthesis of cabbage by regulating stomatal parameters in salt-stressed soil. Sustainability 2023, 15, 4206. [Google Scholar] [CrossRef]
- Yeboah, S.; Zhang, R.; Cai, L.; et al. Soil water content and photosynthetic capacity of spring wheat as affected by soil application of nitrogen-enriched biochar in a semiarid environment. Photosynthetica 2017, 55, 532–542. [Google Scholar] [CrossRef]
- Qi, L.; Ding, R.; Du, T.; Kang, S.; Tong, L.; Sien, Li. Stomatal conductance drives variations of yield and water use of maize under water and nitrogen stress. Agricultural Water Management 2022, 268, 107651. [Google Scholar] [CrossRef]
- Wormer T., M. The Effect of Soil Moisture, Nitrogen fertilization and some meteorological factors on stomatal aperture of coffea arabica L. Annals of Botany 1965, 29 (4), 523 - 539.
- Abdul, R.; Shahid, N.; Huda, A.; Sulaiman, A.; Wei, Y.; Muhammad, Z. Effects of manure-based biochar on uptake of nutrients and water holding capacity of different types of soils. Case Studies in Chemical and Environmental Engineering 2020, 2, 100036. [Google Scholar] [CrossRef]
- Lustosa C., M.; Tuzzin de M., M.; Cerri, C.E.P.; Cherubin, M.R. Biochar amendment enhances water retention in a tropical sandy soil. Agriculture 2020, 10, 62. [Google Scholar] [CrossRef]
- Kun, Y.; Jiang, Y.; Wang, J.; Cai, X.; Wen, Z.; Qiu, Z.; Qiao, G. Tobacco straw biochar improved the growth of Chinese cherry (Prunus pseudocerasus) via altering plant physiology and shifting the rhizosphere bacterial community. Scientia Horticulturae 2022, 303, 111244. [Google Scholar] [CrossRef]
- Farhangi-Abriz, S.; Torabian, S. Biochar increased plant growth-promoting hormones and helped to alleviates salt stress in common bean seedlings. J Plant Growth Regul 2018, 37, 591–601. [Google Scholar] [CrossRef]
- Yang, G.; Shao, G.; Lu, J.; Zhang, K.; Wu, S.; Wang, Z. Effects of biochar application on crop water use efficiency depend on experimental conditions: A meta-analysis. Field Crops Research 2020, 249, 107763. [Google Scholar] [CrossRef]
- Wan, H.; Chen, Y.; Cui, B. Biochar amendment increases c and n retention in the soil–plant systems: its implications in enhancing plant growth and water-use efficiency under reduced irrigation regimes of maize (Zea mays L.). J Soil Sci Plant Nutr 2023, 23, 1576–1588. [Google Scholar] [CrossRef]
- Parasar, B.J.; Agarwala, N. Unravelling the role of biochar-microbe-soil tripartite interaction in regulating soil carbon and nitrogen budget: a panacea to soil sustainability. Biochar 2025, 7, 37. [Google Scholar] [CrossRef]
- Cisse, A.; Zhao, X.; Fu, W.; Kim, R.E.R.; Chen, T.; Tao, L.; Feng, B. Non-Photochemical quenching involved in the regulation of photosynthesis of rice leaves under high nitrogen conditions. Int J Mol Sci 2020, 21(6), 2115. [Google Scholar] [CrossRef]
- Schulz, H.; Dunst, G.; Glaser, B. Positive effects of composted biochar on plant growth and soil fertility. Agron. Sustain. Dev. 2013, 33, 817–827. [Google Scholar] [CrossRef]
- Shi, R.; Li, J.; Ni, N.; Xu, R. Understanding the biochar’s role in ameliorating soil acidity. Journal of Integrative Agriculture 2019, 18 (7), 1508 - 1517.
- Aparna, V.; Narender Reddy, S.; Subrahmanyam, D. Study on genotypic differences in photosynthetic nitrogen use efficiency, nitrogen use efficiency, yield and yield related traits in different rice genotypes under different nitrogen levels. Int. J. Curr. Microbiol. App. Sci. 2019, 8 (4), 2484 - 2493.
- Jebastin, T.; Priyadharshini, S.; Margret, A.A.; Rajadurai, M. Relative physiological parameter appraisal on indigenous rice variety of South India (Kattuyanam) in contrary to the contemporary cultivars (Andhra Ponni) influenced by biochar. Ecological Genetics and Genomics 2022, 25, 100138. [Google Scholar] [CrossRef]
- Ali, I.; Zhao, Q.; Wu, K.; Ullah, S.; Iqbal, A. Biochar in combination with nitrogen fertilizer is a technique: to enhance physiological and morphological traits of rice (Oryza sativa l.) by improving soil physio-biochemical properties. Journal of Plant Growth Regulation 2021, 41 (6), 1 - 15.
- Bai S., H.; Omidvar, N.; Gallart, M. Combined effects of biochar and fertilizer applications on yield: A review and meta-analysis[J].Science of the Total Environment, 2022(808-): 808. 10. 1016 /j.scitotenv.2021.152073.
Figure 1.
Daily mean temperature and daily cumulative precipitation during rice growth period in 2022(a) and 2023(b).
Figure 1.
Daily mean temperature and daily cumulative precipitation during rice growth period in 2022(a) and 2023(b).
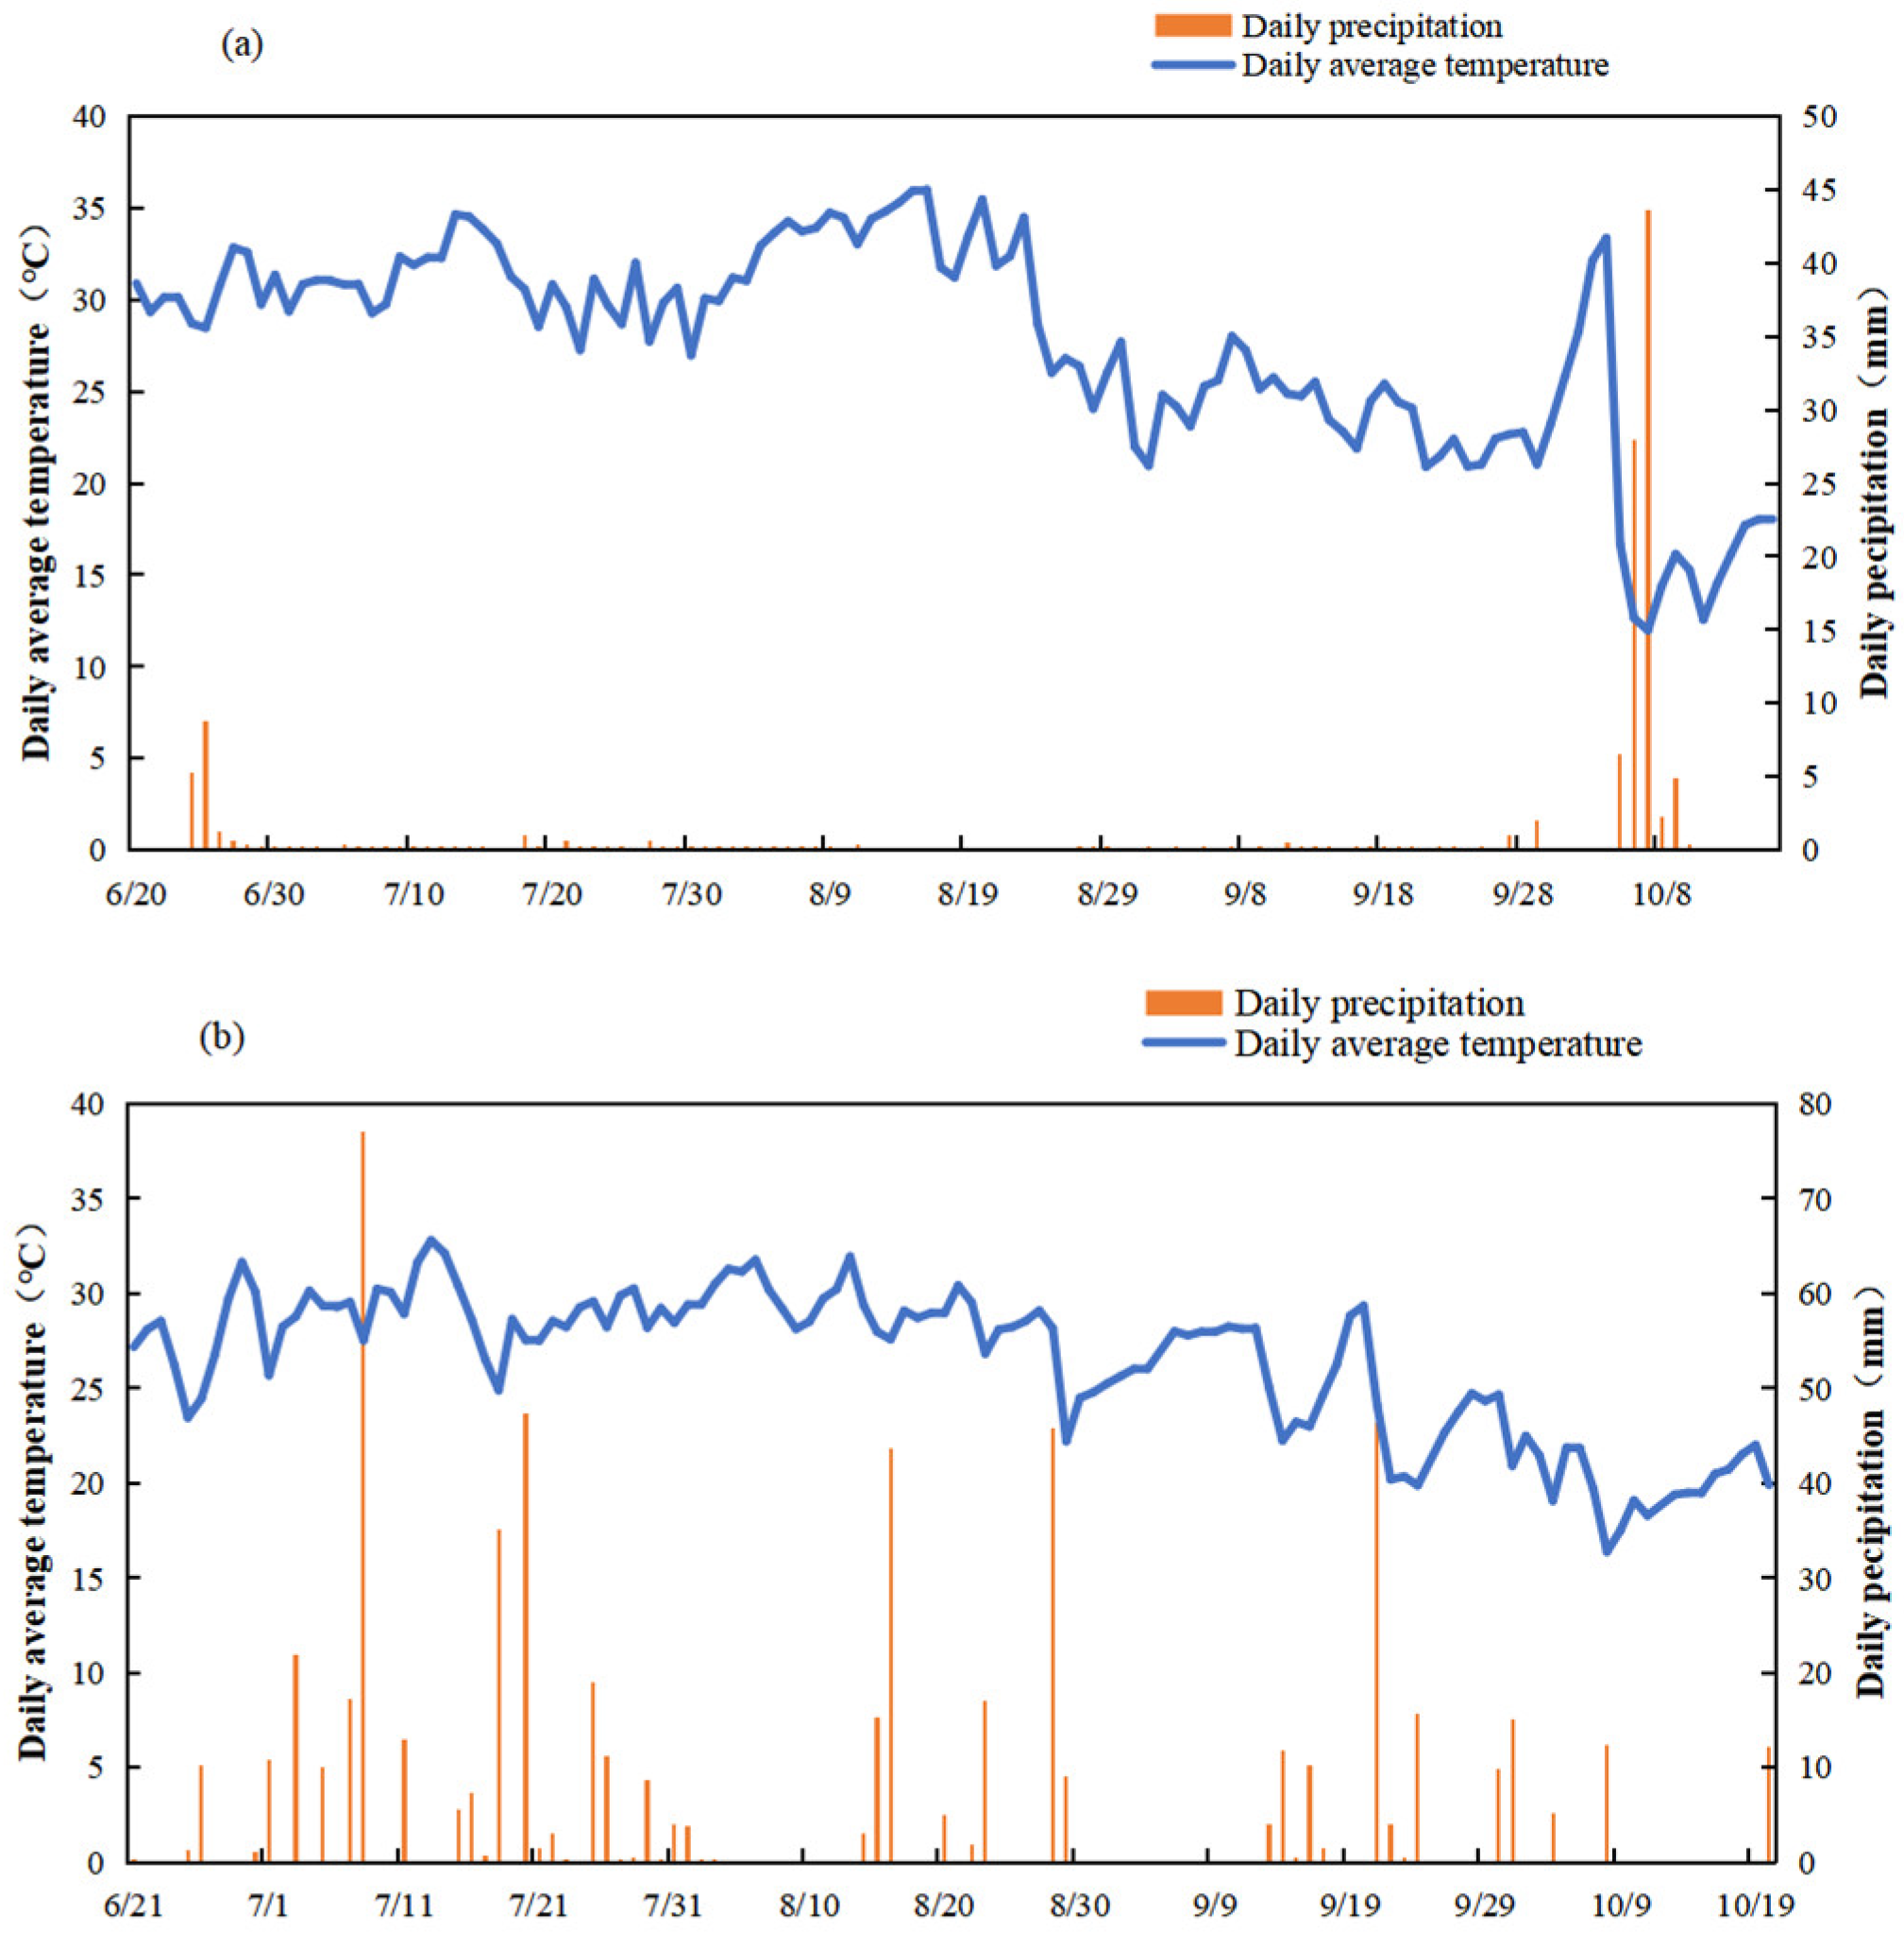
Table 1.
Growth Stages of Rice in 2022 and 2023.
| Year | Tillering |
Jointing, booting |
Heading, flowering |
Filling | Maturity |
| 2022 | 7.1 ~ 7.28 | 7.29 ~ 8.24 | 8.25~ 9.8 | 9.9 ~ 9.25 | 9.26 ~ 10.16 |
| 2023 | 7.1 ~ 7.31 | 8.1 ~ 8.26 | 8.27 ~ 9.10 | 9.11 ~ 9.26 | 9.27 ~ 10.16 |
Table 4.
Regression equation for net photosynthetic rate of rice leaves under different treatments.
| Treatment | Regression equation | R2 | P | |
|
B0 |
N0 |  |
0.561 | <0.001 |
| N180 |  |
0.737 | <0.001 | |
| N225 |  |
0.610 | <0.001 | |
| N300 |  |
0.798 | <0.001 | |
| B15 | N0 |  |
0.723 | <0.001 |
| N180 |  |
0.632 | <0.001 | |
| N225 |  |
0.731 | <0.001 | |
| N300 |  |
0.663 | <0.001 | |
| B30 | N0 |  |
0.695 | <0.001 |
| N180 |  |
0.676 | <0.001 | |
| N225 |  |
0.658 | <0.001 | |
| N300 |  |
0.500 | 0.001 | |
Note: Pn:net photosynthetic rate; Ta: atmosphere temperature; VPD: vapor pressure deficit; Rh:relative humutidy; Ci: CO2 concentration of intercell; Ca: CO2 concentration of atmosphere.
Disclaimer/Publisher’s Note: The statements, opinions and data contained in all publications are solely those of the individual author(s) and contributor(s) and not of MDPI and/or the editor(s). MDPI and/or the editor(s) disclaim responsibility for any injury to people or property resulting from any ideas, methods, instructions or products referred to in the content. |
© 2025 by the authors. Licensee MDPI, Basel, Switzerland. This article is an open access article distributed under the terms and conditions of the Creative Commons Attribution (CC BY) license (http://creativecommons.org/licenses/by/4.0/).
Copyright: This open access article is published under a Creative Commons CC BY 4.0 license, which permit the free download, distribution, and reuse, provided that the author and preprint are cited in any reuse.


