1. Introduction
Autophagy is a self-digestive process that maintains cellular homeostasis by removing unnecessary or dysfunctional components through a lysosome-mediated mechanism. Macroautophagy, here in after referred to as
autophagy for practical purposes, is activated under stress conditions, such as nutrient deprivation, infection, and hypoxia. It is characterized by the formation of double-membrane vesicles called autophagosomes that surround the cargo (damaged organelles, protein aggregates, or cytoplasmic material) and then fuse with lysosomes to degrade its contents [
1,
2]. At the molecular level, the process follows five key stages: (1) Autophagy induction; (2) phagophore nucleation; (3) elongation of the phagophore; (4) autophagosome generation, and (5) autophagolysosome formation, where cargo proteins are degraded by lysosomal hydrolases. A set of genes encoding the “core” molecular machinery of autophagy, called ATG proteins, has been identified [
3,
4,
5]. To date, 31 central
atg genes have been transcribed and translated into ATG proteins, organized into five subgroups: (1) ULK complex, a serine/threonine kinase complex that responds to signals like nutrient deprivation to start autophagy; (2) Class lll Ptdlns3K complex, responsible for initiating the phagophore formation by generating phosphatidylinositol-3-phosphate (PtdIns3P) that helps recruit other ATG proteins, including (3) the WIPI/ATG18-ATG2 complex, involved in phagophore expansion and closure, and (4) two membrane proteins, ATG9/mAtg9 and VMP1, that provide membrane to the forming phagophore; and (5) two ubiquitin-like protein conjugation systems (Ubl) (ATG12 and ATG8/LC3) that are critical for phagophore elongation, and the formation and expansion of the autophagosome, respectively [
6,
7]. As the work is focused on this fifth subgroup, a more detailed description of the processes involved is presented.
The two ubiquitin-like conjugation systems include the Ubl proteins (ATG12 and ATG8/LC3), an activating enzyme (ATG7), two ubiquitin-conjugating enzyme analogues (ATG10 and ATG3), an ATG8/LC3-modifying protease (ATG4), the ATG12-binding protein (ATG5), and ATG16 [
8]. These conjugation systems are widely conserved in eukaryotes and have essential roles. Specifically, the ATG8 conjugation system is involved in membrane elongation, cargo protein recognition, autophagosome closure, autophagosome trafficking, autophagosome-lysosome fusion, and inner membrane degradation [
9]. However, lipidation of the ATG8/LC3 protein is necessary to perform its functions, for which the C-terminal end of ATG8/LC3 is cleaved by an ATG4 protease of the C54 family of autophagins to expose a glycine residue (Gly) to which a phosphatidylethanolamine (PE) is added, which enables the binding to the phagophore membranes to form autophagosomes. To allow the fusion of the autophagosome with the lysosome, the PE binding is known to be reversible, as the ATG4 protease, in a second event, removes the ATG8/LC3-PE bound to the outer membrane of the autophagosome, leaving again a Gly-exposed ATG8/LC3 [
10,
11].
Trichomonas vaginalis is the causative agent of trichomoniasis, the most common non-viral sexually transmitted infection (STI) worldwide, with more than 275 million cases annually [
12]. In women, the infection manifests mainly with foamy, foul-smelling, greenish-yellow vaginal discharge. It is accompanied by pruritus, vulvar irritation, abdominal pain, edema, and a slight increase in vaginal pH (≥ 5.0). In severe cases, it has been linked to cervical neoplasia and pelvic inflammatory disease [
13]. In men,
T. vaginalis can cause urethral irritation, mild discharge, or burning after urinating or ejaculating, epididymitis, and prostatitis. However, ~85% of women and ~77% of men may be asymptomatic carriers [
14,
15].
T. vaginalis infection is also associated with infertility, preterm birth, low birth weight, and increased susceptibility to human immunodeficiency virus (HIV) infection and transmission [
13,
15]. It is considered a risk factor for cervical and prostate cancer [
13].
In
T. vaginalis, autophagy has been described as an adaptive mechanism under several nutrient conditions, including low and high glucose, or low and high iron [
16,
17,
18]. Two autophagy marker proteins have been characterized: TvAtg8a (
TVAGG3_0691340) and TvAtg8b
(TVAGG3_0430750). TvAtg8a is associated with autophagosomes under glucose restriction (GR) conditions, while under high glucose (HG) conditions, autophagy is activated as a compensatory proteolytic degradation system when proteasome activity is inhibited [
17]. TvAtg8b is another autophagy marker that is induced under GR or iron restriction (IR) conditions, and in the presence of rapamycin. TvAtg8b was identified in lysosomes, and lipidated and non-lipidated forms were detected under the different autophagy-inducing conditions tested [
18]. Together, these results show that autophagy in
T. vaginalis can be induced through several signaling pathways [
16,
17,
18]. Although the processing of the ATG8 family of proteins at the C-terminal end must be carried out by a protease of the C54 family of autophagins, so far, the participation of autophagin-like proteases in the processing of the TvAtg8a and TvAtg8b proteins in
T. vaginalis has not been reported.
Genomic sequences that encode five TvAtg4-type proteins called TvAtg4.1 (TVAGG3_0280010), TvAtg4.2 (TVAGG3_0421160), TvAtg4.3 (TVAGG3_0930750), TvAtg4.4 (TVAGG3_0673040), and TvAtg4.5 (TVAGG3_0264470) have been found in the genome of
T. vaginalis. Transcriptomic results under GR and HG conditions showed
tvatg4.1 with the highest expression in GR, followed by
tvatg4.4 [
16]. However, only TvAtg4.4 was detected in the proteomes of parasites grown under different iron conditions [
19].
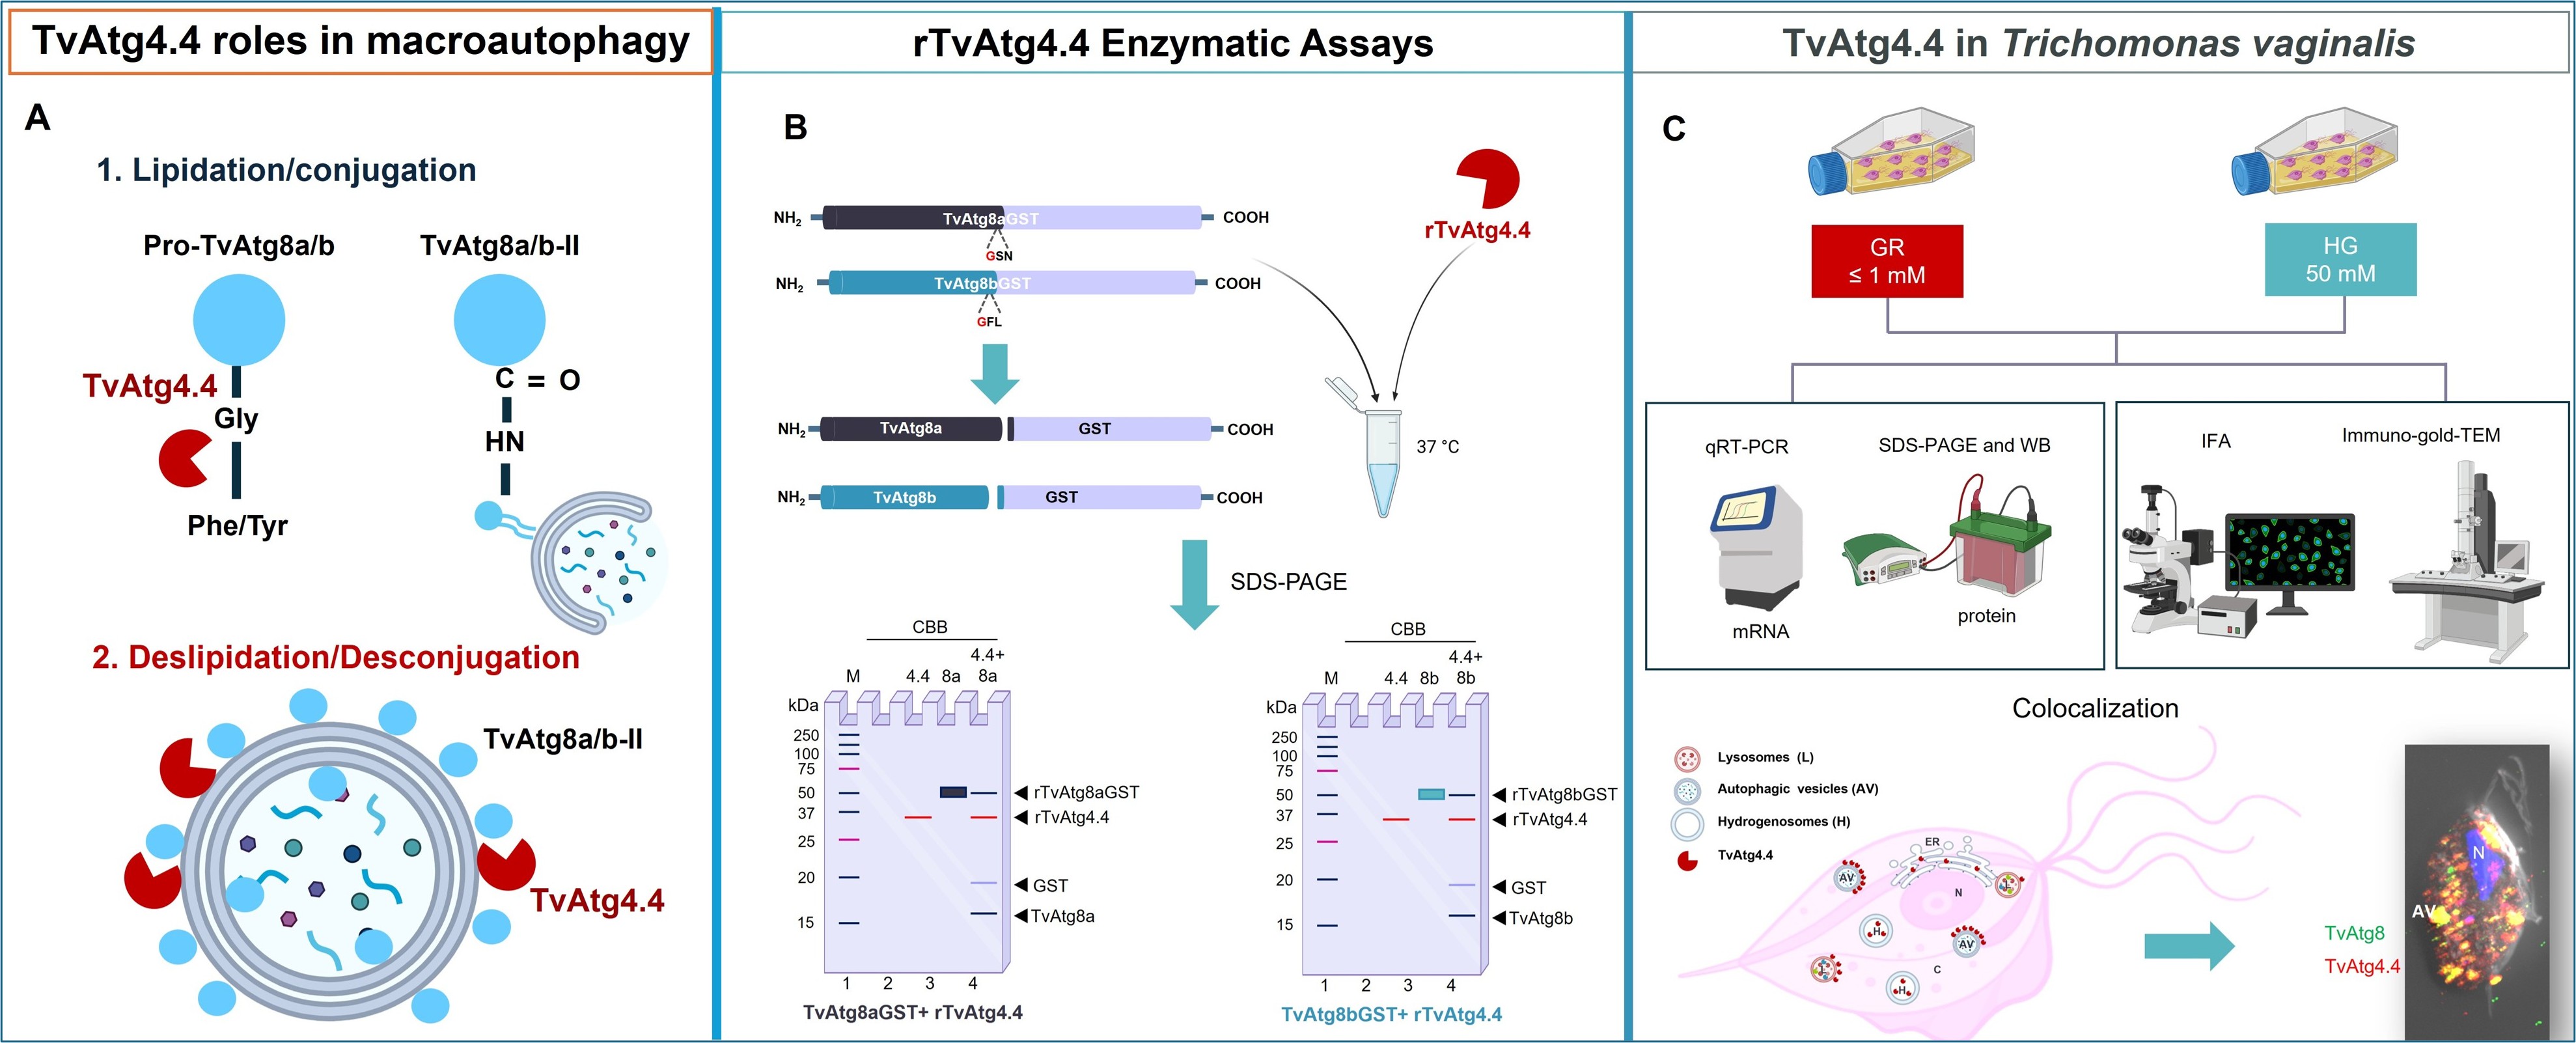
Due to the importance of lipidation of TvAtg8a and TvAtg8b for the autophagic process, in this work, we evaluated the processing capacity of the recombinant protease TvAtg4.4 in vitro, as a model autophagin molecule, using purified recombinant substrates, rTvAtg8GST and rTvAtg8bGST. In addition, we analyzed the effects of different glucose concentrations on the expression and localization of the TvAtg4.4 protease in T. vaginalis under autophagy-inducing conditions. Our results provide insight into the molecular mechanisms of autophagy in T. vaginalis by elucidating the enzymatic function and cellular localization of TvAtg4.4, which may have novel roles in parasite biology.
3. Discussion
Autophagy is a fundamental process to maintain cellular homeostasis. Different forms of autophagy have been described, and the various pathways followed by each of them have been reported in many eukaryotes. However, the process in lower eukaryotes, such as in the protozoan parasite
T. vaginalis has only started to be revealed by studying the mechanism of autophagy induced by cultivation under GR and HG conditions, or iron-restriction (IR) and high (HI) iron conditions [
16].
During autophagy, membrane elongation, cargo protein recognition, autophagosome closure, autophagosome trafficking, autophagosome-lysosome fusion, and inner membrane degradation involves the ATG8 conjugation system, one of the two ubiquitin-like conjugation systems widely conserved in eukaryotes that are essential during autophagy [
9]. Lipidation of ATG8 is necessary to perform its functions, for which an ATG4 protease of the C54 family of autophagins must cleave the C-terminal end of ATG8 to expose a glycine residue (Gly) that allows the addition of phosphatidylethanolamine (PE), a crucial step for the binding of phagophore membranes to form autophagosomes.
Due to the importance of lipidation of TvAtg8a and TvAtg8b for the autophagic process, in this work, as an autophagin model molecule, we evaluated the processing capacity of the recombinant protease TvAtg4.4 in vitro using purified substrates, rTvAtg8GST and rTvAtg8bGST. In addition, we analyzed the effects of different glucose concentrations on the expression and localization of the TvAtg4.4 protease in T. vaginalis under autophagy-inducing conditions. Our results provide insight into the molecular mechanisms of autophagy in T. vaginalis by elucidating the enzymatic function and cellular localization of TvAtg4.4, which may have novel roles in parasite biology.
Five TvAtg4-like proteins have been reported in the genome of
T. vaginalis (TvAtg4.1, TvAtg4.2, TvAtg4.3, TvAtg4.4, and TvAtg4.5). While transcription of
tvatg4.1, followed by
tvatg4.4 seems to peak under GR conditions [
16], translation of
tvatg4.4 into a protein was detected only under IR and HI conditions [
19]. Here we identify TvAtg8a and TvAtg8b as substrates of TvAtg4.4 and describe rTvAtg4.4 autophagin
in vitro activity by demonstrating by SDS-PAGE the release of GST and TvAtg8a or TvAtg8b, when using recombinant TvAtg8aGST or TvAtg8bGST as substrates [
28].
T. vaginalis proteins TvAtg8a and TvAtg8b share 44% identity and, like many other organisms including
H. sapiens’ ATG8 contain the conserved Gly residue that is required for recognition by the TvAtg4.4 protease (
Supplementary Figure S1).
Despite differences in secondary structure compared to the crystallized HsATG4B, TvAtg4.4 autophagin maintains the two main domains of the C54 family: i) the protease domain and its two distinct subdomains, containing the catalytic triad Cys
52/Asp
214/His
216. ii) The auxiliary domain formed by two α-helices (
Figure 2). Reports on the crystal structure of HsATG4B show that it is self-inhibited by a cap loop formed by a GKPNSA motif and by Trp
142, which is close to the catalytic Cys
52. and is also involved in substrate recognition, as mutation of the residue results in protease activity loss.
In silico analysis of TvAtg4.4 revealed similarities to HsATG4B, such as the cap loop and the conserved Trp
116 (
Figure 2B) [
20,
22]. Identifying the APEAR and cLIR motifs (
Figure 2) at the
in silico level in TvAtg4.4 suggests that there is a timely regulation in the autophagosome deconjugation of TvAtg8-PE by TvAtg4.4. Therefore, we propose that TvAtg4.4 autophagin follows the model already reported during the biogenesis of the autophagosome, where the LIR junction pocket is protected to avoid premature interaction between TvAtg4.4 and TvAtg8a/b in cytoplasm and in the inner membrane of the autophagosome, due to steric impediment and/or competition, avoiding association. In addition, the APEAR motif could allow specific recognition of the TvAtg8a/b-PE C-terminal for its autophagic membrane deconjugation [
21,
29,
30]. Further experiments are needed to corroborate whether it also participates in the recognition of TvAtg8a or TvAtg8b (
Figure 2C).
Having confirmed
in silico that TvAtg4.4 has the canonical catalytic triad of the autophagin family, we evaluated whether the rTvAtg4.4 protease could process the recombinant substrates TvAtg8aGST and TvAtg8bGST. Increasing concentrations of rTvAtg4.4 with the rTvAtg8aGST substrate resulted in a linear digestion rate (
Figure 4), which has been previously reported for other autophagins [
31]. Under these conditions, no enzymatic activity was observed when using rTvAtg8bGST as substrate, even at high protease concentrations. This result was surprising and led us to search for enzyme hysteresis, where enzymes that can exhibit slow protease activity due to sudden changes in substrate ligand or activator, concentration, leading to the wrong conclusion that the protease is inactive. In these cases, it is suggested to increase protease interaction for extended periods, which could reveal the catalytic activity [
32,
33]. Thus, we tested the enzyme activity during increased interaction times with each substrate (
Figure 5). rTvAtg4.4 showed higher
in vitro enzymatic activity for TvAtg8aGST compared to TvAtg8bGST, requiring incubations of only 15 min for the former and 3 h for the latter. We therefore propose that rTvAtg4.4 displays enzymatic hysteresis towards TvAtg8bGST, assuming that TvAtg8bGST triggers a slow conformational change upon contact with the protease. The different enzymatic activities observed in rTvAtg4.4 with its two
T. vaginalis substrates is consistent with reports of the activity of other ATG4s. For example,
H. sapiens ATG4A can cleave the C-terminal end of all ATG8 isoforms; however, processing occurs at different times, ranging from 3 to 300 min [
34].
Another explanation of the faster processing time of TvAtg8a vs. TvAtg8b could lay in the aa residue found before the C-terminal Gly. ATG4 requires the presence of Gly at the C-terminal end of ATG8 as mutations to Ala or its elimination results in the lack of enzymatic activity [
35]. In addition, ATG4 shows higher specificity for its substrate when a Phe residue precedes the Gly, whereas any other aa residue decreases the specificity [
34]. Interestingly, TvAtg8a does contain a Phe residue before the Gly, whereas TvAtg8b contains a Tyr residue (
Supplementary Figure S1). Therefore, the differential behavior of TvAtg4.4 against TvAtg8a and TvAtg8b could be due to the difference between the aa residues prior to Gly. To corroborate this hypothesis, enzymatic activity after mutation assays on the Gly and Phe residues of both substrates need to be recorded.
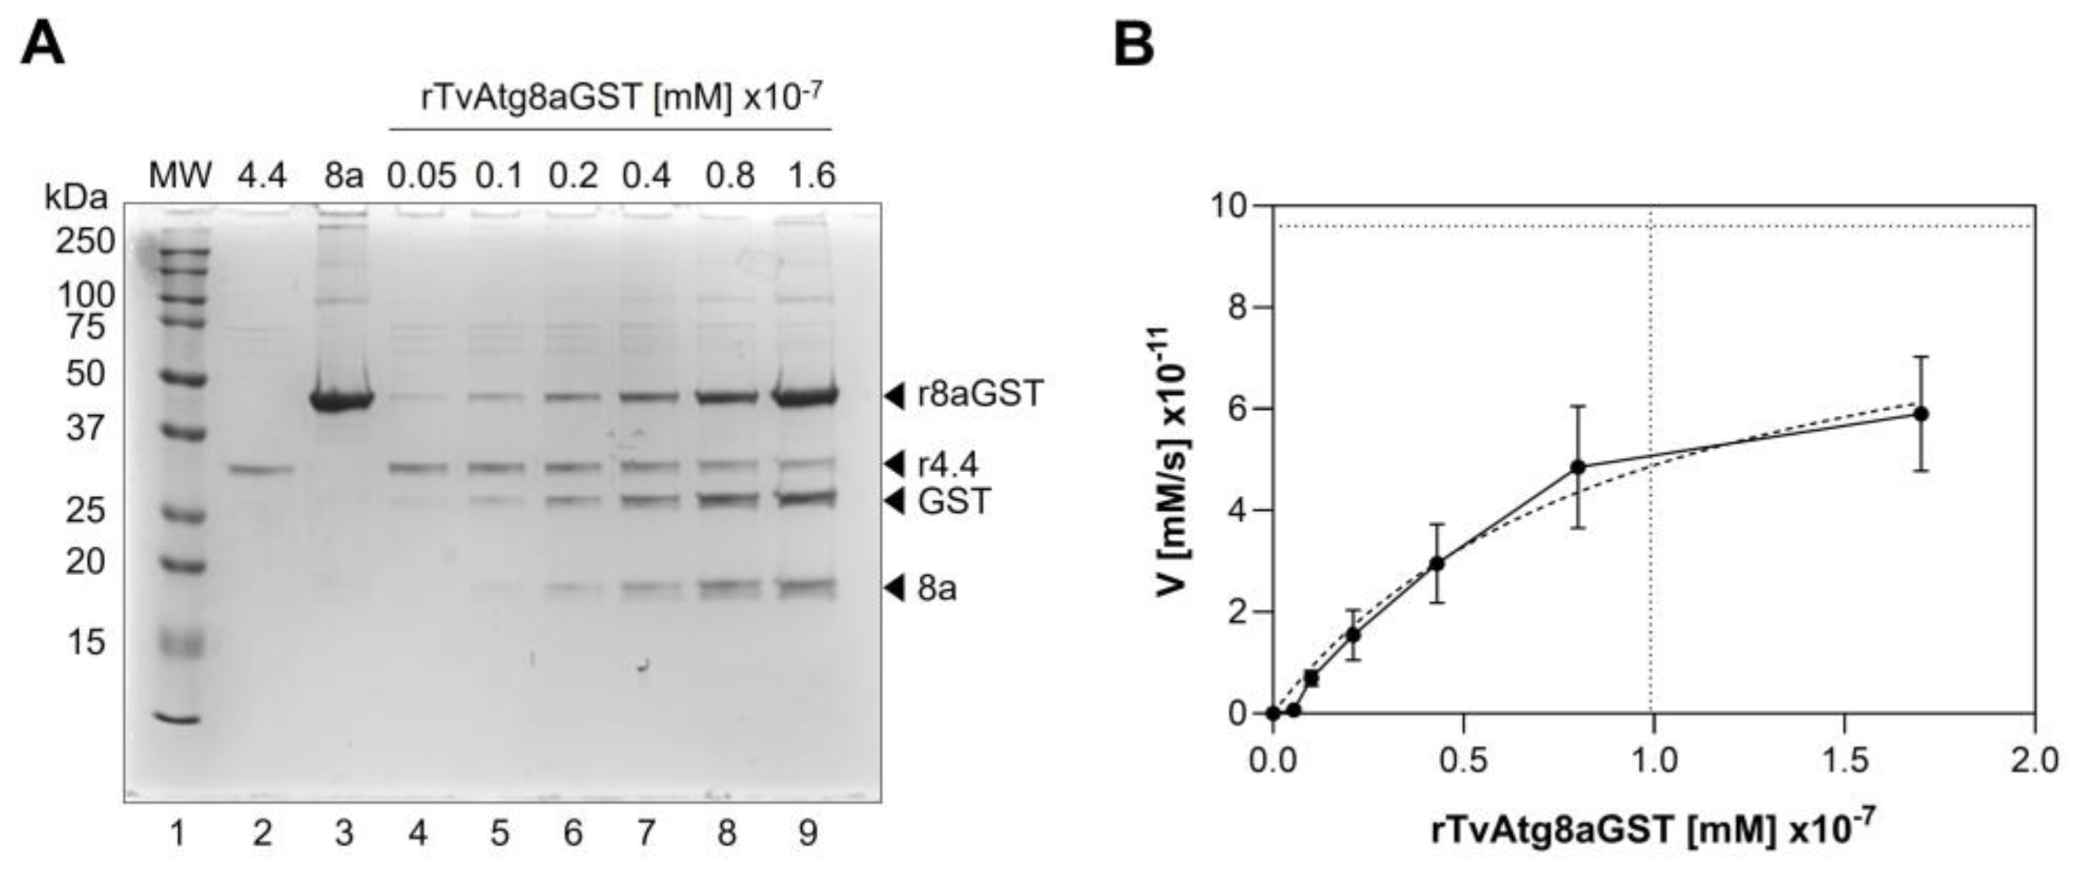
Determining the kinetic parameters of an enzymatic reaction helps analyzing the affinity towards its substrate (Km) and the maximum reaction speed [Vmax]. A small Km value indicates high affinity of the protease to its substrate [
36]. Here, we determined a Vmax value for TvAtg4.4 of 9.6 x 10
-11 mM/s, while the Km value was 9.9 x 10
-8 mM (9.9 x 10
-6 mol/L) for TvAtg8a (
Figure 6), which is comparable to HsATG4B Km of 5.1 x 10
-6 mol/L for its substrates [
33,
34,
37].
Proteases are grouped into families that share aa sequences; these, in turn, are classified into clans that share related tertiary structures [
38]. TvAtg4.4 belongs to the CA Clan and to the C54 or autophagin family. The CA clan is represented by papain-like proteases, characterized by using a cysteine residue for the hydrolysis of the bond to be catalyzed, where the catalytic triad Cys/Asn (or Asp)/His is always involved [
39]. We here report that TvAtg4.4 has the canonical catalytic triad (Cys
52/Asp
214/His
216) and that its activity depends on a cysteine residue through enzyme inhibition assays using protease inhibitors for the different
T. vaginalis protease families [
40,
41,
42]. The results presented in
Figure 7A and B showed that the rTvAtg4.4 activity was almost entirely inhibited by IAM and partially by E-64. This result confirms, as with other autophagins, its catalytic activity depends on Cys
52, since IAM alkylates the thiol group of Cys, forming a covalent bond (S-carboxydomethylcysteine) [
43]. Interestingly, partial inhibition of TvAtg4.4 activity was observed with E-64, a specific inhibitor of papain-like proteases that irreversibly binds to the thiol group of Cys. A complete inhibition of TvAtg4.4 catalytic activity was probably hindered by the closed cap loop near the active site, as identified in the
in silico analysis (
Figure 2C), which could prevent access of the large E-64 inhibitor, but not the small IAM molecule to the catalytic Cys
52 [
20,
43,
44]. Subsequent assays in which Cys
52 is deleted from TvAtg4.4 will help demonstrate whether its protease activity is due to this residue, and not to any other four remaining Cys.
Exploring the substrate specificity of rTvAtg4.4 [
45], we performed comparative assays using TvAtg8aGST or BSA, as substrates. Results corroborate the specificity of TvAtg4.4 for TvAtg8aGST (
Figure 7C and D), which is consistent with previous observations that processing of the ATG8 family is carried out solely by the C54 proteases [
46]. In addition, we corroborated this finding by FWB, which shows the direct binding of TvAtg4.4-TvAtg8aGST and TvAtg4.4-TvAtg8bGST (
Figure 7E and F) [
47].
Since nutrient stress has been reported to trigger autophagy in
T. vaginalis [
16], we analyzed the effect of GR and HG culture conditions on TvAtg4.4 activity. Glucose is the primary source of carbon and energy of
T. vaginalis; the parasite is exposed to different glucose levels during infection (0.3-36.65 mM) [
48]. HG provides optimal metabolic conditions for cell division and the establishment of infection, whereas GR conditions derive in metabolic stress and activation of survival pathways such as autophagy, leading to improved antioxidant capacity [
16]. In this work, we focused on analyzing the effect of different glucose conditions (GR and HG; ≤1 mM and 50 mM, respectively) on expression of
tvatg4.4 transcript, and amount and enzymatic activity of TvAtg4.4 in
T. vaginalis.
Results show that expression of
tvatg4.4 is positively regulated under GR conditions. These results agree with those previously reported by Huang
et al. (2019), who found that the different Atg4-type genomic sequences in
T. vaginalis are positively regulated under GR conditions [
16].
In silico analysis of the 5 ́ region of
tvatg4.4 showed basal transcription elements, but no typical glucose response elements (E-box) (
Figure 2) [
49]. An interesting challenge in the future will be to look for these regulatory sequences.
Analysis of TvAtg4.4 in WB assays using a polyclonal anti-rTvAtg4.4 antibody showed recognition of 5 bands (110, 45, 35, 27 and 22 kDa). Unlike other cysteine proteases,
T. vaginalis autophagin does not undergo proteolytic processing for its activation. Rather, its activation is substrate-dependent as in other autophagins. While the expected and calculated size of this protein is ~35 kDa, the observed ~45 and ~110 kDa bands could correspond to PTMs of the protein and the formation of oligomers, respectively. A regulatory mechanism of HsATG4B involves oxidation-reduction reactions, in which intra- and inter-molecular disulfide bridges form between Cys residues. Therefore, when using reducing agents (DTT), only one band should be observed. In contrast, oxidizing agents (H
2O
2) agent induced the formation of intramolecular bonds between Cys. Increasing the concentration of the oxidizing agent rises intermolecular bonds, leading to ATG4 oligomerization, the appearance of high-molecular-weight bands, and, ultimately, the loss of protease activity. Based on these observations, TvAtg4.4 high-molecular-weight bands could be due to low activity of the reducing agent (β-mercaptoethanol) compared to DTT [
50,
51,
52,
53]. Therefore, we could hypothesize around a spatiotemporal regulation of TvAtg4.4 protease activity through the formation of some ~110 kDa and higher molecular weight oligomers (
Figure 8, lane 15, star) that could be modulated by the presence of glucose. Degradation of the TvAtg4.4 autophagin could explain the ~27 and ~22 kDa bands (
Figure 8), supported by their lysosomal localization (
Figure 12).
In other eukaryotes, ATG4 participates in two ATG8 processing steps, 1) in the initiation of autophagy through the processing of newly synthesized ATG8 family proteins, and 2) in the removal of ATG8 from the outer membrane of the autophagosome prior to lysosome-autophagosome fusion [
26,
27,
28,
29,
30,
54,
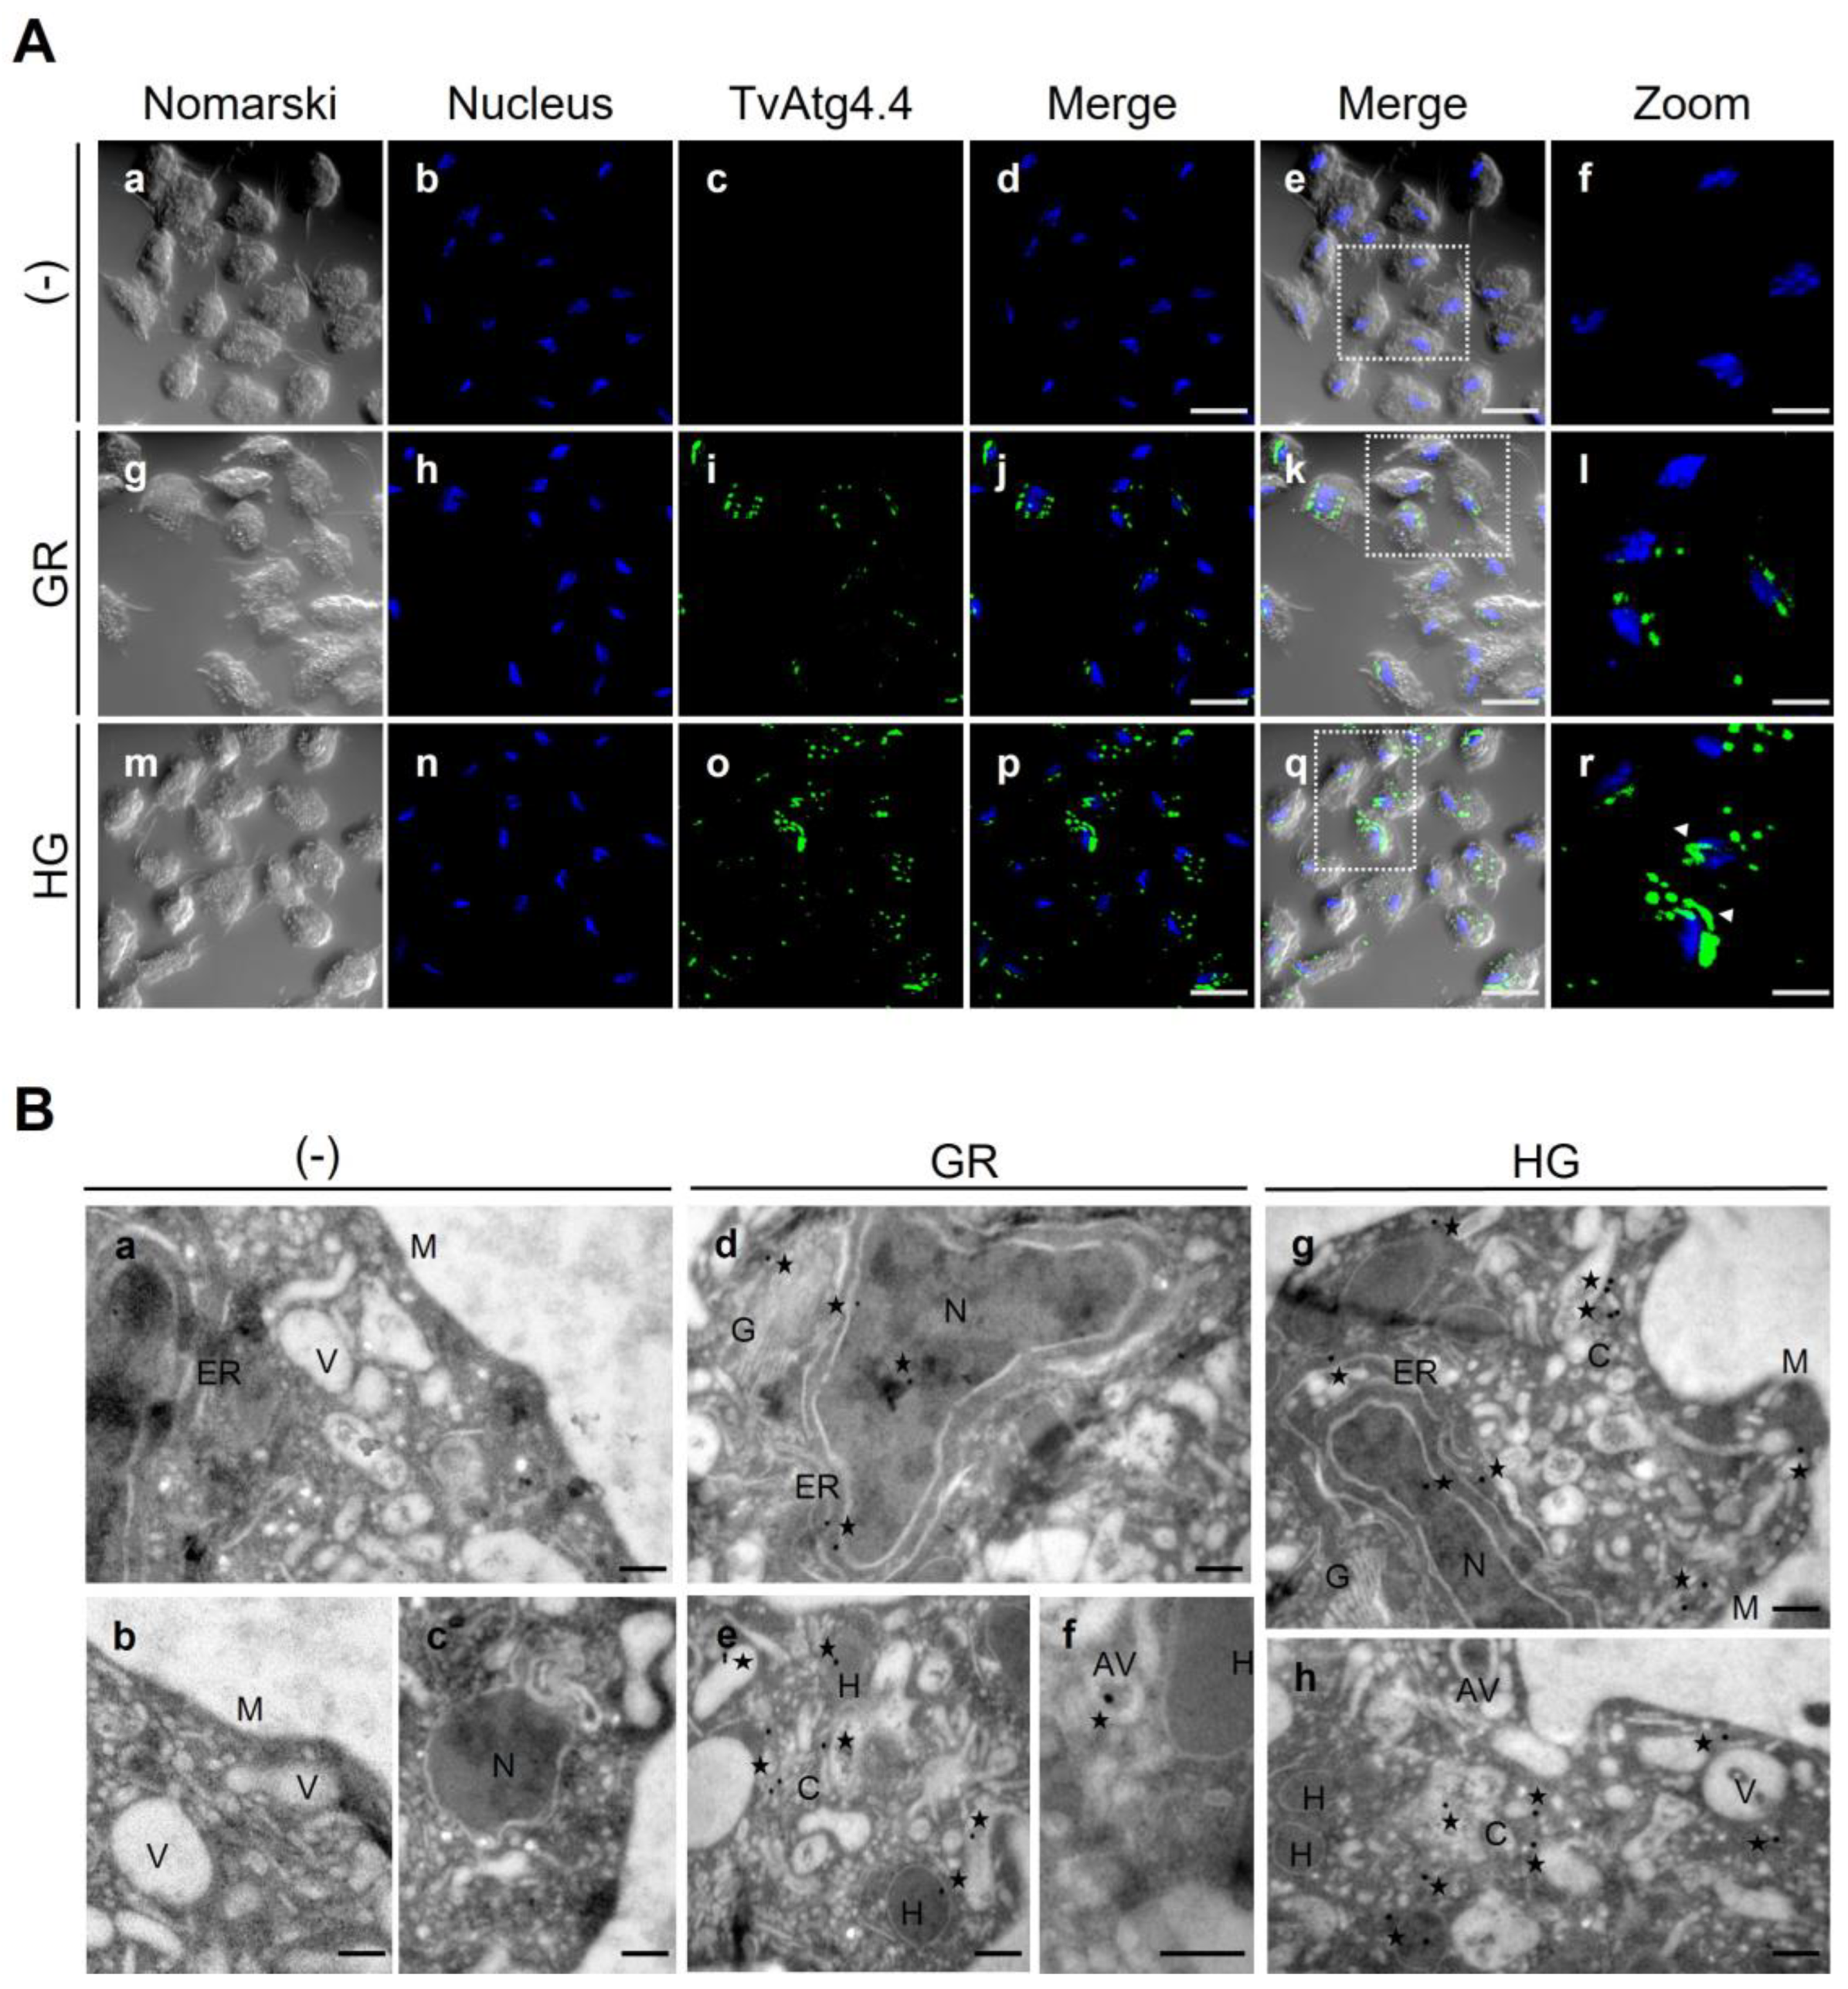
55]. This suggests that the autophagin family is localized in the cytoplasm and the ER. In our study, TvAtg4.4 was found in cytoplasm and ER, as other autophagins. In addition, TvAtg4.4 was also found in other compartments, V, AV, G, N, and H. IFA confirmed that TvAtg4.4 localized in autophagic vesicles (
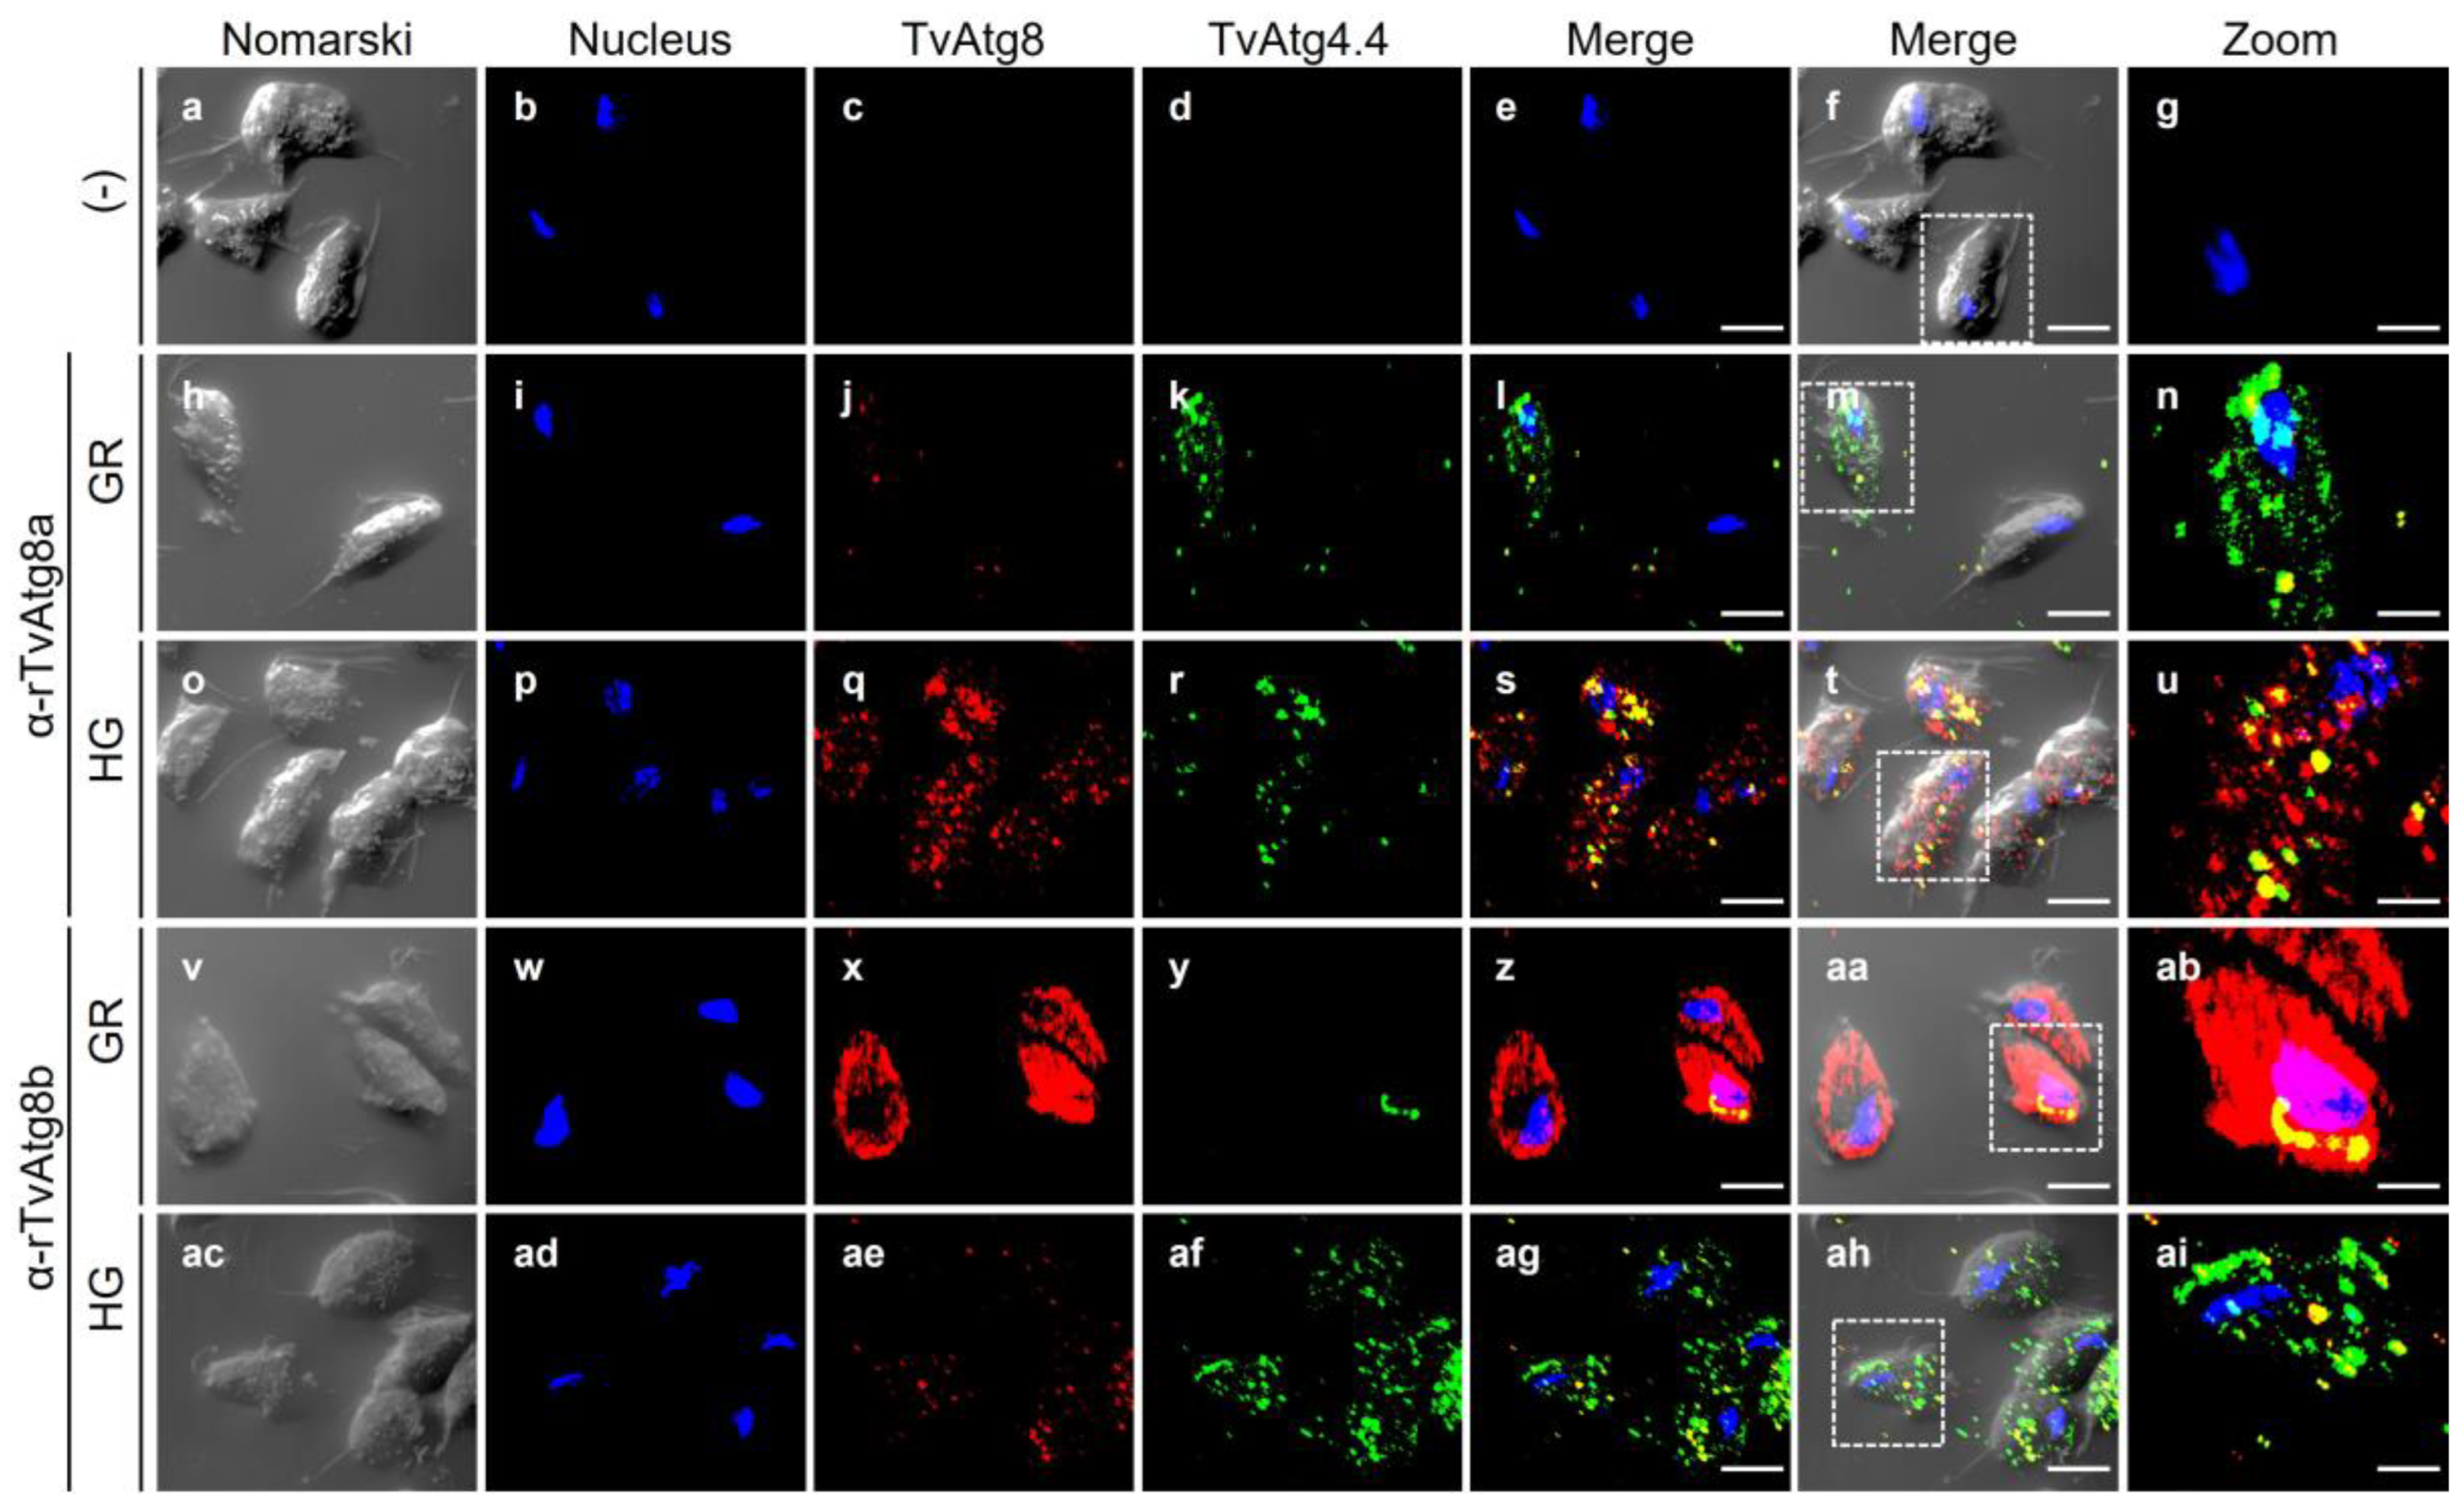
Figure 9), as revealed by its colocalization with the autophagy markers TvAtg8a and TvAtg8b, previously reported in
T. vaginalis [
17,
18]. However, some vesicles containing TvAtg4.4 (green) did not have autophagy markers; instead, colocalized in lysosomes using lysotracker as a marker. Thus, we also demonstrated the lysosomal origin of these vesicles (
Figure 12). The presence of low-molecular-weight bands by WB (~27 and ~22 kDa) (
Figure 8) suggest that TvAtg4.4 could be directed into the endolysosomal system for degradation [
55,
56].
In addition, immuno-gold-TEM images suggested the presence of TvAtg4.4 in hydrogenosomes. Using PFOa as a marker of hydrogenosomes [
27,
57,
58], we confirmed by IFA colocalization with TvAtg4.4 (
Figure 13). There are no reports on the presence of autophagins in hydrogenosomes. We present different hypotheses to explain this observation. i) Hydrogenosomal sequestration per se will avoid the cytoplasmic TvAtg4.4 enzymatic activity. ii) Since a regulatory mechanism for these proteins involves redox reactions that render them inactive, the hydrogenosome oxidative environment [
58,
59] may serve as a regulatory mechanism for TvAtg4.4 activation or deactivation by forming oligomers. iii) The presence of autophagic proteins such as TvAtg4.4 in hydrogenosomes could serve as a marker for a non-canonical secretory autophagy for PFOa via hydrogenophagy [27; unpublished data]. However, additional studies are needed to demonstrate this and to understand TvAtg4.4 association with hydrogenosomes in
T. vaginalis. The localization of TvAtg4.4 in
T. vaginalis hydrogenosomes by TEM is an interesting observation, because it poses the question as to whether there is another type of autophagy mechanism in
T. vaginalis, besides the degradative, such as a secretory autophagy taking place in hydrogenosomes [
27]. This question needs to be addressed in future experiments.
Author Contributions
Conceptualization, R.A. and M.G.M.C.; methodology, M.G.M.C., C.I.F.P., and L.S.V.; validation, R.A., M.G.M.C., M.E.C., L.I.S.V., C.I.F.P., and J.O.L.; formal analysis, R.A., M.G.M.C., L.I.S.V., C.I.F.P., and J.O.L.; investigation, R.A., M.G.M.C., and J.O.L.; resources, R.A., M.E.C., and J.O.L.; data curation, R.A., M.G.M.C., L.I.S.V., C.I.F.P., and J.O.L.; writing—original draft preparation, M.G.M.C.; writing—review and editing, M.G.M.C., M.E.C., and R.A.; visualization, R.A., M.G.M.C., M.E.C., L.I.S.V., C.I.F.P., and J.O.L.; supervision, R.A., C.I.F.P., J.O.L.; project administration, R.A.; funding acquisition, R.A., and J.O.L. All authors have read and agreed to the published version of the manuscript.
Figure 1.
In silico analysis of 3D and 2D structures of TvAtg4 autophagins from T. vaginalis and comparison to Homo sapiens ATG4B. (A) Functional domains of TvAtg4 autophagins. The protease domain (blue) and auxiliary domain-like (gray), conformed by two β-strands (β5 and β13) and two α-helices (α6 and α8), except for TvAtg4.4, which does not have the β5 and β13 strands. pLIR-like motifs represented the APEAR domain in light blue and the cLIR-like domain in pink. The size and molecular weight (kDa) of each TvAtg4 was taken from the TrichDB database using the corresponding TVAGG3 number. (B) Multiple alignment of the amino acid sequences of the five TvAtg4 autophagins with H. sapiens HsATG4B, and yeast SCAtg4 (Uniprot Q9Y4P1 or PDB 2CY7). The catalytic triad (Cys, Asp, and His) is highlighted in blue; the regulatory Trp (W142) in yellow; the conserved phospho-serine site of HsATG4B in orange, and that corresponding to yeast in purple. TvAtg4 autophagins share 25% identity with HsATG4B and 23% with yeast Atg4. (C) 3D structure of Homo sapiens ATG4B (HsATG4B) obtained from the AlphaFold database (Uniprot Q9Y4P1). The protease domain is presented in magenta and the auxiliary domain in green. The catalytic domain is amplified to show the catalytic triad Cys/His/Asp and the regulatory tryptophan (Trp142). (D) 3D modeling of the five TvAtg4 autophagins in PDB format obtained from the AlphaFold database (a) TvAtg4.1 (TVAGG3_0280010), (b) TvAtg4.2 (TVAGG3_0421160), (c) TvAtg4.3 (TVAGG3_0930750), (d) TvAtg4.4 (TVAGG3_0673040), and (e) TvAtg4.5 (TVAGG3_0264470). (f) Overlap of all 3D models of TvAtg4 autophagins (presented in different colors) with HsATG4B using the UCSF Chimera® program. (E) Diagram of HsATG4B secondary structure.
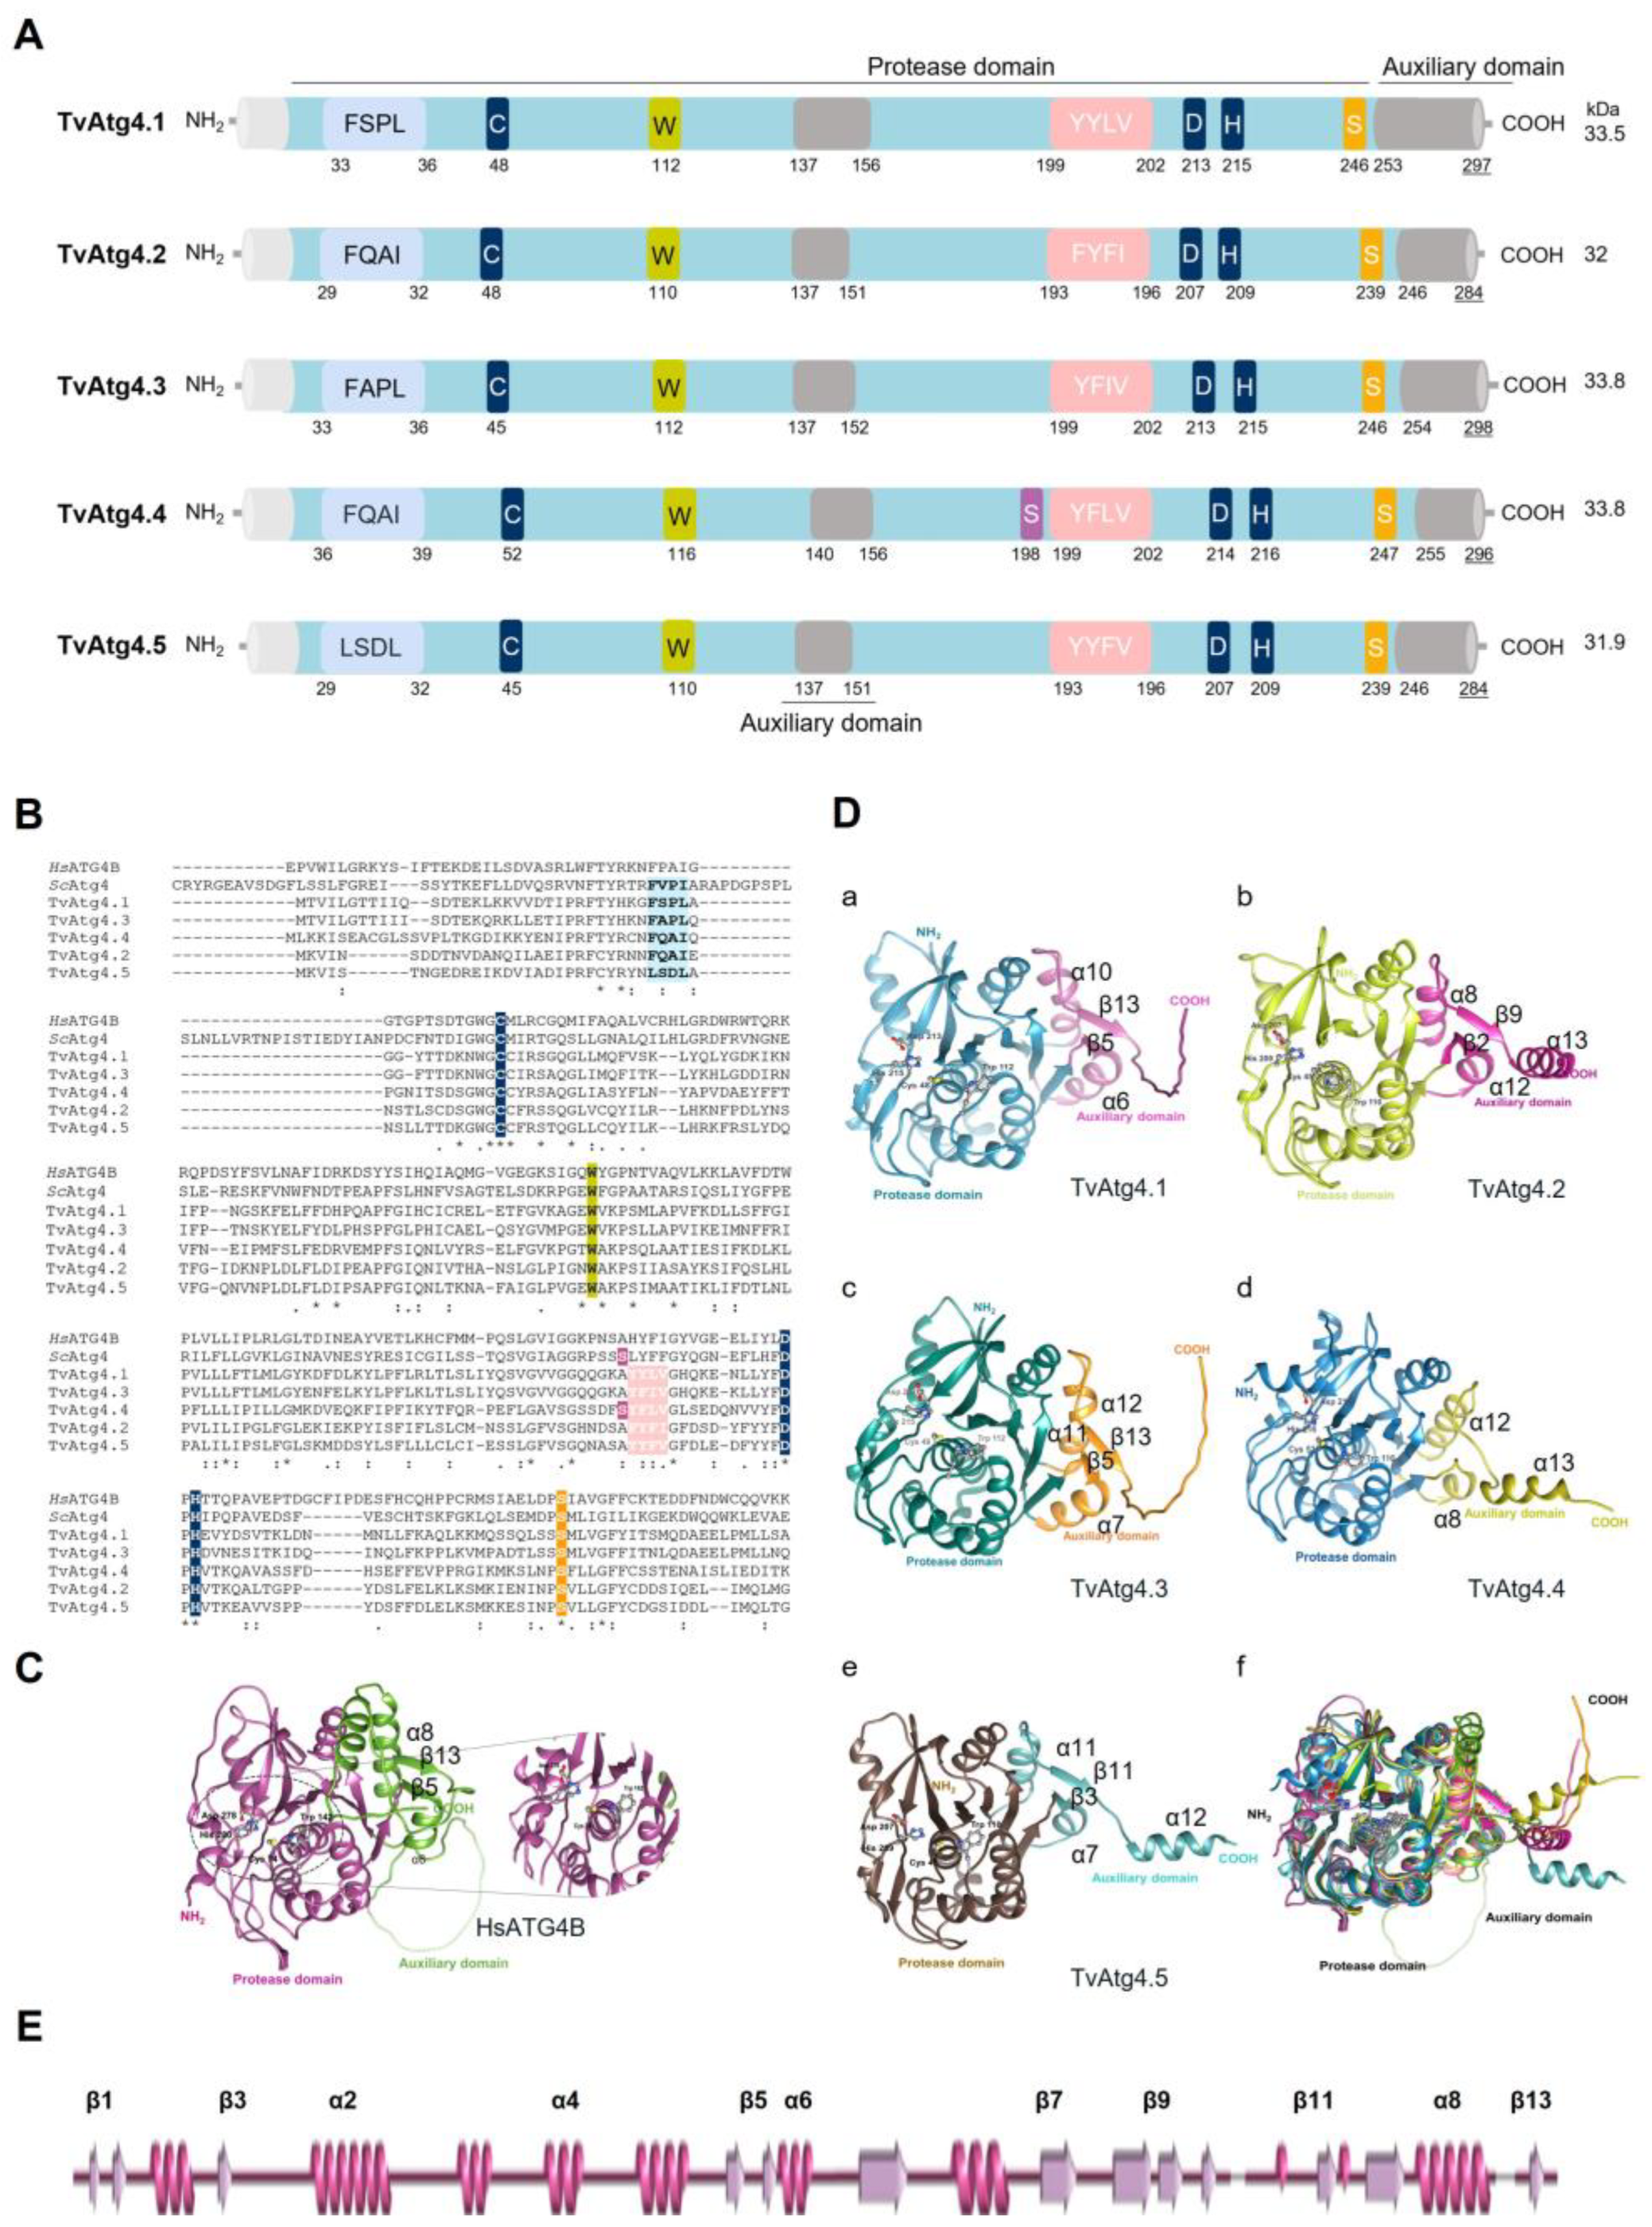
Figure 2.
In silico analysis of nucleotide and amino acid sequences of TvAtg4.4 from Trichomonas vaginalis. (A) (a) Diagram of the genomic sequence of tvatg4.4 (TVAGG3_0673040). The gene is 891 bp in size and is flanked in the 5’ end with vesicle fusion protein gene (TVAGG3_0673030) and in the 3’ end with GspF protein gene (TVAGG3_0673060). The intergenic distance is 392 bp and 661 bp, respectively. (b) In the tvatg4.4 5’ regulatory region, 11 and 20 bp upstream of the translation start codon (ATG), Inr and M5 motives are highlighted in bold as putative promoter elements for transcription initiation. (c) In the tvatg4.4 3’ regulatory region, 34 and 54 bp downstream of the stop codon (TAA) is the putative polyadenylation signal, followed by the putative U-rich sequence. (B) Diagram of the aa sequence and putative functional domains of the TvAtg4.4 protein showing possible post-translational modifications sites (PTMs): phosphorylation (purple), glycosylation (yellow), palmitoylation (green), acetylation (lila), SUMOylation (pink), and methylation (red). (C) Three-dimensional (3-D) model of the TvAtg4.4 protein in AlphaFold2 v1.5.2. The protease domain is shown in blue and the auxiliary domain in gold. The zoom shows the Cys-Asp-His catalytic triad, as well as the putative regulatory Trp.
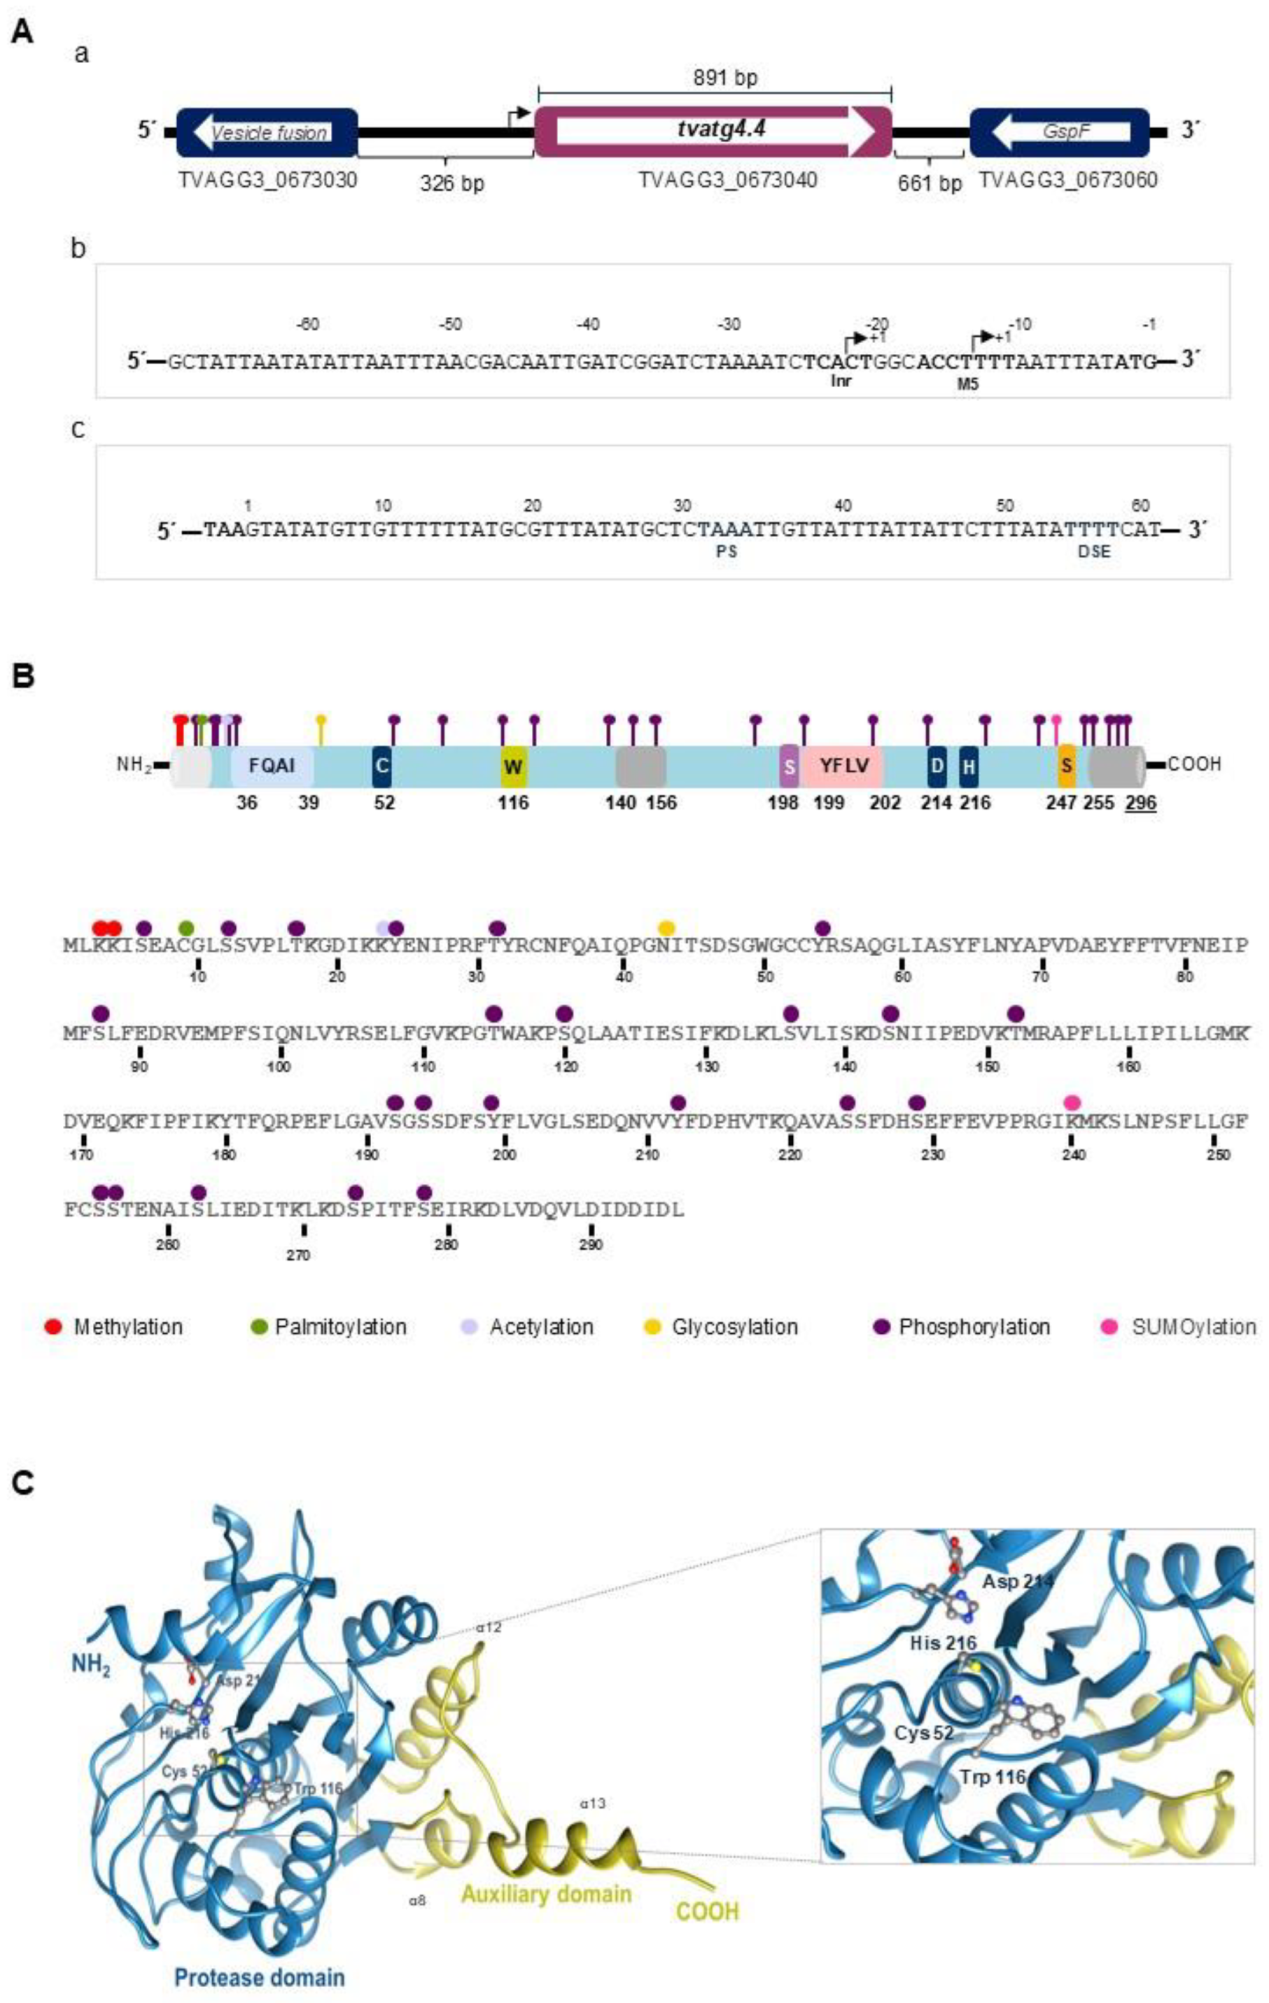
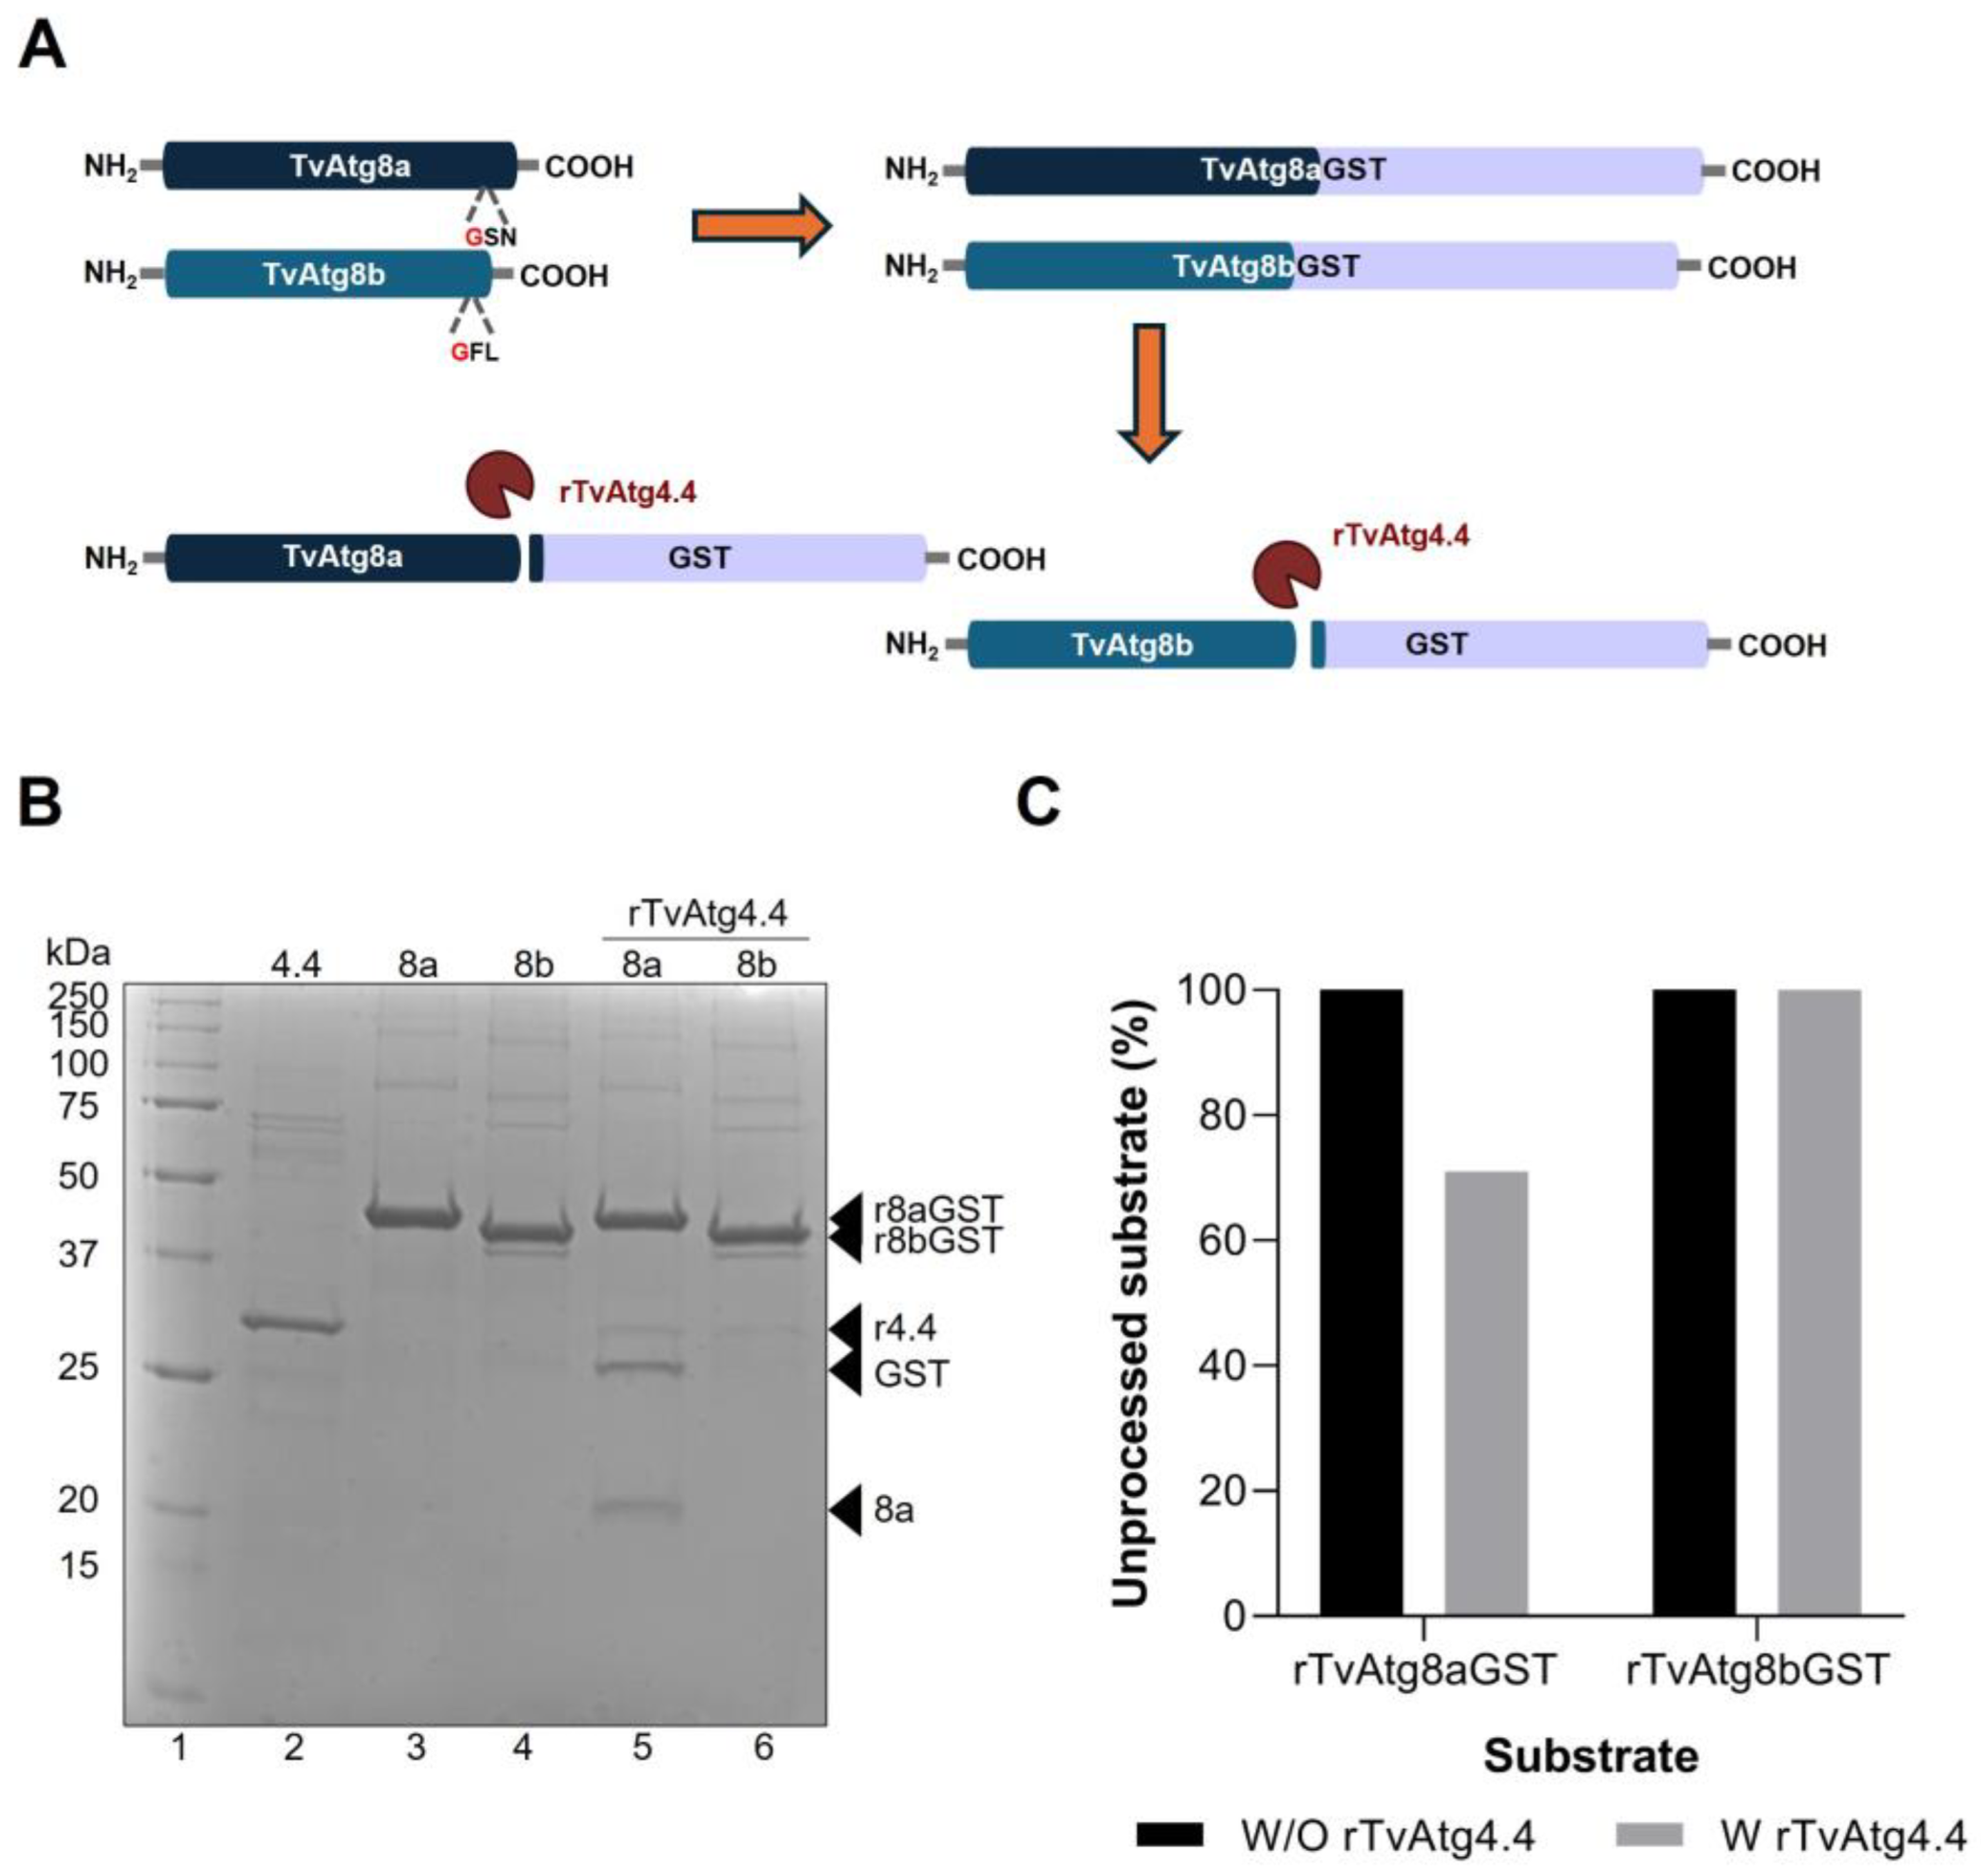
Figure 3.
In vitro enzymatic processing of rTvAtg8aGST and rTvAtg8bGST proteins by rTvAtg4.4 autophagin. (A) Diagram of the design of recombinant proteins TvAtg8a and TvAtg8b with the fused GST tag at the carboxyl terminus. The cleavage site of TvAtg4.4 at the G (Gly) residue is shown in red at the carboxyl terminal generating two products: the GST tag and TvAtg8a or TvAtg8b. (B) In vitro processing of rTvAtg8a/bGST by rTvAtg4.4. rTvAtg4.4 (lane 2) was incubated with either rTvAtg8a/GST and rTvAtg8b/GST (lanes 3 and 4, respectively). The resulting digestion products are shown in lanes 5 and 6. When incubated with rTvAtg8a/GST, rTvAtg4.4 produced the release of GST and TvAtg8a (lane 5, arrowheads). However, no digestion products were obtained using rTvAtg8bGST as substrate (lane 6). (C) Densitometric analysis of rTvAtg8aGST or rTvAtg8bGST protein bands with and without incubation with rTvAtg4.4. The percentage of protein that remained unprocessed was plotted.
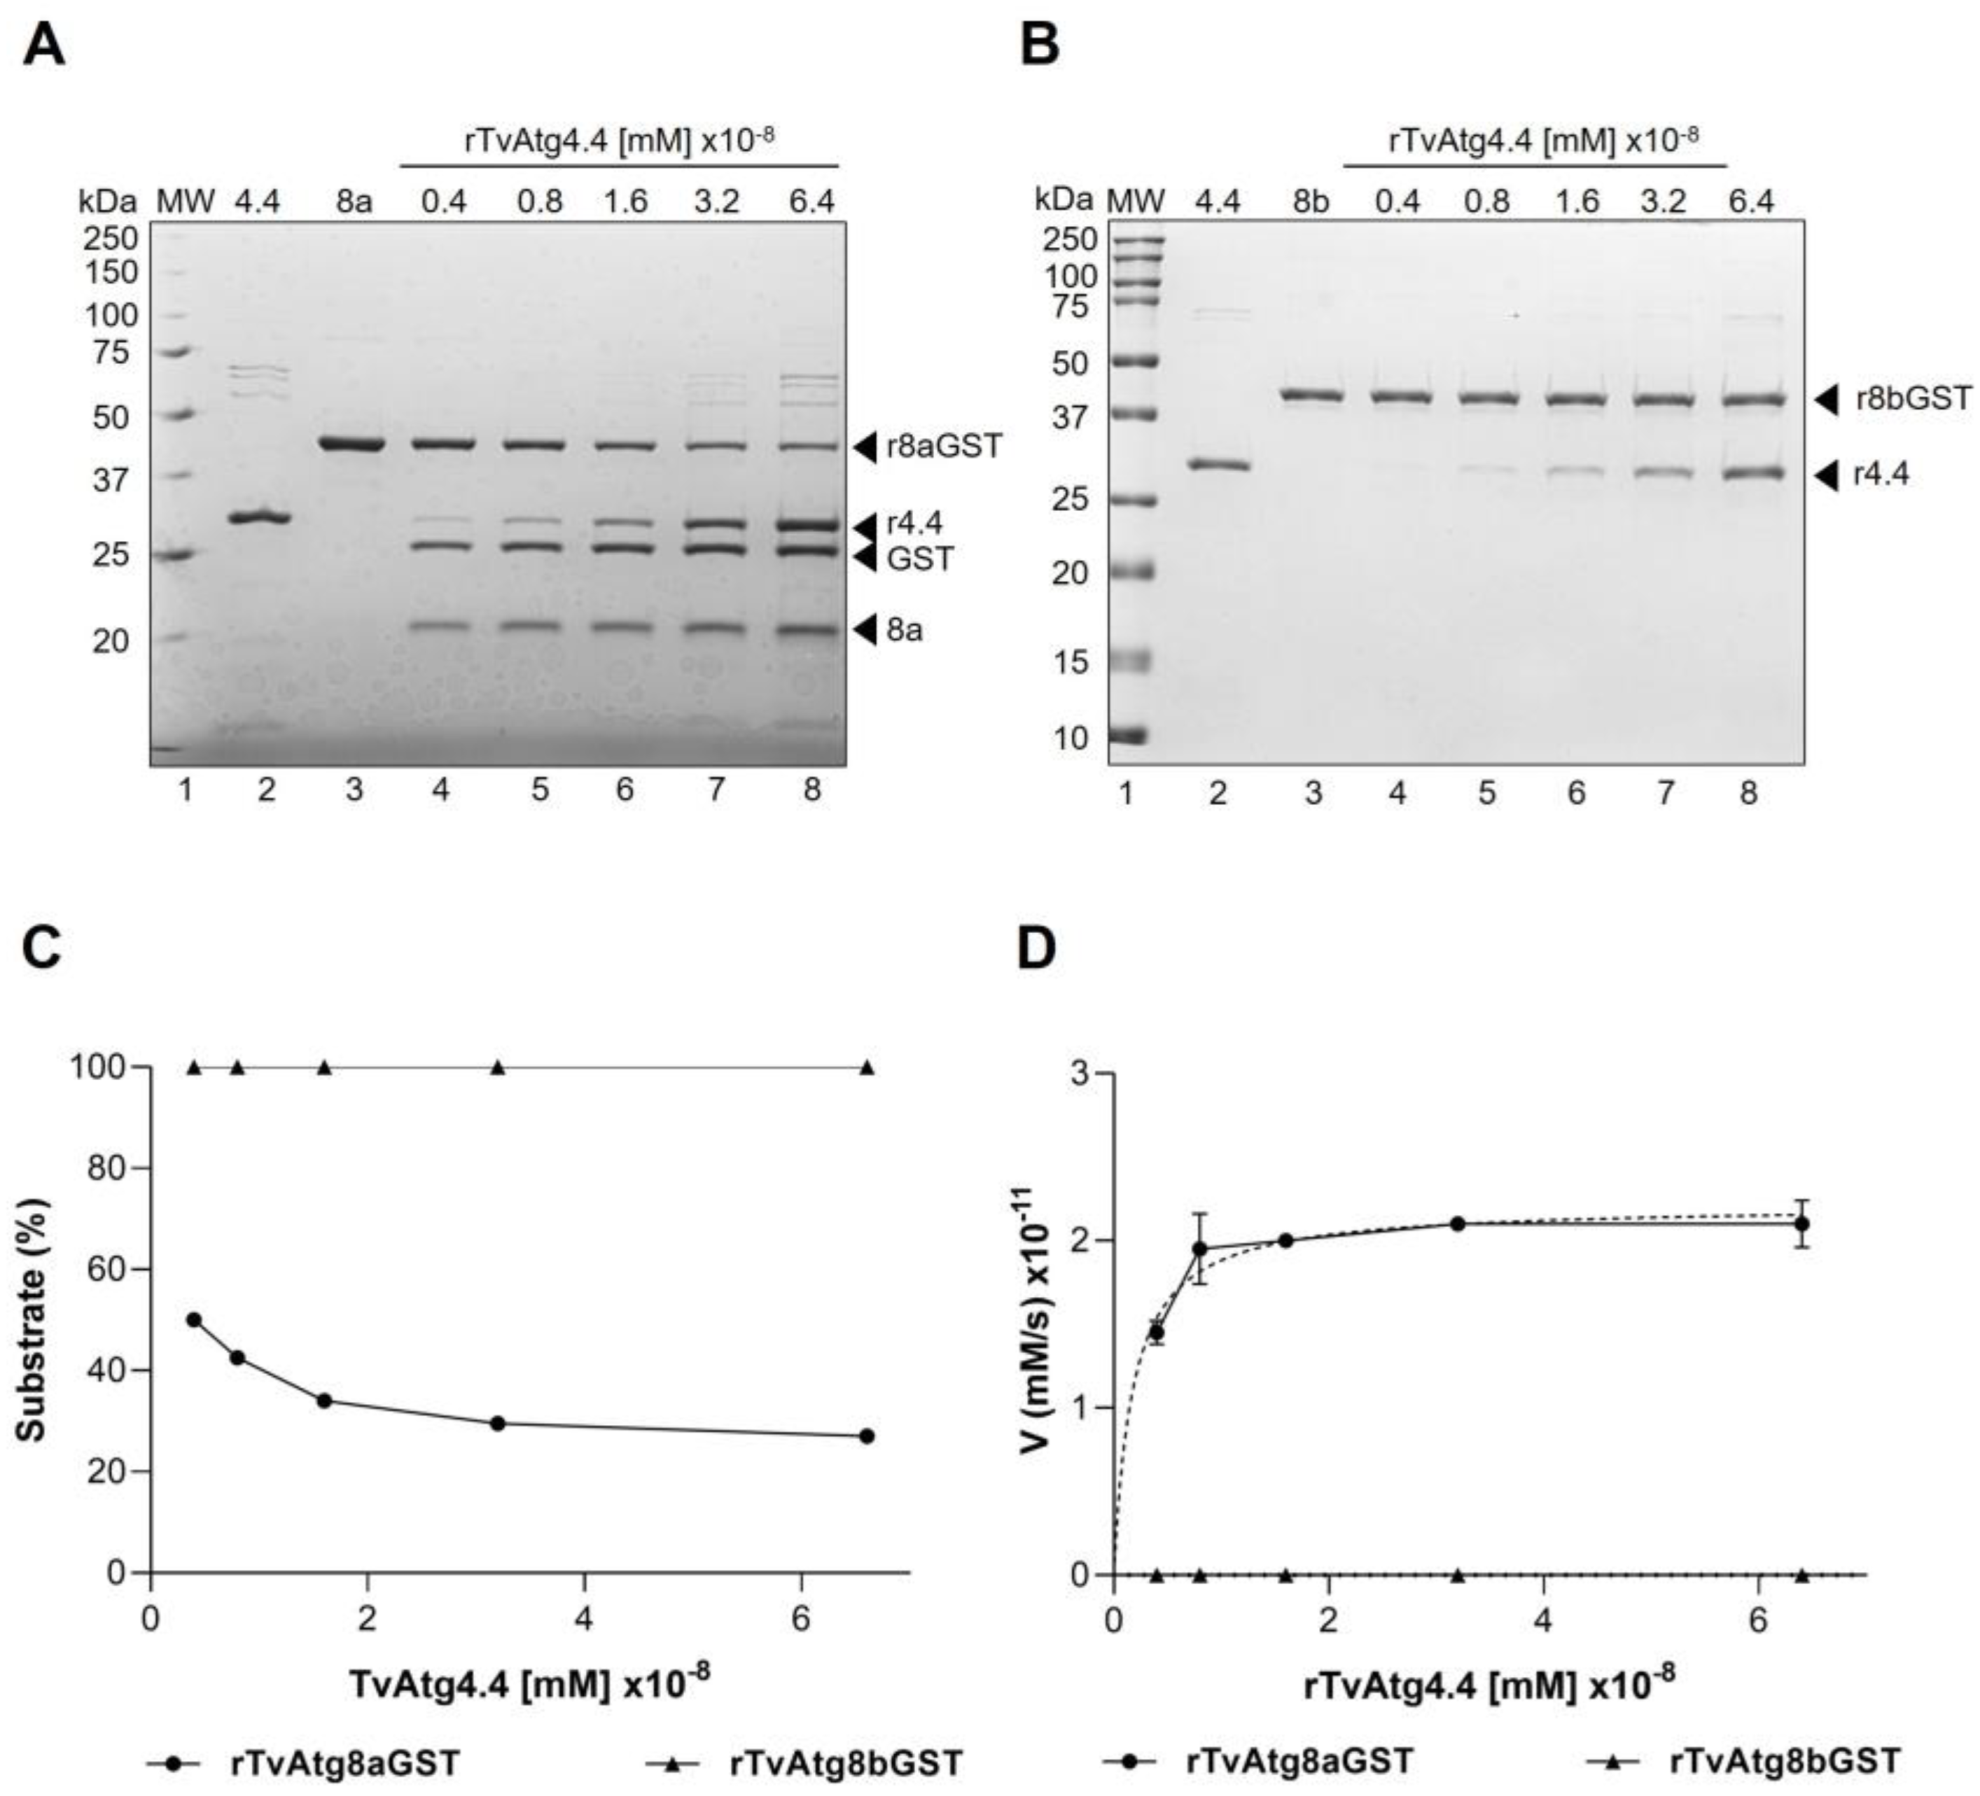
Figure 4.
Effect of rTvAtg4.4 concentration on the processing of rTvAtg8aGST and rTvAtg8bGST. Protease activity of rTvAtg4.4 on rTvAtg8aGST (A) or rTvAtg8bGST (B). Increasing concentrations of rTvAtg4.4 were added to rTvAtg8a/bGST substrate. Arrowheads indicate the release of the GST tag and TvAtg8a (A, lanes 4-8) or unprocessed rTvAtg8b (B, lanes 4-8). As a control rTvAtg4.4 was incubated without substrate (lane 2) and rTvAtg8a/bGST without protease (lane 3). (C) Densitometric analysis of the released bands was performed. The percentage of unprocessed substrate was calculated using the following formula: ODAtg8s-GST/(ODAtg8s-GST + ODGST + ODAtg8s) × 100%. (D) Reaction speed (y-axis) was calculated considering the change in GST concentration and plotted against the different concentrations of rTvAtg4.4 (x-axis). Curves were adjusted using nonlinear regression.
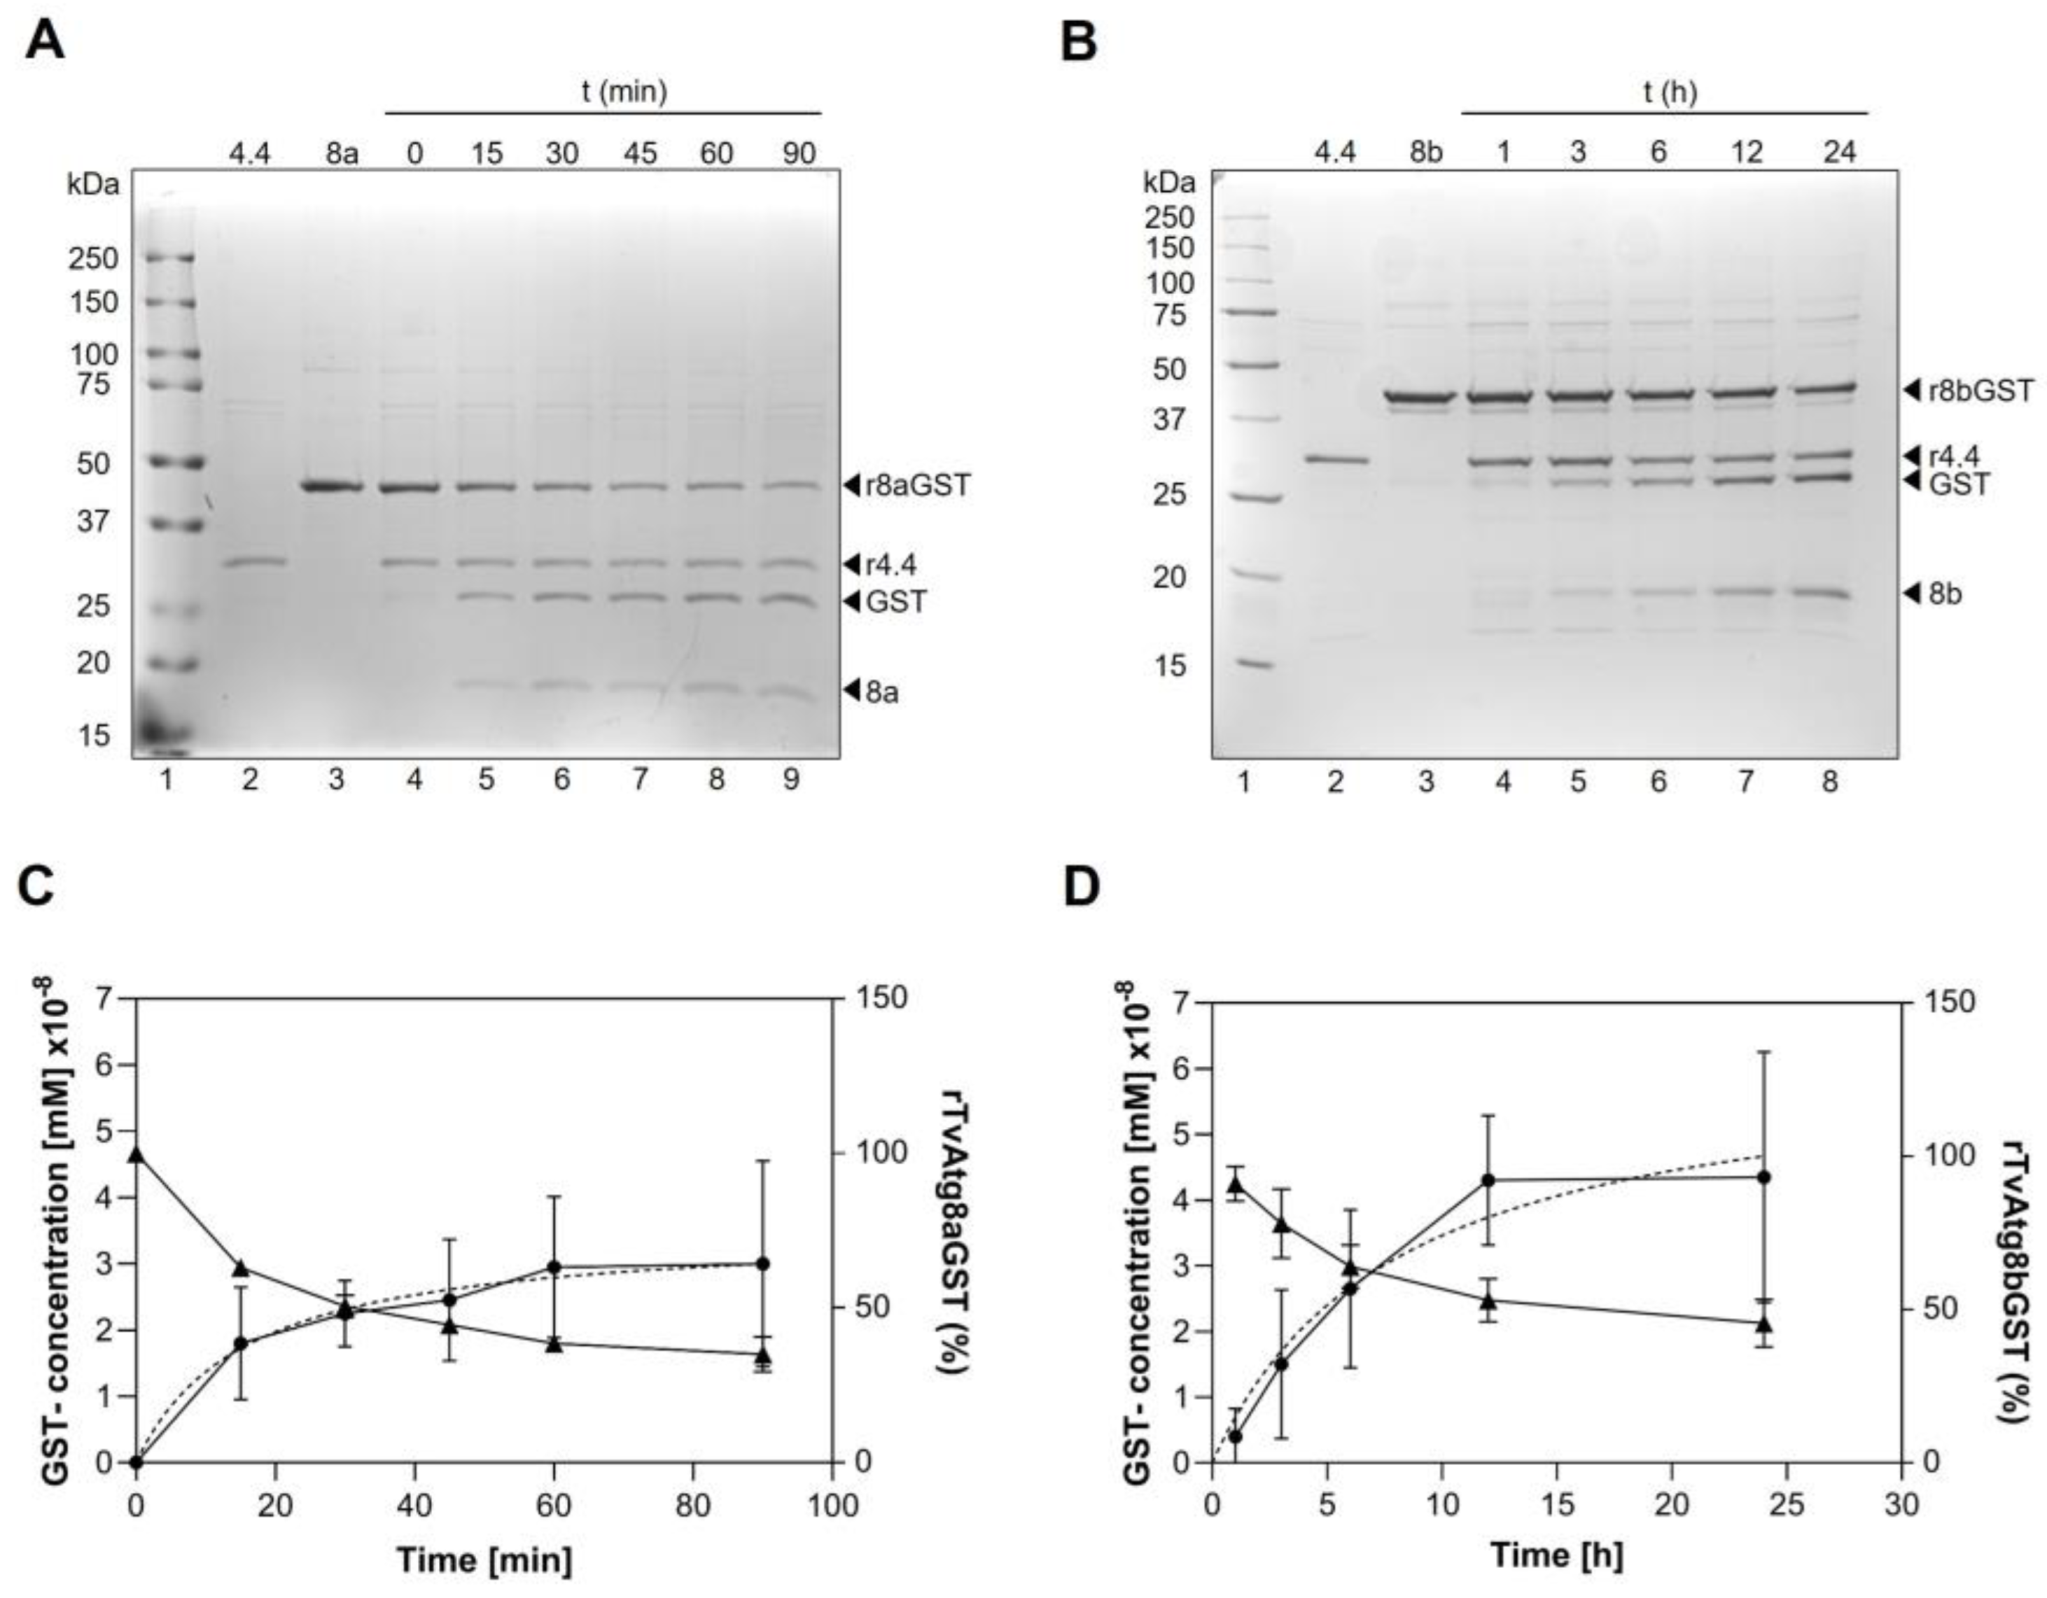
Figure 5.
Time-lapse enzymatic activity of rTvAtg4.4 on rTvAtg8aGST (A) or rTvAtg8bGST (B). rTvAtg4.4 (1.66 x 10⁸ mM) was incubated with rTvAtg8aGST (4.37 x 10⁸ mM) or rTvAtg8bGST (4.425 x 10⁻⁸ mM) at 37 °C for 0, 15, 30, 45, 60, and 80 min for rTvAtg8aGST (A, lanes 4 to 9); and 1, 3, 6, 12, and 24 h for rTvAtg8bGST (B, lanes 4 to 8). Reactions were stopped by boiling for 5 min and the release of GST tag and TvAtg8a or TvAtg8b protein was visualized on 12% SDS-PAGE. (C and D) The percentage of rTvAtg8aGST (C) or rTvAtg8bGST (D) that remains unprocessed was calculated by the amount of released GST in mM concentration versus the incubation time using the following equation: ODAtg8s-GST/(ODAtg8s-GST + ODGST + ODAtg8s) × 100%. Data were plotted with a nonlinear regression.
Figure 6.
Enzymatic kinetics of the rTvAtg4.4 autophagin to determine its Km and Vmax values. (A) TvAtg4.4 autophagin (1.66 x 10⁻⁹ mM) was incubated with 0.05, 0.1, 0.2, 0.4, 0.8, and 1.6 x 10⁻⁷ mM; rTvAtg8aGST, and the digestion products were analyzed by SDS-PAGE (lanes 4-9). As reaction controls, we used the maximum concentration of substrate without enzyme (lane 3) and enzyme without substrate (lane 2). (B) The percentage of substrate that remains unprocessed was calculated by plotting the different concentrations against the total amount of substrate in the reaction. The maximum rate of reaction was defined as the change in the concentration of released GST, and the values obtained were plotted against the different substrate concentrations used. The curves were fitted using the nonlinear regression method for enzyme kinetics to determine the Michaelis-Menten data.
Figure 7.
Substrate specificity for rTvAtg4.4 autophagin. (A) Inhibition of the protease activity of the rTvAtg4.4 autophagin using different families of protease inhibitors: metallo (EDTA), serine (TLCK), aspartic (SO4Cu2), and cysteine (IAM and E-64). The protease activity was measured by analyzing the amount of rTvAtg8aGST that remained unprocessed. (B) The results obtained were plotted as the percentage of rTvAtg8aGST that remained unprocessed in the presence of the different protease inhibitors used. Asterisks denote statistical significance: *** p<0.001, **p<0.001, p<0.01). (C) rTvAtg4.4 autophagin incubated with rTvAtg8aGST protein (lane 5) or BSA (lane 6) in a reaction mix for 1 h at 37 °C. The reactions were stopped by boiling for 5 min and separated by 12% SDS-PAGE. As controls, a reaction mix was incubated with only rTvAtg4.4 (lane 2), TvAtg8aGST (lane 3), or BSA (lane 4). (D) A densitometric analysis of the unprocessed bands was performed, and the percentage of unprocessed substrate with and without enzyme was plotted. (E and F) FarWestern blot (FWB) to detect protein-protein interaction between rTvAtg4.4 autophagin and rTvAtg8aGST (E) or rTvAtg8bGST (F). Substrates were separated by SDS-PAGE, gel strip stained with Coomassie brilliant blue (CBB, lanes 2) and transferred onto nitrocellulose membranes and stained with Ponceu red (PR, lanes 4). As positive controls, the membranes were incubated with anti-rTvAtg8a or anti-rTvAtg8b antibody (lanes 6). For negative controls, the membranes were incubated with the anti–rTvAtg4.4 antibody (lanes 5). For the FWB assay, each substrate membrane was pre-incubated with rTvAtg4.4 (lanes 8) or rChagasin (lanes 7), washed, incubated with anti-rTvAtg4.4 (lanes 8) or anti-rChagasin (lanes 7) antibodies, washed, incubated with HRP–conjugated secondary antibody, and developed by chemiluminescence.
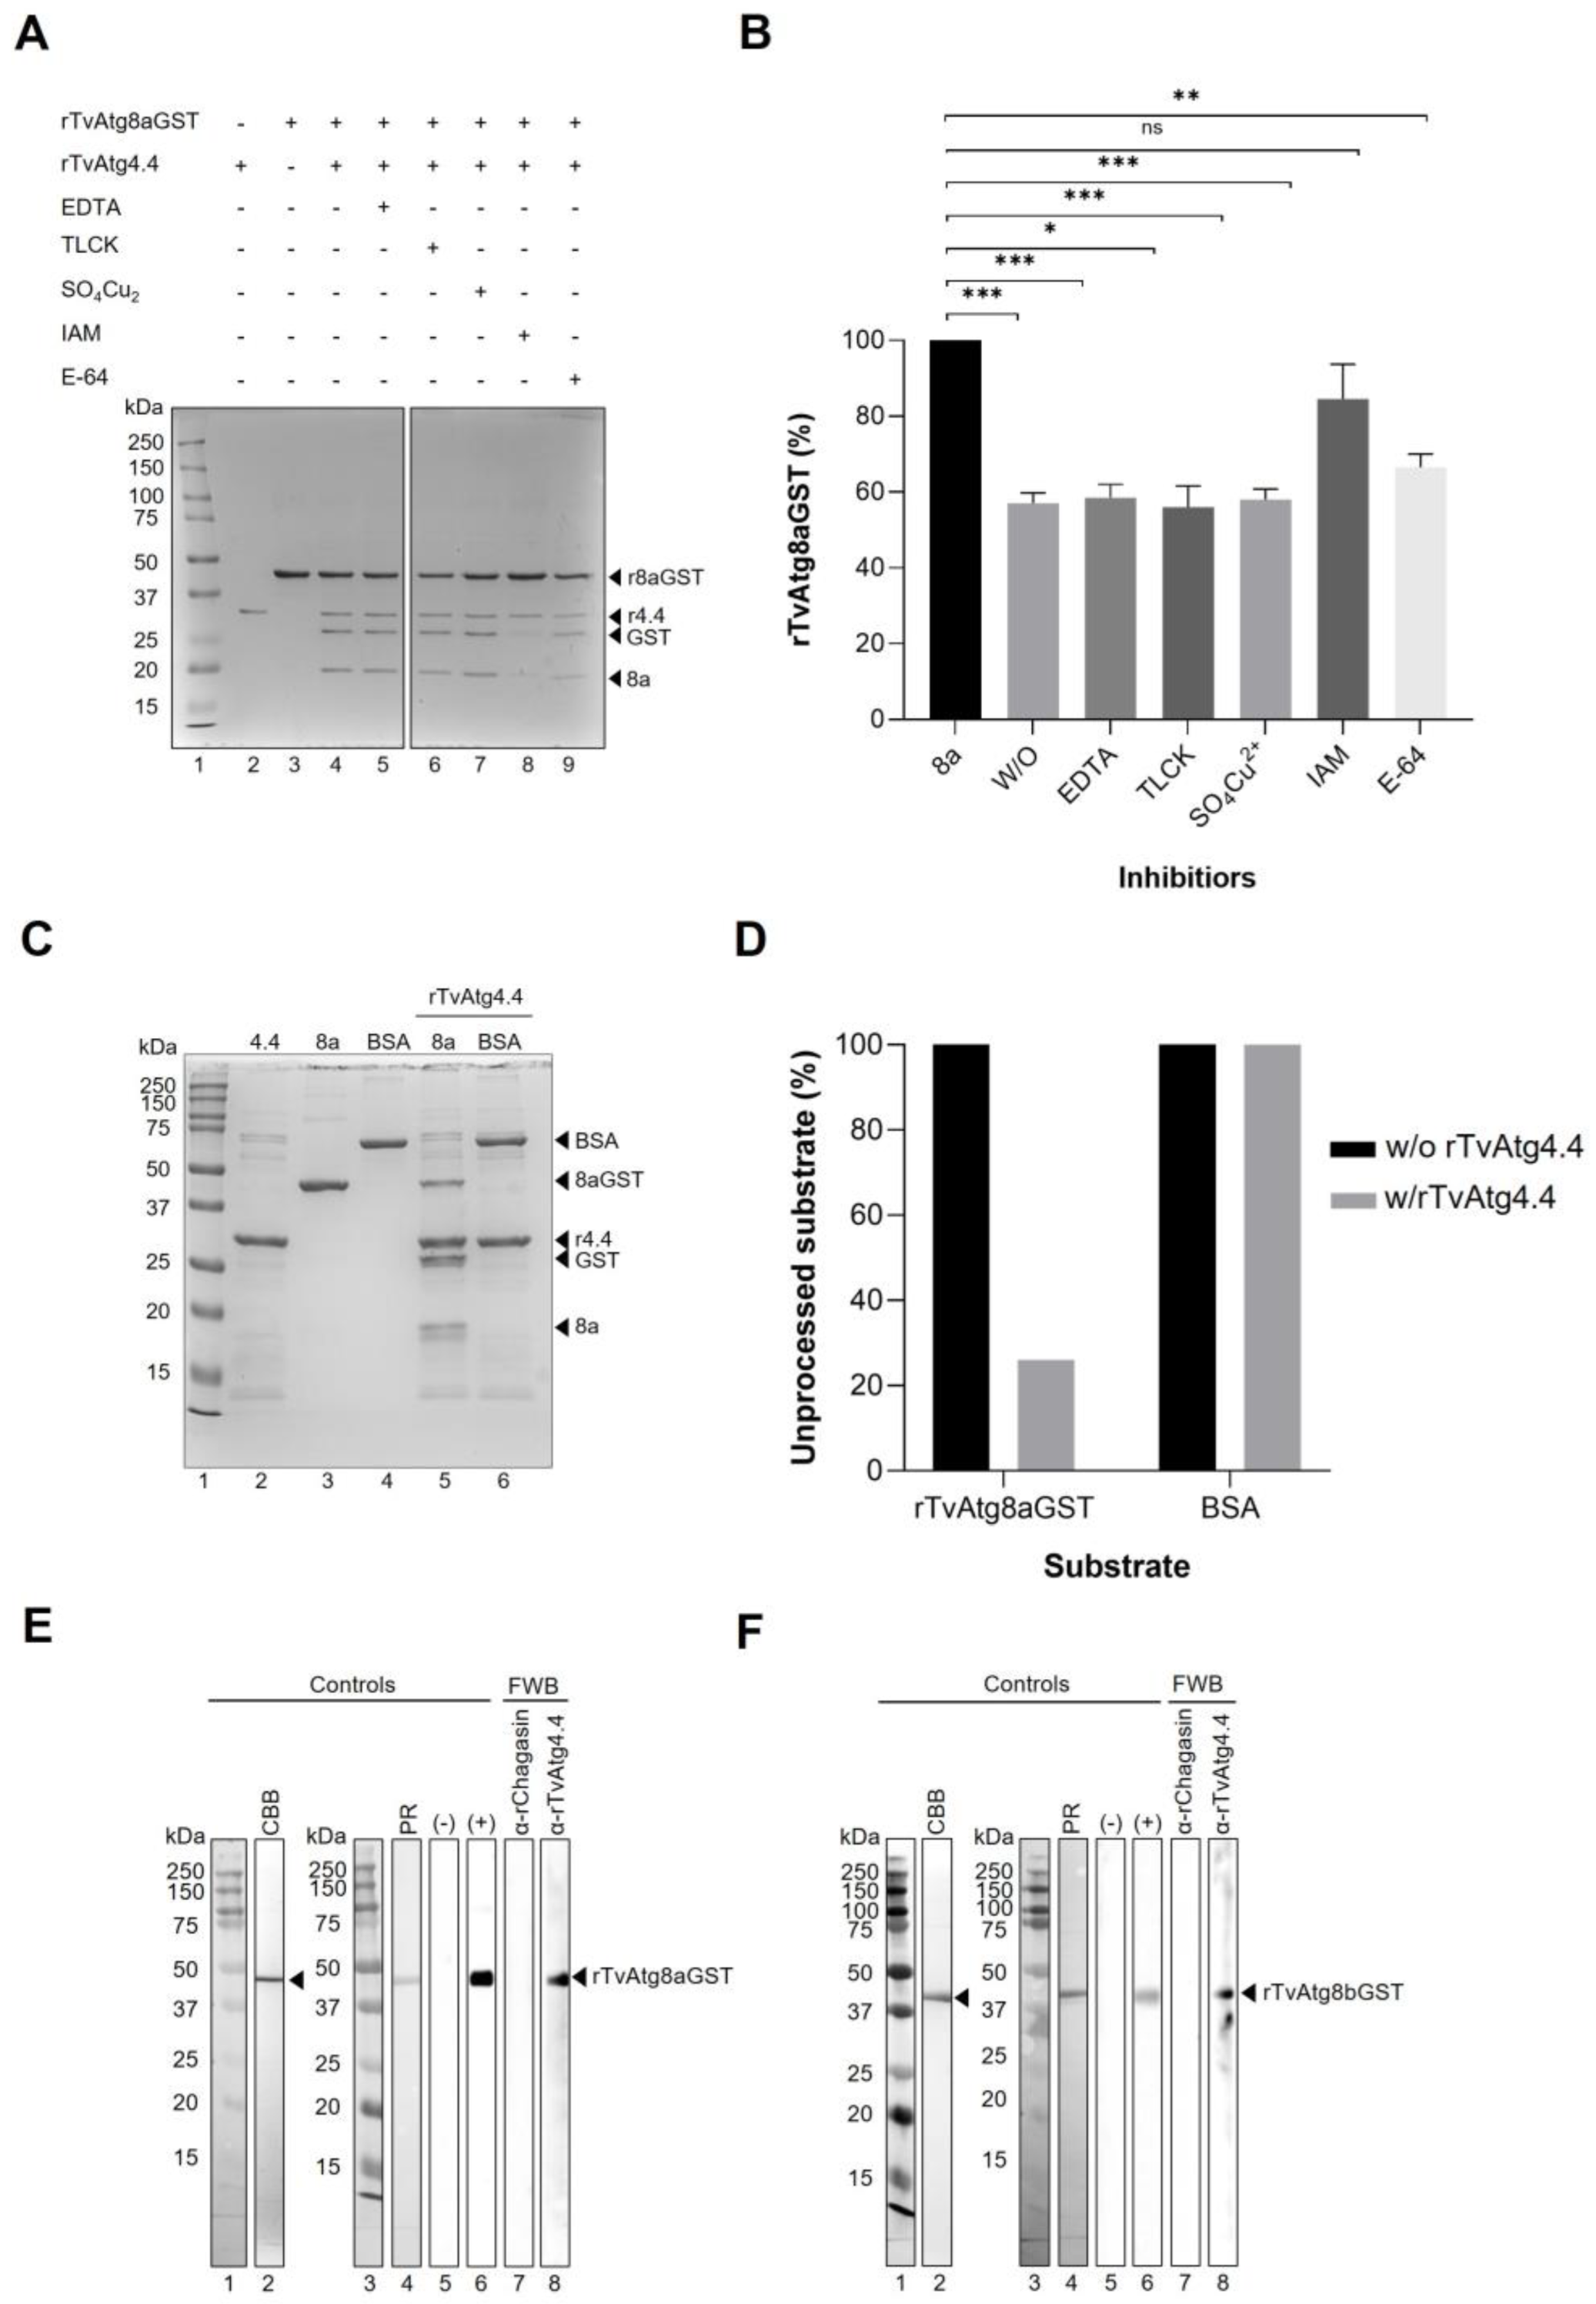
Figure 8.
Effect of glucose on the expression of tvatg4.4 transcript and TvAtg4.4 autophagin. (A) using cDNA from parasites grown under glucose-restricted (GR) and high glucose (HG) conditions were used as templates to determine expression of tvatg4.4 transcript by qRT-PCR assay using α-tubulin as a normalized gene. Statistical significance is shown with asterisks **** p<0.0001. (B) WB assay of total protein extracts (TPE) of parasites grown under GR and HG conditions were used to detect the TvAtg4.4 autophagin. Lanes 2 and 3, total protein patterns of parasites grown under GR and HG conditions separated by 12% SDS-PAGE stained with CBB. Duplicate gels were transferred onto NC membranes and stained with, Ponceau red (PR, lanes 4 and 5), or incubated only with the secondary antibody (negative control, lanes 6 and 7), or with distinct primary antibodies:, Rα-rTvEno Ab (loading control, lanes 8 and 9); Rα-rTvCP2 Ab (control protein negatively regulated by glucose, lanes 10 and 11); Mα-rTvCatD Ab (control protein positively regulated by glucose, lanes 12 and 13); Mα-rTvAtg4.4 Ab (to detect the TvAtg4.4 protein in trichomonad extracts, lanes 14 and 15). Arrowheads indicate bands identified by the anti-rTvAtg4.4 Ab (~110, ~45, ~35, ~27 y ~22 kDa) in extracts from parasites grown under GR and HG conditions. Star indicates putative high molecular weight TvAtg4.4 oligomers. (C) Densitometric analysis normalized to the enolase band was carried out with each protein band. The band with the highest intensity (pixels) was taken as 100%, for comparative purposes. A statistical analysis was performed, and significant differences are shown with asterisks ** p< 0.001. .
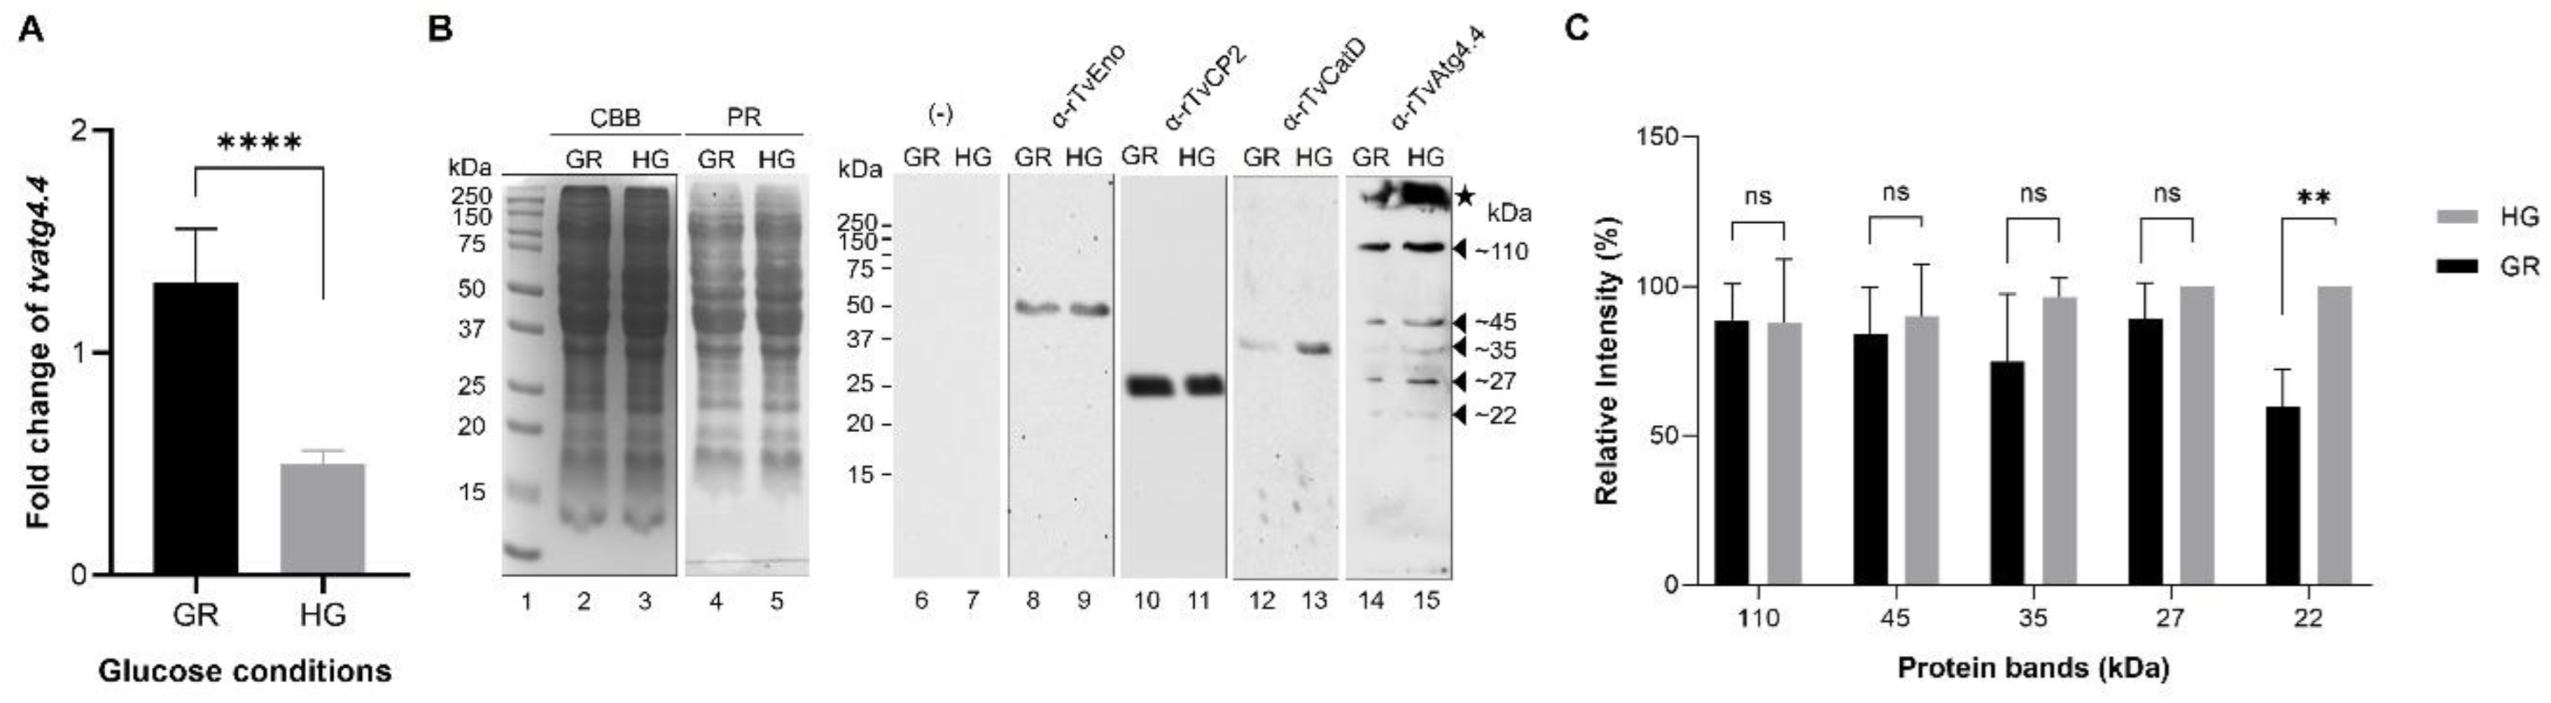
Figure 9.
Localization of TvAtg4.4 in T. vaginalis grown under GR and HG conditions by IFA and TEM. (A) Permeabilized parasites grown under GR (panels g-l) or HG (panels m-r) conditions were incubated with Mα-rTvAtg4.4 antibody and a secondary antibody coupled to Alexa-594 (green). As a negative control (-), parasites were incubated only with the secondary antibody (panels c). Nuclei were stained with Hoechst. Orthogonal projection (OP) or optical section (S). Scale bar, 5 μm, except for amplified images (Zoom) that correspond to 2 μm. (B) Immuno-gold localization by TEM of parasites grown under GR (panels d–f) and HG (g-h) conditions using the Mα-rTvAtg4.4 antibody and a secondary antibody coupled to 20 nm gold particles. Negative controls (-) were incubated with PI serum or only with the secondary antibody (panels a-c). Cytoplasm (C), nucleus (N), membrane (M), hydrogenosome (H), endoplasmic reticulum (ER), Golgi apparatus (G), vesicle (V), autophagic vesicle (AV). Scale bar, 200 nm.
Figure 10.
Colocalization of TvAtg4.4 with TvAtg8a or TvAtg8b autophagosomes under GR and HG conditions by IFA. Permeabilized parasites were double labeled with Mα-rTvAtg4.4 antibody (green) and Rα-rTvAtg8a or Rα-rTvAtg8b antibodies (red) to identify autophagic vesicles in parasites grown under GR (h-n and v-ab, respectively) or HG (o-u and ac-ai, respectively) conditions. Colocalization was measured by the Pearson coefficient; a value >0.5 suggests colocalization between proteins. Samples incubated with PI serum or only with the secondary antibody (a-g) were used as negative controls. Scale bar, 5 µm. Zoom bar, 2 μm.
Figure 11.
Subcellular localization of TvAtg4.4 with TvAtg8a or TvAtg8b by TEM. Parasites grown under GR and HG conditions were labeled with Mα-rTvAtg4.4 primary antibody and a secondary antibody coupled to 15 nm gold particles (stars), and with Rα-rTvAtg8a or Rα-rTvAtg8b antibodies and a secondary antibody coupled to 30 nm gold particles (arrowheads). (-) PI serum or incubation with only secondary antibody (a-c) was used as a negative control. The organelles were identified as follows: cytoplasm (C), nucleus (N), membrane (M), hydrogenosome (H), endoplasmic reticulum (ER), Golgi apparatus (G), Vesicle (V), double membrane autophagic vesicle (AV) in TvAtg8a or TvAtg8b under GR (d-f and j-l) and HG (g-i and m-o) conditions, respectively. Black scale bars, 500 nm and 200 nm.
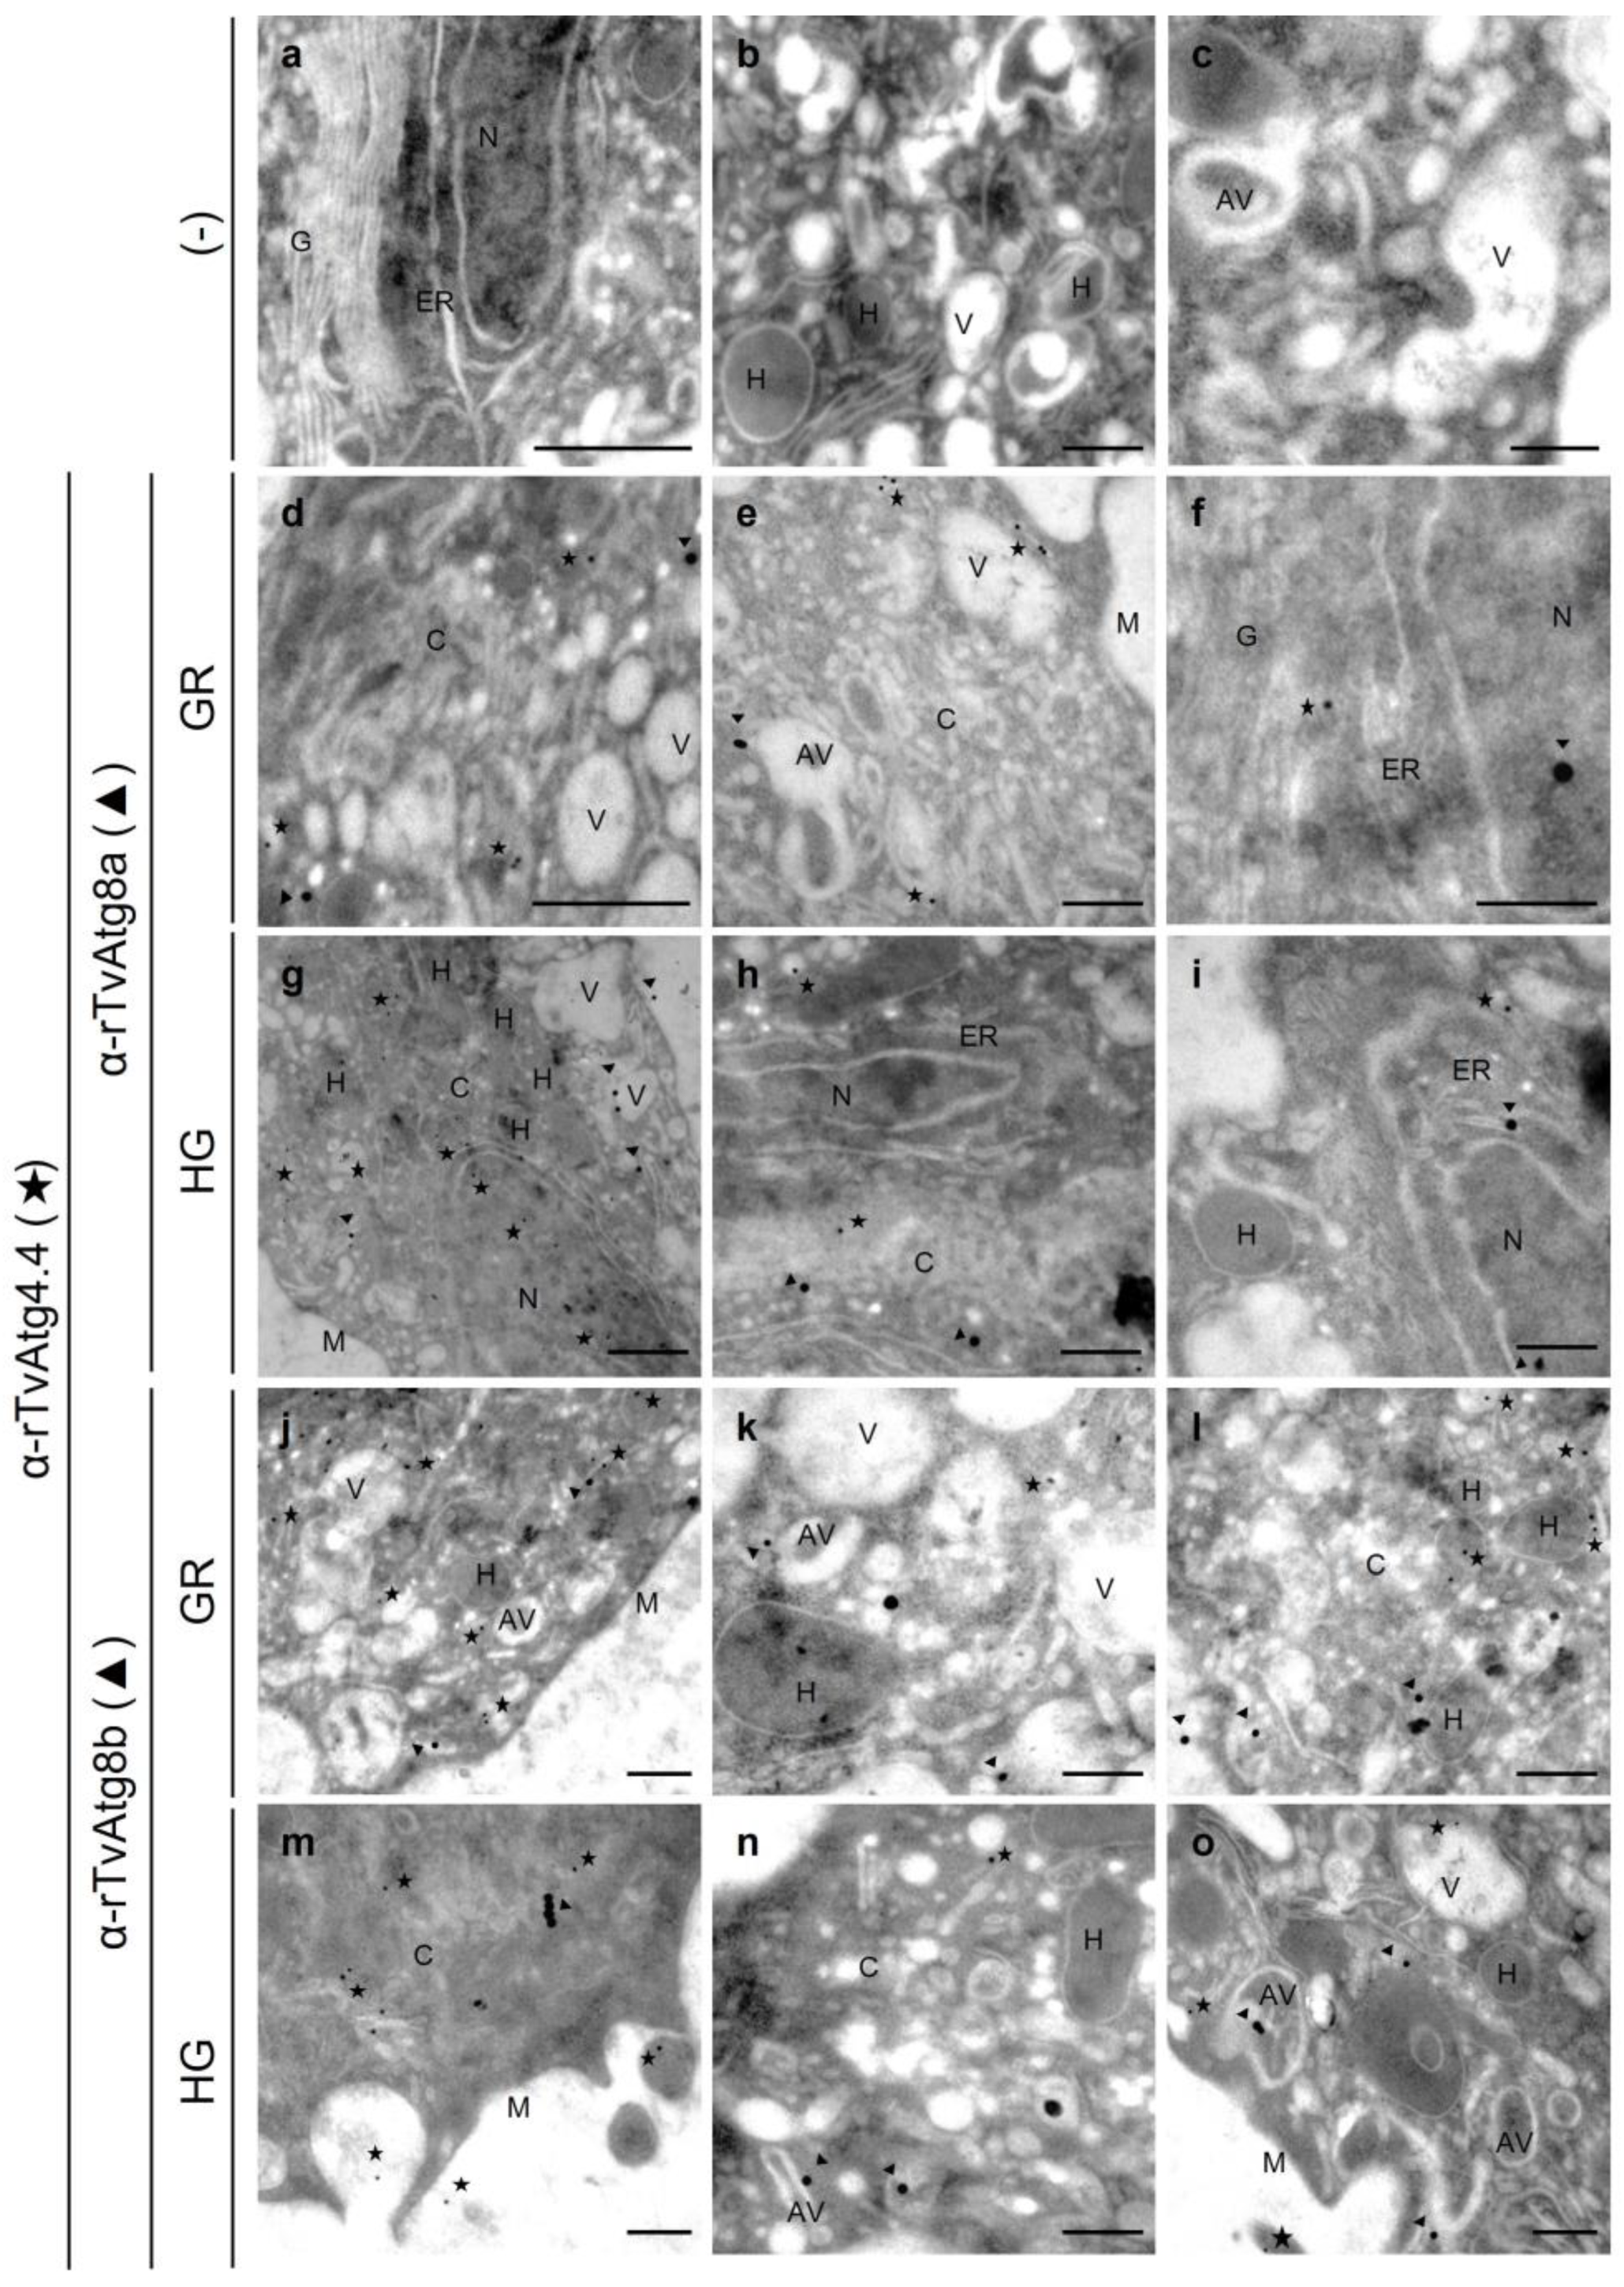
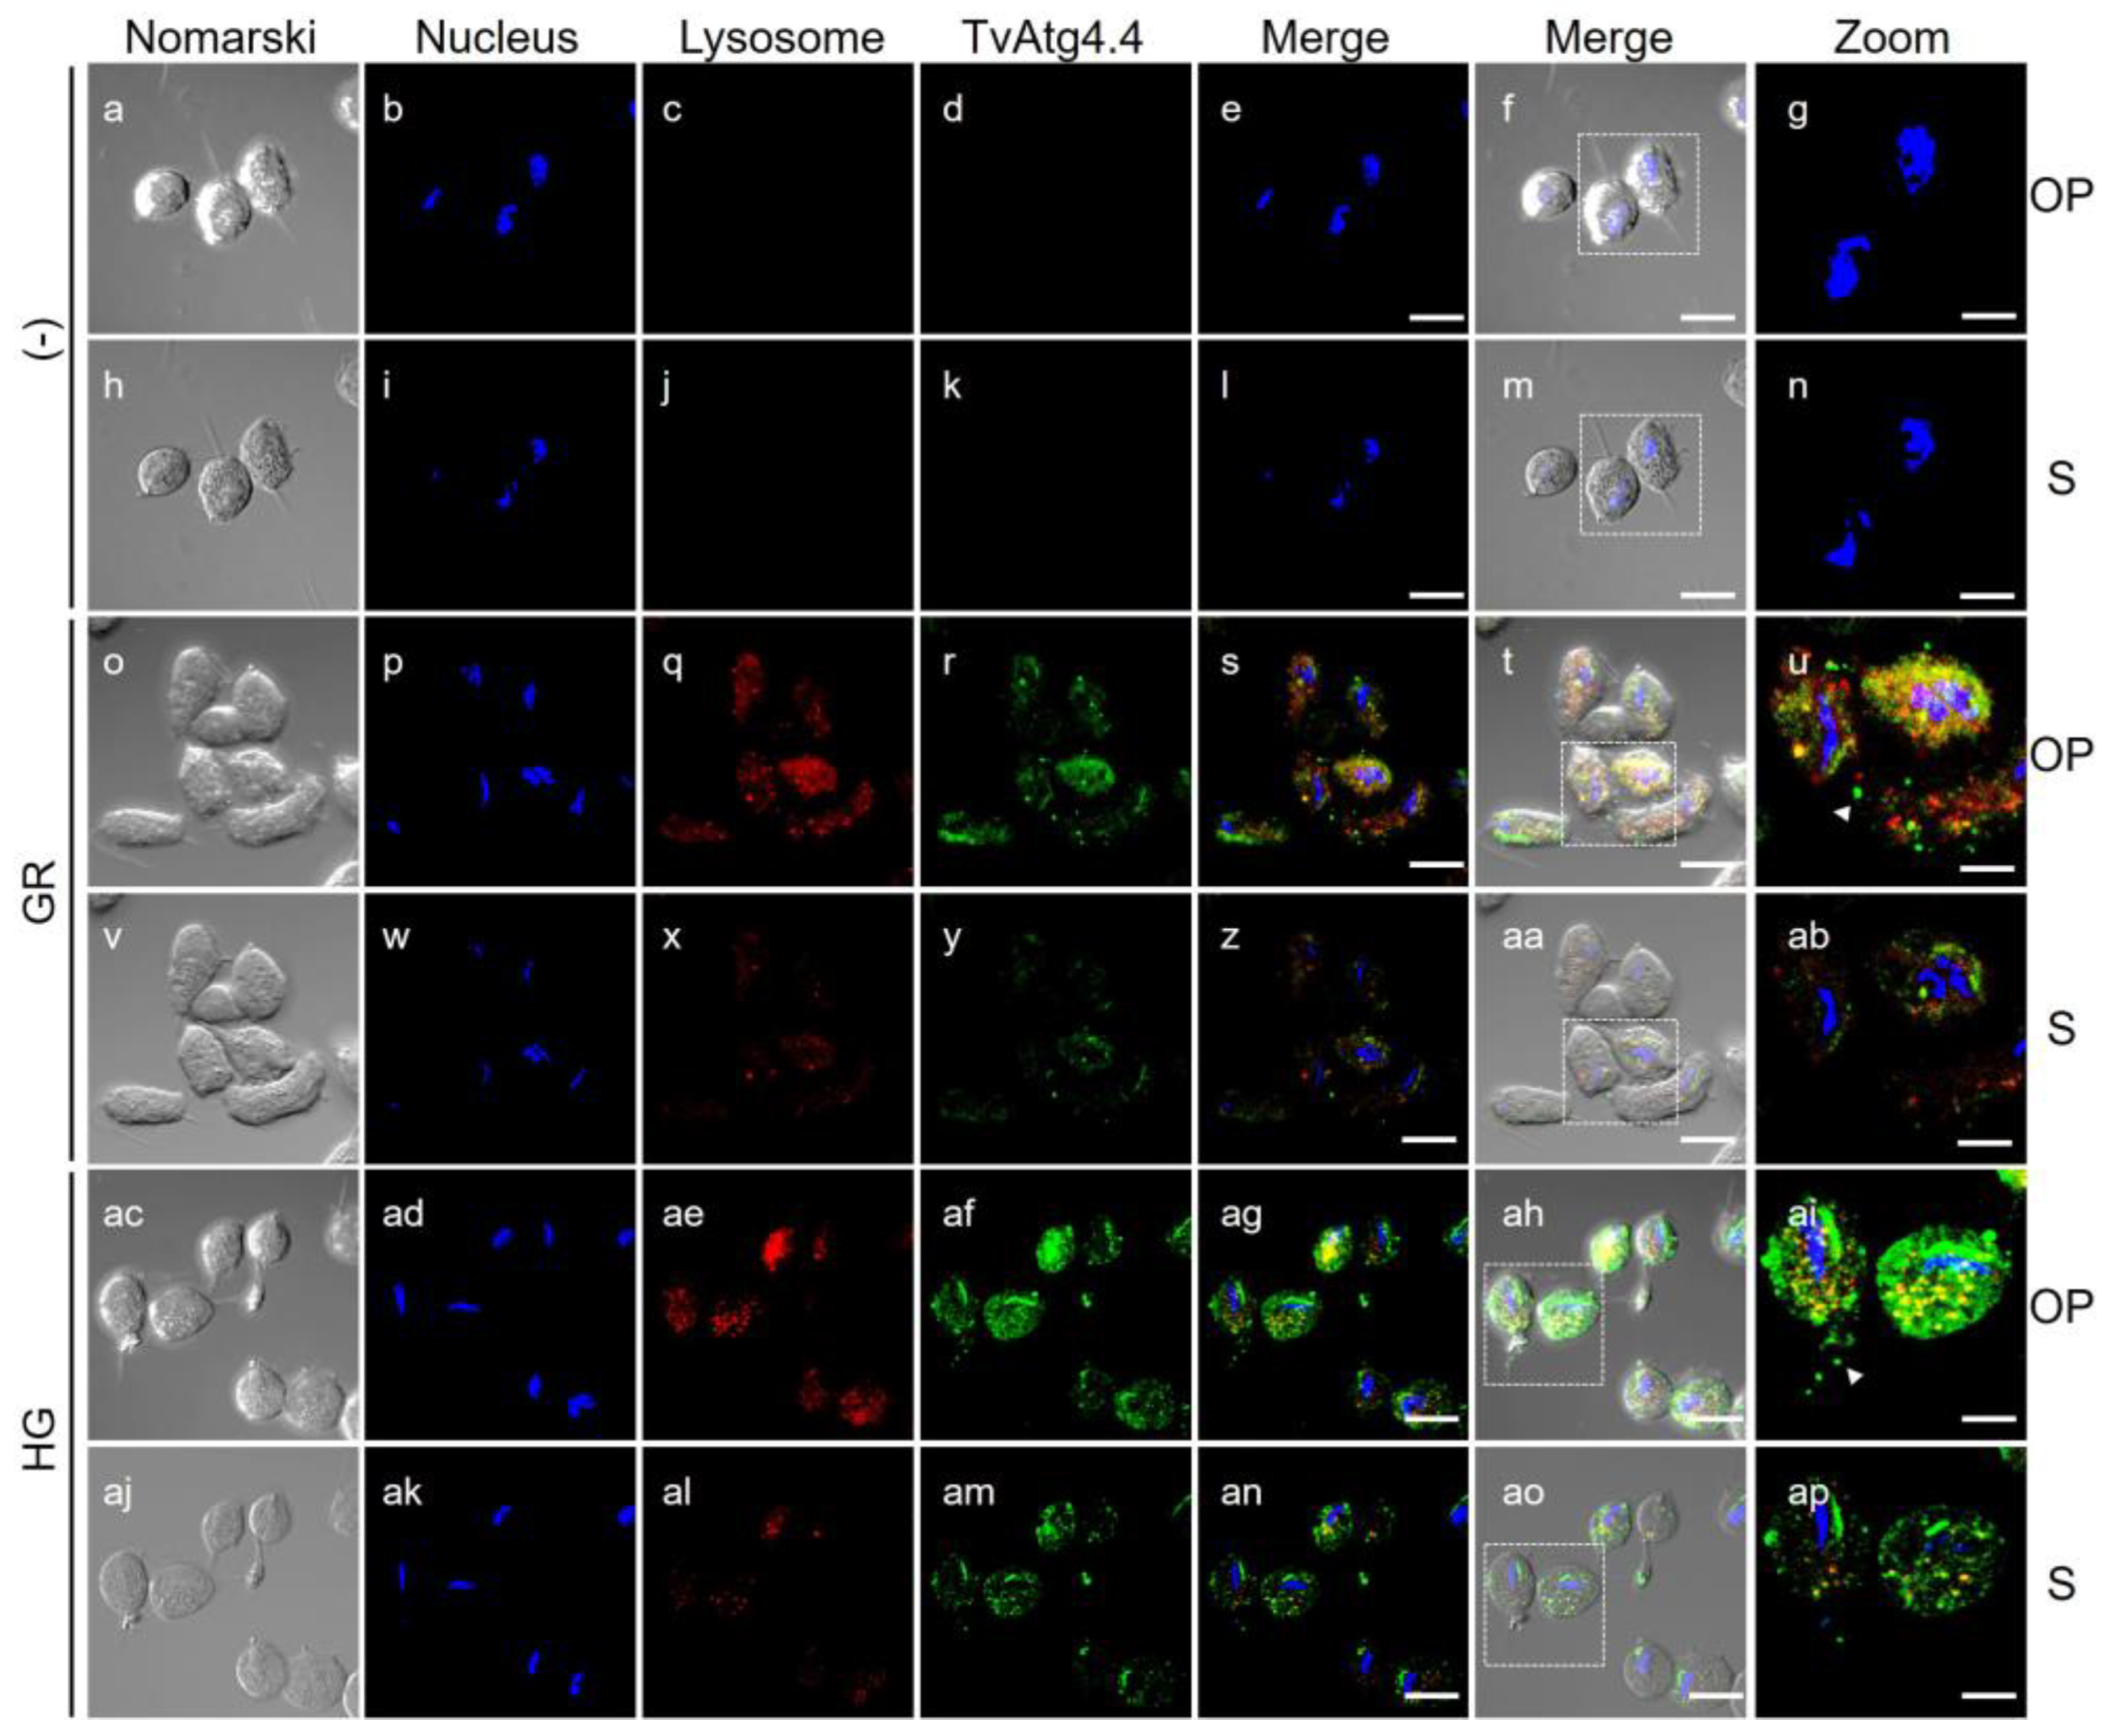
Figure 12.
Permeabilized parasites grown under GR (o-ab) and HG (ac-ap) glucose conditions. Parasites were labeled with Mα-rTvAtg4.4 antibody (green) and with Lysotracker (red). (-) Samples incubated with PI serum or only secondary antibody (a-n) were used as negative controls. Nuclei were labeled with Hoechst (blue). Orthogonal projection (OP) and optical sections (S) are shown. Scale bar, 5 μm. Zoom bar, 2 μm.
Figure 13.
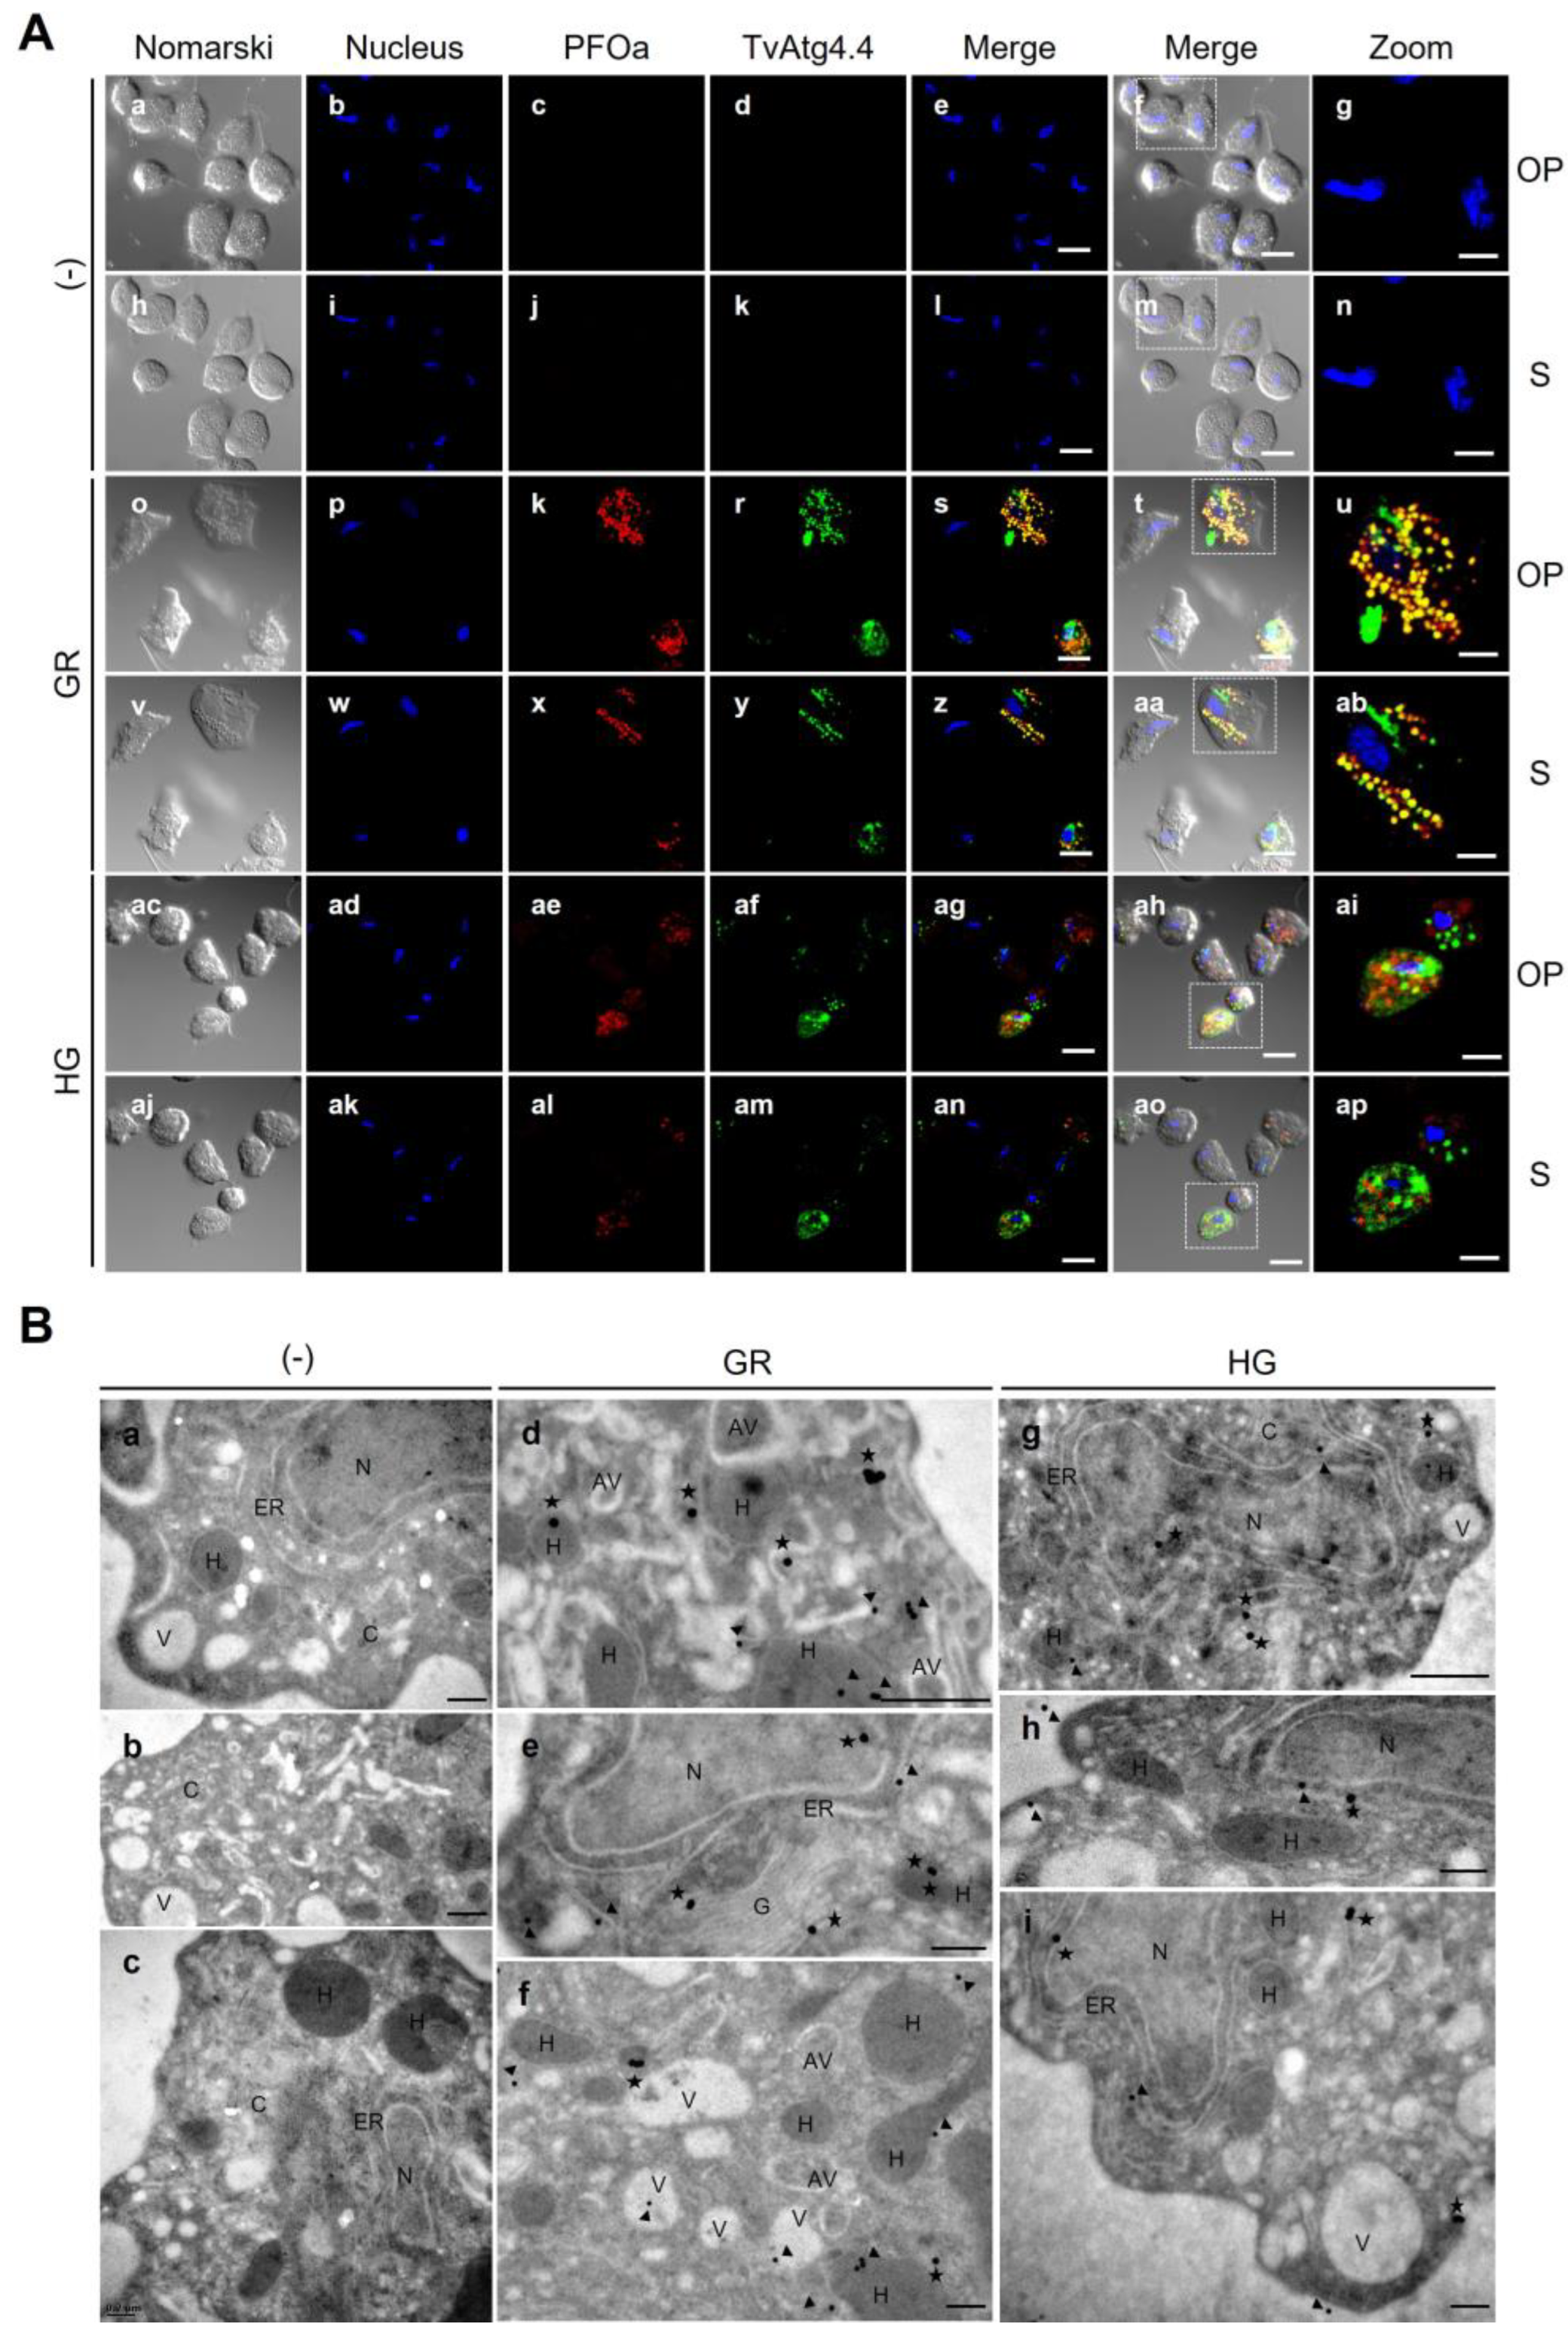
Localization of TvAtg4.4 autophagin in hydrogenosomes of parasites grown under different glucose conditions by IFA and TEM. (A) Permeabilized parasites grown under GR (o-ab) and HG (ac-ap) conditions were labeled with Mα-rTvAtg4.4 (green) and with Rα-rPFOa (red) antibodies to identify hydrogenosomes. (-) Incubation with PI serum or only with secondary antibody was used as a negative control (a-n). Nuclei were labeled with Hoechst (blue). Yellow vesicles indicate the localization of TvAtg4.4 in hydrogenosomes. Orthogonal projections (OP) and optical sections (S) are shown. Scale bar 5 µm; Zoom bar 2 µm. (B) TEM of parasites grown under GR (d-f) or HG conditions (g-i); (-) parasites incubated only labeled with the secondary antibody (a-c) were used as negative controls. The location of TvAtg4.4 (stars) and PFOa (arrowheads) is indicated. Identified organelles: cytoplasm (C), nucleus (N), membrane (M), hydrogenosome (H), endoplasmic reticulum (ER), Golgi apparatus (G), Vesicle (V), autophagic vesicle (AV). Black scale bar, 500 nm and 200 nm.
Figure 13.
Localization of TvAtg4.4 autophagin in hydrogenosomes of parasites grown under different glucose conditions by IFA and TEM. (A) Permeabilized parasites grown under GR (o-ab) and HG (ac-ap) conditions were labeled with Mα-rTvAtg4.4 (green) and with Rα-rPFOa (red) antibodies to identify hydrogenosomes. (-) Incubation with PI serum or only with secondary antibody was used as a negative control (a-n). Nuclei were labeled with Hoechst (blue). Yellow vesicles indicate the localization of TvAtg4.4 in hydrogenosomes. Orthogonal projections (OP) and optical sections (S) are shown. Scale bar 5 µm; Zoom bar 2 µm. (B) TEM of parasites grown under GR (d-f) or HG conditions (g-i); (-) parasites incubated only labeled with the secondary antibody (a-c) were used as negative controls. The location of TvAtg4.4 (stars) and PFOa (arrowheads) is indicated. Identified organelles: cytoplasm (C), nucleus (N), membrane (M), hydrogenosome (H), endoplasmic reticulum (ER), Golgi apparatus (G), Vesicle (V), autophagic vesicle (AV). Black scale bar, 500 nm and 200 nm.