
Submitted:
25 November 2025
Posted:
26 November 2025
You are already at the latest version
Abstract
This article presents the stages of development of an NDIR (Non-dispersive infrared) open-type gas analyzer with a fundamentally new discrete IR radiation generation scheme for measuring the dynamics of water vapor and carbon dioxide concentrations with further application in the instrument base of an ecological and climatic station to implement the eddy covariance method. In addition, the process of selecting components of NDIR gas analyzers, as well as its calibration and conducting experiments in the field as part of an ecological and climatic station is described.
Keywords:
NDIR spectroscopy
; gas analyzer
; eddy covariance method
; fluxes measurement
1. Introduction
The growing concentrations of key greenhouse gases (GHGs) in the atmosphere—primarily carbon dioxide () and methane ()—are explicitly linked to anthropogenic climate change and dramatic shifts in global biogeochemical cycles [1]. Understanding the sources and sinks of these gases is of critical importance, requiring accurate measurement of their net exchange (fluxes) between the atmosphere and various terrestrial and aquatic ecosystems, including forests, wetlands, and agricultural landscapes. These flux measurements provide priceless data for assessing ecosystem responses to environmental variability and management practices, as well as for restricting and testing Earth system models.
The eddy covariance (EC) method has become the standard micrometeorological technique for quantifying fluxes directly at the ecosystem scale over areas ranging from hectares to square kilometers [2,3]. The principle of the method is based on capturing turbulent scalar transport in the near-surface layer of the atmosphere. In particular, the flux (F) is calculated as the covariance between high-frequency fluctuations in vertical wind speed (w’) and the scalar mixing coefficient or density (c’) of interest (i.e. ), averaged over a suitable period (usually 30-60 minutes). This direct approach requires instruments capable of detecting these fast turbulent fluctuations, which require a rapid response (10-20 Hz), and high-precision sensors for determining both the three-dimensional wind speed vector (usually an acoustic anemometer) and the corresponding gas concentrations.
Non-dispersive infrared gas analyzers (NDIR) (IRGAs) have become the widely recognized technology for measuring and water vapor () fluxes in the scientific community. Open-path (OP) designs, such as the widely used LI-COR LI-7500 and Campbell Scientific EC150/IRGASON series instruments, are particularly demanded in many environments. Their advantages include relatively low power consumption, which is crucial for deployment at remote, autonomous sites, no signal attenuation or delays associated with the use of samplers, and ease of operation.
However, open path NDIR analyzers face their own inherent problems. Due to the influence of environmental conditions, they are susceptible to data loss during precipitation, fog, or dew formation on the optical lenses. Flow calculations require significant post-processing to correct for air density variations caused by the simultaneous transfer of heat and water vapor (WPL correction [4]). In addition, past errors associated with device self-heating, especially in low-energy environments, have required complex correction procedures [5]. Even modern optical NDIR designs can exhibit minor deviations related to spectroscopic effects and sensitivity to ambient temperature fluctuations [6,7]. Closed path NDIR analyzers (e.g., LI-COR LI-7200RS) represent an evolution aimed at addressing some performance issues, but they require compromises in frequency response and potential tube effects [8].
While NDIR technology provides a reliable solution for measuring and , simultaneous measurement of , , and using open-channel EC is currently based mainly on more complex and energy-intensive laser spectroscopy methods (e.g., TDLAS, QCLS) or requires the use of multiple separate gas analyzers [9,10]. This creates limitations for organizing complex monitoring of greenhouse gas fluxes, especially in locations with limited power supply or where simplicity and reliability of instruments are prioritized. Here we present a new open path analyzer based on NDIR principles, specifically designed for simultaneous high-frequency measurement of and concentrations, suitable for calculating eddy covariance fluxes. The main design principles were focused on ensuring reliability in field conditions, optimizing the optical configuration to ensure sensitivity to multiple gases, effective temperature control, and reduced power consumption compared to alternative laser solutions. This article describes in detail the design of the instrument, laboratory performance, and evaluation of field performance.
2. Materials and Methods
This section outlines the methodology, where we describe stages of development of a structurally fundamentally new NDIR gas analyzer. The instrument is an open-type fast gas analyzer featured by a fundamentally new discrete IR radiation generation scheme. Unlike the LI-7500, the developed device uses pulse-width modulation of the signal to obtain the discrete IR radiation, rather than an impeller which is less reliable and durable.
The developed analyzer is intended for integration into complex meteorological stations, specifically for measuring carbon dioxide and water concentrations dynamics, especially for the eddy covariance method implementation.
The selection of the component base for the instrument’s development was a crucial step, essential for achieving the requisite high accuracy, sensitivity, and quality of the future product. The main technical components selected for the NDIR gas analyzer included an emitter, a control panel, and matching optics.
2.1. IR Emitter
The Micro-Hybrid JSIR 350-4 broadband emitter was chosen as the source of IR radiation. The main technical characteristics of the JSIR-350-4 are presented in Table 1 and Figure 1.
Where is the ambient temperature. Figure 1 shows JSIR 350-4 emission normalized to nominal power.
2.2. Photodetector Device
The InfraTec LRM-244 four-channel pyroelectric photodetector was chosen as the photodetector device. The LRM-244 is highly protected from the effects of external environmental factors due to the central window made of silicon. The light filters are located inside the photodetector device, which provides protection from environmental influences, including mechanical damage.
A unique operational feature of the LRM-244 is its characteristic polarity, which generates a negative signal when subjected to a positive flow of IR radiation. The comprehensive technical specifications for the LRM-244 are subsequently presented in Table 2.
The presented photodetector is configured to measure greenhouse gases such as and . The characteristics of the bandpass filters of the LRM-244 channels are shown in Table 3.
2.3. Matching Lenses
Flat-convex Edmund Optics lenses model 87-946 were selected as matching optical elements. These lenses are made of Burnett’s germanium needle, which has outstanding transmission properties in the IR range. In addition, the lenses have a broadband anti-glare coating for a wavelength range of 3...12 microns, which increases light transmission while reducing surface reflections. The diameter of the 87-946 lens is 25 mm, the focal length is 40 mm.
2.4. Developed NDIR Gas Analyzer
Figure 2 shows overall structure of the instrument. The optical path length, defined as the distance through which the atmospheric air circulates during measurement, is precisely 300 mm. The total device height is 345 mm.
2.5. Calibration
After the device was assembled and the automation software for collecting primary experimental data was developed, the device was calibrated for further field testing as part of an ecological and climatic station and compared with a similar device LI-COR LI-7500A.
Calibration involves determining a calibration ratio that shows the relationship between the values obtained from the photodetector channels and the greenhouse gas concentration. The calibration algorithm for the NDIR gas analyzer we developed is described below, using the and channels:
a) A sealed calibration tube with temperature and humidity sensors is placed in the optical path of the NDIR gas analyzer;
b)Before the calibration with target gases the values and are calculating with IR transparent nitrogen () is blown through the tube.
c) For carbon dioxide calibration, a calibration gas mixture (600 ppm) is blown through the tube, the values of it corresponds to a concentration of 600 ppm (Figure 3). For water vapor calibration, conditions close to dew point (dew point) are set in the calibration tube using a portable dew point generator LI-COR LI-610. d) In accordance with the obtained ratios between the concentrations of , and ), , calibration curves are constructed, where is the concentration of gas x and A, B, K, M are calibration constants (1-2):
The sensitivity of the developed NDIR gas analyzer for the channel is 0.19 ppm. This value is competitive compared to the claimed sensitivity of 0.10 ppm for LI-7500A.
2.6. Primary Data Processing
A pulse-width modulator generates a periodic control signal with a frequency of 10 Hz, which is fed to a broadband infrared emitter. Each of the four FPA (Focal Plane Array) channels records a periodic signal (Figure 4). The data presented in Figure 5 are offset-subtracted and absolute-valued (3). Then, for each of the four channels, the integral over each square wave period is computed, and intensity series are constructed (4) (Figure 6).
where is the mean voltage value over the square wave period.
Next, averaging is performed over two reference channels (5):
where and are the averaged intensity values of the reference channels.
Then, the quantities proportional to the optical density for carbon dioxide and water vapor are calculated as follows (6-7):
where is the integral for channel, is the integral for channel.
2.7. Field Verification Site Setup
On September 17-18 and October 17, 2024, a number of experiments were conducted at the Kamshilovka training base of Bauman Moscow State Technical University to test the NDIR gas analyzer and collect and process primary data. The experiments were conducted in order to verify the accuracy of the developed device.
Figure 9 shows a photograph of the experimental setup, where the devices are placed on a 3.2 m high from the ground and at a distance of 470 cm from each other.
The software and hardware measurement system consists of the following components: a 4-channel prototype sample of a non-dispersive infrared water and carbon dioxide gas analyzer; a three-axis WindMaster Pro ultrasonic anemometer; an open-type LI-7500A gas analyzer for analysis; a data acquisition system LI-COR 7550 Analyzer Interface Unit; a power supply and communication module for the prototype of the non-dispersive infrared and analyzer. Using this system, the following parameters were measured: concentration at a frequency of 10 Hz, concentration at a frequency of 10 Hz, readings from the three channels of the anemometer at a frequency of 10 Hz, and data on temperature, humidity, and pressure at a frequency of 1 Hz.
2.8. Flux Data Calculation
High-frequency (20 Hz) raw data from the sonic anemometer and infrared gas analyzers were processed using the EddyPro 7.0.9 software (LI-COR Biosciences). Raw data with timestamps from NDIR gas analyzer were collected to csv files, and utilizing homebrew python script converted to ghg files, with anemometer data added. Fluxes were computed over 30-minute averaging intervals. Prior to covariance calculation, low-frequency trends inherent in the time series were removed using the Block Averaging detrending method. The coordinate system was aligned with the mean wind streamline for each interval using the Double Rotation method. Any residual tilt in the anemometer’s orientation relative to the mean streamline, not accounted by double rotation, was addressed using the Planar Fit method [11] applied across a longer dataset encompassing various wind directions. Time lags between the vertical wind component and scalar concentration measurements, arising primarily from sensor separation were determined and corrected using the Covariance Maximization technique. Fluxes were corrected for density fluctuations induced by concurrent heat and water vapor transport using the Webb-Pearman-Leuning (WPL) correction [12]. Data quality assurance was performed using the Foken et al. [13] quality flagging system. A specific correction algorithm (W-boost) designed for Gill WindMaster anemometers was also enabled [14].
3. Results
The anemometer sends its data to the collection systems of two gas analyzers simultaneously with a frequency of 10 Hz. The measurements of the NDIR gas analyzer and LI-7500A are synchronized according to the data from the anemometer (Figure 10).
To accurately calculate carbon dioxide fluxes, it is necessary to consider the effect of dilution with water vapor. An NDIR analyzer measures the mole fraction of relative to humid air ("wet" mole fraction), expressed in ppm (µmol/mol). This value is then converted to "dry" mole fraction (i.e., the mole fraction in dry air), as shown in Equation (8):
where is the dry mole fraction of , is the mole fraction of , is the mole fraction of .
Figure 11 shows the result of calculating the drained mole fraction of carbon dioxide for NDIR and LI-COR LI-7500A.
The Figure 12 and Figure 13 show the results of modeling carbon dioxide and water vapor fluxes based on data obtained from the NDIR-developed gas analyzer and LI-7500A. The simulation was carried out for a 12-hour experiment at 08.30-20.30, conducted on 17.10.24 in Kamshilovka. For clarity, a five-minute flow averaging interval was selected.
The statistical comparison for the flux (Figure 14) shows a positive correlation, with a coefficient of determination () of 0.525 and an RMSE of 1.227 mol m−2s−1. The linear regression () suggests that our NDIR device, in its current calibration state, overestimates the flux magnitude by approximately 13% compared to the LI-7500A.
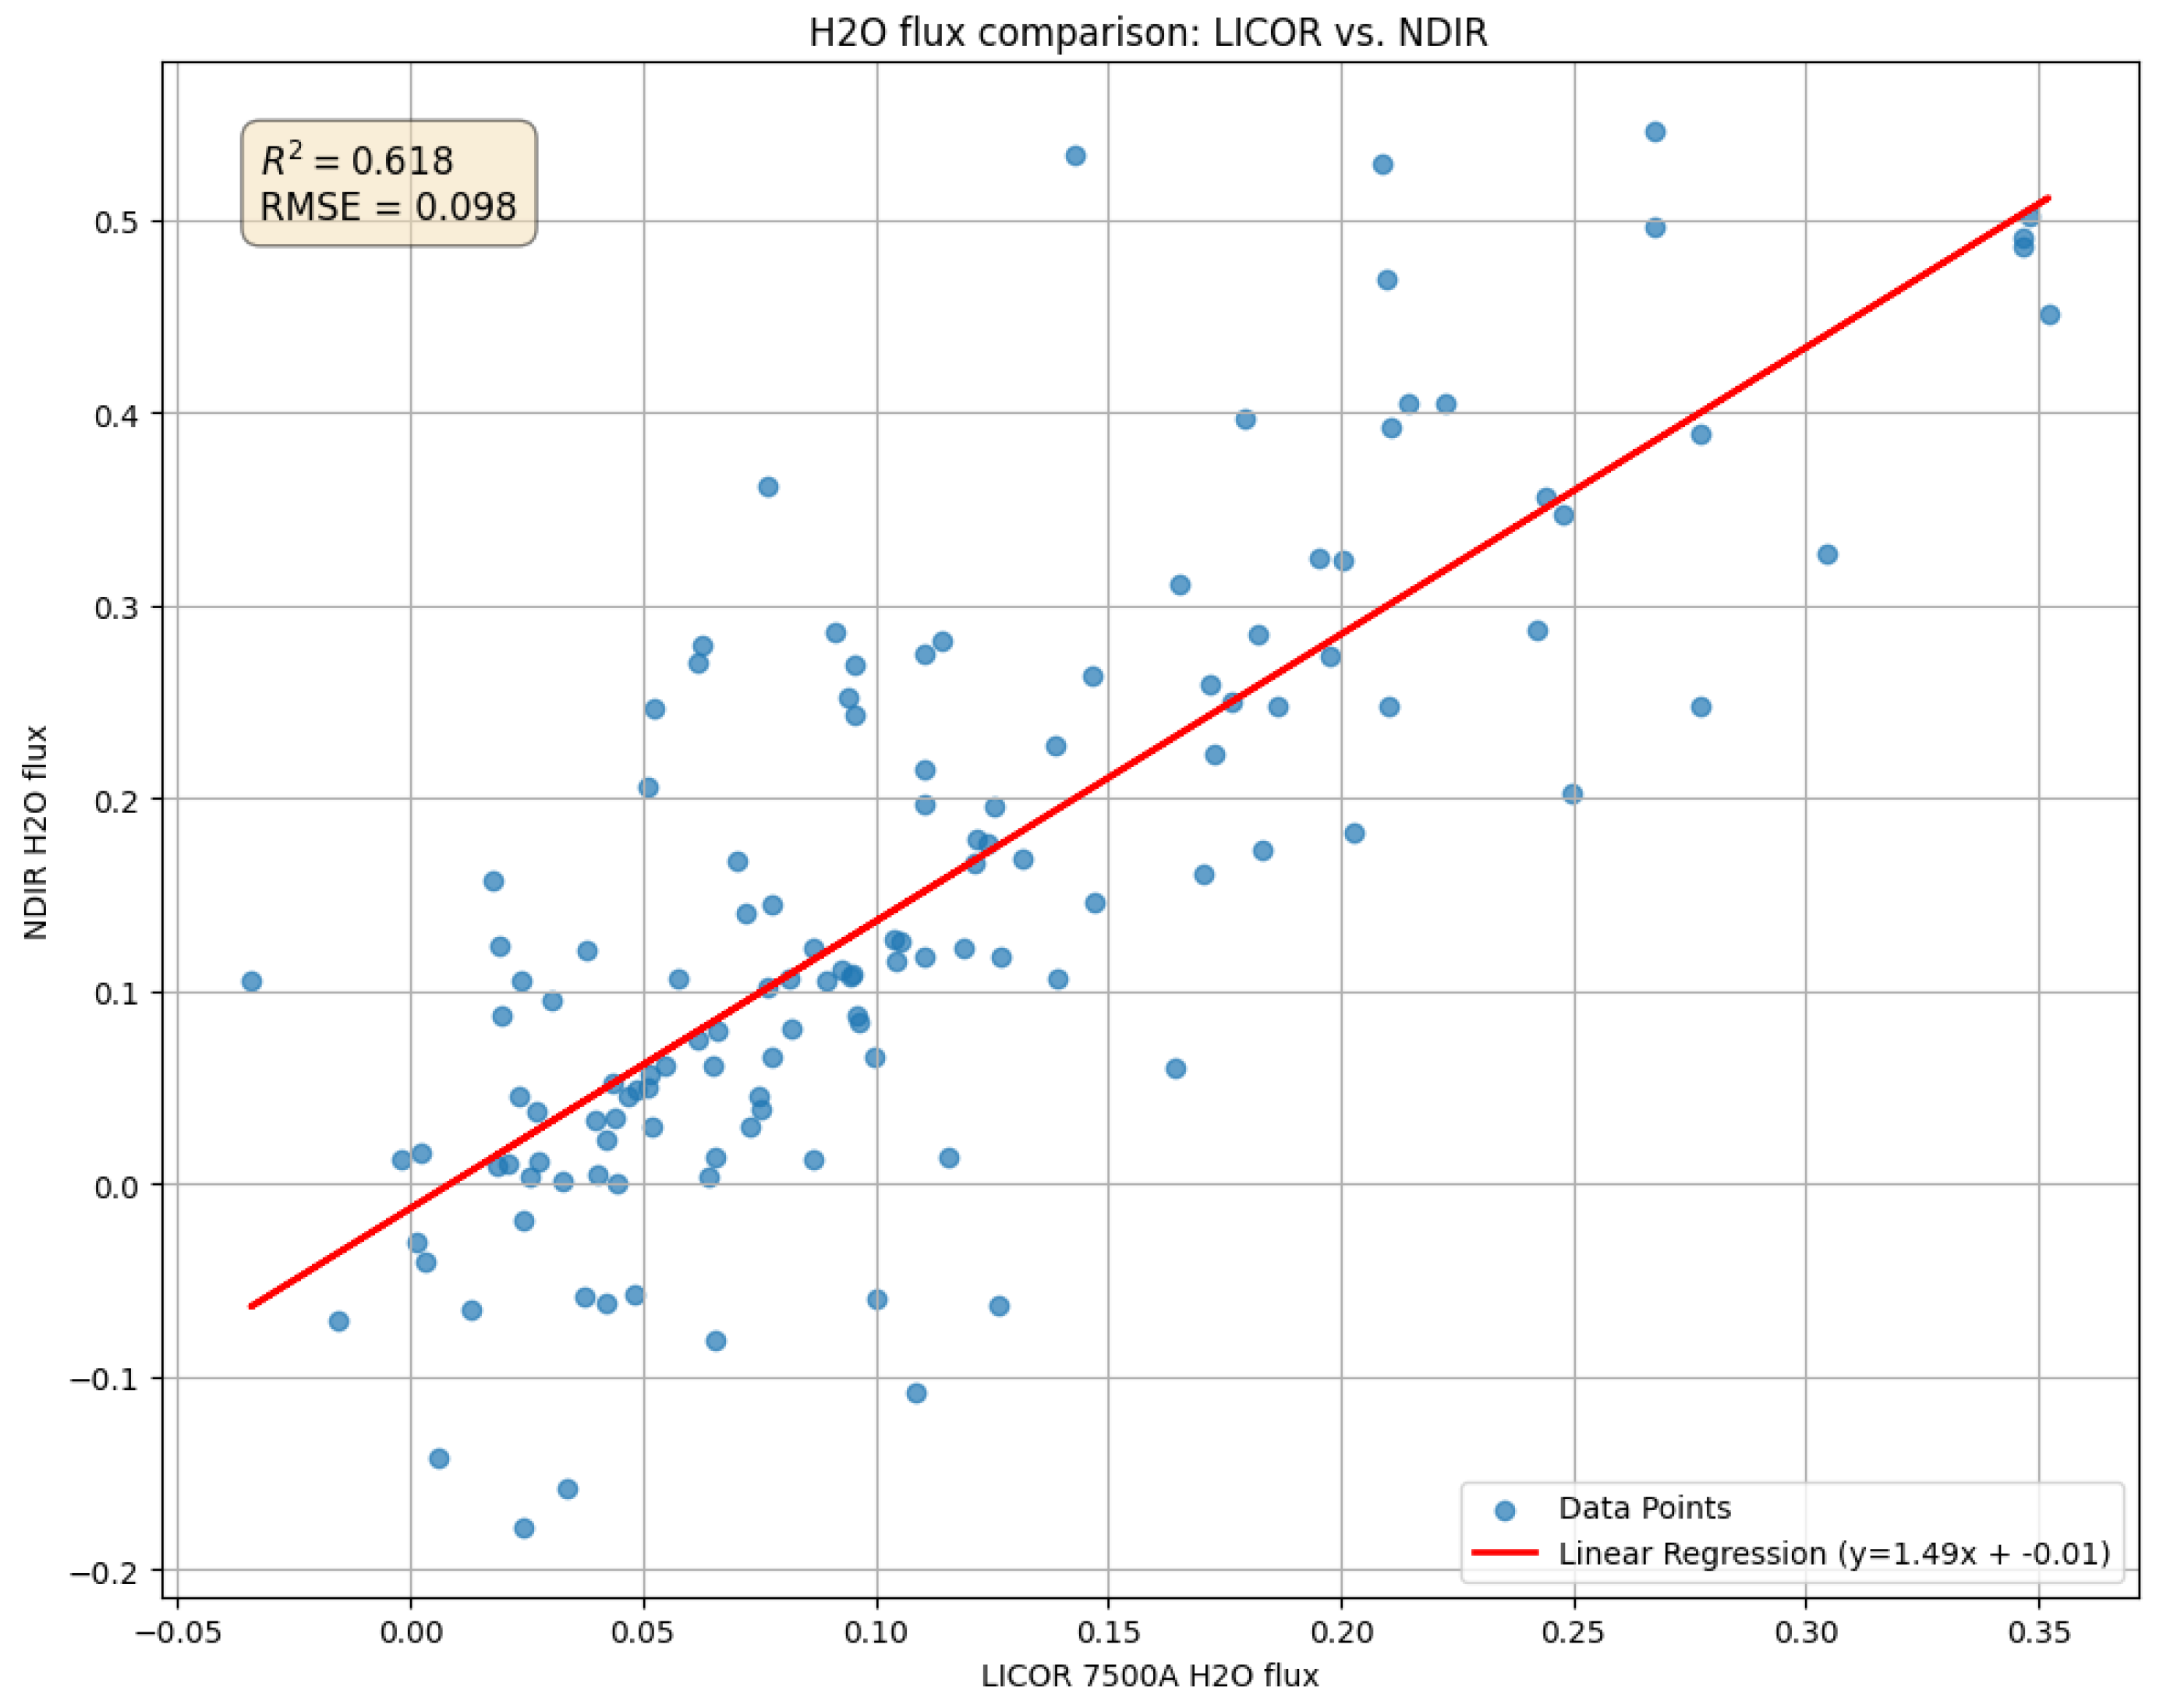
The comparison for the flux (Figure 15) shows a similar of 0.618 with an RMSE of 0.098 mmol m−2s−1. However, this plot reveals a more significant systematic discrepancy, with a regression slope of 1.49 ().
These results indicate that while the NDIR analyzer successfully captures the diurnal trends (as seen in Figure 12 and Figure 13), the initial linear, two-point calibration is not sufficient to fully reconcile the quantitative flux magnitudes between the two instruments.
Figure 10.
Vertical wind velocity (w) for NDIR (in orange) and LI-7500 (in blue).

Figure 11.
dry mole fraction dynamics measured by LI-COR LI-7500A (red line) and NDIR (blue line) devices.
Figure 11.
dry mole fraction dynamics measured by LI-COR LI-7500A (red line) and NDIR (blue line) devices.
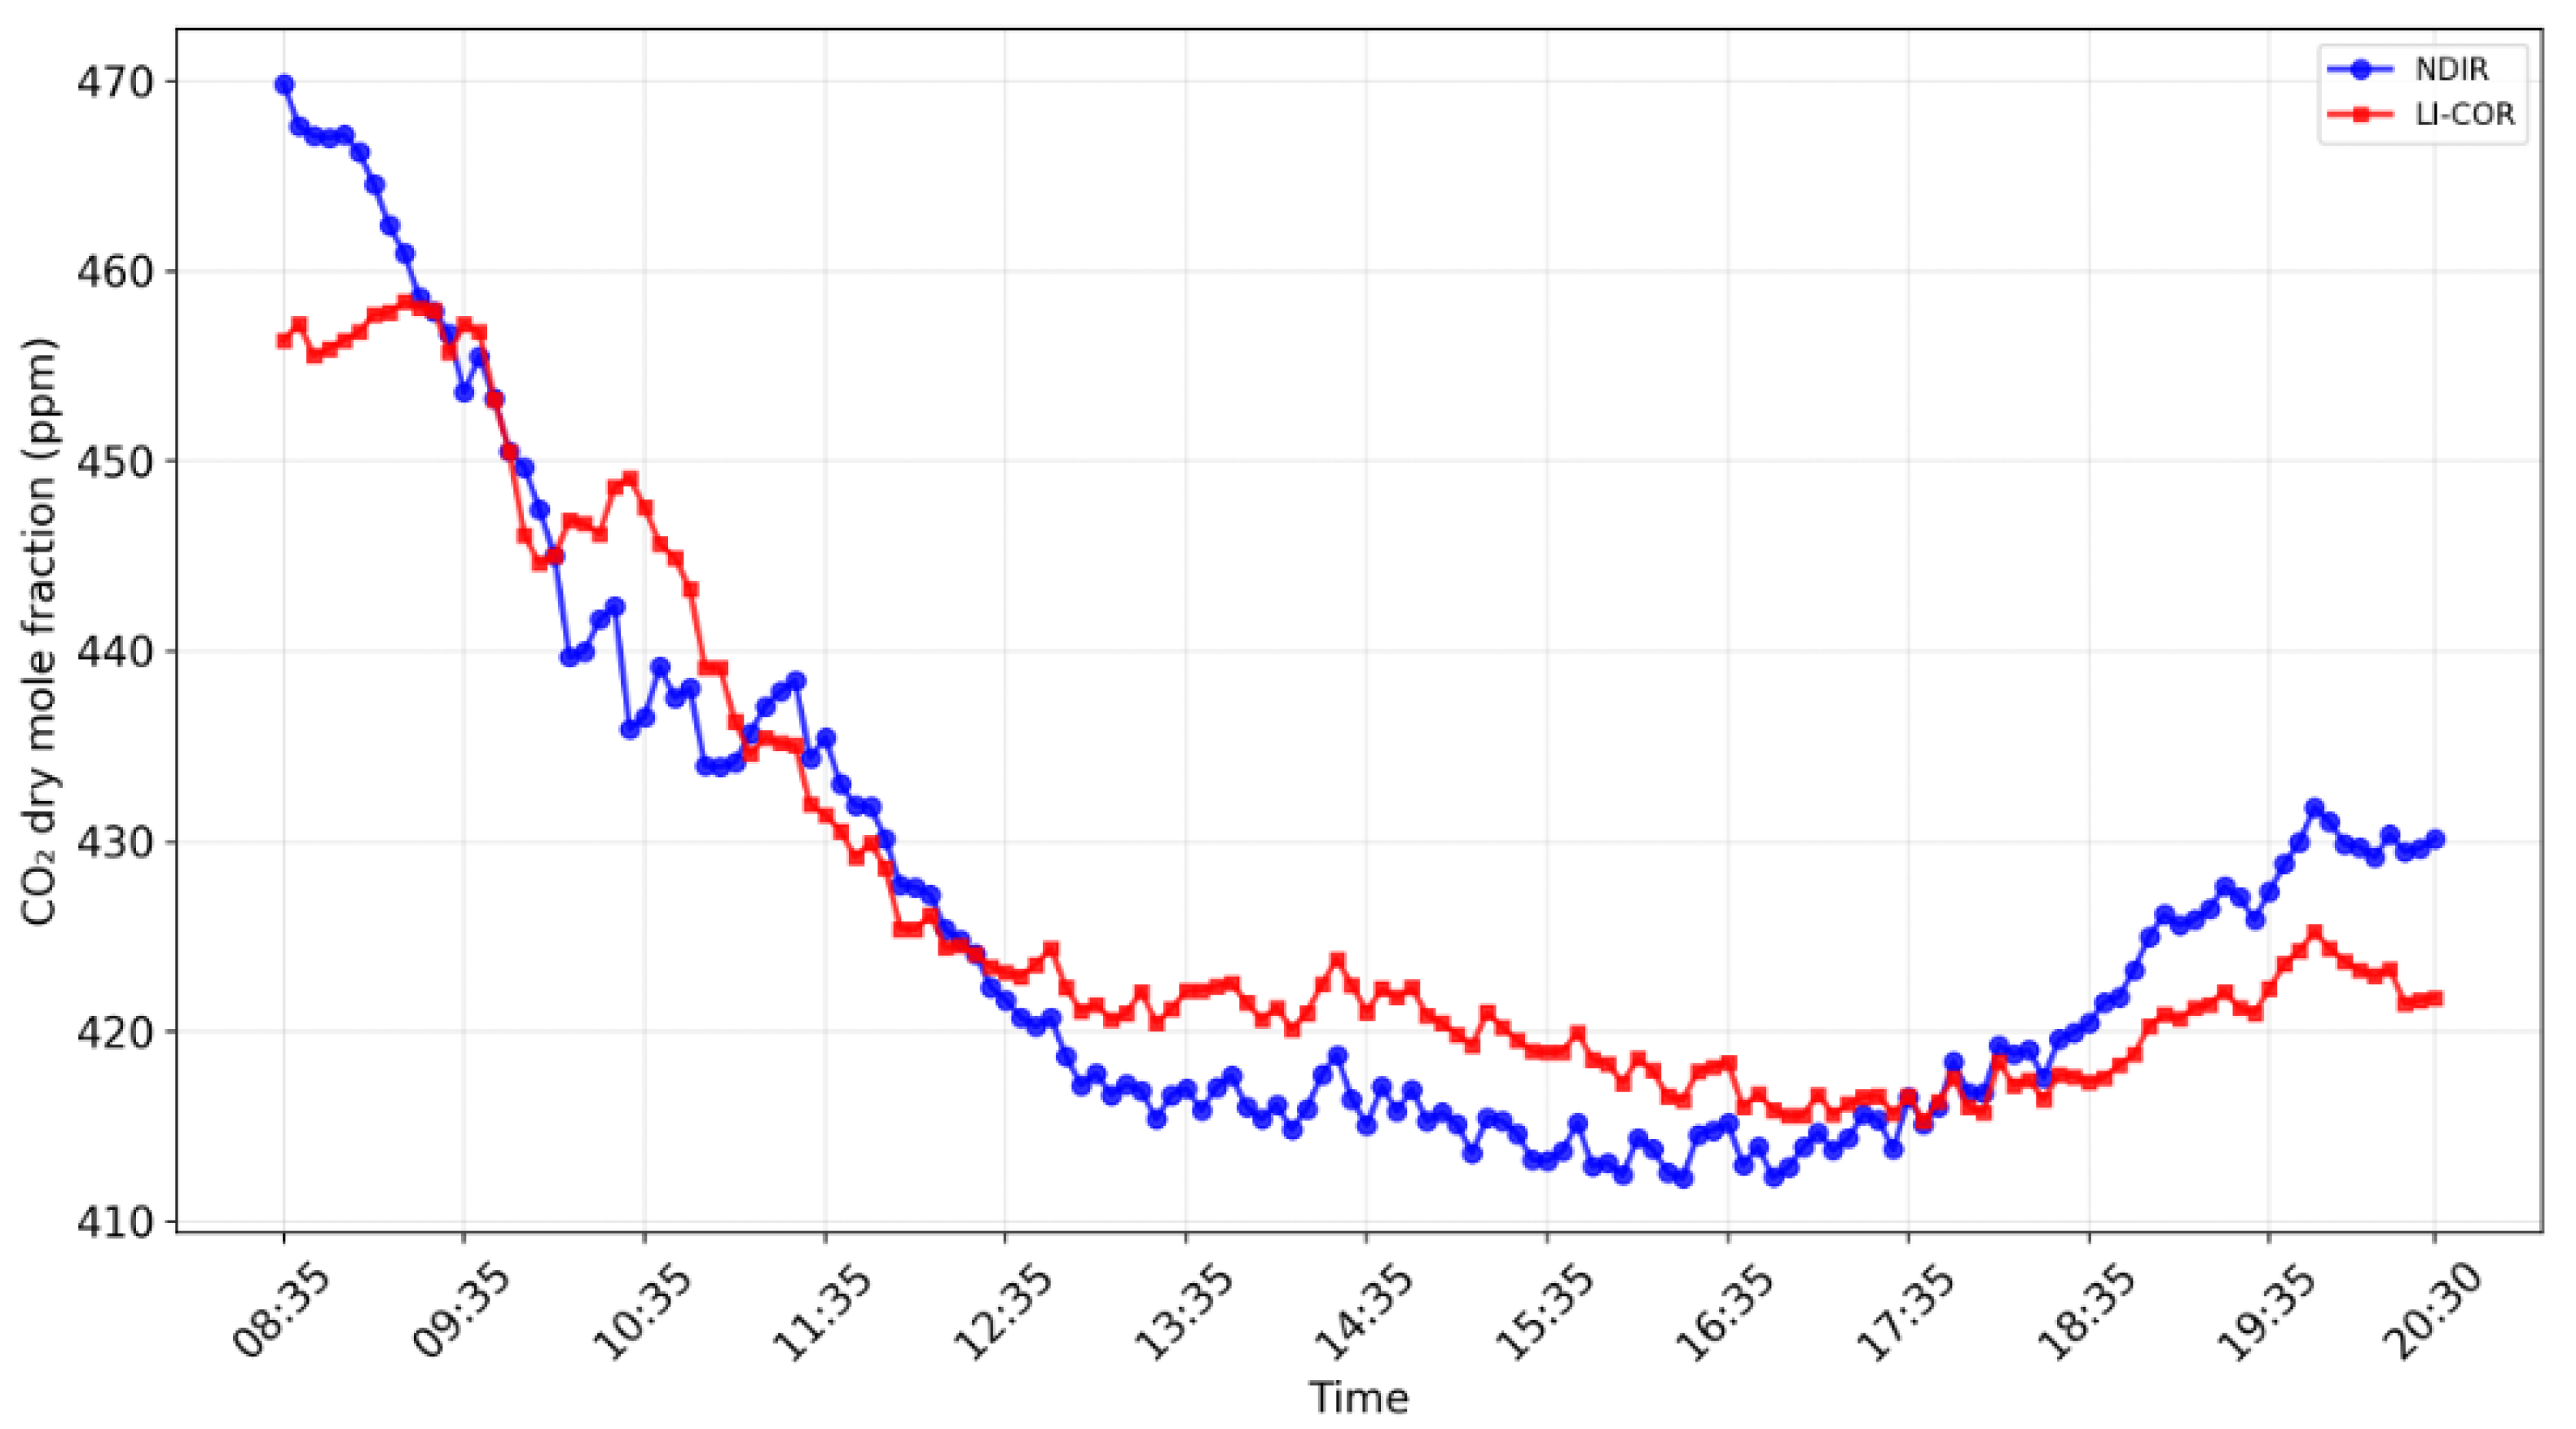
Figure 12.
flux dynamics calculated with EddyPro software for LI-COR LI-7500A(red line) and NDIR(blue line) devices data.
Figure 12.
flux dynamics calculated with EddyPro software for LI-COR LI-7500A(red line) and NDIR(blue line) devices data.
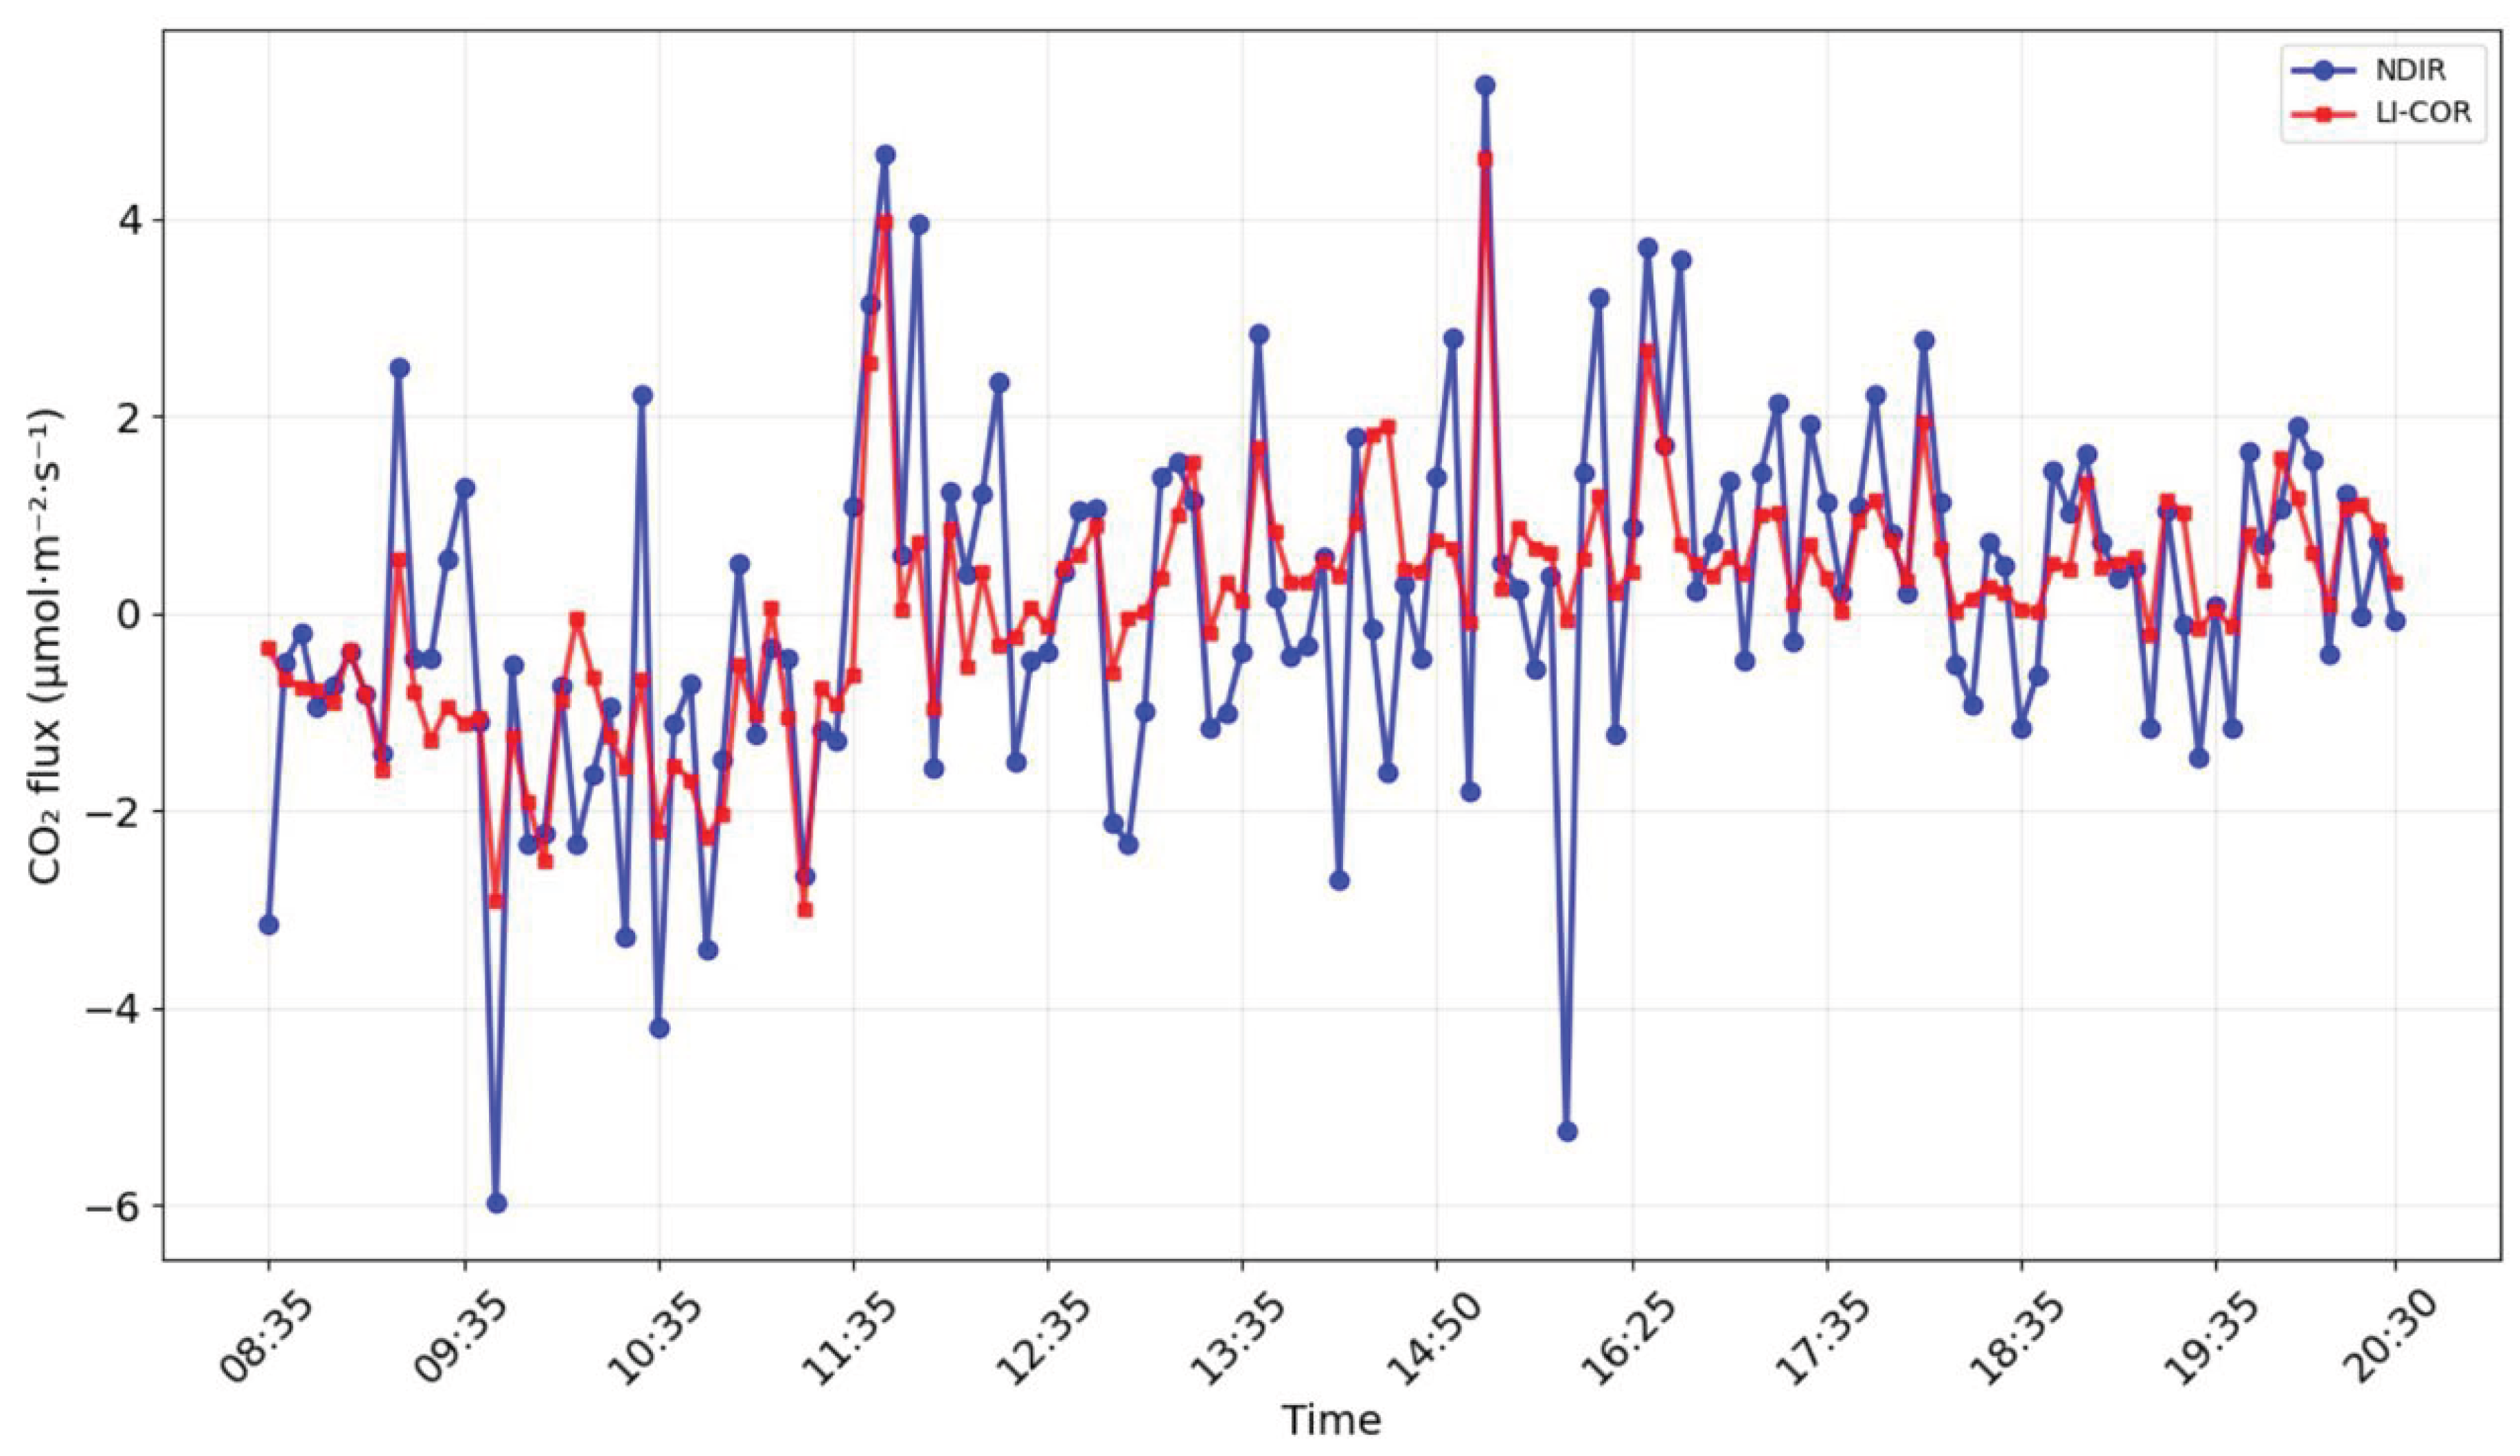
Figure 13.
flux dynamics calculated with EddyPro software for LI-COR LI-7500A(red line) and NDIR(blue line) devices data.
Figure 13.
flux dynamics calculated with EddyPro software for LI-COR LI-7500A(red line) and NDIR(blue line) devices data.
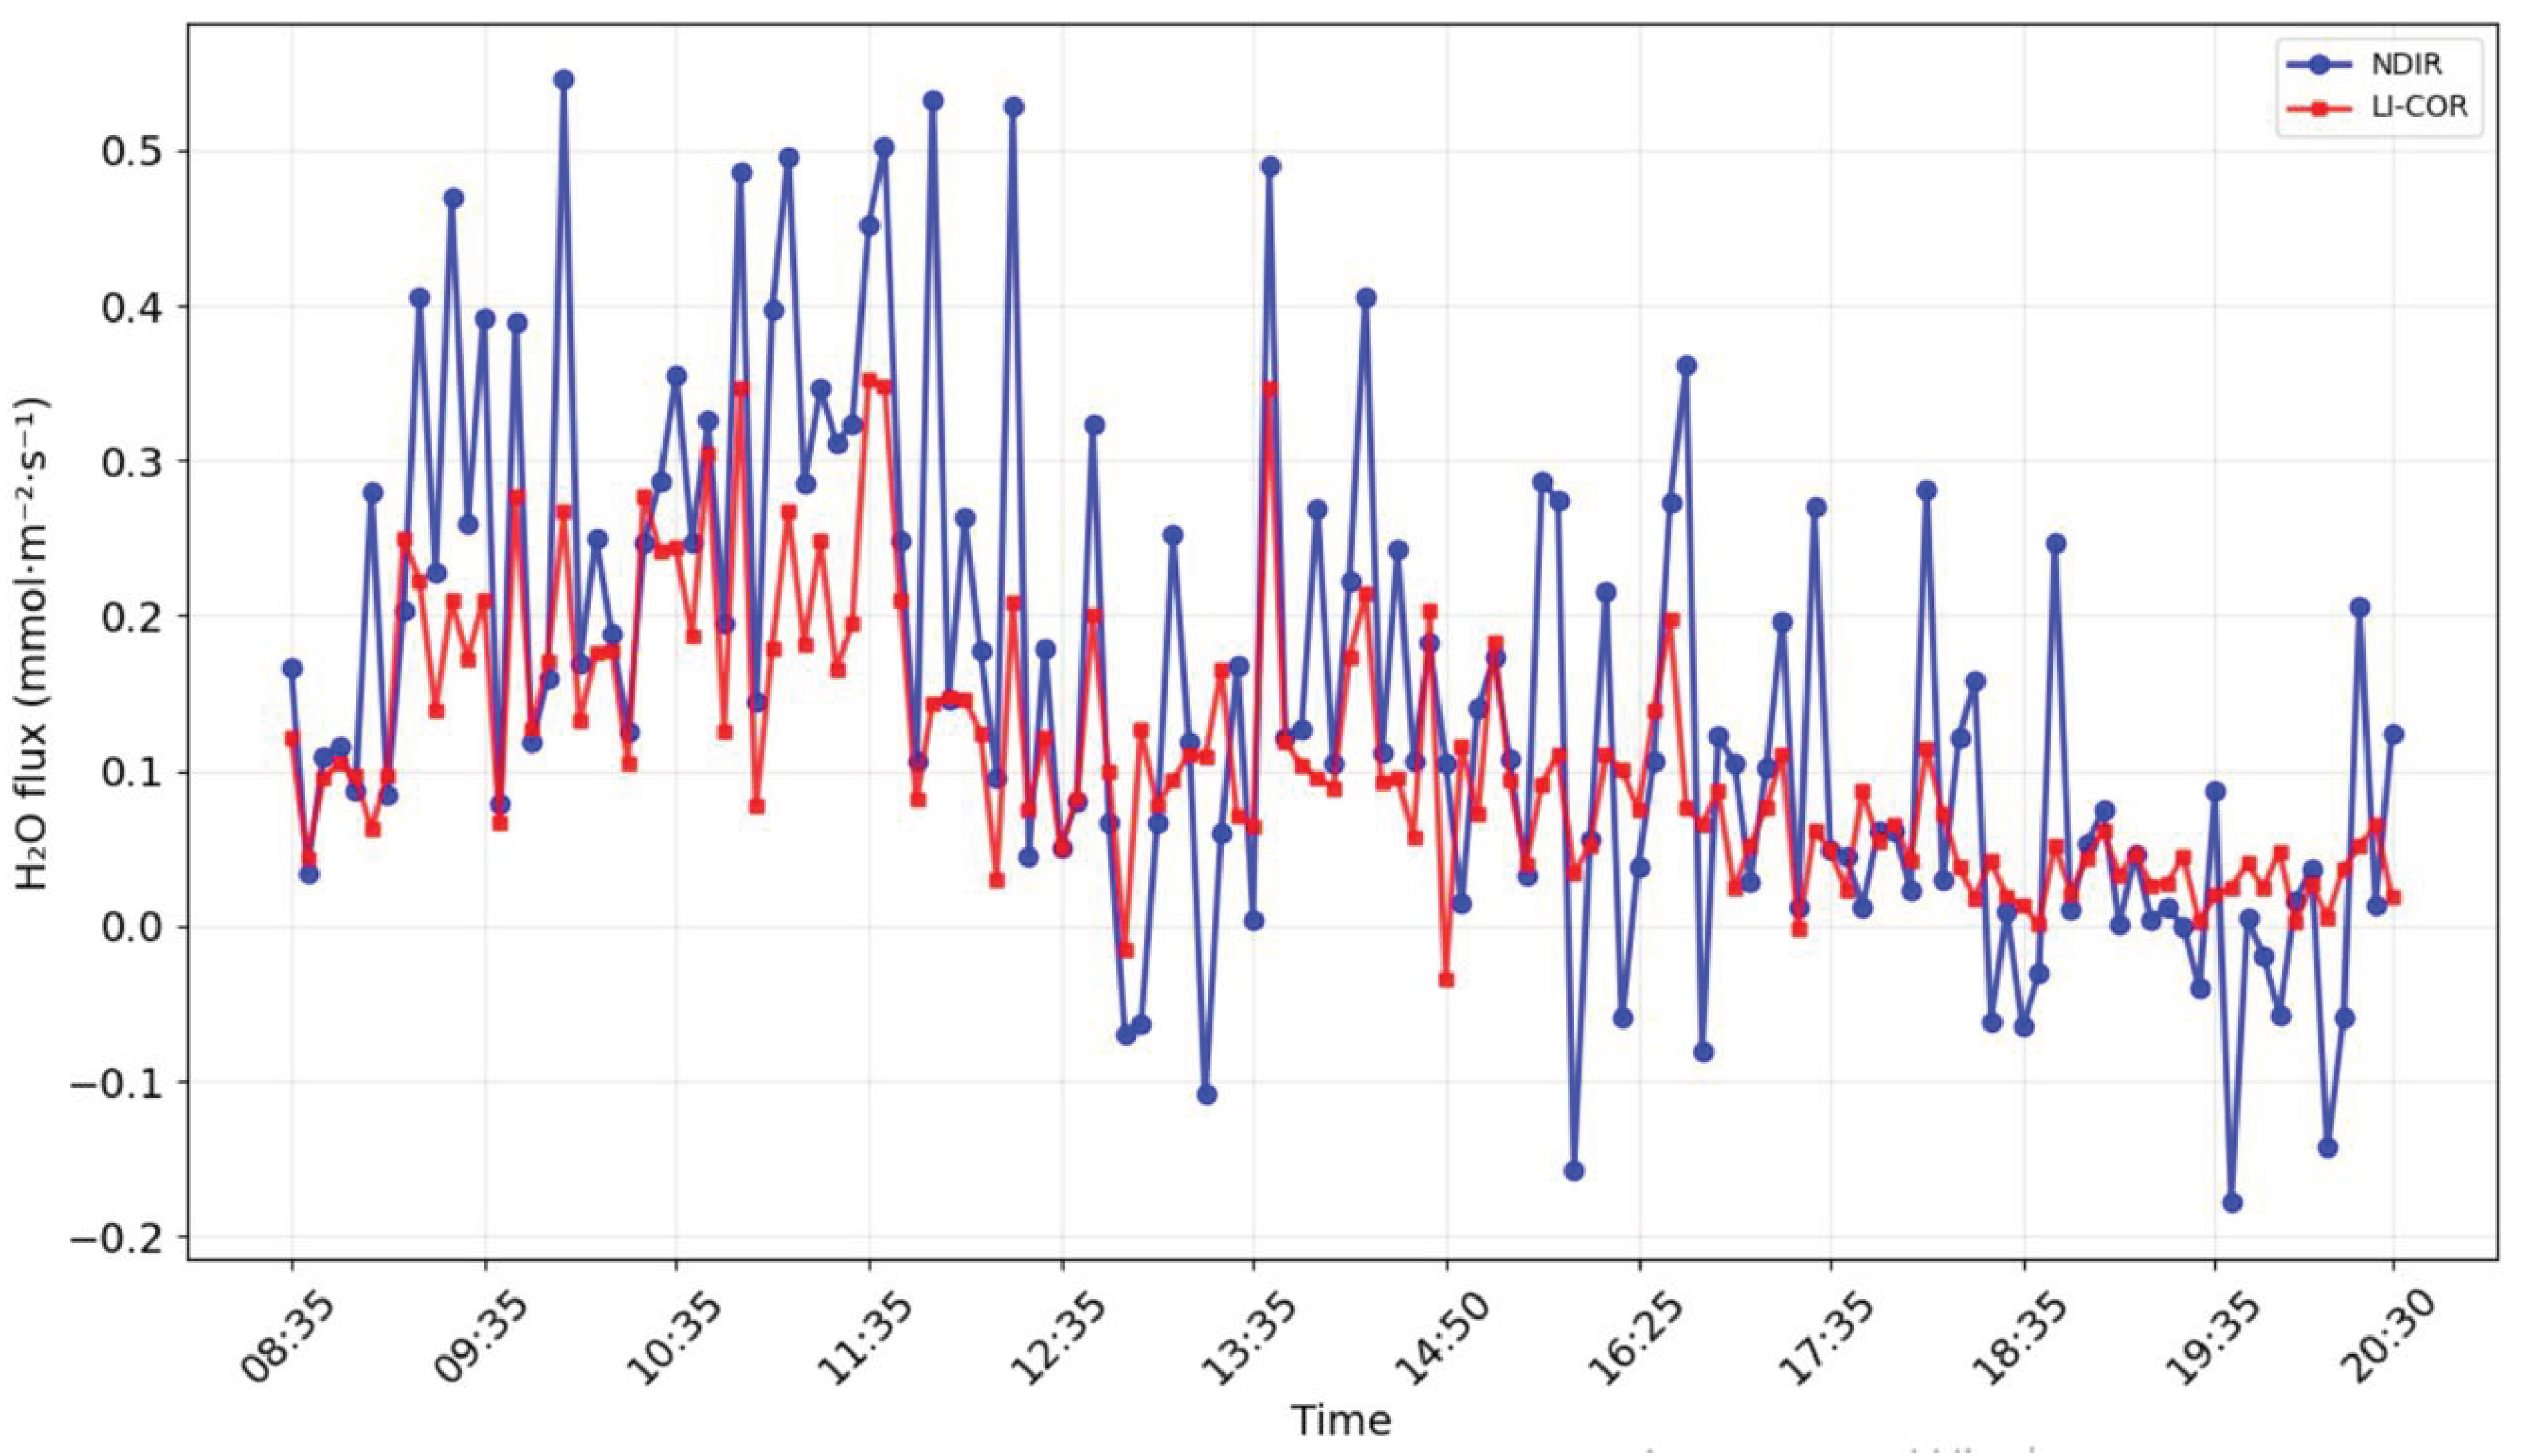
Figure 14.
Scatter plot of 5-minute fluxes comparing the developed NDIR device (y-axis) against the reference LI-COR LI-7500A (x-axis). The analysis shows a coefficient of determination () of 0.525 and a linear regression of .
Figure 14.
Scatter plot of 5-minute fluxes comparing the developed NDIR device (y-axis) against the reference LI-COR LI-7500A (x-axis). The analysis shows a coefficient of determination () of 0.525 and a linear regression of .
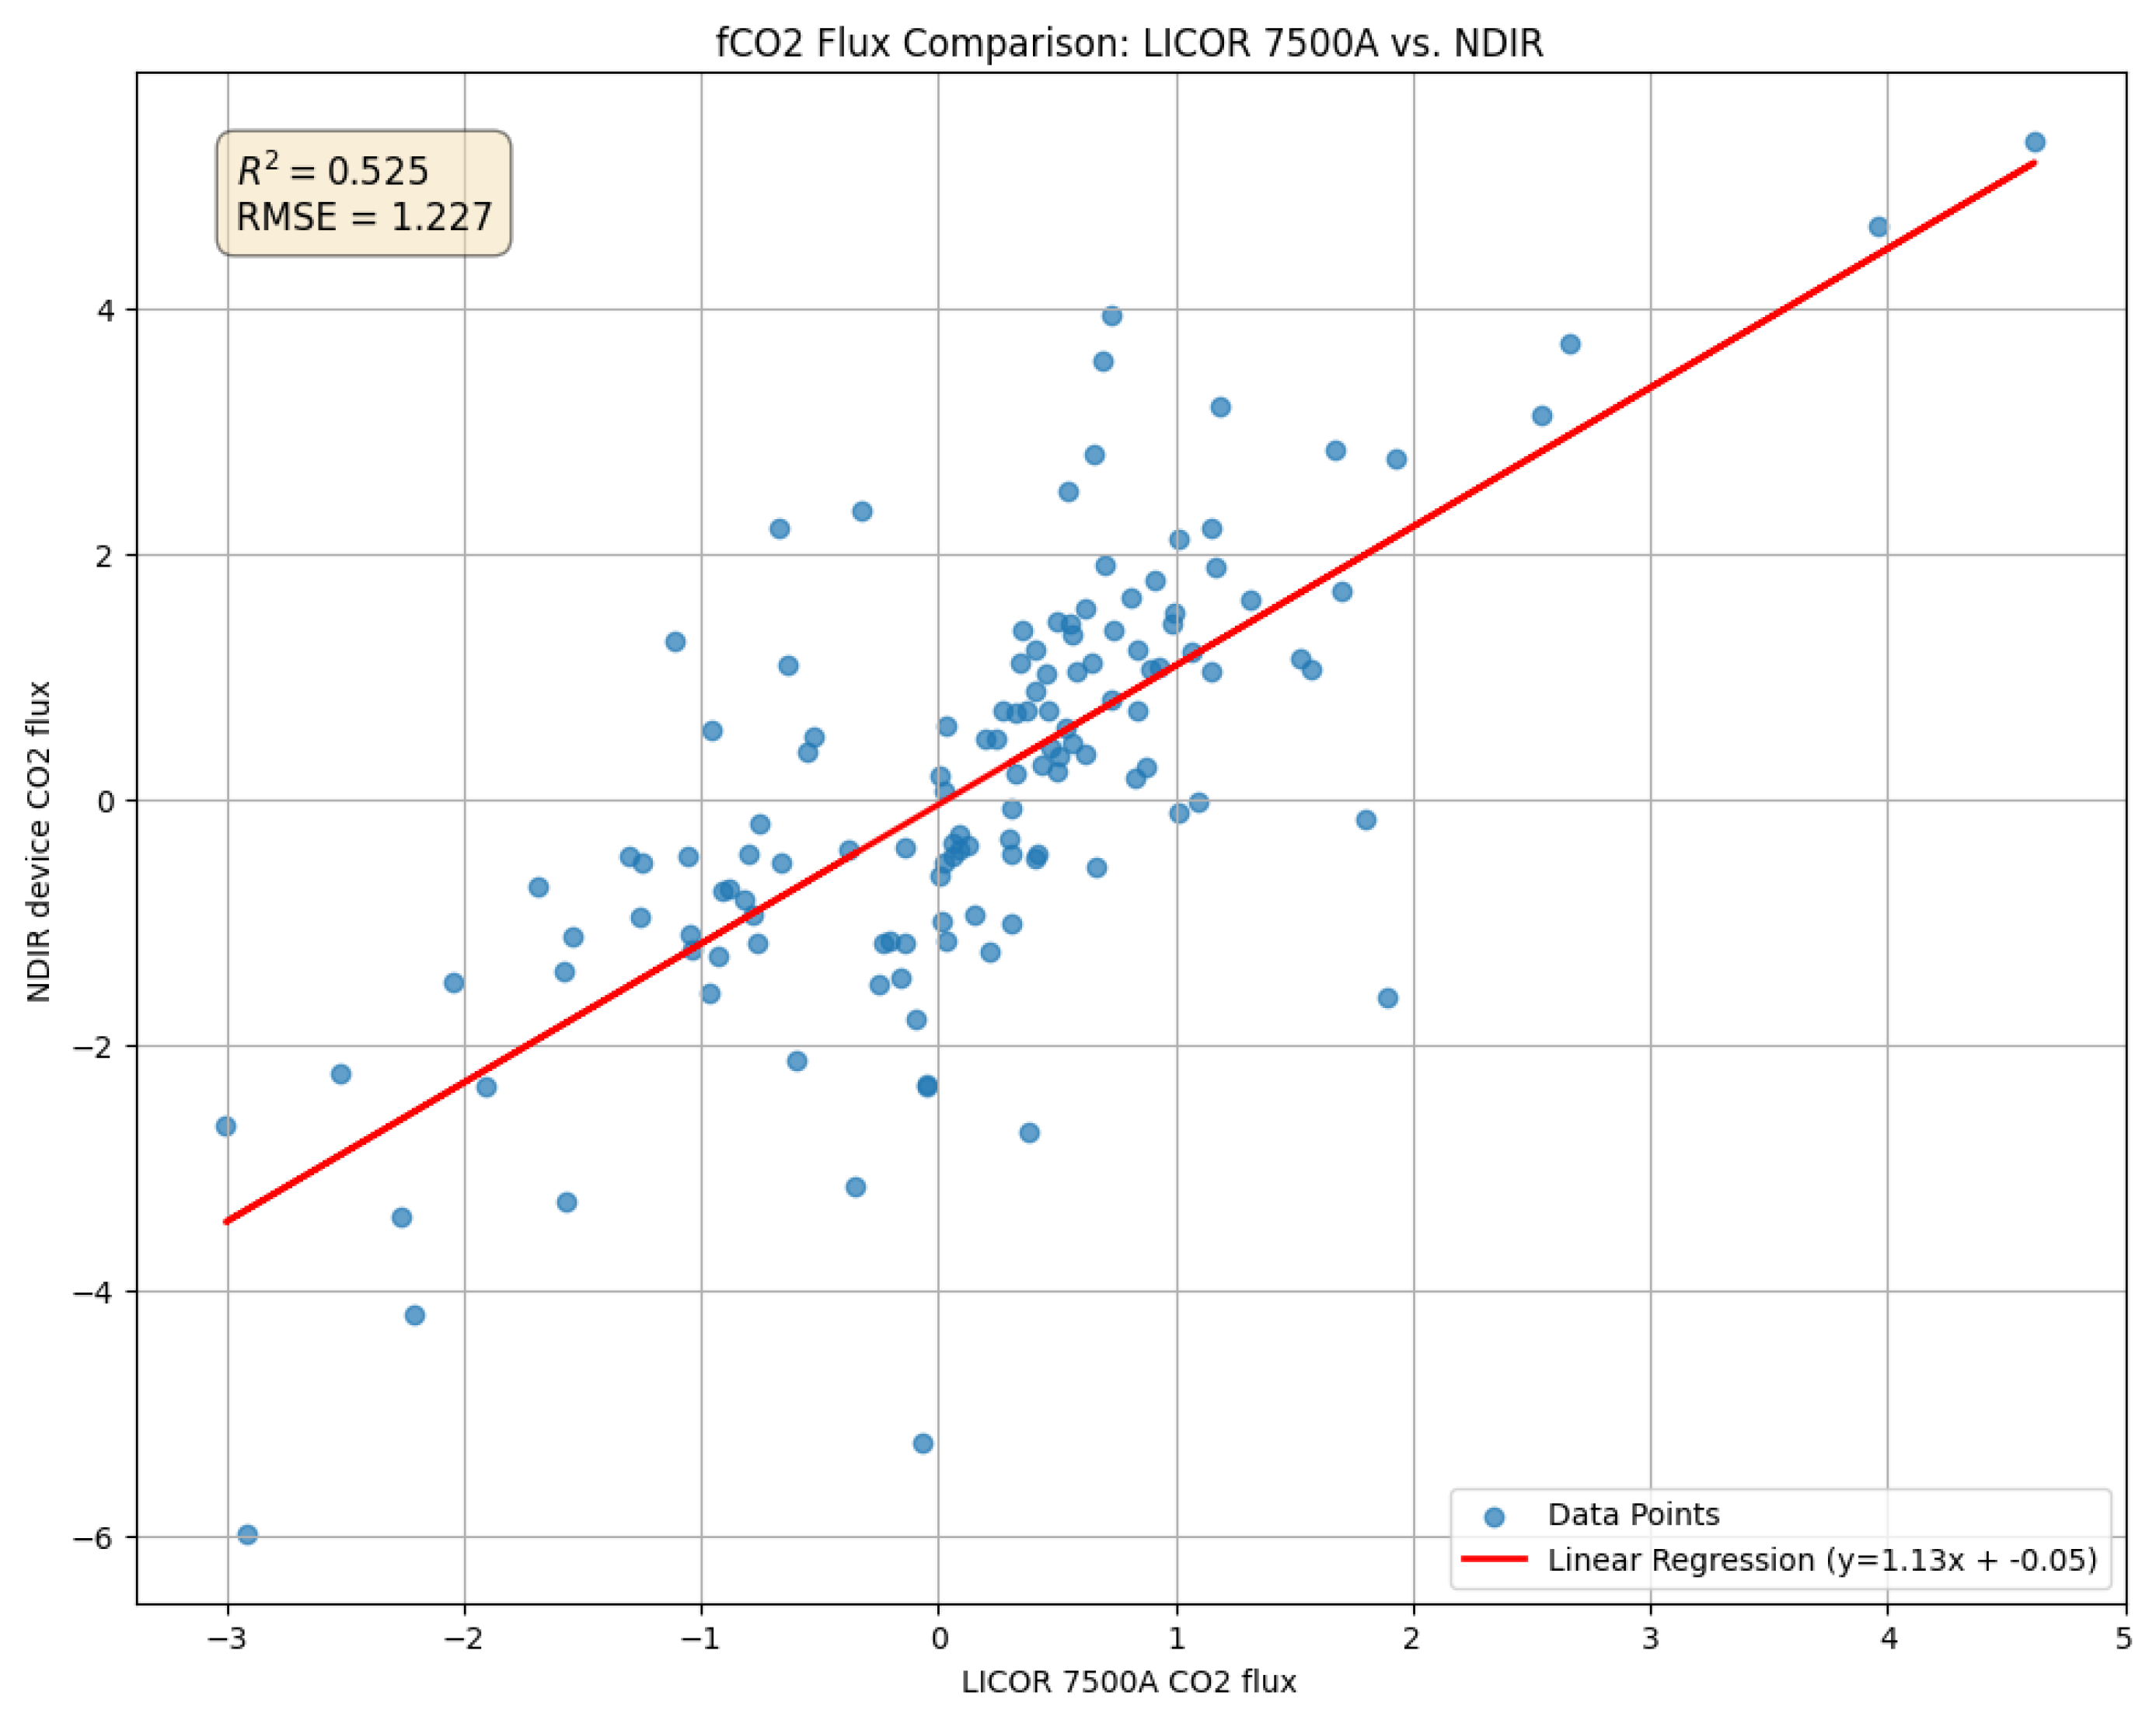
Figure 15.
Scatter plot of 5-minute fluxes comparing the developed NDIR device (y-axis) against the reference LI-COR LI-7500A (x-axis). This comparison yielded an of 0.618 and a linear regression of , indicating a significant systematic overestimation by the NDIR device.
Figure 15.
Scatter plot of 5-minute fluxes comparing the developed NDIR device (y-axis) against the reference LI-COR LI-7500A (x-axis). This comparison yielded an of 0.618 and a linear regression of , indicating a significant systematic overestimation by the NDIR device.
4. Discussion
The paper presents the results of the development and field validation of an open-path NDIR gas analyzer designed to measure water and carbon fluxes using the eddy covariance method.
The primary objective was to create a field prototype of the fast gas analyzer with increased reliability and lower cost by eliminating mechanical signal modulation components. As an innovative solution, the mechanical chopper was replaced with a solid-state pulse width modulation (PWM) circuit for the infrared emitter. This approach improves manufacturability by reducing the number of components, eliminates the risk of electric motor failure, and reduces cost, which is crucial when creating a prototype for mass production and long-term operation in remote and extreme conditions.
Field verification confirmed the operability of the proposed design. The key quality criterion for an eddy covariance analyzer is its ability to detect high-frequency fluctuations in turbulent flows, and in this respect, the developed device demonstrated satisfactory results. A comparison of the data showed comparability of fluxes (reflecting daily absorption by the ecosystem) and (evapotranspiration) for the new analyzer and the reference device LI 7500A (Figure 12 and Figure 13). It was established that a sampling frequency of 10 Hz in combination with the implemented signal processing algorithm is sufficient for eddy covariance measurements.
It is important to discuss the instrument’s performance specifications in context. Our laboratory calibration determined a sensitivity of 0.19 ppm. Although this value is nominally higher (i.e. less sensitive) than the 0.10 ppm specified for the LI-7500A, the field results clearly indicate that this level of precision is more than adequate to resolve eddy covariance. The tight tracking of fluxes, which are dependent on resolving small, rapid changes, is a more practical validation of the instrument’s performance than a static sensitivity metric alone. The accuracy of the data obtained was further confirmed by the successful application of the standard WPL correction, indicating their compatibility with generally accepted methods for processing the EC measurement results.
The authors are aware that the current version of the device and the verification procedure have a number of shortcomings. For example, the field experiment was conducted over a 12-hour period under favorable meteorological conditions. This work did not evaluate the long-term stability of the device, possible drifts in readings, or data loss under unfavorable weather conditions—in particular during rain, fog, and dew formation. All of this is planned to be carried out in the next version of the device with a housing designed for field testing. A separate comparative analysis of the energy consumption of the developed analyzer with systems using mechanical modulators is planned.
5. Conclusions
This work successfully detailed the development stages of an open-path fast NDIR gas analyzer featuring pulse-width modulation IR radiation generation scheme. The primary achievement is the creation of an instrument specifically designed to dynamically measure water vapor and carbon dioxide concentrations. Crucially, the gas analyzer was developed with the explicit purpose of integration into ecological and climatic stations to enable the application of the eddy covariance method for and fluxes measurements. The systematic process of selecting critical components for the NDIR system was completed, and the essential steps of calibrating the instrument were undertaken. Sensitivity of developed gas analyzer for is 0.19 ppm. Finally, the successful execution of field experiments, conducted as part of an ecological and climatic station deployment, demonstrates the practical implementation and competitiveness of the developed gas analyzer for its intended environmental monitoring role.
This work serves as a successful proof-of-concept. The clear next steps are to advance from this prototype to a field ready version for long-term deployment. Future work will focus on quantifying long-term stability, data retention during adverse weather, and conducting a detailed power consumption analysis. This positions the instrument as a promising, reliable, and cost-effective alternative for future ecosystem-scale flux monitoring.
Author Contributions
I.F. and A.Y.: conceptualization, writing, editing; I.K. and V.B. software and hardware development, experiments; A.K.: data processing, original draft; I.S. experiments; A.M. hardware conceptualization, project management. All authors have read and agreed to the published version of the manuscript.
Funding
The project was carried out within «Priority-2030» program of The Ministry of Science and Higher Education of the Russian Federation.
Data Availability Statement
The data presented in this study are available on request from the corresponding author. The data are not publicly available because of privacy restrictions.
Conflicts of Interest
The authors declare no conflicts of interest.
References
- IPCC (Intergovernmental Panel on Climate Change). Climate Change 2021: The Physical Science Basis. Contribution of Working Group I to the Sixth Assessment Report of the Intergovernmental Panel on Climate Change[Masson-Delmotte, V., P. Zhai, A. Pirani, S. L. Connors, C. Péan, S. Berger, N. Caud, Y. Chen, L. Goldfarb, M. I. Gomis, M. Huang, K. Leitzell, E. Lonnoy, J. B. R. Matthews, T. K. Maycock, T. Waterfield, O. Yelekçi, R. Yu and B. Zhou (eds.)]. Cambridge University Press. 2021.
- Aubinet, M. , Vesala T., Papale D. (Eds.). Eddy Covariance: A Practical Guide to Measurement and Data Analysis. Springer Netherlands. 2012. [Google Scholar] [CrossRef]
- Baldocchi D., D. Assessing the eddy covariance technique for evaluating carbon dioxide exchange rates of ecosystems: past, present and future. Global Change Biology. 2003; V.9, №4, 479–492. [Google Scholar] [CrossRef]
- Webb E., K. , Pearman G. I., Leuning R. Correction of flux measurements for density effects due to heat and water vapour transfer. Quarterly Journal of the Royal Meteorological Society. 1980, V.106, 85–100. [Google Scholar] [CrossRef]
- Burba G., G. , McDermitt D. K., Grelle A., Anderson D. J., Xu L. Addressing the self-heating correction for open-path CO2/H2O sensors in cold conditions. Global Change Biology. 2008; V.14, №8, 1854–1876. [Google Scholar] [CrossRef]
- Helbig, M. , Wischnewski K., Kljun N., Chasmer L. E., Quinton W. L., Detto M., Sonnentag O. Addressing a systematic bias in open-path CO2 flux measurements with the EC150 and the IRGASON. Agricultural and Forest Meteorology. 2016; V.228–229, 349–359. [Google Scholar] [CrossRef]
- Wang, J. , Lee X., Wang Y., Ma Y., Li M., Wang X., Zhang L., Liu S. Performance evaluation of an integrated open-path eddy covariance system in a cold desert environment. Journal of Atmospheric and Oceanic Technology. 2017; V.34, №11, 2385–2400. [Google Scholar] [CrossRef]
- Burba G., G. , Anderson D. J., McDermitt D. K. Novel design of an enclosed CO2/H2O gas analyser for eddy covariance flux measurements. Tellus B: Chemical and Physical Meteorology. 2010; V.62, №5, 743–749. [Google Scholar] [CrossRef]
- Detto, M. , Peltola O., Katul G. G. A new generation of open-path gas analyzers for eddy-covariance measurements of CH4, N2O, and CO2. Atmospheric Measurement Techniques. 2021; V.14, №9, 6051–6065. [Google Scholar]
- Zondlo M., A. , Miller D. J., Tao L., Webber M., Williams B. J., Fisher J. B., …Wood J. D. A new open-path eddy covariance method for nitrous oxide and other trace gases that minimizes temperature corrections. Global Change Biology. 2022; V.28, №4, 1446–1457. [Google Scholar] [CrossRef]
- Wilczak J., M. , Oncley S. P., Stage S. A. Sonic anemometer tilt correction algorithms. Boundary-Layer Meteorology. 2001; V.99, №1, 127–150. [Google Scholar]
- Webb, E. K. , Pearman, G. I., Leuning, R. Correction of flux measurements for density effects due to heat and water vapour transfer. Quarterly Journal of the Royal Meteorological Society. 1980; V.106, №447, 85–100. [Google Scholar]
- Foken, T. , Wichura B. Tools for quality assessment of surface-based flux measurements. Agricultural and Forest Meteorology. 1996; V.78, №1-2, 83–105. [Google Scholar]
- Nakai, T. , Shimoyama K. Ultrasonic anemometer angle of attack errors under turbulent conditions. Agricultural and Forest Meteorology. 2012; V.162-163, 14–26. [Google Scholar]
Figure 1.
Emission spectrum of the Micro-Hybrid JSIR 350-4 infrared emitter normalized to nominal power and Planck’s Law. The specific spectral bands used for the NDIR analysis— reference channel, the carbon dioxide () channel, and the water vapor () channel — are graphically represented by the blue, green, and orange blocks, respectively.
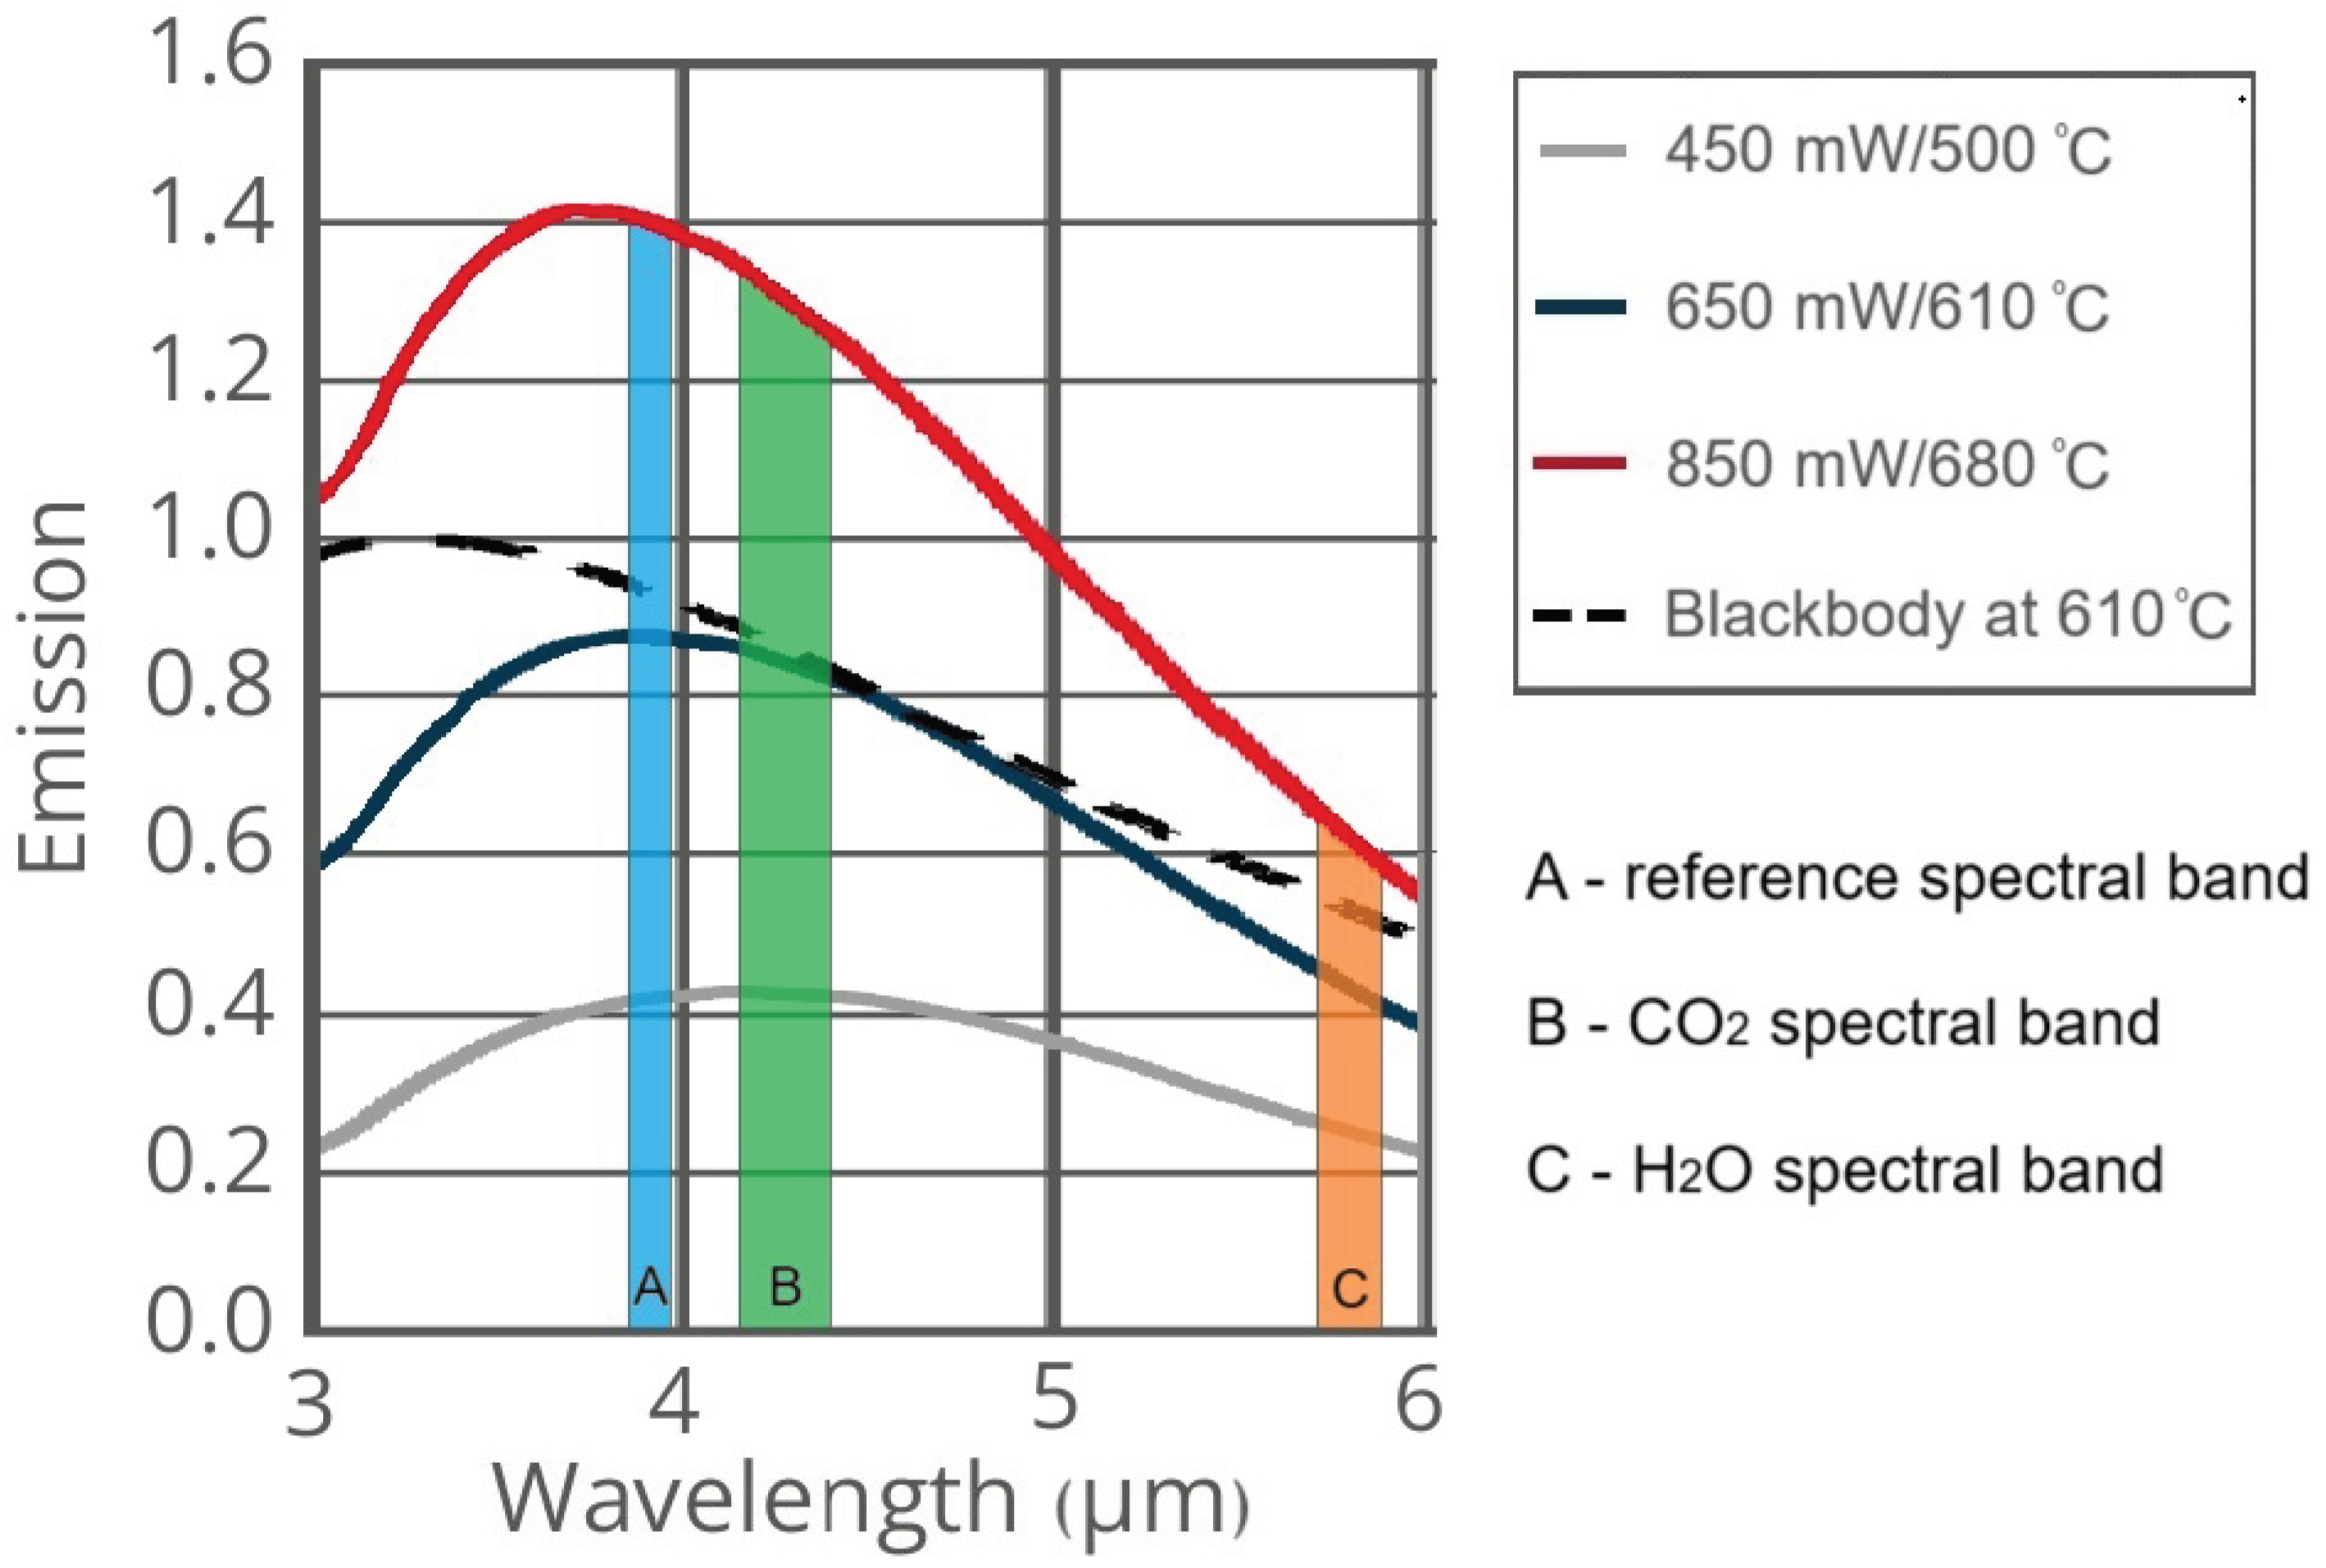
Figure 2.
Developed NDIR gas analyzer
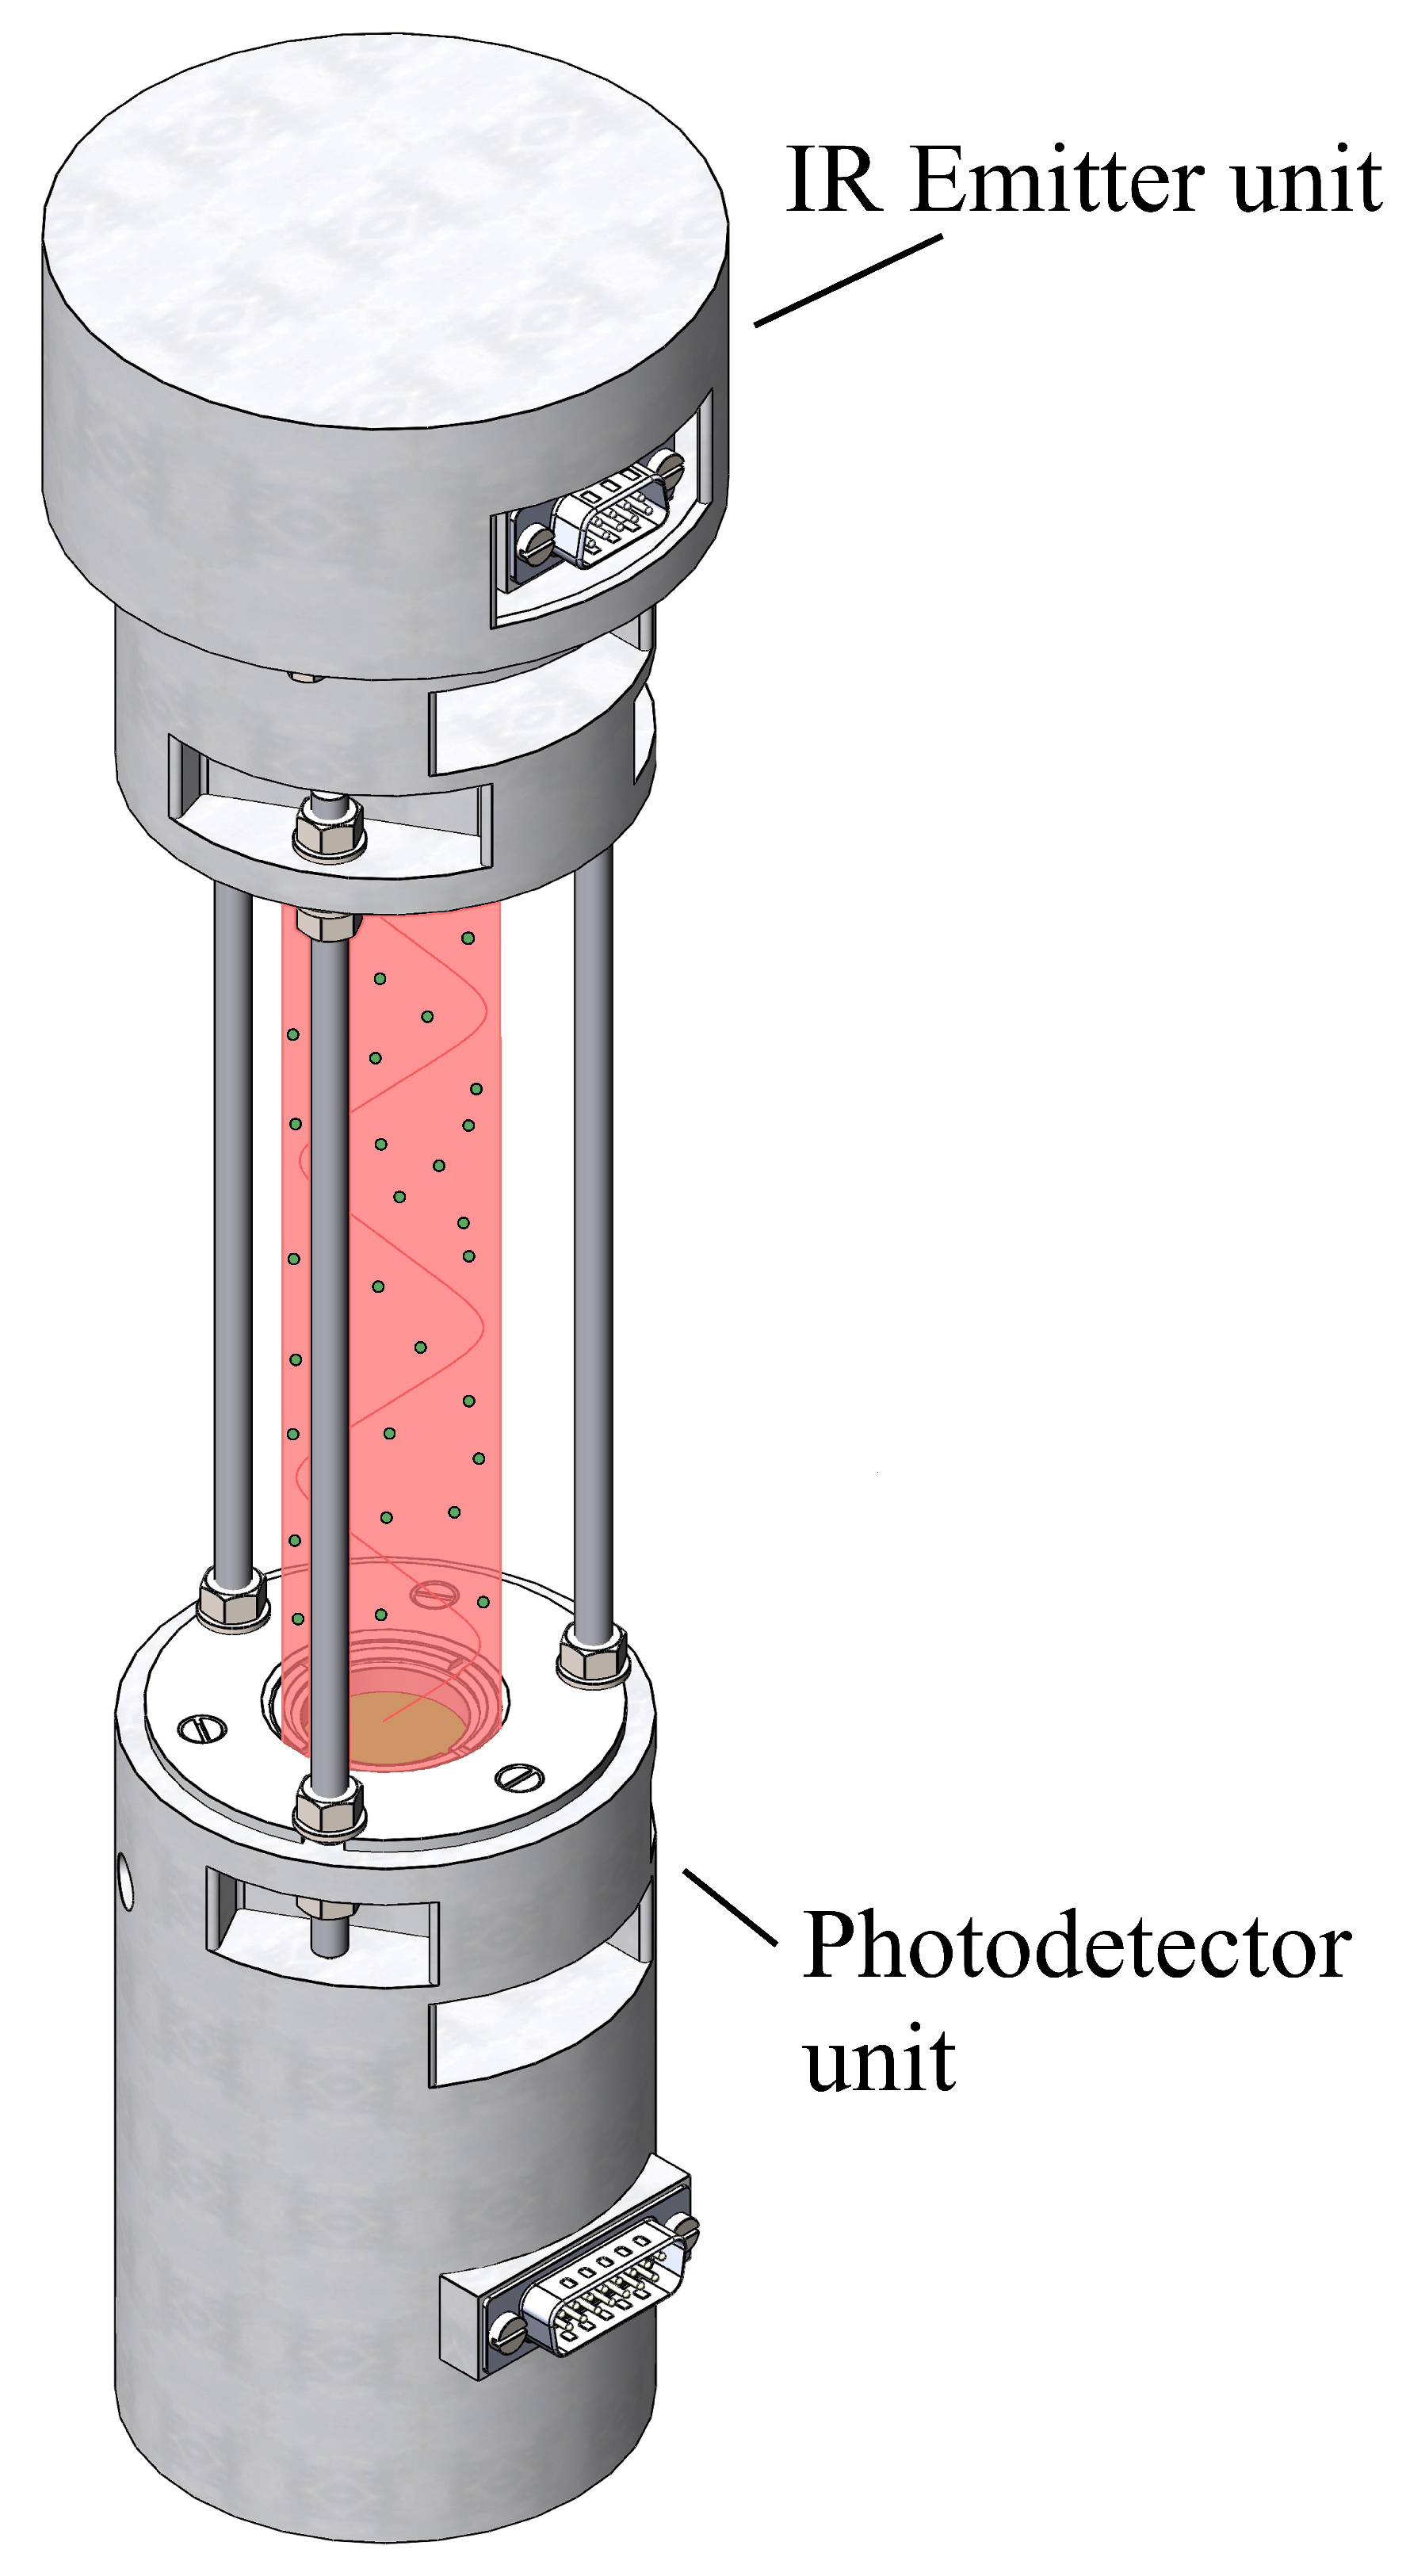
Figure 3.
Calibration of developed NDIR gas analyzer; . 1 – a gas cylinder with a 600 ppm calibration gas mixture; 2 – developed NDIR gas analyzer with a calibration tube; 3 – LI-7500A with a calibration tube.
Figure 3.
Calibration of developed NDIR gas analyzer; . 1 – a gas cylinder with a 600 ppm calibration gas mixture; 2 – developed NDIR gas analyzer with a calibration tube; 3 – LI-7500A with a calibration tube.
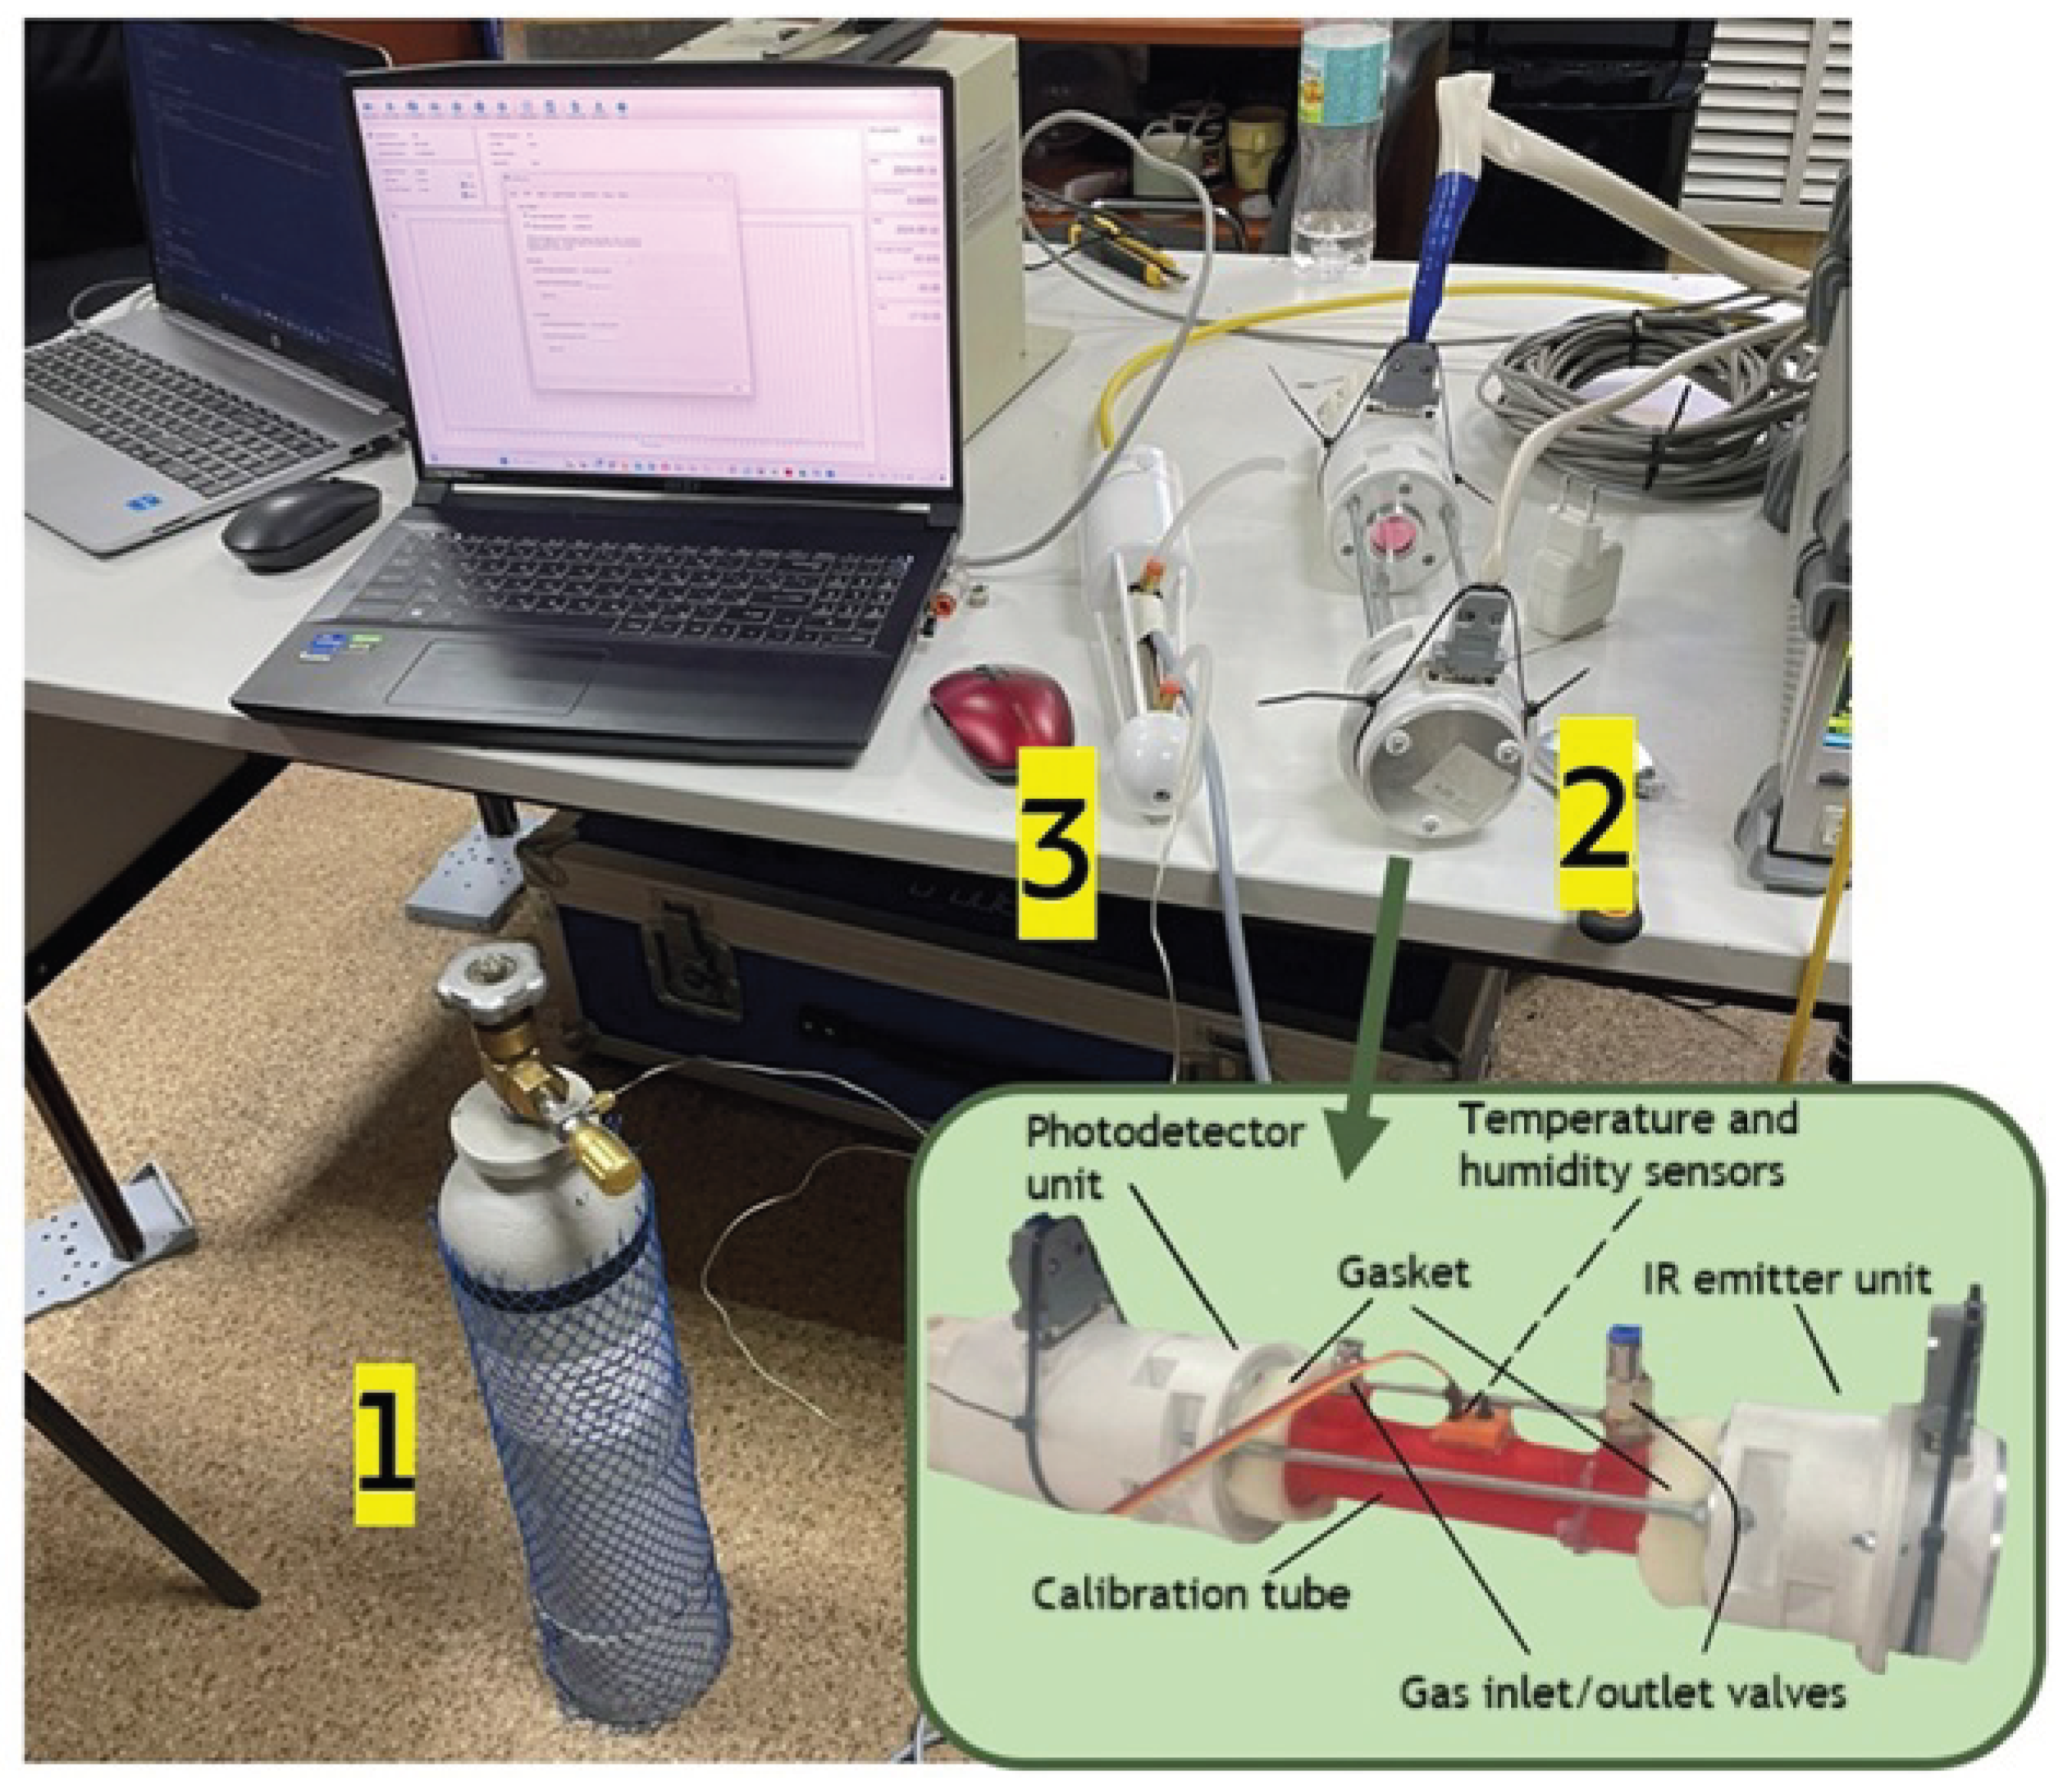
Figure 4.
The primary type of signal.
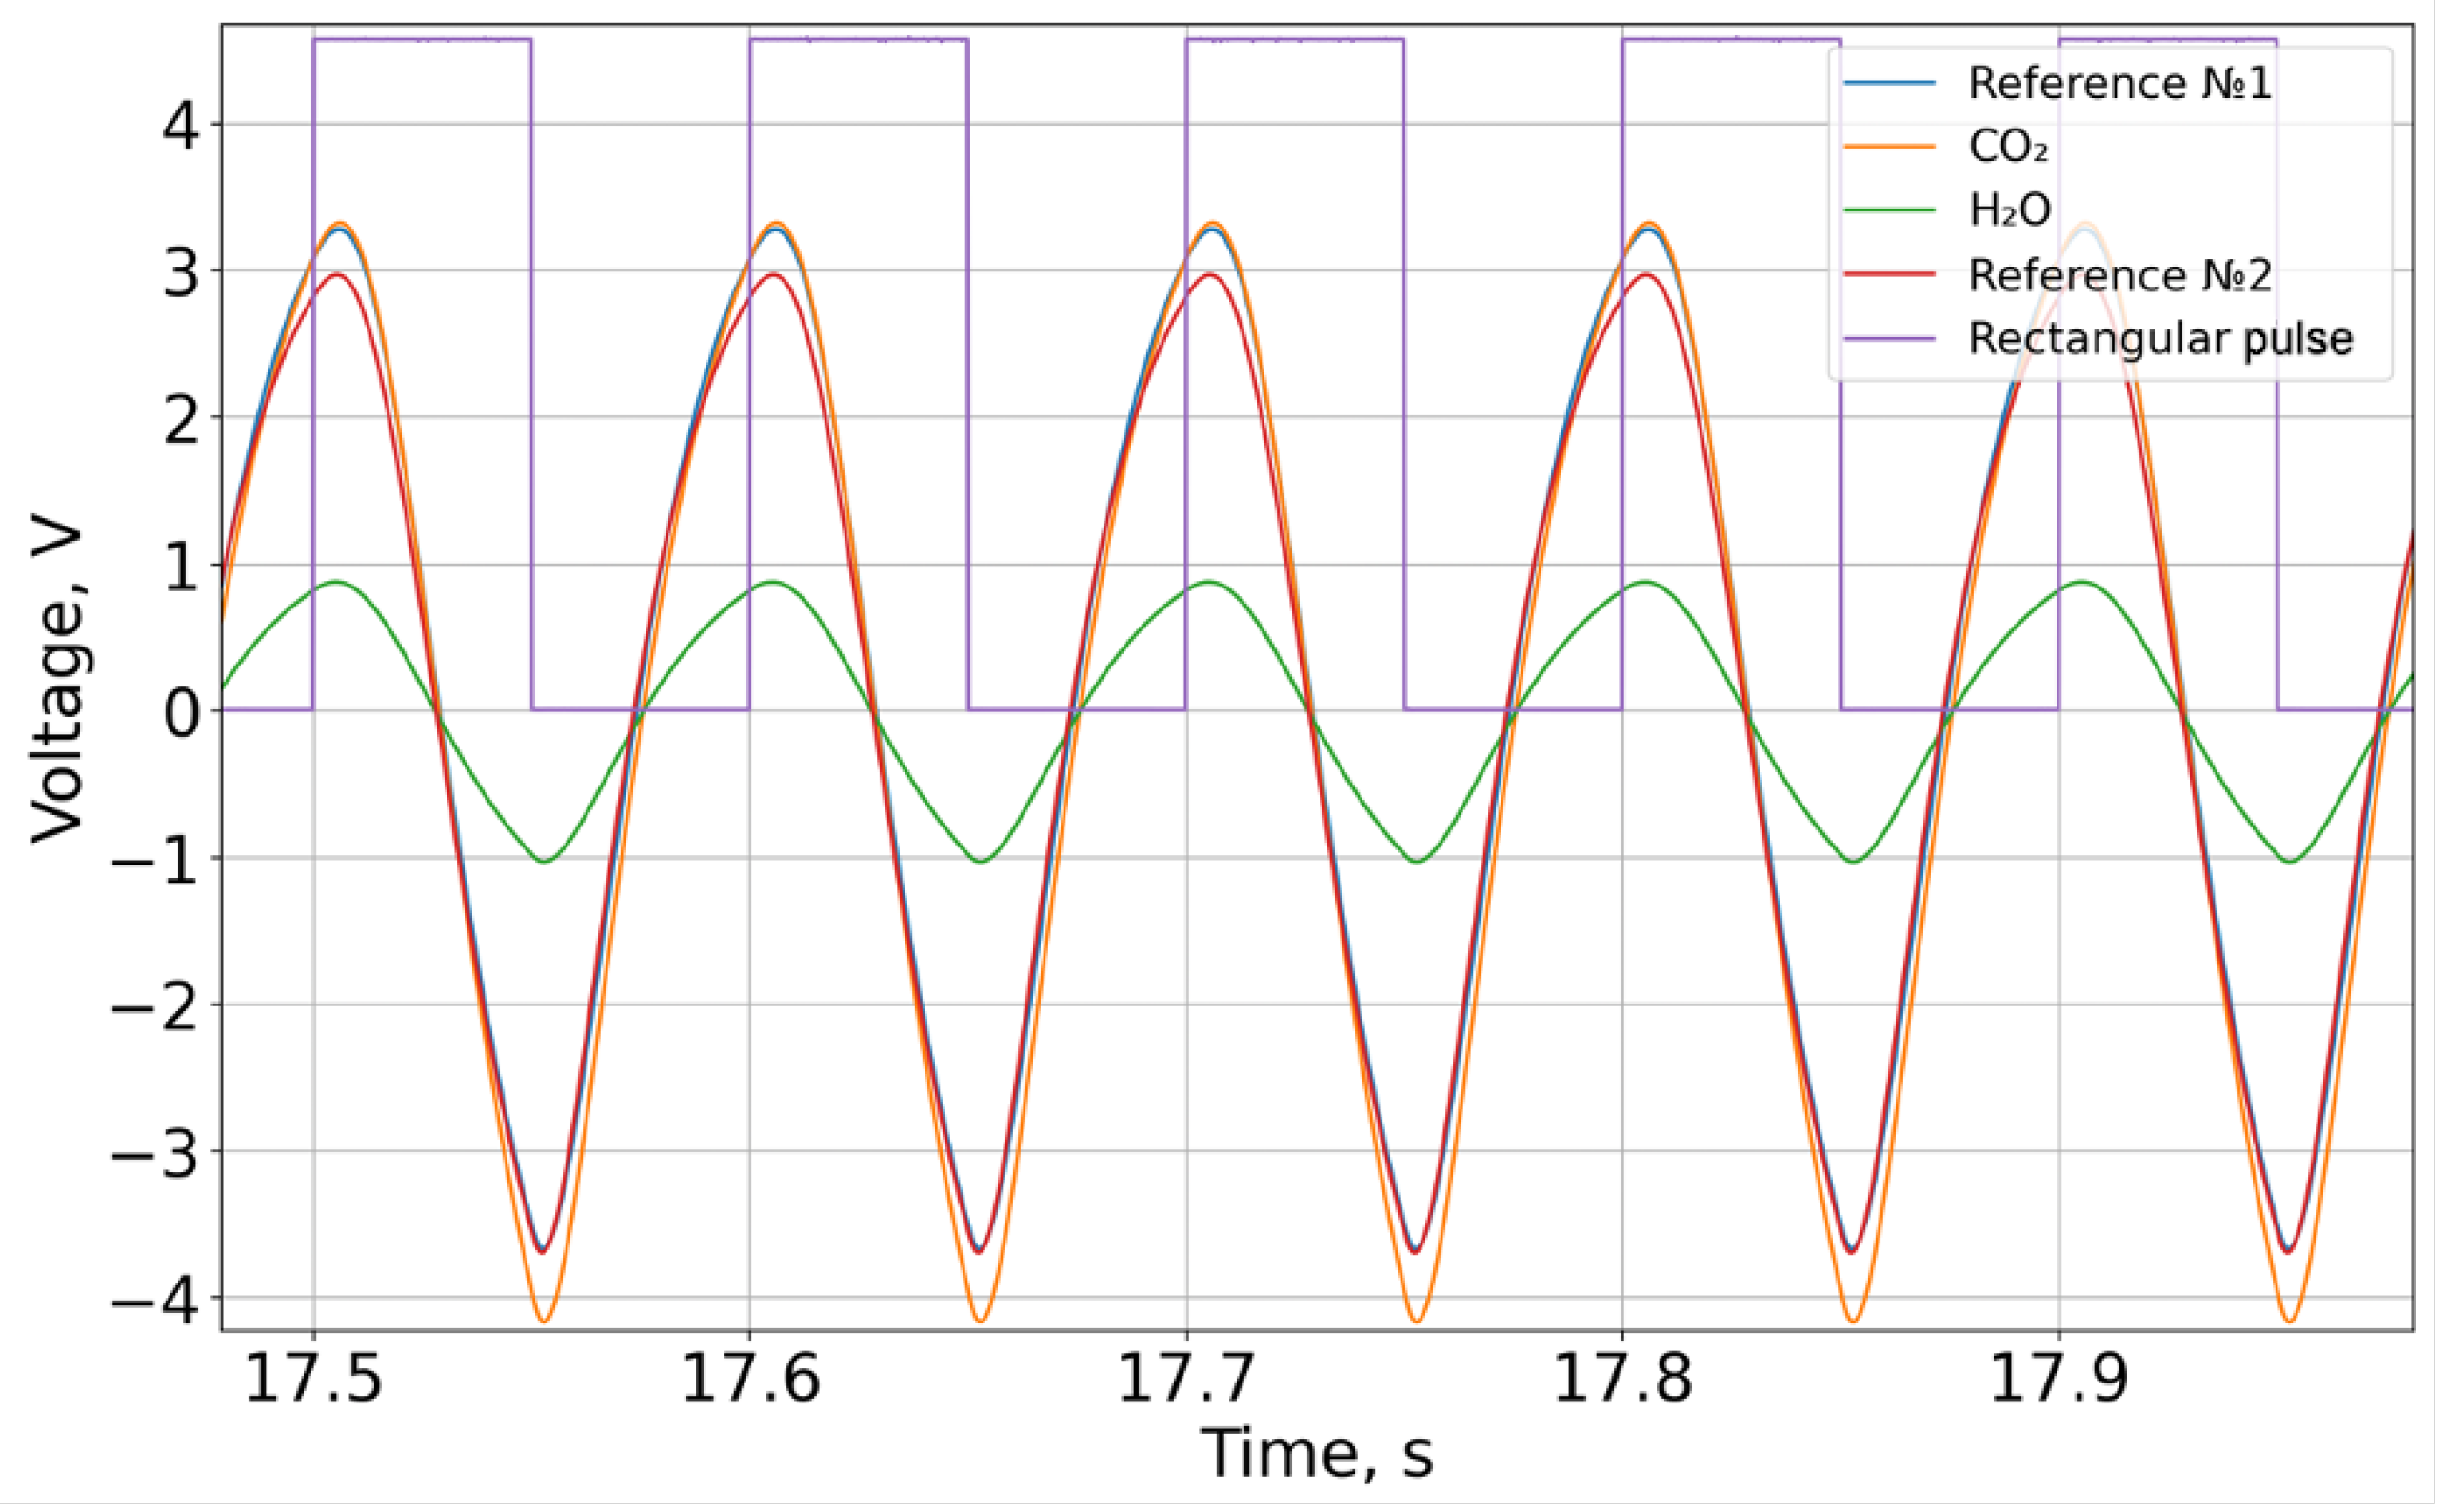
Figure 5.
The absolute value of the voltage minus the average value for the period.
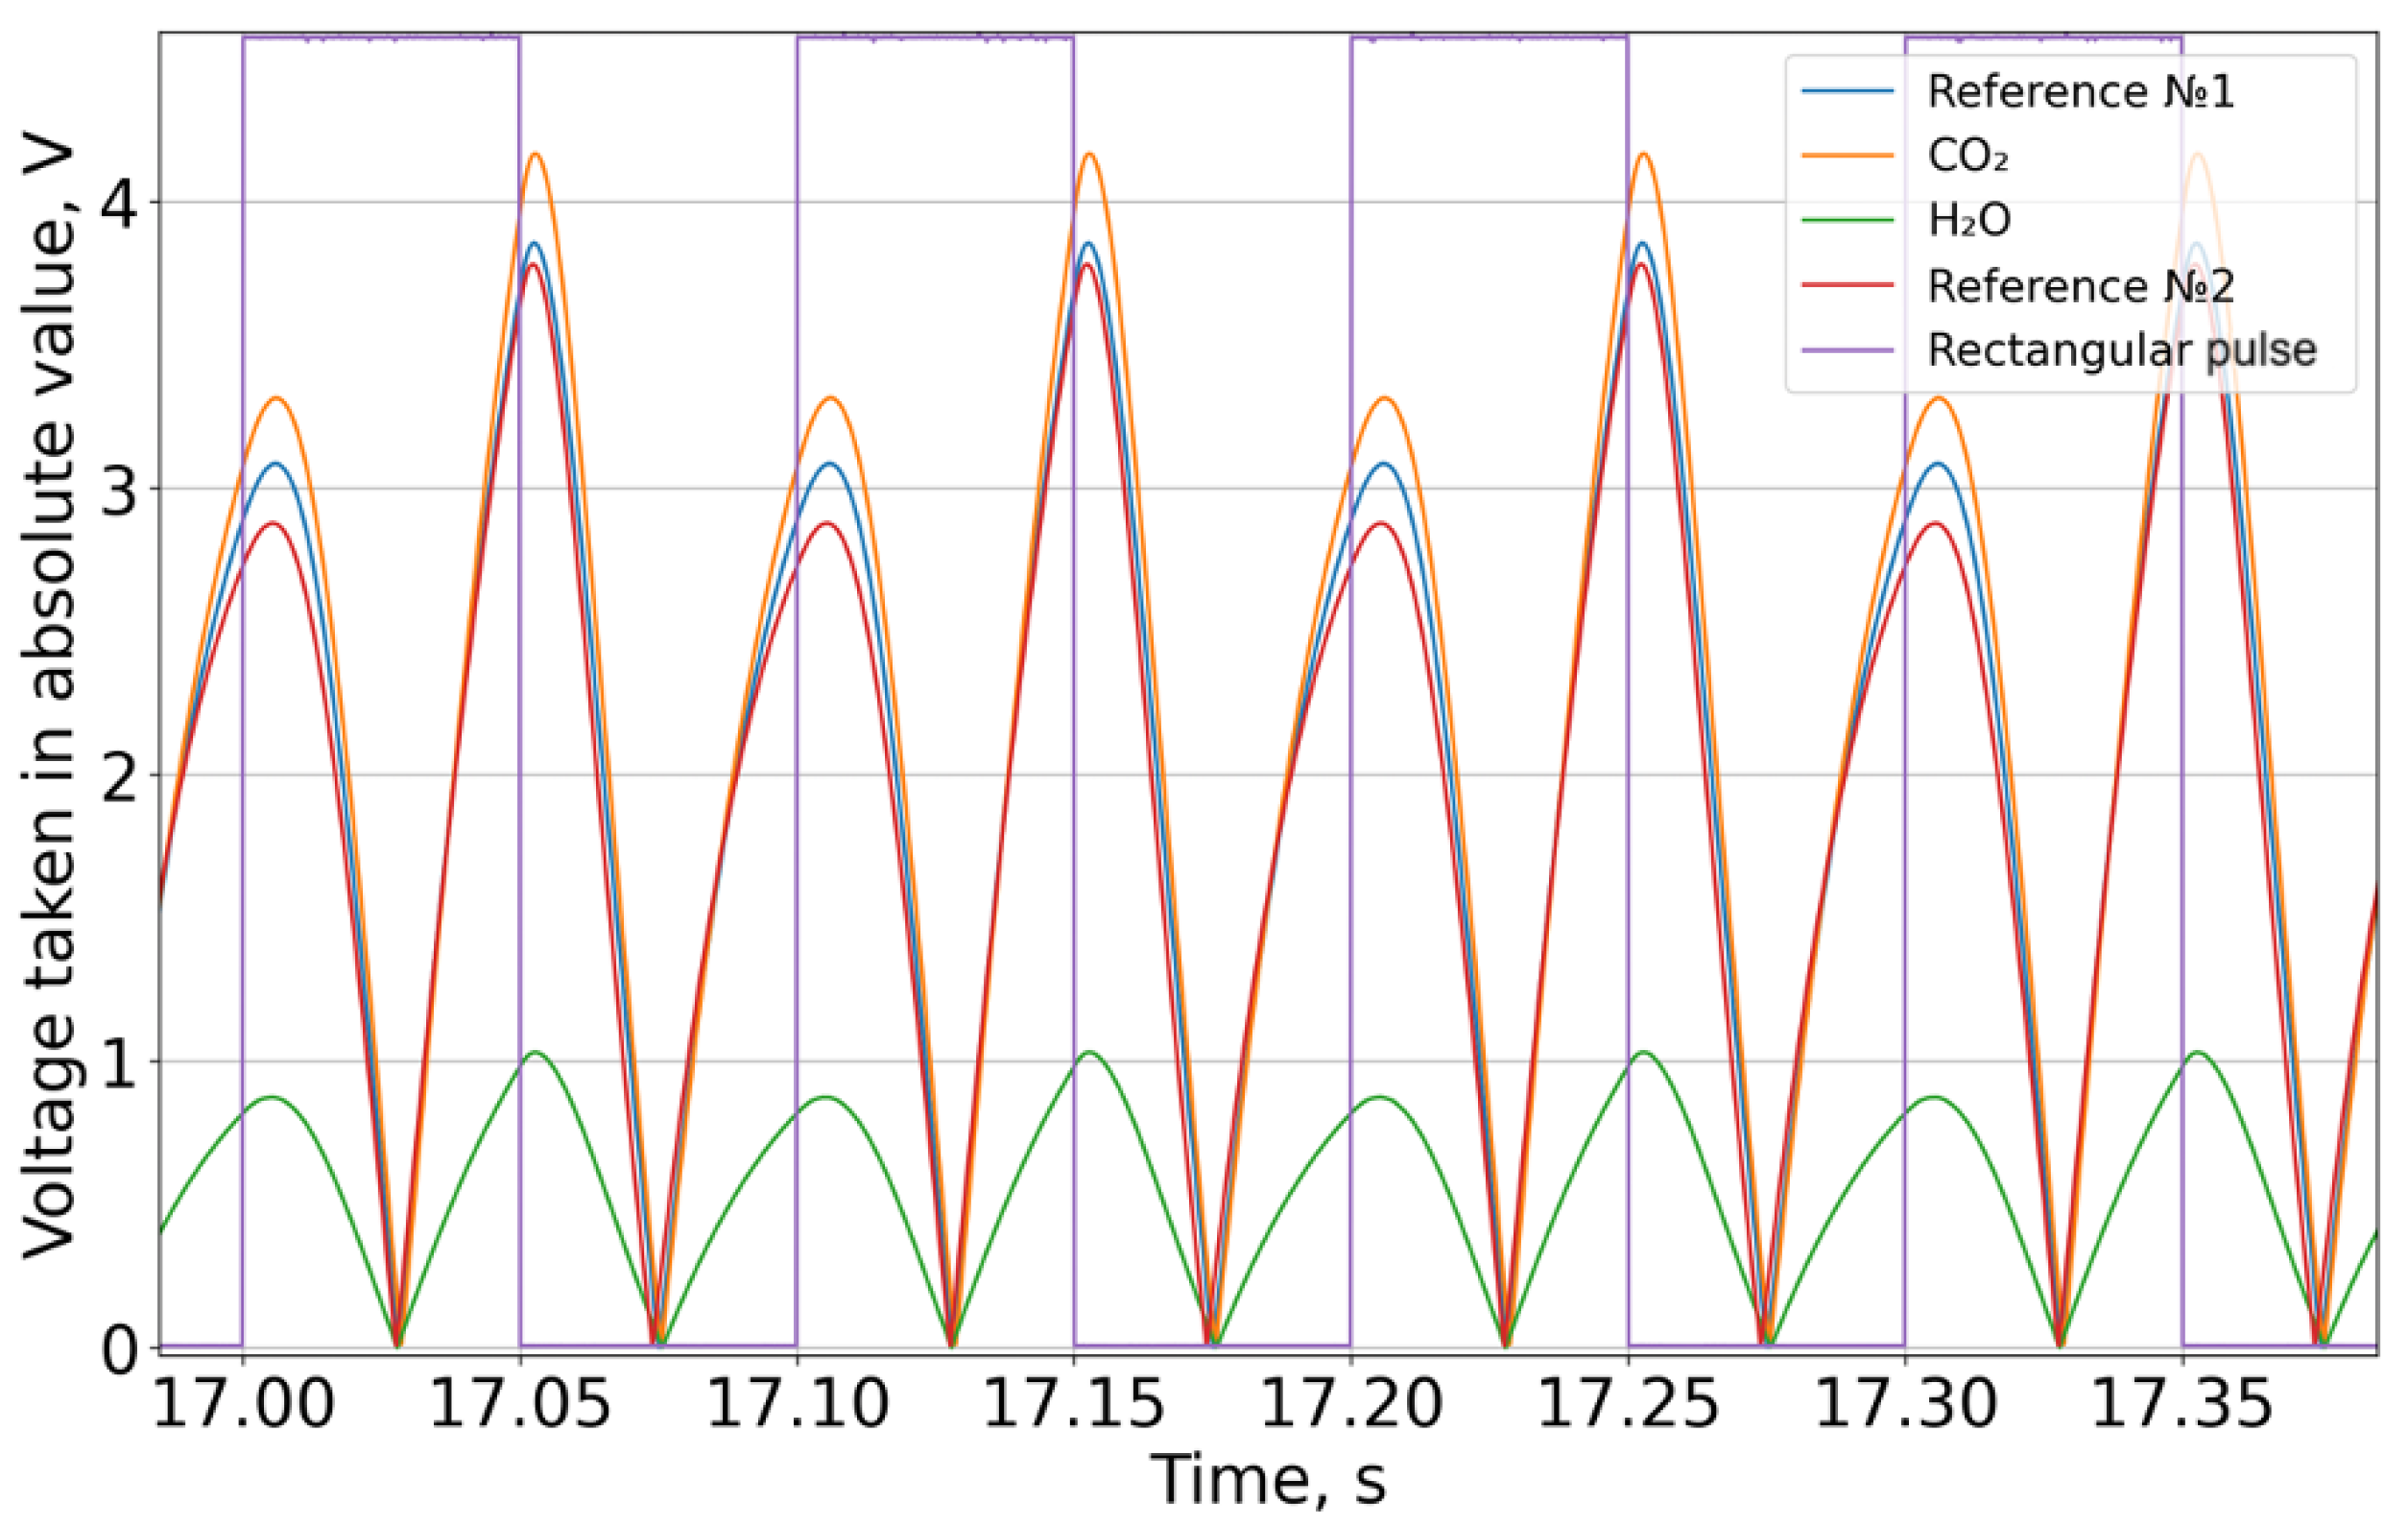
Figure 6.
The integral of the absolute voltage value for each period of the rectangular pulse.
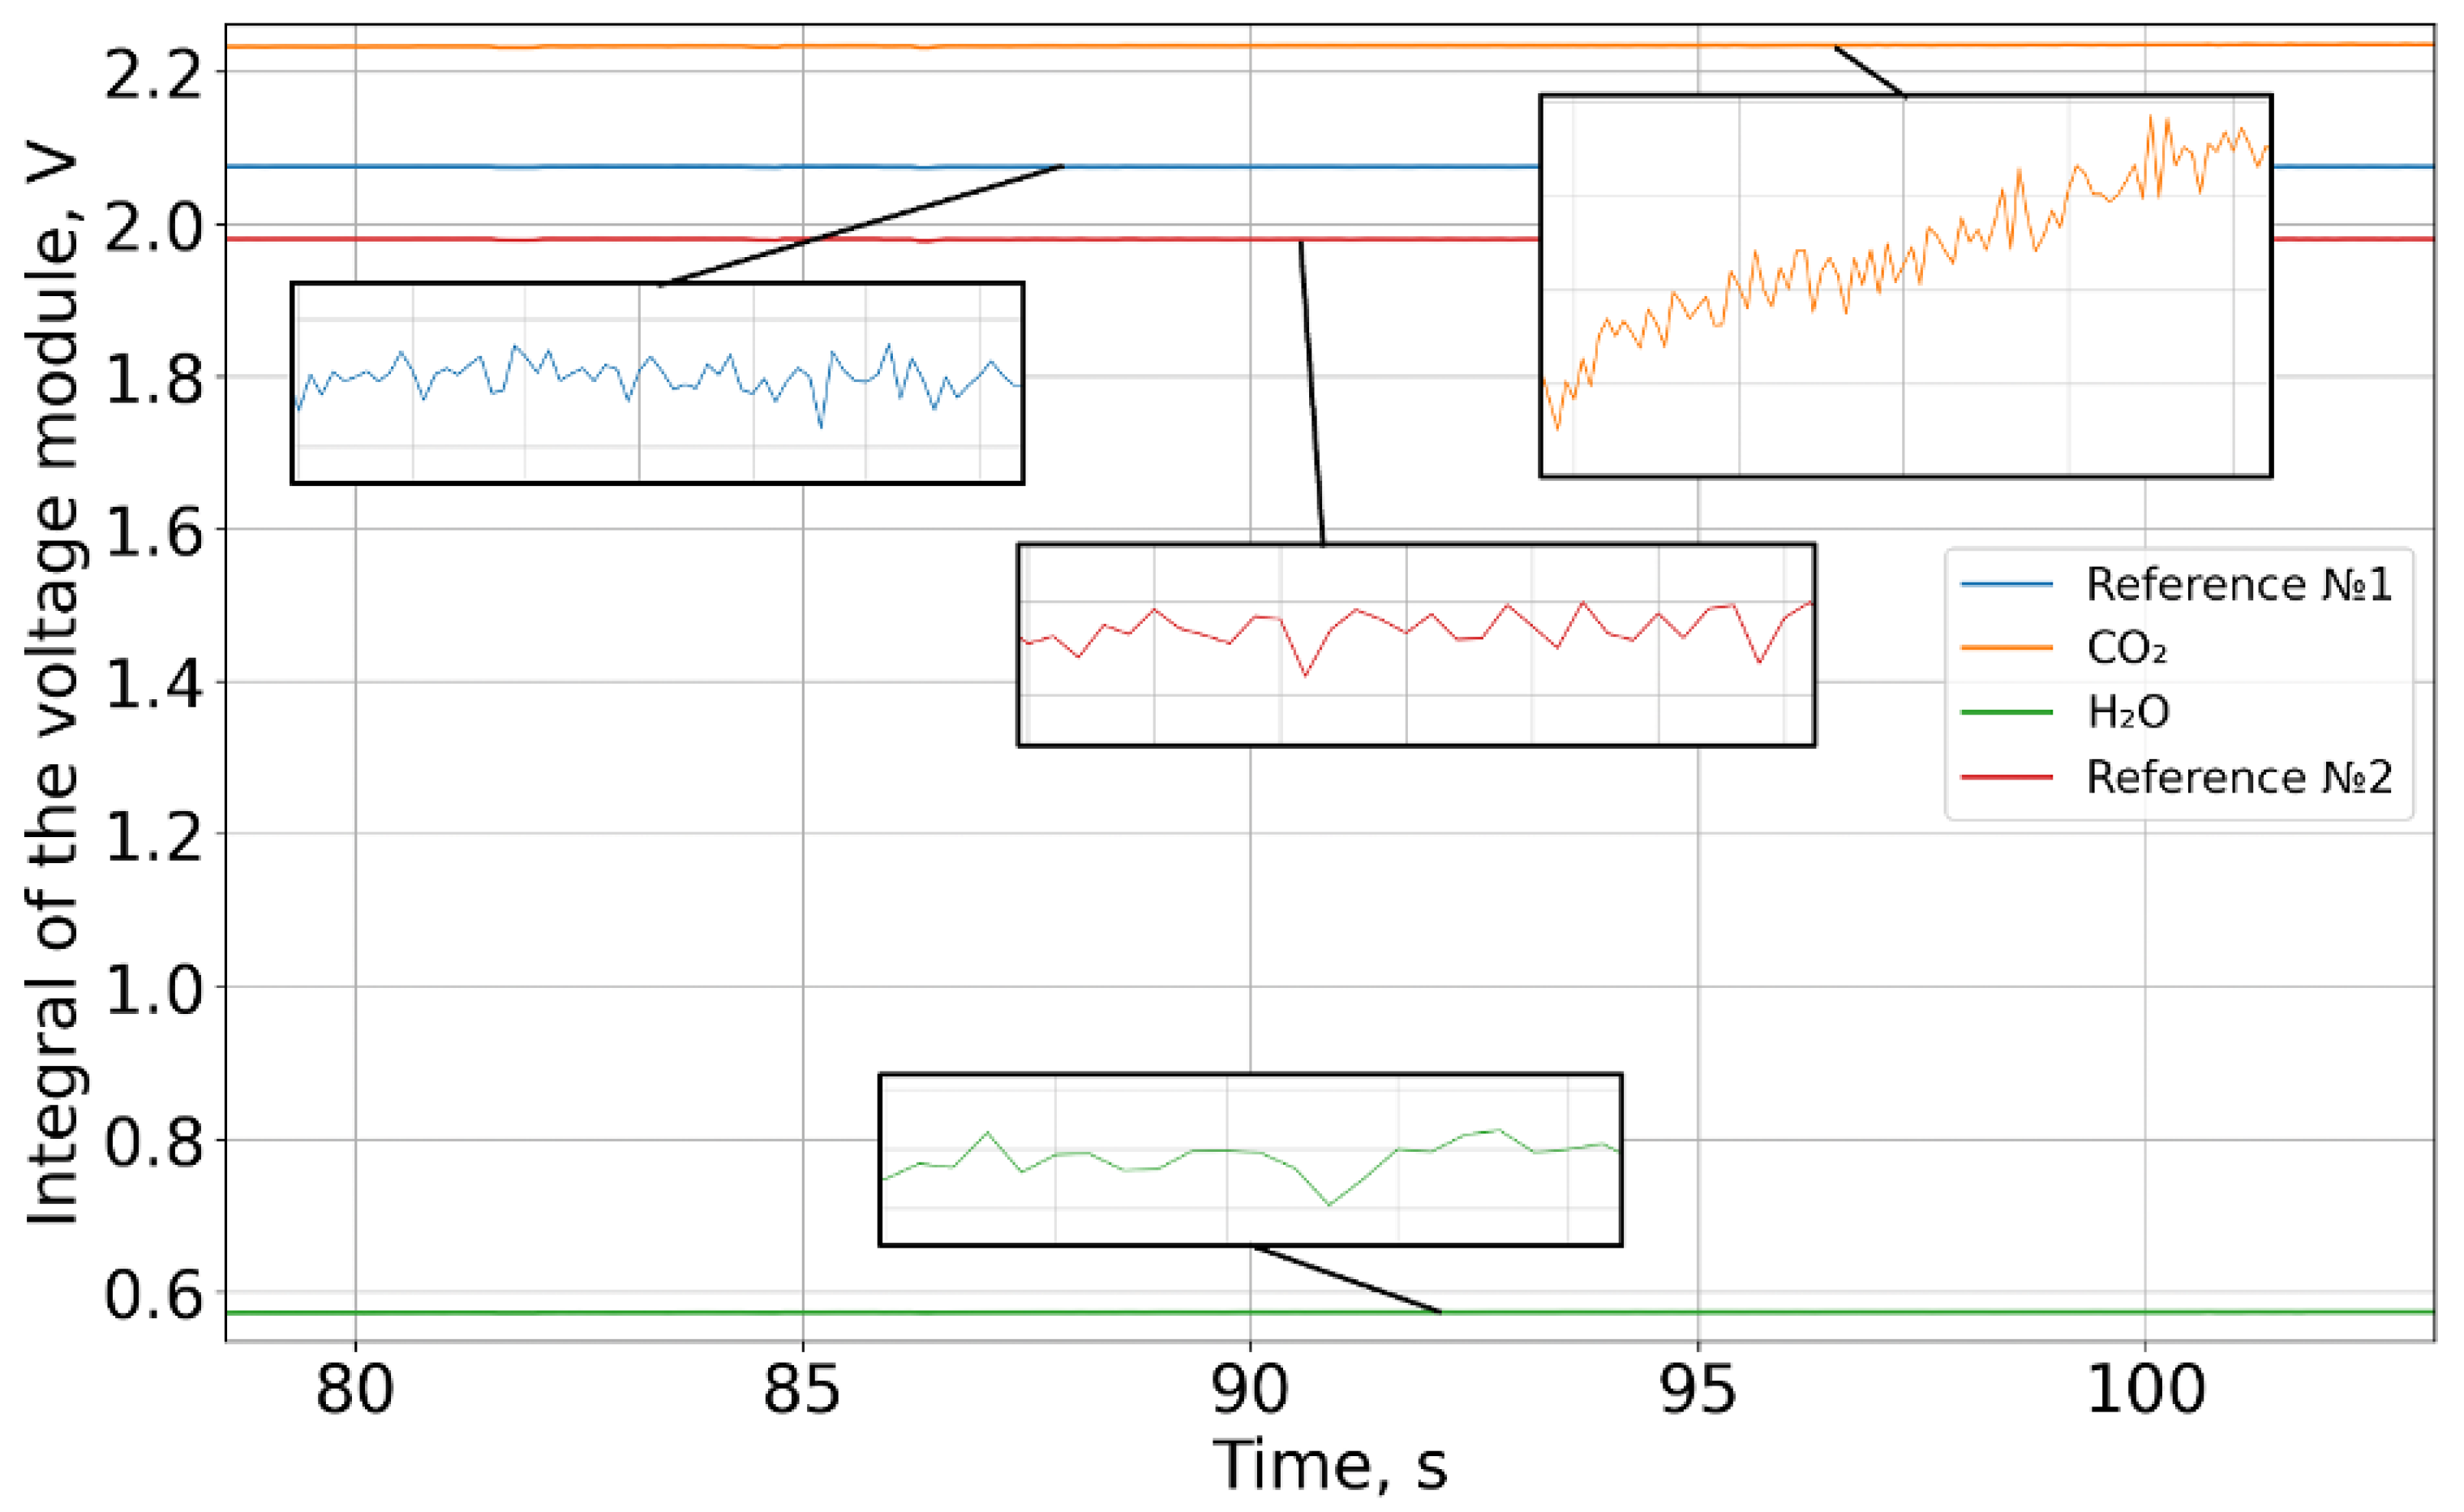
Figure 7.
mole fraction dynamics measured by LI-COR LI-7500A (red line) and NDIR (blue line) devices.
Figure 7.
mole fraction dynamics measured by LI-COR LI-7500A (red line) and NDIR (blue line) devices.
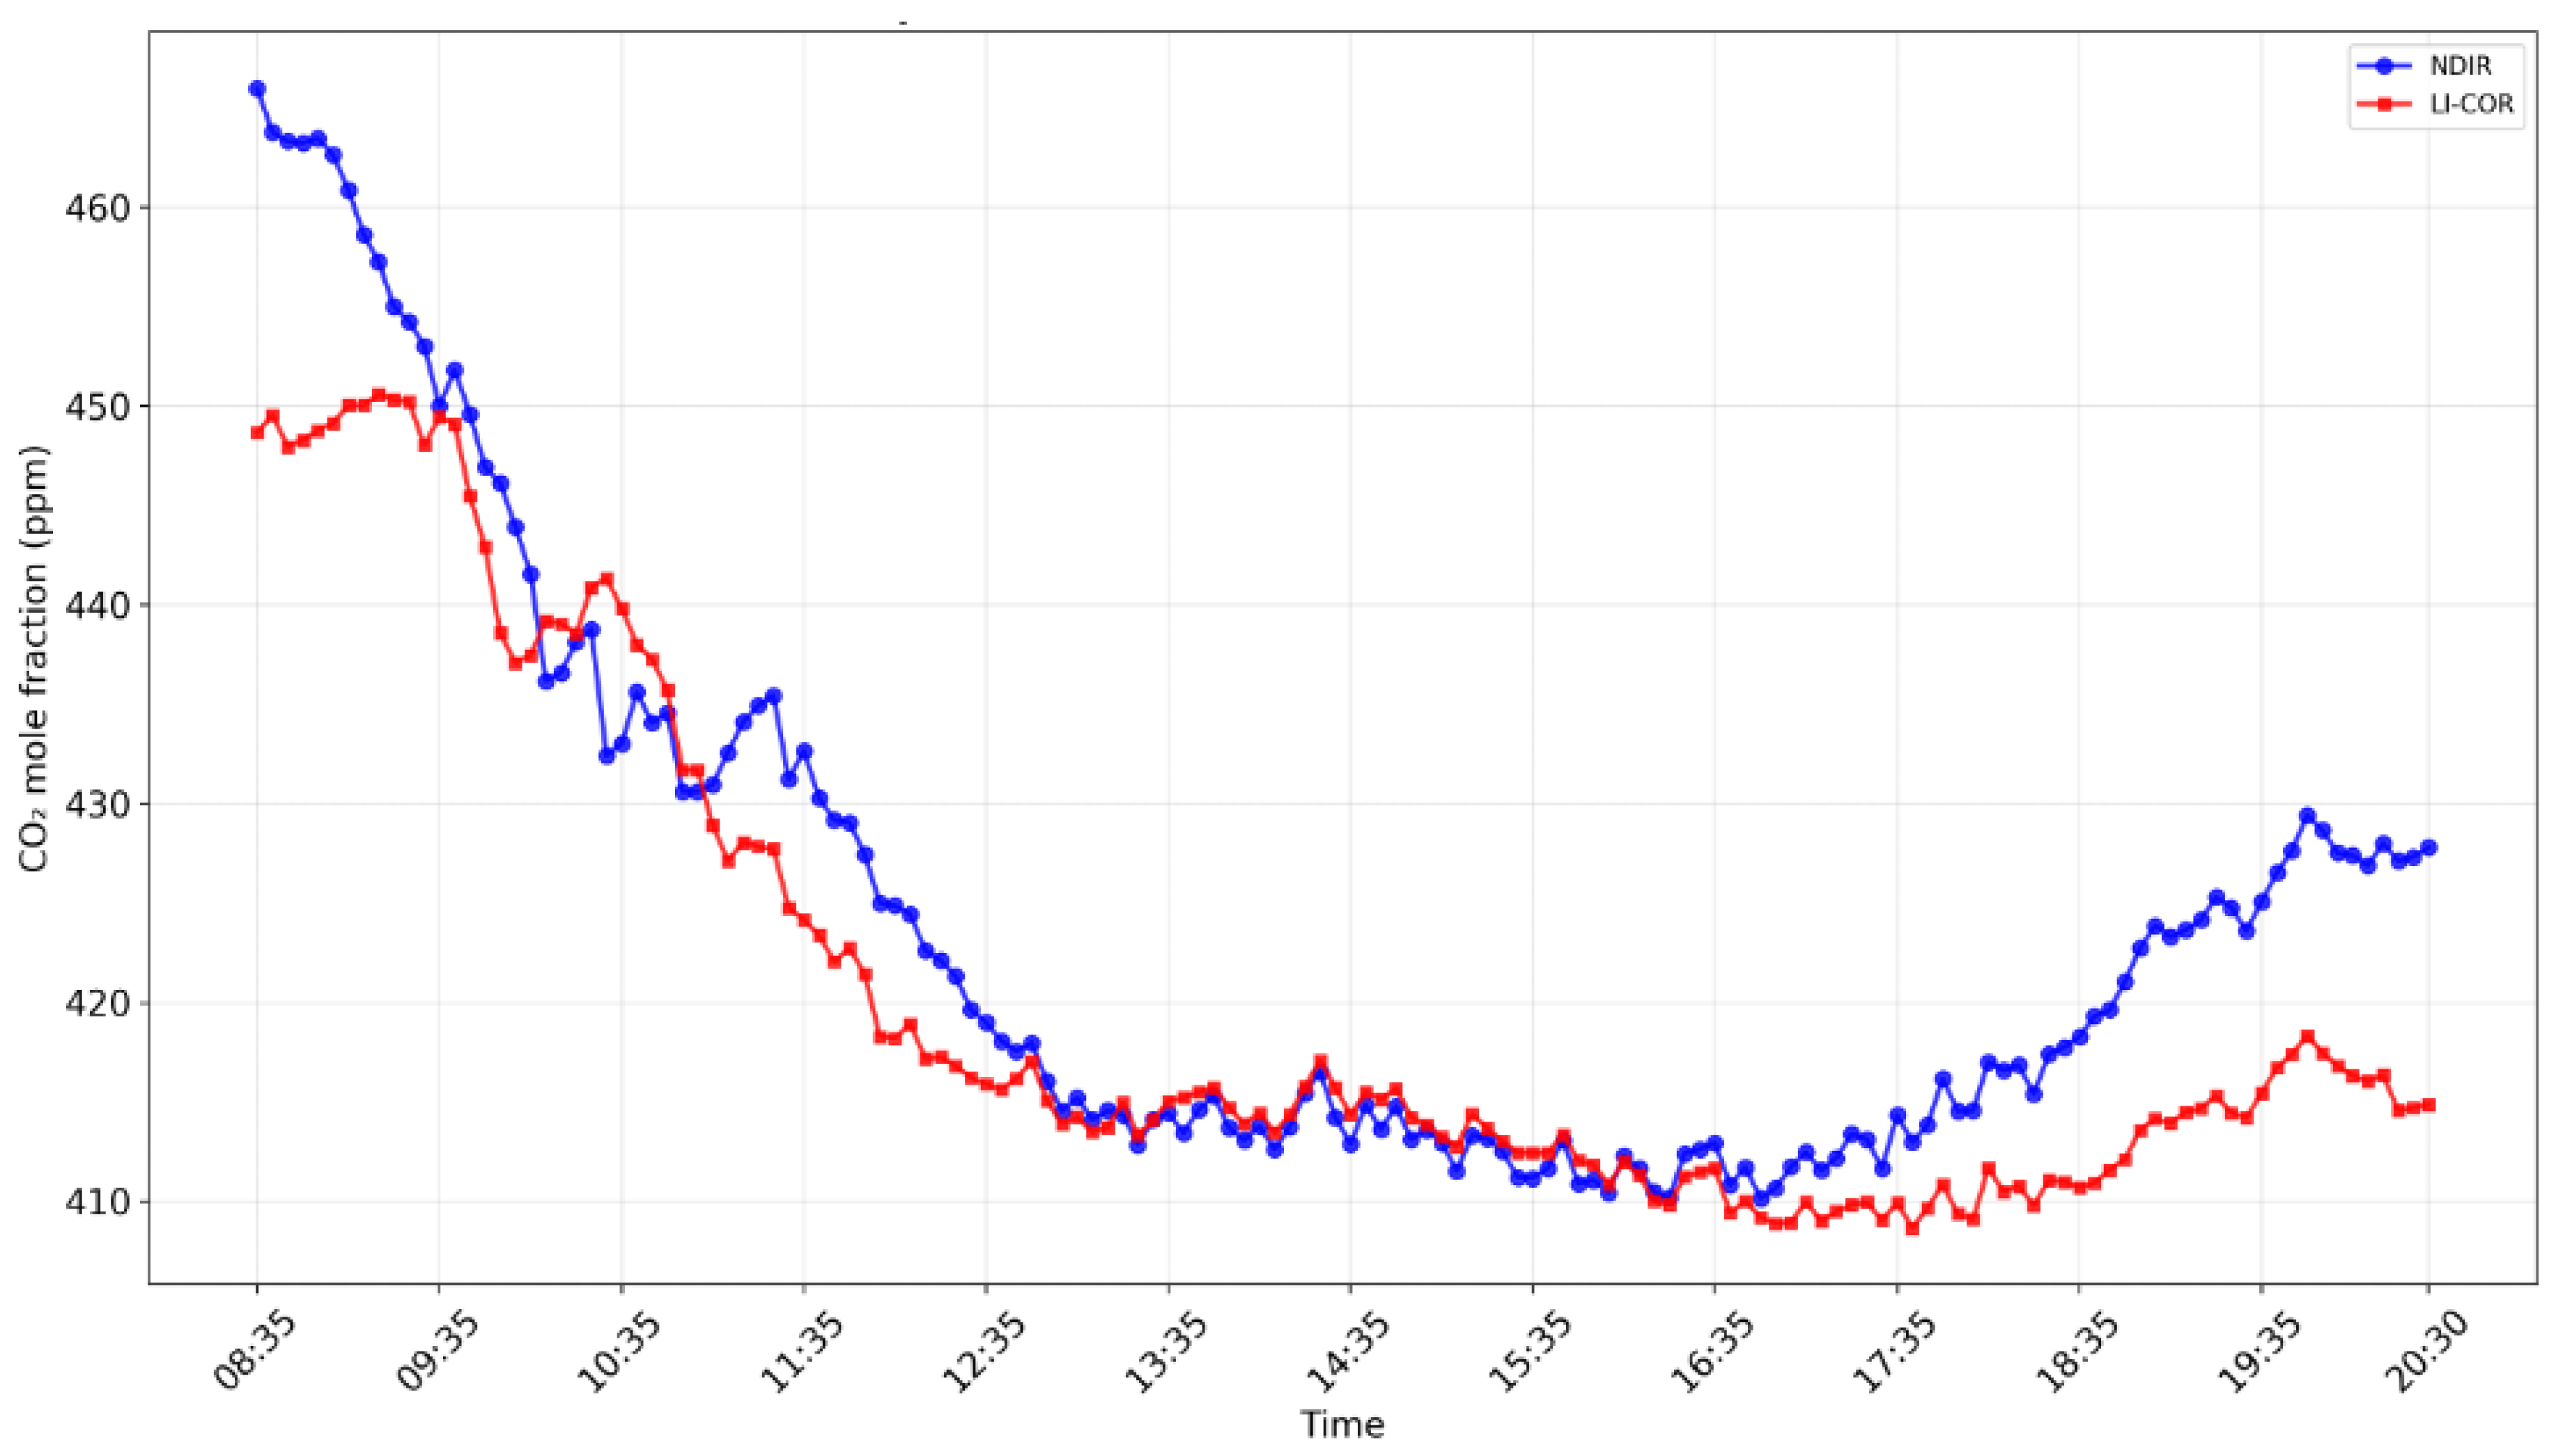
Figure 8.
mole fraction dynamics measured by LI-COR LI-7500A (red line) and NDIR (blue line) devices.
Figure 8.
mole fraction dynamics measured by LI-COR LI-7500A (red line) and NDIR (blue line) devices.
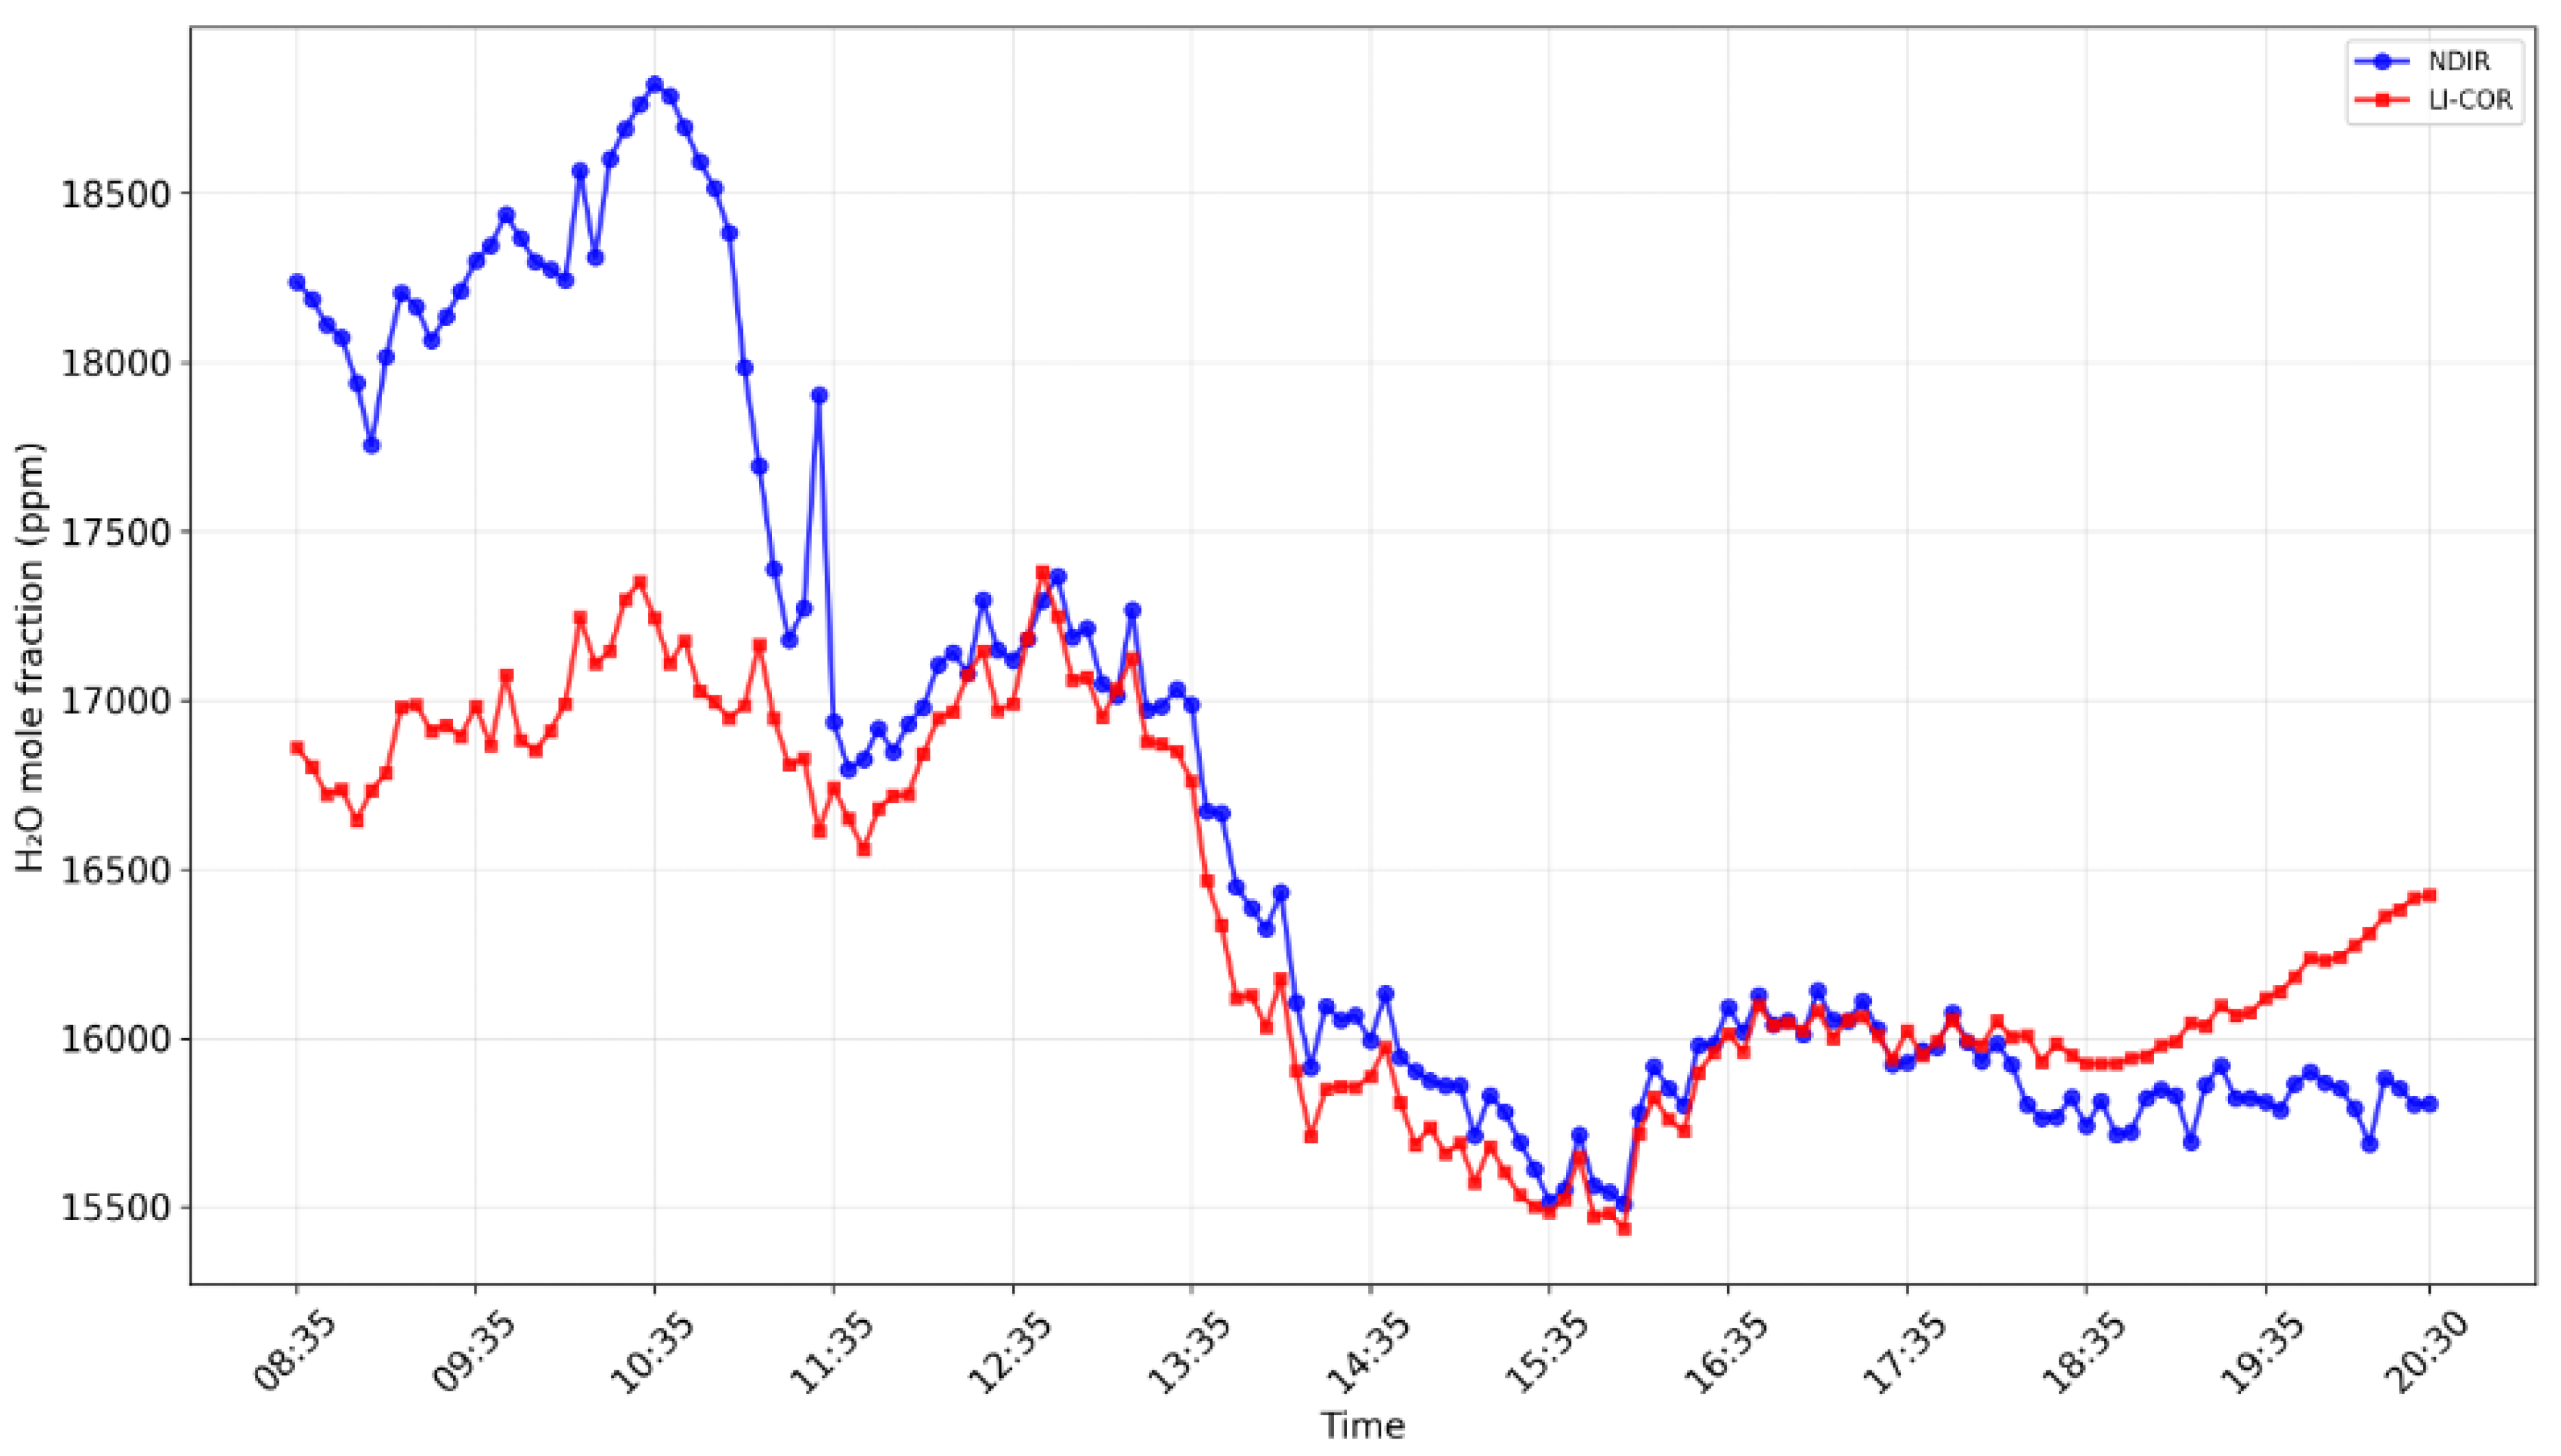
Figure 9.
Experimental setup. 1 – Developed NDIR gas analyzer; 2 – Data processing unit for NDIR analyzer; 3 – Ultrasonic anemometer (WindMaster Pro); 4 – Open-path gas analyzer LI-COR LI-7500A; 5 – Data processing unit (LI-COR 7550 Interface Unit); 6 – Control laptop; 7 – Laboratory power supply.
Figure 9.
Experimental setup. 1 – Developed NDIR gas analyzer; 2 – Data processing unit for NDIR analyzer; 3 – Ultrasonic anemometer (WindMaster Pro); 4 – Open-path gas analyzer LI-COR LI-7500A; 5 – Data processing unit (LI-COR 7550 Interface Unit); 6 – Control laptop; 7 – Laboratory power supply.
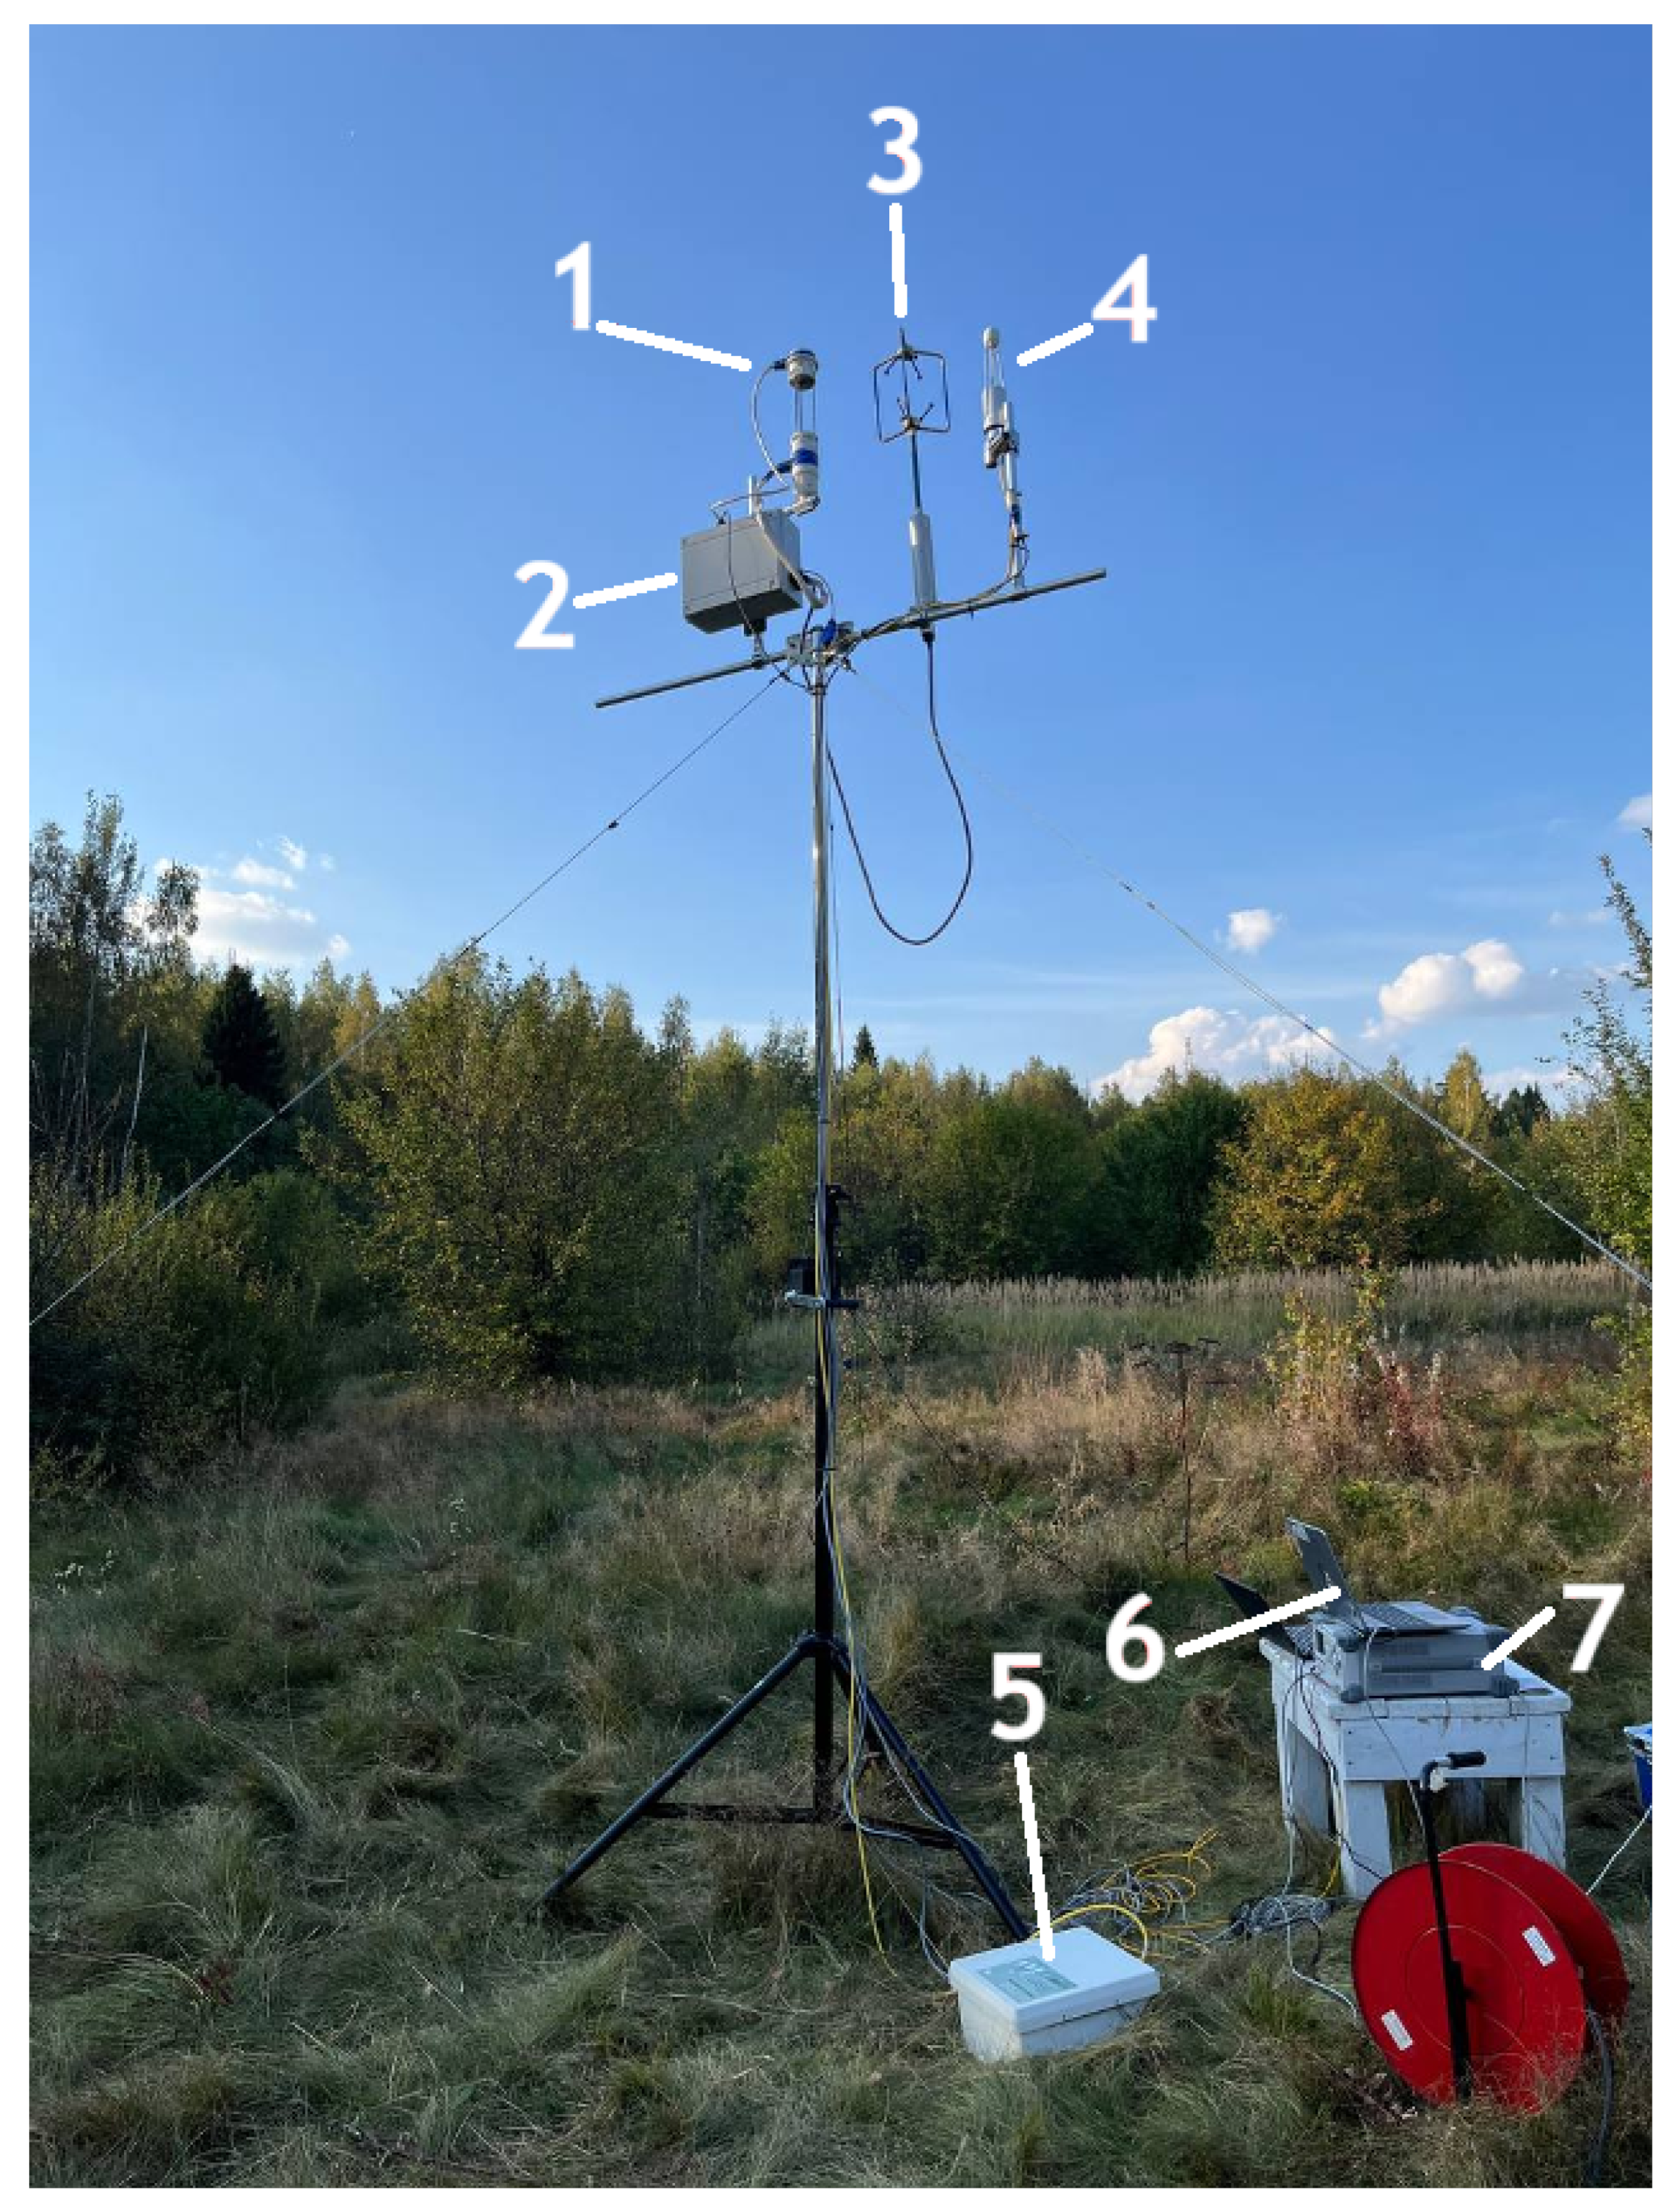

Table 1.
Technical characteristics of JSIR 350-4
| Parameter | Value | Units | Additional notes |
|---|---|---|---|
| Spectral range | 2...15 | – | |
| Active area | 2.2 × 2.2 | – | |
| Thermal resistance (R) | 40 ± 20 | At nominal power | |
| Temperature coefficient | 500 | ppm/K | At 25 °C – 800 °C |
| Time constant | 12.5 | – | |
| Nominal power consumption | 650 | In on state | |
| Operating voltage | 4.9 | At R = 40 | |
| Operating current | 132 | At R = 40 | |
| Active area temperature (T) | 610 ± 30 | °C | At nominal power; |
| Estimated service life | > 5000 | 740 () | |
| > 100000 | 610 () | ||
| Limiting values of some parameters | |||
| Input power | 1200 | In on state; | |
| Case temperature | 120 | ||
| T | 850 | – | |
Table 2.
Technical characteristics of LRM-244
| Parameter | Value | Units |
|---|---|---|
| Aperture size | 8.5 x 8.5 | |
| Photocell size | 2 × 2 | |
| Thermal time constant | 150 | |
| Feedback resistor | 100 ± 20% | |
| Feedback capacitor | 0.2 ± 0.1 | |
| Voltage sensitivity | 80000 | |
| Maximum noise density | 55 | |
| Detectivity | ·/ | |
| Supply voltage V+/V- | 16 | |
| Operating supply voltage V+/V- | +2.2...8.0 / -2.2...-8.0 | |
| Recommended supply voltage V+/V- | +5/-5 | |
| Maximum current consumption | 150 | |
| Offset voltage | -5...+5 | |
| Optimal load | 470 | |
| Maximum output current | ±0.4 | |
| Operating temperature | -25...+85 |
Table 3.
Technical characteristics of bandpass filters of LRM-244 channels
| Parameter | Channel 1 | Channel 2 | Channel 3 | Channel 4 |
|---|---|---|---|---|
| Channel assignment | Reference | CO2 | H2O | Reference |
| Bandpass filter, nm | 3950 | 4260 | 5800 | 3950 |
| Filter bandwidth at half height, nm | 90 | 180 | 100 | 90 |
Disclaimer/Publisher’s Note: The statements, opinions and data contained in all publications are solely those of the individual author(s) and contributor(s) and not of MDPI and/or the editor(s). MDPI and/or the editor(s) disclaim responsibility for any injury to people or property resulting from any ideas, methods, instructions or products referred to in the content. |
© 2025 by the authors. Licensee MDPI, Basel, Switzerland. This article is an open access article distributed under the terms and conditions of the Creative Commons Attribution (CC BY) license (http://creativecommons.org/licenses/by/4.0/).
Copyright: This open access article is published under a Creative Commons CC BY 4.0 license, which permit the free download, distribution, and reuse, provided that the author and preprint are cited in any reuse.


