
Submitted:
25 November 2025
Posted:
26 November 2025
You are already at the latest version
Abstract
Smart specialization (RIS3) requires evidence-based priority setting, but there is still a lack of empirical evidence on whether regions are guided by their capability endowments or policy mimicry. We analyze 236 EU regions, 178,314 publications, 116,336 projects, and 470 RIS3 ener-gy priorities (2021–2027) across 112 energy themes to see if the choices align with capability. We create two dimensions of potential: inside strength potential and adjacent frontier potential. The Portfolio Opportunity Index (POI) measures the portfolio's tilt towards strengths vs. adjacencies. Selection behavior is characterized using the SCZBI (Selection Comfort-Zone Bias Index), exploi-tation/exploration rates, stretch rate, and alignment metrics.
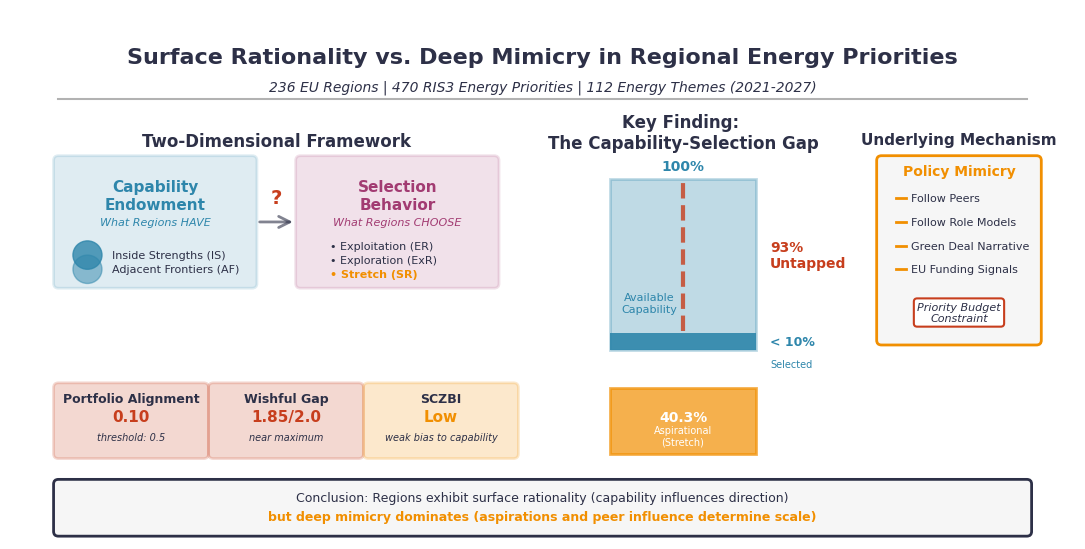
The results of the study show that surface rationality masking deep mimicry. Capability influ-ences the direction of selection, but not its scale—regions select less than 10% of available strengths or adjacencies. Instead, 40.3% of priorities go beyond IS and AF potential, focusing on aspirational domains (hydrogen, offshore wind energy). The alignment of portfolio priorities is minimal (0.10, well below the 0.5 threshold), and wishful gaps approach maximum (1.85/2.0). Importantly, stretching substitutes for capability-based selection, indicating a "priority budget" constraint.” Regions leave 93% of capacity potential untapped.
We find that RIS3 energy priorities reflect aspirations and policy mimicry rather than capability mobilization. Regions “follow their peers” and “follow role models” (institutional isomorphism) to attract EU funds and align with the Green Deal narrative, rather than capability endowments. Without mechanisms to anchor priorities in absorption capacity, smart specialization risks be-coming wishful thinking. Future research should examine whether capacity-based priorities out-perform mimicry-driven selections.
Keywords:
smart specialization
; RIS3
; energy transition
; regional innovation
; policy mimicry
; capability endowments
; entrepreneurial discovery
; relatedness density
; strategic behavior
Abstract
Smart specialization (RIS3) requires evidence-based priority setting, but there is still a lack of empirical evidence on whether regions are guided by their capability endowments or policy mimicry. We analyze 236 EU regions, 178,314 publications, 116,336 projects, and 470 RIS3 energy priorities (2021–2027) across 112 energy themes to see if the choices align with capability. We create two dimensions of potential: inside strength potential and adjacent frontier potential. The Portfolio Opportunity Index (POI) measures the portfolio's tilt towards strengths vs. adjacencies. Selection behavior is characterized using the SCZBI (Selection Comfort-Zone Bias Index), exploitation/exploration rates, stretch rate, and alignment metrics. The results of the study show that surface rationality masking deep mimicry. Capability influences the direction of selection, but not its scale—regions select less than 10% of available strengths or adjacencies. Instead, 40.3% of priorities go beyond IS and AF potential, focusing on aspirational domains (hydrogen, offshore wind energy). The alignment of portfolio priorities is minimal (0.10, well below the 0.5 threshold), and wishful gaps approach maximum (1.85/2.0). Importantly, stretching substitutes for capability-based selection, indicating a "priority budget" constraint.” Regions leave 93% of capacity potential untapped. We find that RIS3 energy priorities reflect aspirations and policy mimicry rather than capability mobilization. Regions “follow their peers” and “follow role models” (institutional isomorphism) to attract EU funds and align with the Green Deal narrative, rather than capability endowments. Without mechanisms to anchor priorities in absorption capacity, smart specialization risks becoming wishful thinking. Future research should examine whether capacity-based priorities outperform mimicry-driven selections.
1. Introduction
The transition to cleaner, more sustainable, and secure energy systems poses a major challenge for regional economies [1,2]. As the European Union accelerates efforts to decarbonize and modernize energy infrastructures [3], regional innovation systems must adapt, build new capabilities and reconfigure existing structures of knowledge and technology [4,5]. This process of structural transformation—what Boschma [6] terms "regional branching"—requires economies to exploit existing competencies while simultaneously exploring adjacent technological domains. At the same time, publicly funded regional innovation policies are facing increasing pressure to deliver tangible results: they must not only support existing strengths, but also enable diversification, exploration, and structural transformation [7]. This challenge is intensified by significant differences in regional innovation potential, institutional quality and industrial structure [8,9], reflecting what Rodríguez-Pose [10] describes as persistent territorial disparities in the European innovation geography.
In this context, the concept of Research and Innovation Strategies for Smart Specialization (RIS3) has become a central pillar of EU cohesion policy, aimed at helping regions identify and mobilize their unique strengths to support sustainable economic transformation [11,12]. Grounded in the entrepreneurial discovery process [13,14], RIS3 encourages regions to prioritize domains where they possess competitive advantages and can realistically aspire to global leadership. However, despite its widespread adoption across European regions, the effectiveness of RIS3 implementation remains contested [11,12,15]. Scholars working on regional innovation policy express concerns about whether regional strategies are truly “smart”—that is, whether they are grounded in authentic local capabilities and dynamically oriented towards emerging opportunities, or whether they simply replicate existing structures and follow a logic of institutional mimicry [16,17]. For example, Di Cataldo et al. [18] demonstrate that many RIS3 across Europe are characterized by scattered objectives, poor alignment with regional potential, and a tendency to imitate the portfolios of neighboring regions rather than reflecting genuine entrepreneurial discoveries. This pattern resonates with broader institutional theory on isomorphism [19], where organizations adopt similar practices not for efficiency reasons but due to competitive, normative, or coercive pressures. More recently, Pylak et al. [20] emphasized that the selection of priority areas in RIS3 often reflects behavioral mimicry (“follow the peers,” “follow the role models”) rather than the ideal of “follow the indicators” grounded in the region's unique strengths.
These questions become particularly acute in the context of the energy transition [3,7,21]. The need for decarbonization constitutes what Geels [22,23] refers to as a socio-technical transformation—a fundamental reconfiguration of production, consumption, and innovation systems that goes far beyond incremental technological change. Under the RIS3 2021–2027 programming period, regions across the EU are encouraged to include energy-related specializations—whether in renewables, hydrogen technologies, smart grids, energy storage or sustainable infrastructure [21,24]. Yet critical questions remain: do regions possess genuine capability endowments in these domains, or are priorities aspirational? When regions do select energy priorities, do they consolidate existing comfort zones or branch into adjacent opportunities? Does the alignment between capability endowments and priority selection reflect evidence-based entrepreneurial discovery or policy mimicry? And what do selection patterns reveal about the gap between smart specialization’s normative vision and its practical implementation?
1.1. The Two-Dimensional Challenge: Endowment and Selection
The smart specialization literature has predominantly focused on what regions select as priorities, with less systematic attention to what regions could select based on their pre-existing capability landscape [20,25]. This distinction is crucial: a region's strategic behavior cannot be properly evaluated without understanding its opportunity space. Drawing on evolutionary economic geography [6,26,27], we argue that regional innovation policy operates across two fundamental dimensions. First, the capability endowment dimension captures what a region objectively has—its inside strengths (IS), where it exhibits proven activity above EU benchmarks, and adjacent frontiers (AF), where existing capabilities provide natural entry points through technological relatedness. Second, the selection behavior dimension captures what a region strategically chooses—whether it exploits its strengths, explores its adjacencies, or stretches toward distant domains disconnected from its capability base.
The tension between these dimensions directly engages March's [28] foundational distinction between exploitation of existing competencies and exploration of new possibilities. However, regional policy adds a spatial and structural layer: not all exploration is equally feasible. From the related variety literature [6,26,27], we know that diversification tends to occur into technologically related domains where cognitive proximity facilitates knowledge spillovers and recombination. Regions with portfolios characterized by high related variety—diverse but interconnected activities—are better positioned to branch into adjacent domains while maintaining coherence [26,27,29]. Conversely, regions attempting to leap into distant, unrelated domains face steeper learning curves and higher failure risks, even when such domains appear globally attractive [30,31,32,33].
This two-dimensional framework also speaks to ongoing debates about the “wishful thinking” problem in RIS3 [18,20]. If regions systematically select priorities that are decoupled from their capability base—high aspirations with low absorptive capacity [8,34]—then policy resources may be allocated inefficiently and entrepreneurial discovery processes may fail to translate into capability building. Conversely, if regions only select priorities that perfectly mirror their current portfolios, they risk path-dependent lock-in and miss opportunities for structural renewal [6,20,35]. The optimal strategy likely requires striking the right balance: utilizing proven strengths while seeking to expand into related areas that require the development of existing competencies but do not cause them to be lost [18,27,35].
Despite extensive literature on RIS3 formulation [12,15,25], empirical evidence remains limited on three fronts. First, we lack systematic mapping of regional capability endowments in energy domains—distinguishing what regions demonstrably possess (inside strengths) from what they could plausibly pursue (adjacent frontiers)—and how these endowments evolve over time. Existing RIS3 evaluations typically rely on aggregate innovation indicators (patents, publications, R&D intensity) rather than fine-grained, domain-specific capability assessments that could reveal whether regions possess absorption capacity in the energy topics they prioritize [27,35]. Second, and more critically, we lack understanding of how endowments shape selection behavior: whether regions rationally align priorities with opportunities (“follow the indicators”), engage in mimicry by emulating peers and role models (“follow the peers,” “follow the role models”), or pursue aspirational targets disconnected from capabilities (“wishful thinking”) [20]. The few studies addressing selection patterns focus on thematic convergence [18,35] or binary presence/absence of priorities [20], but do not quantify how much of the capability base regions mobilize (exploitation intensity), how extensively they pursue adjacencies (exploration intensity), or to what degree priorities align with pre-policy activity portfolios.
This paper addresses these gaps through a comprehensive analysis of EU regions’ energy innovation capabilities and priority selection behavior during the 2014–2027 period, structured around two research questions that move from descriptive landscape mapping to hypothesis-driven behavioral analysis.
1.2. Research Questions and Hypotheses
1.2.1. RQ1: What Energy Capability Endowments Do Regions Possess, and How Do These Evolve Over Time?
Our first research question establishes the empirical landscape of regional energy innovation capabilities across the EU. We map the distribution of inside strength potential and adjacent frontier potential for 236 NUTS-2 regions across 112 energy topics, distinguishing regions where capability bases tilt toward established strengths (high Portfolio Opportunity Index, POI) from those where bases tilt toward unexploited adjacencies (low POI). This descriptive exercise is essential for three reasons: (1) it provides the baseline against which to evaluate selection behavior (RQ2), revealing whether regions select from abundant or scarce capability endowments; (2) it documents the heterogeneity in regional opportunity spaces, testing whether the EU energy innovation landscape exhibits core-periphery gradients [24] or more complex spatial patterns; and (3) it assesses whether portfolios evolve organically during the pre-policy period (2014–2020), establishing the counterfactual trajectory against which future policy impacts could be measured.
Evolutionary economic geography suggests two competing dynamics. On one hand, path-dependence and increasing returns may lead regions to concentrate further in existing strengths, narrowing portfolios over time through cumulative causation [27,35]. On the other hand, the branching logic suggests that strong capability bases provide platforms for diversification into related domains, potentially broadening portfolios [6,31,32] as regions pursue Jacobs externalities [36]. Understanding pre-policy trends in coverage—the fraction of potential energy domains (IS + AF) that regions actively follow with above-median activity—allows us to distinguish whether capability landscapes are static (locked-in) or dynamic (organically broadening), with implications for whether RIS3 interventions face inertial or fluid regional systems.
1.2.2. RQ2: How Do Regions' Capability Endowments Shape Their Priority Selection Behavior?
Building on the capability landscape established in RQ1, our second research question examines the strategic logic underlying priority selection under RIS3 2021–2027. We characterize selection behavior through multiple complementary metrics: Exploitation Rate (ER) measuring what fraction of available inside strengths are selected as priorities; Exploration Rate (ExR) measuring what fraction of adjacent frontiers are pursued; and Stretch Rate (SR) capturing priorities that fall outside both IS and AF (aspirational targeting or wishful thinking); a Selection Comfort-Zone Bias Index (SCZBI) quantifying whether regions tilt toward selecting inside strengths versus adjacent frontiers; and portfolio-priority alignment, assessing cosine similarity and L1 divergence between pre-policy activity vectors and priority vectors.
To organize regional strategic behavior, we propose a typology based on a 2×2 matrix (see Figure 1) crossing POI (capability endowment) with SCZBI (selection behavior), yielding four archetypes: (1) Strength Boosters (high POI, high SCZBI) who possess many strengths and select them—potentially deepening narrow specializations; (2) Excelling Perfectionists (high POI, low SCZBI) who possess strengths but deliberately select adjacencies—utilizing strong bases for related variety branching; (3) Explorers (low POI, low SCZBI) who build from weak bases toward frontiers—high-risk growth strategies requiring external support; and (4) Narrow Specialists (low POI, high SCZBI) who lack strong bases yet select non-adjacent or distant priorities—aspirational positioning with low absorptive capacity.
We formulate and test three competing hypotheses about the mechanisms driving selection:
- H1 (Rational Selection Hypothesis): If regions engage in evidence-based entrepreneurial discovery [13,14,25,37], they should align priorities with capability endowments. Specifically, regions with more inside strengths (high POI) should exploit them by exhibiting higher SCZBI and higher ER (> 15%), while regions with abundant adjacent frontiers (low POI) should exhibit lower SCZBI and higher ExR (> 15%). This hypothesis predicts a positive correlation between POI and SCZBI among comfort-zone-biased regions (upper half of POI × SCZBI space) and positive correlation among exploration-biased regions (lower half), reflecting “following the indicators” logic [20]. Empirically, we test whether POI predicts selection intensity (ER and ExR) after controlling for regional characteristics (GDP per capita, R&D capacity, legacy of energy priorities in 2014–2020).
- H2 (Explorative Selection Hypothesis): Alternatively, regions may prioritize organizational learning and capability building [19,28] by systematically targeting AF to utilize related variety mechanisms [30,31,32]. High-POI regions with strong bases may branch into adjacencies (Excelling Perfectionists), while low-POI regions may build from abundant AF potential (Explorers). This hypothesis predicts high ExR (> 15%) among low-SCZBI regions, regardless of POI, and positive correlation between AF potential (number of adjacent frontier topics) and ExR. This would reflect forward-looking diversification strategies that stretch but respect relatedness constraints.
- H3 (Mimicry and Wishful Thinking Hypothesis): Despite normative aspirations for evidence-based selection, institutional isomorphism [19] and policy mimicry [20,35] may dominate. Regions may “follow peers” (selecting domains common in their reference group) or “follow role models” (emulating successful innovators like Germany’s hydrogen strategy or Denmark’s offshore wind) rather than “follow indicators” (grounding selection in capabilities). This hypothesis predicts: (1) low portfolio-priority alignment (cosine similarity < 0.3), indicating priorities are decoupled from pre-policy activity; (2) high wishful gaps (L1 distance > 1.5, approaching the maximum of 2.0), reflecting compositional mismatch; (3) high Stretch Rates (SR > 30%), indicating systematic targeting of domains outside both IS and AF; and critically, (4) substitution rather than addition—high SR should negatively predict ER and ExR in multivariate regressions (β < 0), revealing that regions face “priority budget” constraints and allocate slots to aspirational targets at the expense of capability-based choices. This would confirm that mimicry displaces, rather than complements, evidence-based selection.
The three hypotheses are not mutually exclusive: rational orientation (H1) and explorative orientation (H2) could coexist with mimicry (H3) if capability influences which type of priority to select (IS vs. AF) but mimicry determines what fraction of the capability base to mobilize. Testing all three hypotheses allows us to distinguish surface rationality (positive POI-SCZBI correlation) from deep mimicry (low ER/ExR, high SR, substitution mechanism).
1.3. Integrated Theoretical Framework and Contributions
Our theoretical framework integrates insights from evolutionary economic geography [6,22,26], organizational learning theory [28], related variety scholarship [29,30,32], absorptive capacity research [32,34], and institutional isomorphism [19] to conceptualize regional innovation policy as operating across two dimensions—capability endowment (what regions have) and selection behavior (what regions choose)—with the tension between these dimensions revealing whether smart specialization achieves its normative vision of evidence-based entrepreneurial discovery or whether it transforms into aspirations based on mimicry.
This paper contributes to three areas of literature. First, we advance smart specialization scholarship by providing the first large-scale empirical test of whether regions “follow the indicators” or “follow peers/role models” in energy priority selection [20], using a comprehensive two-dimensional framework that operationalizes both capability endowments and selection behavior. Our novel metrics provide a replicable toolkit for auditing strategic behavior in regional innovation policy, directly addressing long-standing critiques about mimicry, wishful thinking, and scattered objectives [12,17,18,20,25,35]. By documenting not just what regions select (topic labels) but how much of their capability base they mobilize (ER, ExR) and how aligned selections are with portfolios (alignment, wishful gap), we move the literature from thematic description to quantitative behavioral evaluation.
Second, we contribute to evolutionary economic geography by empirically validating the concepts of inside strengths and adjacent frontiers through fine-grained relatedness density calculations across 112 energy topics. Our finding that regions with high relatedness density (high adjacent frontier potential) face lower cognitive barriers to entry aligns with branching theory [6,26,27,31,33], but our discovery that such regions nonetheless exhibit low exploration rates (≈5%) reveals a critical insight: adjacency advantages are necessary but insufficient for diversification. Regions may possess the technological proximity to branch into adjacent energy domains, yet systematically fail to prioritize them, instead pursuing distant aspirational targets (high stretch rate). This disconnect between potential and selection suggests that policy interventions aiming to catalyze related variety branching must do more than identify adjacencies—they must create incentive structures that reward capability-grounded exploration over aspirational leaps. Our stretch rate metric, capturing priorities outside both inside strength and adjacent frontiers, provides a novel measure of “capability distance” that future research can use to test whether distant diversification attempts systematically fail relative to capability-grounded selections.
Third, we inform the policy learning and mimicry literature by demonstrating that mimicry extends beyond convergence on topic labels to encompass the selection process itself: systematically under-mobilizing capabilities (low ER/ExR) and over-allocating to wishes (high SR) with a substitution mechanism whereby stretch crowds out evidence-based choices. This has profound implications for RIS3 design: addressing mimicry requires not just diversifying regional strategies (reducing thematic convergence) but fundamentally altering how priorities are anchored in absorptive capacity assessments [32,34]. Without such stabilizing mechanisms—control of ER/ExR indicators, the requirement to justify capability, rewarding performance rather than promises— RIS3 risks turning into a competition of ambitious declarations, in which regions compete for the most fashionable areas (Green Deal, hydrogen economy, offshore wind energy) regardless of their suitability, as documented by Pylak et al. [20] in their analysis of “follow the peers” versus “follow the indicators” behavior.
Our empirical strategy utilizes a harmonized panel of 178,314 publications (OpenAlex), 116,336 innovation projects (CORDIS, Kohesio), and 1,159 RIS3 energy priorities (2021–2027) across 238 NUTS-2 regions and 112 energy topics identified through semantic topic modeling (BERTopic with LLM labeling). This data architecture enables us to: (1) construct capability measures grounded in observed pre-policy activity (2018-2020 baseline); (2) map relatedness structure among energy topics via document-level soft topic assignments, yielding a sparse similarity matrix (29% non-zero entries) that captures modular technological structure; (3) calculate relatedness density for each region-topic pair, operationalizing adjacency readiness; and (4) characterize selection behavior and test hypotheses through correlation analysis, multivariate regressions, and subsample comparisons.
The remainder of the paper is organized as follows. Section 2 describes the data sources, semantic topic modeling approach, construction of the region-year-topic panel, operationalization of capability endowment and selection behavior metrics, and analytical strategy for hypothesis testing. Section 3 reports results sequentially: Section 3.1 maps capability endowments and their evolution (RQ1), and Section 3.2 characterizes selection behavior, tests hypotheses H1-H3, and classifies strategic archetypes (RQ2). Section 4 discusses theoretical and policy implications, places the research findings in the broader context of the literature on smart specialization and evolutionary economic geography, identifies limitations, and outlines directions for future research.
2. Materials and Methods
2.1. Data and Topic Space Construction
2.1.1. Data Sources and Spatial Harmonisation
RIS3 aims to align regional innovation activities with local strengths and emerging opportunities, but assessing this alignment requires a harmonized empirical basis. To address RQs 1–2, we construct a multi-source regional panel of research outputs, innovation projects, and RIS3 energy policy priorities covering the EU-27 between 2014 and 2025. Our approach is consistent with established principles in regional studies and innovation system research, which emphasize the need to use micro-level, activity-based indicators to understand capacity formation, diversification patterns, and policy responsiveness [6,26,27,38,39]. The following data architecture forms the basis of our strategies for semantic topic modeling, and capability mapping.
The empirical dataset draws on publicly accessible repositories: OpenAlex (an open-access bibliographic catalogue of scholarly works, authors, and institutions), CORDIS (the European Commission’s catalogue of EU Framework Program research and innovation projects), Kohesio (the Commission’s repository of Cohesion Policy projects and beneficiaries), Eye@RIS3 (RIS3 priorities for 2014–2020), and the S3 Community of Practice Observatory (RIS3 priorities for 2021–2027). For thematic scope, we retain OpenAlex publications classified in energy with publication dates 2014–2025; CORDIS projects tagged Energy under Horizon 2020 (2014–2020) and Horizon Europe (2021–2027); Kohesio projects (2014–2020; 2021–2027) whose Thematic Objective Label corresponds to low-carbon economy, climate change adaptation and risk prevention, network infrastructure in transport and energy, or environment protection and resource efficiency; and RIS3 priorities (2014–2020; 2021–2027) classified under the energy scientific category. All records are limited to EU Member States (EU-27) and harmonized to NUTS-2 (2021) as follows: publications by author affiliations; CORDIS/Kohesio by project beneficiaries; and RIS3 priorities by normalizing reported NUTS codes and cross-walking historical codes to the 2021 standard, including expansion of NUTS-0/1 entries to their constituent NUTS-2 units. For CORDIS/Kohesio records lacking coordinates but carrying a historical NUTS code, we harmonize to NUTS-2 (2021) via an area-weighted crosswalk based on polygon intersections between legacy units and the 2021 layer. Records that cannot be reliably assigned to NUTS-2 (2021) – owing to missing geodata or absent/invalid codes – are excluded from the analytical dataset. Final datasets contain 116,336 projects (3 817 CORDIS, 112 519 Kohesio), 178,314 OpenAlex publications, and 470 RIS3 priority records (284 for 2014–2020 and 186 for 2021–2027).
2.1.2. Extracting Topics and Aligning Them to Regional Priorities
To translate heterogeneous publications and projects into a comparable analytical space, we extract high-resolution semantic topics using BERTopic. This step is essential because traditional classifications (e.g., WoS categories, Horizon thematic tags) are too coarse to capture the fine-grained technological pathways along which regions diversify [26,27]. Topic extraction provides a data-driven representation of knowledge domains, while the subsequent LLM-based labeling and RIS3 matching enable a unified mapping between real-world energy activity and regionally declared policy priorities.
To build our aggregated corpus of publicly funded research and project results, we use titles from OpenAlex publications and CORDIS/Kohesio projects, supplemented with abstracts and keywords where available. We implement BERTopic because it is tailored to short texts and yields coherent topic groupings with sparse, interpretable descriptors. Concretely, documents are embedded with the Sentence-Transformer paraphrase-multilingual-MiniLM-L12-v2 to place all sources in a single semantic space, reduced via UMAP to preserve local neighborhoods while denoising, clustered with HDBSCAN to accommodate heterogeneous cluster shapes and explicitly handle noise, and described with class-TF-IDF (c-TF-IDF) to produce compact, human-readable topic terms. A document’s topic is defined as the index of the global cluster to which HDBSCAN assigns it; documents not assigned by HDBSCAN are marked as outliers (no topic). Outliers are optionally reassigned to the nearest topic centroid only when the cosine similarity is greater than or equal to 0.20; otherwise, they remain without a topic label. In addition to the hard topic index, we retain diagnostic soft evidence: for each document we compute cosine similarities to all global cluster centroids and store the top ten raw (unnormalized) values.
To extract topics closely related to energy and label them, we use a local LLM (llama4) model for the most frequently occurring terms in each cluster. The LLM model flags energy-related clusters and assigns them concise titles that are understandable to policy makers based on the most frequently occurring terms.
To place RIS3 2021–2027 priorities in the same space, we embed each priority topic with the same Sentence-Transformer used for publications/projects and compare it only to the previously selected energy topics. Using FAISS nearest-neighbor search (cosine on L2-normalised vectors), a priority topic is linked to its single closest energy topic only if the similarity exceeds a conservative threshold of 0.70, chosen through stratified hand audit to prioritize precision over recall and ensure that matched priorities genuinely correspond to the same semantic domain.
2.1.3. Regional Panel Construction
Having placed all documents and policy priorities into the same semantic topic space, we next construct a region–year–topic panel. This panel structure aligns with evolutionary economic geography frameworks in which regional capabilities emerge cumulatively, path-dependently, and often unevenly [6,22,26]. The weighting approach ensures that documents contribute proportionally to multiple affiliated regions and that soft semantic evidence is preserved—critical features for studying subtle shifts in capability formation.
We build a comparable panel of topic intensities for each region and year to (i) quantify how research and policy-funded activity is distributed across topics within regions, (ii) track shifts over time, and (iii) use harmonised, additive measures in downstream analyses. We retain only documents whose topic is flagged as energy-relevant.
Let be the set of all energy-relevant topics. From the stored diagnostics, for every document we have the top ten unnormalised cosine similarities to topics (i.e. global cluster centroids). For document observed in year , let denote its topic (assigned global cluster index) and let denote the cosine similarity between and topic . Define the top ten topics set for as . We keep only energy topics that appear in the document’s top ten and lie sufficiently close to its topic , using a data-driven threshold with fixed and set ex-ante. The retained set is
We form raw weights for and renormalise within :
.
HenceIf lists multiple NUTS-2 affiliations in year , we allocate the document’s unit mass across regions proportionally to their frequency in the affiliation list and normalise to one. Let be the set of NUTS-2 regions listed in ’s affiliations in year . Let be the affiliation count of region in that list. We allocate the unit mass of across its affiliated regions proportionally to these counts:
Hence, For document let for non-related topics and for in year . Topic mass in region and year is
If in region in year there are no documents with topic , we assume that The region-year total mass is . The topic share within a region-year is
2.2. Mapping Regional Capability Endowments and Evolution (RQ1)
RQ1 asks what energy capability endowments regions possess and how these evolve over time. This descriptive mapping exercise establishes the empirical ground before analyzing selection behavior and policy impacts. We operationalize capability endowments through three components: inside strengths (IS_potential), adjacent frontiers (AF_potential), and a summary Portfolio Opportunity Index (POI). We then track coverage dynamics—whether regions naturally expand into available capability domains over the pre-policy period (2014–2020).
2.2.1. Pre-Policy Topic Shares
For each region and topic we define the ex-ante baseline share as the average over only those baseline years with positive portfolio mass in that region:
where and denotes the number of years in set .
This baseline anchors each region’s portfolio composition before the 2021–2027 policy window. By averaging only over years with observed activity, we avoid mechanically pushing shares toward zero in regions/years where the corpus simply contains no documents. Using a multi-year mean (2018-2020) dampens idiosyncratic noise and business-cycle fluctuations, yielding a stable pre-policy reference.
2.2.2. Topic Similarity Matrix
To capture technological proximity among energy topics, we construct a corpus-based similarity matrix using documents’ soft topic assignments. Let index all document-year pairs and let index topics. Define the document-cluster matrix by for , where are the within-document soft topic weights constructed in Section 2.1.3.
Let , where
and , .
We then define the cosine-similarity matrix as
By construction, is symmetric, has a zero diagonal, and its entries lie in . This similarity matrix provides a corpus-driven topology of topics: two clusters are close when documents frequently assign them positive weights simultaneously. The use of cosine similarity makes the measure scale-free and resistant to uneven topic sizes. To further reduce noise, we thin out by setting values below the 5th percentile to zero, eliminating micro-similarities from rare co-occurrences.
2.2.3. Relatedness Density
We proceed from the corpus-level topology to a region-topic measure of adjacent frontier potential. For region and topic , Relatedness Density (RD) is the weighted mean of similarities to other topics, with weights equal to the region’s ex-ante shares in those topics:
If the denominator is zero (i.e., no non-trivial neighbors under ), we set .
Intuitively, combines proximity with the region’s pre-policy capabilities into a single “neighborhood readiness” score. It measures how strongly a region’s portfolio already sits in topics close to . A high indicates concentration near ’s neighborhood and thus lower frictions for diversification toward [40].
2.2.4. Definitions of Capability Endowment Tags
We construct two fundamental capability endowment tags on the grid to distinguish what regions objectively have before policy intervention.
A region possesses inside strength potential (IS_potential) in topic when its ex-ante baseline share exceeds the EU-wide 60th percentile for that topic, i.e.,
This flags topics where the region already demonstrates substantial presence relative to the EU distribution, indicating proven capability and absorptive capacity [32,34].
A region possesses adjacent frontier potential (AF_potential) in topic when it lacks current inside strength but exhibits high relatedness to its existing portfolio, formally:
Here, is the EU-wide 60th percentile of for topic (computed across regions). The condition ensures that AF_potential targets nearby opportunities rather than current strengths. This operationalizes the branching logic: regions can more easily diversify into domains that are cognitively proximate to their existing portfolio [6,27,40].
2.2.5. Portfolio Opportunity Index (POI)
To summarize each region’s overall capability endowment profile, we define the Portfolio Opportunity Index:
measures whether a region’s capability base tilts toward established strengths (high POI, many IS_potential domains) or toward adjacent opportunities (low POI, many AF_potential domains relative to IS_potential). Regions with high POI possess deep portfolios in proven domains but may face saturation; regions with low POI have shallower current strengths but broader adjacency frontiers. This index is undefined when a region has neither IS_potential nor AF_potential topics; in practice, we set (neutral) for such cases, though they are rare in our energy-focused sample.
2.2.6. Coverage Dynamics: Temporal Evolution of Capability Portfolios
To assess whether regions naturally expand into their available capability domains before policy intervention (organic portfolio broadening vs. path-dependent concentration), we construct a coverage measure tracking the fraction of potential energy topics that regions actively pursue over time.
For each region and year , define:
This measures what fraction of the region’s capability space (IS_potential + AF_potential) exhibits positive observed activity in year . An increasing trend in over 2014–2020 would indicate organic portfolio broadening; a flat or declining trend would suggest path-dependent concentration or lock-in.
We estimate a simple panel regression to test for systematic temporal trends:
where are region fixed effects and is a linear time trend. A positive indicates regions are organically expanding coverage before policy intervention; a null suggests static portfolios.
2.3. Characterizing Priority Selection Behavior (RQ2)
RQ2 examines how regions’ capability endowments shape their priority selection behavior under RIS3 2021–2027. We operationalize selection behavior through multiple complementary measures that capture strategic orientation (comfort-zone bias vs. frontier exploration), selection efficiency (exploitation vs. exploration rates), and portfolio-priority alignment. We then classify regions into strategic archetypes using a 2×2 typology.
2.3.1. Treatment Assignment and Priority Flags
To integrate policy priorities into our analytical framework, we assign treatment status at the region-topic level. The RIS3 2021–2027 dataset does not report exact adoption dates for each priority. To avoid imputing uncertain timing and maintain comparability, we adopt a conservative rule: all priorities recorded in a region’s RIS3 2021–2027 documentation are treated as becoming active at the start of the programming period.
For each region-topic pair , we define:
Let denote the set of topics selected in region ’s priorities, with cardinality . This indicator is the foundation for all subsequent selection behavior measures.
2.3.2. Priority Positioning Tags
We classify each selected priority according to its position in the region’s capability landscape:
Priorities that fall within the region’s inside strength potential (Inside Strength Selected, IS_selected):
Priorities that fall within the region’s adjacent frontier potential (Adjacent Frontier Selected, AF_selected):
Priorities that fall outside both IS_potential and AF_potential, i.e., wishful thinking or distant exploration (Stretch_selected):
These tags partition the priority set into three mutually exclusive categories based on pre-policy capability positioning.
2.3.3. Selection Comfort-Zone Bias Index (SCZBI)
To quantify whether regional strategies lean toward exploitation of existing strengths or exploration of adjacent frontiers, we define Selection Comfort-Zone Bias Index (SCZBI) as follows:
where is the indicator function (equals 1 if condition holds, 0 otherwise).
measures the difference between the share of priorities targeting inside strengths and the share targeting adjacent frontiers. Values near +1 indicate strong comfort-zone bias (selecting proven strengths); values near –1 indicate frontier exploration bias (selecting adjacencies); values near 0 reflect a balanced mix. This operationalizes March’s [22] exploration-exploitation framework at the regional strategy level.
2.3.4. Selection Rates: Exploitation, Exploration, and Stretch
To assess selection efficiency—what fraction of available opportunities regions actually prioritize—we define three rates.
The fraction of available inside strengths that are selected as priorities (Exploitation Rate, ER):
High ER indicates that the region mobilizes many of its proven capabilities; low ER suggests foregone strengths.
The fraction of available adjacent frontiers that are selected as priorities (Exploration Rate, ExR):
High ExR indicates active pursuit of adjacencies; low ExR suggests missed diversification opportunities.
The fraction of priorities that fall outside both IS and AF potential (Stretch Rate, SR):
High SR indicates wishful thinking or high-risk distant exploration; low SR indicates priorities grounded in capability endowments.
2.3.5. Portfolio-Priority Concordance: Alignment and Wishful Gap
To assess how closely regional priority vectors match their pre-policy activity portfolios, we compute two complementary measures as core indicators of strategic alignment.
For every region , let be the region’s vector of topic shares in the final pre-policy year 2020, with components for . The region’s priority vector is defined as:
so that . If a region has no recorded priorities (), we set .
Alignment (cosine similarity):
with if the denominator is zero. This indexes directional agreement between the portfolio and the priority vector on , where 1 indicates perfect alignment.
Wishful gap( divergence):
This captures absolute mismatch on ; smaller values indicate portfolios closer in levels to stated priorities. High alignment and low gap indicate evidence-based, portfolio-grounded selection; low alignment and high gap indicate aspirational or mimicry-driven selection decoupled from capabilities.
2.3.6. Opportunity Cost Index (OCI)
To quantify the extent to which regions leave capability potential “on the table” (foregone opportunities), we define Opportunity Cost Index (OCI) as follows:
measures the share of the region’s pre-policy capability mass (in IS + AF potential topics) that is not selected as a priority. High OCI indicates substantial foregone opportunities; low OCI indicates comprehensive mobilization of available strengths and adjacencies.
2.3.7. Strategic Archetype Classification
We classify regions into four strategic archetypes using a 2×2 matrix crossing POI (capability endowment) with SCZBI (selection behavior). We split both dimensions at the median:
- High POI: (many inside strengths)
- Low POI: (few inside strengths, many adjacencies)
- High SCZBI: (comfort-zone bias)
- Low SCZBI: (frontier exploration)
This yields four archetypes:
- Strength Boosters (high POI, high SCZBI): Many existing strengths, and prioritize them. Deepening narrow specializations, lock-in risk.
- Excelling Perfectionists (high POI, low SCZBI): Strong capability base, but deliberately pursue adjacent frontiers. Optimal related variety strategy.
- Narrow Specialists (low POI, high SCZBI): Limited strengths, yet select non-adjacent or overly ambitious IS. Aspirational priorities with low absorptive capacity.
- Explorers (low POI, low SCZBI): Limited existing strengths, but pursue adjacent opportunities. High-risk growth strategy requiring external support.
3. Results
We present results sequentially following our two research questions. Section 3.1 maps regional capability endowments and their evolution (RQ1), establishing the empirical landscape. Section 3.2 characterizes priority selection behavior and strategic archetypes (RQ2). All analyses use data from 236 NUTS-2 regions, 112 energy topics, 178,314 publications, and 116,336 projects over the period 2014–2025.
3.1. Regional Capability Endowments and Evolution (RQ1)
RQ1 asks what energy capability endowments regions possess and how these evolve over time. We begin by documenting the construction of our capability measures, then present the distribution of Inside Strengths, Adjacent Frontiers, and the Portfolio Opportunity Index, before analyzing portfolio dynamics during the pre-policy period (2014–2020).
3.1.1. Topic Similarity and Relatedness Structure
Using the filtered document-topic probability matrix (310,057 work-topic pairs with probability ≥ 0.70 from an initial 1.84 million pairs), we construct a 112×112 topic similarity matrix capturing technological proximity among energy domains. The filtering substantially reduces noise: only 29.1% of topic pairs exhibit non-zero similarity after applying the 5th-percentile threshold (similarity ≥ 0.0003), indicating that the energy innovation space exhibits clear modular structure rather than uniform interconnectedness. The median non-zero similarity is 0.007, with a right-skewed distribution ranging to 0.99 for highly related pairs such as “Solar photovoltaics” and “Renewable energy systems.” This sparse similarity structure is consistent with the technological relatedness literature [27,40]: energy innovation comprises distinct but partially overlapping domains where knowledge spillovers are selective rather than universal.
The RD measure, which weights topic similarities by regional portfolio composition, exhibits substantial variation (mean = 0.013, median = 0.009, range [0, 1]). This heterogeneity indicates that regions occupy diverse positions in the energy innovation space: some concentrate in tightly connected domains (high RD for many topics), while others pursue scattered, unrelated activities (low RD across the board). This variation provides the foundation for distinguishing inside strengths from adjacent frontiers.
3.1.2. Distribution of Capability Endowments
Table 1 summarizes the distribution of capability endowments across the 236 EU regions in our sample. On average, regions possess inside strength potential in 42 energy topics and adjacent frontier potential in 21.3 topics, yielding a mean POI of 0.655. The median POI (0.695) is slightly higher, indicating a right-skewed distribution: most regions tilt toward exploitation of existing strengths rather than exploration of adjacent opportunities. However, substantial heterogeneity exists, with POI ranging from 0.091 (a region with few proven strengths but many adjacencies) to 1.0 (regions with proven strengths but no identified adjacent opportunities given their portfolio composition). The Gini coefficient of 0.172 suggests moderate inequality in capability profiles—less concentrated than income or patent distributions, but far from uniform.
Figure 2 visualizes this distribution. The histogram reveals a unimodal distribution centered slightly above the midpoint, with a long left tail representing regions that are “opportunity-rich” (many AF_potential, few IS_potential) and a compressed right tail of “strength-rich” regions (many IS_potential, few AF_potential). The median POI = 0.695 (dashed red line) divides the sample into relatively balanced halves, facilitating our subsequent classification of strategic archetypes in Section 3.2.
Table 2 disaggregates capability endowments by POI quartile, revealing stark differences in regional profiles. Quartile 1 (Low POI, mean = 0.368) comprises regions with an inverted portfolio structure: 24.8 inside strengths versus 37.9 adjacent frontiers. These are regions at early stages of energy innovation development or those with shallow but broad portfolios—typified by peripheral or post-transition economies building from limited bases. Quartile 4 (High POI, mean = 0.871) comprises mature energy innovation hubs with deep specialization: 57.2 inside strengths but only 8.6 adjacent frontiers. Notably, the total potential (IS + AF) remains relatively stable across quartiles (62.7 to 65.8 topics), indicating that POI reflects portfolio composition rather than size. This pattern is consistent with life-cycle theories of regional development [6]: regions do not simply accumulate more capabilities monotonically; they transition from broad, shallow adjacency portfolios to narrow, deep strength portfolios as they mature.
Figure 3 plots the trade-off between inside strengths and adjacent frontiers at the regional level, with region labels identifying notable cases. The dashed diagonal line (number of IS equal to the number of AF) marks theoretically balanced portfolios, though the observed data exhibit a clear negative slope, confirming the compositional nature of POI: regions with more inside strengths tend to have fewer adjacent frontiers, and vice versa. Color gradients transition from red (low POI, opportunity-rich) through yellow (moderate POI) to green (high POI, strength-rich), making regional positioning immediately interpretable.
Several patterns emerge. First, the upper-left quadrant contains opportunity-rich regions such as Friesland (NL12), Burgenland (AT11), and Severna Hrvatska (HR06), which possess 50-60+ adjacent frontier topics but relatively few (10-25) established strengths. These represent either peripheral regions building from limited bases or specialized regions with narrow but potentially expandable portfolios. Second, the lower-right quadrant contains strength-rich hubs such as Île-de-France (FR10), Mittelfranken (DE25), and various German Länder, which have accumulated 60-80+ inside strengths but face diminishing adjacent opportunities (fewer than 20 AF topics). These are mature innovation systems approaching portfolio saturation—they possess deep capabilities but limited obvious adjacencies given their existing composition.
Third, the central cluster around the diagonal exhibits moderate POI (yellow/light green), representing regions with balanced or transitional profiles. Notable examples include regions in Sweden (Småland med öarna, SE21), Italy (Abruzzo, ITF1; Sardegna, ITG2), Denmark (Sjælland, DK02), Portugal (Algarve, PT15) which maintain roughly 30-45 topics in both IS and AF categories. These regions may have greater strategic flexibility: they can either consolidate existing strengths or pursue adjacencies without facing binding constraints.
Fourth, extreme outliers merit attention. At the far left, Ionia Nisia (EL62), Luxembourg in Belgium (BE34) and Zeeland (NL34) possess almost no inside strengths (0-2 topics) but moderate adjacent frontiers, indicating very early-stage or highly specialized portfolios. At the far right, no region exceeds approximately 80 inside strengths, suggesting an effective ceiling on capability accumulation even in the most advanced regions. Finally, the negative slope (implied correlation between number of IS and AF) is clearly visible and statistically confirmed (Pearson r = –0.18, p = 0.006), consistent with the compositional interpretation: POI reflects portfolio allocation rather than scale. Regions do not simply accumulate both IS and AF indefinitely; they face implicit trade-offs in directing limited research capacity, talent, and funding.
Figure 4 maps POI across EU regions revealing pronounced geographic clustering that partially contradicts simple core-periphery narratives. Low-POI regions (red/orange, opportunity-rich) concentrate in three distinct clusters. First, a Southeastern European belt encompasses Greece (especially Peloponnese and Central Greece), Bulgaria (most regions except for Southwestern, i.e., with Sofia province), Romania, Croatia and parts of Italy (Sardegna, Umbria, Marche, Abruzzo). Second, a Central European corridor includes Hungary, Eastern Austria, Western Slovakia, Czech Republic, Eastern and Northeastern Poland, and the Baltic states (Lithuania, Latvia). Third, peripheral pockets appear in the Netherlands, Belgium, and Central Norway. These low-POI regions are not innovation deserts—Table 2 shows Q1 regions average 37.9 adjacent frontiers—but they lack established strengths, indicating portfolios dominated by potential rather than proven capabilities.
High-POI regions (green, strength-rich) exhibit clear geographic concentration. Germany displays nearly uniform high POI across all Länder, with particularly strong performance in Bavaria (Oberbayern, Mittelfranken), Baden-Württemberg, Nordrhein-Westfalen, and the former East German regions (Saxony, Thuringia). France shows high POI in Île-de-France, Auvergne-Rhône-Alpes, and Bourgogne. Spain displays a mixed pattern with high POI in Madrid, Catalonia, and Valenciana, but lower POI in La Rioja and Cantabria. Northern and Central Italy (Lombardy, Emilia-Romagna, Veneto, Lazio, Piedmont) exhibit high POI, contrasting sharply with the South. Scandinavia presents a split: north Denmark and Southern Sweden show high POI, while Central Sweden, and Finland exhibit more moderate values. Moderate-POI regions include also much of Western Poland (excluding Lubuskie), Estonia, and part of Ireland. These represent either regions in transition from opportunity-rich to strength-rich profiles, or regions maintaining deliberately balanced portfolios.
The spatial pattern suggests that POI reflects industrial maturity and innovation system thickness [38,39] rather than simple GDP per capita. Notable deviations from wealth-based predictions include: (1) Eastern German regions (Saxony, Thuringia) exhibit high POI despite lower GDP than Western counterparts, likely reflecting inherited industrial capabilities from reunification and targeted Cohesion Policy investments; (2) Parts of wealthy Netherlands and Belgium show surprisingly low POI, potentially due to narrow specialization in non-energy sectors (financial services, logistics); (3) Central European regions (Poland, Czech Republic, Slovakia, Hungary) show within-country heterogeneity, with Western/capital regions exhibiting moderate-to-high POI while Eastern/peripheral regions remain opportunity-rich.
From a policy perspective, this geography has important implications. Low-POI regions in Southeast and Central Europe face a dual challenge: they possess adjacency potential but lack the absorptive capacity [34] to convert it into strengths without sustained support. High-POI regions in Germany, France, and Northern Italy risk lock-in and portfolio saturation—they have deep capabilities but few obvious adjacencies. RIS3 interventions should therefore be differentiated: low-POI regions require capacity-building and foundational investments to activate adjacent frontiers, while high-POI regions need mechanisms to break path-dependencies and re-open exploration [6].
3.1.3. Portfolio Dynamics in the Pre-Policy Period (2014–2020)
Figure 5 tracks portfolio coverage—the fraction of IS and AF potential topics with substantial activity—over the pre-policy period 2014–2020. Mean coverage hovers around 0.59 throughout, indicating that on average, regions actively pursue roughly 60% of their capability space (IS_potential + AF_potential) with above-median research intensity. The 95% confidence bands remain narrow and exhibit no clear temporal trend, consistent with the panel regression results reported below. This stability is notable: despite significant external shocks during this period (Paris Agreement 2015, Clean Energy Package 2016-2019, COVID-19 onset 2020), regional energy innovation portfolios exhibit remarkable inertia.
Table 3 formalizes the visual impression from Figure 5. The year coefficient β = 0.00142 is substantively small (implying a 1-percentage-point increase in coverage over 7 years) and statistically insignificant (p = 0.254). The within-R² of 0.001 confirms that time trends explain virtually none of the variation in coverage after absorbing region fixed effects. We conclude that regional portfolios are static during 2014–2020: there is no evidence of organic broadening or concentration prior to the 2021–2027 policy intervention. This finding has an important implication.
From a substantive standpoint, portfolio inertia suggests that without deliberate policy intervention, regions are unlikely to spontaneously diversify into adjacent energy domains despite possessing the relatedness structure to do so. This locks in path-dependent specializations [6,25] and may perpetuate core-periphery divides. The strong stability of coverage (adjusted R² = 0.248 driven entirely by region fixed effects) implies that portfolio composition is deeply rooted in regional capabilities, institutions, and industrial structures—factors that change slowly absent exogenous shocks. RIS3, by design, aims to be such a shock: a coordinated effort to redirect regional portfolios toward strategic priorities.
3.2. Priority Selection Behavior: Rational, Explorative, or Mimicry? (RQ2)
RQ2 examines how regions select energy priorities under RIS3 2021–2027. The smart specialization literature emphasizes evidence-based entrepreneurial discovery [13,14,37], suggesting regions should align priorities with capability endowments—either by exploiting inside strengths (rational selection) or exploring adjacent frontiers (explorative selection). However, institutional isomorphism theory [19] and recent empirical work [20] suggest that policy mimicry may dominate, with regions “following peers” or “following role models” rather than “following indicators.” We test three competing hypotheses about selection behavior, operationalizing choices through multiple metrics: SCZBI (Selection Comfort-Zone Bias Index), ER/ExR/SR (Exploitation, Exploration, Stretch Rates), and portfolio-priority alignment. Our analysis reveals that while capability endowments exert directional influence on strategy choice (supporting rational and explorative logics), mimicry and wishful thinking dominate in practice, with regions systematically selecting priorities outside their capability space and substituting aspirational targets for evidence-based choices.
3.2.1. Descriptive Overview of Selection Behavior
Table 4 summarizes selection behavior across the 182 EU regions that declared energy priorities in RIS3 2021–2027. The mean Selection Comfort-Zone Bias Index (SCZBI) is 0.231 (median 0.232, range [–1, 1]), indicating a slight population-level tilt toward selecting inside strengths (IS) over adjacent frontiers (AF). However, substantial heterogeneity exists: 25% of regions exhibit SCZBI ≤ 0 (exploration bias), 50% fall between 0 and 0.5 (balanced or moderate comfort-zone bias), and 25% exceed 0.5 (strong comfort-zone bias). This variation suggests diverse strategic orientations—some regions consolidate strengths, others pursue frontiers—consistent with heterogeneous capability profiles documented in RQ1.
Yet beneath this surface diversity lies a striking commonality: universally low mobilization of capability potential. The Exploitation Rate (ER) averages only 6.2% (median 5.5%), meaning regions select as priorities fewer than one-tenth of their available inside strengths. The Exploration Rate (ExR) is similarly anemic at 5.3% (median 3.9%), indicating regions pursue a tiny fraction of their adjacent frontiers. In stark contrast, the Stretch Rate (SR) averages 40.3% (median 37.5%), with 75% of regions exceeding 18.6%. This means that on average, four in ten regional energy priorities fall outside both potential IS and potential AF—domains where regions possess neither demonstrated strength nor adjacency readiness.
Portfolio-priority concordance metrics reinforce this interpretation. Mean alignment is 0.10 (median 0.08), far below moderate concordance (0.5 threshold) and indicating minimal overlap between priorities and pre-policy activity portfolios. The wishful gap averages 1.8 (median 1.9), approaching the theoretical maximum of 2.0 (complete non-overlap). The Opportunity Cost Index (OCI) averages 0.93, revealing that regions leave 93% of their combined IS and AF potential unselected. Taken together, these descriptives suggest that priority selection is largely decoupled from capability endowments: regions neither systematically exploit strengths nor systematically explore adjacencies, but instead allocate the plurality of priorities to distant, aspirational domains.
3.2.2. Strategic Archetype Classification
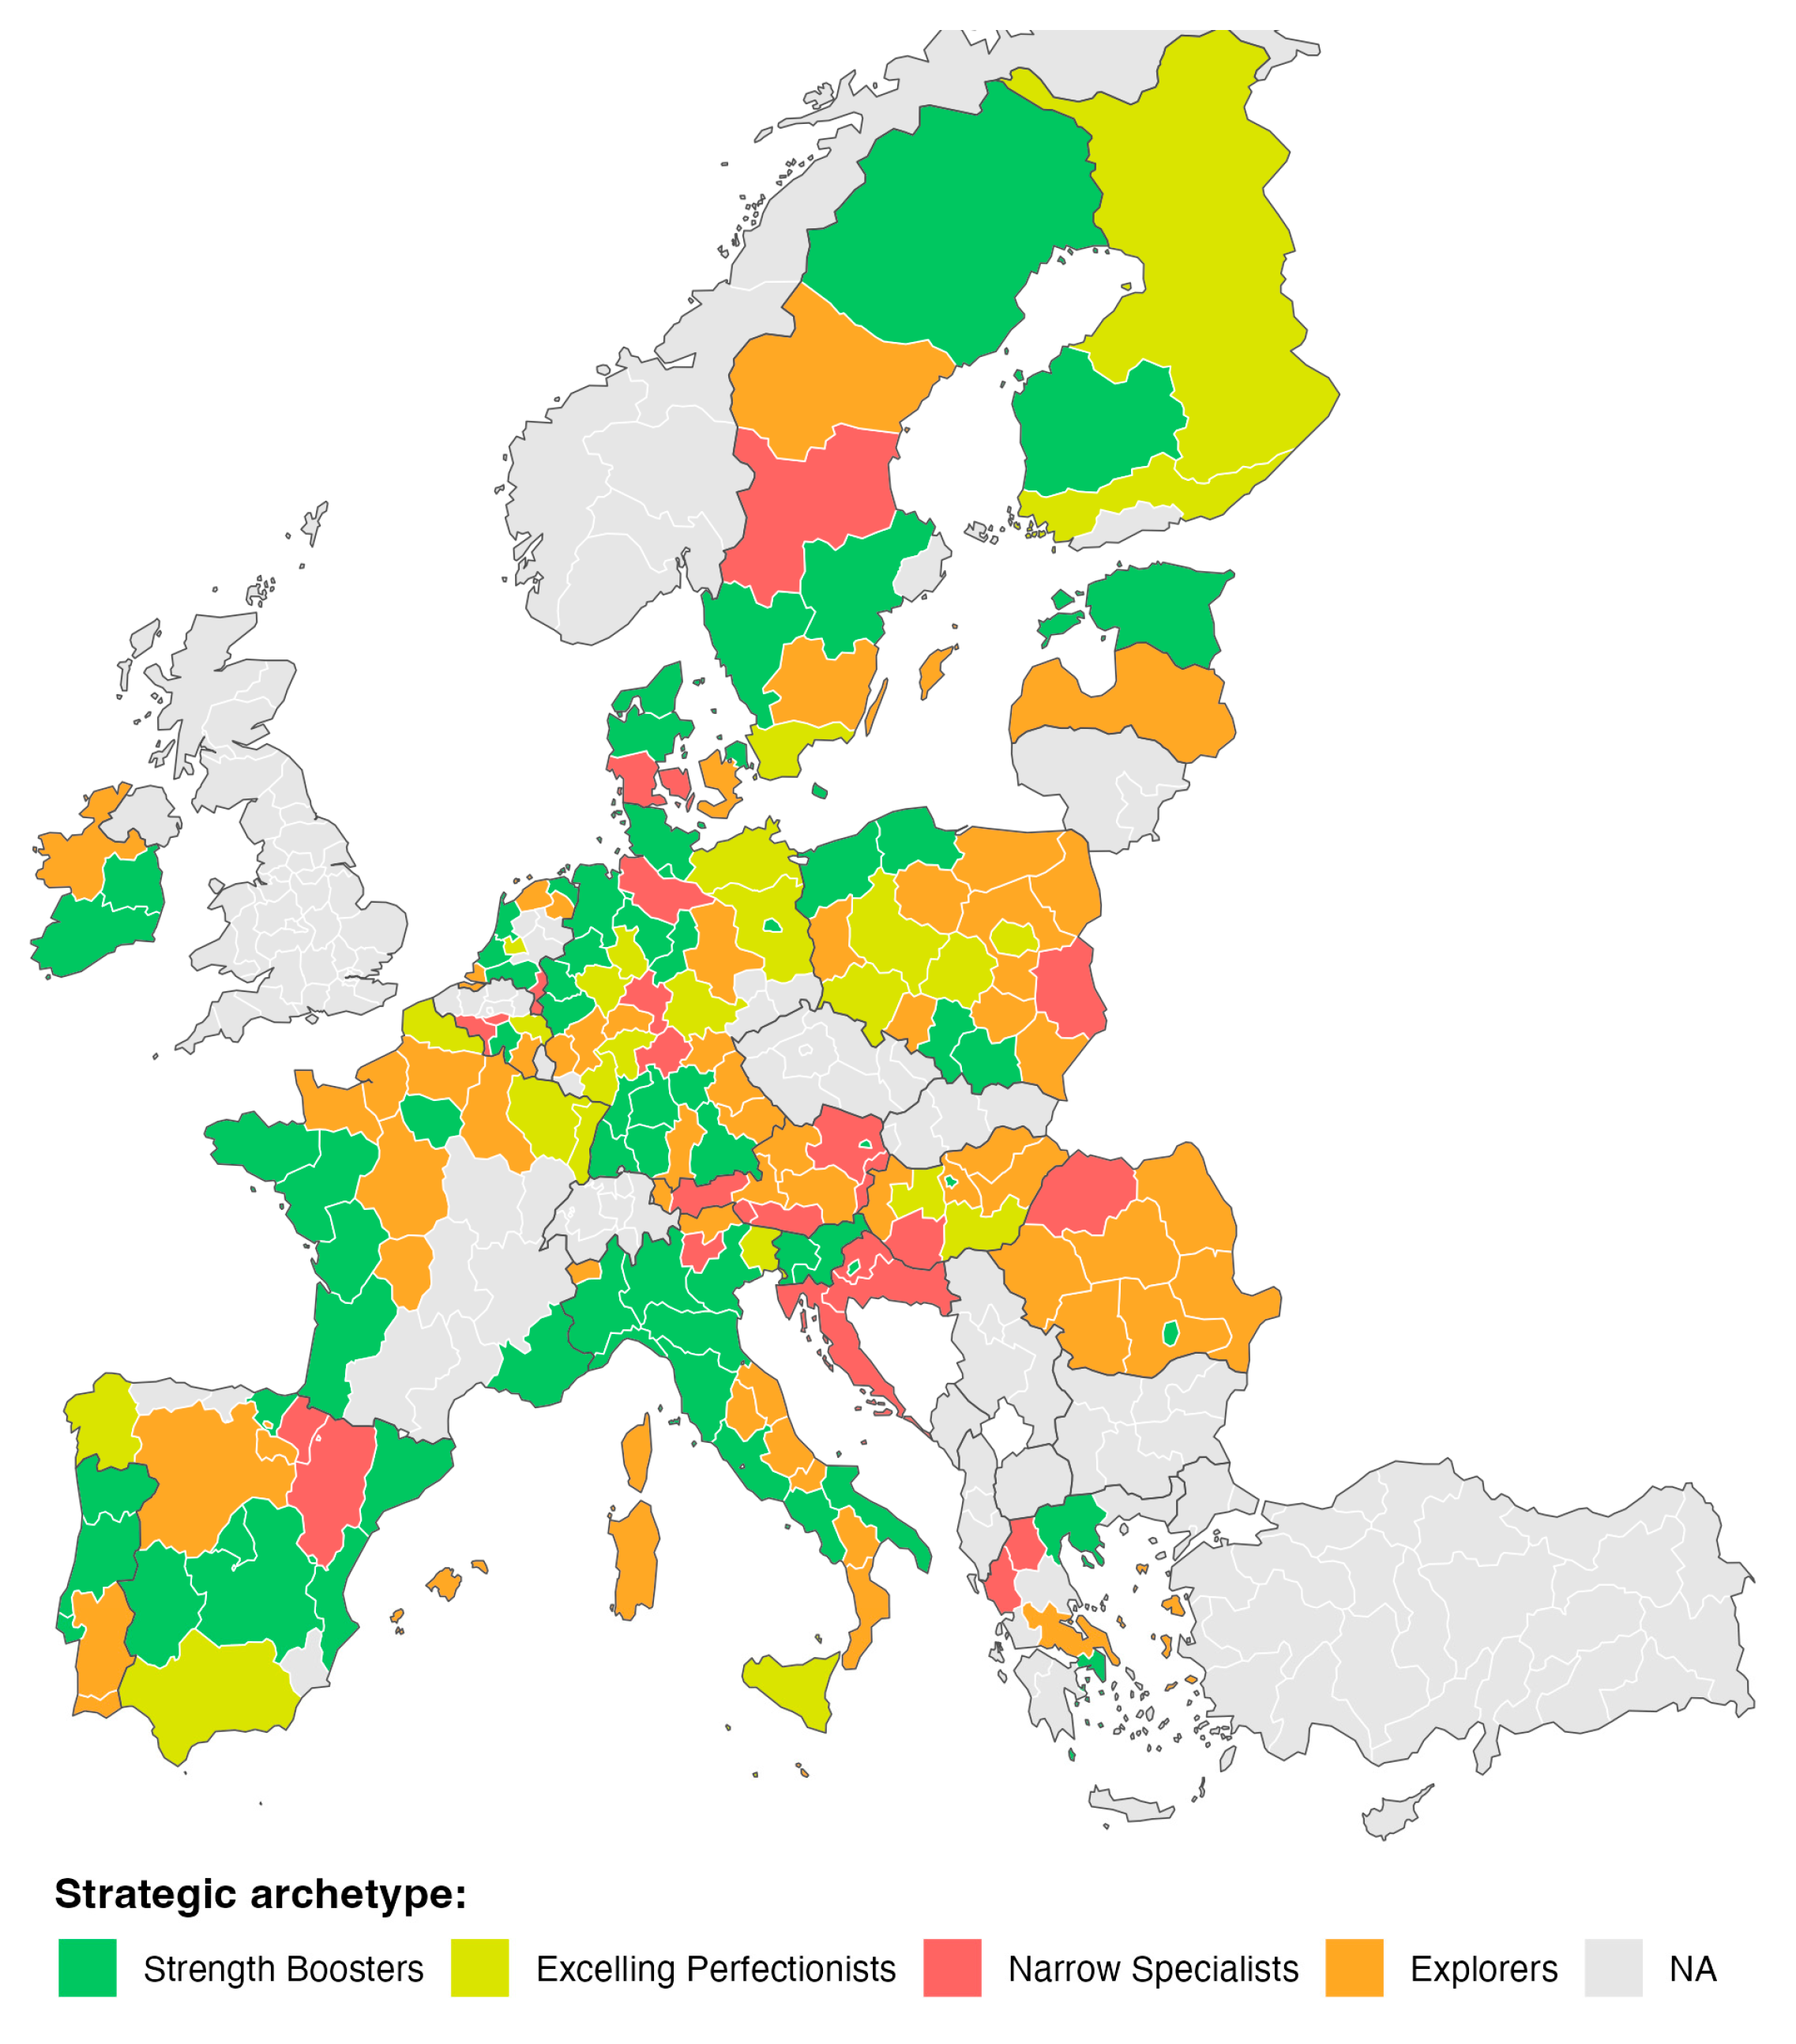
We classify regions into four strategic archetypes (see Figure 1) based on the 2×2 matrix crossing POI (capability endowment) with SCZBI (selection behavior). Table 5 and Figure 10 present the results. Strength Boosters (36.8%, n=67) exhibit high POI and high SCZBI, combining strength-rich portfolios with comfort-zone selection—typified by German Länder (Bayern, Baden-Württemberg), Northern and Western Italy (Piemonte, Lombardia, Veneto, Emilia-Romagna, Toscana, Lazio), Slovenia, Irland, Western France, Central Spain, Northern Portugal. Excelling Perfectionists (13.7%, n=25) combine high POI with low SCZBI, utilizing strong bases to pursue adjacencies—appearing in select German regions, especially in East Germany, some Central and Western Polish regions (Warsaw, Łódzkie, Wielkopolskie, Dolnośląskie), scattered French and Spanish regions, and most of Finland. Narrow Specialists (13.2%, n=24) pair low POI with high SCZBI, attempting ambitious leaps from weak foundations—forming a rather fragmented regions in Central Europe (Austria, Croatia, Lubelskie in Poland, Nord-Vest in Romania), a few regions in Germany, Spain, Belgium, Denmark and Sweden. Explorers (36.3%, n=66) display low POI and low SCZBI, pairing adjacency-rich portfolios with frontier-oriented selection—concentrated in Central and Eastern Europe (Poland, Romania, Bulgaria), Western regions (France, Netherlands, Denmark, Ireland), and parts of Southern Europe (Greece, Southern and Eastern Italy, upper central Spain).
Figure 6.
Strategic archetype spatial map.
However, archetype labels mask a deeper uniformity: all four groups exhibit high Stretch Rates (Table 5, column 7). Strength Boosters dedicate 36.7% to stretch, Excelling Perfectionists, despite low SCZBI implying AF focus, allocate 63.7% of priorities to stretch domains—the highest rate of any archetype. Explorers dedicate 40.6% to stretch, and even Narrow Specialists exhibit “only” 25.3% SR because they also select some IS (ER = 8.3%, highest among archetypes). The implication is that stretch behavior is not deviant but normative: it pervades all strategic orientations, suggesting systemic forces (policy trends, EU narratives, mimicry) shape selection beyond capability logic.
Figure 7 visualizes ER, ExR, and SR by archetype with 95% confidence intervals. The dominant visual feature is the tall orange bars (SR), which overshadow the red (ER) and blue (ExR) bars in all groups. This graphically confirms that regardless of POI or SCZBI, stretch dominates selection. Excelling Perfectionists exhibit the highest SR (64%) despite possessing the strongest capability bases (mean POI = 0.787, Table 5), while Narrow Specialists—paradoxically—show the lowest SR (25%) alongside the highest ER (8.3%). This inversion contradicts expectation: weak-capability regions should not be more grounded in their (limited) strengths than strong-capability regions. The pattern suggests that strong regions feel greater “license to dream,” while weak regions select opportunistically from scarce activity.
3.2.3. Testing Hypotheses on Selection Behavior
We now test three competing hypotheses about the mechanisms driving selection: rational (H1), explorative (H2), or mimicry-driven (H3).
First, we test H1 (Rational Selection Hypothesis), i.e., “Strength-Based Strategies”. If regions engage in evidence-based entrepreneurial discovery [13,14,37], they should align priorities with capability endowments. Regions with many inside strengths (high POI) should exploit them (high SCZBI, Strength Boosters). Regions with few strengths but clear niches (low POI) should focus narrowly on those domains (high SCZBI, Narrow Specialists). Both strategies reflect capability-grounded rationality, yielding a positive or null correlation between POI and SCZBI among comfort-zone-biased regions (upper half of POI × SCZBI space) and high Exploitation Rates (ER > 15%) among high-POI regions. This hypothesis aligns with the “follow the indicators” logic [20].
To test this hypothesis, we analyze the correlation within SCZBI > 0 subsample. We subset to regions exhibiting comfort-zone bias (SCZBI > 0, n = 120) and test whether POI predicts SCZBI intensity. Pearson correlation yields r = 0.374 (p < 0.0001), statistically significant and positive. This supports H1: among regions tilting toward IS selection, those with more inside strengths (high POI) do indeed exhibit stronger comfort-zone bias. However, the correlation is moderate (r < 0.5), and the explained variance (R² = 0.14) is modest, indicating that capability explains only 14% of selection intensity among rational selectors.
Then, we test Exploitation Rate among high-POI regions. We examine mean ER in the top POI quartile (n = 59, POI ≥ 0.82). Mean ER is 6.8% (95% CI: [5.4%, 8.2%]), far below the 15% threshold that would indicate systematic exploitation. Even among the most strength-rich regions, fewer than 7% of available inside strengths are prioritized. H1 is partially supported: capability does predict selection direction (positive r), but not selection magnitude (low ER). Regions exhibit rational orientation (choosing IS over AF when they have more IS) but do not mobilize their strengths at scale.
We now move on to testing hypothesis H2 (Explorative Selection Hypothesis), i.e., “Growth-Oriented Strategies”. It says that regions, alternatively, may pursue exploration over exploitation [28] by targeting adjacent frontiers to build new capabilities through related variety [6]. High-POI regions may branch into adjacencies (low SCZBI, Excelling Perfectionists), while low-POI regions may build from abundant AF potential (low SCZBI, Explorers). Both strategies reflect organizational learning, yielding a positive or null correlation between POI and SCZBI among exploration-biased regions (lower half of POI × SCZBI space) and high Exploration Rates (ExR > 15%) among low-SCZBI regions.
To test this hypothesis, we conduct two tests. First, we analyze correlation within SCZBI < 0 subsample. We subset to regions with exploration bias (SCZBI < 0, n = 62) and test whether POI predicts the intensity of AF selection. Pearson correlation yields r = 0.184 (p = 0.152), positive but statistically insignificant. This provides weak support for H2: among exploratory regions, higher POI is associated with slightly lower exploration bias (less negative SCZBI), consistent with stronger regions having fewer adjacencies to pursue (per Table 2, Q4), but the relationship is not robust.
Then, we test Exploration Rate among low-SCZBI regions. Mean ExR in the exploration-biased subsample (SCZBI < 0) is 7.2% (95% CI: [5.1%, 9.3%]), again far below 15%. Even among regions explicitly tilting toward AF, fewer than one-tenth of adjacent frontiers are selected. H2 is weakly supported: exploration orientation exists (negative SCZBI), but like exploitation, it does not translate into high mobilization rates. Regions prefer AF over IS in their limited selections, but most potential AF remains untapped.
Both rational and explorative selection logics operate directionally—POI correlates with SCZBI as predicted (Figure 8 shows clear quadrant structure)—but neither drives intensive capability mobilization. ER and ExR remain universally low (~5-8%), far below thresholds indicating systematic evidence-based selection. This suggests that while capability exerts weak influence on which type of priority to select (IS vs. AF), it does not determine how much of the capability base to activate. The question becomes: what does determine selection, if not capabilities?
Therefore, we move to the third hypothesis, H3 (Mimicry and Wishful Thinking Hypothesis), i.e., “Capability-Decoupled Selection”. Despite normative aspirations for evidence-based selection, institutional isomorphism [19] and policy mimicry [20] may dominate. Regions may “follow peers” or “follow role models” by selecting globally prominent domains (hydrogen economy, offshore wind, battery storage) regardless of capability fit. This produces low portfolio-priority alignment (<0.3), high wishful gaps (>1.5), high Stretch Rates (>30%), and critically, substitution rather than addition: high SR should crowd out ER and ExR (negative coefficients in regressions) as regions have limited “priority budget” and allocate slots to wishes rather than capabilities.
We run two tests. First, we analyze alignment and gap thresholds. Mean alignment is 0.102 (95% CI: [0.087, 0.117]), far below 0.3 and decisively rejecting the hypothesis that priorities moderately align with portfolios (one-sample t-test vs. μ = 0.3: t = –26.03, p < 0.0001). Mean wishful gap is 1.851 (95% CI: [1.826, 1.877]), exceeding 1.5 and approaching the maximum of 2.0 (t-test vs. μ = 1.5: t = 27.13, p < 0.0001). Mean SR is 40.3% (95% CI: [36.0%, 44.6%]), exceeding 30% (t-test vs. μ = 0.3: t = 4.77, p < 0.0001). All three thresholds are decisively confirmed: priorities are minimally aligned with portfolios, maximally distant in composition, and heavily tilted toward stretch domains.
Figure 9 disaggregates alignment and gap by archetype, revealing that low alignment is universal, not archetype specific. Even Narrow Specialists, who exhibit the highest median alignment (~0.19), remain far below 0.5. Excelling Perfectionists, despite possessing the strongest capability bases (mean POI = 0.787), show the lowest alignment (~0.04)—an inversion suggesting that strong regions feel greater freedom to pursue aspirational pivots. All archetypes exhibit wishful gaps near 2.0, confirming systematic disconnect between priorities and portfolios.
Then, we run test on substitution mechanism. To test whether high SR adds to or substitutes for capability-based selection, we estimate regressions with ER and ExR as dependent variables, including SR as a predictor alongside POI, legacy, and controls (Table 6, Models 1–2).
In Model 1, SR exhibits a large, negative, highly significant coefficient (β = –0.072, p < 0.001). For every 10-percentage-point increase in SR, ER declines by 0.7 percentage points. Given mean ER = 6.2%, this implies that regions at the 75th percentile of SR (57.1%, Table 4) have ER approximately 3 percentage points lower than those at the 25th percentile (18.6%)—a 50% reduction. Critically, POI remains insignificant (β = –0.001, p = 0.959) even after controlling for SR, confirming that capability does not predict exploitation intensity once wishful thinking is accounted for.
In Model 2, SR again exhibits a negative, significant coefficient (β = –0.063, p < 0.001), indicating similar crowding-out of exploration. POI remains insignificant (β = 0.018, p = 0.516). The pattern is consistent: stretch substitutes for, rather than complements, capability-based selection.
Additional controls reveal intriguing patterns. GDP per capita negatively predicts both ER (β = –0.029, p = 0.018) and ExR (β = –0.024, p = 0.149), suggesting wealthier regions select less from their capabilities—consistent with the “license to dream” interpretation. GERD intensity also negatively predicts ExR (β = –0.011, p = 0.020), implying that stronger R&D capacity paradoxically reduces capability mobilization. Legacy exhibits a marginally positive effect on ER (β = 0.023, p = 0.084), hinting at weak learning effects, but the coefficient is small and barely significant.
The regression evidence is unambiguous: regions face a “priority budget” constraint, and when they allocate slots to stretch domains (chasing hydrogen, offshore wind, or other EU policy darlings), they do not also select IS or AF—they instead select wishes. This is not additive but substitutive, indicating that mimicry and wishful thinking crowd out evidence-based selection. The mechanism operates as follows: regions participate in entrepreneurial discovery processes, stakeholder consultations, and strategy workshops, yet the final priority lists reflect aspirations (signaling to EU funders, emulating successful role models, following policy trends) more than grounded capability assessments. As documented in Pylak et al. [20], regions “follow peers” and “follow role models” rather than “follow indicators.”
H3 is strongly supported. Low alignment, high gaps, high SR, and the substitution mechanism all confirm that mimicry/wishful thinking dominates selection in practice, even though rational and explorative logics exert directional influence (H1–2). The positive POI–SCZBI correlation (r = 0.477, Figure 8) initially suggested rationality, but the low absolute ER/ExR rates and strong negative SR coefficients reveal this to be surface rationality masking deeper mimicry. Regions gesture toward their capabilities when choosing between IS and AF but allocate most priorities to neither.
3.2.4. Spatial Patterns and Legacy Effects
Figure 10 maps SCZBI across EU regions, exhibiting prominent spatial clustering that partially reflects, but also complicates, the capability gradient from RQ1. Comfort-zone bias (green, SCZBI > 0.5) concentrates in Ireland, Western France, Northern Italy and Greece, Croatia, Austria, Denmark and partly Sweden. These are mature innovation systems with high POI (Figure 4, RQ1), selecting inside strengths as predicted by H1. Exploration bias (red/orange, SCZBI < 0) appears in scattered regions: Netherlands (Noord-Nederland), France (Corsica, Centre — Val de Loire, Hauts-de-France), Spain (La Rioja), and Sweden (Västerbottens län). Interestingly, the red belt of regions in Germany with low SCZBI scores also has low POI scores, suggesting that these regions are deliberately seeking to explore new areas, even if their internal strengths are not numerous.
Legacy effects are modest. Regions with 2014–2020 energy priorities (Legacy = 1, n = 165) exhibit slightly higher mean SCZBI (0.242 vs. 0.124), ER (6.3% vs. 4.7%), and SR (41.1% vs. 32.7%) than non-legacy regions (n = 17), but t-tests reveal no significant differences (all p > 0.10) except a marginal effect in the ER regression (Table 6, β = 0.023, p = 0.084). This suggests that prior RIS3 experience does not substantially alter selection behavior—both legacy and non-legacy regions engage in high-stretch, low-capability-mobilization prioritization. The lack of a legacy premium in selection implies that regions do not “learn” to select more strategically over successive cycles, or alternatively, that the 2021–2027 period introduced new pressures (European Green Deal, hydrogen economy hype, offshore wind narratives) that reset selection dynamics regardless of history.
4. Discussion and Conclusion
This study set out to understand how EU regions select energy priorities under RIS3 2021–2027, asking whether selection aligns with capability endowments—exploiting inside strengths or exploring adjacent frontiers—or follows other logics such as policy mimicry and aspirational targeting. By constructing a comprehensive empirical landscape of regional energy innovation capabilities and analyzing priority selection behavior across 236 NUTS-2 regions, we uncover a striking pattern: surface rationality masks deep mimicry. While capability endowments exert directional influence on selection (regions with more strengths tilt toward selecting them), this influence is shallow—regions mobilize fewer than 7% of their capabilities and instead allocate 40% of priorities to distant, aspirational domains disconnected from their portfolios. We now place these findings in the broader context of the literature, discuss theoretical and policy implications, acknowledge limitations, and identify directions for future research.
4.1. Key Findings and Contributions
Our analysis yields two sets of integrated findings. First, regarding regional capability endowments (RQ1), the energy innovation space exhibits clear modular structure with only 29% of topic pairs showing non-zero similarity, indicating that technological relatedness shapes feasible diversification pathways as predicted by evolutionary economic geography [6,26]. Substantial heterogeneity exists in regional capability profiles: POI ranges from 0.09 to 1.0, with low-POI regions characterized by many adjacencies but few strengths (opportunity-rich) and high-POI regions exhibiting the reverse (strength-rich). This distribution aligns with life-cycle theories of regional development [38,39], wherein regions transition from broad, shallow portfolios to narrow, deep specializations as they mature.
Critically, portfolios proved remarkably static during 2014–2020 (coverage trend β = 0.0014, p = 0.254), suggesting that organic diversification into adjacent energy domains is rare without deliberate policy intervention. This finding resonates with path-dependence literature emphasizing regional lock-in [41] and the need for exogenous shocks—such as RIS3 policy interventions—to disrupt entrenched trajectories [6]. The absence of pre-trends also strengthens the parallel trends assumption for future causal analyses, as treated and control topics exhibit flat evolution before the 2021 policy window.
Second, regarding priority selection behavior (RQ2), our findings point to a clear conclusion: rational and exploratory logics operate directionally, but mimicry and wishful thinking dominate. Three hypotheses were tested. H1 (rational selection) posited that regions align priorities with capability endowments, with high-POI regions exploiting inside strengths. We find partial support: POI and SCZBI correlate positively (r = 0.477, p < 0.0001), indicating capability influences selection direction. However, this correlation explains only 23% of variance (R² = 0.23), and Exploitation Rates remain dismally low (mean ER = 6.2%), far below the 15% threshold that would indicate systematic mobilization. H2 (explorative selection) proposed that low-POI regions or exploration-biased regions (low SCZBI) would pursue adjacent frontiers. Again, partial support emerges: regions with low SCZBI do exhibit slightly higher Exploration Rates (ExR = 7.2% vs. 4.7% among high-SCZBI regions), but absolute rates remain minimal, and most potential AF goes untapped.
H3 (mimicry and wishful thinking) receives decisive support across multiple tests. First, portfolio-priority alignment is minimal (mean = 0.10, far below the 0.5 threshold for moderate concordance), and wishful gaps approach the theoretical maximum (mean = 1.85 out of 2.0), confirming that priorities are systematically decoupled from pre-policy portfolios. Second, Stretch Rate dominates universally: 40.3% of priorities fall outside both potential IS and potential AF, indicating widespread targeting of aspirational domains. Third, and most critically, high SR substitutes for rather than complements capability-based selection: multivariate regressions reveal that SR negatively predicts both ER (β = –0.072, p < 0.001) and ExR (β = –0.063, p < 0.001), demonstrating that when regions allocate “priority slots” to wishes, they do not also select IS or AF—they select wishes instead. This crowding-out mechanism confirms that regions face a “priority budget” constraint and that mimicry displaces evidence-based selection. Finally, the Opportunity Cost Index averages 0.927, meaning regions leave 93% of their combined IS and AF potential unmobilized—a staggering degree of foregone capability activation.
4.2. Theoretical Implications: Reconceptualizing Smart Specialization
Our findings contribute to three theoretical debates. First, we advance the smart specialization literature by providing the first large-scale empirical test of whether regions “follow the indicators” (capability-grounded selection) or “follow peers” and “follow role models” (mimicry-driven selection), as theorized by Pylak et al. [20]. While Foray et al. [14] and subsequent normative work [13,37] emphasize evidence-based entrepreneurial discovery wherein stakeholders identify regional strengths and adjacencies through data-driven processes, our evidence suggests this vision is not realized in practice for energy priorities in 2021–2027. Instead, regions engage in aspirational positioning: they select globally prominent domains most likely to signal ambition, attract EU co-funding under Horizon Europe and Cohesion Policy instruments, and align with European Commission narratives (i.e., European Green Deal, Fit for 55 package, REPowerEU). This behavior aligns with institutional isomorphism theory [19], wherein organizations adopt similar practices not for efficiency but due to coercive (EU funding conditionality), normative (consultant “best practices”), and mimetic (emulating successful role models) pressures.
Importantly, our finding of surface rationality masking deep mimicry adds a new dimension to the debate. Regions are not entirely irrational—capability does predict selection direction (r = 0.48), and the four strategic archetypes exhibit distinct POI × SCZBI profiles. However, this rationality is shallow: it influences which type of priority to select (IS vs. AF) but does not determine whether to mobilize capabilities at scale. The substitution mechanism (SR crowds out ER/ExR) reveals that mimicry is not merely one force among many but the dominant logic, displacing capability-based selection. This challenges the entrepreneurial discovery paradigm’s assumption that regional stakeholders, when properly engaged, will converge on evidence-based priorities. Our results suggest that even when stakeholder processes occur, the final priority lists reflect political economy dynamics—lobbying by aspirational sectors (hydrogen associations, offshore wind consortia), consultant-driven template strategies, and competitive signaling to EU evaluators—more than grounded capability assessments.
Second, we contribute to evolutionary economic geography by operationalizing and empirically validating the concepts of inside strengths and adjacent frontiers through relatedness density measures. Our finding that regions with high relatedness density to a topic (high RD) face lower barriers to entry aligns with the branching logic [6,27] and related variety mechanisms [30]. However, the disconnect between potential (high AF_potential) and selection (low ExR) reveals a critical gap: adjacency advantages are necessary but insufficient for diversification. Regions may possess the cognitive proximity and knowledge base to branch into adjacent energy domains, yet they systematically fail to prioritize them, instead chasing distant domains. This suggests that policy interventions aiming to catalyze branching—such as RIS3—must do more than identify adjacencies; they must create incentive structures that reward capability-grounded exploration over aspirational leaps. Our Stretch Rate (SR) metric, capturing priorities outside both IS and AF, provides a novel tool for future research to measure “capability distance” and test whether distant diversification attempts succeed or fail.
Third, we inform the policy learning and mimicry literature. Recent work documents that regions emulate peers’ RIS3 priorities [20], import consultant-designed strategies [42,43], and respond to EU Commission signals about “priority sectors” (such as hydrogen, batteries, etc.). Our contribution is to show that mimicry is not confined to what regions select (topic labels) but extends to how they select: by systematically under-mobilizing capabilities (low ER/ExR) and over-allocating to wishes (high SR). This implies that addressing mimicry requires more than diversifying regional strategies (reducing convergence on hydrogen/wind); it requires fundamentally altering the selection process to anchor priorities in absorptive capacity assessments [34]. Without such anchoring, even regions with diverse priority lists may simply be engaging in “diverse wishful thinking.”
4.3. Policy Implications: Rethinking Smart Specialization Design
If RIS3 aims to enable evidence-based entrepreneurial discovery that mobilizes regional strengths and builds on adjacencies [13,14,37], our findings suggest this vision faces severe implementation challenges. Instead of systematic capability activation (which would yield high ER and ExR), we observe aspirational signaling (high SR, low alignment, high OCI). Three policy implications follow.
First, strengthen mechanisms anchoring priorities in capability assessments. Current RIS3 guidelines emphasize stakeholder consultation and entrepreneurial discovery but provide limited tools to ensure selections reflect absorptive capacity. Our Exploitation Rate (ER), Exploration Rate (ExR), and alignment metrics offer actionable indicators that regional authorities and EU evaluators could use to audit strategies. Regions with ER < 10%, ExR < 10%, and alignment < 0.2 should be flagged for revision, as their priorities are demonstrably disconnected from portfolios. Requiring regions to justify each priority by citing pre-existing strengths (publications, patents, firms, projects) or demonstrating adjacency (relatedness density calculations) would impose discipline on selection. Alternatively, performance-based funding could reward regions that show high ER/ExR and low SR in implementation, creating incentives to mobilize capabilities rather than chase headlines.
Second, differentiate policy instruments by strategic archetype. Our typology— Strength Boosters, Excelling Perfectionists, Narrow Specialists, Explorers—reveals that regions occupy distinct positions in capability-selection space, yet EU and national policies often apply uniform instruments (competitive calls, tax credits, cluster programs). Excelling Perfectionists (high POI, low SCZBI), who utilize strong bases to pursue adjacencies, may benefit from challenge-driven innovation instruments (e.g., Horizon Europe Missions) that direct branching toward societal goals. Strength Boosters (high POI, high SCZBI), who deepen narrow specializations, risk lock-in and may require disruption incentives (e.g., funding for radical pivots, support for entrepreneurial entry in unrelated domains). Explorers (low POI, low SCZBI), who build from weak bases into adjacencies, face steep learning curves and may need capacity-building support (training, infrastructure, institutional strengthening) before competitive instruments are effective. Narrow Specialists (low POI, high SCZBI), who attempt distant leaps, should be counseled toward realism: redirecting priorities toward their limited IS or abundant AF rather than pursuing unattainable stretch goals. One-size-fits-all RIS3 implementation ignores these differences.
Third, address systemic mimicry through transparency and benchmarking. If regions “follow peers” due to information asymmetries—uncertain about what constitutes “good” priorities—then publicizing selection metrics (ER, ExR, SR, alignment) for all regions could reduce mimicry by making capability-grounded strategies visible. Creating a RIS3 dashboard showing which regions achieve high ER/ExR (evidence-based selectors) and which exhibit high SR (aspirational selectors), alongside post-policy outcome measures (to be developed in future research), would allow peer learning based on performance rather than headlines. Currently, regions emulate Germany’s hydrogen strategy or Denmark’s offshore wind because these are high-profile, but they lack data on whether such strategies actually worked for those regions’ capabilities. Transparency might shift mimicry from “follow the loudest” to “follow the effective.”
However, we acknowledge a deeper challenge: mimicry may be rational for individual regions even if collectively suboptimal. If EU Horizon Europe and Cohesion Policy funding flows preferentially to regions that signal alignment with Commission priorities (Green Deal, hydrogen economy), then selecting stretch domains maximizes funding probability even if it minimizes capability fit. all regions declare ambitious plans for hydrogen/offshore wind energy, which undermines the credibility of individual declarations, but no region can afford to take a realistic approach and risk losing funding. To solve this problem, the criteria for allocating EU funds need to be reformed to reward alignment of capabilities rather than alignment of narratives—a politically difficult but necessary step.
4.4. Limitations and Boundary Conditions
Our study has several limitations that bound the scope of conclusions. First, we focus on energy domains, which may exhibit unique dynamics given the European Green Deal’s prominence and the hydrogen economy hype during 2019–2021 (when RIS3 2021–2027 strategies were designed). Mimicry pressures may be weaker in less politicized domains (e.g., advanced materials, aggrotech). Future research should replicate our two-dimensional framework (POI and SCZBI) in other sectors to test generalizability.
Second, we measure priorities, not outcomes. Although we show that regions make choices based on aspirations, we do not examine whether such choices lead to innovative actions or whether priorities based on capabilities outperform those based on wishful thinking. This causal question—central to policy design—requires difference-in-differences analysis comparing treated (prioritized) and control (non-prioritized) topics over 2021–2025, which we reserve for future work. If high-SR priorities nonetheless succeed (e.g., because they attract disproportionate EU funding or catalyze entrepreneurial entry), then aspirational selection may be defensible as forward-looking foresight rather than wishful thinking. Conversely, if high-ER/low-SR priorities systematically outperform, this would vindicate the evidence-based paradigm.
Third, our capability measures (potential IS and AF) rely on pre-2021 publication and project activity, which may not capture tacit knowledge, firm capabilities, or human capital stocks. A region with low publication-based POI might nonetheless possess industrial strengths (e.g., manufacturing expertise applicable to energy transitions) not visible in our data. Integrating patent data, firm surveys, or labor market analytics would enrich capability measurement.
Fourth, we cannot directly observe mimicry mechanisms—whether regions copied peers, followed consultants, or responded to EU signals. Survey or interview data on RIS3 strategy formulation processes would complement our revealed-preference analysis.
4.5. Future Research Directions
Our findings open multiple research avenues. First and foremost, causal evaluation of whether priority selection matters for outcomes is needed. Using the difference-in-differences framework, future work should test: (1) Do prioritized topics exhibit faster growth in publication/project activity than non-prioritized topics? (2) Does this effect vary by ER, ExR, SR—i.e., do capability-grounded priorities (high ER, low SR) outperform aspirational priorities (low ER, high SR)? (3) Does strategic archetype moderate impacts—do Excelling Perfectionists’ priorities succeed more than Narrow Specialists’ priorities? Answering these questions would provide empirical evidence on the mimicry debate: if high-SR priorities consistently underperform, policymakers should discourage aspirational targeting; if they succeed, the current practice may be justified.
Second, our two-dimensional framework (capability endowment POI × selection behavior SCZBI) should be extended to other domains and policy cycles. Replicating the analysis for RIS3 2014–2020 (retrospectively) would test whether mimicry intensified or diminished over time. Comparing energy to health, digitalization, or advanced manufacturing would reveal whether Green Deal pressures uniquely drive stretch behavior or whether it is systemic across sectors. Cross-national studies could test whether RIS3 governance quality (stakeholder inclusiveness, data infrastructure, institutional capacity) predicts lower SR and higher ER/ExR, isolating best practices.
Third, the mechanisms underlying mimicry warrant deeper investigation. Why do regions with high POI—possessing abundant inside strengths—nonetheless allocate two-thirds of priorities to stretch domains (Excelling Perfectionists SR = 64%)? Is this strategic foresight (anticipating that current strengths will become obsolete, proactively pivoting) or institutional capture (lobbying by aspirational sectors overwhelming capability evidence)? Case studies comparing high-ER and high-SR regions within the same country (controlling for national institutions) could illuminate micro-level dynamics. Similarly, understanding why Narrow Specialists exhibit the lowest SR (25%) despite lacking capabilities—seemingly the most “grounded” archetype—requires qualitative work. Our interpretation is that weak regions select opportunistically from scarce activity, but alternative explanations (e.g., smaller strategy teams unable to articulate stretch ambitions) merit exploration.
Fourth, the role of legacy (prior RIS3 experience) deserves attention. We found no significant legacy effects on selection behavior, suggesting regions do not “learn” to select more strategically over successive cycles. However, legacy may matter for implementation rather than selection: experienced regions may translate priorities into activity more effectively even if their selection behavior is equally aspirational. Testing whether legacy moderates the priority-to-outcome relationship (DiD estimates of treatment effects) would clarify whether experience compensates for wishful thinking through superior governance.
Fifth, the normative question of whether mimicry is “bad” remains open. If all regions pursue hydrogen and offshore wind, collective overinvestment may occur, but if EU funding scales to match demand, individual regions may rationally compete for shares. Modeling the equilibrium of the priority-selection game—wherein regions signal alignment with EU trends, the EU allocates funding based on those signals, and post-hoc some regions succeed while others fail—would formalize the strategic dynamics. Our descriptive evidence documents widespread stretch behavior; game-theoretic analysis could explain why it persists and what policy reforms would shift equilibria toward capability-grounded selection.
4.6. Concluding Remarks
This study provides the first comprehensive empirical portrait of how EU regions select energy priorities under RIS3 2021–2027, revealing a landscape where capability endowments shape strategic orientation, but mimicry and aspirational targeting dominate selection outcomes. Regions leave 93% of their inside strengths and adjacent frontiers not mobilized, instead allocating 40% of priorities to distant domains disconnected from portfolios, with stretch behavior substituting for rather than complementing evidence-based choices. While the entrepreneurial discovery paradigm envisions regional stakeholders converging on capability-grounded priorities through data-driven processes, the reality is that EU policy narratives (Green Deal, hydrogen economy), competitive funding pressures, and institutional mimicry produce strategies that signal ambition more than they mobilize absorption capacity.
These findings challenge policymakers to rethink smart specialization design. Without mechanisms anchoring priorities in capability assessments—auditing ER/ExR rates, requiring justifications based on relatedness density, rewarding performance over promises—RIS3 risks devolving into aspirational signaling contests where regions compete to claim the most fashionable domains regardless of fit. Differentiated instruments by strategic archetype, transparency through public benchmarking, and reformed EU funding criteria that reward capability alignment could mitigate mimicry pressures. Yet we also recognize that individual regions may rationally engage in mimicry if it maximizes funding access, pointing to a collective action problem that requires coordinated policy reform at the EU level.
For scholars, our two-dimensional framework—operationalizing capability endowments (POI) and selection behavior (SCZBI) to classify regions into strategic archetypes—offers a replicable template for evaluating RIS3. The Exploitation Rate, Exploration Rate, Stretch Rate, and alignment metrics provide concrete indicators to audit whether strategies “follow indicators” or “follow peers,” moving the smart specialization literature from normative prescription toward empirical evaluation. Future research should test whether capability-grounded priorities outperform aspirational ones, providing the causal evidence needed to settle the debate between evidence-based and mimicry-driven regional innovation policy.
The energy transition represents one of the defining challenges of the 21st century, demanding coordinated action across EU regions to decarbonize economies while maintaining competitiveness. Smart specialization, in principle, could enable this by directing regions toward energy domains where they possess competitive advantages and realistic prospects for global leadership. Our findings suggest that realizing this potential requires confronting uncomfortable truths: current practice prioritizes signaling over substance, aspiration over absorption, and headlines over capabilities. Bridging the gap between the normative vision of evidence-based entrepreneurial discovery and the empirical reality of mimicry-driven selection is the central challenge for the next generation of smart specialization policy.
Author Contributions
Conceptualization, KP; methodology, KP, AG; software, KP, AG, PG, DH; validation, KP, AG, PG, DH; formal analysis, KP, AG; investigation, KP, AG, PG, DH; resources, AG; data curation, AG; writing—original draft preparation, KP, AG, PG, DH; writing—review and editing, KP, AG, PG, DH; visualization, KP; supervision, KP; project administration, KP; funding acquisition, KP, AG, PG, DH. All authors have read and agreed to the published version of the manuscript.
Funding
This research received no external funding.
Data Availability Statement
The data used in this study is publicly available.
Acknowledgments
Open Access funding provided by the Lublin University of Technology.
Conflicts of Interest
The authors declare no conflicts of interest.
References
- Schanes, K.; Jäger, J.; Drummond, P. Three Scenario Narratives for a Resource-Efficient and Low-Carbon Europe in 2050. Ecological Economics 2019, 155, 70–79. [Google Scholar] [CrossRef]
- DeCotis, P.A.; Cartwright, E.D. The Transition to a Low-Carbon Economy. Climate and Energy 2022, 39, 13–17. [Google Scholar] [CrossRef]
- Labianca, M.; Faccilongo, N.; Monarca, U.; Lombardi, M. A Location Model for the Agro-Biomethane Plants in Supporting the REPowerEU Energy Policy Program. Sustainability 2023, 16, 215. [Google Scholar] [CrossRef]
- Farole, T.; Rodríguez-Pose, A.; Storper, M. Cohesion Policy in the European Union: Growth, Geography, Institutions. JCMS Journal of Common Market Studies 2011, 49, 1089–1111. [Google Scholar] [CrossRef]
- Cai, Y.; Etzkowitz, H. Theorizing the Triple Helix Model: Past, Present, and Future. Triple Helix Journal 2020, 7, 189–226. [Google Scholar] [CrossRef]
- Boschma, R. Relatedness as Driver of Regional Diversification: A Research Agenda. Regional Studies 2017, 51, 351–364. [Google Scholar] [CrossRef]
- Careri, F.; Efthimiadis, T.; Masera, M. 2020–2022: Pivotal Years for European Energy Infrastructure. Energies 2022, 15, 1999. [Google Scholar] [CrossRef]
- Rodríguez-Pose, A.; Di Cataldo, M. Quality of Government and Innovative Performance in the Regions of Europe. Journal of Economic Geography 2015, 15, 673–706. [Google Scholar] [CrossRef]
- Charron, N.; Lapuente, V.; Annoni, P. Measuring Quality of Government in EU Regions across Space and Time. Papers in Regional Science 2019, 98, 1925–1953. [Google Scholar] [CrossRef]
- Rodríguez-Pose, A. Innovation Prone and Innovation Averse Societies: Economic Performance in Europe. Growth and Change 1999, 30, 75–105. [Google Scholar] [CrossRef]
- McCann, P.; Ortega-Argilés, R. The Early Experience of Smart Specialization Implementation in EU Cohesion Policy. null 2016, 24, 1407–1427. [Google Scholar] [CrossRef]
- Gianelle, C.; Kyriakou, D.; McCann, P.; Morgan, K. Smart Specialisation on the Move: Reflections on Six Years of Implementation and Prospects for the Future. null 2020, 54, 1323–1327. [Google Scholar] [CrossRef]
- Foray, D. From Smart Specialisation to Smart Specialisation Policy. European Journal of Innovation Management 2014, 17, 492–507. [Google Scholar] [CrossRef]
- Foray, D.; David, P.A.; Hall, B. Smart Specialisation – the Concept. Knowledge Economists Policy Brief 2009, 9, 1–5. [Google Scholar]
- McCann, P.; Ortega-Argilés, R. Smart Specialization, Regional Growth and Applications to European Union Cohesion Policy. Regional Studies 2015, 49, 1291–1302. [Google Scholar] [CrossRef]
- Kroll, H. Efforts to Implement Smart Specialization in Practice—Leading Unlike Horses to the Water. European Planning Studies 2015, 23, 2079–2098. [Google Scholar] [CrossRef]
- Capello, R.; Kroll, H. From Theory to Practice in Smart Specialization Strategy: Emerging Limits and Possible Future Trajectories. European Planning Studies 2016, 24, 1393–1406. [Google Scholar] [CrossRef]
- Di Cataldo, M.; Monastiriotis, V.; Rodríguez-Pose, A. How ‘Smart’ Are Smart Specialization Strategies? JCMS: Journal of Common Market Studies 2020, 1–27. [CrossRef]
- DiMaggio, P.J.; Powell, W.W. The Iron Cage Revisited: Institutional Isomorphism and Collective Rationality in Organizational Fields. American Sociological Review 1983, 48, 147–160. [Google Scholar] [CrossRef]
- Pylak, K.; Deegan, J.; Broekel, T. Smart Specialisation or Smart Following? A Study of Policy Mimicry in Priority Domain Selection. Regional Studies 2025, 59, 2429626. [Google Scholar] [CrossRef]
- Calvo-Gallardo, E.; Arranz, N.; Arróyabe, J.C.F. de Contribution of the Horizon2020 Program to the Research and Innovation Strategies for Smart Specialization in Coal Regions in Transition: The Spanish Case. Sustainability 2022, 14, 2065. [Google Scholar] [CrossRef]
- Geels, F.W. Technological Transitions as Evolutionary Reconfiguration Processes: A Multi-Level Perspective and a Case-Study. Research Policy 2002, 31, 1257–1274. [Google Scholar] [CrossRef]
- Geels, F.W. The Multi-Level Perspective on Sustainability Transitions: Responses to Seven Criticisms. Environmental Innovation and Societal Transitions 2011, 1, 24–40. [Google Scholar] [CrossRef]
- Pylak, K.; Pizoń, J.; Łazuka, E. Evolution of Regional Innovation Strategies Towards the Transition to Green Energy in Europe 2014–2027. Energies 2024, 17, 1–25. [Google Scholar] [CrossRef]
- Hassink, R.; Gong, H. Six Critical Questions about Smart Specialization. European Planning Studies 2019. [Google Scholar] [CrossRef]
- Neffke, F.; Henning, M.; Boschma, R. How Do Regions Diversify over Time? Industry Relatedness and the Development of New Growth Paths in Regions. Economic Geography 2011, 87, 237–265. [Google Scholar] [CrossRef]
- Balland, P.-A.; Boschma, R.; Crespo, J.; Rigby, D. Smart Specialization Policy in the European Union: Relatedness, Knowledge Complexity and Regional Diversification. Regional Studies 2019, 53, 1252–1268. [Google Scholar] [CrossRef]
- March, J.G. Exploration and Exploitation in Organizational Learning. Organization Science 1991, 2, 71–87. [Google Scholar] [CrossRef]
- Boschma, R.; Iammarino, S. Related Variety, Trade Linkages, and Regional Growth in Italy. Economic Geography 2009, 85, 289–311. [Google Scholar] [CrossRef]
- Frenken, K.; Van Oort, F.; Verburg, T. Related Variety, Unrelated Variety and Regional Economic Growth. Regional Studies 2007, 41, 685–697. [Google Scholar] [CrossRef]
- Boschma, R.; Capone, G. Institutions and Diversification: Related versus Unrelated Diversification in a Varieties of Capitalism Framework. Research Policy 2015, 44, 1902–1914. [Google Scholar] [CrossRef]
- Fritsch, M.; Kublina, S. Related Variety, Unrelated Variety and Regional Growth: The Role of Absorptive Capacity and Entrepreneurship. Reg Stud 2017, 1–12. [Google Scholar] [CrossRef]
- Pinheiro, F.L.; Hartmann, D.; Boschma, R.; Hidalgo, C.A. The Time and Frequency of Unrelated Diversification. Research Policy 2021, 104323. [Google Scholar] [CrossRef]
- Cohen, W.M.; Levinthal, D.A. Absorptive Capacity: A New Perspective on Learning and Innovation. Administrative Science Quarterly 1990, 35, 128–152. [Google Scholar] [CrossRef]
- Deegan, J.; Broekel, T.; Fitjar, R.D. Searching through the Haystack: The Relatedness and Complexity of Priorities in Smart Specialization Strategies. null 2021, 1–24. [Google Scholar] [CrossRef]
- Jacobs, J. The Economy of Cities; A Vintage book, V-584; Random House: New York, 1969; ISBN 978-0-394-42296-1. [Google Scholar]
- Foray, D. Smart Specialisation: Opportunities and Challenges for Regional Innovation Policy; Routledge: Abingdon, 2015. [Google Scholar]
- Tödtling, F.; Asheim, B.; Boschma, R. Knowledge Sourcing, Innovation and Constructing Advantage in Regions of Europe. European Urban and Regional Studies 2013, 20, 161–169. [Google Scholar] [CrossRef]
- Asheim, B.; Smith, H.L.; Oughton, C. Regional Innovation Systems: Theory, Empirics and Policy. Regional Studies 2011, 45, 875–891. [Google Scholar] [CrossRef]
- Boschma, R.; Balland, P.-A.; Kogler, D.F. Relatedness and Technological Change in Cities: The Rise and Fall of Technological Knowledge in US Metropolitan Areas from 1981 to 2010. Industrial and Corporate Change 2015, 24, 223–250. [Google Scholar] [CrossRef]
- Martin, R.; Sunley, P. Path Dependence and Regional Economic Evolution. Journal of Economic Geography 2006, 6, 395–437. [Google Scholar] [CrossRef]
- Grillitsch, M.; Asheim, B.; Trippl, M. Unrelated Knowledge Combinations: The Unexplored Potential for Regional Industrial Path Development. Cambridge Journal of Regions, Economy and Society 2018, 11, 257–274. [Google Scholar] [CrossRef]
- Grillitsch, M.; Hansen, T. Green Industry Development in Different Types of Regions. European Planning Studies 2019, 27. [Google Scholar] [CrossRef]
Figure 1.
Regional strategic archetypes in RIS3 energy priorities. Classification based on capability endowment and selection behavior.
Figure 1.
Regional strategic archetypes in RIS3 energy priorities. Classification based on capability endowment and selection behavior.
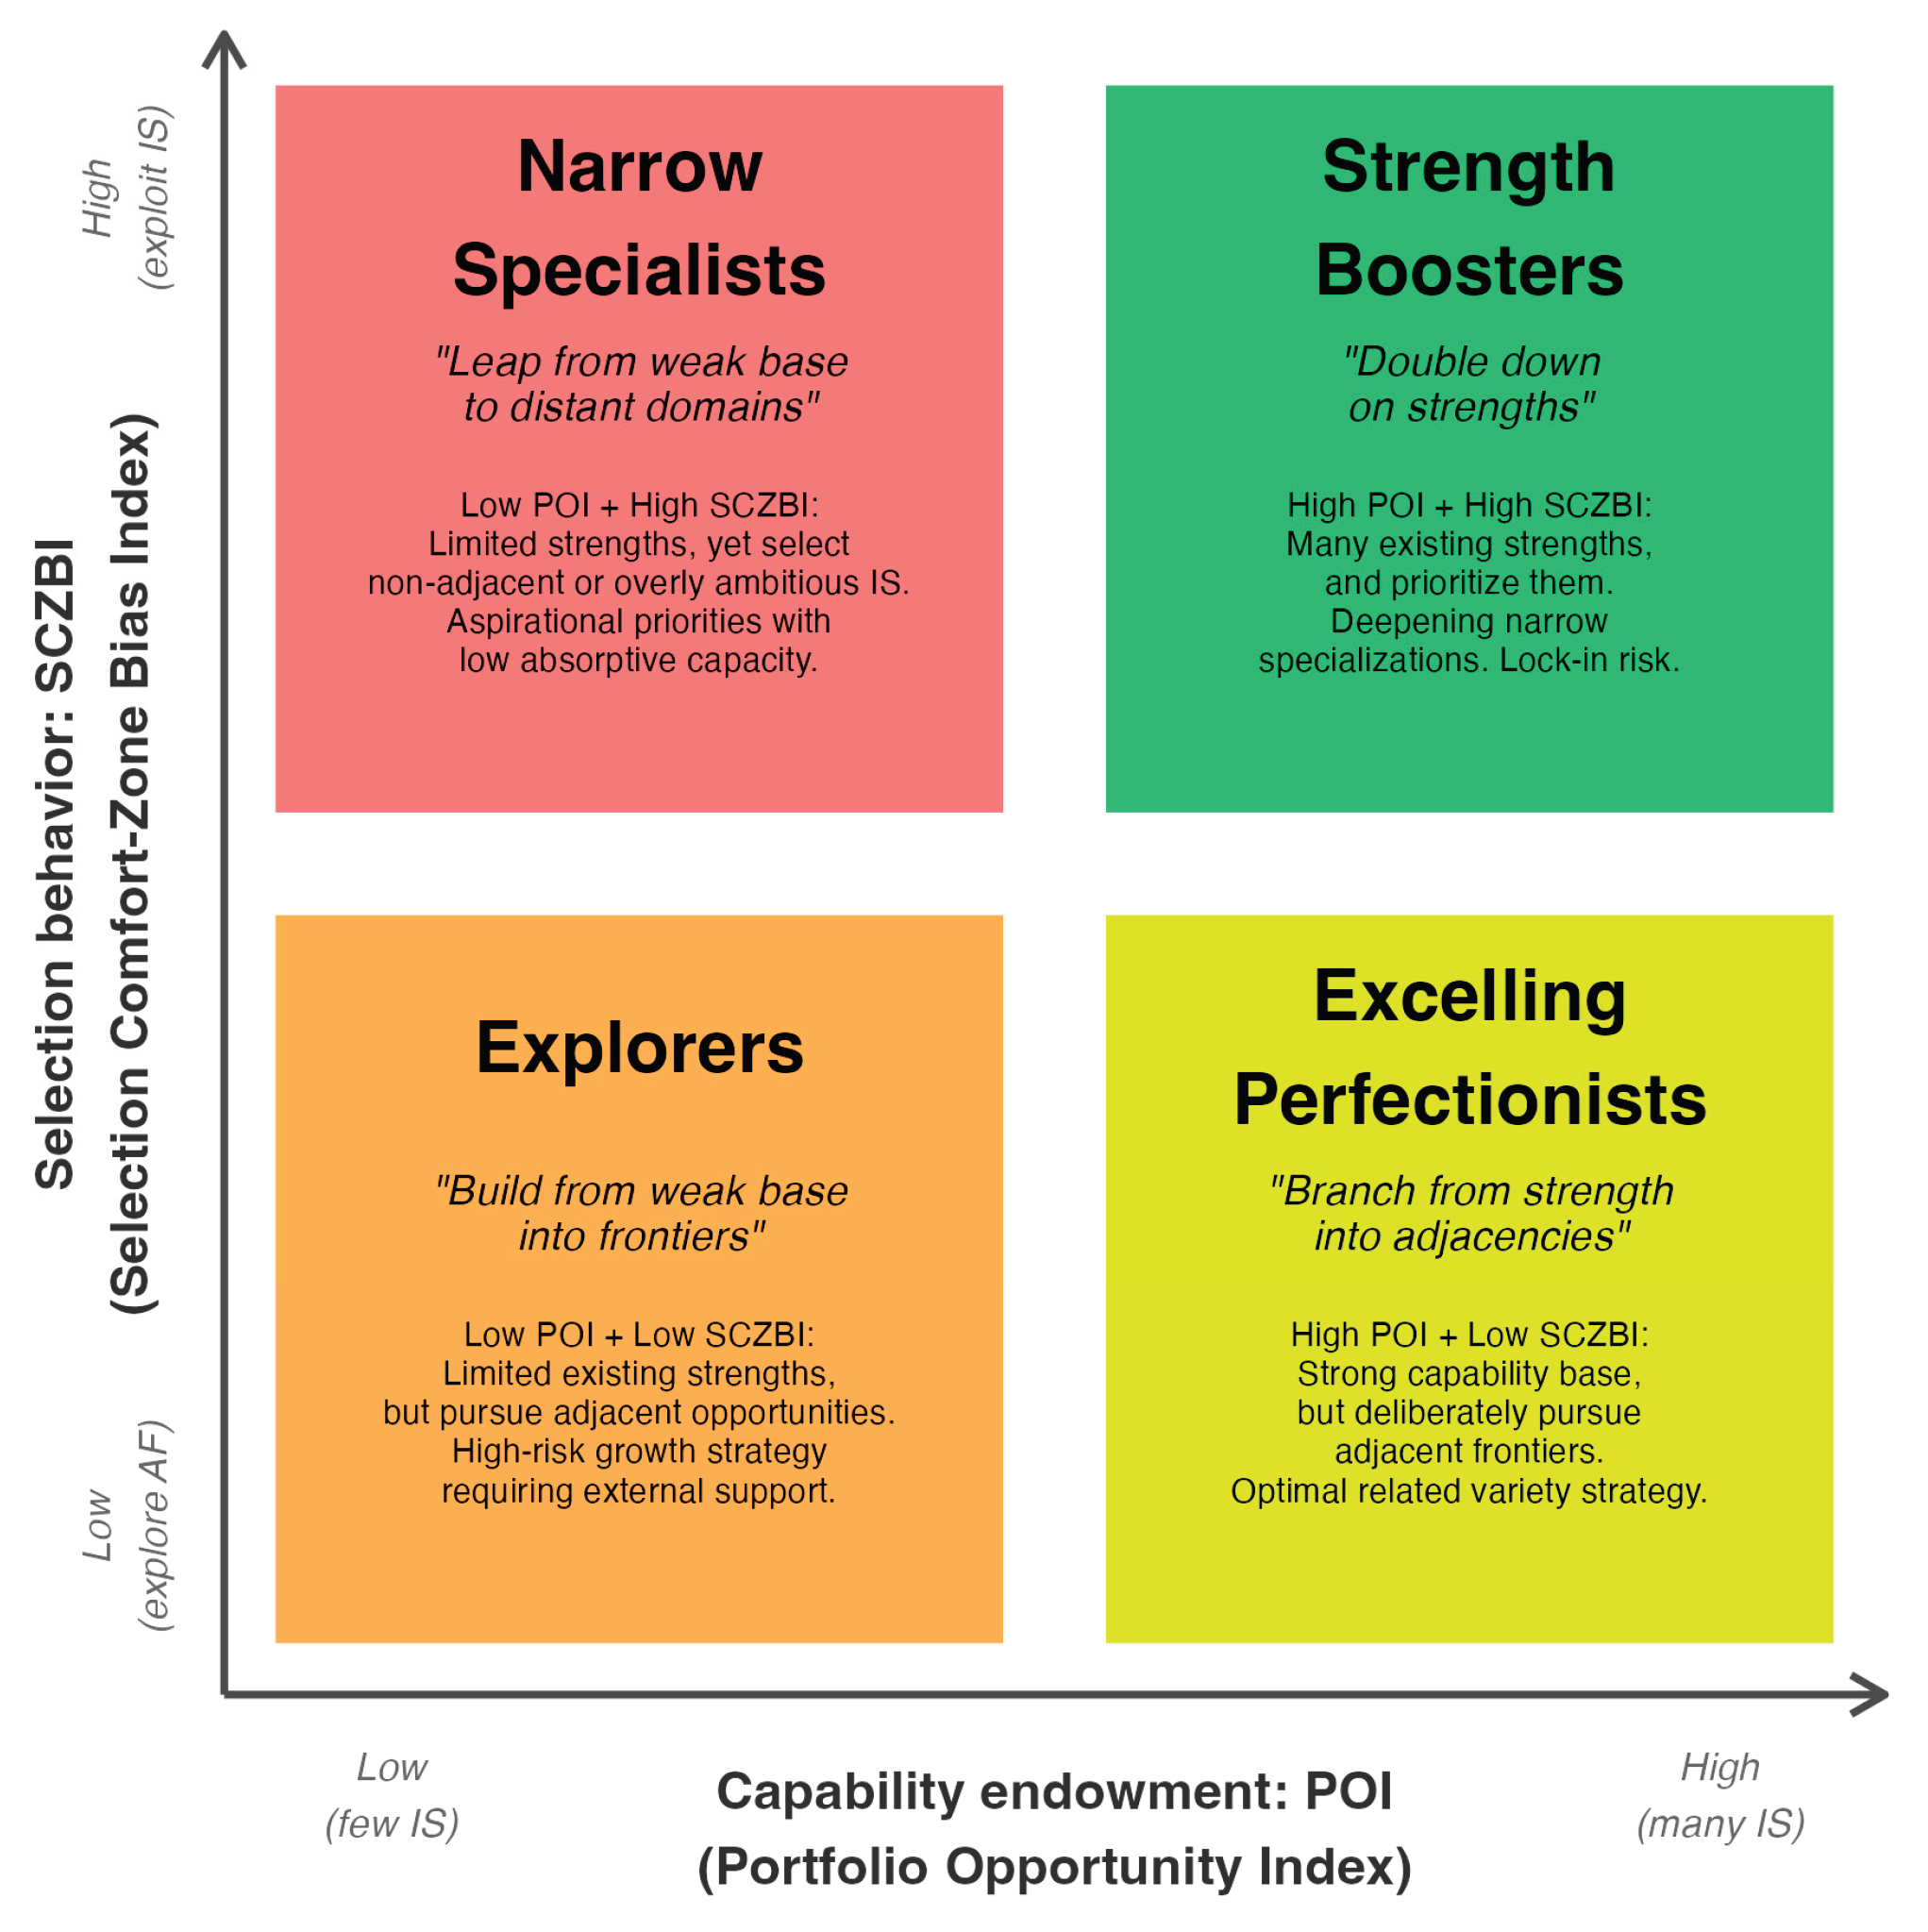
Figure 2.
Distribution of Portfolio Opportunity Index (POI) across EU regions.
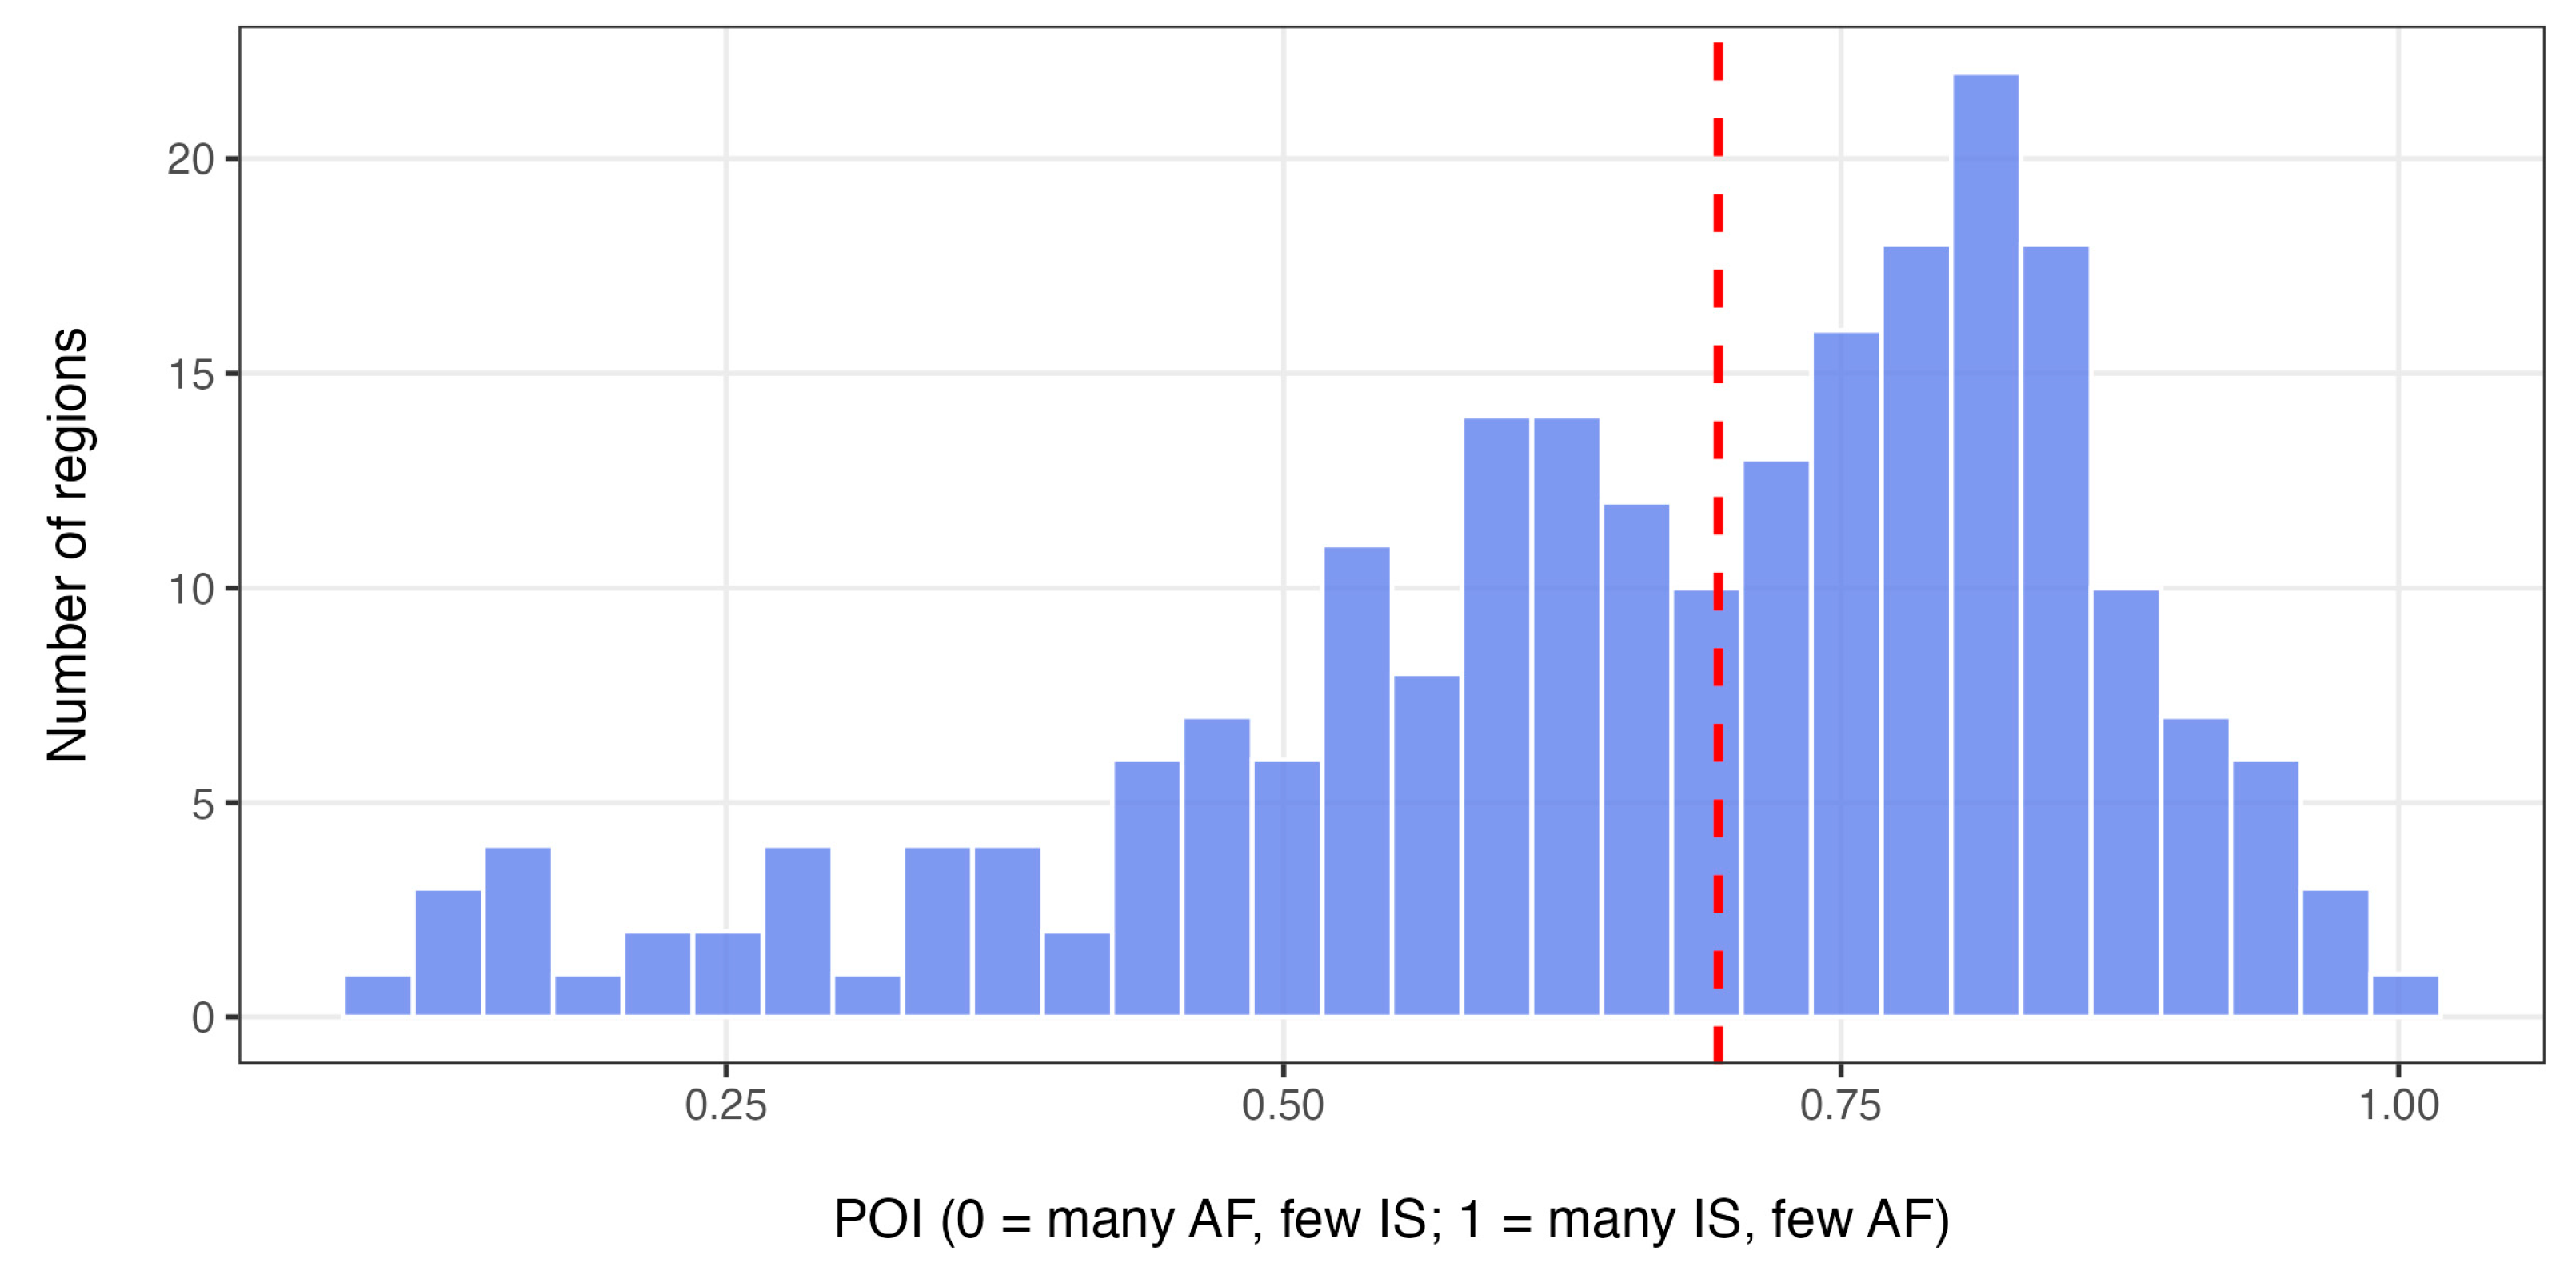
Figure 3.
Regional capability profiles: Inside Strengths (IS) vs. Adjacent Frontiers (AF).
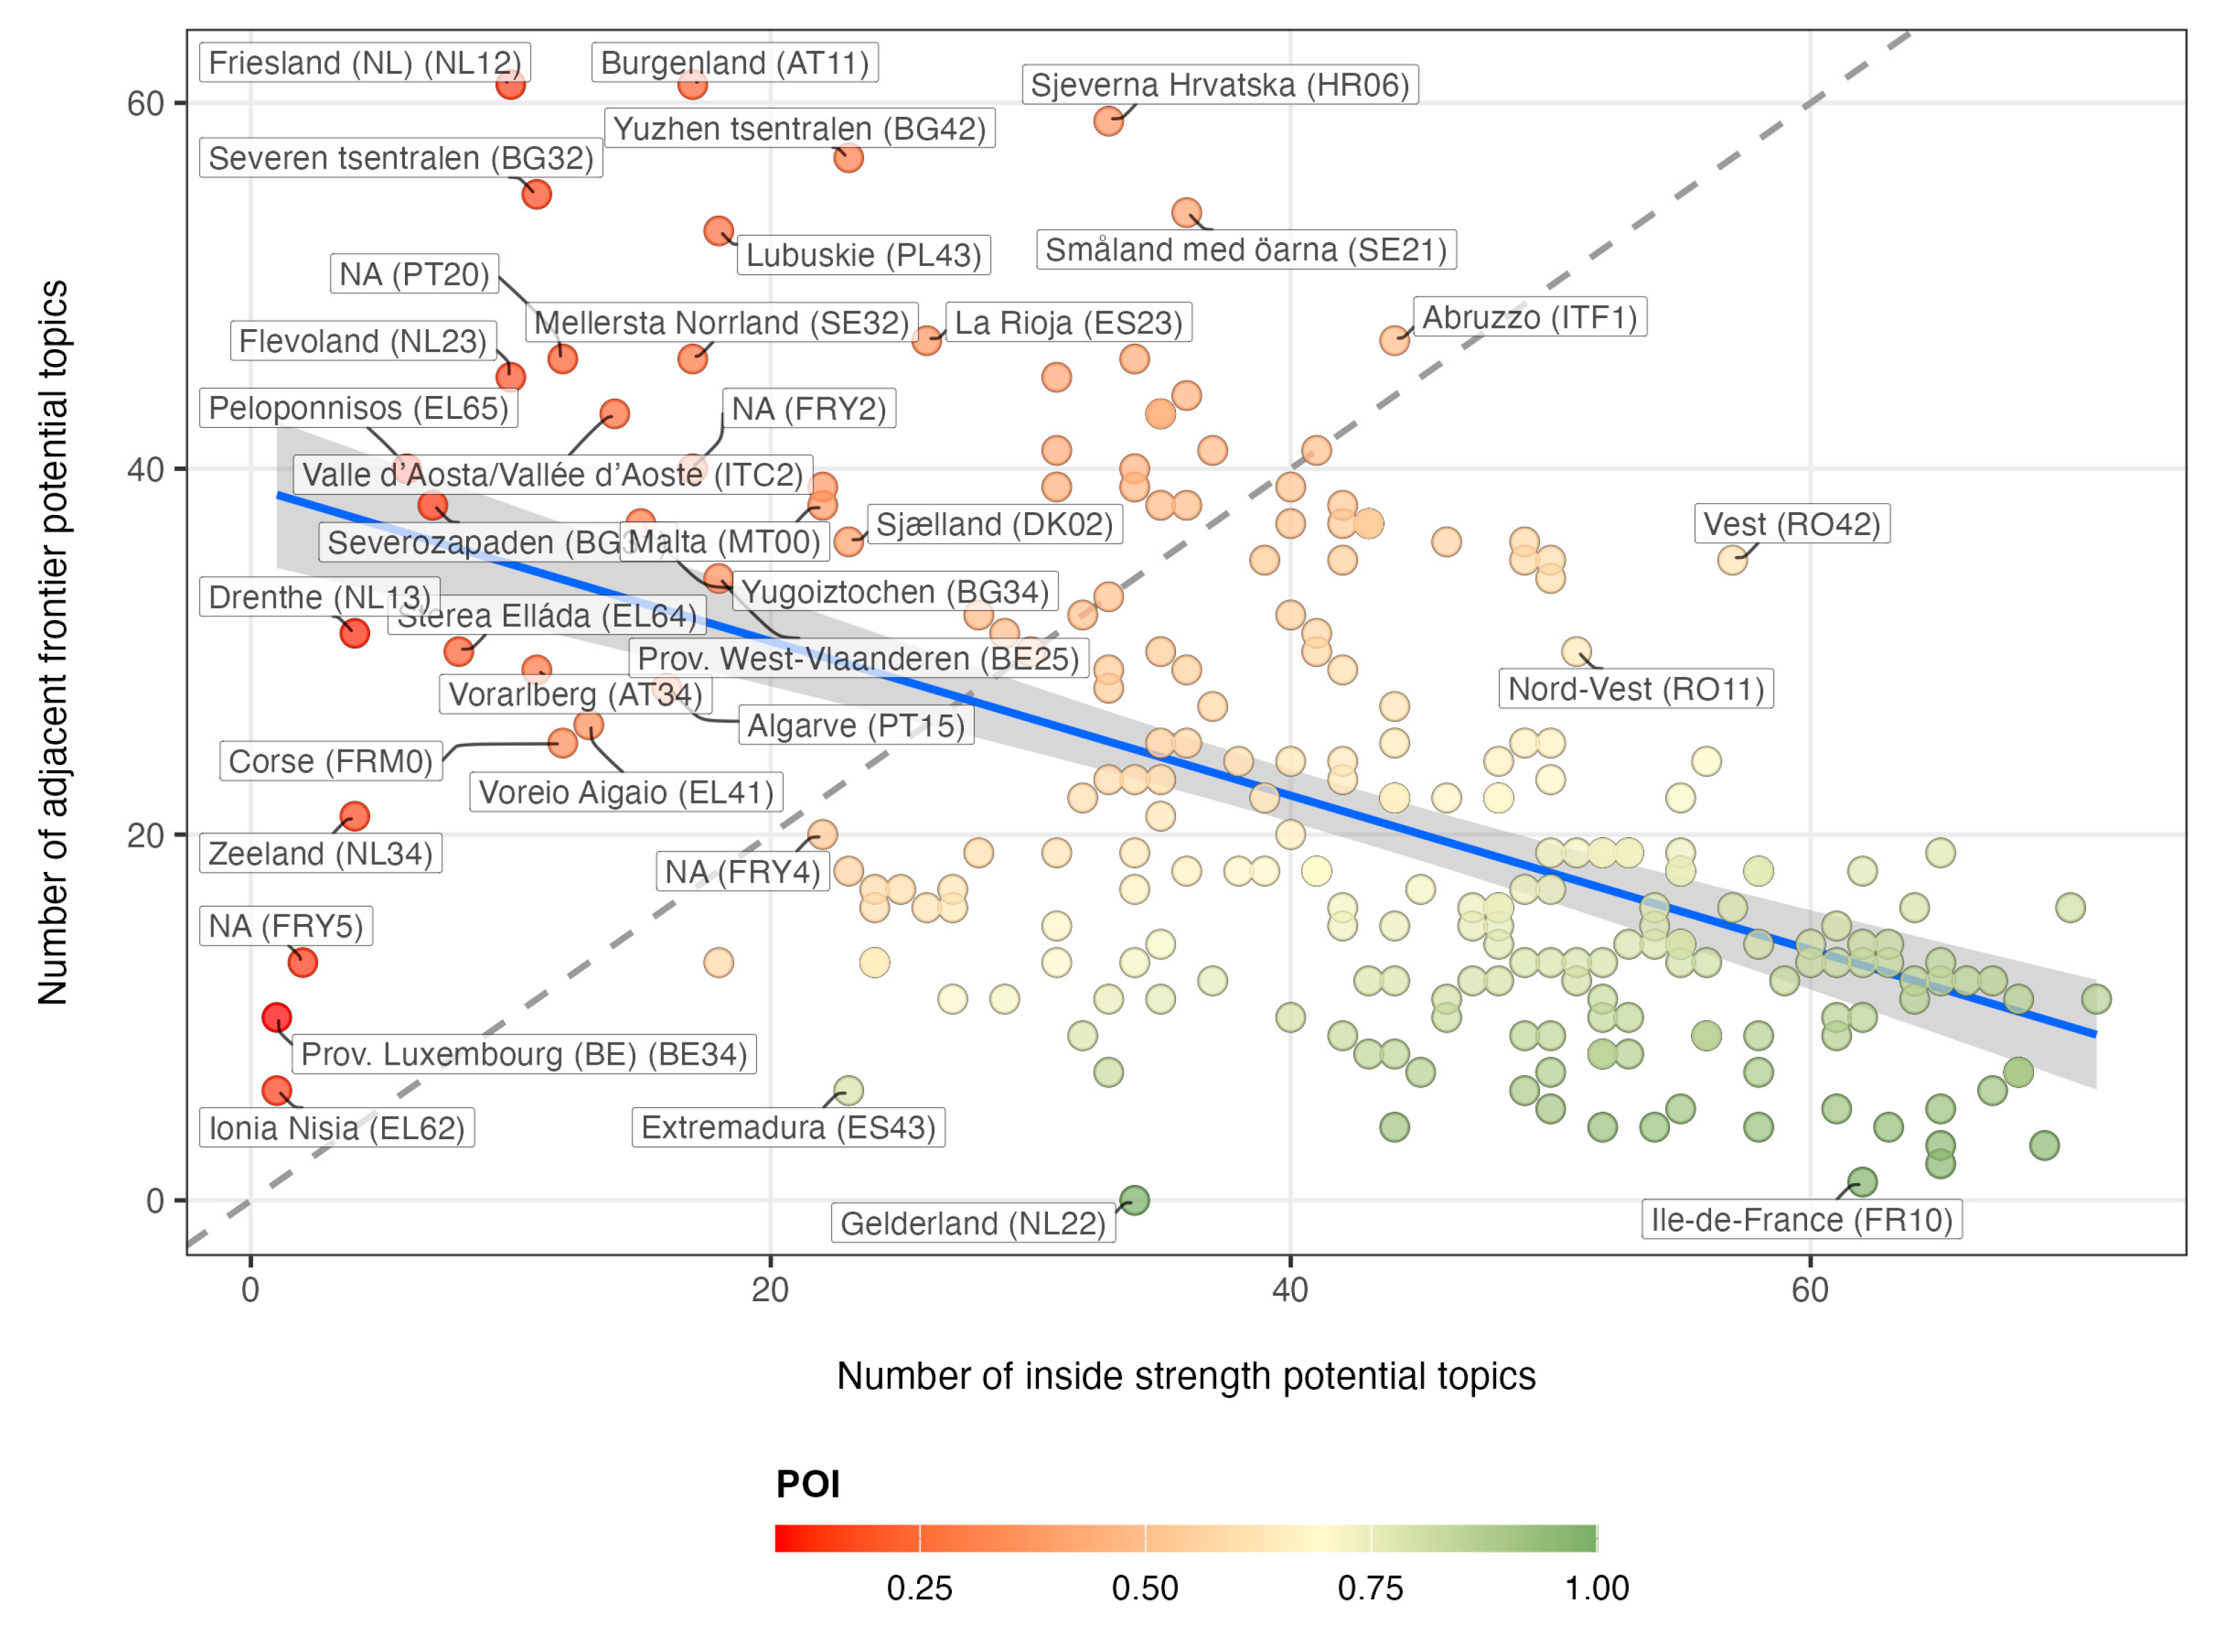
Figure 4.
Portfolio Opportunity Index (POI) across EU regions.
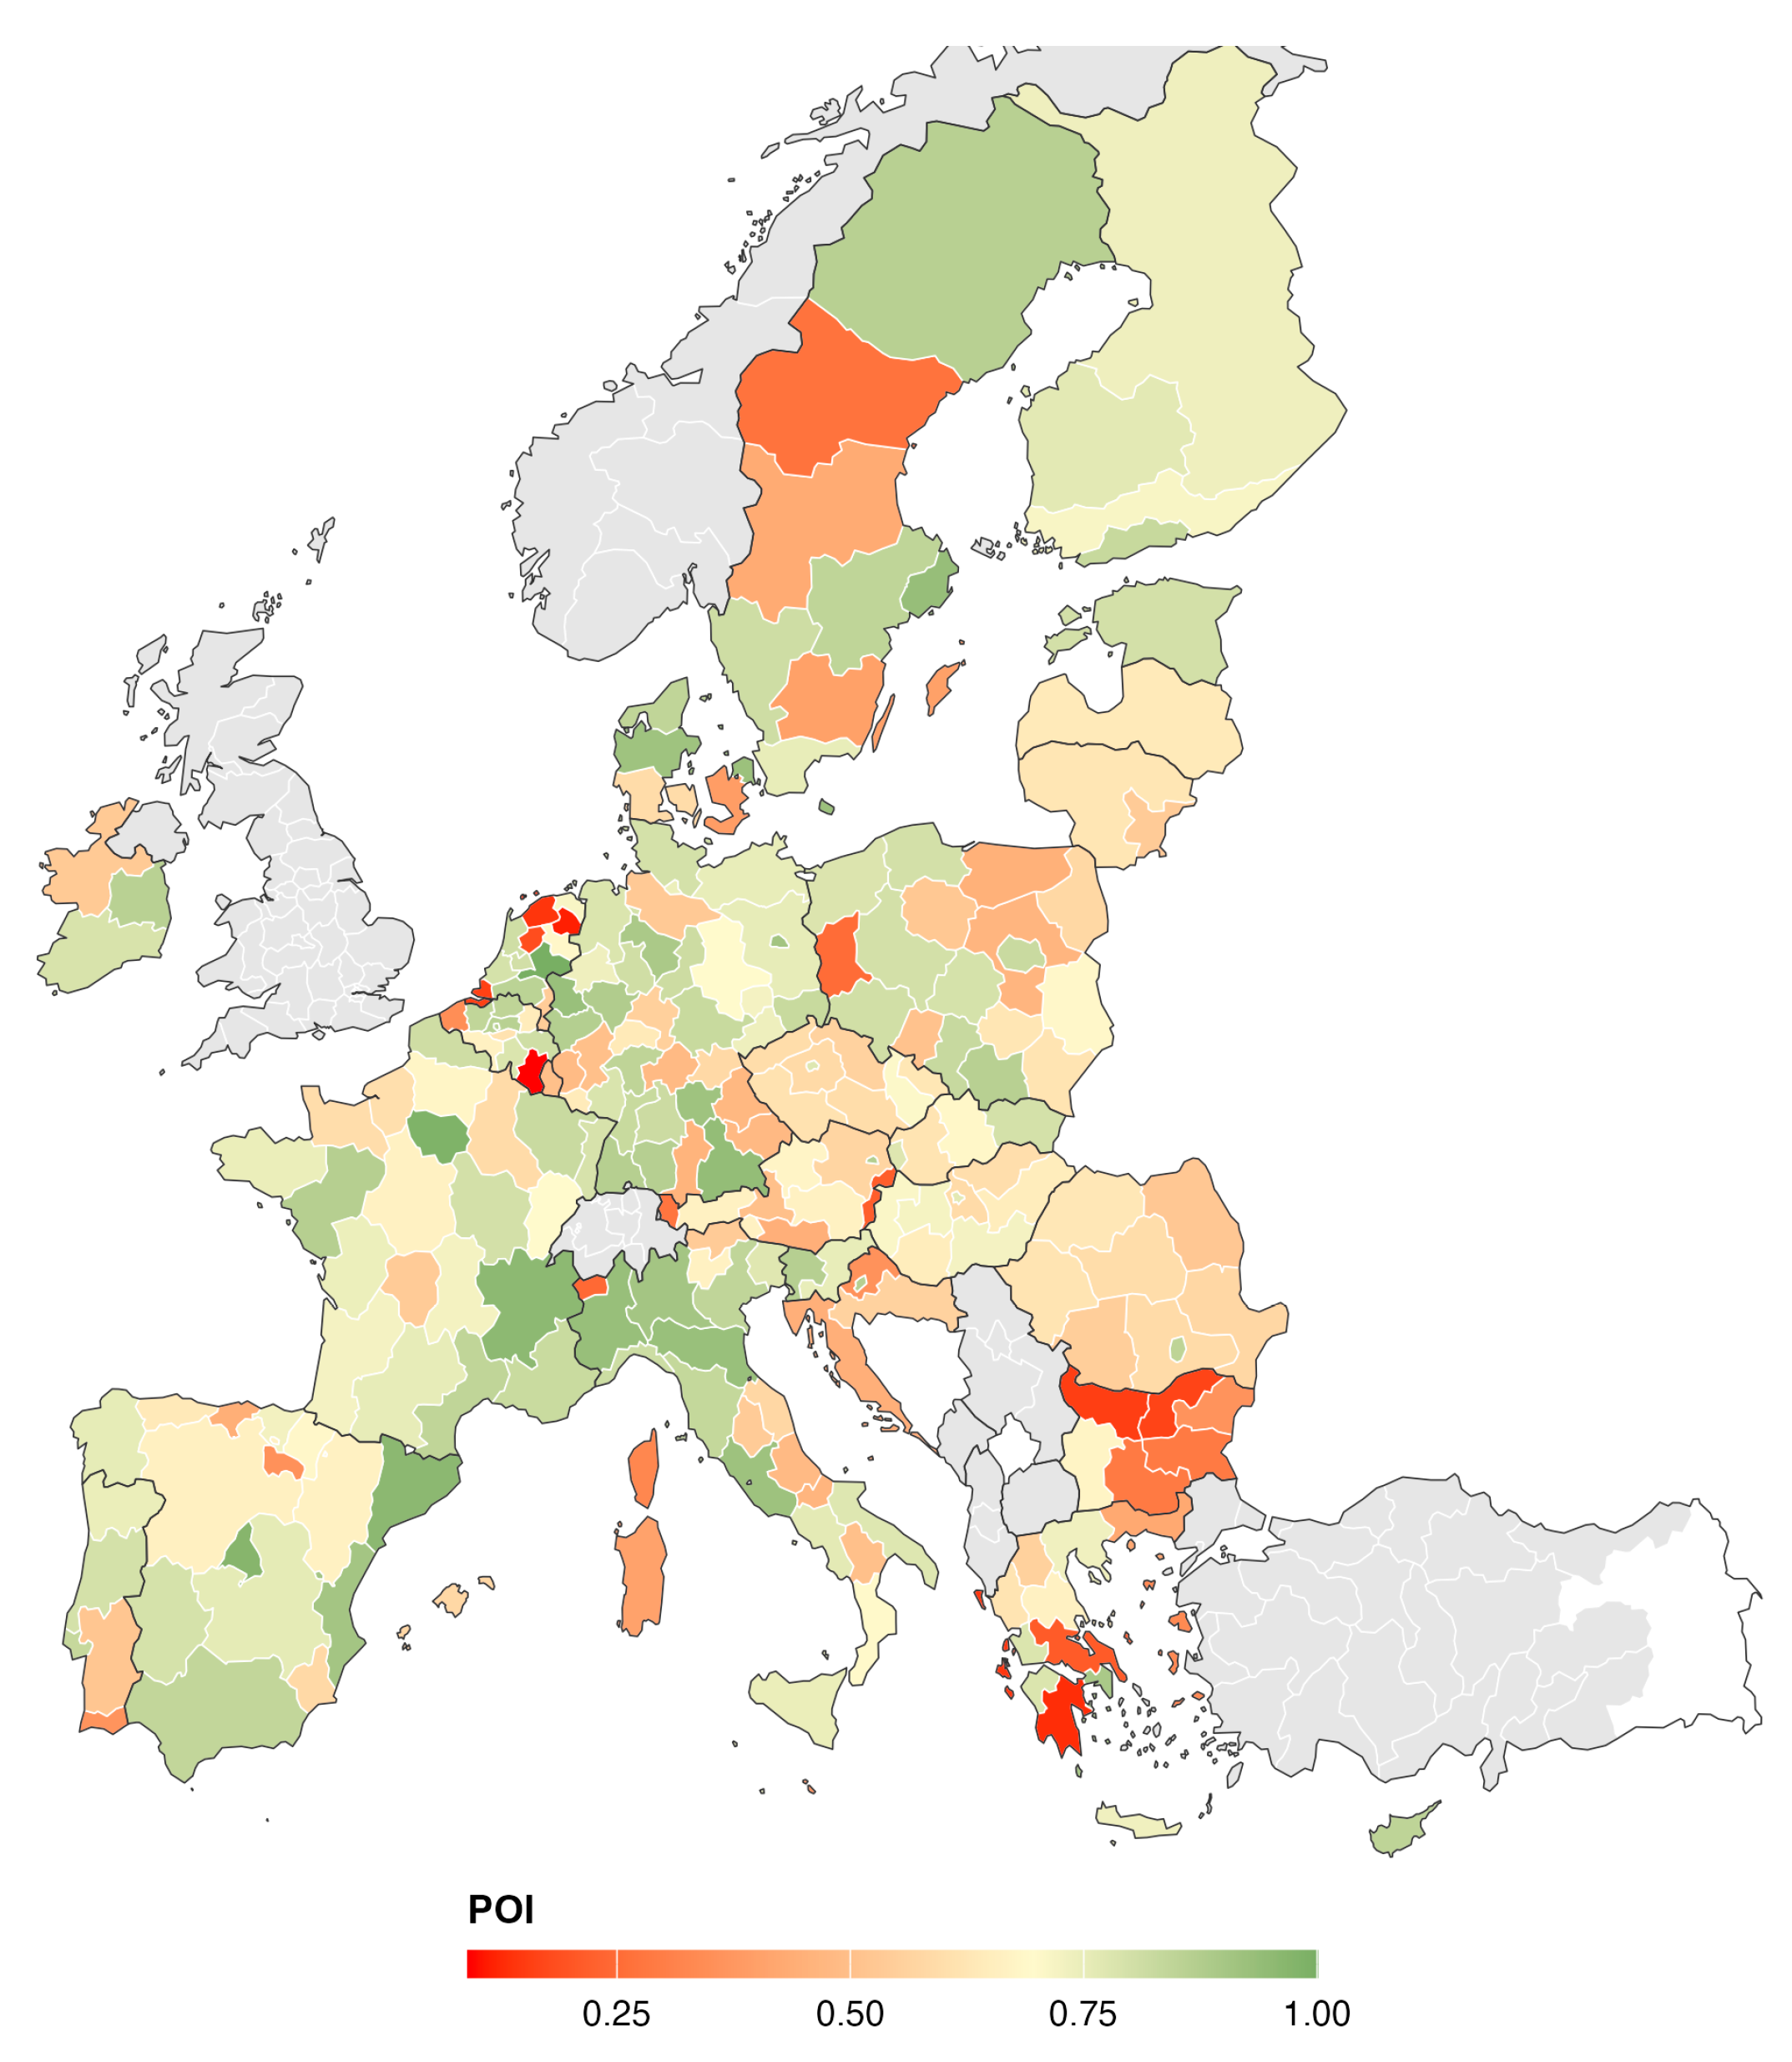
Figure 5.
Coverage dynamics: Portfolio breadth over time (2014–2020).
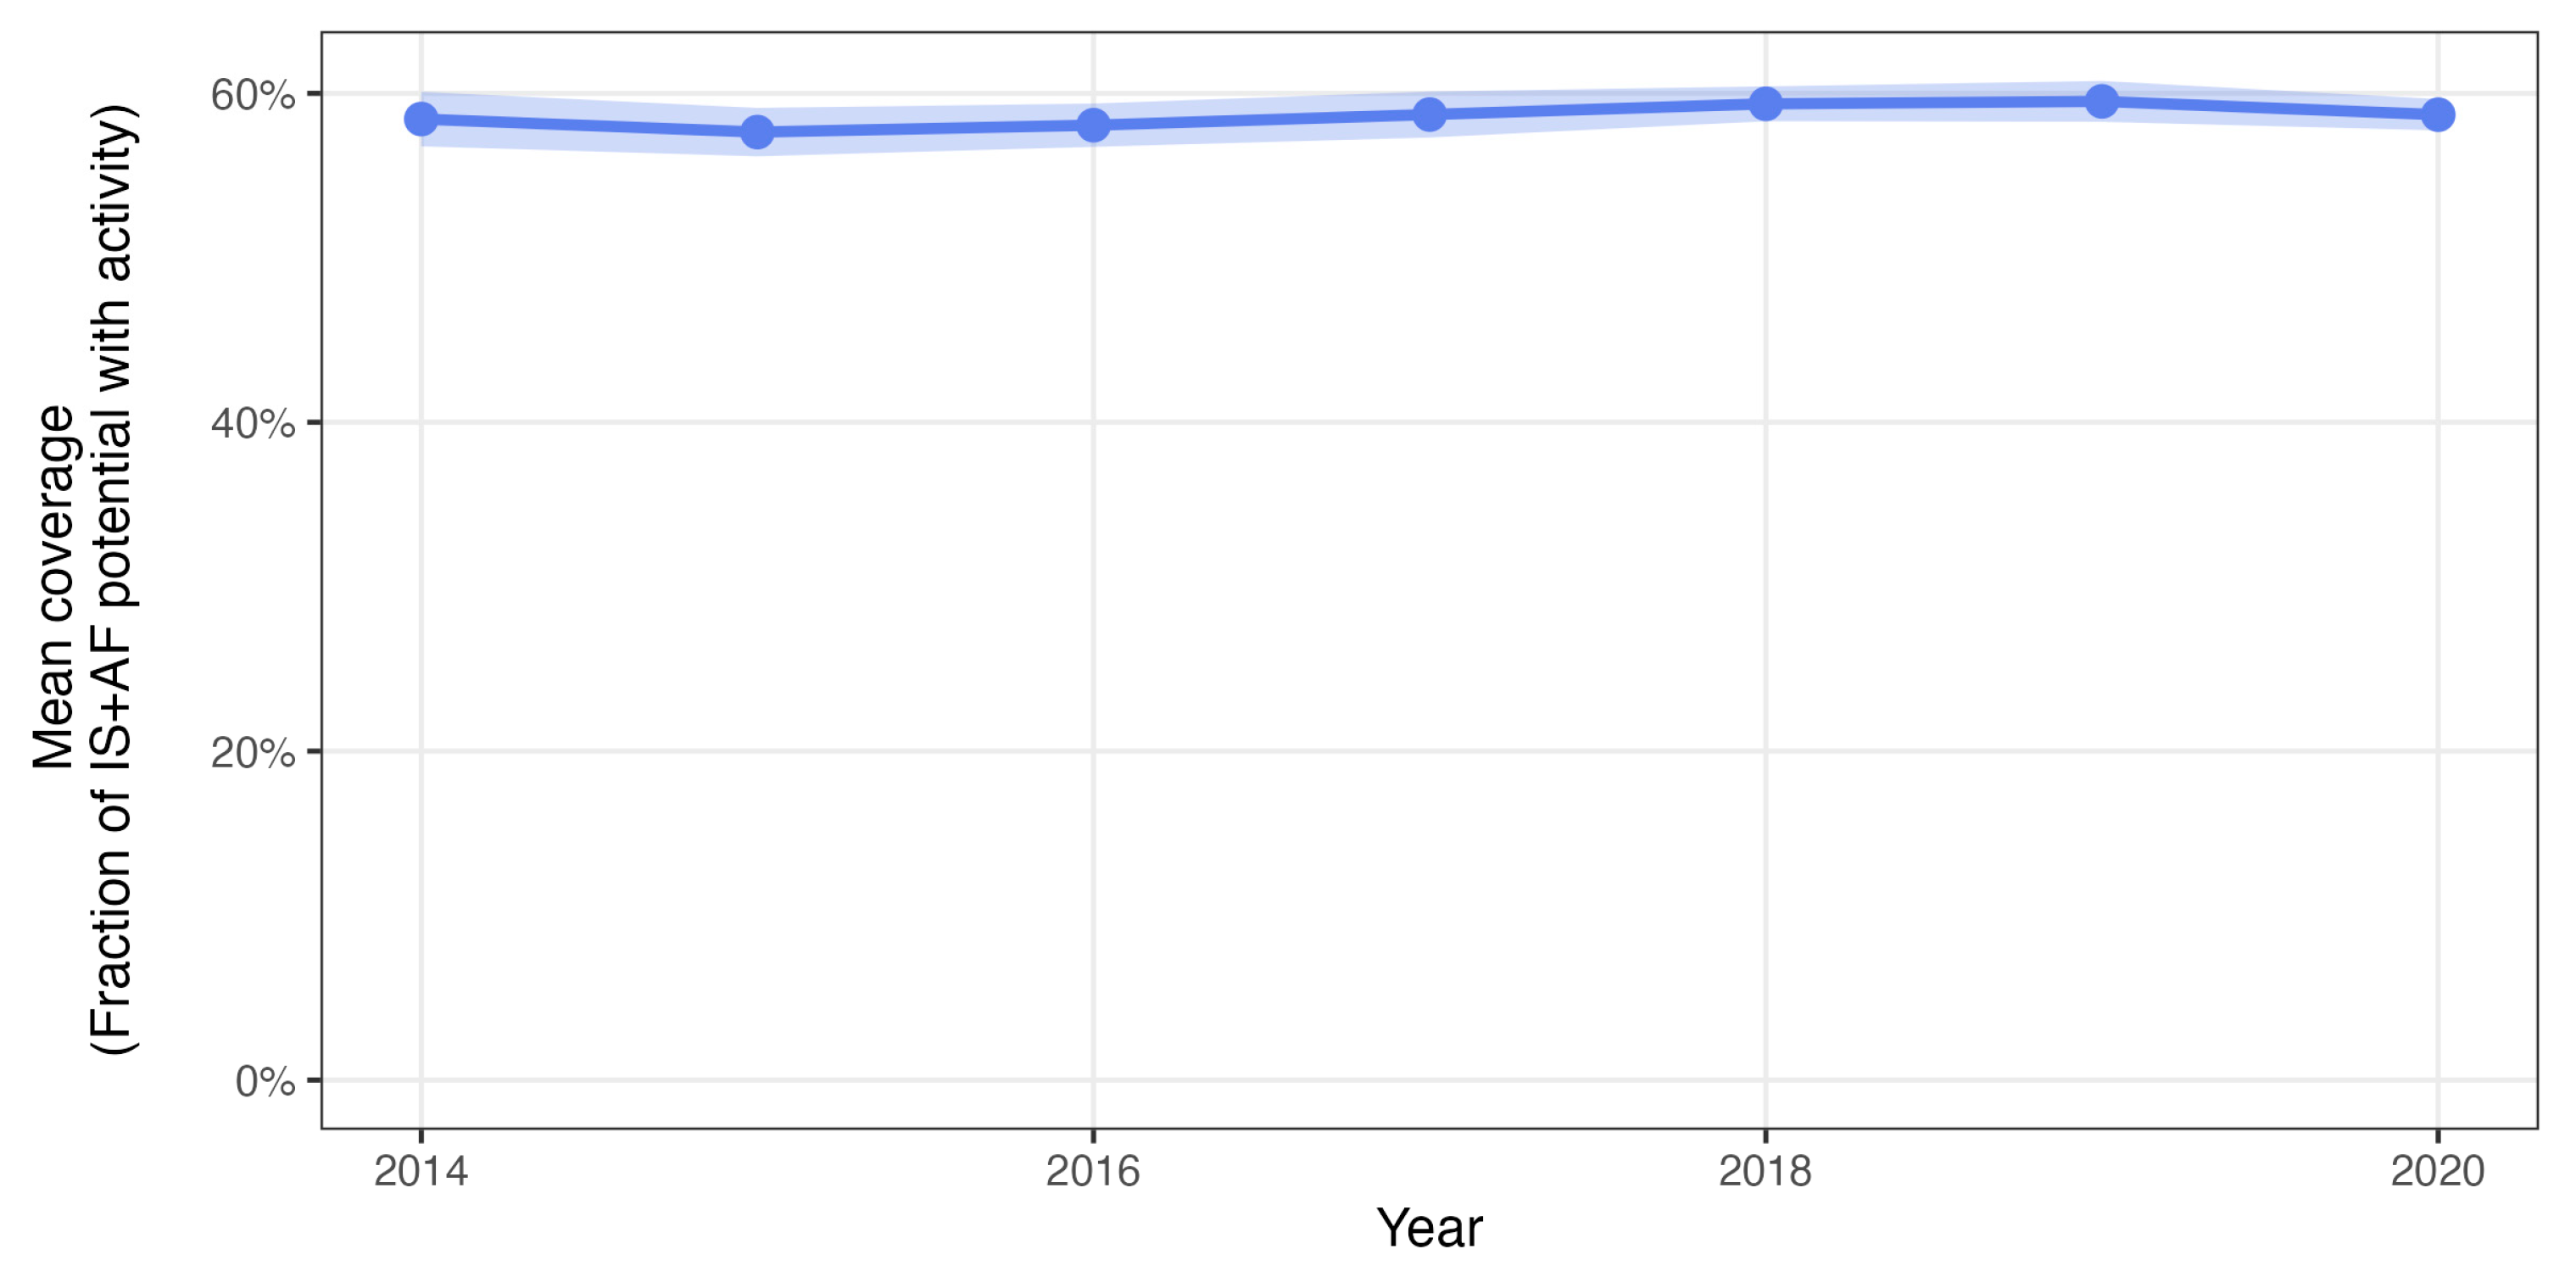
Figure 7.
Selection behavior by archetype. Grouped bar chart.
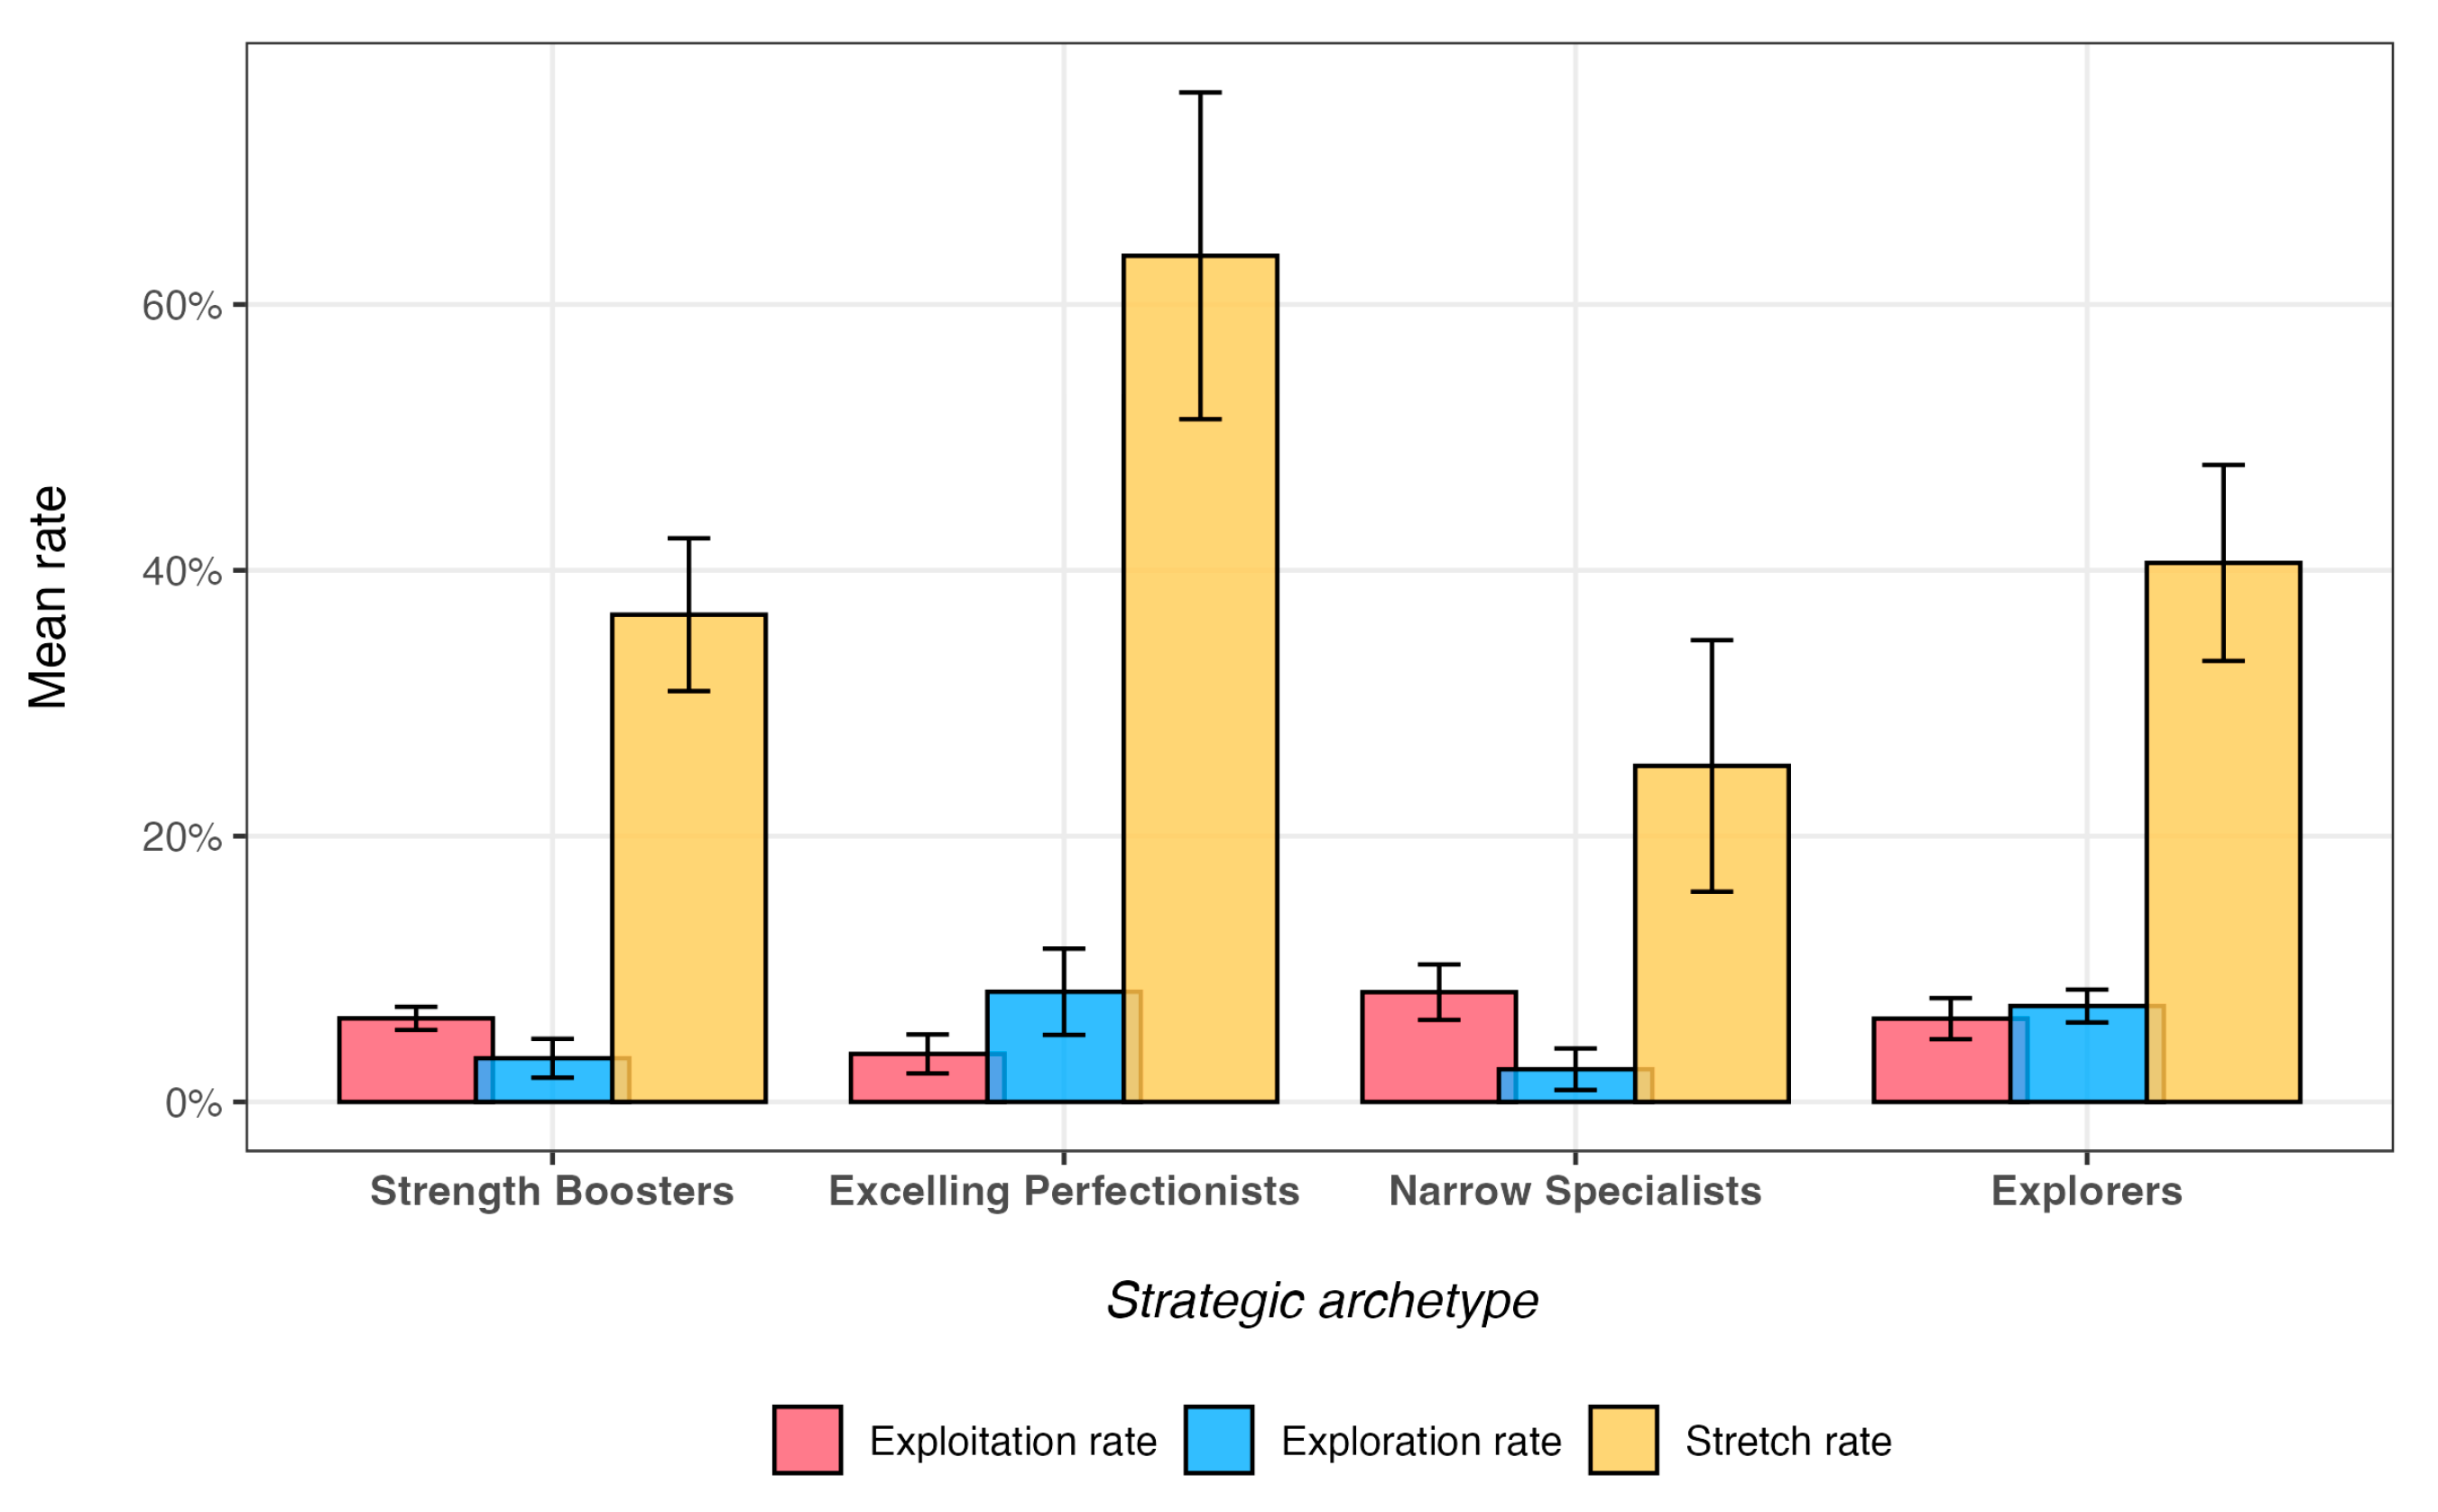
Figure 8.
Portfolio Opportunity Index vs. Selection Comfort-Zone Bias Index.
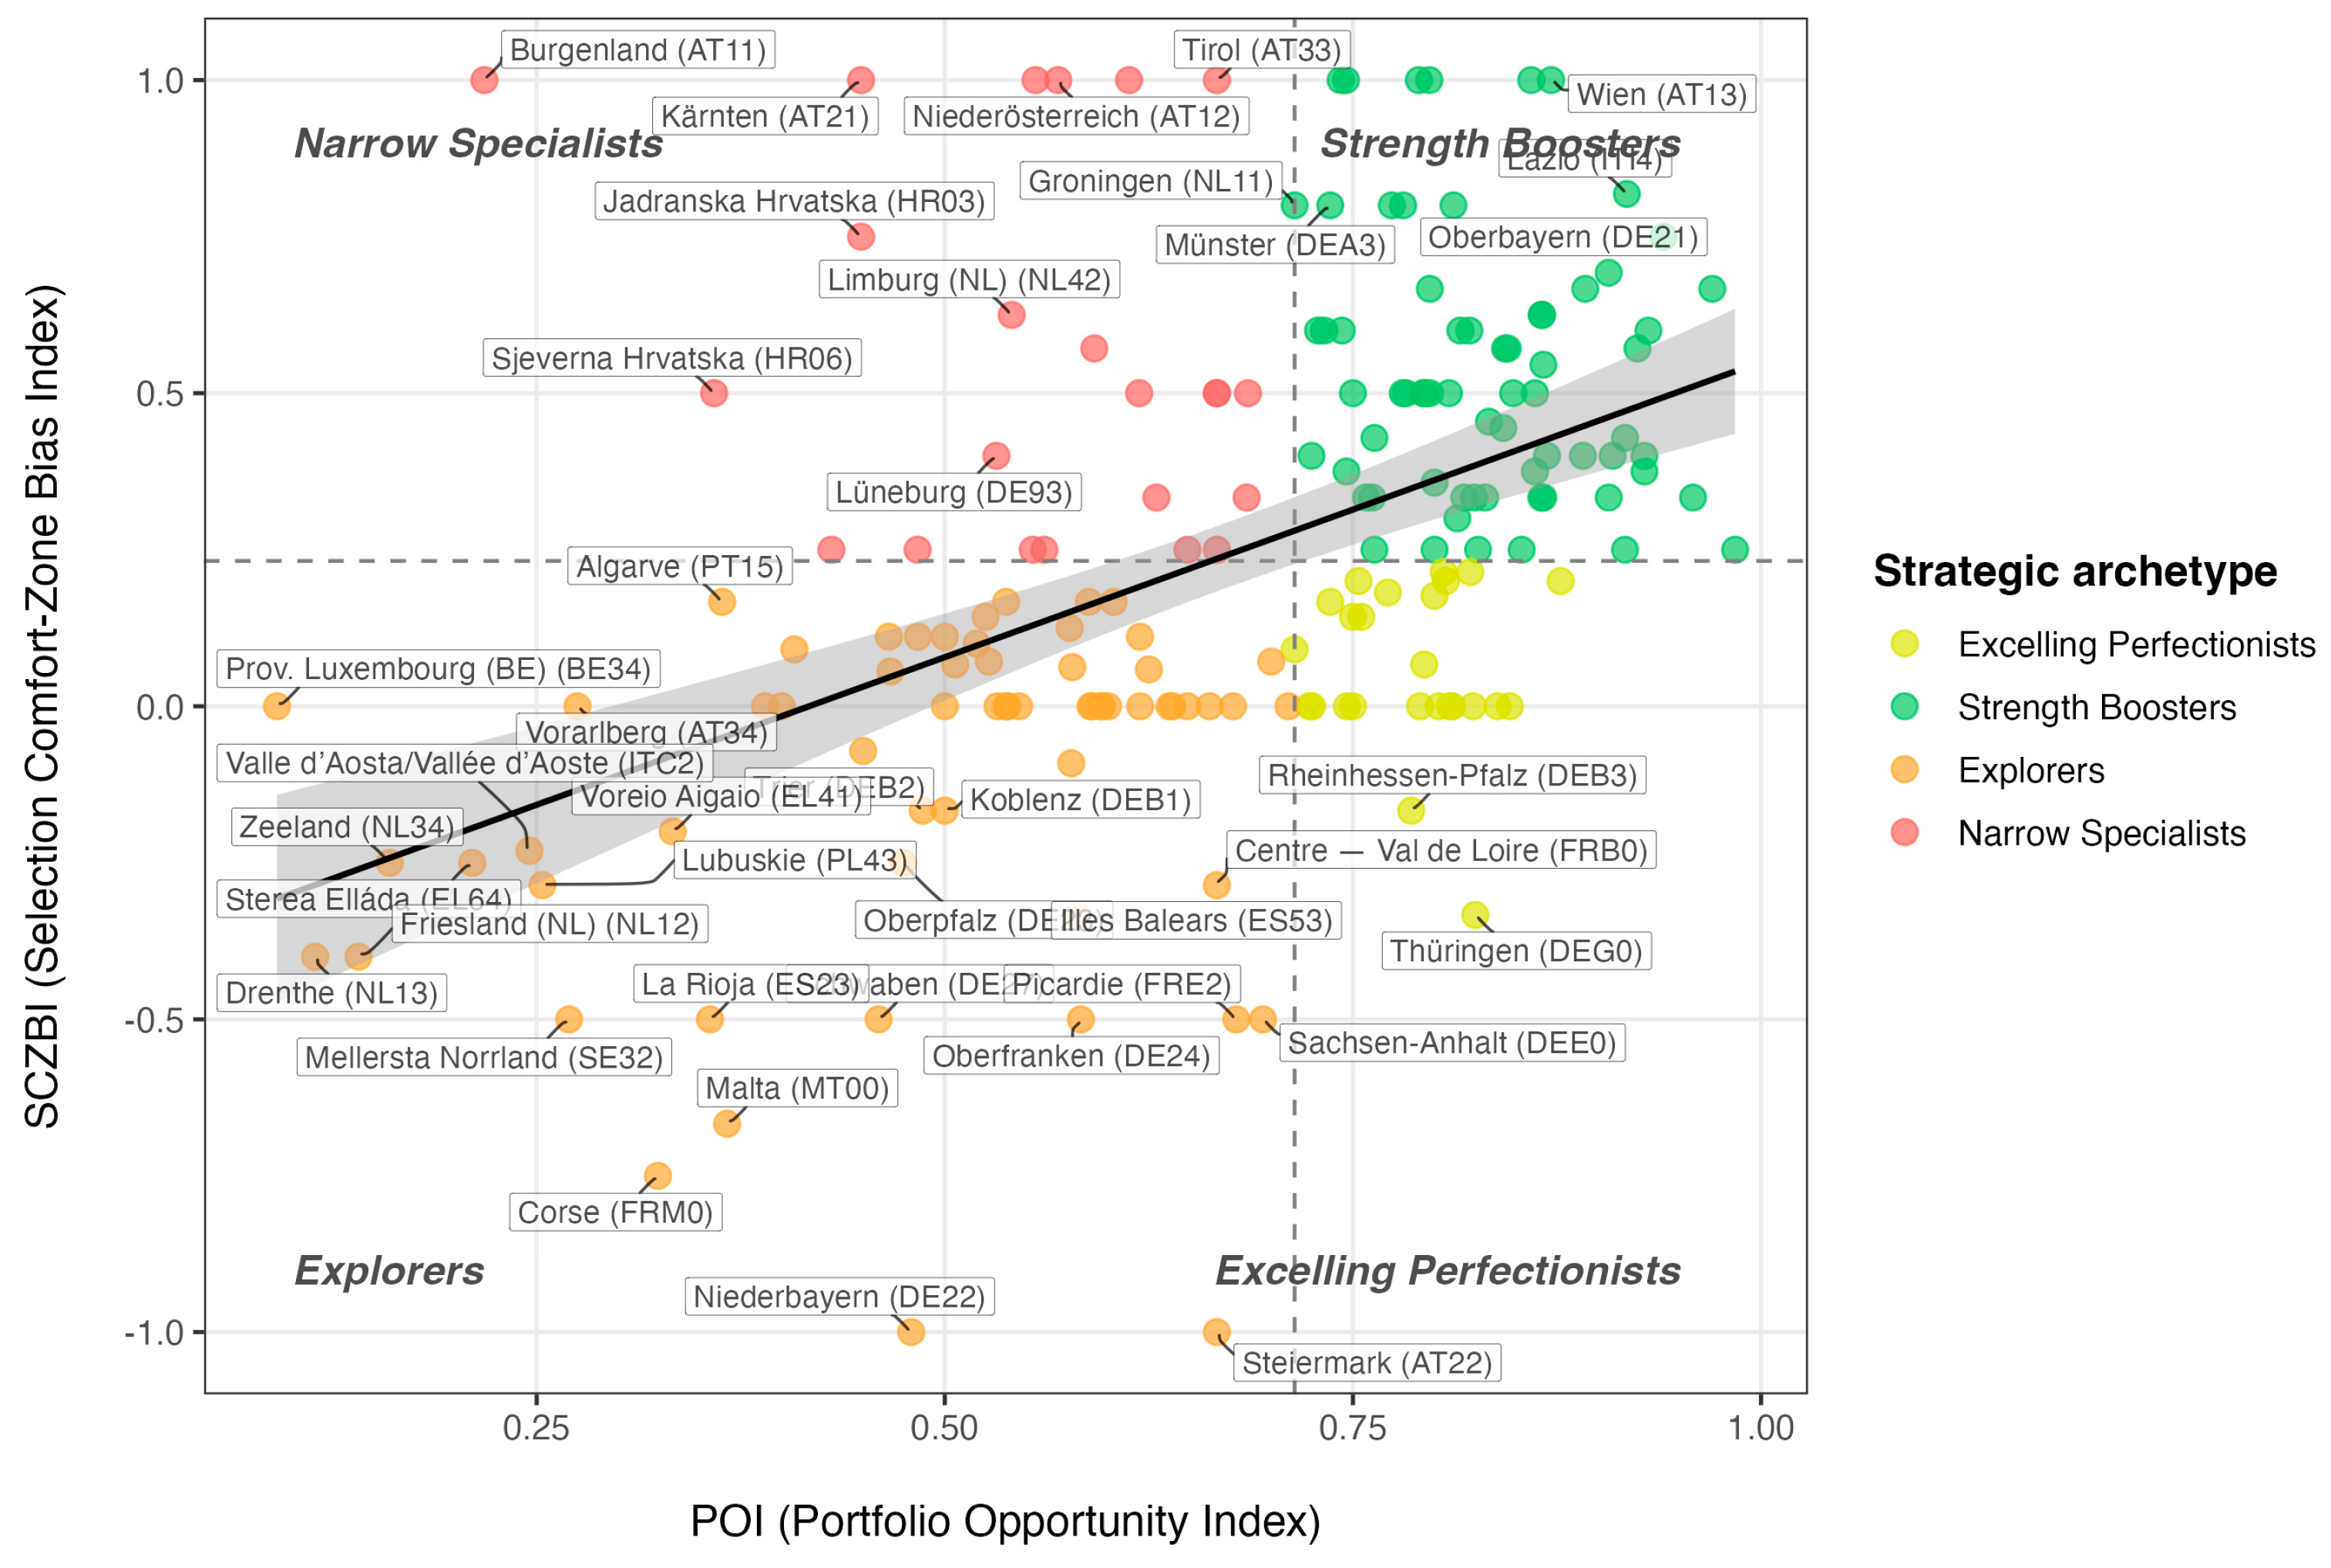
Figure 9.
Portfolio-priority concordance by strategic archetype.
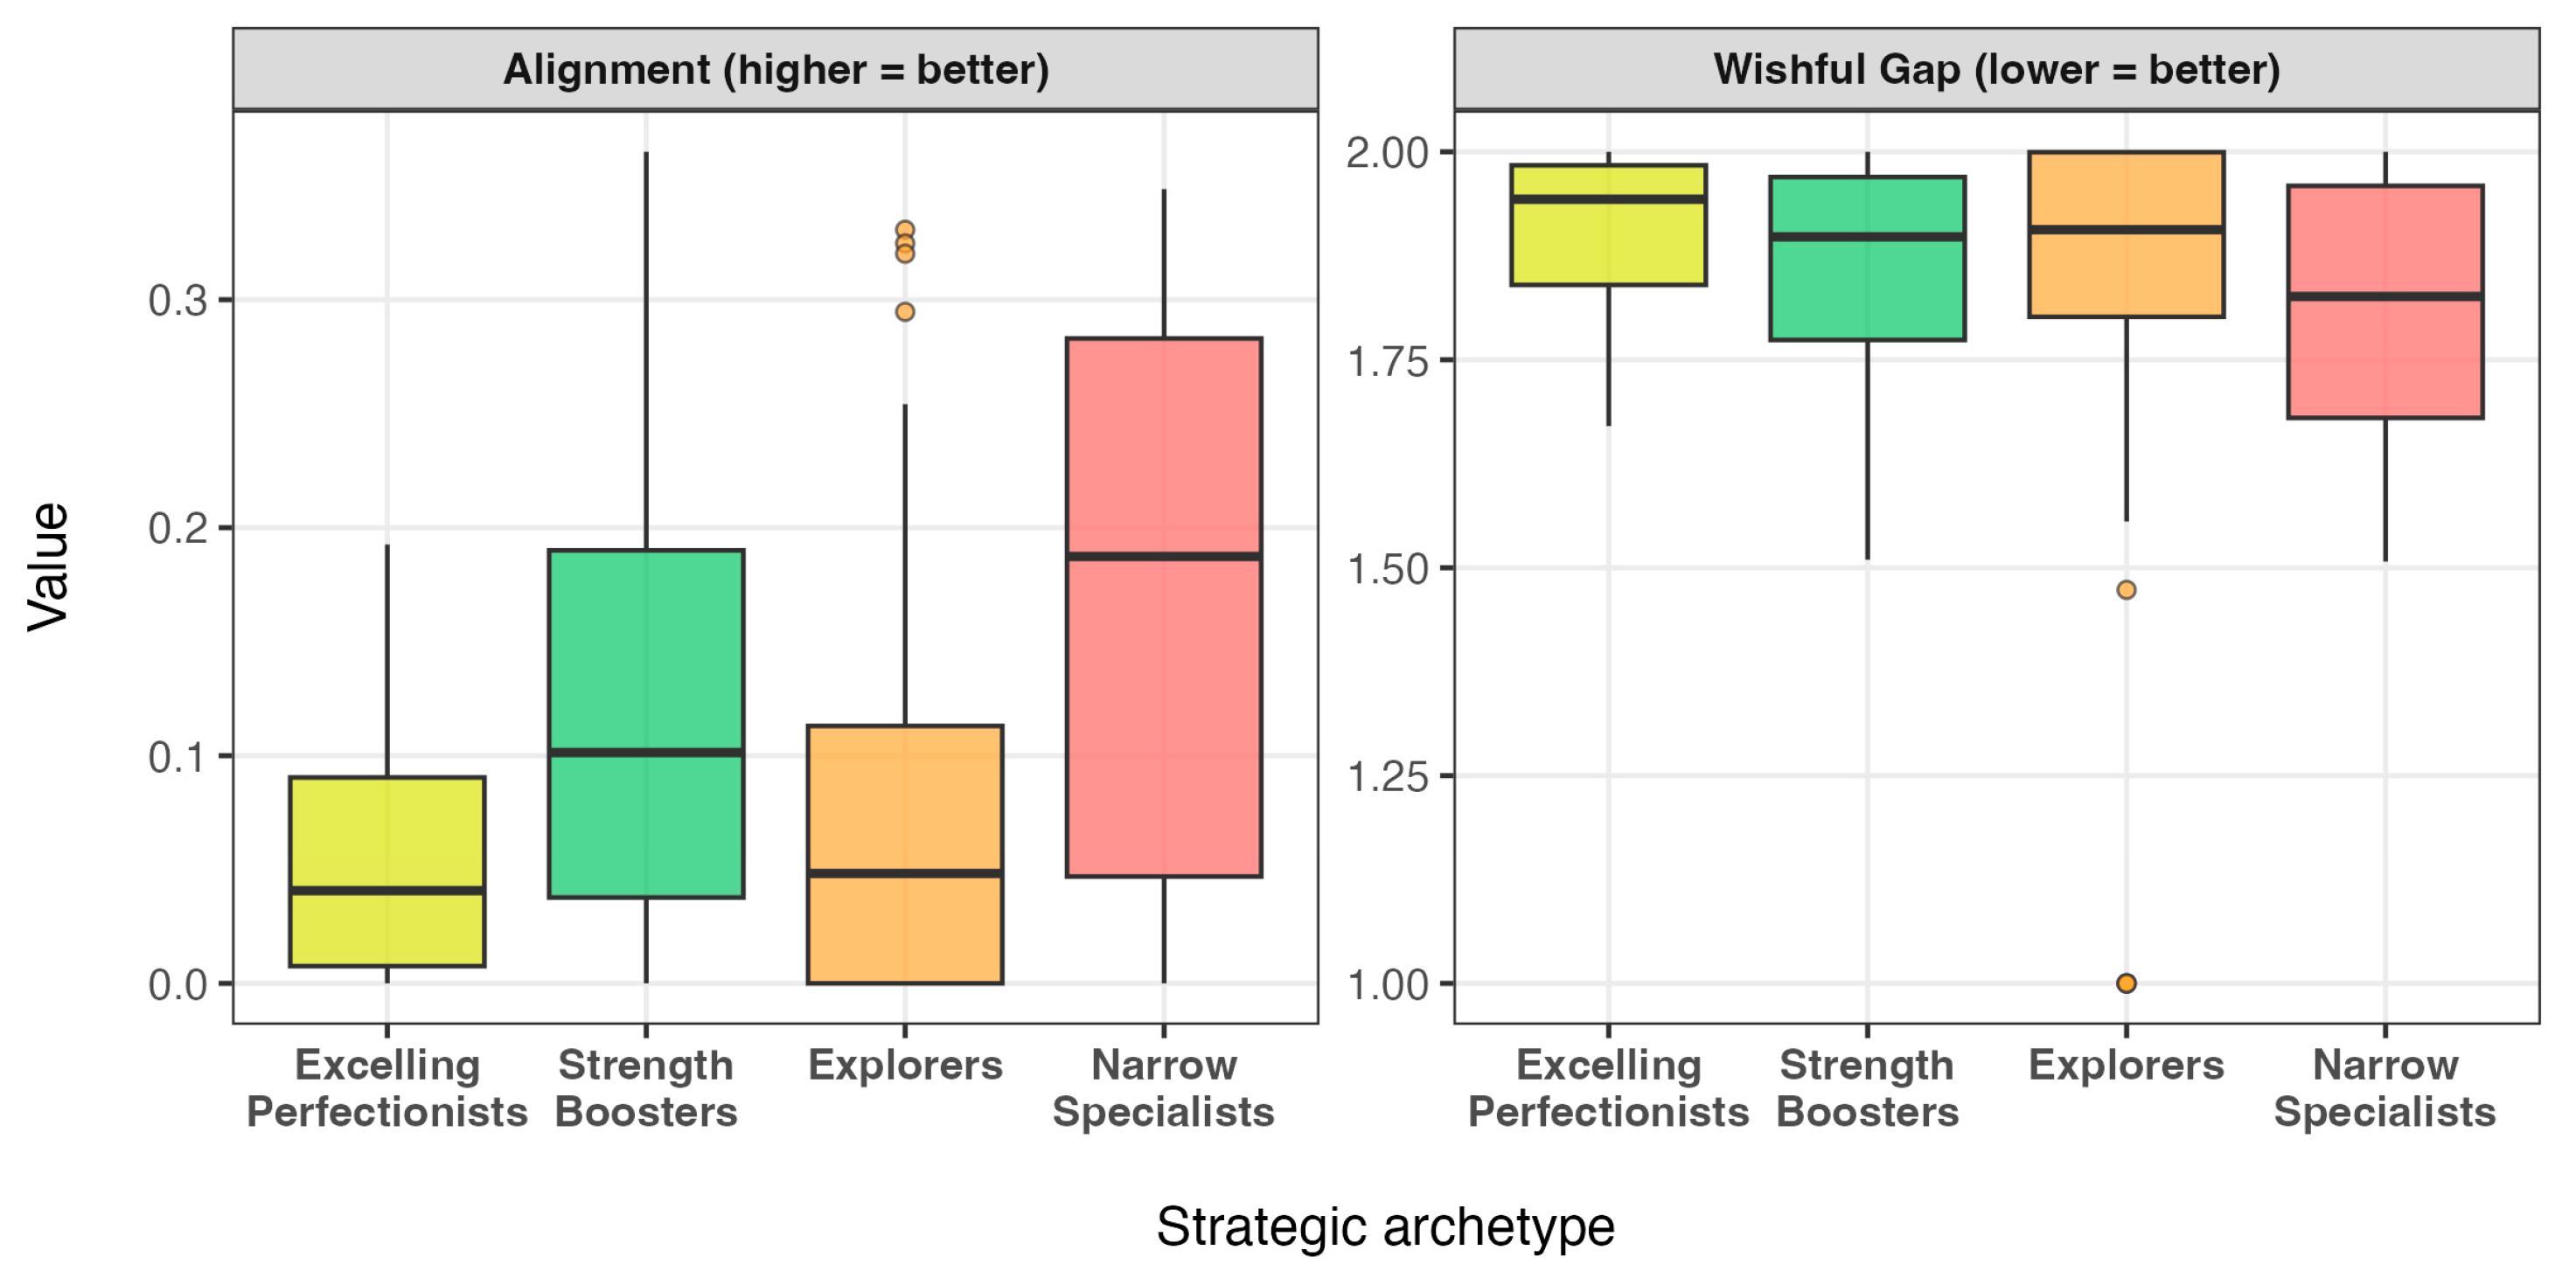
Figure 10.
Selection Comfort-Zone Bias Index (SCZBI) across EU regions.
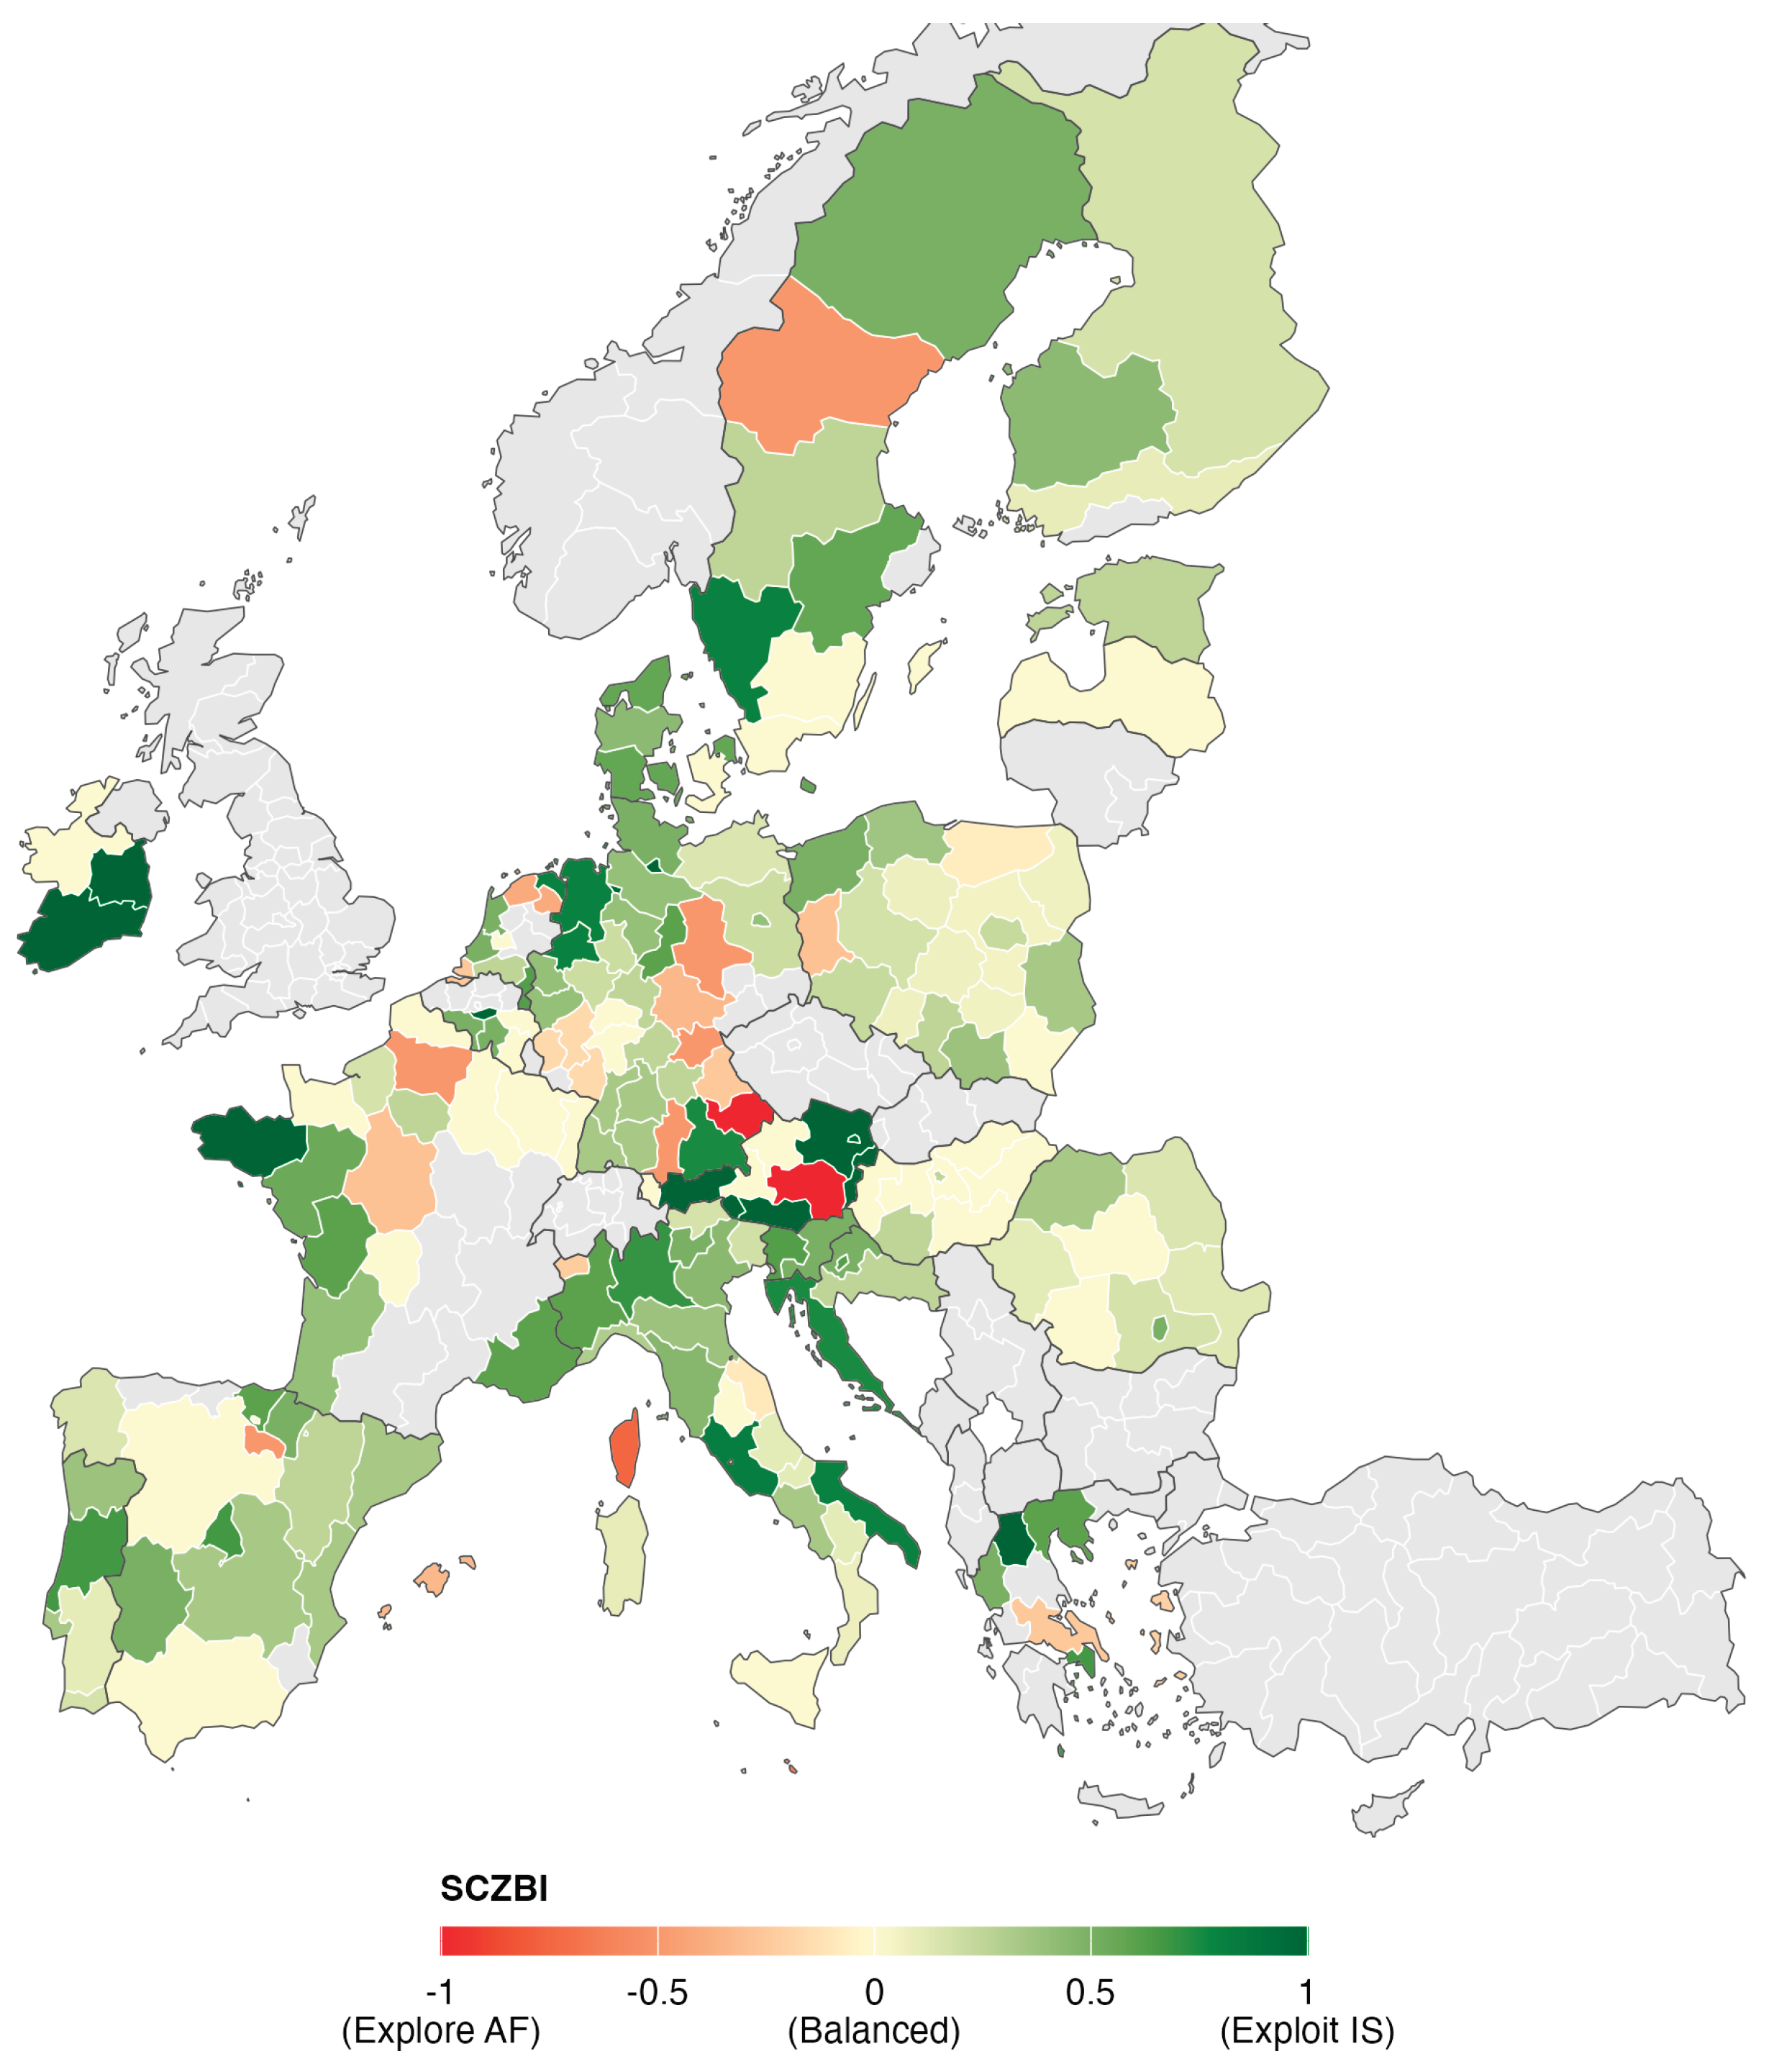

Table 1.
POI distribution across EU regions.
| # regions | Mean | SD | Min | Q25 | Median | Q75 | Max | Gini | Mean # IS | Mean # AF |
| 236 | 0.655 | 0.204 | 0.091 | 0.538 | 0.695 | 0.809 | 1 | 0.172 | 42 | 21.3 |
Table 2.
Capability endowments by POI quartile.
| POI quartile | # regions | Mean POI | SD POI | Mean # IS | Mean # AF | Mean total |
| Q1 (Low POI) | 59 | 0.368 | 0.139 | 24.8 | 37.9 | 62.7 |
| Q2 | 60 | 0.620 | 0.044 | 38.2 | 23.4 | 61.6 |
| Q3 | 58 | 0.762 | 0.031 | 48.2 | 15.0 | 63.2 |
| Q4 (High POI) | 59 | 0.871 | 0.048 | 57.2 | 8.6 | 65.8 |
Table 3.
Coverage dynamics regression results.
| Dependent Variable | Coverage (fraction of IS+AF potential with substantial activity) |
| Specification | Coverage ~ Year + Region FE, clustered SE (n=235 regions) |
| Observations | 1,608 region-year pairs |
| Year coefficient (β) | 0.00142 (SE: 0.00124) |
| t-statistic | 1.143 |
| p-value | 0.254 |
| Within R² | 0.0012 |
| Adjusted R² | 0.248 |
Table 4.
Selection behavior statistics.
| # regions | Metric | Mean | SD | Min | Q25 | Median | Q75 | Max |
| 182 | SCZBI | 0.231 | 0.399 | –1.000 | 0.000 | 0.232 | 0.500 | 1.000 |
| 182 | ER | 0.062 | 0.051 | 0.000 | 0.022 | 0.055 | 0.091 | 0.250 |
| 182 | ExR | 0.053 | 0.063 | 0.000 | 0.000 | 0.039 | 0.083 | 0.308 |
| 182 | SR | 0.403 | 0.293 | 0.000 | 0.186 | 0.375 | 0.571 | 1.000 |
| 182 | alignment | 0.102 | 0.103 | 0.000 | 0.007 | 0.078 | 0.160 | 0.365 |
| 182 | gap | 1.851 | 0.175 | 1.000 | 1.778 | 1.904 | 1.985 | 2.000 |
| 182 | OCI | 0.927 | 0.092 | 0.491 | 0.884 | 0.957 | 0.999 | 1.000 |
Table 5.
Strategic archetype characteristics.
| archetype | # regions | Mean POI | Mean SCZBI | Mean ER | Mean ExR | Mean SR | Mean alignment | Mean gap | Mean # priorities |
| Strength Boosters | 67 | 0.833 | 0.536 | 0.063 | 0.033 | 0.367 | 0.121 | 1.855 | 6.209 |
| Excelling Perfectionists | 25 | 0.787 | 0.060 | 0.036 | 0.083 | 0.637 | 0.060 | 1.904 | 6.680 |
| Narrow Specialists | 24 | 0.560 | 0.553 | 0.083 | 0.025 | 0.253 | 0.169 | 1.806 | 5.208 |
| Explorers | 66 | 0.480 | –0.131 | 0.063 | 0.072 | 0.406 | 0.074 | 1.844 | 6.667 |
Table 6.
Strategic archetype characteristics.
| term |
Model 1 ER |
Model 2 ExR |
Model 3 SR |
| (Intercept) | 0.245. (0.128) |
0.238 (0.178) |
2.280** (0.851) |
| POI | 0.012 (0.022) |
0.018 (0.03) |
0.146 (0.145) |
| SR | –0.062*** (0.012) |
–0.054** (0.016) |
n.a. |
| Legacy | 0.016 (0.013) |
-0.004 (0.018) |
0.233** (0.086) |
| Logarithm of GDP per capita (in purchasing power standard) | –0.019 (0.013) |
–0.020 (0.018) |
–0.203* (0.085) |
| Logarithm of population density | –0.006 (0.004) |
–0.004 (0.005) |
0.043 (0.027) |
| GERD (as % of GDP) | -–0.005 (0.003) |
–0.01* (0.005) |
0.017 (0.022) |
| Share of fossil fuels (country level) | 0.001* (0.000) |
0.001** (0.000) |
–0.005** (0.002) |
Disclaimer/Publisher’s Note: The statements, opinions and data contained in all publications are solely those of the individual author(s) and contributor(s) and not of MDPI and/or the editor(s). MDPI and/or the editor(s) disclaim responsibility for any injury to people or property resulting from any ideas, methods, instructions or products referred to in the content. |
© 2025 by the authors. Licensee MDPI, Basel, Switzerland. This article is an open access article distributed under the terms and conditions of the Creative Commons Attribution (CC BY) license (http://creativecommons.org/licenses/by/4.0/).
Copyright: This open access article is published under a Creative Commons CC BY 4.0 license, which permit the free download, distribution, and reuse, provided that the author and preprint are cited in any reuse.


