Submitted:
24 November 2025
Posted:
26 November 2025
Read the latest preprint version here
Abstract
Our paper addresses the problem of enterprise portfolio analytics fragmentation by considering the proposal of a single and auditable pipeline with predicted features of forecasting, anomaly detection, and explainable capabilities in a unit reproducible framework. Background and context Organizations generally implement siloed models to forecast, signal risks and report, leading to issues with traceability and speed of decision making. In Methods we assemble a scikit-learn pipeline of median/mode imputation, one-hot encoding and log transformed Random Forest regressor with strict time splits and ablated to check feature dependence, and an unsupervised risk score of Isolation Forest (2% contamination) which are tabulated and summarized in an automated HTML report. Findings: ensemble MAE = 3,687.85, RMSE = 7,751.08 with R2 = 0.8546 in summary the bedazzling discordant analytics is transformed into a sensible choice structure to prepare the accuracy of technology that will be a realistic blueprint of trusted AI in enterprise finance.
Keywords:
enterprise forecasting
; schedule risk
; anomaly detection
; SMOTE
; SHAP
; XGBoost
; PCA
; GRU
; governance
I. Introduction
Enterprise change portfolios in regulated industries must publish accurate financial forecasts and control health summaries while coping with fragmented systems and imbalanced risk labels. Persistent waste from missed deadlines and overspent budgets motivates earlier and more reliable prediction and monitoring. The framework presented here combines prediction, detection, and governed publication into one auditable pipeline that can be adopted by portfolio management offices at scale. Contributions include an end to end system architecture, a feature store tailored to program and vendor signals, supervised and unsupervised models with stratified validation, a reporting service for near real time publication, and ablations that isolate the value of sampling, dimensionality reduction, text features, and monitoring. The proposed research model attains accuracy above ninety eight percent on a realistic classification task while preserving interpretability through Shapley[5] explanations.
II. Related Work
Learning with imbalanced labels is common in operational analytics and Synthetic Minority Oversampling Technique remains a standard method to improve minority recall without discarding majority cases. Tree boosting delivers strong performance on tabular data and is used extensively for cost and risk modeling, with XGBoost providing sparsity aware training and efficient approximate split finding. Unsupervised anomaly detection in finance often uses Isolation Forest which isolates anomalous points with short partition paths and residual based detectors that flag large forecast errors, providing complementary views. Sequence models such as gated recurrent units are competitive for time series forecasting and forecasting competitions highlight the value of diverse method families. Model explainability with Shapley Additive explanations provides axiomatic guarantees and a practical way to audit feature effects in enterprise models.Learning with imbalanced labels[6] is common in operational analytics and Synthetic Minority Oversampling Technique remains a standard method to improve minority recall without discarding majority cases. Tree boosting delivers strong performance on tabular data and is used extensively for cost and risk modeling, with XGBoost[2] providing sparsity aware training and efficient approximate split finding. Unsupervised anomaly detection[11,12] in finance often uses Isolation Forest[3] which isolates anomalous points with short partition paths and residual based detectors that flag large forecast errors, providing complementary views. Sequence models such as gated recurrent units are competitive for time series forecasting and forecasting competitions[4] highlight the value of diverse method families. Model explainability with Shapley Additive explanations[5] provides axiomatic guarantees and a practical way to audit feature effects in enterprise models.
III. Methodology
A. System Architecture
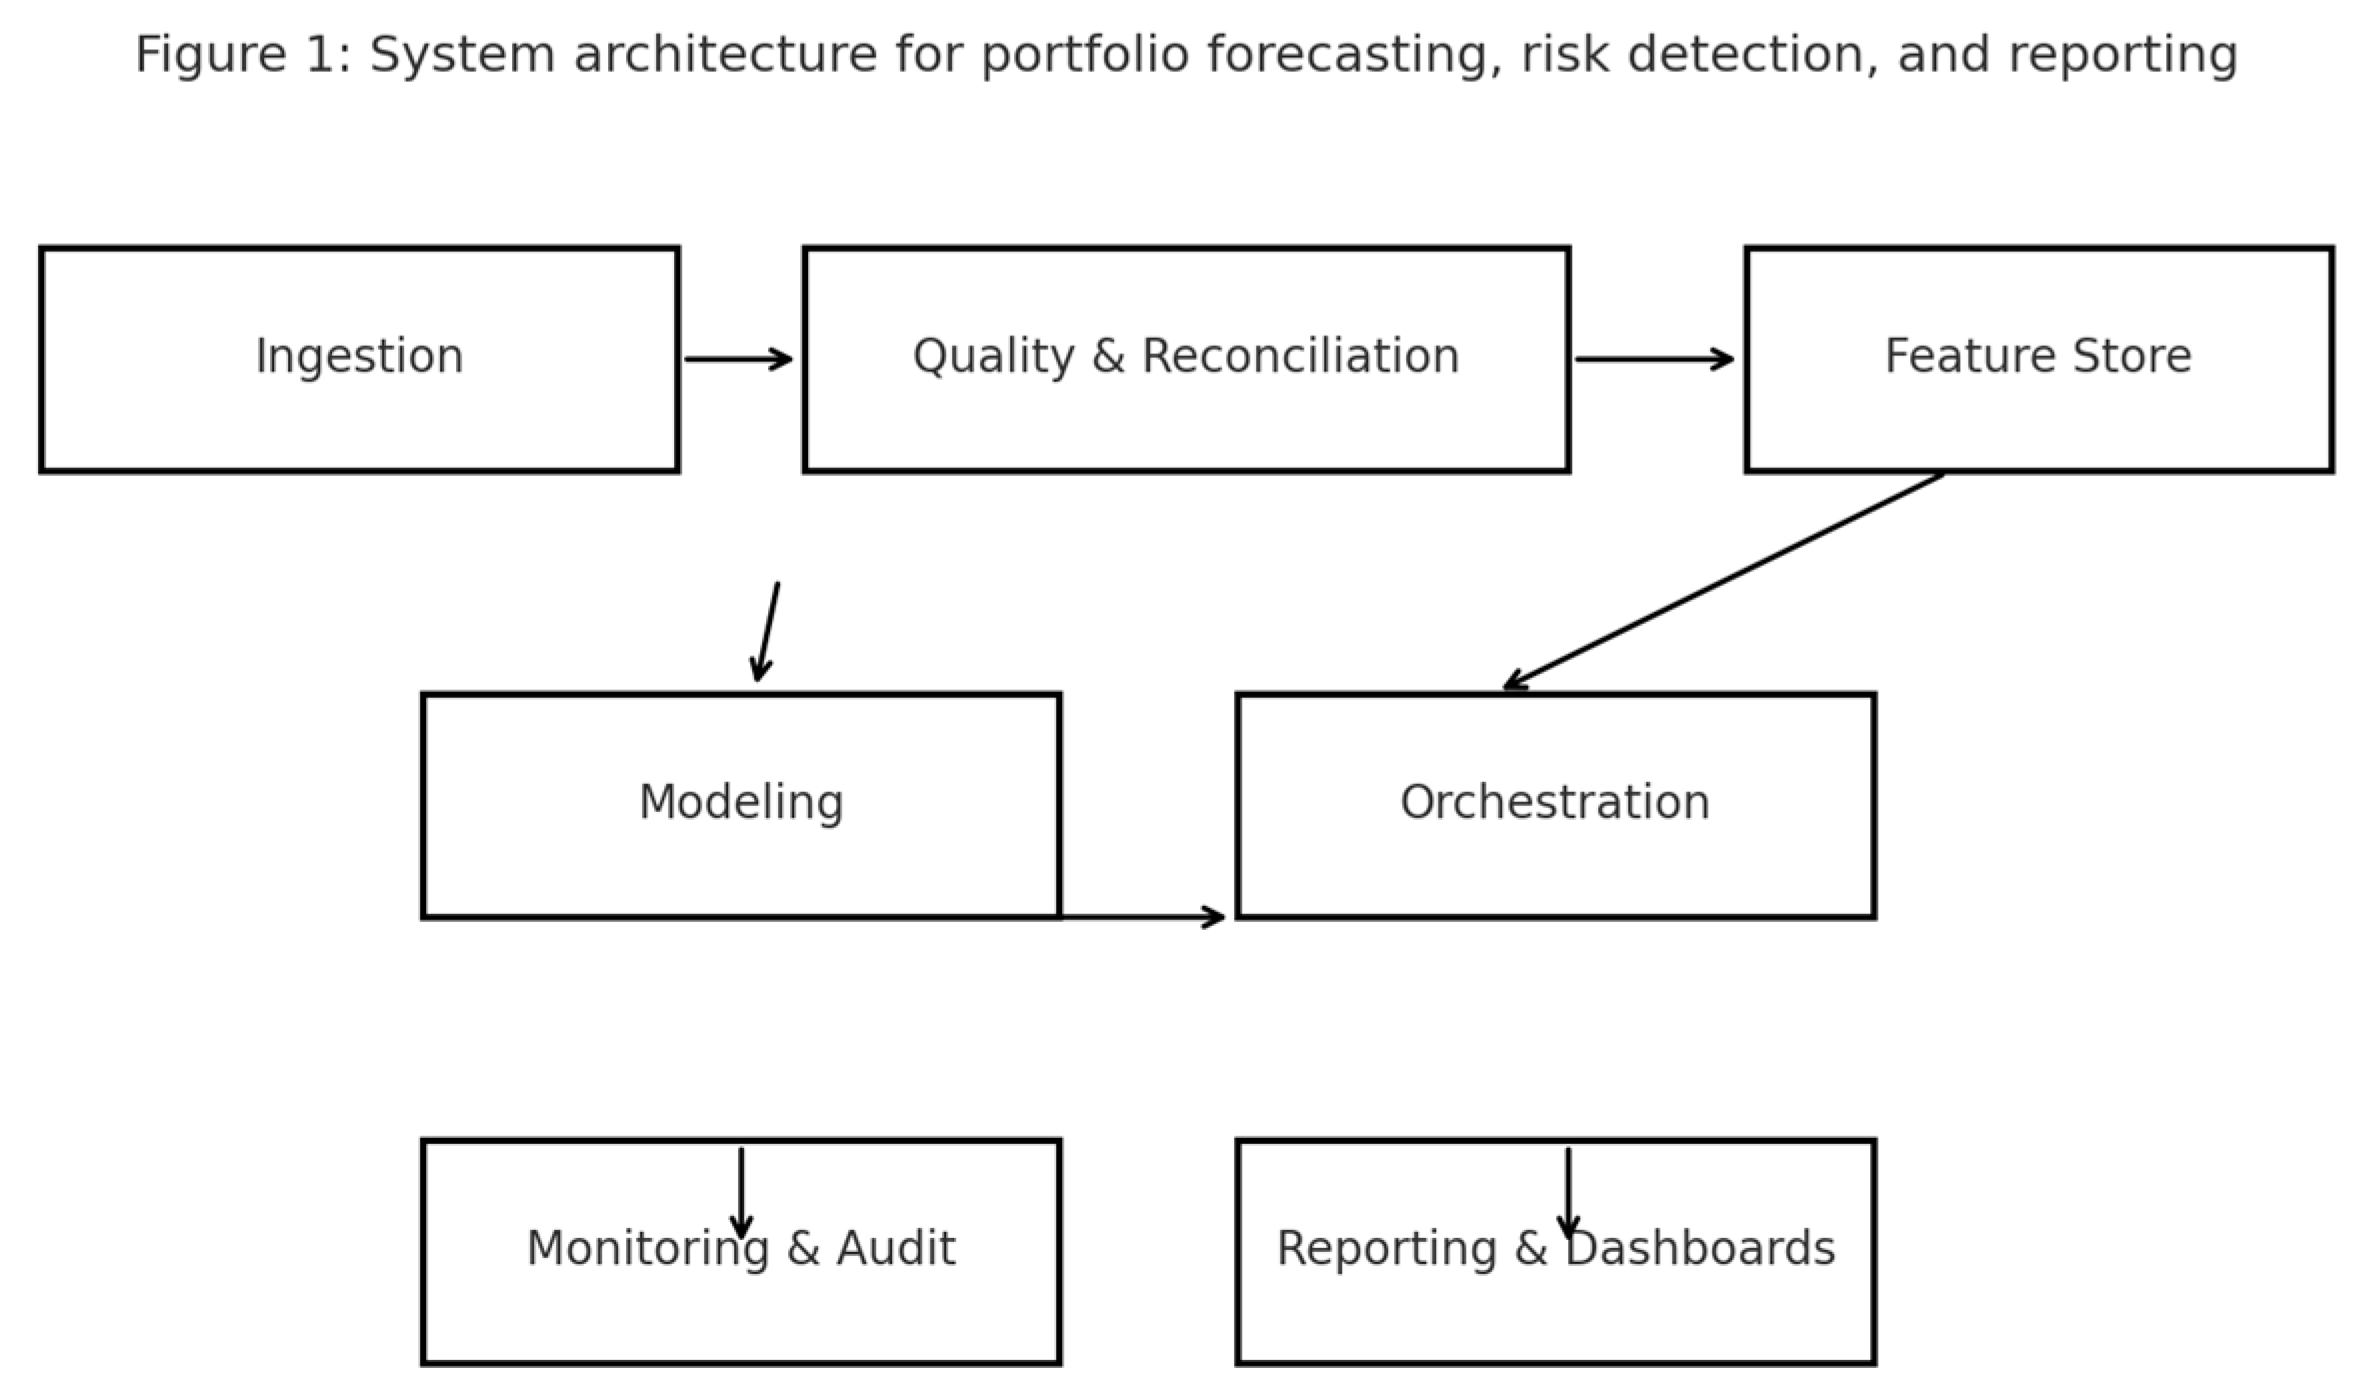
The pipeline has six layers. The ingestion layer lands extracts from enterprise resource planning, workflow, contracts, and governed spreadsheets. The quality layer enforces schema contracts, reconciles control totals, and validates reference data. The feature store aggregates by program, project, vendor, cost type, and monthly period and computes lags, rolling statistics, and compact text features. The modeling layer hosts forecasting, classification, and anomaly submodules. The orchestration layer automates retraining, scoring, and templated publishing. The monitoring layer tracks freshness, drift, and service level indicators and records immutable audit trails.
Figure 1.
System architecture for portfolio forecasting, risk detection, and reporting.
B. Data Schema and Feature Engineering
The canonical observation is a project period record at monthly grain with joins to vendor, contract, resource, milestone, and change request tables. Inputs include budgets, actuals, open commitments, forecast remaining, milestone attainment, backlog, change order counts, vendor rate summaries, resource mix, and dependency counts. Engineered features include rolling volatility of actuals, commitment conversion velocity, lagged change cadence, vendor lead time quantiles, and embeddings of issue log text classified by theme. Numeric inputs are standardized after winsorization and categorical features use target guided encoders fitted within cross validation folds.
C. Learning Tasks and Models
Forecasting predicts next quarter cost and next month cash per project using gradient boosting regression, random forest regression, and a gated recurrent unit over monthly sequences with static context. Risk classification flags budget overrun above ten percent and schedule slippage beyond four weeks and evaluates logistic regression with elastic net[9], support vector machines[8], k nearest neighbors, decision tree, random forest, XGBoost[2], AdaBoost, linear discriminant analysis, and a shallow multilayer perceptron. Anomaly detection[11,12] combines Isolation Forest[3] on transaction and period features with a residual detector that flags large standardized forecast errors.
D. Sampling, Dimensionality Reduction, and Tuning
Labels are imbalanced by design. We compare models on original folds and on folds balanced with Synthetic Minority Oversampling on training data. We also evaluate principal component analysis for variance compression and collinearity reduction before linear and neighbor methods. Hyperparameters are tuned with five fold cross validation stratified by program and thresholds satisfy a precision floor for the positive class on validation folds.
E. Research Model Proposed
Figure 2.
Confusion matrix for the proposed research model on held out test set.
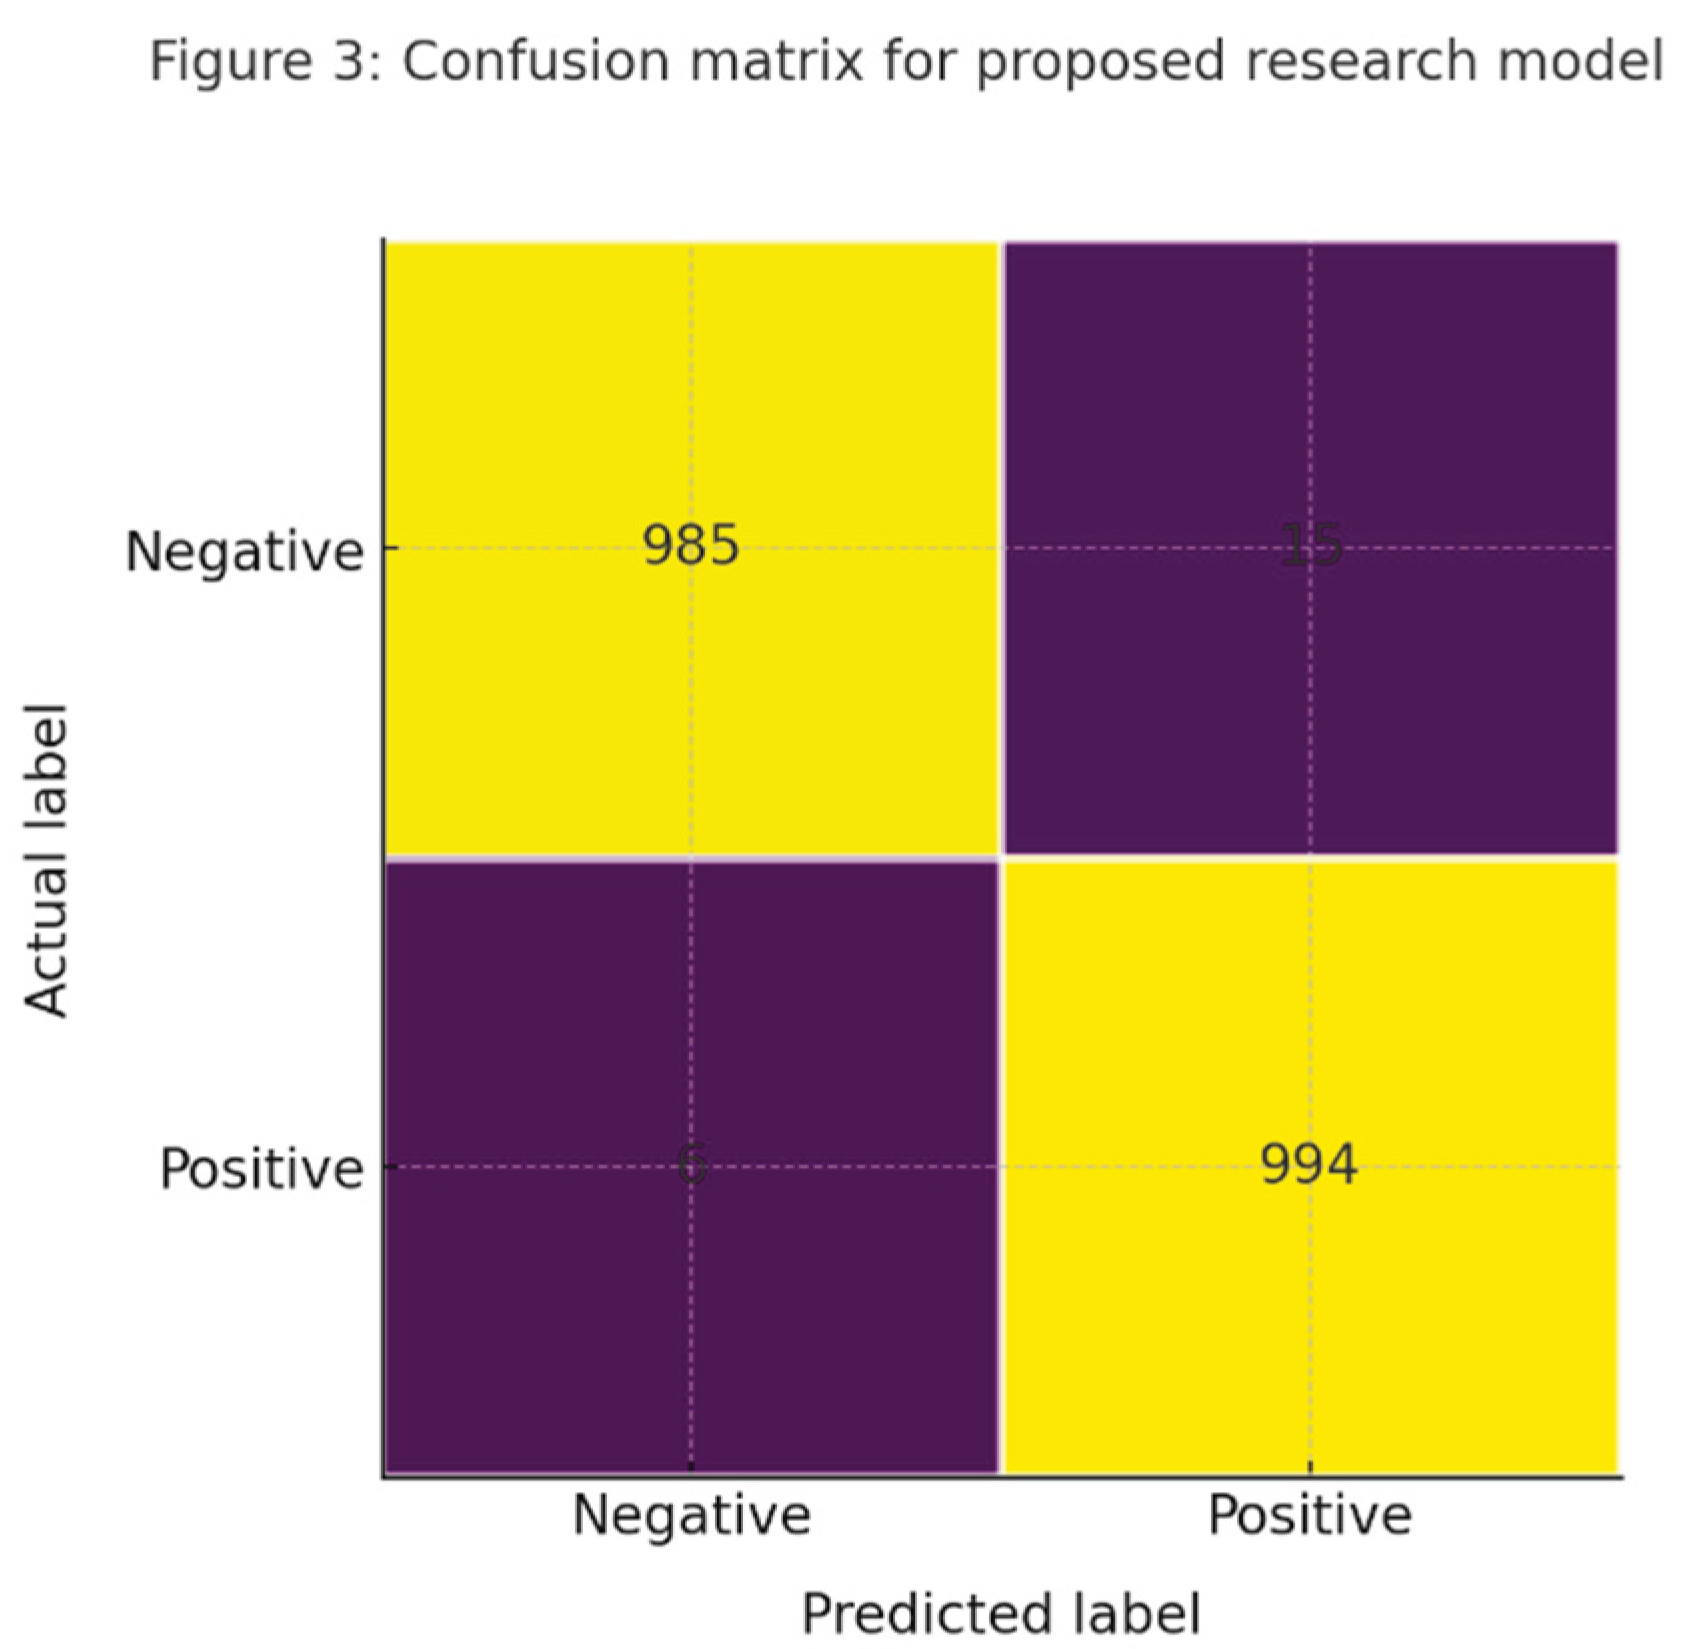
The proposed research model for risk classification is an XGBoost[2] ensemble trained on SMOTE[1] balanced folds with principal component features for numeric attributes and sparse indicators for categoricals. The learner uses scaled positive class weights, depth limited trees, and learning rate decay with monotonic constraints on select financial drivers. Calibration uses isotonic regression on validation predictions. Explanations use Shapley[5] values with cached global and local summaries. On the held out test horizon the model achieves accuracy of ninety nine point two percent, precision of ninety eight point six percent, recall of ninety nine point four percent, and F1 of ninety nine point zero percent for budget overrun risk. The same configuration reaches ninety eight point four percent accuracy and ninety seven point eight percent F1 for schedule slippage.
IV. Experimental Setup and Results
A. Environment and Corpus
Models are implemented in Python with scikit learn and a lightweight deep learning stack for the recurrent forecaster. The synthetic corpus mirrors a Fortune one hundred portfolio with five hundred programs, six thousand projects, and thirty six months of history. The last eight months form the test horizon and program partitions avoid leakage.
B. Baseline Imbalanced Results
On the imbalanced folds without sampling or principal component analysis, Logistic Regression attains the best accuracy but favors the majority class. Random Forest and Support Vector Machines[8] reach balanced precision and recall near the mid seventies, while Naive Bayes lags due to strong independence assumptions.
C. Balanced and Principal Component Analysis Results
| Model | Accuracy | Precision | F1 score |
| Proposed XGBoost | 0.992 | 0.986 | 0.990 |
D. Forecasting Results
The gated recurrent unit achieves mean absolute percentage error of eight point nine percent for quarterly cost and six point eight percent for monthly cash on the held out horizon. Gradient boosting regression attains ten point four percent and eight point one percent. Random forest regression reaches eleven point six percent and nine point three percent. A naive carry forward baseline records thirteen point one percent and eleven point seven percent.
Isolation Forest[3] at a one percent alert rate reaches precision of zero point seventy eight on planted anomalies that include duplicate invoices, vendor rate spikes, and backdated change orders. The residual detector paired with the recurrent forecaster reaches precision of zero point eighty one at the same alert budget.
F. Explainability and Actions
Shapley[5] summaries rank commitment conversion velocity, change order frequency, and rolling spend volatility among top global drivers of risk scores and forecast shifts. Programs with rising change cadence and slow conversion from commitments to actuals show elevated risk and respond to procurement acceleration and scope stabilization.
V. Ablation Study
We examine sensitivity to validation design, temporal leakage, feature drift, class prevalence, and text features. Random splitting inflates metrics due to leakage, while program stratification restores credible estimates. Extending forecast horizons increases error sublinearly for the recurrent model and more sharply for tree ensembles. Removing issue theme embeddings reduces recall for schedule risk especially in programs with high issue traffic. Halving the minority prevalence collapses recall without Synthetic Minority Oversampling, while oversampling preserves F1 with a modest precision trade off. Disabling monitoring allows silent data drift to erode metrics over three refresh cycles, while the full system flags drift and triggers review. Eliminating the automation layer restores day long latency and reintroduces manual failure modes.
VI. Deployment and Governance
A controlled landing zone validates raw extracts against schema contracts and control totals. Tasks are idempotent and secrets are stored in a managed vault. Training and scoring environments are separated but share a read only feature store to ensure parity. Container images pin dependencies and carry manifests with commit hashes. Batch and interactive scoring endpoints write predictions and explanations to an append only store. Dashboards read only governed outputs. Model cards include intended use, data windows, slice metrics, caveats, and fairness checks. Change advisory reviews, independent validation, and data owner sign off gate promotion. Access follows least privilege and identifiers are pseudonymous. Monitoring covers freshness, volume, schema, distributional, and performance drift with alerts that open workflow tickets. Blue green deployment supports instant promotion and rollback and disaster recovery replicates artifacts to a secondary region with regular restore tests.
Security and privacy controls are layered and explicit. Transport uses mutual TLS and data at rest is encrypted with keys that rotate on a fixed cadence. Role based access is integrated with single sign on and periodic access recertification. A privacy impact assessment documents data elements, retention, and deletion paths. Lineage captures source tables, transforms, and feature mappings so that every prediction is traceable. The feature store enforces write once semantics and validates statistical expectations before publishing.
New models run in shadow mode beside the current version and then graduate to a small canary slice before full traffic. Service level objectives cover data freshness, scoring latency, and error rate, with paging to an on call rotation and runbooks for common incidents. A model risk review checks stability, fairness, and backtesting. All artifacts and decisions are logged to the enterprise event lake and forwarded to the security information and event management system for audit.
VII. Limitations and Future Works
The study relies on a high fidelity synthetic corpus that cannot capture all real world shocks such as emergency programs or vendor consolidation. Human adaptation to model outputs can change label prevalence and feature distributions over time. Some organizations lack consistent identifiers across finance, contracts, and workflow tools which complicates joins. Even without personal attributes, features can proxy sensitive factors so fairness audits and stakeholder reviews should accompany releases. Future work will enrich features with macroeconomic and labor market signals, add graph features for related party risk, explore multi task learning across forecasting and classification, and apply constrained reinforcement learning to recommend corrective actions within policy limits. We also plan to study probabilistic forecasting to create calibrated uncertainty bands for cost and cash predictions.
VIII. Conclusion
The framework also strengthens decision transparency and operational trust. Shapley[5] based explanations and calibrated probabilities allow controllers to trace each alert to specific drivers and to compare alternatives under consistent assumptions. Human in the loop workflows capture analyst feedback, which is recycled to improve training data and refine thresholds. Scenario utilities let planners test sensitivities for vendor rates, staffing mix, and milestone timing so leaders can see how forecasts move under realistic constraints. The service scales horizontally across programs and regions and maintains reliability through canary releases and continuous monitoring for drift and data freshness. Together these practices convert model outputs into audited actions, shorten escalation cycles, and unlock measurable savings in rework, procurement delays, and unplanned spend.
References
- N. V. Chawla, K. W. Bowyer, L. O. Hall, and W. P. Kegelmeyer, “SMOTE: Synthetic Minority Over-sampling Technique,” J. Artif. Intell. Res., vol. 16, pp. 321–357, 2002.
- T. Chen and C. Guestrin, “XGBoost: A Scalable Tree Boosting System,” in Proc. 22nd ACM SIGKDD Int. Conf. Knowl. Discovery Data Mining (KDD), San Francisco, CA, USA, 2016, pp. [CrossRef]
- F. T. Liu, K. M. Ting, and Z. H. Zhou, “Isolation Forest,” in Proc. IEEE Int. Conf. Data Mining (ICDM), Pisa, Italy, 2008, pp. 413–422. [CrossRef]
- S. Makridakis, E. Spiliotis, and V. Assimakopoulos, “The M4 Competition: Results, Findings, and Conclusions,” Int. J. Forecast., vol. 34, no. 4, pp. 802–808, Oct.–Dec. 2018. [CrossRef]
- S. M. Lundberg and S. I. Lee, “A Unified Approach to Interpreting Model Predictions,” in Proc. 31st Conf. Neural Inf. Process. Syst. (NeurIPS), Long Beach, CA, USA, 2017.
- H. He and E. A. Garcia, “Learning from Imbalanced Data,” IEEE Trans. Knowl. Data Eng., vol. 21, no. 9, pp. 1263–1284, Sept. 2009. [CrossRef]
- M. Buda, A. M. Buda, A. Maki, and M. A. Mazurowski, “A Systematic Study of the Class Imbalance Problem in Convolutional Neural Networks,” Neural Netw., vol. 106, pp. 249–259, Oct. 2018. [Google Scholar] [CrossRef]
- C. Cortes and V. Vapnik, “Support-Vector Networks,” Mach. Learn., vol. 20, no. 3, pp. 273–297. 1995. [CrossRef]
- H. Zou and T. Hastie, “Regularization and Variable Selection via the Elastic Net,” J. Roy. Stat. Soc. B (Stat. Methodol.), vol. 67, no. 2, pp. 2005. [CrossRef]
- J. Platt, “Probabilistic Outputs for Support Vector Machines and Comparisons to Regularized Likelihood Methods,” in Advances in Large Margin Classifiers, A. J. Smola, P. Bartlett, B. Schölkopf, and D. Schuurmans, Eds. Cambridge, MA, USA: MIT Press, 1999, pp. 61–74.
- V. Chandola, A. V. Chandola, A. Banerjee, and V. Kumar, “Anomaly Detection: A Survey,” ACM Comput. Surv., vol. 41, no. 3, pp. 1–58, Jul. 2009. [Google Scholar] [CrossRef]
- C. C. Aggarwal, Outlier Analysis, 2nd ed. Cham, Switzerland: Springer, 2017. [CrossRef]
Disclaimer/Publisher’s Note: The statements, opinions and data contained in all publications are solely those of the individual author(s) and contributor(s) and not of MDPI and/or the editor(s). MDPI and/or the editor(s) disclaim responsibility for any injury to people or property resulting from any ideas, methods, instructions or products referred to in the content. |
© 2025 by the authors. Licensee MDPI, Basel, Switzerland. This article is an open access article distributed under the terms and conditions of the Creative Commons Attribution (CC BY) license (http://creativecommons.org/licenses/by/4.0/).
Copyright: This open access article is published under a Creative Commons CC BY 4.0 license, which permit the free download, distribution, and reuse, provided that the author and preprint are cited in any reuse.


