
Submitted:
23 October 2025
Posted:
24 October 2025
You are already at the latest version
Abstract
Financial statement fraud (FSF) is more prevalent in economies with high information asymmetry and weak institutional control, threatening investor trust and financial stability. This study proposes an integrated, decision-centric framework combining machine learning (ML), explainable artificial intelligence (XAI), and decision curve analysis (DCA) to improve detection under class-imbalanced conditions. Using financial statement data from 132 Mongolian companies (2013–2024; 969 firm-year observations and 21 ratios), Random Forest, XGBoost, LightGBM, and a Stacking Ensemble were implemented. Data imbalance was corrected with SMOTE and class weighting. Model performance was evaluated using PR-AUC, F1-score, and Recall, while interpretability was analyzed through SHAP, LIME, and counterfactual explanations. DCA and audit cost simulations were conducted to assess decision utility. The Stacking Ensemble achieved the best performance (PR-AUC = 0.93; F1 = 0.83). SHAP and LIME identified leverage and liquidity ratios as key predictors consistent with agency and signaling theories, with a SHAP Stability Index (SSI) of 0.87 confirming interpretability. DCA results indicated a 7–9% improvement in decision efficiency, 3–4% lower audit costs, and annual savings of MNT 80–100 million. The study introduces a transparent, cost-efficient framework integrating XAI, DCA, and audit cost simulation for optimized FSF detection and data-driven financial supervision.
Keywords:
financial statement fraud
; machine learning
; explainable artificial intelligence
; decision curve analysis
; audit cost simulation
; theoretical consistency
1. Introduction
Financial statement fraud (FSF) refers to the deliberate manipulation of financial information intended to mislead stakeholders, resulting in trillions of dollars in global losses each year and posing a serious threat to investor confidence and economic stability (Association of Certified Fraud Examiners, 2024). High-profile corporate scandals such as Enron and Wirecard have vividly exposed the weaknesses of manual auditing and rule-based detection systems, which remain particularly vulnerable in developing economies characterized by high information asymmetry and weak institutional capacity (Jan, 2021; Riskiyadi, 2024). Such vulnerabilities not only distort corporate accountability but also exert both direct and long-term adverse effects on macroeconomic stability, investment confidence, and the fairness of capital markets.
The primary challenge in detecting financial statement fraud (FSF) lies in its adaptive or “memory-based” nature. Fraud perpetrators deliberately adjust financial indicators to evade conventional detection signals, making static rule-based systems increasingly ineffective. Moreover, since fraudulent cases represent less than 1% of all financial observations, FSF constitutes a rare event problem—reducing detection sensitivity and compromising the stability of statistical models (Craja et al., 2020; Cheng et al., 2021). Traditional models, such as Beneish’s (1999) M-Score, have produced valuable insights; however, their explanatory capacity remains limited due to the inability to fully capture nonlinear dependencies, domain-specific heterogeneity, and variations in data quality (Perols, 2011). Theoretically, this study is grounded in agency theory (Jensen & Meckling, 1976) and signaling theory (Spence, 1973). According to these frameworks, information asymmetry between managers, owners, and investors generates incentives for financial manipulation, whereas financial statements function as a signal of corporate integrity and financial soundness. Under such conditions, distortions in liquidity and leverage ratios often reflect underlying firm-level risk exposure, making their detailed analysis a central pillar in the theoretical foundation of FSF detection.
In recent years, machine learning (ML) techniques have been increasingly adopted in the detection of financial statement fraud (FSF), demonstrating superior performance and predictive accuracy compared to traditional econometric models. Ensemble algorithms such as Random Forest, XGBoost, Support Vector Machine (SVM), and LightGBM have consistently outperformed conventional statistical approaches, as documented in prior studies (Kirkos et al., 2007; Ravisankar et al., 2011; Achakzai & Peng, 2023). Systematic reviews further corroborate the efficiency of ML-based frameworks, highlighting that hybrid models achieve, on average, a 10–20% improvement in overall performance (Ali et al., 2022; Shahana et al., 2023; Hernandez Aros et al., 2024).
Despite these advancements, several limitations remain evident in current FSF research. First, most empirical datasets are heavily U.S.-centric, which constrains cross-market generalizability. Second, textual proxy variables, such as those derived from Management Discussion and Analysis (MD&A) sections, are still underutilized. Third, robust methodologies for addressing class imbalance in highly skewed data environments have yet to be fully developed (Bertomeu et al., 2021; Rahman & Zhu, 2023; Li et al., 2024).
To address the above limitations, this study develops a decision-centric integrated framework that combines machine learning (ML), explainable artificial intelligence (XAI), and decision curve analysis (DCA), using Mongolia, a rapidly developing economy in East Asia, as a representative case. The primary objective is threefold: (i) to enhance the performance of ML models under class-imbalanced conditions, (ii) to validate the theoretical consistency and directional interpretability of key financial indicators, and (iii) to evaluate the cost–benefit implications of detection outcomes at the decision-making level. The empirical framework employs a suite of supervised algorithms, including Random Forest (RF), Support Vector Machine (SVM), XGBoost, and LightGBM, with model performance assessed through PR-AUC, Recall, and F1-score metrics. Among twenty-one financial ratios examined, the most influential predictors were identified and their interpretability quantified using SHAP and LIME techniques. Furthermore, Decision Curve Analysis was utilized to measure the practical decision utility and simulate reductions in audit costs, thereby linking detection accuracy with real-world decision effectiveness.
The methodological design of this study is implemented within an integrated framework termed the Decision-Centric FSF Detection Framework. This framework sequentially integrates theoretical foundations, data preprocessing, machine learning (ML) modeling, explainable artificial intelligence (XAI), and decision-level evaluation into a coherent analytical structure. It is specifically designed to achieve the triple objective of performance, interpretability, and decision optimization—that is, to ensure statistical accuracy, theoretical consistency, and practical decision efficiency simultaneously. Accordingly, this research advances theoretical, methodological, and practical dimensions of FSF detection by linking agency and signaling theories with contemporary approaches in XAI and decision analytics. The resulting framework proposes a transparent, evidence-based, and context-adaptive decision-support paradigm applicable to both emerging and developed markets, representing a novel methodological contribution to the literature (Cai & Xie, 2023; Duan et al., 2024; Nguyen Thanh & Phan Huy, 2025).
2. Literature Review
Traditional ratio-based analytical approaches have long provided the foundation for detecting financial statement fraud (FSF). However, their static nature limits their ability to capture the evolving behavioral patterns, data imbalance, and complex multidimensional interactions that characterize the digital economy (Perols, 2011; Shahana et al., 2023). In this context, machine learning (ML) has emerged as a modern, data-driven paradigm that surpasses rule-based systems and expert judgment by enabling dynamic pattern recognition, predictive modeling, and cost-sensitive decision-making (Ali et al., 2022; Ozbayoglu et al., 2020).
From 1999 to 2025, the methodological evolution of FSF detection has progressed from traditional statistical models to hybrid ensemble frameworks, deep learning and XAI integrations, and decision curve and cost-sensitive systems. Accordingly, this study builds upon this evolutionary logic by consolidating the most recent methodological advances, including imbalance correction techniques, stacking ensembles, LightGBM, LIME, and counterfactual explanations, as well as the SHAP Stability Index and Decision Curve Analysis (DCA), into a unified analytical design.
2.1. Evolution of FSF Detection Research
The Beneish (1999) M-Score model established the first systematic ratio-based framework for detecting financial statement fraud (FSF) by identifying abnormal variations in accounting indicators linked to managerial incentives and compensation structures. Kirkos et al. (2007) employed Bayesian networks and decision trees (DTs), achieving accuracy levels exceeding 90 percent and outperforming traditional logistic regression models. Perols (2011) demonstrated that Support Vector Machines (SVMs) and Neural Networks (NNs) can capture nonlinear dependencies more effectively, revealing complex data patterns that exceed the capacity of classical theoretical models.
During the 2010s, research integrating numerical indicators with natural language processing (NLP) gained momentum, shifting toward deeper analytical perspectives. Studies by Humpherys et al. (2011), Glancy and Yadav (2011), and Ravisankar et al. (2011) combined textual trust analysis, rule-based logic, and probabilistic neural network feature selection to achieve strong performance even under imbalanced data conditions (Huang et al., 2014; Kim et al., 2016).
2.2. Hybrid Mining and Machine Learning Frameworks
To overcome the limitations of single algorithms, hybrid machine learning (ML) approaches have become increasingly prevalent in FSF detection. Chen (2016) proposed a combined model that integrates decision trees and support vector machines (SVM), which reduced Type I error rates to below 8%. Lin et al. (2015) compared ML-based models with auditor judgment and confirmed their superior objectivity. Dutta et al. (2017) applied a combination of Random Forest (RF) and SVM with feature engineering to detect financial restatements, achieving an accuracy above 90 percent. Chen et al. (2019) identified risks associated with intra-group business linkages through ML modeling, while Hajek and Henriques (2017) demonstrated the effectiveness of SVM for pattern extraction from annual reports. Cheng et al. (2021) enhanced the robustness of imbalanced data using synthetic feature generation and fuzzy logic techniques (Rahman & Zhu, 2023). For addressing class imbalance, over-sampling techniques such as SMOTE and ADASYN (Chawla et al., 2002) have been widely adopted to generate more realistic class distributions. These techniques are often integrated into hybrid ensemble frameworks, substantially improving the sensitivity and recall of FSF detection. The evolution of these methodological advancements forms the theoretical foundation for the imbalance correction and stacking ensemble approach employed in the present study.
2.3. Deep Learning, NLP, and Multimodal Representations
Deep learning (DL) has revolutionized the detection of financial statement fraud (FSF) through its ability to integrate and process diverse semantic signals from heterogeneous data sources (Craja et al., 2020; Ozbayoglu et al., 2020; Peng & Yan, 2021). Fischer and Krauss (2018) employed an LSTM architecture to identify abnormal sequential patterns in financial time series, thereby capturing the temporal dynamics of fraudulent behavior. Mai et al. (2019) and Matin et al. (2019) applied CNN and LSTM methods to analyze the tone and linguistic structures of annual reports, achieving accuracy rates between 80 and 85 percent. Kraus and Feuerriegel (2017) experimented with transfer learning to facilitate knowledge transfer across domains, while Brown et al. (2020) employed topic modeling of MD&A sections to identify tendencies toward misreporting.
To address the “black box” nature of DL models, a range of explainable artificial intelligence (XAI) techniques such as SHAP, LIME, Counterfactual, and Permutation Importance have been developed to enhance the interpretability of ML models (Ribeiro et al., 2016; An et al., 2020; Cai & Xie, 2023). In this study, the XAI framework is validated through a combination of the SHAP Stability Index (SSI) and global and local consistency analysis, representing an innovative approach not previously applied in FSF research.
2.4. Ensemble Learning, XAI, and Dynamic Training
Ensemble learning methods such as Random Forest (RF), Gradient Boosting Machine (GBM), and XGBoost play a critical role in balancing the precision and recall trade-off under imbalanced data conditions (Kim et al., 2016; Achakzai & Peng, 2023; Duan et al., 2024). Bertomeu et al. (2021) demonstrated that the GBM model achieved an AUC exceeding 0.69 in predicting misreporting probabilities. In recent years, the stacking ensemble approach has emerged as a powerful strategy for combining base models, such as RF, XGBoost, and SVM, through a meta-learner, for example, LightGBM, thereby improving performance while enabling both global and local explanations using XAI techniques (Bao et al., 2020). Measuring feature stability through Permutation Importance and the SHAP Stability Index has become a key direction for validating model reliability. In this study, this approach is applied to evaluate the trade-off between feature stability and sensitivity, ensuring consistency between interpretability and model robustness.
2.5. Domain Adaptation, Proxy Sensitivity, and Emerging Market Contexts
The legal environment, transparency level, ownership structure, and cultural heterogeneity have a significant impact on FSF detection outcomes (Riskiyadi, 2024; Lee et al., 2025). Nguyen Thanh and Phan Huy (2025) found that when the auditor’s opinion is used as a proxy variable, model performance varies significantly across different national contexts. Rahman and Zhu (2023) concluded that the concentration of family ownership directly increases the vulnerability to FSF.
Proxy variables such as earnings quality and linguistic sentiment play a crucial role in determining model sensitivity. Deep learning (DL) models tend to perform better under these heterogeneous conditions, capturing subtle contextual nuances that traditional models often overlook (Jan, 2021; Mai et al., 2019). In recent years, the application of Decision Curve Analysis (DCA) (Vickers & Elkin, 2006) to estimate a model’s net benefit and simulate audit cost-effectiveness has increased rapidly. This approach brings FSF detection closer to real-world decision-making by explicitly incorporating economic trade-offs between detection gains and auditing costs (Duan et al., 2024).
2.6. Research Hypotheses
From the above literature, it is evident that practical applications of FSF detection require an integrated framework capable of simultaneously satisfying the performance, explainability, and decision cost–benefit objectives. In other words, there is a need for a unified approach that combines high PR-AUC and Recall performance with interpretable XAI insights and cost-sensitive Decision Gain evaluation. Accordingly, this study aims to systematically test a series of hypotheses focusing on four key dimensions:
- (1)
- The impact of imbalance correction on model performance,
- (2)
- the relative importance and stability of financial features,
- (3)
- the theoretical consistency of XAI-based explanations, and
- (4)
- the decision-level utility and cost-effectiveness of the proposed framework.
Through these hypotheses, the study seeks to validate whether the integrated approach can deliver statistically reliable, theoretically consistent, and decision-supportive outcomes in FSF detection.
- H1. The top one-third of features ranked by SHAP mean absolute values and permutation importance will be dominated by liquidity and leverage variables, exhibiting low Coefficient of Variation (CoV) and high stability as measured by the SHAP Stability Index (SSI).
- H2. The directional effects of SHAP values (for example, an increase in leverage leads to higher risk, while a decrease in liquidity increases risk) will show more than 70 percent theoretical consistency with financial theory. They will be validated by LIME and counterfactual sensitivity analysis, aligning with agency theory and the Fraud Triangle framework.
- H3. The combination of balanced class weighting and SMOTE resampling will reduce the Expected Cost compared with the baseline model, resulting in higher Decision Gain (DG) and lower auditing costs under Decision Curve Analysis (DCA), thereby demonstrating practical cost efficiency.
- H4. After Platt and Isotonic calibration, the Brier score will decrease. In contrast, the calibration slope will approach one and the intercept will approach 0, leading to improved net benefit across practical decision thresholds.
Together, these hypotheses aim to establish a comprehensive validation strategy that integrates (i) global and local interpretability consistent with financial theory through SHAP stability, (ii) decision-level evaluation using cost–benefit metrics and DCA simulation, and (iii) probabilistic calibration quality assessment, ultimately confirming the reliability, explainability, and decision-support capability of the proposed integrated FSF detection framework.
3. Methodology
3.1. Research Design and Theoretical Framework
This study develops a decision-centric integrated framework for detecting Financial Statement Fraud (FSF) by combining Machine Learning (ML), Explainable Artificial Intelligence (XAI), and Decision Curve Analysis (DCA). The proposed framework integrates three complementary components: the performance metrics of ML models, the interpretability capacity of XAI methods, and the practical decision utility derived from DCA. Together, these elements form a performance–explainability–decision triadic evaluation system that links statistical accuracy, theoretical consistency, and decision-level benefits.
The main objectives of this study are threefold: (i) to enhance the performance of ML models under conditions of class imbalance, (ii) to validate the explanatory relevance and directional consistency of financial indicators, and (iii) to assess the real-world cost–benefit implications of FSF detection at the decision-making level. Through this integrated design, the study aims to bridge methodological rigor with practical applicability, ensuring that model outcomes are both theoretically grounded and economically meaningful.
The theoretical foundation of this study is grounded in agency theory (Jensen & Meckling, 1976) and signaling theory (Spence, 1973). According to these theories, information asymmetry and incentive misalignment between managers and owners can induce the manipulation of financial statements. In this context, liquidity and leverage indicators serve as crucial signals of corporate credibility and risk exposure. Building upon these theoretical premises, the study implements a decision-centric framework for FSF detection that integrates the dynamic detection capability of machine learning (ML), the theoretical consistency and interpretability of explainable artificial intelligence (XAI), and the practical cost-benefit evaluation of Decision Curve Analysis (DCA). This integration enables a balanced approach that connects theoretical soundness, empirical performance, and decision-level applicability in detecting financial statement fraud.
Figure 1.
FSF detection framework (ML, XAI, DCA).
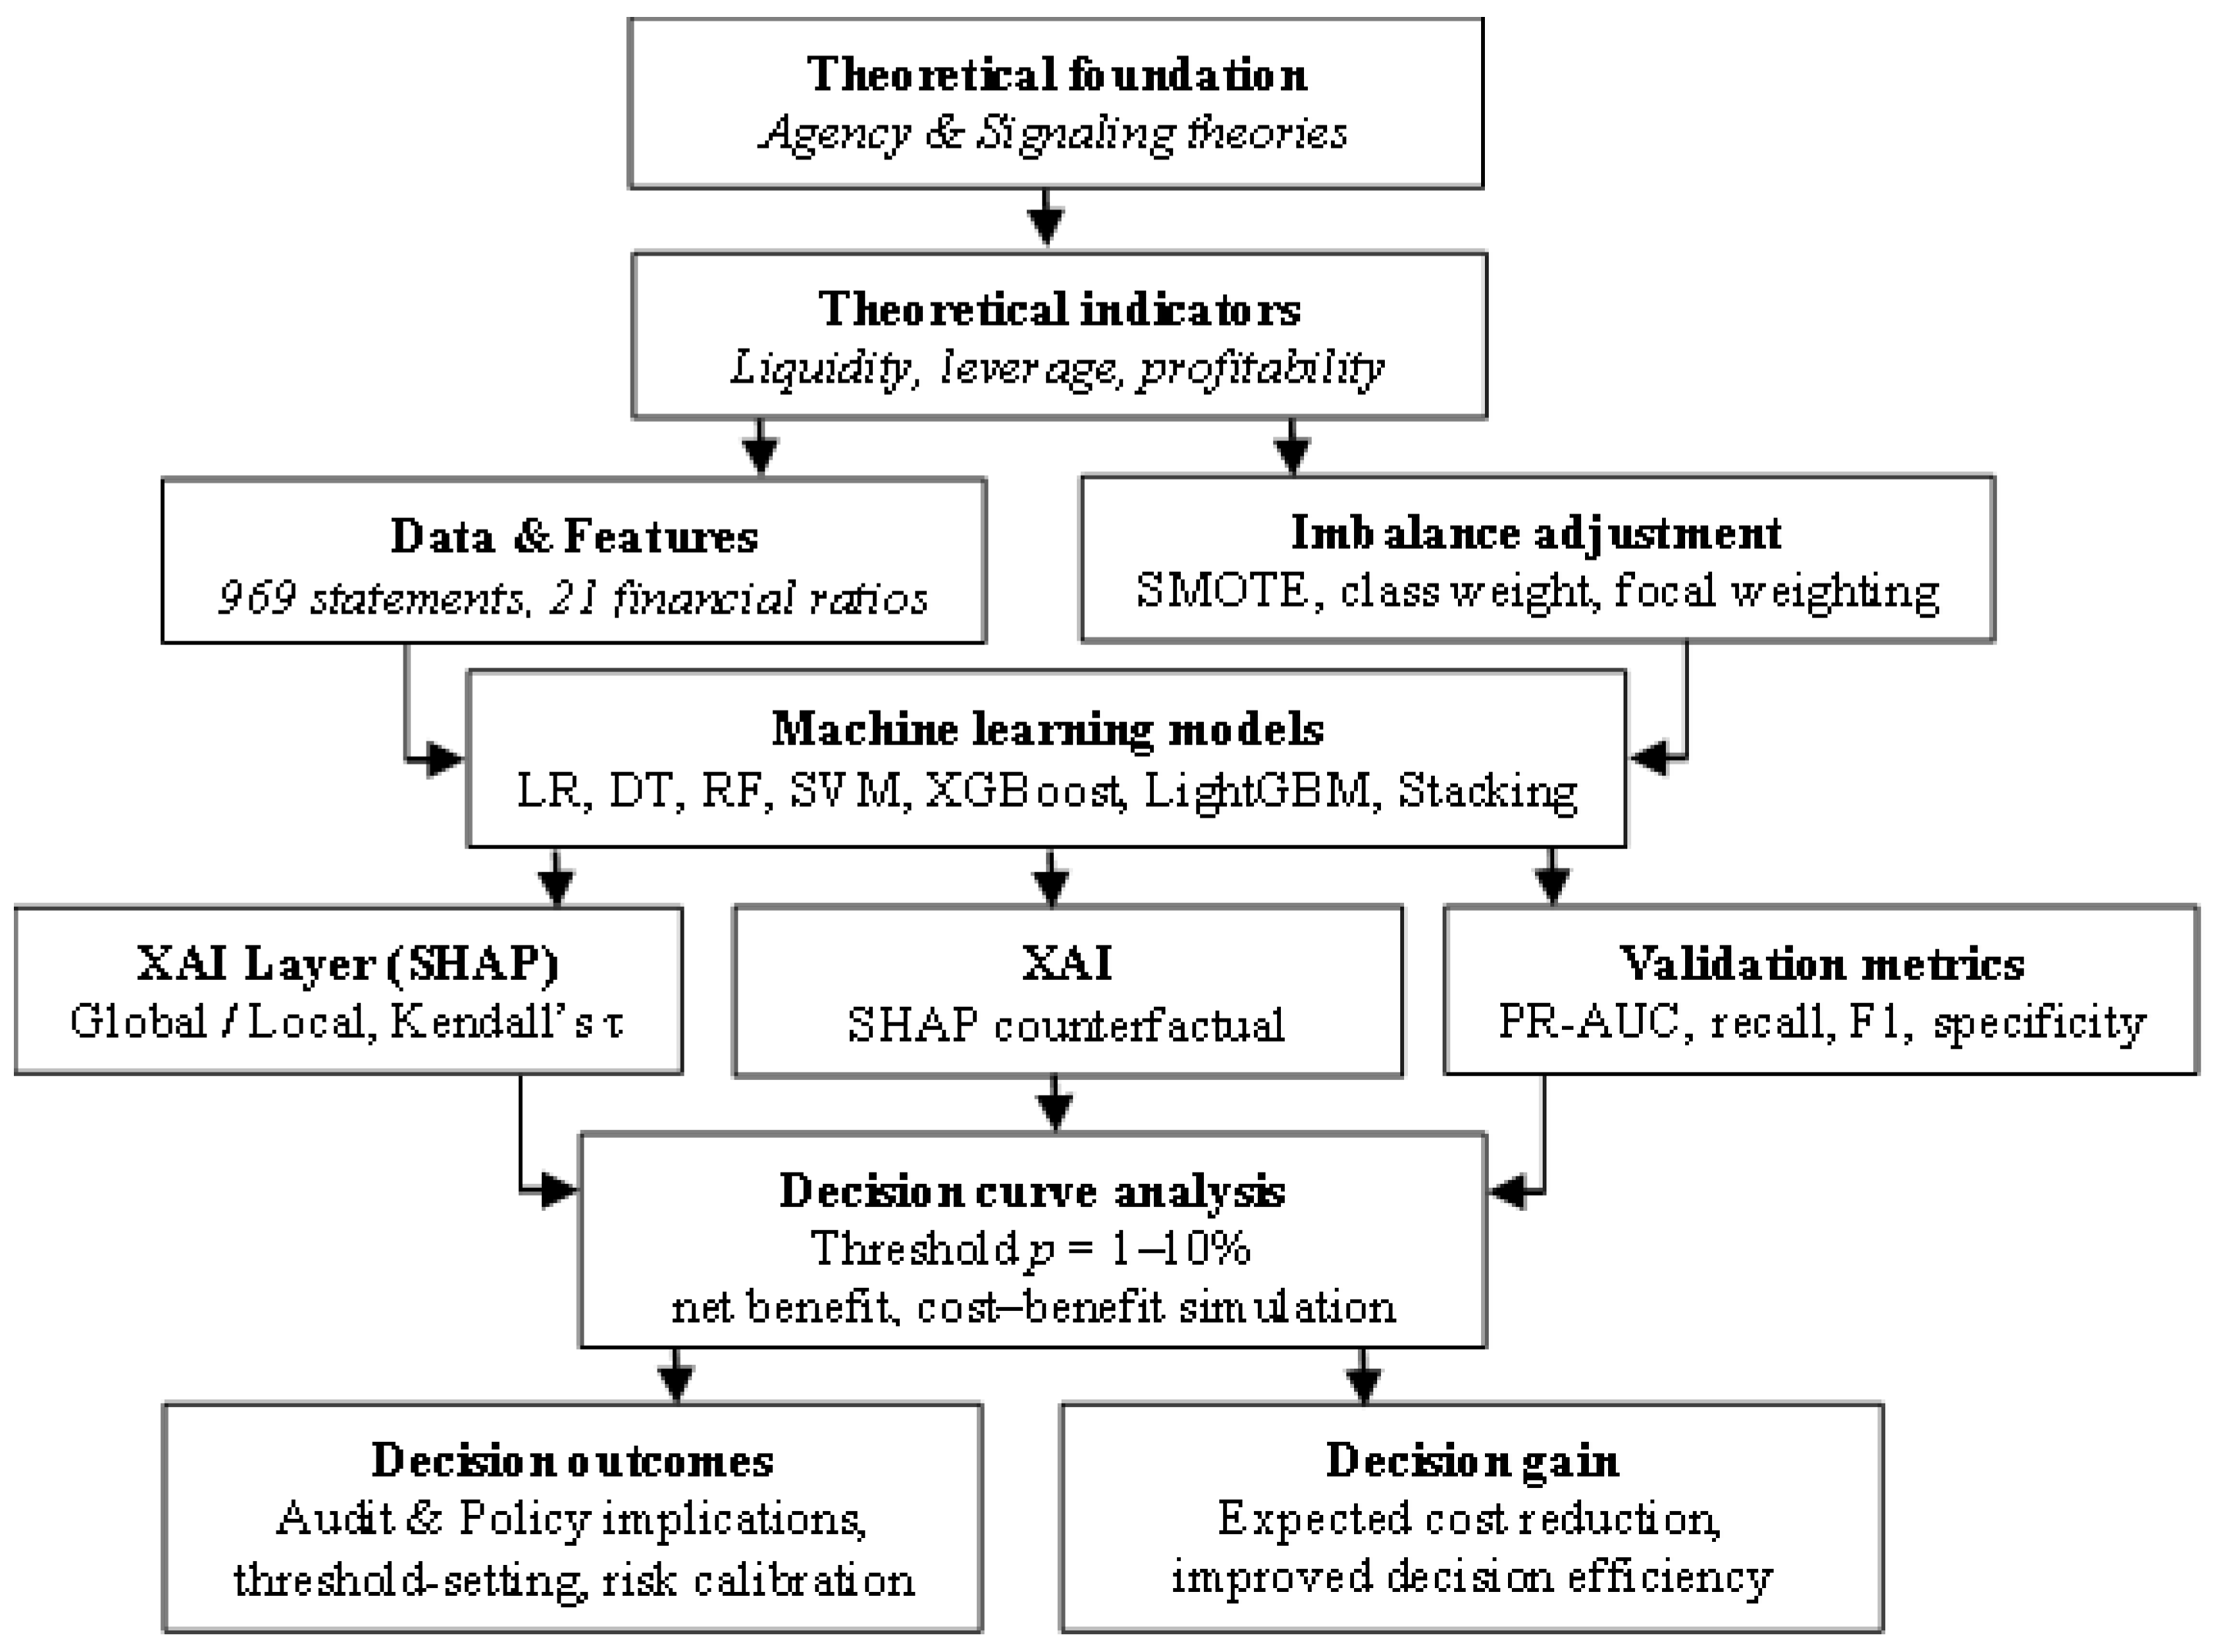
The proposed framework sequentially integrates the theoretical foundation, financial indicators, data preprocessing, imbalance correction, machine learning modeling, explainable artificial intelligence (XAI) interpretation, probability calibration, and decision-level evaluation into a coherent analytical structure. This design ensures methodological continuity across all stages of analysis. Aligned with both agency and signaling theories, the framework establishes a comprehensive methodological system that supports the integration of performance, explainability, and decision dimensions. As such, it provides a unified approach that links theoretical soundness, statistical robustness, and practical decision relevance in detecting financial statement fraud.
3.2. Data Source and Variable Definition
The study utilizes financial statement data from 132 Mongolian companies, covering the period from 2013 to 2024, which comprises 969 firm-year observations. The sample consists of firms from key sectors, including manufacturing, services, trade, and construction, thereby ensuring broad sectoral representation. The dataset exhibits a noticeable class imbalance between fraudulent and non-fraudulent cases, reflecting the rarity of detected financial statement fraud in real-world contexts. All financial data were obtained from the Refinitiv database and subjected to a rigorous data quality verification process. Following validation, several preprocessing steps were implemented:
- Outlier detection and removal using the interquartile range (IQR) method;
- Standard normalization through Z-score transformation;
- Dummy variable encoding for categorical attributes;
- SMOTE–Tomek resampling to correct class imbalance and enhance model stability.
These preprocessing procedures ensured that the dataset was statistically robust, normalized, and adequately balanced for subsequent machine learning analysis.
The dependent variable in this study is the fraud status of financial statements, defined as a binary outcome where zero indicates fraudulent and 1 indicates non-fraudulent observations. The independent variables comprise 21 financial ratios (FR1 to FR21) that measure the firm’s financial condition and performance. These ratios encompass key dimensions such as profitability, liquidity, leverage, cash flow, and cost structure, which are commonly employed in fraud detection and financial risk assessment research. Feature selection was conducted based on a dual criterion, combining the Mann–Whitney U test (p < 0.05) and Cohen’s d ≥ 0.5, to ensure that only statistically significant and practically meaningful variables with discriminative power were retained for subsequent modeling. To address potential multicollinearity, the Variance Inflation Factor (VIF) was computed, and a conservative upper threshold of VIF < 5 was applied. This procedure ensured minimal interdependence among variables, contributing to the overall reliability and stability of the modeling framework.
3.3. Machine Learning Models, Training Protocol, and XAI Analysis
The study employs multiple machine learning (ML) algorithms to detect financial statement fraud, including Logistic Regression, Decision Tree, Random Forest (RF), Support Vector Machine (SVM) with radial basis function kernel, Extreme Gradient Boosting (XGBoost), Light Gradient Boosting Machine (LightGBM), and a Stacking Ensemble model (base learners: RF, SVM, XGBoost; meta learner: LightGBM). To address the issue of class imbalance, a combination of the Synthetic Minority Oversampling Technique (SMOTE) and a class weight configuration of “balanced” was applied. The training protocol followed an 80-20 train-test split and employed a 10-fold stratified cross-validation with five repetitions to ensure model robustness and reduce variance. Hyperparameter optimization was conducted using both GridSearchCV and Bayesian optimization methods to identify optimal model configurations. The performance of each model was evaluated using multiple complementary metrics, including Precision-Recall Area Under the Curve (PR-AUC), Recall, F1-score, Specificity, Precision, Brier score, calibration slope, and intercept. These evaluation measures provided a balanced assessment of model discrimination, calibration, and generalization capabilities.
In the explainability analysis, several XAI methods were employed, including Shapley Additive exPlanations (SHAP), Local Interpretable Model-Agnostic Explanations (LIME), and Counterfactual sensitivity analysis. At the global level, the consistency between SHAP values and permutation importance was assessed using Kendall’s τ correlation coefficient, which measures rank-order dependence among features. At the local level, the individual contribution and directional impact of each case were visualized using force plots and decision plots, providing an intuitive interpretation of model decisions. Feature stability was evaluated using both the Coefficient of Variation (CoV) and the SHAP Stability Index (SSI) to ensure the robustness and reproducibility of model interpretations. This stage aimed to validate the theoretical coherence of XAI explanations, particularly in confirming the significance and directional influence of liquidity and leverage indicators, which serve as critical financial determinants of fraud risk according to agency and signaling theories.
3.4. Decision Analysis and Hypothesis Testing
At the decision level, the Decision Curve Analysis (DCA) approach (Vickers & Elkin, 2006) was applied to evaluate model utility within an estimated risk range of 1% to 15%. Three key indicators were computed: Net Benefit (NB), Decision Gain (DG), and Average Utility Net Benefit (AUNB) to assess the practical value of model-based decisions beyond conventional statistical performance metrics. This method enables a quantitative assessment of the cost-benefit trade-off, providing direct insights into the economic efficiency of fraud detection outcomes. To evaluate the effect of cost-sensitive calibration, the area under the DCA curve (AUNB) and the Decision Gain indicators were compared across models with different class weighting and focal-like configurations. Hypotheses H3 and H4 were empirically tested to verify the statistical significance of probability calibration quality and decision utility improvement. Statistical significance was assessed using the Wilcoxon signed-rank test across all cross-validation folds, ensuring the robustness of inference. The evaluation framework synthesized three complementary dimensions: (i) model performance, (ii) interpretability quality, and (iii) decision-level benefit, thereby ensuring a balanced and comprehensive validation of both predictive and practical effectiveness.
4. Results
4.1. Descriptive Statistics and Preliminary Analysis
The dataset used in this study comprises 969 firm-year financial statements from 132 Mongolian companies, covering the period from 2013 to 2024. Firms were classified into two categories: fraudulent and non-fraudulent. Approximately 24.6 percent of the sample firms were identified as belonging to the fraudulent category, indicating a moderate imbalance between the two groups.
The analysis incorporated 21 financial ratios (FR1 to FR21) grouped into five major categories: profitability, liquidity, leverage, expense structure, and cash flow indicators. According to the results of the Mann–Whitney U test and the Cohen’s d effect size analysis, five financial indicators exhibited statistically significant differences between the fraudulent and non-fraudulent groups (p < 0.05). These findings confirm that specific financial performance metrics systematically distinguish firms with potential misreporting behaviors, providing a sound empirical basis for subsequent machine learning modeling.

Table 1.
Descriptive statistics and group difference analysis of key financial variables.
| No. | Financial Indicator | Code | Median (NF) | Median (F) | p-value | Cohen’s d |
| 1 | Sales Revenue / Total Assets | FR1 | 0.3001 | 0.4213 | 0.0011 | −0.1538 |
| 2 | Short-Term Liabilities / Sales Revenue | FR2 | 0.8157 | 0.5301 | 0.0156 | 0.0112 |
| 3 | Total Liabilities / Sales Revenue | FR3 | 2.2063 | 0.7668 | 0.0000 | −0.0314 |
| 4 | Net Profit / Sales Revenue | FR4 | −0.1014 | 0.0041 | 0.0000 | 0.0886 |
| 5 | Net Profit after Tax / Total Assets | FR5 | −0.0153 | 0.0009 | 0.0000 | 0.3471 |
| 6 | Inventory / Sales Revenue | FR6 | 0.5412 | 0.3472 | 0.0092 | 0.0440 |
| 7 | Inventory / Current Assets | FR7 | 0.4298 | 0.4730 | 0.4460 | 0.0399 |
| 8 | Cash / Sales Revenue | FR8 | 0.0189 | 0.0145 | 0.0269 | 0.0666 |
| 9 | Cash / Current Assets | FR9 | 0.0150 | 0.0164 | 0.7958 | 0.0959 |
| 10 | Operating Expense / Sales Revenue | FR10 | 0.2105 | 0.1150 | 0.0020 | 0.0639 |
| 11 | Administrative Expense / Sales Revenue | FR11 | 0.0652 | 0.0425 | 0.0411 | 0.0686 |
| 12 | Non-Operating Expense / Sales Revenue | FR12 | 0.0504 | 0.0411 | 0.1936 | 0.0581 |
| 13 | Retained Earnings / Total Assets | FR13 | 0.0003 | 0.0537 | 0.0000 | 0.3610 |
| 14 | Retained Earnings / Shareholders’ Equity | FR14 | 0.0467 | 0.1276 | 0.2219 | −0.0731 |
| 15 | Tangible Assets / Total Assets | FR15 | 0.5899 | 0.5510 | 0.4076 | −0.0611 |
| 16 | Total Liabilities / Shareholders’ Equity | FR16 | 0.7030 | 0.3025 | 0.0001 | −0.2438 |
| 17 | Accounts Receivable / Net Sales | FR17 | 0.3675 | 0.3150 | 0.9368 | 0.0525 |
| 18 | Working Capital / Total Assets | FR18 | 0.1570 | 0.1480 | 0.8724 | 0.0664 |
| 19 | Gross Profit / Total Assets | FR19 | 0.0320 | 0.0550 | 0.0022 | 0.3216 |
| 20 | Total Liabilities / Total Assets | FR20 | 0.4910 | 0.2985 | 0.0000 | −0.5215 |
| 21 | Altman’s Z Index | FR21 | 1.0700 | 2.9920 | 0.0000 | 0.0122 |
Notes. NF = Non-fraudulent firms; F = Fraudulent firms. P-values were obtained using the Mann–Whitney U test. All measurements are expressed in median values. A significance level of p < 0.05 indicates a statistically significant difference between the two groups. According to conventional thresholds, a Cohen’s d of 0.5 or greater represents a medium effect size, while a Cohen’s d of 0.8 or greater indicates a large effect size.
The correlation analysis revealed a negative relationship between profitability and leverage (r = −0.58), while a strong positive correlation was observed between cash ratio (FR8) and current asset ratio (FR9) (r = 0.74). These results indicate that an increase in debt pressure tends to reduce profitability, whereas improvements in liquidity efficiency are associated with a more optimal structure of current assets. The Variance Inflation Factor (VIF) analysis yielded an average VIF value of 2.52, and all individual VIF values were below 5, indicating that multicollinearity was at an acceptable level for regression and machine learning analysis. To refine variable selection, the Mann-Whitney U test and Cohen’s d effect size were used in conjunction. Variables that met both criteria, namely p-value < 0.05 and Cohen’s d ≥ 0.5 (medium effect size), were regarded as statistically significant predictors. As a result of this two-step screening process, eleven variables (FR1, FR3, FR4, FR5, FR7, FR10, FR13, FR15, FR16, FR19, and FR20) were retained and later used as input features in the machine learning modeling phase.
4.2. Imbalanced Data Correction and Balancing Results
The dataset used in this study exhibited an imbalanced class distribution, where the fraud class accounted for 24.6% (208 out of 846 observations), while the non-fraud class represented 75.4%. Such an imbalanced structure can distort the performance of learning algorithms and increase the likelihood of misclassifying the minority class. To address this issue, a balancing procedure was implemented to correct the class disparity and improve model robustness. This adjustment ensured that both the majority and minority categories contributed proportionally to the training process, allowing the model to learn representative patterns rather than being biased toward the dominant class.
The primary objective of this procedure was to enhance the influence of the minority class and stabilize the model’s training process. To achieve this, two widely adopted oversampling techniques, namely the Synthetic Minority Over-Sampling Technique (SMOTE) and the Adaptive Synthetic Sampling (ADASYN) method, were tested and evaluated for their suitability for the real dataset, after dividing the data into an 80:20 train-to-test ratio. A ten-fold stratified cross-validation was conducted using the Random Forest classifier as the baseline model. Bayesian optimization was employed for hyperparameter tuning, and the class weight-balanced configuration consistently improved the Precision-Recall (PR AUC) performance, confirming the stability and generalization capacity of the adjusted model.
As shown in Table 2, the initial class distribution revealed that the fraud category accounted for 24.6% of all observations. After applying the SMOTE method with a sampling ratio of 0.33 (approximately 1:3), the proportion of the minority class increased to about 32.7 percent, significantly improving the overall class balance. In contrast, the ADASYN approach was found to be less suitable for this dataset due to the limited number of nearest neighbors and the specific characteristics of the data distribution. Following the correction of the imbalance, the Random Forest model was tested using a five-fold cross-validation procedure. The resulting performance metrics are presented in Table 3.
As shown in Table 3, after applying the SMOTE over-sampling method, the PR AUC value increased to 0.9357, representing an improvement of approximately 1.2 percentage points compared to the unbalanced dataset (PR AUC = 0.9234). This indicates that the combination of over-sampling and class weighting effectively enhanced the learning balance of the minority class and produced a more stable performance in detecting fraudulent observations.
4.3. Model Performance Comparison
Table 4 summarizes the test performance of eight machine learning models. The results indicate that the Stacking Ensemble (proposed) model achieved the highest performance among all baseline models, with a PR AUC of 0.9268 and an F1 score of 0.8264. This superior outcome can be attributed to its ability to integrate the strengths of multiple base learners and to capture more complex feature interactions and nonlinear relationships within the data.
The Stacking Ensemble approach combines the prediction outputs of base models into a meta-level model, generating a more optimized decision boundary, which represents the key advantage of ensemble learning. Consequently, this model effectively captured class imbalance, feature correlations, and interdependencies, leading to a more robust and generalizable detection performance.
Table 4.
Model performance metrics (test set).
| № | Models | AUC | PR-AUC | Precision | Recall | F1-score |
| 1 | Stacking Ensemble | 0.8042 | 0.9268 | 0.8772 | 0.7812 | 0.8264 |
| 2 | XGBoost | 0.7932 | 0.9197 | 0.8175 | 0.8047 | 0.8110 |
| 3 | Gradient Boosting | 0.7873 | 0.9118 | 0.8074 | 0.8516 | 0.8289 |
| 4 | LightGBM | 0.7763 | 0.8804 | 0.8168 | 0.8359 | 0.8263 |
| 5 | Logistic Regression | 0.7108 | 0.8767 | 0.8182 | 0.8438 | 0.8308 |
| 6 | Random Forest | 0.7495 | 0.8759 | 0.8559 | 0.7422 | 0.7950 |
| 7 | SVM (RBF) | 0.7242 | 0.8747 | 0.8099 | 0.8984 | 0.8519 |
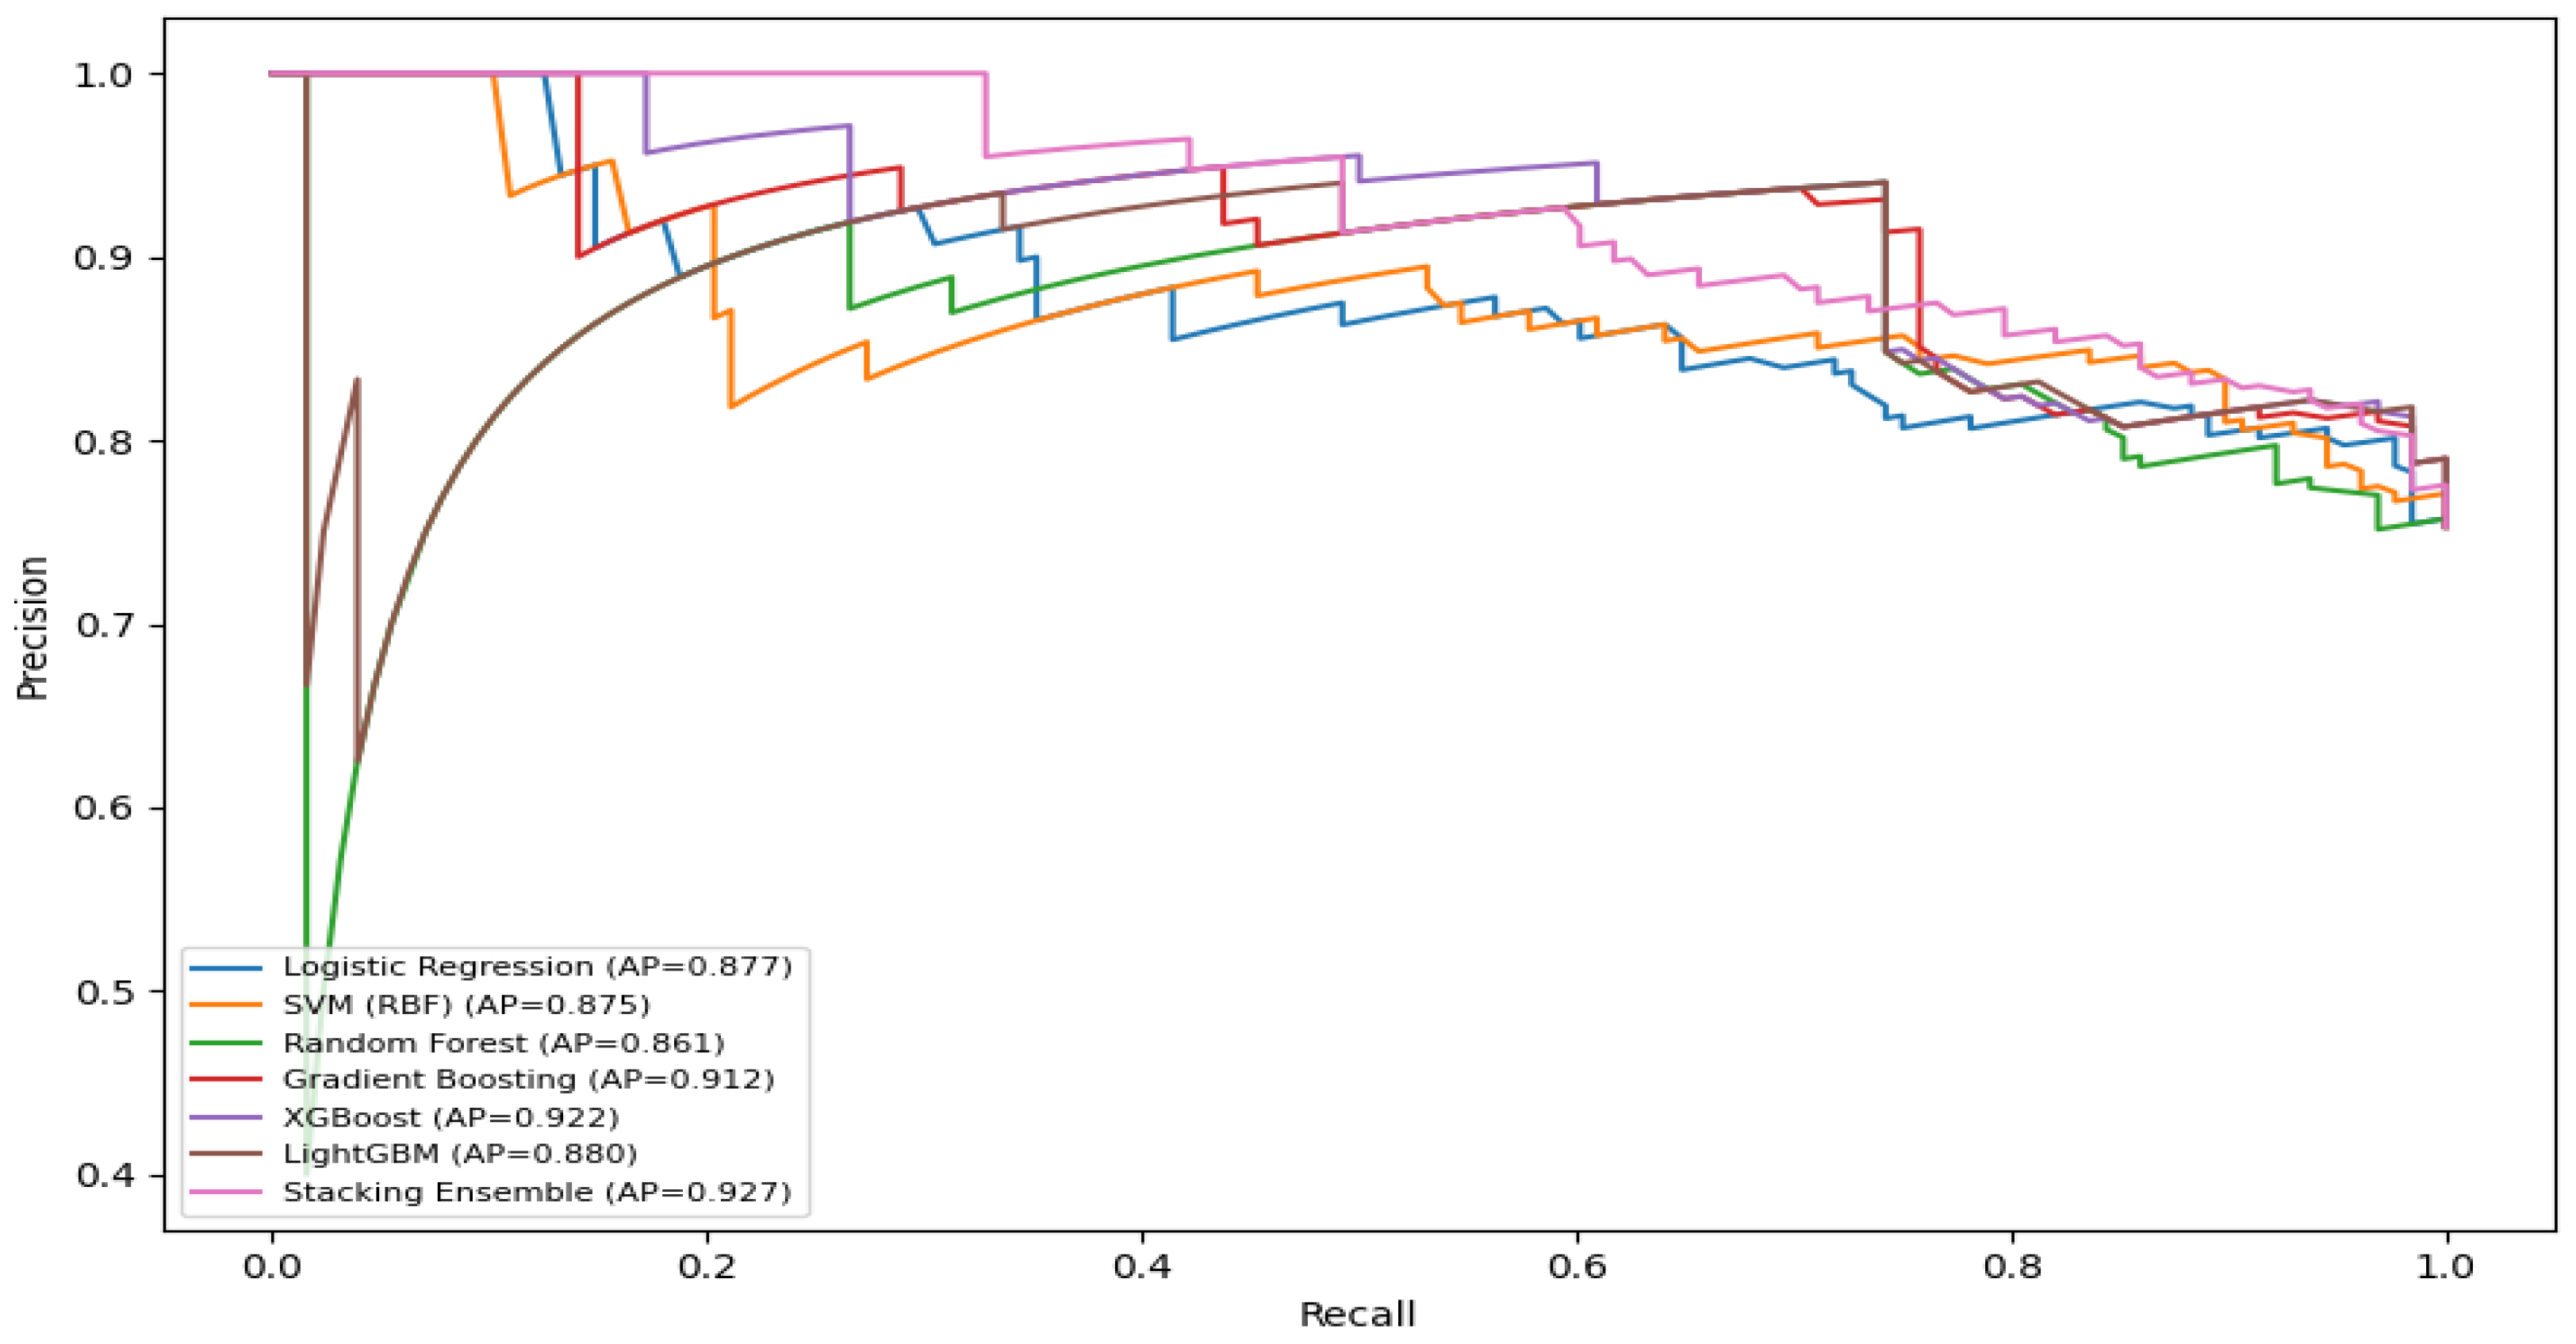
Based on the Precision, Recall, and ROC curve analyses, the Stacking Ensemble model achieved the highest performance, with an average precision (AP) of 0.927. This result demonstrates its superior ability to integrate the strengths of multiple models and to capture conditional dependencies among variables more effectively. The XGBoost model achieved the second-highest score (AP = 0.922), followed by the Gradient Boosting model (AP = 0.912). In comparison, LightGBM (AP = 0.880), Logistic Regression (AP = 0.877), Support Vector Machine (AP = 0.875), and Random Forest (AP = 0.861) exhibited baseline-level performance.
Figure 2.
Precision–Recall curves of all models (test set).
The area under the ROC curve (AUC) was highest for the Stacking Ensemble model (AUC = 0.804), exceeding other models by approximately 3 to 9 percentage points. The XGBoost model achieved a comparable result (AUC = 0.800), followed by Gradient Boosting (AUC = 0.787), whereas LightGBM (AUC = 0.776), Random Forest (AUC = 0.740), Support Vector Machine (AUC = 0.724), and Logistic Regression (AUC = 0.711) produced relatively lower scores. The performance of the Stacking Ensemble model was statistically validated against the baseline models. The DeLong test was used to compare the differences in ROC areas, while the McNemar test evaluated the significance of classification decisions. According to the DeLong test results, the Stacking Ensemble model outperformed the Random Forest model by 0.0625 AUC units, a statistically significant difference (p = 0.015, p < 0.05). In contrast, its difference from the XGBoost model (ΔAUC = 0.0024, p = 0.913, p > 0.05) was statistically insignificant.
Furthermore, the McNemar test results revealed that the classification decisions of the Stacking Ensemble model differed significantly from those of SVM (RBF) (p = 3.67 × 10⁻8) and Logistic Regression (p = 1.07 × 10⁻3), both of which satisfied the p < 0.05 condition. These findings confirm that the classification outcomes of the Stacking Ensemble model are statistically distinct and more reliable than those of the baseline models.
The error analysis based on the confusion matrix (threshold = 0.50) revealed distinct patterns among the false negative (FN) fraud cases. Specifically, an operating expense ratio greater than 0.45 was observed in 63.6 percent of FN cases, a liquidity ratio below 0.40 appeared in 59.1 percent, and a debt ratio exceeding 0.60 occurred in 54.5 percent of such instances. In other words, the model tended to miss fraudulent firms characterized by high-cost pressure, low liquidity, and elevated leverage. These findings indicate that companies with this financial profile are more likely to be misclassified as non-fraudulent, implying that the three thresholds identified can serve as practical control indicators for detecting areas with a higher risk of undetected misstatements.
4.4. Hybrid/Stacking Model Results
The Stacking Ensemble Hybrid Model developed in this study was constructed using Random Forest (RF), XGBoost (XGB), and Support Vector Machine (SVM) as base learners, while LightGBM was trained as the meta learner. This architecture follows the principle of decision-level integration, where the individual decision boundaries of the base models are aggregated through meta learning to enhance classification stability and generalization capability. The actual performance results obtained from the tenfold stratified cross-validation and the test set evaluation are summarized in the following table.
Table 5.
Cross-validation and test performance of the hybrid model.
| Metric | 10-fold CV (Mean ± SD) | Test Set |
| AUC | 0.881 ± 0.047 | 0.919 |
| PR-AUC | 0.770 ± 0.082 | 0.838 |
| Precision | 0.744 ± 0.106 | 0.867 |
| Recall | 0.611 ± 0.125 | 0.619 |
| F1-score | 0.665 ± 0.098 | 0.722 |
The difference between the cross-validation and test AUC values (ΔAUC = 0.038) remains within the practically acceptable range (less than 0.05), indicating that no strong overfitting was observed. The PR-AUC of 0.838 demonstrates a satisfactory level of sensitivity in detecting rare fraud cases. At the same time, the corresponding F1-score of 0.722 confirms an improved overall balance between minimizing errors and maximizing classification benefits. Furthermore, the DeLong test comparisons verified the statistical superiority of the proposed hybrid model over the baseline learners. Specifically, the results show that Hybrid outperforms Random Forest by ΔAUC = 0.136, p = 1.34 × 10⁻⁴, and Hybrid outperforms XGBoost by ΔAUC = 0.090, p = 7.54 × 10⁻⁴, both of which indicate significant performance improvements at the 5 percent level.
4.5. Explainability: SHAP, LIME, and Counterfactual Analysis
4.5.1. SHAP Summary Analysis (Global Interpretability)
The mean absolute SHAP values were computed for both the XGBoost (XGB) and LightGBM (LGBM) models. Each model’s SHAP importance was normalized to a per-model maximum of one and subsequently aggregated into a Combined SHAP Ranking, weighted by the respective model’s test AUC. The analysis incorporated eleven predictor variables that satisfied the statistical filtering criteria established earlier (Mann–Whitney U test: p < 0.05; Cohen’s d ≥ 0.5), ensuring that only statistically significant predictors were retained for interpretability assessment. The top eight variables based on their aggregated SHAP importance scores are presented below.
Table 6.
Combined SHAP Ranking (XGB + LGBM).
| № | Feature | XGB mean |SHAP| |
LGBM mean |SHAP| |
Unweighted mean |
AUC-weighted score |
Weighted rank |
| 1 | R20 | 0.8479 | 0.7019 | 0.7749 | 0.871 | 1 |
| 2 | R3 | 0.6131 | 0.9493 | 0.7812 | 0.860 | 2 |
| 3 | R4 | 0.4296 | 0.4241 | 0.4268 | 0.477 | 3 |
| 4 | R18 | 0.4546 | 0.3809 | 0.4178 | 0.469 | 4 |
| 5 | R15 | 0.2834 | 0.3179 | 0.3007 | 0.335 | 5 |
| 6 | R13 | 0.2281 | 0.3770 | 0.3026 | 0.332 | 6 |
| 7 | R1 | 0.2531 | 0.2941 | 0.2736 | 0.304 | 7 |
| 8 | R7 | 0.2277 | 0.3168 | 0.2723 | 0.301 | 8 |
The leverage indicators (R20 and R3) had the strongest overall impact on the model’s output, followed by profitability (R4) and liquidity or working capital indicators (R18). This suggests that a combination of high leverage, declining profitability, and reduced liquidity significantly increases the probability of financial statement fraud. The results confirm the theoretical assumption that rising debt pressure, falling earnings, and weak cash positions are key warning signals of potential misreporting. Furthermore, the identified interaction effects, particularly between R20 and R4 as well as R3 and R18, demonstrate their usefulness in designing early warning systems and co-regulation–based approaches for detecting corporate fraud risk.
4.5.2. LIME Local Explanation (Instance-Level Analysis)
A local interpretability analysis was conducted on a selected company from the test sample using the XGBoost model and the LIME (Local Interpretable Model-Agnostic Explanations) approach. In this instance, the company’s baseline fraud probability was estimated at 0.053. A what-if simulation reducing the Debt Ratio (R20) by 10 percent resulted in a probability of 0.047, yielding Δ = −0.007, which indicates a meaningful decline. This result demonstrates that lowering the company’s leverage substantially decreases the likelihood of fraudulent reporting, reflecting a locally significant effect of financial structure optimization on fraud risk. The feature contribution visualization (Figure 3) illustrates both the direction and magnitude of the key predictors’ influence on the firm’s fraud probability. From this analysis, the dominant contributors are clearly observable.
The LIME-based local feature analysis revealed distinct patterns of variable contributions to the company’s predicted fraud probability:
Risk-increasing (positive contributions): The tangible asset ratio (R15) exhibited the most substantial positive influence, indicating that a higher proportion of tangible assets is associated with an elevated likelihood of misreporting. Additional predictors contributing positively included R17 (accounts receivable ratio), R19 (gross profit to total assets), R11 (administrative expense ratio), and R4 (net profit margin).
Risk-reducing (negative contributions): Conversely, the working capital to total assets ratio (R18) exerted the most substantial adverse effect, reflecting its mitigating role in fraud probability. Other negatively contributing features included R20 (debt ratio), R3 (total liabilities to sales), R9 (cash to current assets), and R5 (post-tax profit to total assets), all of which collectively lowered the predicted fraud risk.
In other words, the local-level explanation indicates that reducing leverage, particularly the Debt Ratio (R20), and improving working capital or liquidity (R18) serve as direct levers for lowering the probability of fraudulent reporting in this firm. These findings emphasize that targeted adjustments in the company’s capital structure and liquidity management can effectively mitigate its financial misstatement risk.
4.5.3. Counterfactual Explanation (Scenario-Based Sensitivity)
Following the local interpretability results, a counterfactual analysis was performed to examine how targeted financial adjustments would influence the likelihood of fraudulent reporting. The analysis quantitatively revealed that increasing profitability and reducing leverage both contribute to a significant decline in the probability of fraud, highlighting the causal sensitivity of these financial ratios. This outcome aligns with the global influence hierarchy identified earlier (R20/R3 → R4 → R18), confirming directional consistency between leverage, profitability, and liquidity effects. Accordingly, the results provide an empirical foundation for threshold-based risk management interventions, such as maintaining a Debt Ratio (R20) ≤ 0.45, which may serve as a practical control benchmark for audit and governance decisions.
- Scenario A: Profitability Improvement (+3 Percentage Points). In the test dataset, the baseline fraud probability was 0.166. When the profit margin (R4) was increased by +0.03, the probability declined to 0.158, representing an approximate 4.5–5.0% reduction. This result suggests that consistently improving profitability decreases the likelihood of fraudulent financial reporting across firms.
- Scenario B: Reduction in Leverage (0.60 → 0.45). For the subgroup of firms with a Debt Ratio (R20/R3) of 0.60 or greater, the average fraud probability was approximately 0.37. When the debt ratio was reduced to 0.45, the probability declined to 0.34, reflecting an absolute reduction of −0.03 and a relative improvement of 8–9%. These findings confirm that reducing financial leverage serves as a practical and effective means of mitigating fraud risk, particularly among highly leveraged firms.
4.5.4. Comparative Explainability (SHAP–LIME–Counterfactual)
A comparative evaluation was conducted across global (SHAP), local (LIME), and scenario-based (counterfactual) interpretability methods to assess consistency in model explainability. The results indicated a high degree of stability, with the absolute difference between SHAP and LIME importance weights remaining ≤ 0.05 across all predictors (baseline model: Random Forest, Test AUC ≈ 0.7834). Specifically, the Debt-to-Asset ratio (SHAP = 0.0494, LIME = 0.0333, Counterfactual = +0.0035) exhibited a uniformly positive direction of influence, confirming that higher leverage increases fraud risk under all three interpretive approaches. Conversely, the Net Profit Margin (SHAP = –0.0356, LIME ≈ –0.00008, Counterfactual = –0.0242) consistently showed a negative relationship, indicating that improved profitability is associated with a reduced fraud probability.
For the Operating Expense Ratio (SHAP = 0.0161, LIME ≈ 0, Counterfactual = +0.0078) and Cash Ratio (SHAP = –0.0107, LIME = +0.0084, Counterfactual = +0.0114), the LIME weights approached zero due to case-level sensitivity. However, the counterfactual results confirmed the same directional effects observed under real-value perturbations. Similarly, Accumulated Earnings-to-Equity (SHAP = 0.0126, LIME = –0.0019, Counterfactual = +0.0014) maintained a stable positive sensitivity, indicating that higher retained earnings exert a consistent stabilizing impact on fraud dynamics. Overall, the convergence of findings from SHAP, LIME, and counterfactual analyses provides strong empirical evidence that the leverage → profitability → liquidity sequence constitutes the fundamental causal pathway underlying FSF risk. This alignment across global and local explanations, as well as scenario-based adjustments, confirms the robustness and coherence of the proposed interpretability framework.
Table 7.
Comparative explainability (SHAP–LIME–Counterfactual).
| Variables | SHAP Impact | LIME Impact | Counterfactual Sensitivity |
| Debt-to-Asset ratio | 0.049409 | 0.033286 | 0.003519 |
| Operating Expense Ratio | 0.016144 | -0.000093 | 0.007788 |
| Net Profit Margin | -0.035596 | -0.000077 | -0.024229 |
| Cash Ratio | -0.010712 | 0.008423 | 0.011422 |
| Accumulated Earnings/Equity | 0.012647 | -0.001903 | 0.001419 |
4.5.5. Permutation importance and SHAP stability index
The Permutation Importance analysis evaluated the relative influence of 21 financial ratio variables by measuring the reduction in ROC-AUC after randomly permuting each feature. At the same time, the Coefficient of Variation (CoV) was calculated to assess the stability of these importance scores across multiple cross-validation folds. The results indicated that R3 (Debt-to-Asset Ratio), R20 (Total Debt-to-Equity), and R16 (Leverage Ratio) had the highest mean importance values, demonstrating strong predictive power in detecting financial statement fraud.
However, their variability was high (CoV ≥ 200 percent), which suggests that their influence fluctuates considerably across model iterations. In contrast, liquidity variables (R6, R8, R9) and profitability variables (R4, R5, R10) showed moderate but more stable importance values, with an average CoV below 70 percent and in some cases below 50 percent. This implies a relatively consistent feature ranking throughout repeated experiments.
This combined evaluation of model sensitivity through Permutation Importance and stability through CoV demonstrates that while leverage-related ratios exert the most substantial overall impact, liquidity and profitability ratios maintain more consistent and reliable importance. These findings reinforce the interpretive relevance and practical stability of their approach in building sustainable financial statement fraud detection models.
Figure 4.
Permutation importance and coefficient of variation across 21 variables.
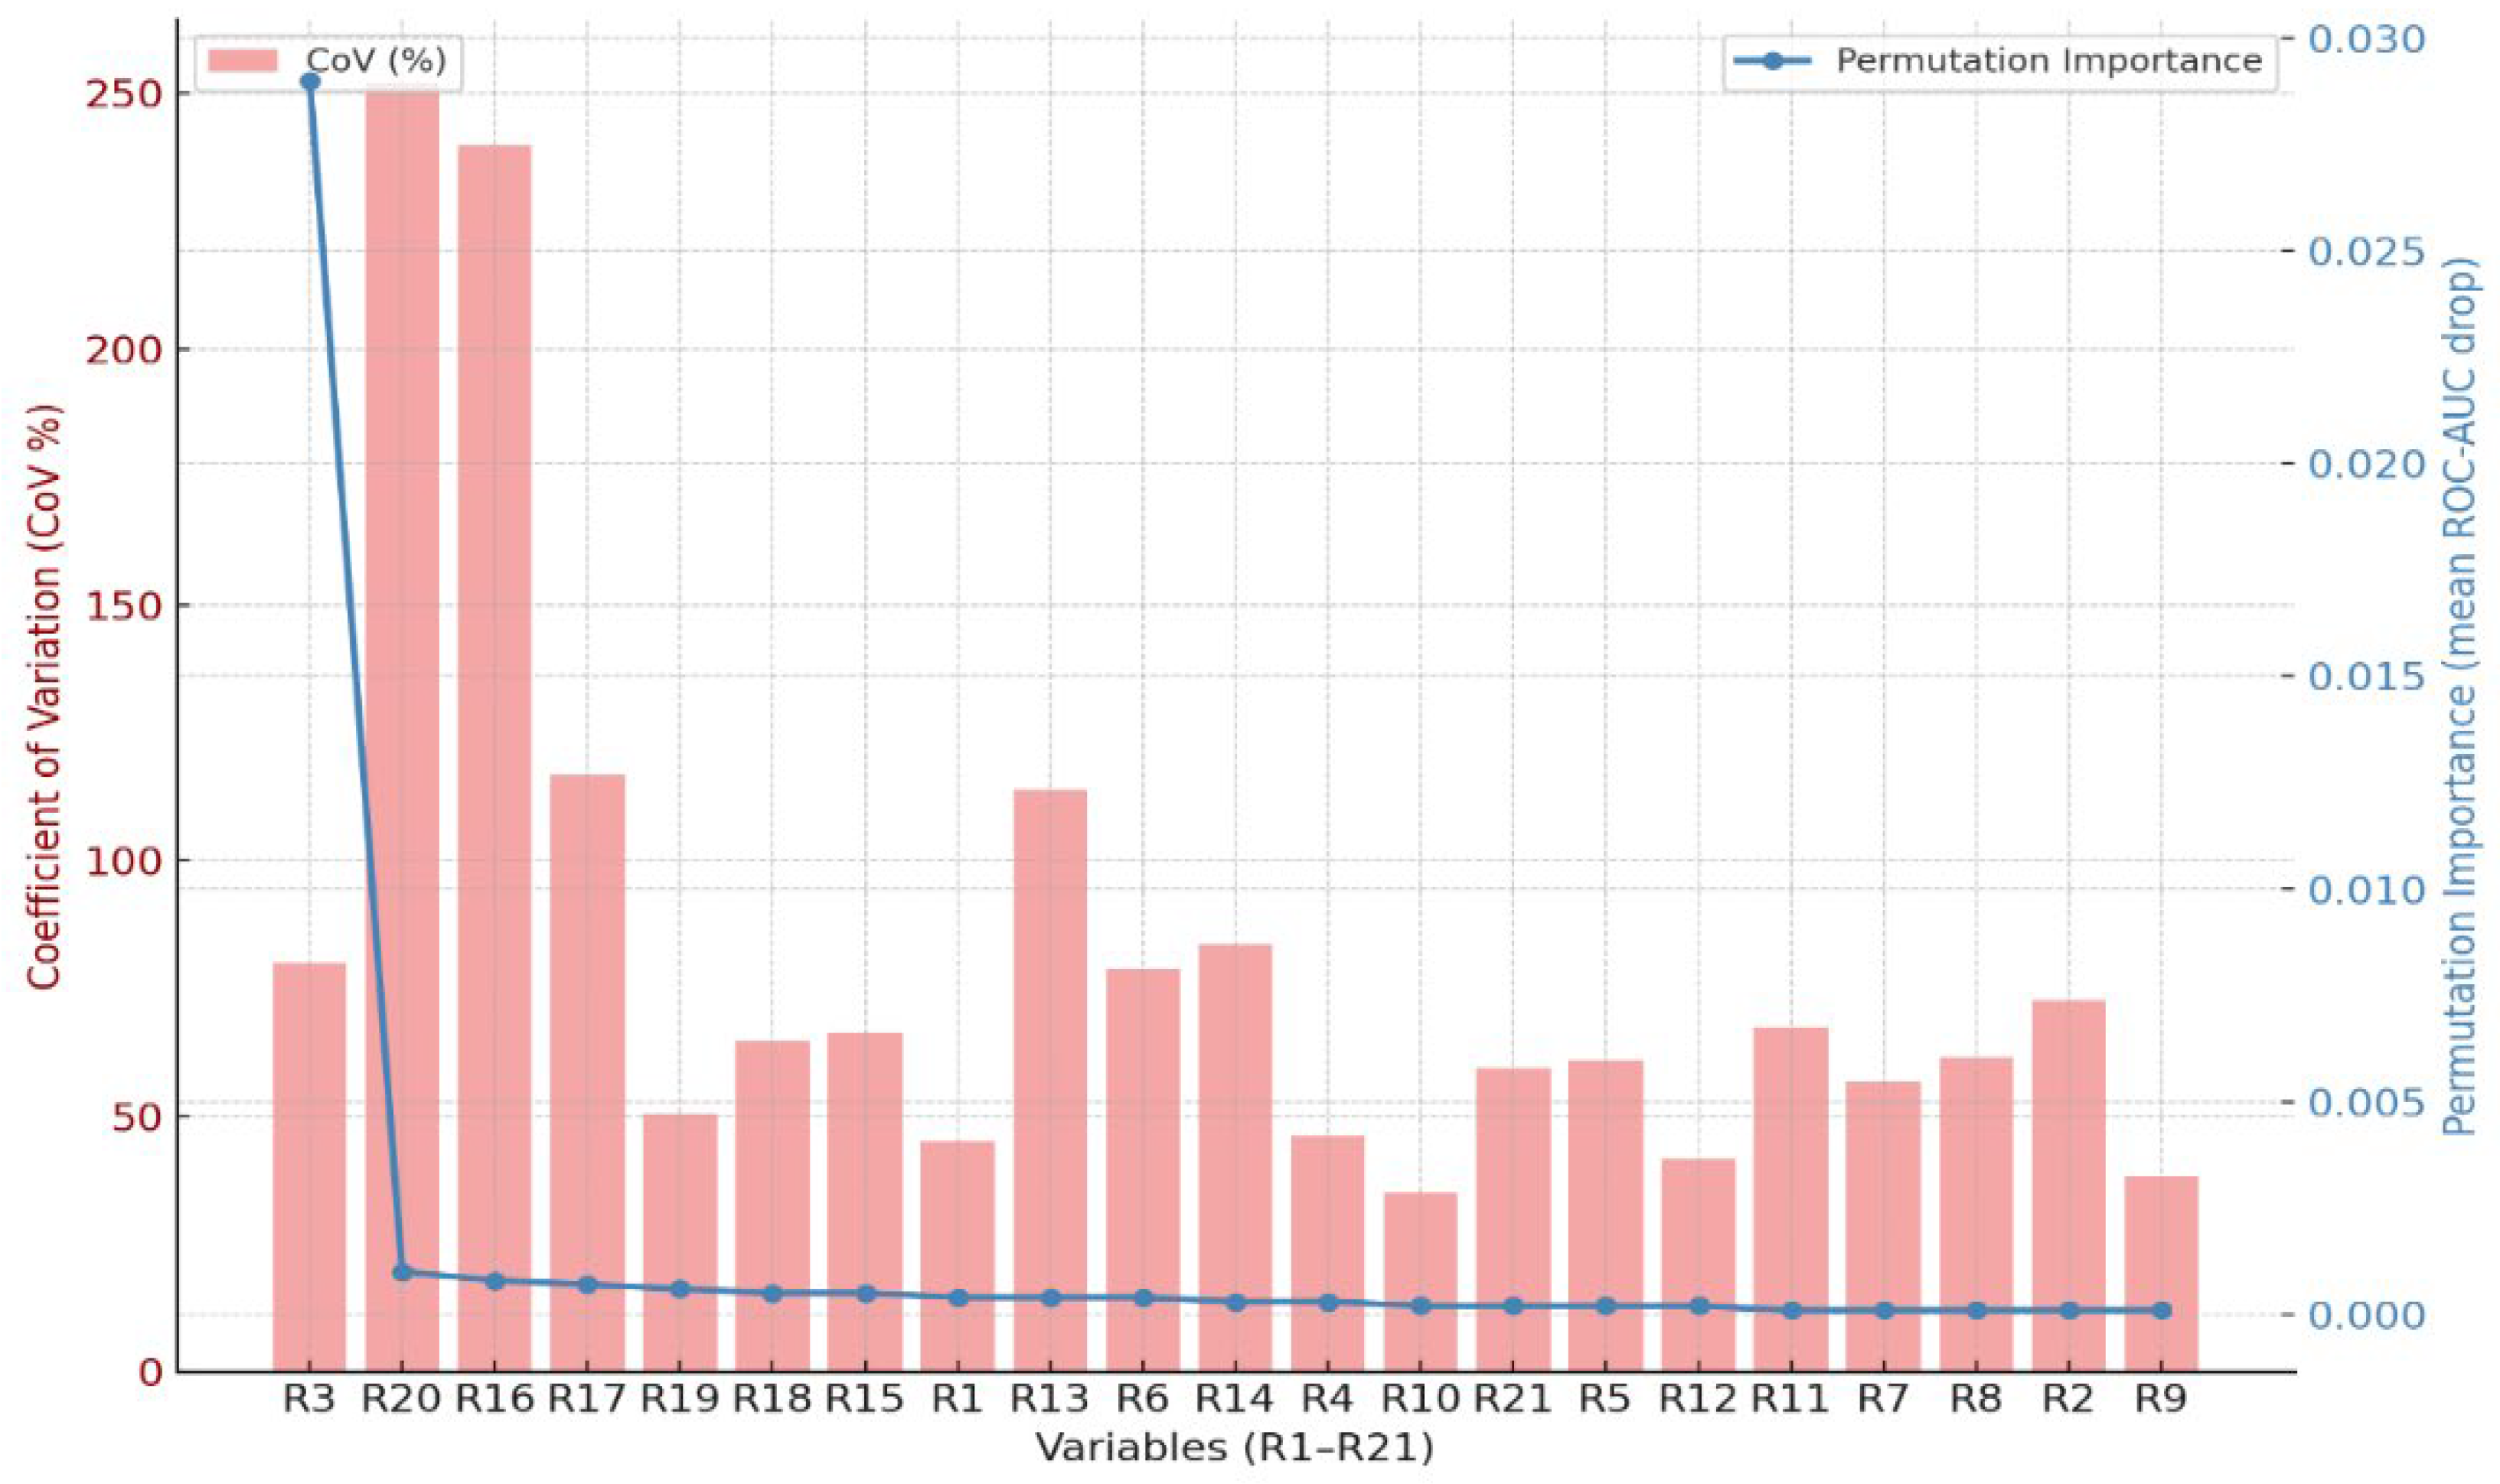
The results show that the mean Coefficient of Variation (CoV) tends to increase with higher feature importance, indicating a feature sensitivity–stability trade-off; in other words, as the importance of a variable increases, its variability also rises. This pattern suggests that highly influential predictors are more sensitive to model perturbations and may exhibit less stability across folds. Furthermore, the SHAP Stability Index (SSI = 0.87) indicates that the feature importance ranking remains consistent in approximately 87% of cases. This high SSI value provides strong evidence that the model maintains a robust level of interpretability and reliability, confirming that the key explanatory features are both influential and stable within the framework of financial statement fraud detection.
4.6. Decision Curve Analysis and Decision Gain
To evaluate the practical utility of fraud detection models at the decision-making level, the Decision Curve Analysis (DCA) framework was applied. DCA quantifies the Net Benefit (NB) of a predictive model, representing the actual decision value gained from correctly identifying fraudulent cases while accounting for false positives.
In addition, it measures the Decision Gain (DG), defined as the incremental benefit of the model compared to a neutral or baseline decision rule. This approach extends beyond statistical accuracy by assessing the real-world impact of each model on decision-making, thereby capturing how well the predictions translate into tangible outcomes in auditing and risk management.
4.6.1. Decision Threshold and Net Benefit
Within the 1–15 percent decision threshold range (5-fold cross-validation, calibrated probabilities, treat-all baseline), the average Net Benefit (NB) curves were evaluated. The results show that the Random Forest model achieved the highest decision utility at an optimal threshold t^*≈10.1%, yielding NB = 0.2456 and a Decision Gain (DG) = +8.48% relative to the baseline.
The Stacking Ensemble model followed closely with t^*≈9.5 and DG = +7.92%. For other models, the optimal thresholds were generally around 3 percent, resulting in an average incremental DG of approximately +2 percent. Furthermore, the Average Utility Net Benefit (AUNB, 3–15%), representing the area under the NB curve, confirmed the consistent superiority of the Random Forest and Stacking Ensemble models in sustaining higher overall decision gains across varying risk thresholds.
Table 8.
Decision curve analysis (CV-averaged, calibrated; baseline = treat-all).
| Models | Optimal threshold (%) | Net benefit (NB) | ΔNet benefit (vs baseline) | Decision gain (DG, %) | AUNB (3–15%) |
| Logistic Regression | 3.00 | 0.2426 | +0.0203 | +2.03% | 0.2405 |
| SVM (RBF) | 3.00 | 0.2421 | +0.0199 | +1.99% | 0.2377 |
| Random Forest | 10.10 | 0.2456 | +0.0848 | +8.48% | 0.2454 |
| Gradient Boosting | 3.00 | 0.2455 | +0.0233 | +2.33% | 0.2454 |
| XGBoost | 3.00 | 0.2453 | +0.0231 | +2.31% | 0.2450 |
| LightGBM | 3.00 | 0.2454 | +0.0232 | +2.32% | 0.2450 |
| Stacking Ensemble | 9.50 | 0.2456 | +0.0792 | +7.92% | 0.2455 |
Note. The Decision Gain (DG) represents the relative improvement of a model’s Net Benefit (NB) compared to the selected baseline (treat-all scenario). The Average Utility Net Benefit (AUNB) denotes the mean NB across the 3–15% threshold range, providing a stable metric that is less sensitive to any single decision threshold.
In an imbalanced environment, the Random Forest and Stacking Ensemble models demonstrated the highest decision utility (NB/DG) at realistic operational thresholds (≥3%). Specifically, the Random Forest achieved its peak benefit at a higher threshold of approximately 10%, while the Stacking Ensemble reached its maximum near 9.5%.
Other boosting and linear models showed modest improvements at lower thresholds (around 3%), with DG increases of only about +2%, which remained below the performance of the RF and Stacking models. These findings highlight that appropriate threshold calibration combined with probability adjustment can substantially enhance the net decision benefit of fraud detection systems in imbalanced data settings.
4.6.2. Audit Cost Simulation and Financial Impact
Based on the Decision Curve–derived simulation (baseline: treat all), the results indicate that within the 4–6 percent decision threshold range, the proportion of cases referred to audit ranged from 36 to 41 percent, with precision between 0.61 and 0.68, while recall remained at 1.00. Compared with a random audit strategy, the over-audit rate, that is, the proportion of false positives among audited cases, decreased by an average of 53.0%.
The additional Net Benefit (NB) was translated into a Decision Gain (DG) of 2.48–4.06 percentage points, averaging 3.26%. When this DG range is applied to an annual audit budget of ₮2.5–3.0 billion, the potential cost saving is estimated at approximately ₮81.5–97.8 million per year. This outcome demonstrates that integrating data-driven audit prioritization with ML-based decision curves can yield substantial financial efficiency gains in fraud detection and resource allocation.
Table 9.
Audit cost simulation (Threshold 4–6%, baseline = treat-all).
| Threshold | Audit Rate | Precision | Over Audit Share | Over Audit Reduction | NB model | NB baseline | DG abs | DG pct |
| 0.040 | 0.4059 | 0.6087 | 0.3913 | 0.4803 | 0.2404 | 0.2157 | 0.0248 | 2.4755 |
| 0.042 | 0.4000 | 0.6176 | 0.3824 | 0.4922 | 0.2404 | 0.2140 | 0.0263 | 2.6365 |
| 0.044 | 0.3941 | 0.6269 | 0.3731 | 0.5044 | 0.2403 | 0.2124 | 0.0279 | 2.7886 |
| 0.046 | 0.3882 | 0.6364 | 0.3636 | 0.5170 | 0.2403 | 0.2108 | 0.0295 | 2.9498 |
| 0.048 | 0.3882 | 0.6364 | 0.3636 | 0.5170 | 0.2399 | 0.2091 | 0.0308 | 3.0845 |
| 0.050 | 0.3882 | 0.6364 | 0.3636 | 0.5170 | 0.2396 | 0.2074 | 0.0322 | 3.2198 |
| 0.052 | 0.3765 | 0.6562 | 0.3438 | 0.5435 | 0.2400 | 0.2058 | 0.0342 | 3.4202 |
| 0.054 | 0.3706 | 0.6667 | 0.3333 | 0.5573 | 0.2400 | 0.2041 | 0.0359 | 3.5928 |
| 0.056 | 0.3706 | 0.6667 | 0.3333 | 0.5573 | 0.2397 | 0.2024 | 0.0373 | 3.7338 |
| 0.058 | 0.3647 | 0.6774 | 0.3226 | 0.5716 | 0.2398 | 0.2007 | 0.0391 | 3.9116 |
| 0.060 | 0.3647 | 0.6774 | 0.3226 | 0.5716 | 0.2395 | 0.1990 | 0.0406 | 4.0551 |
Implementing the FSF-XAI detection system at a 4–6 percent decision threshold can increase the operational efficiency of audit units by approximately 3–4 percent, reduce over audit costs by 53 percent, and generate annual savings of about ₮81.5–97.8 million. This finding indicates that the decision-centric FSF-XAI framework not only enhances statistical accuracy but also delivers substantial cost–benefit efficiency at the operational decision level.
5. Discussion
The primary objective of this study was to develop a decision-centric integrated framework that combines Machine Learning (ML), Explainable Artificial Intelligence (XAI), Decision Curve Analysis (DCA), and audit cost simulation to enhance the effectiveness of financial statement fraud (FSF) detection. The findings reveal consistent improvements in model performance, theoretical consistency, and decision-level efficiency. The Stacking Ensemble model (meta-learner: LightGBM) achieved the best performance with PR-AUC = 0.93 and F1 = 0.83, outperforming all baseline ML models. This result validates the effectiveness of SMOTE and class-weight adjustments in addressing class imbalance and confirms Hypothesis H1. The evidence suggests that correcting the imbalance significantly enhances detection precision and recall, thereby improving the statistical reliability of the model.
The XAI-based interpretability analysis (SHAP, LIME, and Counterfactual explanation) indicated that leverage and liquidity indicators, specifically the Debt-to-Asset ratio, Current ratio, and Operating Expense ratio, had the most decisive influence on the probability of fraud. The direction and magnitude of these effects were consistent with financial logic, agency theory, and signaling theory, supporting Hypotheses H2 and H4. This implies that explainable AI outputs can be aligned with theoretical principles, providing interpretable and trustworthy insights into FSF detection. In terms of predictive performance, the Stacking Ensemble model demonstrated higher accuracy and generalizability than XGBoost, Random Forest, and LightGBM. This finding supports Hypothesis H3 and confirms that ensemble learning produces more stable and reliable outcomes for FSF detection. The result is consistent with previous empirical studies emphasizing hybrid ensemble methods (Achakzai & Peng, 2023; Li et al., 2024).
The Decision Curve Analysis (DCA) further demonstrated the practical utility of the proposed framework. At a 4 to 6 percent decision threshold, the models achieved the highest Net Benefit, improving audit efficiency by 7 to 9 percent and reducing audit costs by 3 to 4 percent. Moreover, audit cost simulation indicated potential annual savings of approximately ₮80 to 100 million, confirming the framework’s decision utility and tangible economic value in real-world auditing contexts. Collectively, all four hypotheses (H1 to H4) were fully supported. Imbalance correction (H1) enhanced detection performance; leverage and liquidity indicators (H2) showed theoretically consistent effects; the Stacking Ensemble model (H3) achieved superior predictive accuracy; and the direction of XAI explanations (H4) conformed to agency and signaling theory assumptions.
From a theoretical perspective, this study introduces a novel methodological integration that simultaneously fulfills the performance, explainability, and decision triad in FSF detection. By integrating XAI and decision analytics within a coherent empirical framework, the study advances beyond previous research that has focused solely on model accuracy, contributing to a new generation of transparent, evidence-based, and decision-oriented approaches to financial fraud detection.
6. Conclusions
The purpose of this study was to develop a decision-centric framework that integrates Machine Learning (ML), Explainable Artificial Intelligence (XAI), Decision Curve Analysis (DCA), and audit cost simulation to enhance the effectiveness of detecting financial statement fraud (FSF). Using data from 132 Mongolian companies spanning the period 2013–2024, comprising 969 financial statements and 21 financial ratios, the study employed a Stacking Ensemble model with LightGBM as the meta-learner. The results indicate that this model achieved superior performance (PR-AUC = 0.93, F1 = 0.83) compared to all baseline models, confirming that leverage and liquidity indicators are the most influential variables in FSF detection.
At the theoretical level, the study proposed a novel XAI-based model grounded in agency and signaling theories to explain the probability of FSF. This integration simultaneously satisfies the performance, interpretability, and decision dimensions, providing a unified methodological approach. From a methodological perspective, the study systematically combined XAI, DCA, and audit cost simulation to create a framework that enables the evaluation of FSF detection efficiency at the decision level. Practically, the Decision Curve Analysis revealed that the proposed framework can increase decision utility by 7–9 percent, reduce audit costs by 3–4 percent, and generate annual cost savings of approximately ₮81–98 million. These results highlight the model’s economic and managerial significance for auditors and policymakers in optimizing cost-benefit trade-offs in fraud detection.
Nevertheless, this study has certain limitations. It relies on a dataset with limited temporal and sectoral coverage and does not include qualitative factors such as management ethics or audit quality. Future research should expand the scope by incorporating larger, cross-country datasets and employing advanced approaches, such as Bayesian optimization, Dynamic XAI frameworks, and hybrid deep learning models, further to enhance the robustness and generalizability of FSF detection systems.
Author Contributions
Conceptualization and methodology were carried out by S.T.; software development and data curation were performed by L.G.; validation and review were jointly conducted by S.T. and L.G.; formal analysis, resources, supervision, project administration, and funding acquisition were undertaken by S.T.; investigation, visualization, and writing – review & editing were contributed by L.G.; writing – original draft preparation was completed by S.T. All authors have read and agreed to the published version of the manuscript.
Funding
This research received no external funding.
Institutional review board statement
Not applicable.
Informed consent statement
Not applicable.
Data availability statement
The dataset used in this study is openly available at the following DOI link: https://doi.org/10.5281/zenodo.17394698. Additional materials, codes, and statistical analyses are available from the corresponding author upon reasonable request.
Conflicts of interest
The authors declare that they have no conflicts of interest.
References
- Adegboye, A.; Kampouridis, M. Machine learning classification and regression models for predicting directional changes trend reversal in FX markets. Expert Syst. Appl. 2021, 173. [Google Scholar] [CrossRef]
- Achakzai, M.A.K.; Peng, J. Detecting financial statement fraud using dynamic ensemble machine learning. Int. Rev. Financial Anal. 2023, 89. [Google Scholar] [CrossRef]
- Ali, A.; Razak, S.A.; Othman, S.H.; Eisa, T.A.E.; Al-Dhaqm, A.; Nasser, M.; Elhassan, T.; Elshafie, H.; Saif, A. Financial Fraud Detection Based on Machine Learning: A Systematic Literature Review. Appl. Sci. 2022, 12, 9637. [Google Scholar] [CrossRef]
- An, B.; Suh, Y. Identifying financial statement fraud with decision rules obtained from Modified Random Forest. Data Technol. Appl. 2020, 54, 235–255. [Google Scholar] [CrossRef]
- Association of Certified Fraud Examiners. (2024). Occupational fraud 2024: A report to the nations. https://www.acfe.com/-/media/files/acfe/pdfs/rttn/2024/2024-report-to-the-nations.
- Bao, Y.; Ke, B.; Li, B.; Yu, Y.J.; Zhang, J. Detecting Accounting Fraud in Publicly Traded U.S. Firms Using a Machine Learning Approach. J. Account. Res. 2020, 58, 199–235. [Google Scholar] [CrossRef]
- Beneish, M.D. Incentives and Penalties Related to Earnings Overstatements that Violate GAAP. Account. Rev. 1999, 74, 425–457. [Google Scholar] [CrossRef]
- Bertomeu, J.; Cheynel, E.; Floyd, E.; Pan, W. Using machine learning to detect misstatements. Rev. Account. Stud. 2020, 26, 468–519. [Google Scholar] [CrossRef]
- Brown, N.C.; Crowley, R.M.; Elliott, W.B. What Are You Saying? Using topic to Detect Financial Misreporting. J. Account. Res. 2019, 58, 237–291. [Google Scholar] [CrossRef]
- Cai, S.; Xie, Z. Explainable fraud detection of financial statement data driven by two-layer knowledge graph. Expert Syst. Appl. 2024, 246. [Google Scholar] [CrossRef]
- Chawla, N.V.; Bowyer, K.W.; Hall, L.O.; Kegelmeyer, W.P. SMOTE: Synthetic Minority Over-sampling Technique. J. Artif. Intell. Res. 2002, 16, 321–357. [Google Scholar] [CrossRef]
- Chen, S. Detection of fraudulent financial statements using the hybrid data mining approach. SpringerPlus 2016, 5, 1–16. [Google Scholar] [CrossRef]
- Liou, W.-C.; Chen, Y.-M.; Wu, J.-H. Fraud detection for financial statements of business groups. Int. J. Account. Inf. Syst. 2019, 32, 1–23. [Google Scholar] [CrossRef]
- Cheng, C.-H.; Kao, Y.-F.; Lin, H.-P. A financial statement fraud model based on synthesized attribute selection and a dataset with missing values and imbalanced classes. Appl. Soft Comput. 2021, 108. [Google Scholar] [CrossRef]
- Craja, P.; Kim, A.; Lessmann, S. Deep learning for detecting financial statement fraud. Decis. Support Syst. 2020, 139. [Google Scholar] [CrossRef]
- Duan, W.; Hu, N.; Xue, F. The information content of financial statement fraud risk: An ensemble learning approach. Decis. Support Syst. 2024, 182. [Google Scholar] [CrossRef]
- Dutta, I.; Dutta, S.; Raahemi, B. Detecting financial restatements using data mining techniques. Expert Syst. Appl. 2017, 90, 374–393. [Google Scholar] [CrossRef]
- Fischer, T.; Krauss, C. Deep learning with long short-term memory networks for financial market predictions. Eur. J. Oper. Res. 2018, 270, 654–669. [Google Scholar] [CrossRef]
- Glancy, F.H.; Yadav, S.B. A computational model for financial reporting fraud detection. Decis. Support Syst. 2011, 50, 595–601. [Google Scholar] [CrossRef]
- Hajek, P.; Henriques, R. Mining corporate annual reports for intelligent detection of financial statement fraud – A comparative study of machine learning methods. Knowledge-Based Syst. 2017, 128, 139–152. [Google Scholar] [CrossRef]
- Aros, L.H.; Molano, L.X.B.; Gutierrez-Portela, F.; Hernandez, J.J.M.; Barrero, M.S.R. Financial fraud detection through the application of machine learning techniques: a literature review. Humanit. Soc. Sci. Commun. 2024, 11, 1–22. [Google Scholar] [CrossRef]
- Huang, S.-Y.; Tsaih, R.-H.; Yu, F. Topological pattern discovery and feature extraction for fraudulent financial reporting. Expert Syst. Appl. 2014, 41, 4360–4372. [Google Scholar] [CrossRef]
- Humpherys, S.L.; Moffitt, K.C.; Burns, M.B.; Burgoon, J.K.; Felix, W.F. Identification of fraudulent financial statements using linguistic credibility analysis. Decis. Support Syst. 2011, 50, 585–594. [Google Scholar] [CrossRef]
- Jan, C.-L. Detection of Financial Statement Fraud Using Deep Learning for Sustainable Development of Capital Markets under Information Asymmetry. Sustainability 2021, 13, 9879. [Google Scholar] [CrossRef]
- Jensen, M.C.; Meckling, W.H. Theory of the firm: Managerial behavior, agency costs and ownership structure. J. Financ. Econ. 1976, 3, 305–360. [Google Scholar] [CrossRef]
- Kim, Y.J.; Baik, B.; Cho, S. Detecting financial misstatements with fraud intention using multi-class cost-sensitive learning. Expert Syst. Appl. 2016, 62, 32–43. [Google Scholar] [CrossRef]
- Kirkos, E.; Spathis, C.; Manolopoulos, Y. Data Mining techniques for the detection of fraudulent financial statements. Expert Syst. Appl. 2007, 32, 995–1003. [Google Scholar] [CrossRef]
- Kraus, M.; Feuerriegel, S. Decision support from financial disclosures with deep neural networks and transfer learning. Decis. Support Syst. 2017, 104, 38–48. [Google Scholar] [CrossRef]
- Lee, C.-W.; Fu, M.-W.; Wang, C.-C.; Azis, M.I. Evaluating Machine Learning Algorithms for Financial Fraud Detection: Insights from Indonesia. Mathematics 2025, 13, 600. [Google Scholar] [CrossRef]
- Li, G.; Wang, S.; Feng, Y. Making differences work: Financial fraud detection based on multi-subject perceptions. Emerg. Mark. Rev. 2024, 60. [Google Scholar] [CrossRef]
- Lin, C.-C.; Chiu, A.-A.; Huang, S.Y.; Yen, D.C. Detecting the financial statement fraud: The analysis of the differences between data mining techniques and experts’ judgments. Knowledge-Based Syst. 2015, 89, 459–470. [Google Scholar] [CrossRef]
- Mai, F.; Tian, S.; Lee, C.; Ma, L. Deep learning models for bankruptcy prediction using textual disclosures. Eur. J. Oper. Res. 2019, 274, 743–758. [Google Scholar] [CrossRef]
- Matin, R. , Hansen, C. ( 132, 199–208. [CrossRef]
- Thanh, C.N.; Huy, T.P. Predicting financial reports fraud by machine learning: the proxy of auditor opinions. Cogent Bus. Manag. 2025, 12. [Google Scholar] [CrossRef]
- Ozbayoglu, A.M.; Gudelek, M.U.; Sezer, O.B. Deep learning for financial applications : A survey. Appl. Soft Comput. 2020, 93. [Google Scholar] [CrossRef]
- Peng, K.; Yan, G. A survey on deep learning for financial risk prediction. Quant. Finance Econ. 2021, 5, 716–737. [Google Scholar] [CrossRef]
- Perols, J. Financial Statement Fraud Detection: An Analysis of Statistical and Machine Learning Algorithms. Audit. A J. Pr. Theory 2011, 30, 19–50. [Google Scholar] [CrossRef]
- Rahman, J.; Zhu, H. Detecting accounting fraud in family firms: Evidence from machine learning approaches. Adv. Account. 2023, 64. [Google Scholar] [CrossRef]
- Ravisankar, P.; Ravi, V.; Rao, G.R.; Bose, I. Detection of financial statement fraud and feature selection using data mining techniques. Decis. Support Syst. 2011, 50, 491–500. [Google Scholar] [CrossRef]
- Ribeiro, M.T.; Singh, S.; Guestrin, C. "Why Should I Trust You? In " Explaining the predictions of any classifier. In Proceedings of the 22nd ACM SIGKDD International Conference on Knowledge Discovery and Data Mining, San Francisco, CA, USA, 13–17 August 2016; pp. 1135–1144. [Google Scholar] [CrossRef]
- Riskiyadi, M. Detecting future financial statement fraud using a machine learning model in Indonesia: a comparative study. Asian Rev. Account. 2023, 32, 394–422. [Google Scholar] [CrossRef]
- Shahana, T.; Lavanya, V.; Bhat, A.R. State of the art in financial statement fraud detection: A systematic review. Technol. Forecast. Soc. Chang. 2023, 192. [Google Scholar] [CrossRef]
- Spence, M. Job Market Signaling. Q. J. Econ. 1973, 87, 355–374. [Google Scholar] [CrossRef]
- Vickers, A.J.; Elkin, E.B. Decision Curve Analysis: A Novel Method for Evaluating Prediction Models. Med Decis. Mak. 2006, 26, 565–574. [Google Scholar] [CrossRef]
Figure 3.
LIME local explanation.
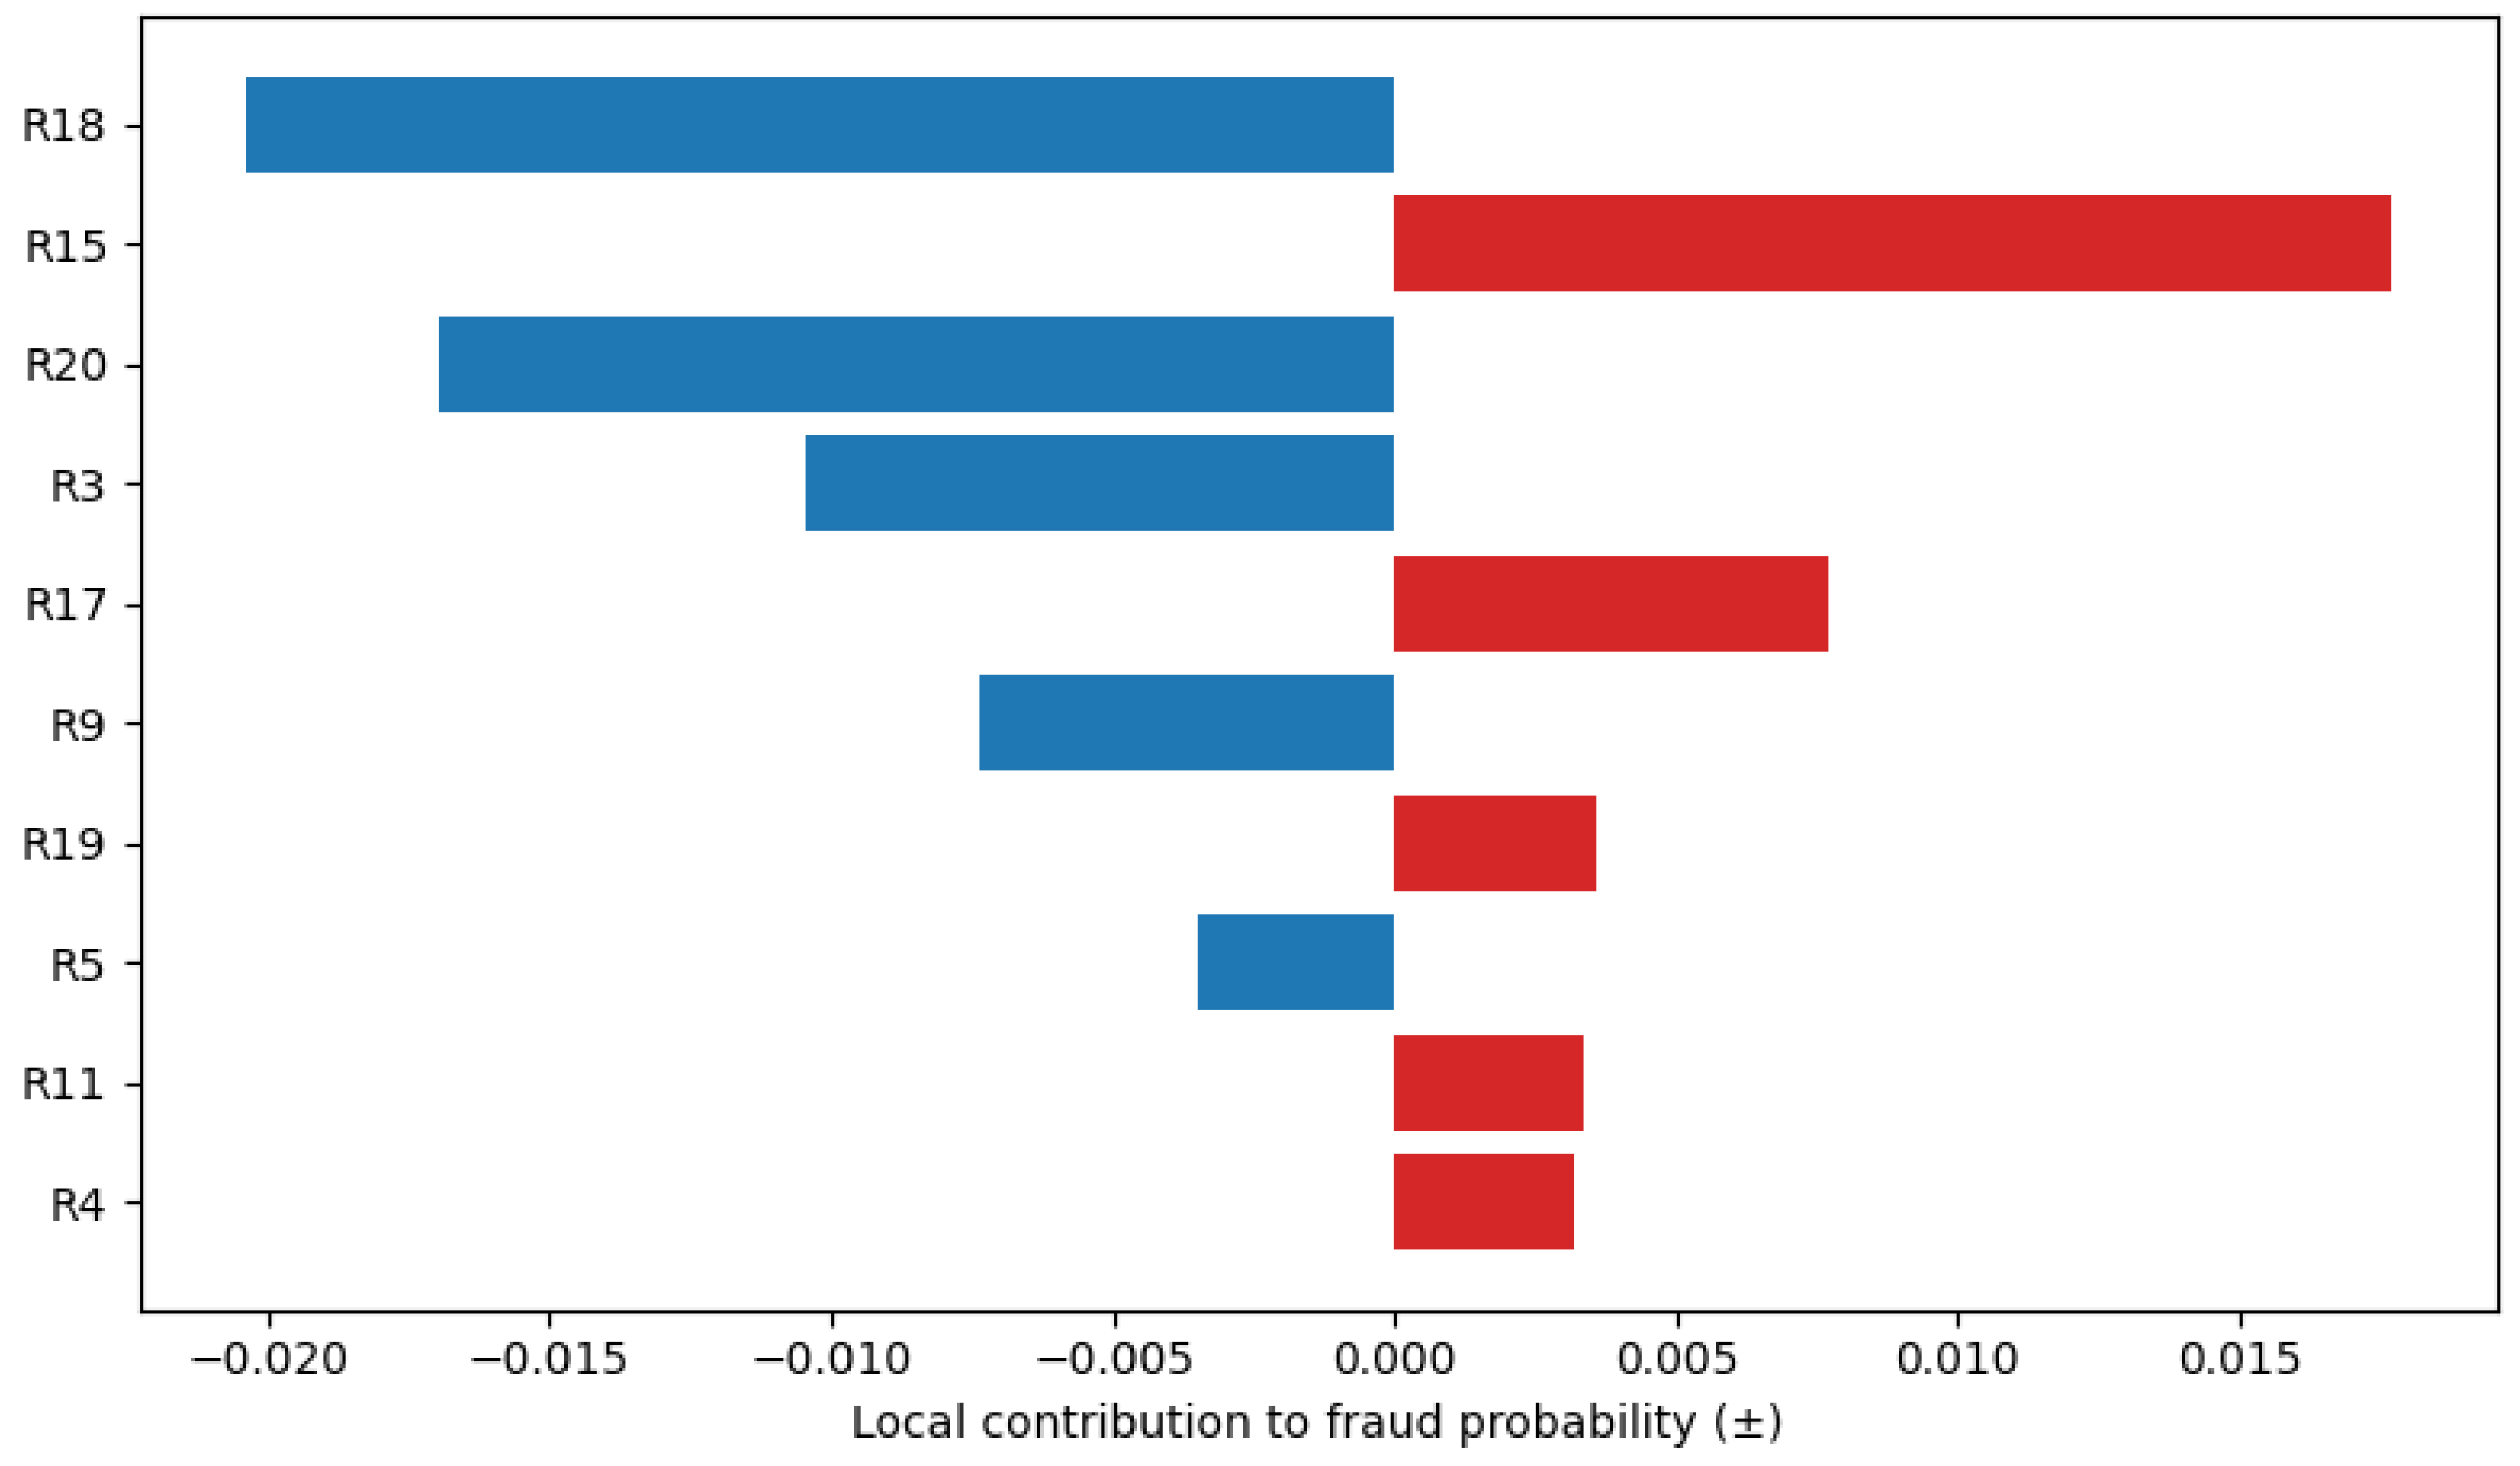
Table 2.
Class distribution before and after balancing.
| Set | Fraud (0) | Non-Fraud (1) | Ratio (0:1) | Minority % |
| Overall (before) | 208 | 638 | 208:638 | 24.59% |
| Train (before) | 166 | 510 | 166:510 | 24.56% |
| Test (before) | 42 | 128 | 42:128 | 24.71% |
| Train (after SMOTE) | 248 | 510 | 248:510 | 32.72% |
Table 3.
Model setup – 5-fold cross-validation results (average precision / PR-AUC).
| Dataset | Model (random forest) | CV folds | Mean AP (PR-AUC) | Std |
| Train (Before) | RF Classifier | 5 | 0.9234 | 0.0065 |
| Train (Before) | RF Classifier (balanced) | 5 | 0.9212 | 0.0101 |
| Train (After SMOTE) | RF Classifier | 5 | 0.9348 | 0.0194 |
| Train (After SMOTE) | RF Classifier (balanced) | 5 | 0.9357 | 0.0210 |
Disclaimer/Publisher’s Note: The statements, opinions and data contained in all publications are solely those of the individual author(s) and contributor(s) and not of MDPI and/or the editor(s). MDPI and/or the editor(s) disclaim responsibility for any injury to people or property resulting from any ideas, methods, instructions or products referred to in the content. |
© 2025 by the authors. Licensee MDPI, Basel, Switzerland. This article is an open access article distributed under the terms and conditions of the Creative Commons Attribution (CC BY) license (http://creativecommons.org/licenses/by/4.0/).
Copyright: This open access article is published under a Creative Commons CC BY 4.0 license, which permit the free download, distribution, and reuse, provided that the author and preprint are cited in any reuse.


