Submitted:
23 November 2025
Posted:
25 November 2025
You are already at the latest version
Abstract
Freezing and thawing strongly affect the structural integrity and quality of meat, yet these processes remain difficult to monitor due to spatial temperature gradients and non-uniform phase transitions. This study investigates the ability of ultrasound to provide real-time detection of dynamic freezing and thawing events in pork tissues with different fat compositions. Specimens of water, lean meat, marbled meat, layered lean-fat structures and lard were subjected to controlled freeze-thaw cycles while ul-trasonic signals and internal temperatures were continuously followed using a custom experimental setup. Consistent amplitude drops in the MHz range at entering the freezing phase followed by characteristic signal patterns that differed sharply between lean and fatty tissues were recorded. Lean meat, dominated by water content, exhibit-ed rapid signal loss at the onset of ice crystallization and a clear recovery of amplitude once fully frozen. Fat-rich tissues demonstrated prolonged attenuation and near dis-appearance of high-frequency signals, with incomplete recovery even at deep-frozen states. Hysteresis between temperature readings and actual phase transition moments was found. These findings indicate that ultrasound provides distinct freeze-thaw sig-natures that reflect tissue composition offering a reliable monitoring tool for freezing uniformity and the true onset and completion of freezing and thawing in meat.
Keywords:
meat
; blast freezing and thawing
; fat content
; ultrasonic testing
; monitoring
1. Introduction
Freezing remains the cornerstone of meat preservation. However, conventional freezing is often accompanied by textural deterioration, drip loss, and nutritional degradation, prompting continuous development of novel freezing and thawing technologies aimed at minimizing structural damage [1]. Among the established industrial solutions, blast freezing remains dominant due to its scalability, cost-effectiveness, and adaptability for large meat cuts and high-volume cold-chain logistics. Its ability to form relatively small ice crystals provides better preservation of texture and reduces thaw drip compared with slow freezing. With growing global demand for frozen foods and ongoing investment in cold infrastructure, blast freezing continues to expand as a practical and reliable technology. To improve freezing uniformity and reduce quality loss during thawing, numerous advanced methods have been proposed, such as ultrasonic freezing, high-voltage electric and magnetic fields, liquid nitrogen, and high-pressure systems [2,3].
Despite these technological advances, in-situ, real-time monitoring of freezing and thawing remains a critical challenge. Freezing is inherently non-uniform: internal temperature gradients lead to heterogeneous ice crystal formation, affecting structural integrity, drip loss, and sensory attributes. Without internal monitoring, operators cannot detect partial freezing, incomplete thawing, or non-uniform cooling. Real-time sensors therefore play a crucial role in verifying that regulatory temperature thresholds are met, preventing unnoticed temperature abuse, improving energy efficiency, and enabling automated freezer control systems and AI-based quality prediction models.
Several non-destructive sensing technologies have been explored for monitoring thermal and structural changes in meat, each offering unique advantages [4]. Ultrasound, in pulse-echo or through-transmission mode, is particularly promising because it responds sensitively to changes in acoustic impedance during phase transitions. Ultrasound can track ice-front propagation, microstructural alterations, and thermal events in real time [5]. Recent studies demonstrate its ability to monitor pre-thawing stages with substantial amplitude changes [6], predict thawing endpoints through machine-learning models [7], and detect ice-crystal formation during super-chilling using combined ultrasound and NIR spectroscopy [8]. Other complementary methods include low-field NMR (water mobility), infrared thermography (surface temperature mapping), and electrochemical sensors (protein oxidation indicators) [9,10,11].
Ultrasound holds several distinct advantages for industrial applications. Changes in acoustic velocity, attenuation, and backscatter correlate strongly with phase transitions, enabling highly sensitive detection of nucleation, freezing completeness, thawing progression and internal structural changes that temperature sensors cannot capture [6]. Moreover, ultrasound penetrates several centimeters into tissue, operates reliably in cold and humid environments, and integrates well with machine-learning algorithms for stage classification.
The purpose of this communication paper is to present new experimental findings on ultrasonic monitoring of meat during freezing and thawing. We report unique ultrasonic pattern behaviors associated with varying fat composition, as well as measurable delays between the real physical freezing-thawing transitions and the moment when temperature sensors cross the 0 °C threshold. The results were obtained using a custom laboratory setup designed for rapid freezing of small meat specimens with integrated ultrasonic recording capabilities, which made it possible to observe its dynamic behavior [12].
2. Materials and Methods
2.1. Experimental Setup
Figure 1 shows the configuration of the ultrasonic measurement system used to record continuously acoustic signals throughout the freeze–thaw cycle. Meat specimens were placed inside cylindrical plastic capsules (Ø40 × 60 mm, wall thickness 1 mm) and rigidly mounted between the freezing claws of refrigeration system. Internal temperature was measured using two calibrated thermocouples connected to DT890C+ multimeters. To account for spatial temperature gradients in the specimen, one thermocouple was positioned at the specimen’s periphery, and the other one at the core being inserted at an angle to avoid interfering with ultrasound propagation (Figure 2A). Once installed, the acoustic base remained unchanged throughout all measurements during the freezing and thawing experiment (Figure 2B,C). Freezing was performed using the REMS 131012 Frigo 2 F-Zero electric pipe-freezing system of Messtechnik GmbH & Co KG operating with high-purity propane R-290 as the refrigerant [12]. This system supports low-volume freezing studies with power consumption below 500 W. Freezing began at +20 °C and continued until the central thermocouple reached –20 °C. The freezing rates varied between 0.25 and 3 °C/min depending on temperature range and meat heat capacity. After reaching -20 °C, freezing stopped and the thawing phase was initiated by gently heating the freezing claws with a hot-air gun.
2.2. Ultrasonic Measurements
Ultrasound measurements were taken at discrete temperature intervals during the freeze-thaw cycle in through transmission mode using a pair of 2.2 MHz piezoelectric transducers with plane parallel surfaces coaxially mounted on a caliper-based probe to ensure stable pressure and precise readings of the acoustic base. Signals were recorded using a custom acquisition system built on an Altera Cyclone IV FPGA with USB 3.0 FIFO transfer (FT600Q). The system transmitted 2-period tone bursts at 2.2 MHz carrier frequency and voltage 140 Vpp, with 10-bit ADC resolution, 30 MHz sampling, and 16-fold averaging.
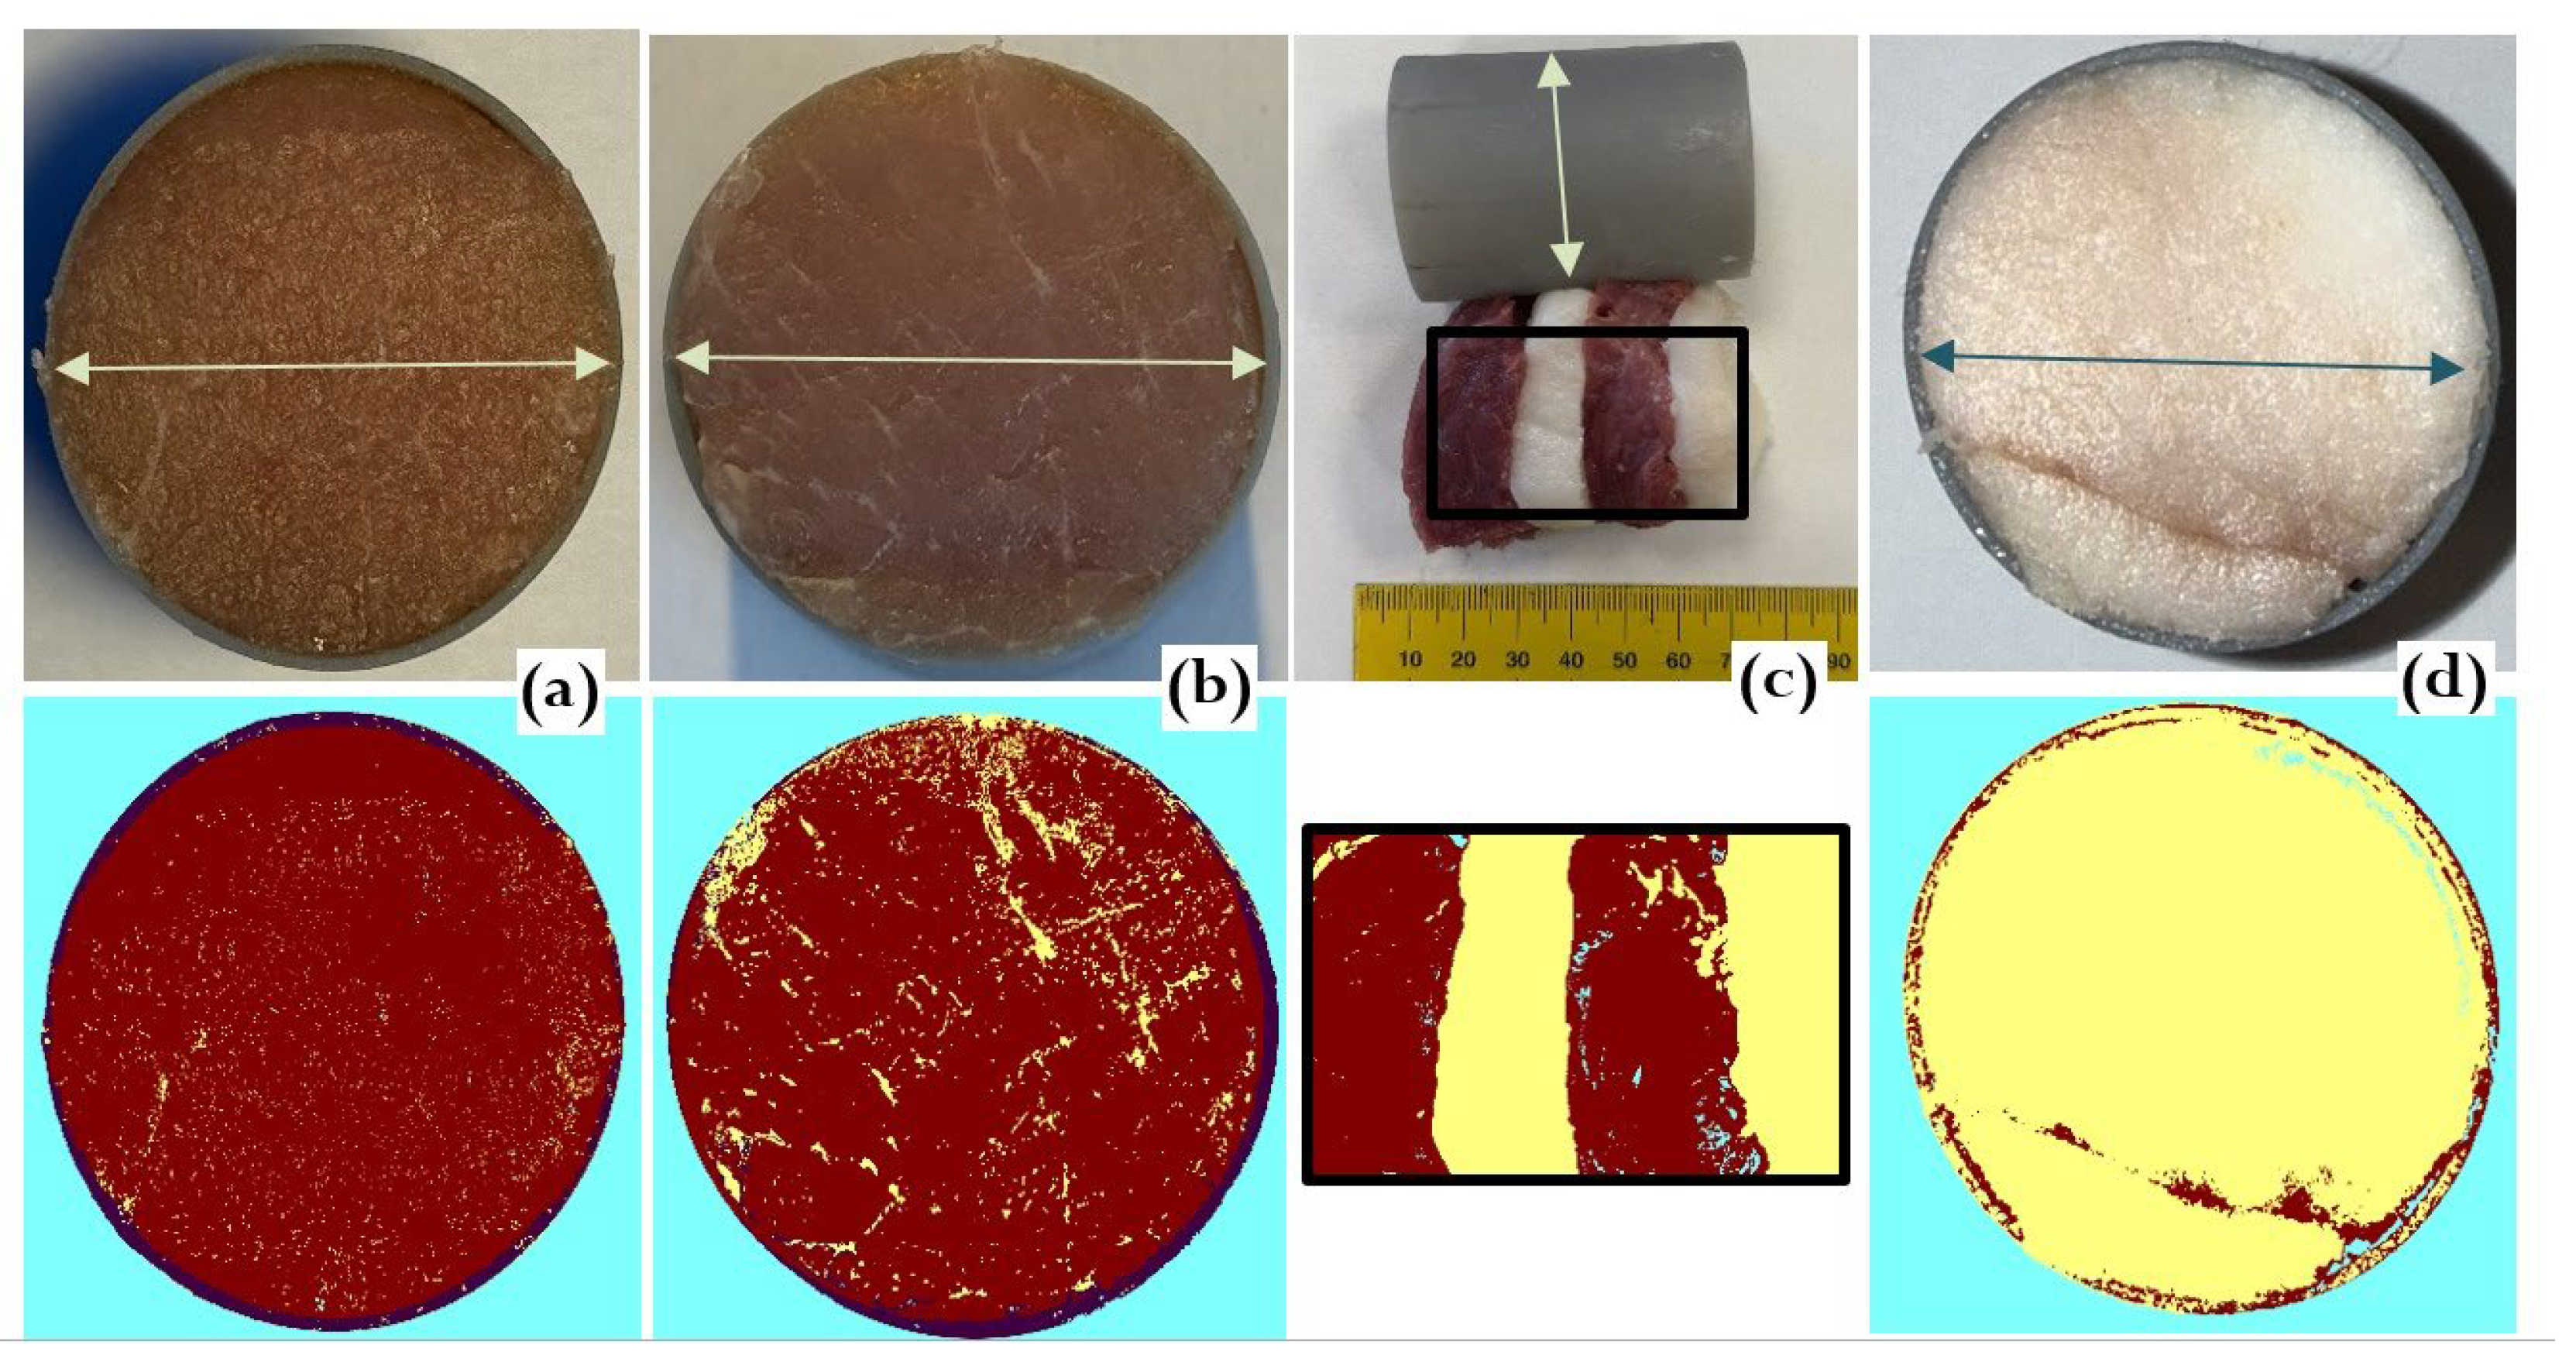
Figure 3.
Meat specimens. (a) Lean pork; (b) marbled pork; (c) layered structure of lean meat and fat; (d) lard. Top row – original images; bottom row – segmented images, where lean tissue is marked in dark red and fat in yellow. Arrows indicate the capsule diameter of 40 mm.
Figure 3.
Meat specimens. (a) Lean pork; (b) marbled pork; (c) layered structure of lean meat and fat; (d) lard. Top row – original images; bottom row – segmented images, where lean tissue is marked in dark red and fat in yellow. Arrows indicate the capsule diameter of 40 mm.
2.3. Specimens
The experiment included five specimens designed to represent a wide range of fat contents to reveal the corresponding ultrasonic trends in the freeze-thaw cycle (Figure 3):
1. Water (reference for freezing behavior of high water-content tissues). Lean pork contains 72-76% water [13];
2. Lean pork (<4% fat);
3. Marbled pork (~10% fat);
4. Layered lean/fat structure (alternating layers of lard and lean meat perpendicular to ultrasound propagation path; ~ 45% fat);
5. Lard. (~ 99% fat).
All specimens were prepared as 60 mm-thick, 40 mm-diameter cuts to be placed inside the corresponding plastic capsules. The water specimen was prepared in the same capsule, sealed inside a thin rubber membrane. Fat and lean proportions were estimated by RGB-based image segmentation using pattern recognition software in C#, calculating the number of pixels corresponding to the proximity to lean and fat classes.
3. Results and Discussion
3.1. General Signal Behavior During Freezing
Ultrasonic transformations during cooling are illustrated in Figure 4 for lean pork and lard. Across all specimens, including water, signal amplitudes decreased markedly during the moment of phase transition. In warm tissue (above 0 °C), direct-propagation signals exhibited high signal-to-noise ratios (SNR) in the range of 300–500. During freezing, amplitudes dropped to SNR 3–8.
However, lean and fatty tissues displayed fundamentally different signal trajectories as temperature decreased to -20 °C, particularly:
a) Lean meat (high water content), characterized by:
- -
- A rapid disappearance of signals indicated the coexistence of liquid water and ice, where emerging crystals scatter ultrasound and increase attenuation.
- -
- Once fully frozen, the specimen formed a more homogeneous acoustic medium, allowing the signal to partially recover (SNR 50–100).
- -
- Ultrasound velocity increased sharply as propagation transitioned from liquid-like tissue to solid-like (ice) behavior.
b) Fatty tissue (lard), characterized by:
- -
- Signal amplitude continued declining throughout the full temperature range.
- -
- MHz-range signals disappeared entirely at deep-frozen states.
- -
- Only weak low-frequency components persisted in frozen fat.
3.2. Stepwise Freeze–Thaw Profiles
Figure 5, Figure 6, Figure 7, Figure 8 and Figure 9 present normalized ultrasonic signals during gradual cooling/freezing and subsequent heating/thawing processes in a sequence of the specimens from water and minimal fat content in meat to high fat content and lard. Left-side plots normalize each signal to its own peak amplitude (emphasizing velocity-related temporal shifts), while right-side plots normalize all measurements to the global peak (highlighting amplitude attenuation).
Key observed trends:
a) Strong amplitude drop in all tissues as freezing begins.
b) Reappearance of MHz-range signals at deep-frozen states in lean meat, but not in fat-rich samples.
c) Faster freezing and thawing transitions in lean meat compared to fatty meat.
d) Symmetrical acoustic behavior during cooling vs. heating, forming distinctive freeze–thaw “gates.”
e) Pronounced hysteresis—actual freeze/thaw transitions lag behind the temperature crossing 0 °C due to internal temperature gradients and thermal hysteresis in water, organic liquids, and fat [14,15].
These trends indicate that each tissue type generates a characteristic ultrasonic freeze–thaw signature, effectively serving as an acoustic fingerprint directly related to fat content and internal structure.
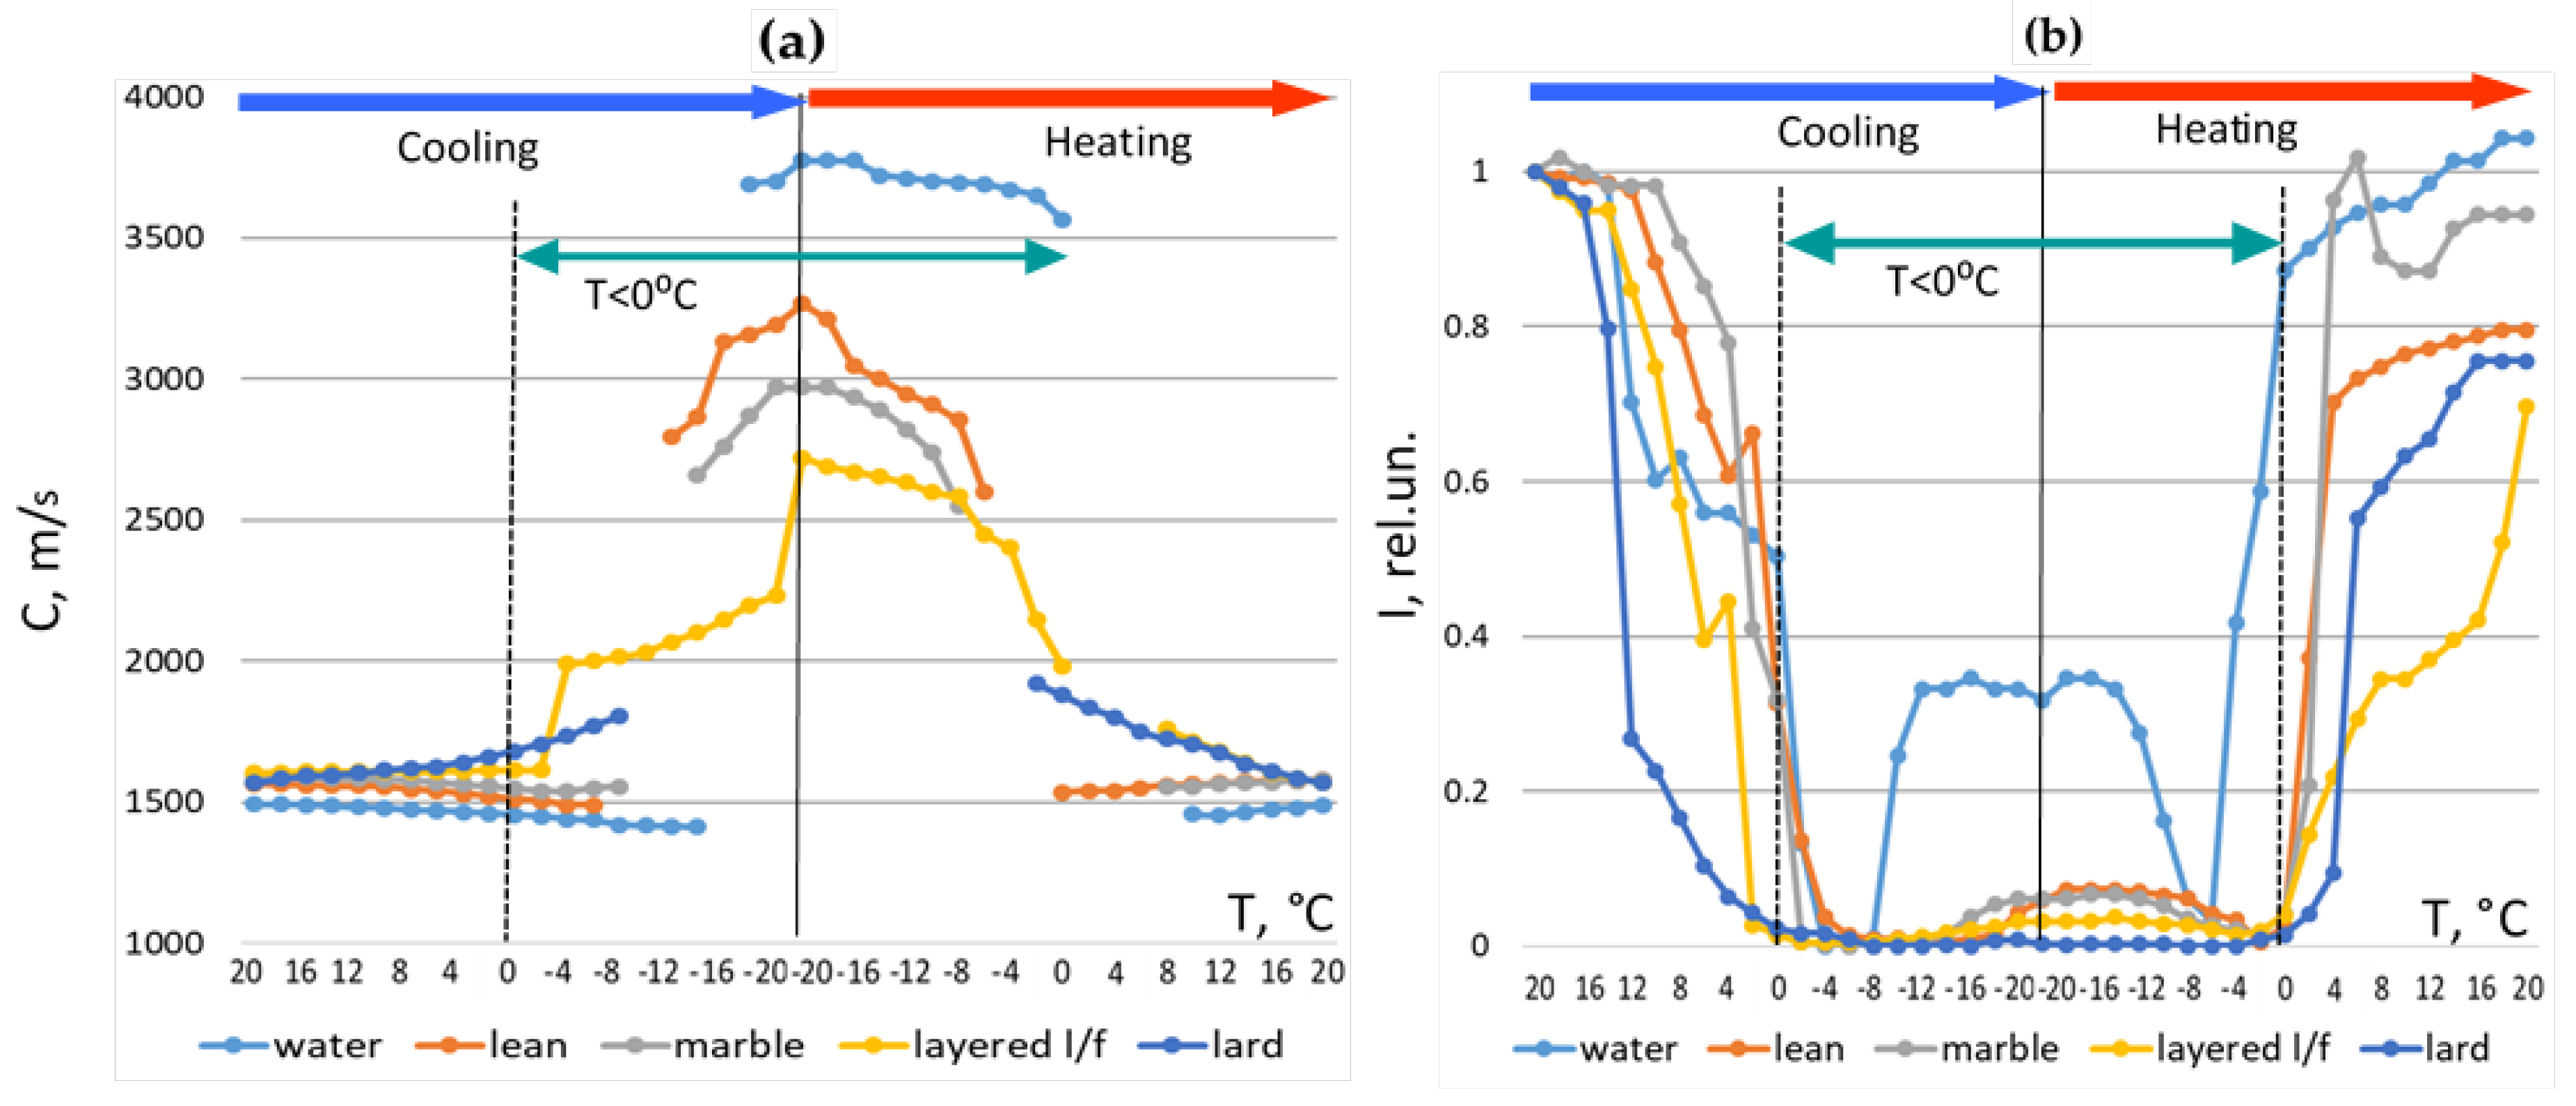
3.3. Quantitative Analyses
Ultrasound velocity and intensity were extracted from recorded signals (Figure 10). Velocity was calculated using transmission time corrected for the transducers constant using the first zero crossing as the signal reference point and calibrated acoustic base. Intensity was derived from the integral of rectified amplitude values after noise correction.
Results of the analysis of changes in the velocity and intensity parameters:
a) Lean meat behaved similarly to water, showing sharp velocity transitions and substantial intensity recovery after full freezing.
b) Fatty tissues exhibited behavior closer to pure fat, with minimal velocity increase and persistent intensity loss.
c) A sharp intensity drop reliably marked the onset of freezing.
d) A velocity jump from 1400–1600 m/s in warm state to > 2000 m/s in frozen state indicated complete freezing for all types of meat.
e) Restoration of velocity and intensity to near-initial values indicated complete thawing for all types of meat.
f) Extremely low intensity values and rapid transitions corresponded to incomplete or partial freezing/thawing due to temperature gradients and hysteresis.
At positive temperatures, when cooling from +20 degrees C to zero, the behavior of velocity and intensity demonstrated the same tendencies as in classical works [16]. Ultrasound velocity in non-fatty, water-rich specimens decreased with cooling, while for fat it increased. In the layered lean/fat specimen, the both trends interfered. The intensity drop with cooling was sharper for fatty specimens confirming increased attenuation in fat with lowering temperature. At positive temperatures, when cooling from +20 °C to zero, the behavior of the velocity and intensity demonstrated the same trends as in classical studies [16]. The ultrasound velocity in non-fatty water rich specimens decreased upon cooling, while it increased in fatty specimens. In the layered lean/fat specimen, both trends interfered. The decrease in intensity upon cooling was sharper for the fatty specimens, confirming the increase in attenuation in fat with decreasing temperature.
4. Conclusions
Ultrasonic measurements captured distinct acoustic patterns during freezing and thawing across meat types with varying fat content. Lean meat exhibited rapid signal attenuation at the onset of ice formation and a clear recovery of amplitude once fully frozen, whereas fatty tissues showed sustained attenuation and, in some cases, complete loss of MHz-range signals throughout deep freezing. All specimens demonstrated notable hysteresis between temperature readings and the true physical transitions of freezing and thawing.
These results show that ultrasound can provide a sensitive, non-destructive, real-time indicator of both the onset and completion of phase transitions during blast freezing and thawing. The method can detect internal freezing non-uniformity, identify incomplete thawing, and differentiate meat based on fat composition – all capabilities that temperature sensors alone cannot offer. This makes the technique promising for improving process control, quality assurance, and energy optimization in industrial meat freezing operations.
Further studies should aim to validate the method on larger industrial-scale cuts, to account for other factors influencing freezing and thawing such as object’s size, cooling/heating rate and types of meat and to integrate ultrasonic sensing with automated freezer controls. Expanding frequency ranges and developing robust industrial transducer mounts will enhance applicability in real processing environments.
Author Contributions
All authors contributed to the study, including principal discussions, drafting, preparing visual materials and formal analysis. A.T. conceptualized the study and overall methodology, designed the test objects, collected ultrasonic data and performed data synthesis; M.O. conducted experiments, processed data and helped in preparing manuscript; V.M. provided organization of studies and participated in data analysis and interpretation.
Funding
The study was supported by the research project of the Latvian Council of Science lzp-2021/1-0290 “Comprehensive assessment of the condition of bone and muscle tissues using quantitative ultrasound” (BoMUS).
Informed Consent Statement
Not applicable.
Data Availability Statement
The original contributions presented in the study are included in the article; further inquiries can be directed to the corresponding author.
Acknowledgments
The authors thank Vyacheslavs Zemchenkovs at the Riga Technical University for assistance in arrangement of the refrigerating system and specimens’ preparation.
Conflicts of Interest
The authors declare no conflicts of interest.
References
- Jiang, L.; Liu, D.; Wang, W.; Li, R.; Yu, S.; Zhou, J. Advancements and perspectives of novel freezing and thawing technologies effects on meat: A review. Food Res. Int. 2025, 204, 115942. [Google Scholar] [CrossRef] [PubMed]
- Zhan, X.; Sun, D.-W.; Zhu, Z.; Wang, Q.J. Improving the quality and safety of frozen muscle foods by emerging freezing technologies: A review. Crit. Rev. Food Sci. Nutr. 2018, 58, 2925–2938. [Google Scholar] [CrossRef] [PubMed]
- Cheng, W.; Gao, Q.; Sun, Y.; Li, X.; Chen, X.; Chong, Z.; Sheng, W. Research progress of freezing processes and devices for fresh meat products. Int. J. Refrig. 2024, 161, 71–82. [Google Scholar] [CrossRef]
- Jeong, S.K.; Jo, K.; Lee, S.; Jeon, H.; Kim, S.; Han, S.; Woo, M.; Choi, Y.S.; Jung, S. Changes in the properties of frozen meat with freezing and storage conditions and non-destructive analyses for monitoring meat quality. Food Sci. Anim. Resour. 2025, 45, 711–726. [Google Scholar] [CrossRef] [PubMed]
- Prempeh, N.Y.A.; Nunekpeku, X.; Murugesan, A.; Li, H. Ultrasound in the food industry: Mechanisms and applications for non-invasive texture and quality analysis. Foods 2025, 14, 2057. [Google Scholar] [CrossRef] [PubMed]
- Jha, R.; Lang, W.; Jedermann, R. Ultrasonic measurement setup for monitoring pre-thawing stages of food. J. Sens. Sens. Syst. 2023, 12, 133–139. [Google Scholar] [CrossRef]
- Chen, H.; Sun, Q.; Xuan, L.; Lin, Z.; Yang, Z.; Huang, X.; Li, Z.; Gao, W.; Ren, J.; Shi, J.; Zou, X. Ultrasonic technology for predicting beef thawing degree and endpoint. J. Food Eng. 2024, 383, 112236. [Google Scholar] [CrossRef]
- Grassi, S.; Jiménez, A.; Ruiz, J.; González-Mohino, A. Use of ultrasound and NIRs as tools for monitoring ice formation in superchilled meat. J. Food Eng. 2024, 369, 111957. [Google Scholar] [CrossRef]
- Khan, M.A.; Ahmad, B.; Kamboh, A.A.; Qadeer, Z. Use of NMR relaxometry for determination of meat properties: A brief review. Food Mater. Res. 2022, 2, 8. [Google Scholar] [CrossRef]
- Wang, B.; Bai, X.; Du, X.; Pan, N.; Shi, S.; Xia, X. Comparison of effects from ultrasound thawing, vacuum thawing and microwave thawing on the quality properties and oxidation of porcine Longissimus lumborum. Foods 2022, 11, 1368. [Google Scholar] [CrossRef] [PubMed]
- Bhandari, S.; Devage, S.A.; Kumar, R.; Ramanathan, R.; Krishnan, S. Electrochemical measurement of freeze–thaw cycle impact on sarcoplasmic oxidation in beef. ACS Meas. Sci. Au 2025, 5, 287–293. [Google Scholar] [CrossRef] [PubMed]
- Mironovs, V.; Tatarinov, A.; Abayev, A.; Zemchenkovs, V. Experimental system for investigating processes of shock freezing of meat. Agron. Res. 2024, 22, 495–502. [Google Scholar]
- Honikel, K.O. Water-holding capacity of meat. In Muscle Development of Livestock Animals: Physiology, Genetics and Meat Quality; Pas, M.F., Everts, M.E., Haagsman, H.P., Eds.; CABI Publishing: Cambridge, MA, USA, 2004; pp. 389–400. [Google Scholar]
- Koc, A.B.; Vatandas, M. Ultrasonic velocity measurements on some liquids under thermal cycle: Ultrasonic velocity hysteresis. Food Res. Int. 2006, 39, 1075–1083. [Google Scholar] [CrossRef]
- Wesolowski, A.; Sienkiewicz, J.J.; Skibniewska, K.A.; Luczycka, D.; Choszcz, D. Hysteresis of ultrasound velocity in pork lard and water during a thermal cycle. J. Food Eng. 2016, 190, 48–53. [Google Scholar] [CrossRef]
- Bamber, J.C.; Hill, C.R. Ultrasonic attenuation and propagation speed in mammalian tissues as a function of temperature. Ultrasound Med. Biol. 1979, 5, 149–157. [Google Scholar] [CrossRef] [PubMed]
Figure 1.
Diagram of ultrasonic measurement setup for monitoring freezing-defrosting process: (a) meat specimen enclosed in claws of refrigeration system; (b) refrigerant tubes; (c) ultrasonic emitter; (d) ultrasonic receiver; (e) digital caliper with transducers’ consoles; (f) ultrasonic acquisition unit; (g) laptop; (h) thermocouples.
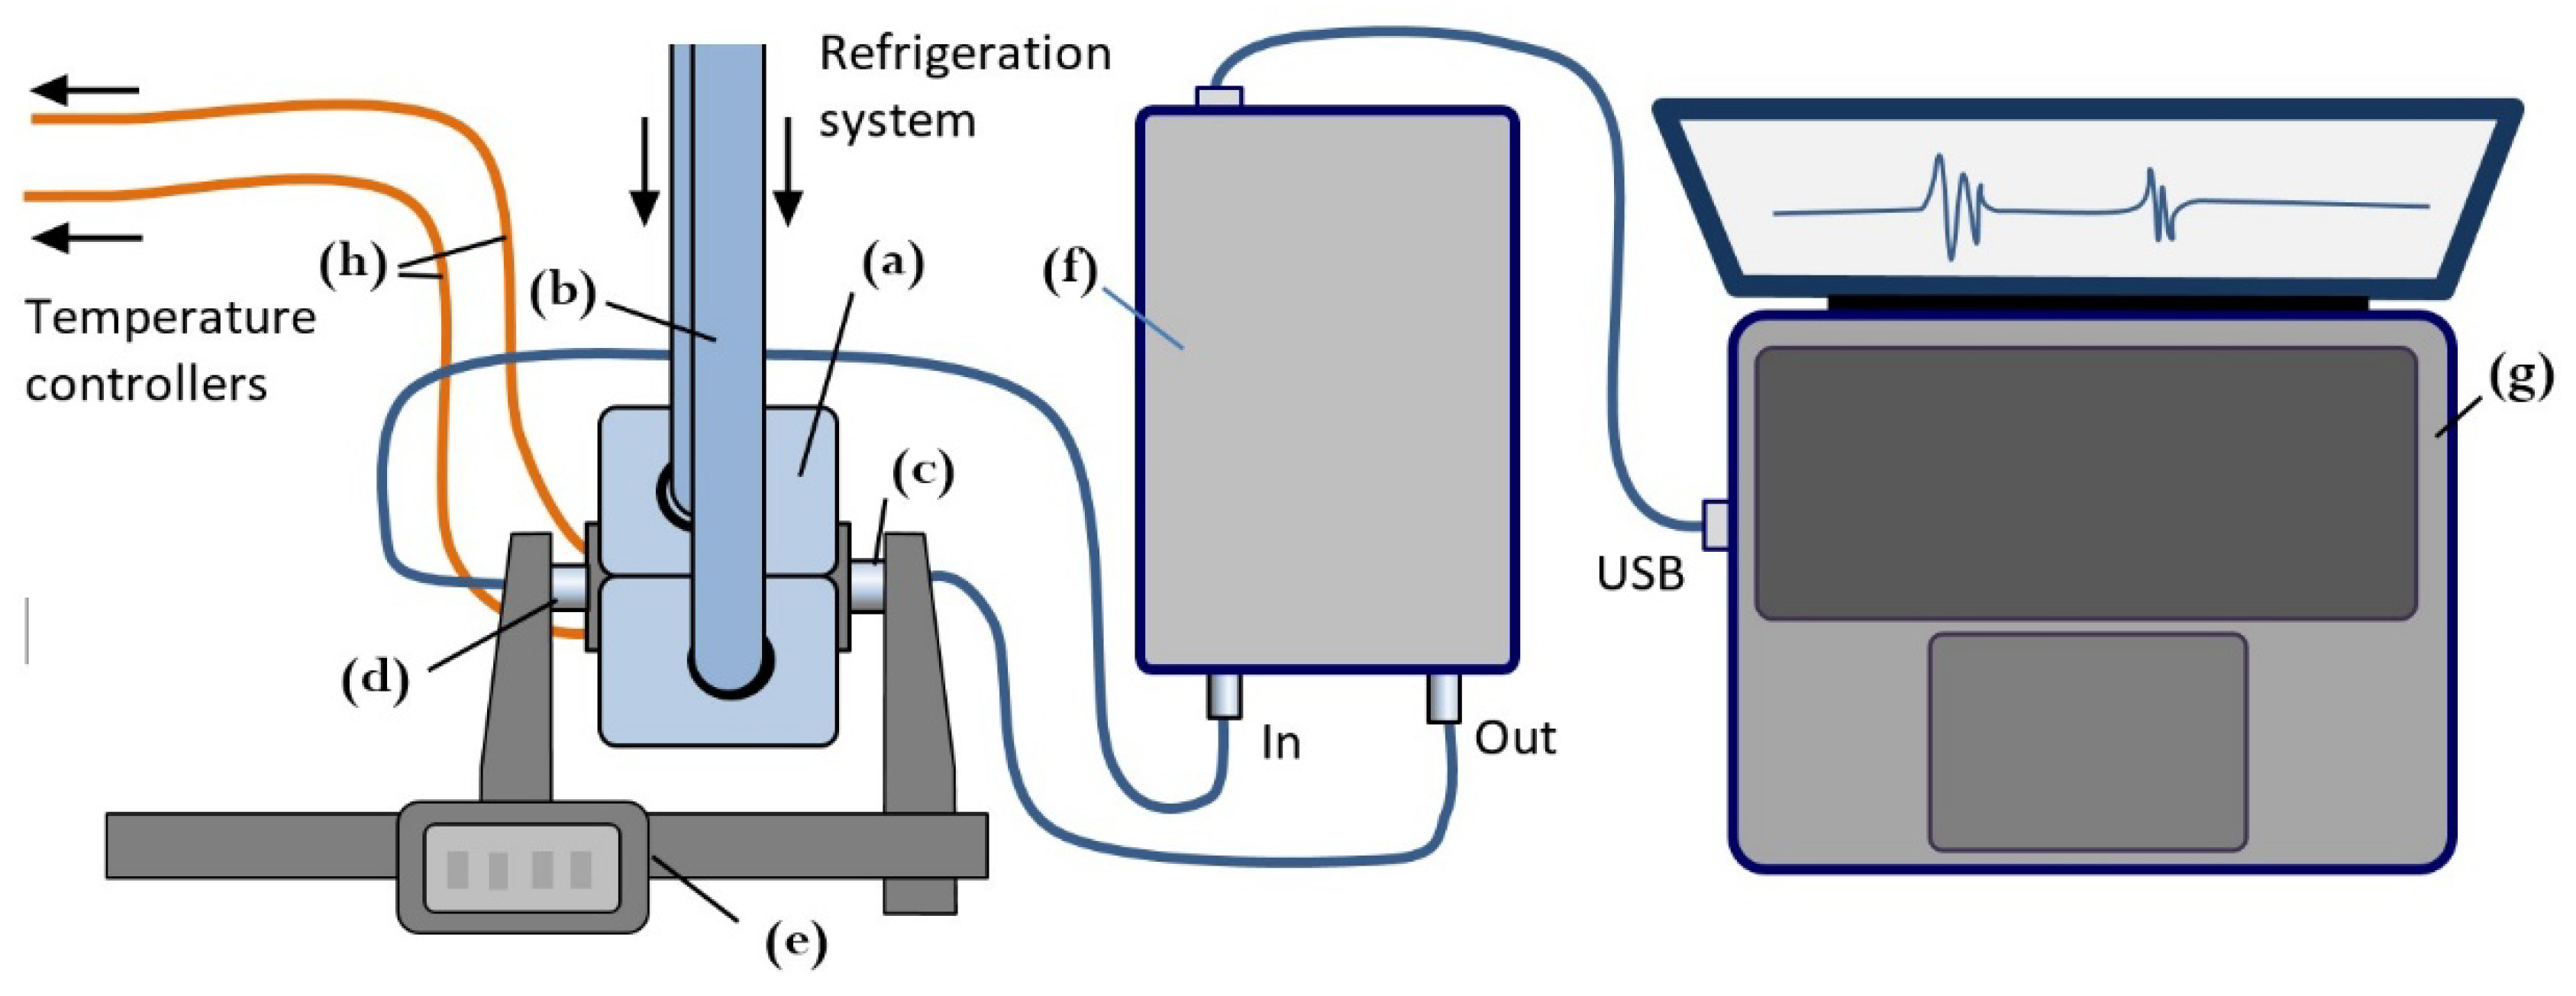
Figure 2.
Illustrations of ultrasonic experiment. (a) Close up view of meat specimen in refrigerator’s claws with inserted thermocouples; (b) measurement assembly; (c) close up view of ultrasonic transducers attached to specimen during freezing.
Figure 2.
Illustrations of ultrasonic experiment. (a) Close up view of meat specimen in refrigerator’s claws with inserted thermocouples; (b) measurement assembly; (c) close up view of ultrasonic transducers attached to specimen during freezing.
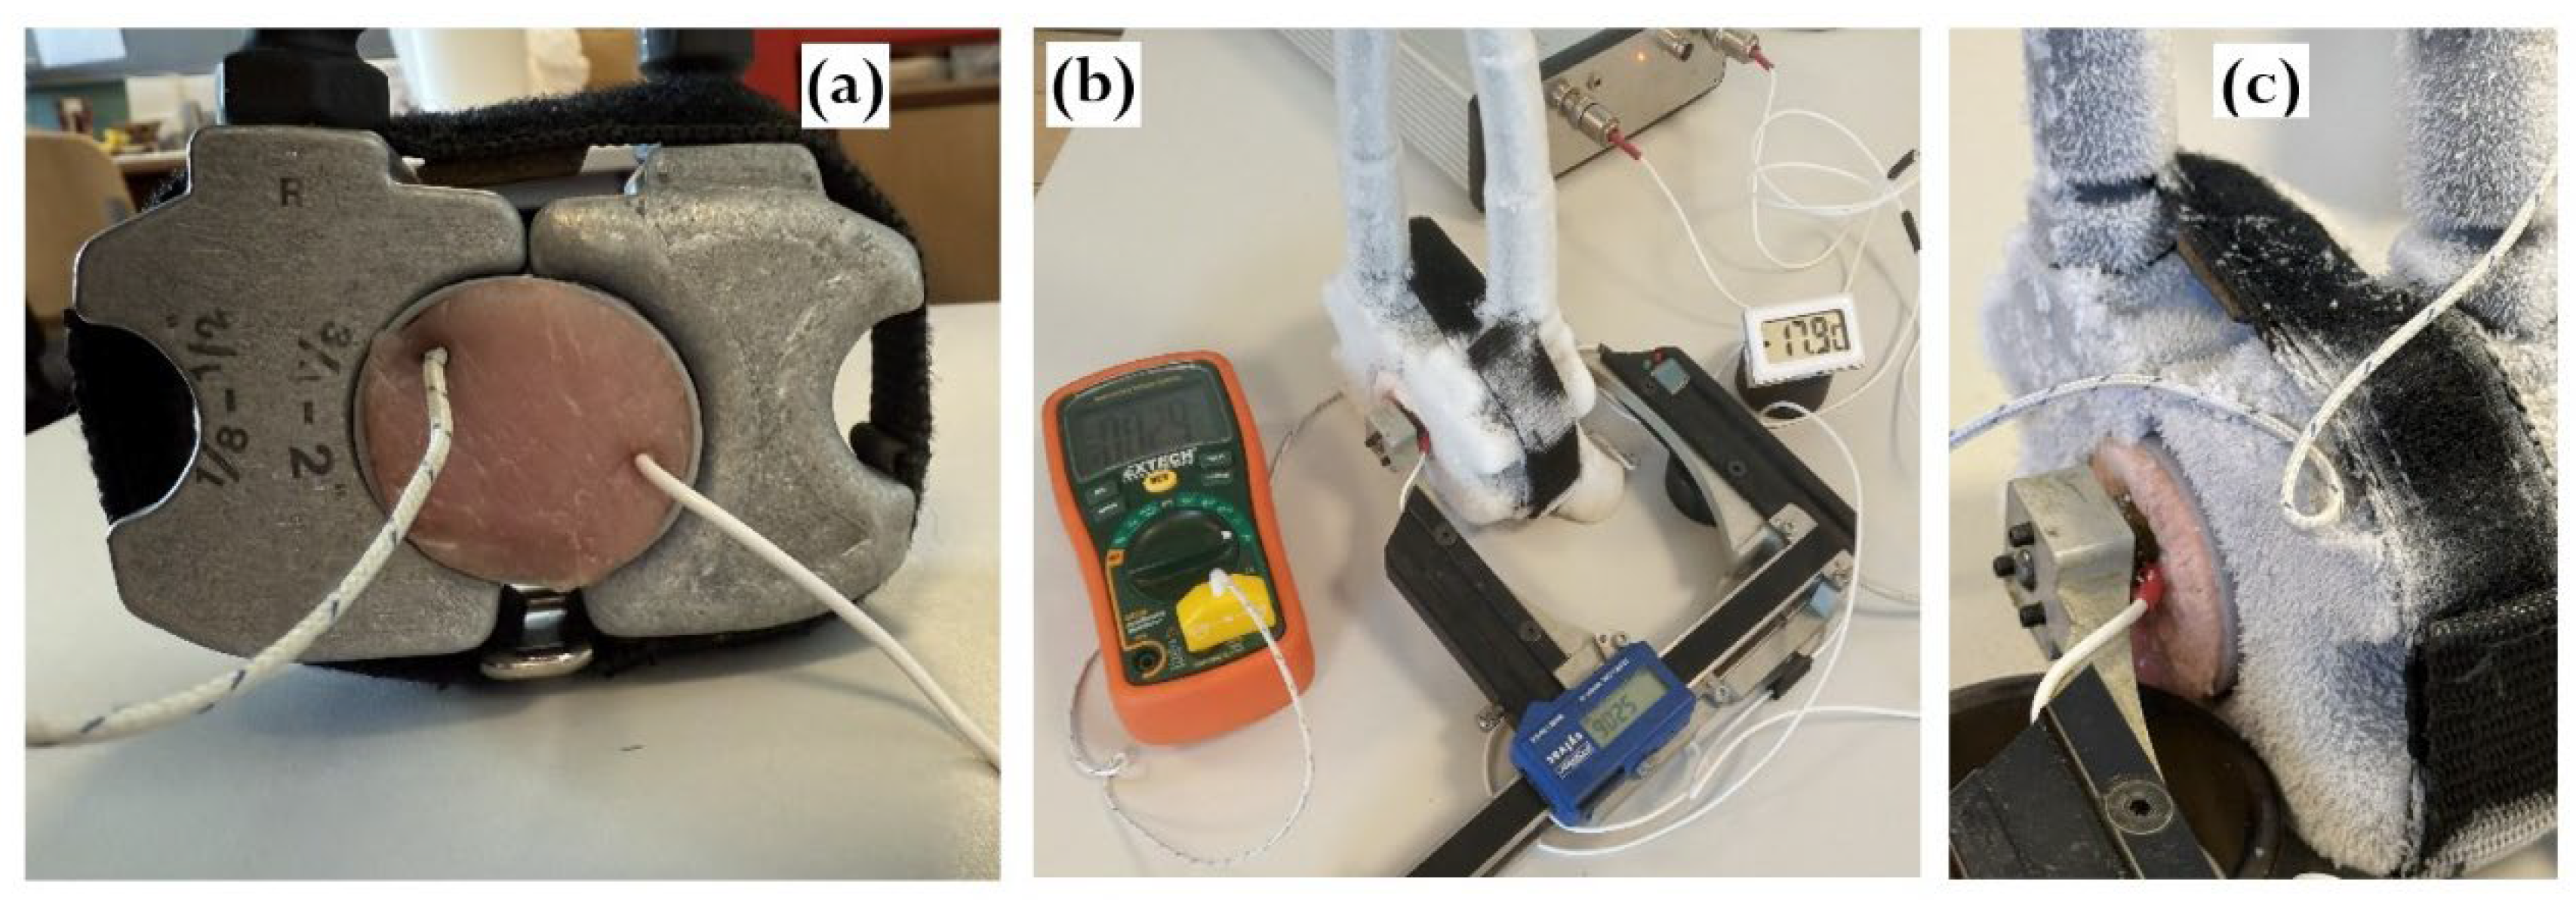
Figure 4.
Changes in ultrasonic waveforms in (a) lean pork and in (b) lard during freezing.
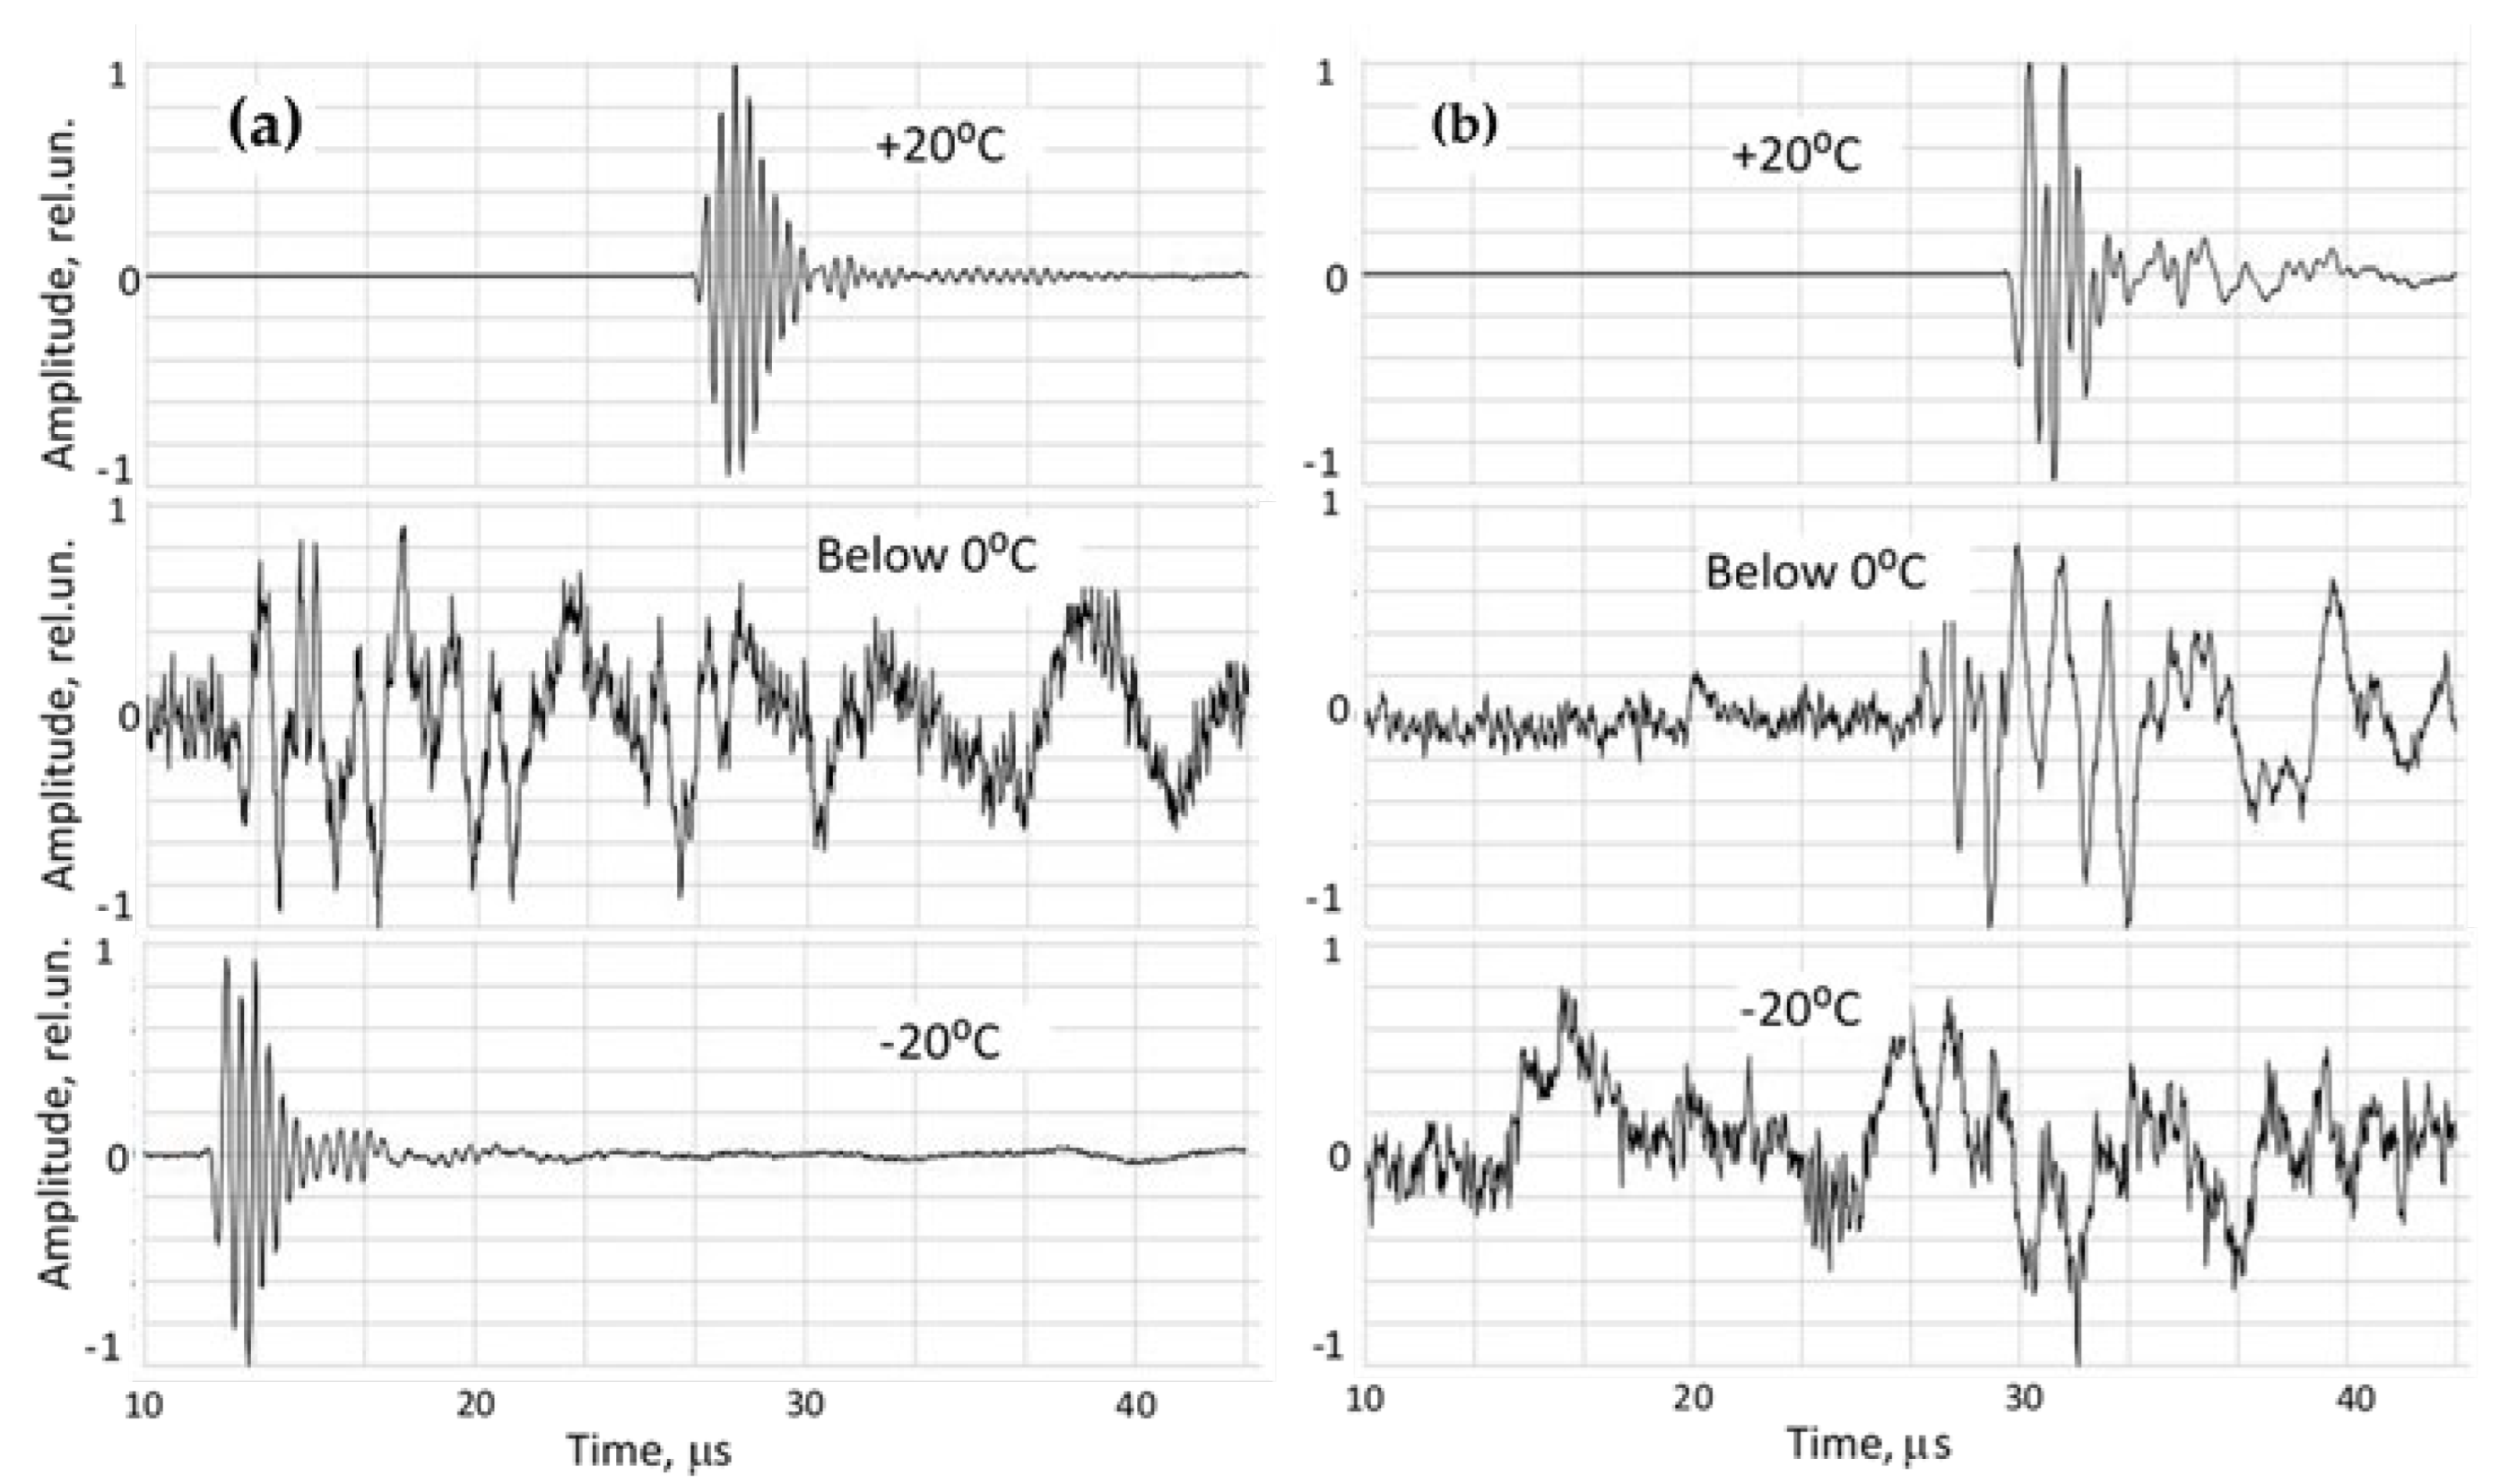
Figure 5.
Diagrams of ultrasonic signal changes in water during freezing and thawing. One line corresponds to the ultrasonic signal on a time scale with color-coded amplitude. The left diagram shows signals normalized by the peak amplitude within each signal; the right diagram shows rectified signals normalized by the peak amplitude across all signals. The freezing (cooling) process is indicated by a blue arrow and the thawing (heating) process by a red arrow. Transitions through zero temperature and reaching -20 °C are marked by red horizontal lines.
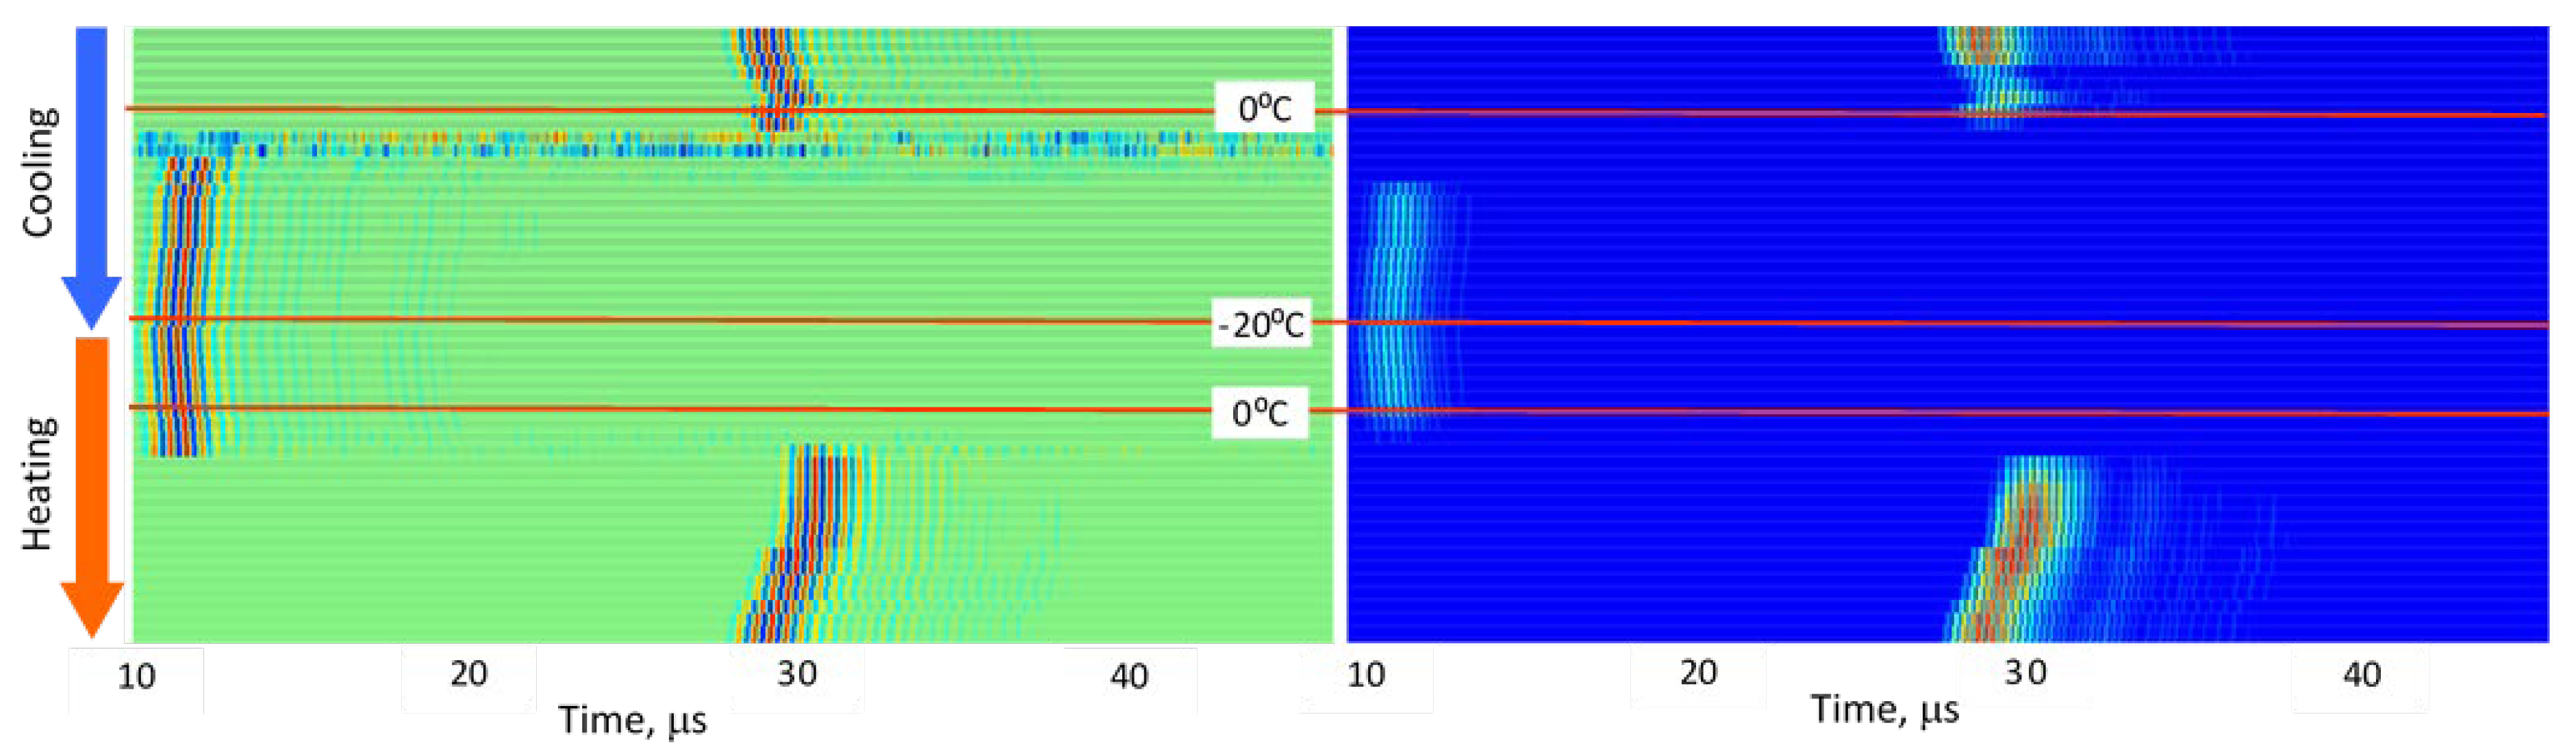
Figure 6.
Diagrams of ultrasonic signal changes in lean pork meat during freezing and thawing. The designations are the same as in Figure 5.
Figure 6.
Diagrams of ultrasonic signal changes in lean pork meat during freezing and thawing. The designations are the same as in Figure 5.
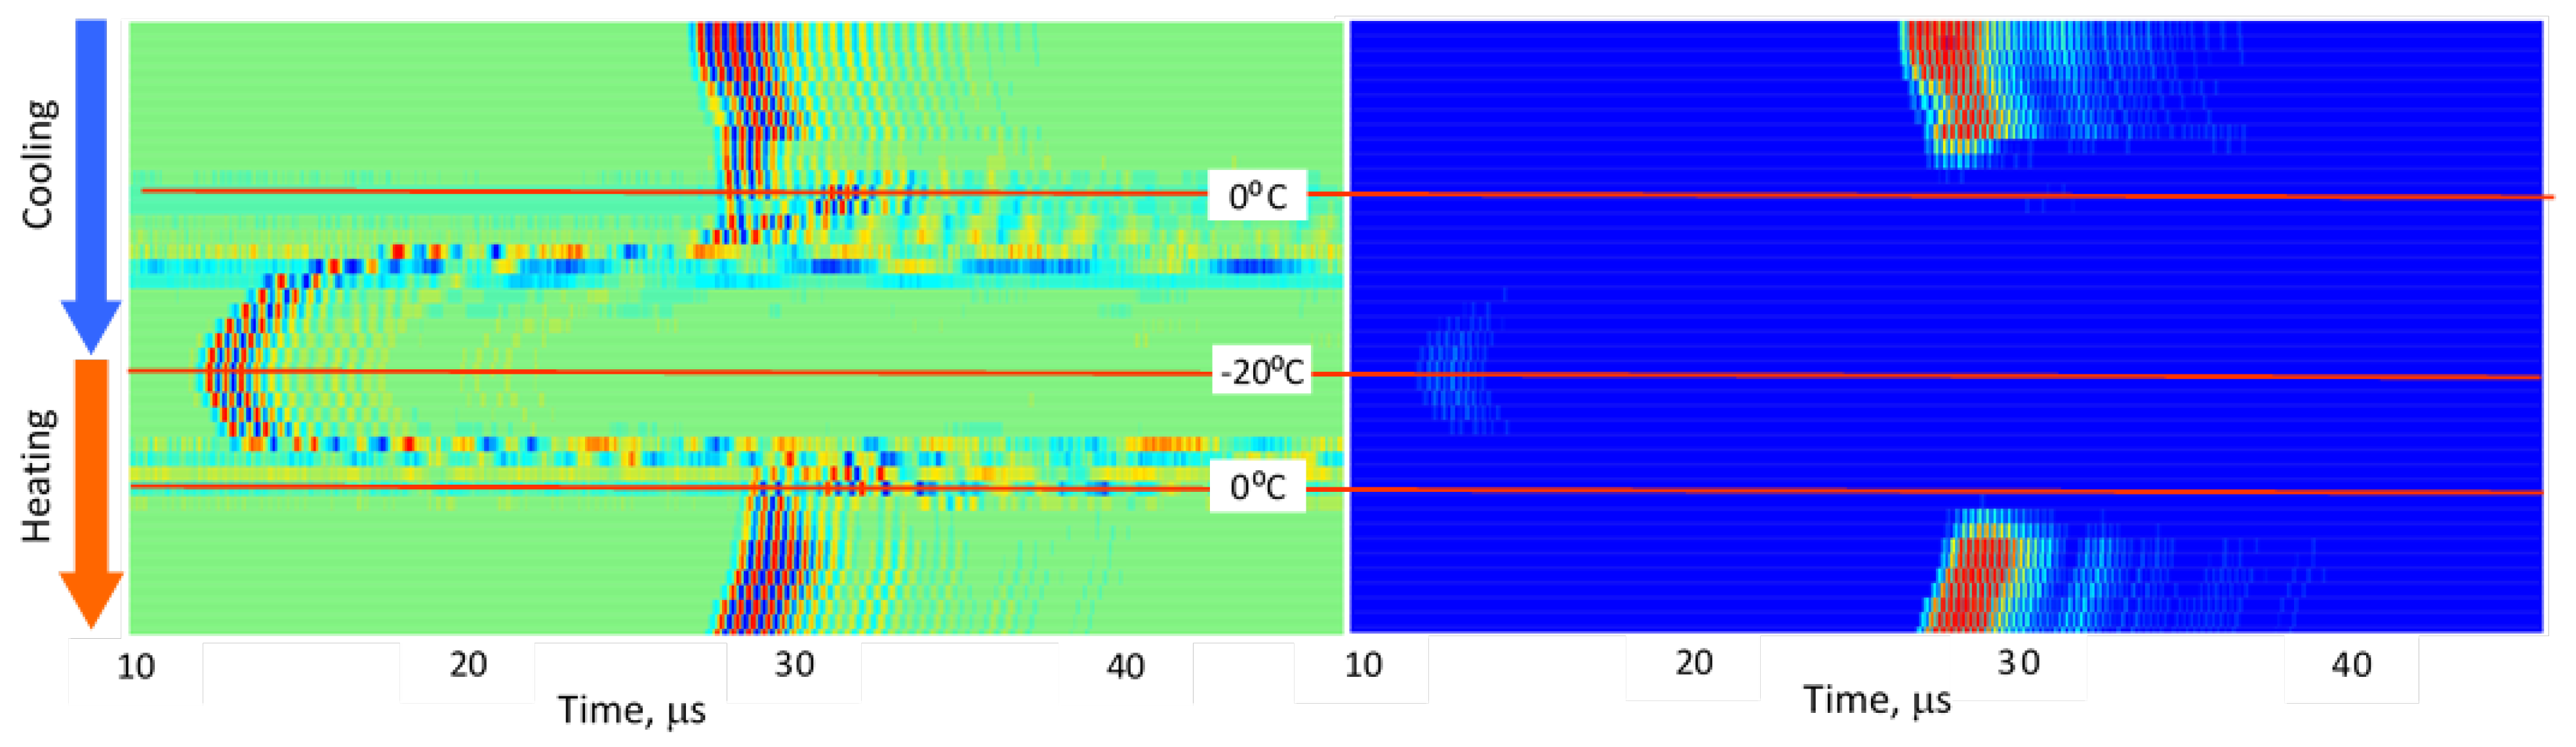
Figure 7.
Diagrams of ultrasonic signal changes in marbled pork meat during freezing and thawing. The designations are the same as in Figure 5.
Figure 7.
Diagrams of ultrasonic signal changes in marbled pork meat during freezing and thawing. The designations are the same as in Figure 5.
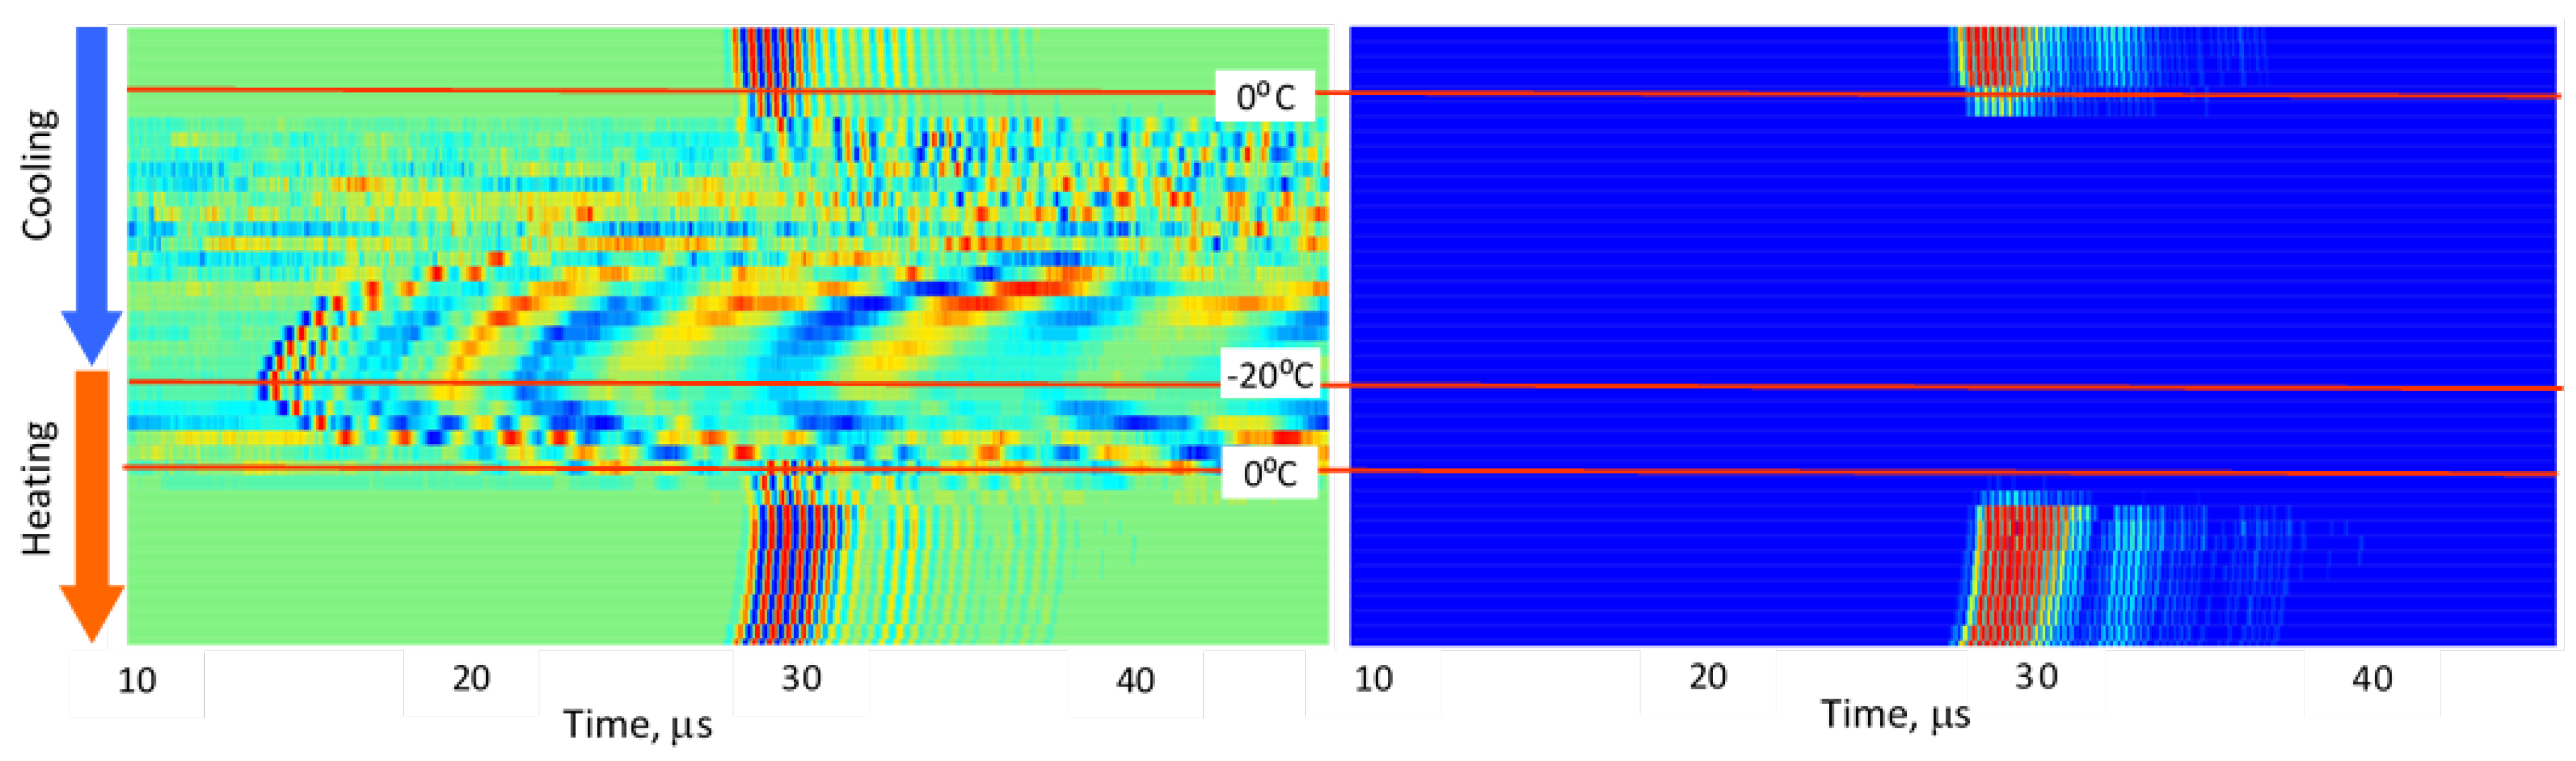
Figure 8.
Diagrams of ultrasonic signal changes in layered lean/fat pork meat during freezing and thawing. The designations are the same as in Figure 5.
Figure 8.
Diagrams of ultrasonic signal changes in layered lean/fat pork meat during freezing and thawing. The designations are the same as in Figure 5.
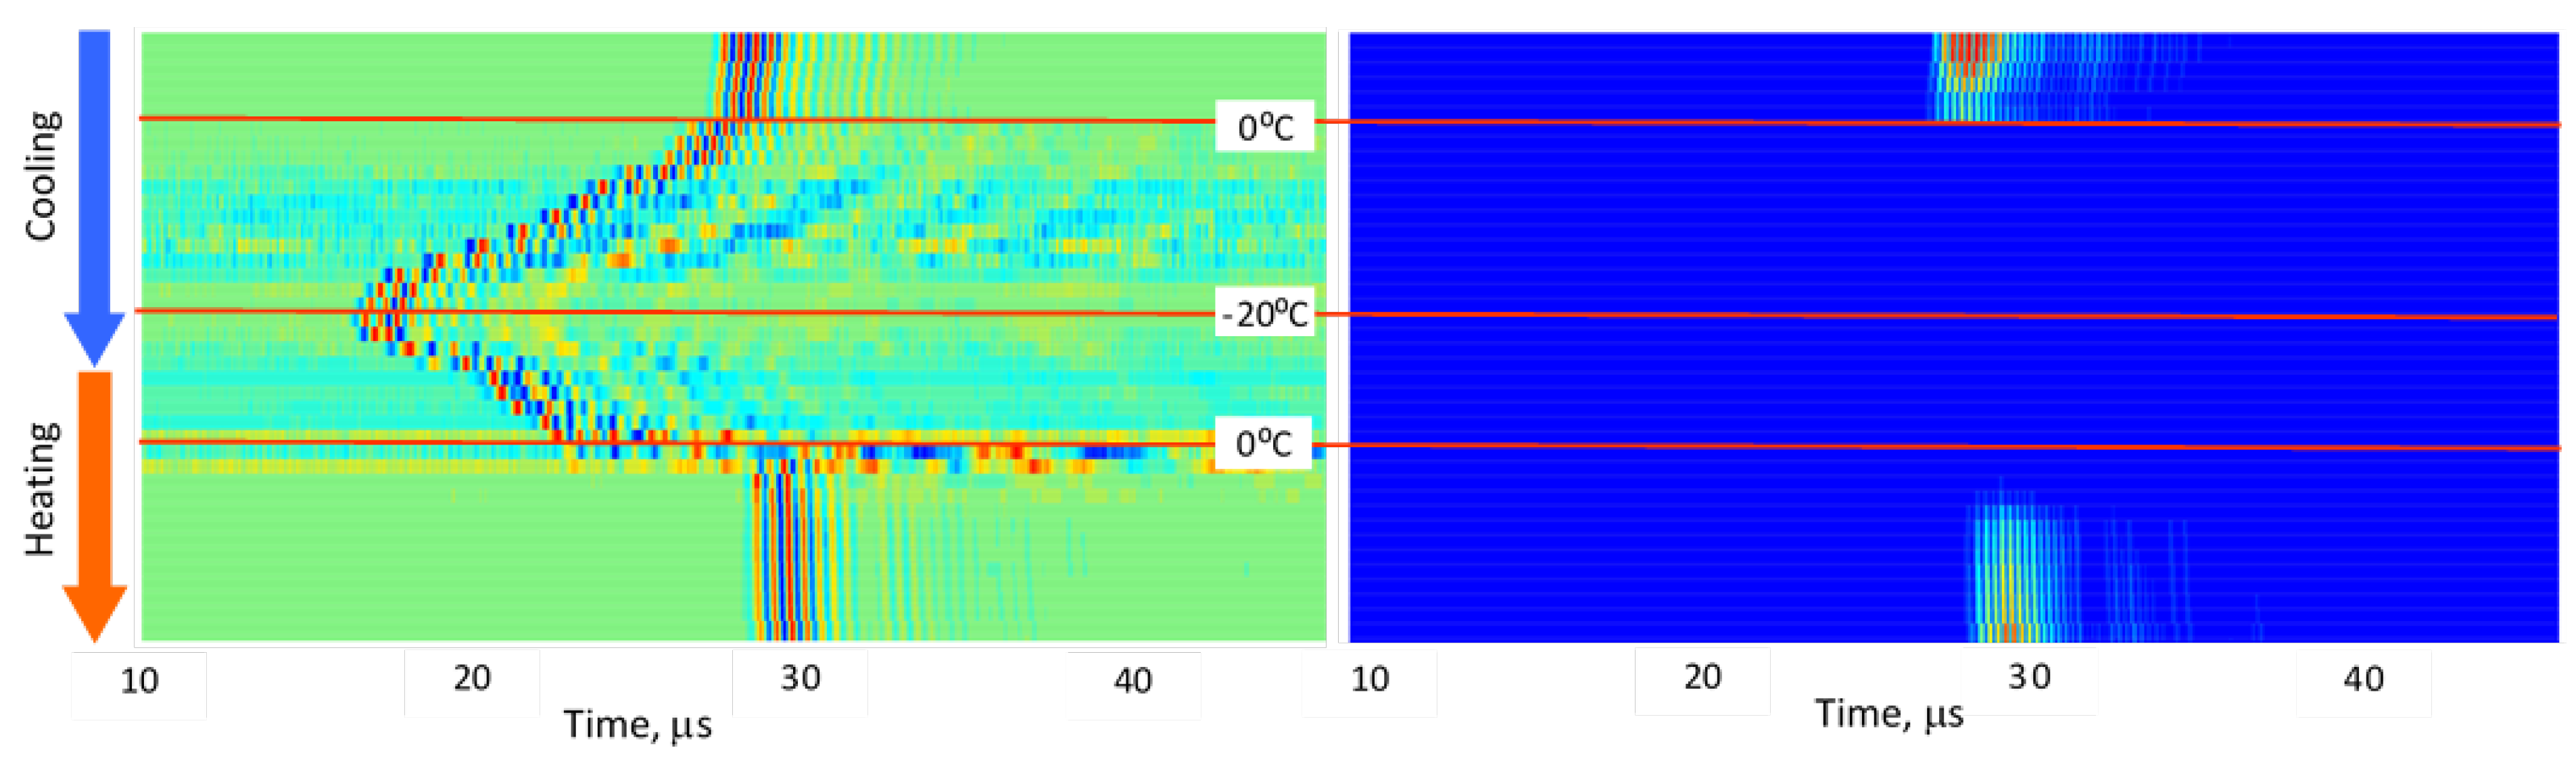
Figure 9.
Diagrams of ultrasonic signal changes in pork lard during freezing and thawing. The designations are the same as in Figure 5.
Figure 9.
Diagrams of ultrasonic signal changes in pork lard during freezing and thawing. The designations are the same as in Figure 5.
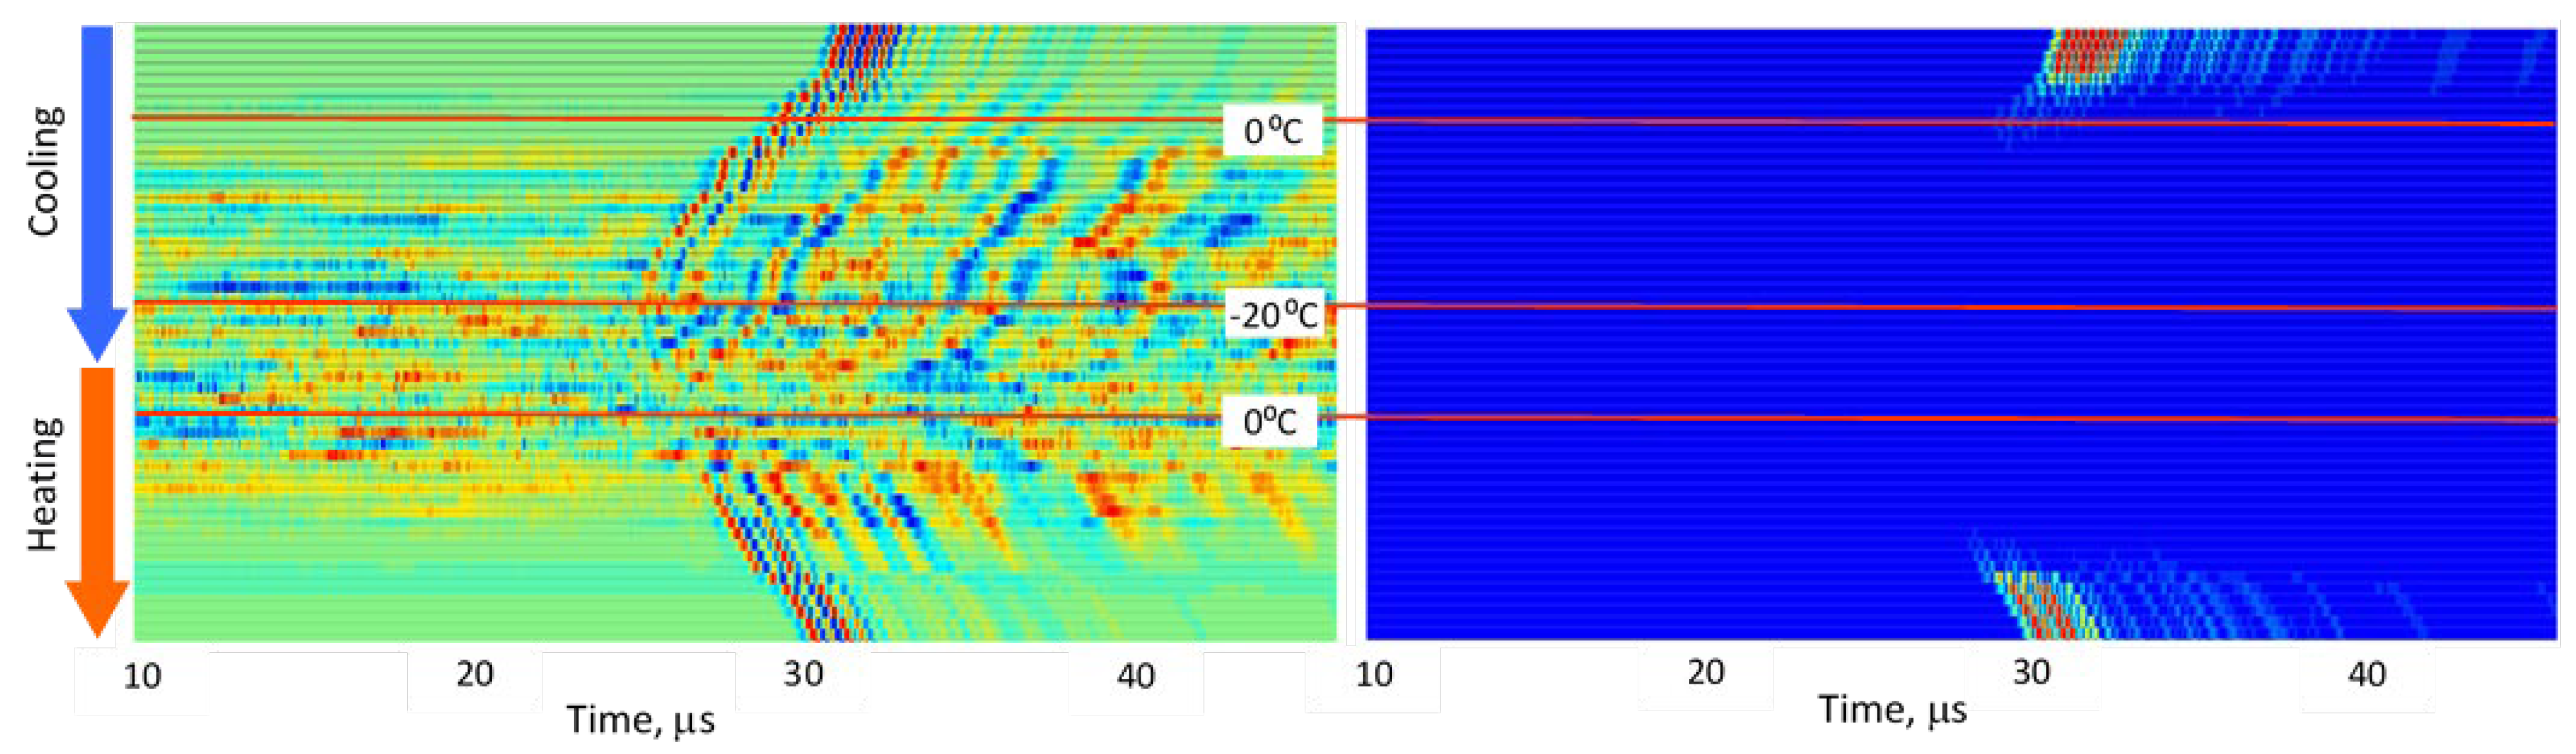
Figure 10.
Changes in ultrasound velocity C (a) and ultrasonic signal intensity I (b) with temperature T change during freezing and thawing processes in water, fat (lard) and different types of meat.
Figure 10.
Changes in ultrasound velocity C (a) and ultrasonic signal intensity I (b) with temperature T change during freezing and thawing processes in water, fat (lard) and different types of meat.
Disclaimer/Publisher’s Note: The statements, opinions and data contained in all publications are solely those of the individual author(s) and contributor(s) and not of MDPI and/or the editor(s). MDPI and/or the editor(s) disclaim responsibility for any injury to people or property resulting from any ideas, methods, instructions or products referred to in the content. |
© 2025 by the authors. Licensee MDPI, Basel, Switzerland. This article is an open access article distributed under the terms and conditions of the Creative Commons Attribution (CC BY) license (http://creativecommons.org/licenses/by/4.0/).
Copyright: This open access article is published under a Creative Commons CC BY 4.0 license, which permit the free download, distribution, and reuse, provided that the author and preprint are cited in any reuse.


