
Submitted:
25 November 2025
Posted:
26 November 2025
You are already at the latest version
Abstract
Promoting the synergistic development of green finance (GF) and green technology innovation (GTI) is crucial for achieving sustainable economic development. Based on the sample data of 30 provinces in China from 2010 to 2023, this study first sorts out the theoretical mechanism of interactive coupling, and then employs methods including Dagum Gini coefficient, spatial kernel density estimation, spatial correlation analysis, and GTWR model to explore the spatiotemporal pattern, evolution trend, and driving factors of the coupling coordination between GF and GTI. The findings are as follows: (1) The CCD is about to transition from the moderate imbalance stage to the near imbalance stage, presenting a distinct spatial pattern of "higher levels and faster development in the east, while lower levels and slower development in the west". (2) Gini coefficient of the CCD shows an upward trend, with the degree of imbalance increasing year by year; the main sources of the overall differences follow the order: Gw > Gb > Gt. (3) The CCD between GF and GTI exhibits a positive spatial correlation, and the agglomeration degree is constantly strengthening; the High-High Cluster areas are mainly concentrated in northern China. (4) Economic development level, financial development level, population scale, and urbanization level drive the coupling coordination between GF and GTI. This study provides new theoretical and empirical evidence for the complex coupling relationship and driving factors of GF and GTI, and offers a key scientific basis for the Chinese government to formulate differentiated regional policies, thereby promoting the effective implementation of the green and low-carbon development strategy.
Keywords:
coupling coordination
; Dagum Gini coefficient
; kernel density estimation
; spatial correlation
; spatiotemporal evolution
; geographically and temporally weighted regression
; driving factors
; green finance
; green technology innovation
1. Introduction
With the growth of the economy and the significant improvement of residents' living standards, global energy and resource consumption has increased sharply. This has led to worsening environmental pollution, a growing scarcity of resource stocks, and enormous challenges to the ecological environment [1,2,3]. In 2022, China put forward the "dual carbon goals". This demonstrates an unwavering commitment to promoting the strategy of ecological priority, intensive resource use, and green and low-carbon development.
Developing green finance (GF) is a key path to establishing environmental protection mechanisms, improving environmental quality, controlling pollutant emissions, promoting green industries, and advancing the progress of production technologies [4]. As a core tool for guiding capital flow to green fields [5], GF can stimulate the application of green technologies [6], promote green innovation in enterprises [7], drive the transformation and upgrading of industrial structures. Its impact in promoting green innovation among polluting enterprises is particularly notable [8].
Meanwhile, green technology innovation (GTI) also opens up new development space for green finance. GTI concentrates technology and capital on green industries such as pollution control, emission reduction and new energy, which can improve production efficiency, reduce production costs, and mitigate environmental pollution. When the green economy develops to a certain stage, it will form green economic growth points, thereby leading to green dividends such as improved investment returns [8], optimized financial environment, and expanded investment market [9], highlighting ecological value and economic benefits of GF.
Existing studies mainly analyze the impact from the perspectives of listed companies [9,10], heavy-polluting industrial enterprises [11], agriculture-related enterprises [12], and new energy enterprises [13,14]. However, research on the reverse promotion of GF by GTI remains relatively scarce. Some scholars have begun to use the CCD and GTWR model to study the coupled and coordinated development of green finance with digital technology [15], green low-carbon transition [16,17], and sustainable economic development [18]. Nevertheless, in-depth research on the environmental impact mechanism of GF and GTI coupling coordination mechanism is still lacking, and empirical studies on its spatiotemporal characteristics, evolution path, and driving factors are even scarcer.
Taking 30 provinces in China as the research object, this study constructs a spatial coupling framework for the dual system of GF and GTI by the CCD model, and breaks through the traditional isolated perspective to reveal the system's synergistic effects. Methodologically, this study innovatively integrates a suite of advanced techniques, including the entropy-weighted TOPSIS method, CCD model, kernel density estimation, Dagum Gini coefficient, GTWR model, and ArcGIS technology. Through this integration, a comprehensive methodological system is established. This system encompasses multiple analytical dimensions: objective indicator weighting, quantitative measurement of synergistic evolution, identification of spatial dependence, analysis of spatiotemporal heterogeneity, and research on driving factors.
This system effectively identifies the spatial dependence and spatiotemporal heterogeneity of system coupling, makes up for the limitation of existing studies that ignore spatial correlation, provides a scientific basis for revealing the synergistic mechanism between GF and GTI, and offers theoretical guidance and empirical reference for promoting the achievement of the dual carbon goals and high-quality green development.
2. Coupling Coordination Mechanism and Driving Factors Between GF and GTI
2.1. Relevant Study on the Relationship Between GF and GTI
2.1.1. Relevant Studies on GF and GTI
International research on the connotation of GF began relatively early. White et al. [19] defined the structure of the financial system, and argued that financial development should be integrated with environmental protection and promote the synergistic development of the economy and the environment. As GF has continued to develop, its concept has been continually refined. Linnenluecke et al. [20] argued that GF refers to innovation in financial instruments, systems, and models that serve environmental protection projects and energy conservation. At the G20 Hangzhou Summit in 2016, the G20 Comprehensive Report on Green Finance clarifies the meaning of GF [21]. Later, with the release of Guiding Opinions on Establishing Green Finance System, "green finance" gradually gained increasing attention, and China's green finance entered a phase of rapid development.
GF can expand China’s green development space [22], optimize the economic structure without suppressing total output and total employment, and promote sustainable regional economic development [23]. Its role is more prominent for technology-intensive enterprises with high dependence on external financing [24].
Microscopically, GF can improve the production efficiency of green enterprises [25], significantly promote their social responsibilities [26]. It is more conducive to stimulating the innovation motivation of green enterprises. Some scholars [27] found that green credit impacted the real operations of heavy-polluting enterprises through financing constraints, significantly curbing their pollution discharge behavior. However, these enterprises do not proactively transform and upgrade through technological innovation, and the Porter Hypothesis is not obvious. Lu et al. [28] found that the cost-following effect and credit constraint effect caused by green credit policies have reduced the technological innovation of heavy-polluting enterprises, failing to generate the Porter effect. Using a mediation effect model, He et al. argued the green credit level and R&D investment has a significant promoting effect on the environmental protection enterprises [29].
As a type of technological innovation that integrates economic benefits and ecological benefits, GTI provides crucial technological support for green development. Existing studies mainly rely on the "Porter Theory" hypothesis and have developed a systematic theoretical framework and empirical evidence focusing on aspects such as the driving factors, environmental benefits, empirical testing, and policy application of GTI. Scholars generally agree that GTI is a vital engine for green development—through GTI, outdated production capacity can be eliminated, production efficiency improved, and environmental pollution reduced [30]. Scholars have also examined issues related to financial support for the development of GTI [31], using game theory models to deduce that GF provides financing support for enterprises, thereby improving energy efficiency and curbing carbon dioxide emissions [32].
2.1.2. Study on the Relationship Between GF and GTI
There are mainly two viewpoints in the study of the relationship between GF and GTI. First, scholars argue that GF significantly improves the level of green productivity [33] and exerts a relatively obvious positive impact on technological innovation [34,35,36]. Second, some hold that the impact on technological innovation shows a U-shaped trend [37]. Specifically, some studies agree that as the environmental regulation role of GF continues to strengthen, the crowding-out effect on enterprises' innovation input gradually intensifies. However, after crossing the inflection point of the U-shaped curve, enterprises can obtain more financial support for their green environmental protection projects, which is then allocated to technological innovation. Additionally, another viewpoint suggests that the impact on green innovation has a double threshold effect. This indicates that the driving effect weakens as the intensity of environmental regulation increases, implying that environmental regulation needs to be moderate [38].
2.2. Analysis of the Coupling Coordination Mechanism
These two systems are not mutually independent; instead, there is an interlocking relationship of mutual interaction between them. The synergistic development of GF and GTI is an indispensable path for the sustainable economic development.
First, GF provides necessary capital support for GTI to alleviate capital bottlenecks and insufficient financing [39]. Zhu et al. [40] confirmed that GF promotes technological innovation through R&D subsidies and environmental regulation. Zhao et al. [41] pointed out that green credit has a significant incentive effect on GTI and will drive the improvement of enterprises' technological innovation level. Second, GF guides capital flow to environment-friendly enterprises through its "resource allocation" and "capital orientation" functions, accelerating the transformation and upgrading of the green industrial structure [42]. GF can help enterprises reduce financing costs, expand financing channels, thereby reducing financing constraints [43], alleviating the capital pressure of green technology transfer, and promoting green technology innovation in enterprises [44]. Third, many scholars have also started discussing the implications of the lag in green finance. Hou et al. [45] pointed out that insufficient supply of green capital and high financing costs for green finance, are the core manifestations of green finance at present. Pasquale et al. [46] argued that the insufficient coverage of green finance makes it challenging for small and medium-sized enterprises to participate in it. It is a significant factor contributing to the slow development of green finance.
Conversely, the dividend feedback from GTI can boost the development of GF. GTI concentrates technology and capital on green industries (e.g., new energy, pollution control, and energy conservation). It can improve production efficiency, reduce production costs, and mitigate environmental pollution. When the green economy develops to a certain stage, it can replace the traditional economy, form green economic growth points, and highlight the ecological value and economic benefits through green dividends. In this process, the scale of financial institutions, will further expand. However, the two systems of GF and GTI have long been in a running-in stage, and insufficient coordination between the systems restricts the improvement of their overall development level.
The aforementioned research findings indicate that there is an objective coupling effect between GF and GTI. At the enterprise level, GTI projects require capital injection to conduct R&D and marketization of achievements, generate investment returns, and feed back to green financial capital, thereby achieving a win-win outcome between enterprises and financial institutions. At the industrial level, the guidance of GF effectively directs capital to withdraw from the "high-energy consumption, high-emission, and overcapacity" industries and flow toward environment-friendly industries. This enhances the overall magnitude and degree of green innovation, and ultimately forms green economic growth points through the industrial agglomeration effect [31].
2.3. Impact of Different Development Situations of GF and GTI on Coupling Coordination
When both GF and GTI are at a relatively high level, the two systems will be in a state of high coupling. At this stage, after obtaining sufficient capital support through green finance, green enterprises concentrate resources on R&D and innovation of green technologies, convert these achievements into profits through marketization, and return the profits to financial institutions in the form of investment returns. Meanwhile, financial institutions gain the expected green investment returns, which increases their willingness to engage in green investment. This will further optimize the financial environment, and expand the scale of green finance market, ultimately forming an industrial agglomeration effect and a scale effect.
When either GF or GTI lags behind in development, the two systems will be in a state of insufficient coupling or coupling at a low development level. If GF lags behind, its functions of "risk diversification" and "alleviating capital shortages" will be weakened, reducing its ability to provide capital support for GTI projects. To obtain green capital with low financing costs but limited overall scale, green enterprises will compete for market share in the field of GTI. This will lead to green products showing signs of homogenization and low-end orientation, thereby seriously hindering the sustainable development of GTI. Additionally, when GTI is in a backward state, the scale of GF will shrink due to the lack of suitable investment projects in the market. The lagging GTI conditions and generally low market innovation will lead to convergence in green product offerings. This will reduce the "green investment returns" of financial institutions, dampen the enthusiasm for green investment, and further lead to capital outflow, ultimately exacerbating the financing constraint problem of GTI.
2.4. Analysis of Driving Factors for the Coupling Coordination Between GF and GTI
To effectively promote in-depth integration and coordinated development, it is essential to thoroughly analyze the issue of the driving factors that have a significant impact on the CCD. This will enable the formulation of relevant policies more targetedly and the optimization of resource allocation, thereby further improving the coupling level, and facilitating the smooth achievement of sustainable development goals. Drawing on existing literature, this study selects economic development level (ED), financial development (FD), population scale (PS), and urbanization level (UR) as the influencing factors to analyzes their driving force.
The economic development (ED) level serves as the core material foundation for the synergistic evolution of GF and GTI, and its driving role is reflected in the dual pathways of "supply guarantee + demand pull" [47]. GTI (e.g., low-carbon technology R&D, environmental protection equipment iteration) is characterized by high investment, long cycles, and high risks, requiring sustained financial support. Enterprises in economically developed provinces have stronger profitability and can independently bear a higher proportion of R&D costs; meanwhile, local governments possess more robust fiscal strength and can reduce the risks and costs of innovation entities through green subsidies, tax reductions, thereby providing a "financial buffer" for GTI. When the economy develops to a certain stage, society’s demand for "green development" will shift from "passive compliance" to "active pursuit," forcing enterprises to accelerate GTI. Meanwhile, the expanded market demand for green financial products drives financial institutions to optimize their green service systems. Ultimately, this realizes a positive cycle of "green demand - technological innovation - financial support".
The financial development (FD) level directly determines the "support efficiency" of GF for GTI and serves as a "bridge and link" for the coupling of the GF and GTI. Provinces of high financial development level have a larger-scale financial market and more varied entities, enabling them to provide a richer range of green financial instruments [48]. For instance, commercial banks can provide targeted support for enterprises' innovation projects through green credit; securities firms can assist in issuing green corporate bonds to raise R&D funds; and green insurance can hedge against the risks of innovation failure. These measures collectively address the issues of "difficulties in financing and high financing costs" for GTI. A well-developed financial market can reduce information asymmetry in green projects through information disclosure mechanisms, screen high-quality innovation projects via risk pricing mechanisms, and guide capital to flow from high-pollution and low-efficiency sectors to the field of GTI. This directly promotes the in-depth coupling of GF and GTI.
GTI relies on high-quality labor. Provinces with a large population scale (PS) have more sufficient human capital reserves, which easily form a "talent pool" and provide a "human core" for GTI [49]. In addition, a large population scale means a broader consumer market for green products and services, which will stimulate enterprises to increase investment in green technology R&D. Meanwhile, large-scale market demand can reduce the unit costs of green technologies and attract financial institutions to increase the supply of GF. The "human capital dividends" and "market scale dividends" brought by population scale are important guarantees for the synergy between GF and GTI [50].
Urbanization level (UR) serves as the spatial agglomeration force for the coupling coordination. With the acceleration of urbanization, industries agglomerate at an accelerated pace, which can reduce the cost of technological cooperation among enterprises, promote the sharing and iteration of green technologies, and also enhance the availability of green financial services. The environmental pressure brought by urbanization will strengthen local governments’ demand for green governance and promote the green technologies. Therefore, urbanization is the spatial support for the synergy between GF and GTI [51], and the improvement of its level can provide "physical space" and "policy impetus" for the coupling of the GF and GTI.
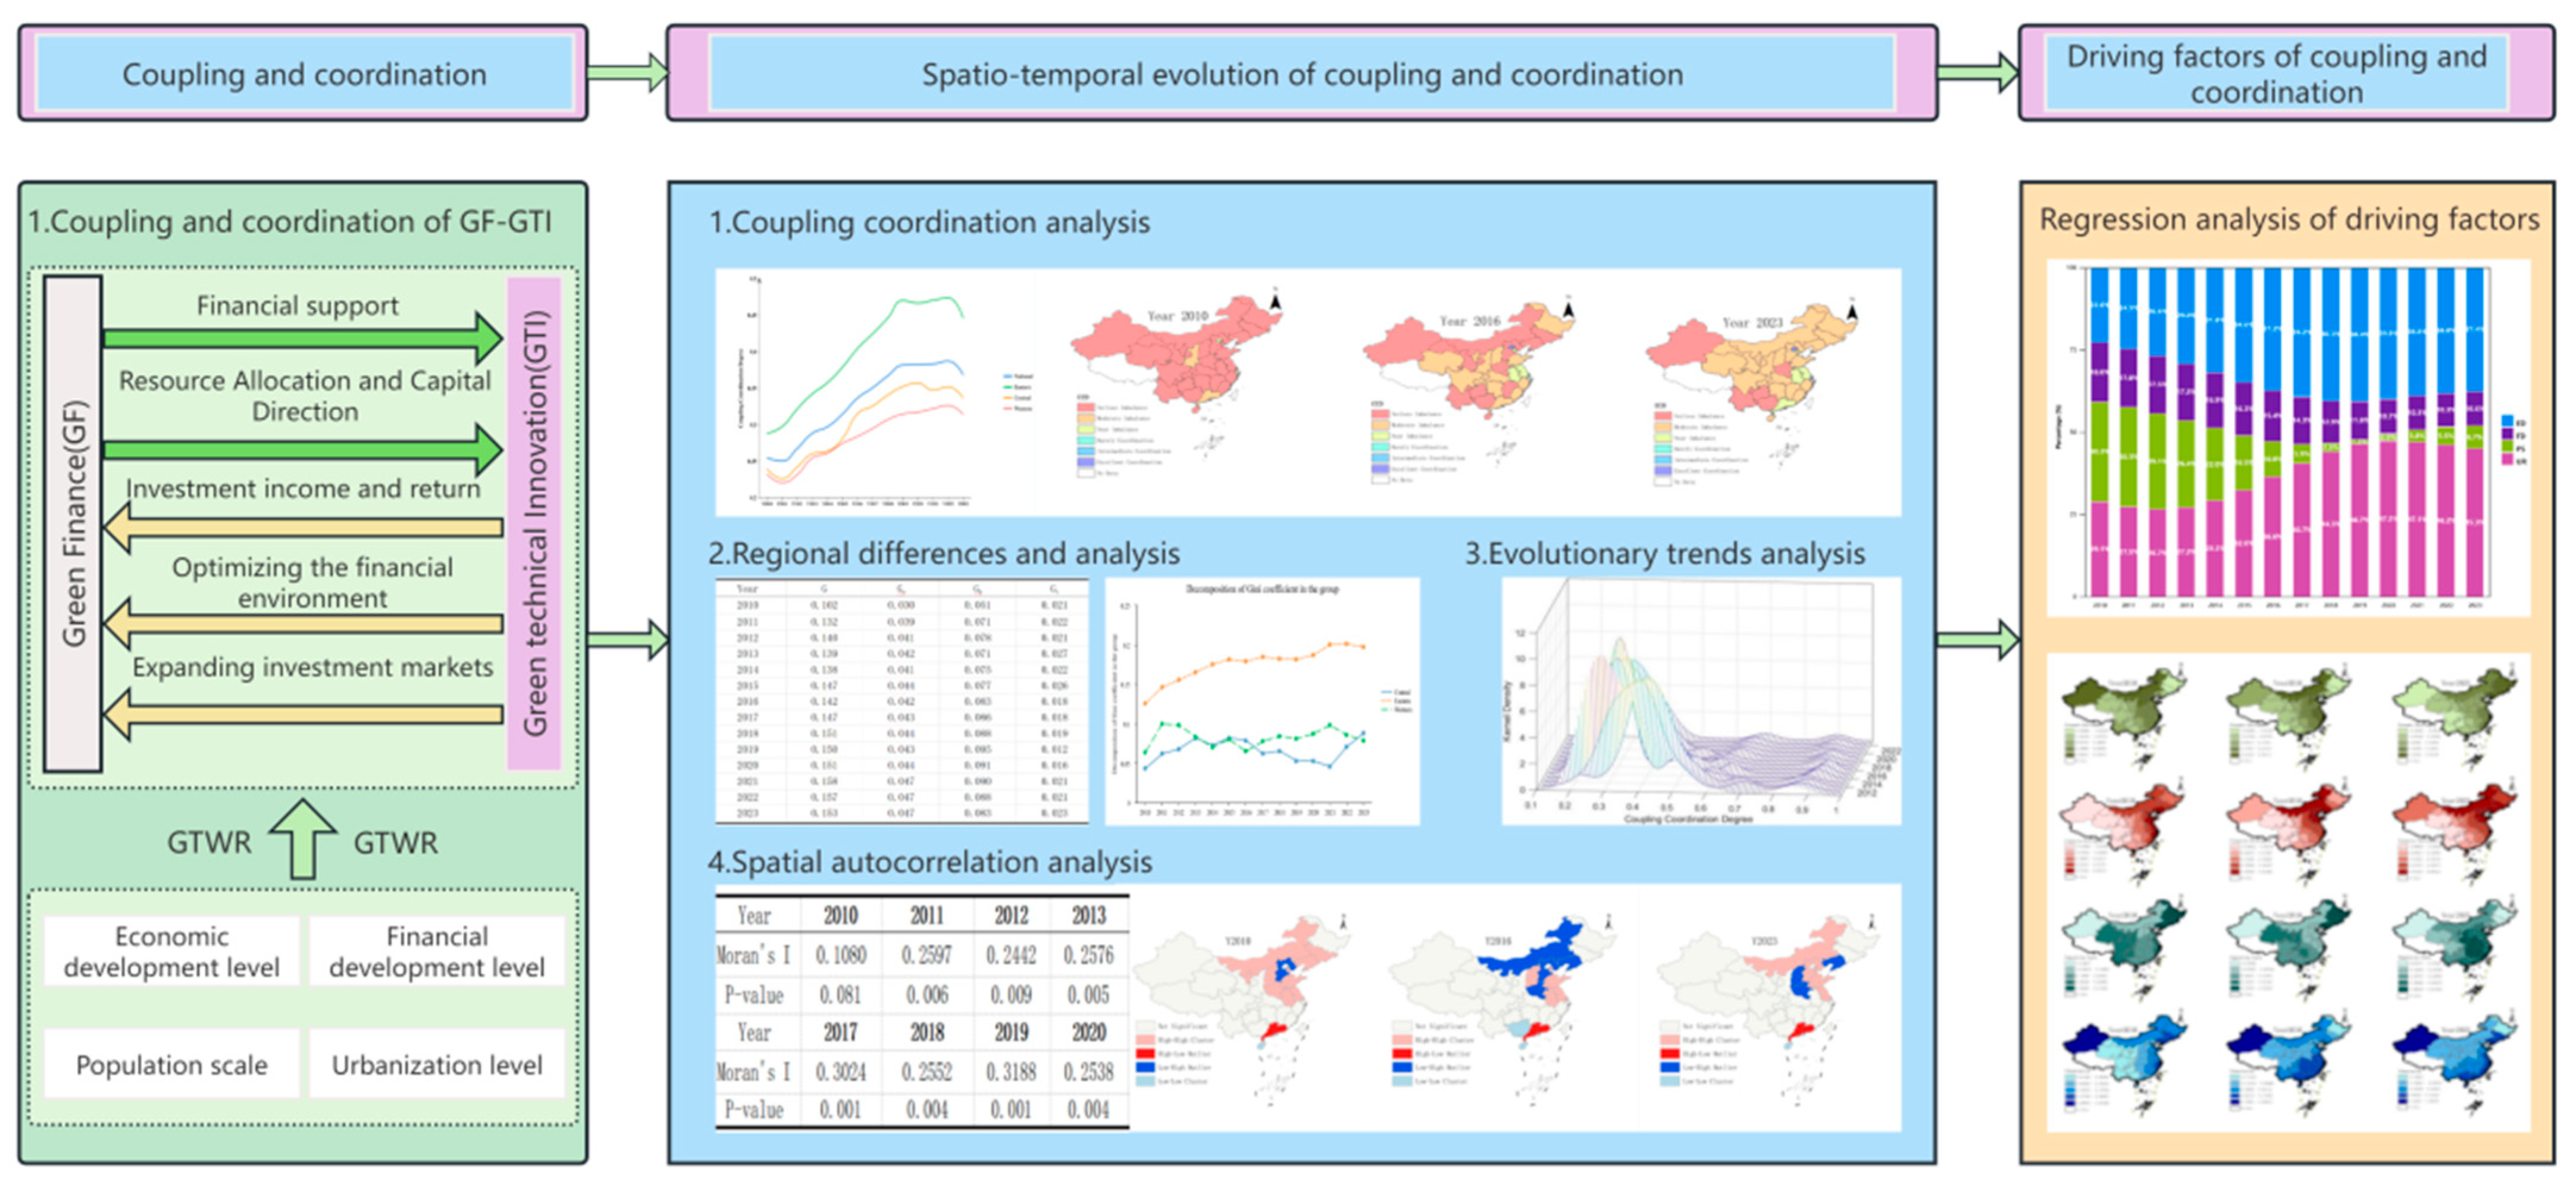
Figure 1.
Analysis of coupling mechanism and driving factors of GF and GTI.
3. Data Sources and Research Methods
3.1. Data Sources and Construction of Index System
3.1.1. Data Sources
In 2008, GF had already achieved initial development in China, and statistical data on GTI was also gradually improved. After the release of Green Credit Guidelines in 2012, data on GF became increasingly comprehensive. Considering this situation, and combining the availability and continuity of data, this study takes 30 provinces (excluding Tibet, Hong Kong, Macau and Taiwan) across China from 2010 to 2023 as the research sample.
The original sample data are sourced from the China Statistical Yearbook, China Science and Technology Statistical Yearbook, statistical yearbooks and bulletins of various provinces, China Insurance Yearbook, official websites of local governments, and the National Bureau of Statistics website, among others. In addition, data related to the calculation of GTI, ED, FD, PS, and UR are derived from the CNRDS Database, China Environmental Statistical Yearbook, and Wind Database. Some missing data were supplemented using the linear interpolation method.
3.1.2. Construction of the Evaluation Index System
The research on green finance in Chinese academic circles has a relatively short history. Some scholars use single indicators to measure, such as green credit, green insurance [50,51]. As China's green finance policies continue to evolve, GF has achieved considerable development in China. A wide variety of green financial instruments have emerged, and their scale has gradually expanded. Thus, the use of a single indicator can no longer meet the requirements for evaluating China’s green finance.
Considering the availability of data, the scientific nature of index selection, and based on the status of green finance in China, this study refers to the design of the green finance evaluation index system by Hua et al. [9,52], and constructs an evaluation system from four dimensions. These four dimensions include six secondary indicators, forming a relatively comprehensive and objective green finance evaluation system.
Green technology innovation mainly refers to the R&D and application of enterprises in the fields of environmental protection, low-carbon, new energy, and other related areas. Specifically, the number of green invention patents is an important indicator for measuring enterprises’ GTI, and refers to granted invention patents with technical and innovative attributes in the green field. This indicator covers six major technical fields, namely energy conservation and environmental protection, pollution prevention and control, environmental materials, ecological restoration, resource recycling, and clean energy. Compared with the indicator of patent applications, it more accurately reflects the market value of technological innovation and its emission reduction potential. Therefore, the number of green invention patents can more effectively capture enterprises’ R&D capabilities and application-transformation efficiency in GTI.
Referring to Wang et al. [15,53], the number of green patent grants per 10,000 persons in a given year can be used to represent GTI and indicate the situation of GTI in a region.
The selection of specific indicators is shown in Table 1.
3.2. Research Methods
3.2.1. Entropy-Weighted TOPSIS Method
This study adopts the Entropy-Weighted TOPSIS method to evaluate the development level of green finance [15,42,54]. This method combines the advantages of Entropy Weighted method and TOPSIS method, enabling the measurement results to be more objective and reasonable. The specific calculation steps are as follows:
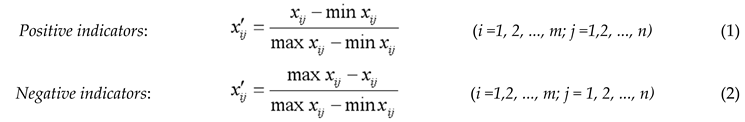
Step 1: Data Standardization. The min-max normalization method is used to normalize the green finance evaluation indicators.
Next, calculate the proportion of each indicator.

Step 3: Calculate the entropy value of the j-th indicator.

The constant k is related to the number of samples m.
Step 4: Calculate the coefficient of variation dj and weight wj of the j-th indicator.

Step 5: Calculate the weighted matrix Cij.

Step 6: Determine the positive and negative ideal solution.

Step 7: Calculate the Euclidean distances.

Step 8: Calculate the relative closeness degree fi (comprehensive score level) for each evaluation object.

3.2.2. Coupling Coordination Degree Model
This study establishes a CCD model to measure the coupling coordination of the GF and GTI. The formulas, referenced from Li et al. [55], are shown in formulas (12) to (14):

In the formulas, U1 represents green finance, U2 represents green technology innovation, C denotes the coupling degree of the two systems, T is the comprehensive development index. Based on the view of Shao et al. [15,56], this study holds that GF and GTI are equally important, so the weights are set as α = β = 0.5; D stands for the CCD. Drawing on existing research findings, the levels of CCD are classified [57], as shown in Table 2.
3.2.3. Dagum Gini Coefficient
Gini Coefficient is a key method for measuring disparities in economic development. Drawing on existing studies, this study adopts the Gini Coefficient proposed by Dagum and its decomposition method to measure the spatial disparities of the CCD as well as their sources.

In formula (15), k denotes the number of regions. gfji and gfhr represent the CCD of any province in the j-th (h-th) region; n stands for the number of provinces; and μ is the average CCD of the 30 provinces across the three major regions.
In formula (16), Gw is the contribution of intra-regional disparity, which describes the source of intra-regional disparity; Gb is the contribution of inter-regional disparity, representing the source of inter-regional disparity; and Gt is the contribution of transvariation density, which measures the cross-overlapping effect of samples among regions. These three components together constitute the Gini coefficient G. The Dagum Gini coefficient further decomposes the overall disparity G into intra-regional disparity (Gw), inter-regional disparity (Gb), and transvariation density (Gt). This approach not only enables the examination of the impact of different subgroups on the overall disparity but also effectively overcomes the problem of cross-overlapping among the measured samples.
3.2.4. Kernel Density Estimation
This method intuitively reflects the overall spatial agglomeration effect by measuring the density of spatial elements within their surrounding areas. Assume that n spatial samples are independent and identically distributed samples drawn from a population with a probability density function f [58]. The calculation formula is shown in formula (17).

In the formula, fn(x) denotes the kernel density value at a point x; k() represents the kernel function; h stands for the bandwidth; and x−xi is the distance from the estimated point x to the sample point xi.
3.2.5. Spatial Autocorrelation Model
Drawing on Du et al. [59], in statistics, spatial autocorrelation is usually measured using the Global Moran's I index. Given a set of elements and sample data, the Global Moran's I index describes the average degree of correlation between all spatial units and their surrounding areas in the entire region, which is used to determine whether the samples follow a clustered, dispersed, or random pattern. Its calculation formula is as follows.

Herein, ωij is the spatial weight between element i and element j. If the sample points are spatially adjacent, then ωij=1; otherwise, ωij=0. S2 represents the sample variance.
3.2.6. Spatio-Temporal Geographically Weighted Regression (GTWR)
Considering the spatial and temporal non-stationarity, this study adopts the GTWR model [60] to more effectively reveal the influencing factors of the CCD between GF and GTI. The mathematical expression is shown in formula (20).

In the formula, yi and xi represent the observed values of the dependent variable y and independent variable x at the point (ui, vi, ti), where (ui, vi, ti) denotes the three-dimensional coordinates of the i-th sample point. The regression coefficient βj(ui, vi, ti) is a function of the geographic coordinates (u, v, t) (with i=1,2, ..., n); and εi is the random error of the i-th sample point, which follows a normal distribution with a mean of 0 and a variance of σ2.
For the spatio-temporal geographically weighted model, the weighted least squares estimation is still adopted as its estimation method, and it is shown in formula (21).

In the formula, wik denotes the spatial weight function matrix based on the geographical distance between the i-th regression point and the k-th sample point.
Based on the above research, this study constructs a spatio-temporal geographically weighted regression model for the CCD between GF and GTI, as shown in formula (22).
The explanation of indicators and symbols are shown in Table 3.

4. Results and Discussions
4.1. The Coupling Coordination Degree Between GF and GTI
Figure 2 shows that the CCD between GF and GTI ranges from 0.25 to 0.39, and is generally in the stage of moderate imbalance. China’s current level of CCD between GF and GTI is not high [15,31]. Inter-regional differences are also relatively obvious; some regions are relatively backward in development level and have failed to achieve the coordinated development.
From a temporal perspective, the CCD between GF and GTI was in a stage of fluctuating changes from 2010 to 2012. This is because national policies on green finance had not yet been introduced, the green finance development system was incomplete, and at the same time, enterprises had a weak awareness of GTI. All of them became the main bottleneck restricting the improvement of the coordination degree [14].
From 2013 to 2020, it entered a stage of rapid growth. The reason lies in the issuance of the Green Credit Guidelines in 2012 and the gradual improvement of green finance data. As the national green development strategy advanced in depth and the green finance policy was established, it entered a channel of rapid improvement [42]. The two systems began to show positive interaction; however, in some regions, the development speed of GF was relatively lagging behind the practice of GTI, which still restricted the synergistic improvement.
After 2020, the growth rate of the CCD slowed down and even declined slightly. Affected by the COVID-19 pandemic,some green projects was hindered, the rhythm of green finance capital investment was disrupted, and green technology innovation activities were also suppressed by factors such as restrictions on personnel mobility and interruptions in the supply chain of key technology products. These factors, in turn, hindered the coordinated development process to a certain extent.
From a spatial perspective, the CCD between GF and GTI presents a distinct spatial distribution pattern. It is higher levels and faster development in the east, while lower levels and slower development in the west. Specifically, the CCD in eastern regions is significantly higher than the other two regions, and is entering the stage of basic coordination. Eastern regions boast a more developed economy and obvious advantages in resource endowments such as geographical location, capital, and technology. Its GTI score is higher than the other two regions. In turn, GF holds advantages in industries and capital, forming a sound interactive cycle with GTI—thus resulting in a relatively high degree, which has increased from 0.29 to 0.47.
In recent years, the central region has achieved steady economic growth, with various economic indicators gradually improving. However, in the key field of GTI, there remains a notable gap between the central region and eastern China. Such gaps are reflected not only in the quantity and quality of innovative achievements and the R&D investment in green technologies, but also in the promotion, application, and industrialization process of green technologies. Meanwhile, due to the lag in GTI, the central region also faces corresponding constraints in the development of GF: the scale and maturity of its green finance market are both inferior to those of eastern China. This prevents the CCD between GTI and GF in the central region from reaching the desired high level; instead, it remains at a medium level. Therefore, the central region is in urgent need of further resource input and policy support to narrow the gap with eastern region and elevate the regional green economy’s overall development level [31,48].
Due to geographical constraints and economic limitations, the western region faces numerous challenges in the R&D, promotion, and application of green technologies, making it difficult to form a robust technological innovation system. Financial institutions have a weak willingness to invest in green projects. Moreover, green financial products and services are relatively scarce. This creates obstacles to effectively meeting GTI's capital needs. This leads to poor interaction between GF and GTI, and a failure to form a sound synergistic effect between the two. Consequently, among the three regions, western region has the relatively lowest CCD between GF and GTI.
As shown in Figure 3, the CCD of the most provinces of China fell into the category of serious imbalance in 2010, while only a few provinces were at the levels of moderate imbalance and near imbalance. This is because the green finance system was still underdeveloped at that time, with limited financial support for GTI, and many innovation projects struggled to advance due to insufficient funds. Meanwhile, the market demand for GTI had not been fully stimulated, and enterprises lacked enthusiasm for conducting green technology R&D, resulting in a low output of GTI achievements. Additionally, policy guidance and incentive measures were insufficient, failing to effectively promote the in-depth integration and coordinated development between GF and GTI.
By 2016, the overall CCD had improved: most provinces had moved up to the moderate imbalance level, Jiangsu Province and Anhui Province reached the near imbalance level, and Shanghai Municipality and Beijing Municipality took the lead in entering the excellent coordination level. This indicates that their GF systems and GTI systems had formed an efficient synergy mechanism. The reason lies in the gradual improvement of the green finance system during this period: the government increased support for green finance, introduced a series of incentive policies, and financial institutions also responded actively by providing more financial support for GTI projects, effectively promoting the in-depth integration and coordinated development. Guided by the normative framework of green finance policies, financial institutions in Shanghai Municipality, Beijing Municipality, Jiangsu Province, and Anhui Province continued to innovate green financial products and services. Simultaneously, these regions also established a sound green technology evaluation system, providing a basis for financial institutions to accurately identify and assess GTI projects. This further reduced the investment risks of financial institutions and enhanced their enthusiasm for participating in GTI.
In 2023, the coupling coordination level improved further, with the number of provinces at the serious imbalance level reduced to 5, and Guangdong Province also advancing to the near imbalance level. This is attributed to the more mature development of green finance during this period: society's awareness of and demand for green development increased significantly, and the market demand for green technology products became increasingly strong. This greatly stimulated enterprises' enthusiasm for conducting green technology R&D and innovation, leading to a continuous emergence of GTI achievements, which further promoted the positive interaction and coordinated progress between GF and GTI. During this period, with strong support from local green finance policies, numerous enterprises in Guangdong Province had sufficient capital to increase investment in the green technology field and carry out a series of forward-looking and innovative R&D projects. Meanwhile, Guangdong's sound industrial supporting system and abundant talent resources also created highly favorable conditions for GTI, thereby achieving rapid momentum in the coordinated development of the two systems.
4.2. Regional Differences in the Degree of the Coupling Coordination
4.2.1. Analysis of Regional Differences
As shown in Table 4, the Gini coefficient of the CCD shows a slow upward trend, indicating that the degree of imbalance in the CCD has increased yearly. In terms of values, the Gini coefficients of China’s three major economic zones show an obvious characteristic of "Eastern Region > Western Region > Central Region". In terms of change trends, the change trends of the Gini coefficients of the coupling degree in China’s three major economic zones vary from each other: the eastern Region shows a steady upward trend yearly, while the central and western regions show a fluctuating upward trend.
Figure 4 shows the changes in the contribution rates of Gw, Gb and Gt to the total Gini coefficient G. Since 2010, the inter-regional gap in the CCD between GF and GTI has been in a dominant position, with its contribution rate to the total gap ranging from 50% to 60%. It is followed by the intra-regional gap, whose contribution rate is around 30%. The smallest contributor is transvariation density (Gt), accounting for approximately 10%~20% of the total gap—this indicates that the cross-overlapping effect of the CCD has a relatively small impact on the overall spatial disparity. The three major contributing factors show a relatively stable trend, which suggests that in the coming period, the overall disparity will still be dominated by inter-regional gaps [22]. Therefore, how to narrow the inter-regional development imbalance is an important direction for the spatial governance of the coordinated development of the coupling between GF and GTI.
4.2.2. Analysis of Inter-Regional Differences
As shown in Table 5, the inter-regional differences among the three groups (Eastern-Central, Eastern-Western, and Central-Western) all show an expanding trend, which has driven the overall increase in regional imbalance in the coordinated development of the coupling.
Among these groups, the inter-group difference between the eastern and western regions has the largest variation range, reaching 60.15%. The rapid widening of this gap has severely undermined the equilibrium of national coordinated development. It also reflects substantial and growing disparities among different regions in terms of policy implementation, market conditions, and resource allocation
4.3. The Evolutionary Trends of Coupling Coordination
Figure 5 illustrates the dynamic distribution evolution of the CCD between GF and GTI. From the peak of the distribution curve: the main peak of the CCD distribution curve narrows in width and increases in height, which indicates that the spatial disparity in the CCD shows an expanding trend. Additionally, the distance between the two peaks gradually widens—this is because the gap gradually expands. The side peak of the CCD distribution curve shifts to the left in position with little change in height. This suggests that in the process of the improvement of the CCD, the CCD of a small number of provinces has not improved, thus widening the gap with the average level.
4.4. Spatial Correlation Analysis
According to the First Law of Geography, the CCD may exhibit spatial correlation among adjacent regions. This study employs the spatial autocorrelation model and the high/low clustering model, taking the CCD as the measurement indicator, and uses ArcGIS software to conduct a spatial correlation analysis on it.
Table 6 presents the Moran's I index and its corresponding p-value from 2010 to 2023. In most years (2011–2022), the Moran's I index is significantly positive at the 5% significance level under the spatial weight matrix. This result indicates there is a significant positive spatial correlation in the CCD. The spatial correlation reached its peak in 2016 (I = 0.3256) and showed a fluctuating downward trend thereafter. A possible reason for this is the intensive introduction of policies related to GF and GTI in China. In particular, in 2016, China issued the Guiding Opinions on Establishing a Green Finance System, which clearly defined the definition and classification of green finance and proposed several specific measures to drive the growth of green finance [11].
Figure 6 illustrates the high/low clustering distribution of the CCD between GF and GTI. The High-Low Outlier indicates that the attribute value of the research variable is relatively high, but the region is surrounded by areas with lower attribute values, showing a negative spatial correlation with the surrounding areas; the meanings of other clustering results are similar.
Through comparison, it can be found that the High-High Cluster is mainly concentrated in northern China. Adjacent provinces exhibit "neighboring imitation" in policy interpretation and the promotion of pilot experience. For example, the Beijing-Tianjin-Hebei region jointly established a green technology trading market [28]. These practices led to the simultaneous improvement of the CCD of adjacent provinces in these regions, forming a High-High Cluster, which ultimately manifests as a significant positive spatial correlation.
In addition, the spatial agglomeration characteristics of various provinces underwent significant changes in 2016. This may be attributed to the fact that Chinese government promulgated the Guiding Opinions on Establishing Green Finance System, while provinces differed in the pace and intensity of policy implementation.
In general, the impact of each driving factor is not static, but exhibits significant spatio-temporal heterogeneity. Policy formulation should abandon the "one-size-fits-all" paradigm and implement regionally differentiated, targeted strategies to promote coordinated regional development.
4.5. Analysis of Driving Factors
4.5.1. Model Selection and Validation
To verify the rationality of the model, first, the data on the CCD between GF and GTI were standardized. Then, a multicollinearity test was conducted on each explanatory variable. The results show that the tolerance of each variable is greater than 0.1, and the VIF value is less than 1.680, indicating no multicollinearity. Thus, the next step of model construction can be carried out.
Second, ordinary least squares (OLS) regression was performed on the driving factors. The results show that the OLS regression coefficients of all driving factors are significant at the 5% significance level, which indicates that economic development level, financial development level, population scale, and urbanization all have a significant positive impact on the CCD. Therefore, the selection of these four factors is meaningful.
Third, the GTWR plugin in ArcGIS 10.8 software was used to conduct OLS, GWR and GTWR analyses respectively. As shown in Table 7, GTWR regression results have a larger R², smaller Residual Sum of Squares (RSS), and smaller corrected AICc. It exhibits the highest goodness of fit and the most obvious spatial heterogeneity, outperforming the OLS model and GWR model. Therefore, this study selects the GTWR model to analyze the coupling development between GF and GTI in China’s provincial-level regions and its influencing factors.
4.5.2. Analysis of Driving Factors
The economic development level (ED) is positively correlated with the CCD, as shown in Figure 7, but it exhibits complex non-linearity and spatio-temporal heterogeneity. Economically developed eastern provinces have provided market demand and financial support for GTI through industrial structure upgrading and high-tech industry agglomeration. In contrast, economically underdeveloped western provinces are constrained by the low level of green finance development and the small scale of the financial market, resulting in a weak driving effect on GTI, and even a negative regulatory effect in some local areas.
The financial development level (FD) has a significant positive impact on the CCD, with its regression coefficient being significant in most provinces and years, showing an obvious pattern of " higher levels and faster development in the east, while lower levels and slower development in the west". This fully indicates that in eastern coastal areas, the abundance and allocation efficiency of financial resources directly determine the capital support for GTI R&D and transformation [28], effectively promoting the R&D and industrialization of green technologies. However, in some central and western regions, the marginal contribution of financial development level is relatively low, which may be related to the uneven distribution of financial resources and insufficient coverage of green financial products.
The impact of population scale (PS) on the CCD presents a complex and changeable spatial pattern. Regions such as Heilongjiang, Jilin, and Liaoning, which initially had high impact coefficients, have gradually evolved to a low level. This may be due to the economic recession, population outflow, or aging in the Northeast China in recent years. The population scale has a significant positive effect on the CCD in central China, with the highest effect in provinces such as Sichuan, Hubei, Hunan, and Jiangxi. This may be because China is promoting the transfer of coastal industries, and the resource potential and labor cost advantages of central China have begun to emerge. Therefore, when promoting green transformation, population factors must be incorporated into comprehensive considerations, and the potential pressure brought by population scale should be offset by improving resource utilization efficiency and advocating green lifestyles.
The impact of urbanization level (UR) on the CCD shows an obvious pattern of "higher in the east and lower in the west". Highly urbanized regions (e.g., Beijing, Tianjin, Shanghai) have promoted the in-depth integration of green technologies and urban construction through improved infrastructure, agglomeration of innovative resources, and policy pilot advantages, but their promoting effect tends to stabilize. In contrast, the urbanization process in western regions is still dominated by scale expansion, with insufficient capacity for green technology integration and application, leading to a weak driving effect. The Xinjiang Uygur Autonomous Region shows strong particularities, which may be due to its large geographical area and single economic and industrial structure, but this does not affect the analysis results.
Figure 8 shows the average GTWR regression coefficients of each driving factor. The impact of economic development level and urbanization on the CCD between GF and GTI has been on an upward trend in each year. This indicates that by expanding the market scale and promoting population agglomeration, the diffusion of technology and industrial synergy have been accelerated, which provides stable financial support and demand-driven impetus for GTI, thus continuously strengthening the coupling coordination effect.
However, the impact of financial development level and population scale on the CCD between GF and GTI has shown a downward trend in each year. A possible reason lies in the dual effects of financial market saturation and policy adjustments. As the financial market gradually matures, the marginal contribution of green financial instruments decreases; in addition, tighter regulation in some regions has restrained innovation vitality. The negative impact of population scale, on the other hand, may be related to uneven resource allocation during the urbanization process, which weakens the scale effect. Concurrently, the environmental pressure caused by rapid urbanization has offset the positive contribution of the demographic dividend.
In general, the impact of each driving factor on the CCD between GF and GTI is not static, but exhibits significant spatio-temporal heterogeneity. Policy formulation should implement differentiated and targeted regional coordination strategies.
5. Conclusions and Recommendations
5.1. Conclusions
First, the overall level of the CCD between GF and GTI is not high, but it shows a rapid upward trend, having gradually developed from the stage of moderate imbalance to near imbalance. From a spatial perspective, significant regional and provincial heterogeneity still exists: the CCD of the eastern region is significantly higher than the other regions, and is entering the stage of barely coordination. Such as Beijing and Shanghai, the developed regions have achieved a leap from moderate imbalance to excellent coordination; however, most provinces are still in the state of moderate imbalance. This reflects the imbalance in the green transformation process among regions, indicating that the in-depth integration of the two systems nationwide still faces constraints in multiple aspects, such as institutional mechanisms, capital investment, and technology transformation.
Second, spatial correlation analysis indicates a significant positive spatial correlation, and this correlation presents an upward trend. The High-High Cluster areas of CCD are mainly concentrated in northern areas such as the BTH region (Beijing-Tianjin-Hebei), while most areas of High-Low Outlier are distributed in central China.
Third, the coupling coordination is affected by the economic development level (ED), financial development level (FD), population scale (PS), and urbanization level (UR). Specifically, the economic development level, financial development level, and urbanization level have a greater impact on the eastern region; population scale has a greater impact on the central region; and all driving factors have limited impact on the western region, and even exert a negative impact in some cases.
5.2. Recommendations
To achieve the coordinated development, and implement the strategies of ecological priority, intensive and economic development, this study puts forward the following recommendations:
First, strengthen the driving effect between GF and GTI. GF is a bottleneck restricting the development of GTI. The Chinese government should enhance policy guidance, increase investment in green R&D and green industry projects, innovate green financial services and products, and provide low-cost and diversified financial support for GTI. At the same time, a connection platform between GF and GTI should be established to promote the effective matching of financial resources with technological innovation, improve the efficiency of capital use, accelerate the application of green technology achievements.
Second, promote the coordinated development across regions. Given the imbalance in the green transformation process among China's regions, cross-regional green development coordination platforms should be established to optimize inter-regional coordination systems and strengthen cooperation and exchanges between eastern region and the others. Eastern region should leverage its technological and capital advantages to accelerate industrial relocation and technology exports. The central and western regions, in turn, should proactively undertake industrial transfers, strengthen self-capacity building, and improve their green development level. In particular, the state should increase policy inclination and resource input, improve their infrastructure and investment environment, and attract more green financial resources and technological innovation factors to agglomerate in these regions.
Third, adapt measures to local conditions and give play to the driving role of economic development level, financial development, population scale, and urbanization level in the coupling coordination. Targeting the differences in economic development level, financial development, population scale, and urbanization level across different regions, differentiated policy measures should be formulated. For developed regions, while optimizing the financial structure and stimulating new green drivers of growth, emphasis should be placed on improving the allocation efficiency of financial resources to avoid over-investment and resource waste. For developing regions, in the process of expanding economic scale and deepening financial development, efforts should be made to strengthen ecological and environmental protection, promote the coordinated progress of urbanization and green development. Meanwhile, there is a need to strengthen monitoring and regulation of population scale and urbanization level, so as to avoid adverse impacts on the coupling coordination of GF and GTI caused by excessive population agglomeration and unordered urbanization.
Author Contributions
Conceptualization, M.C. and H.L.; methodology, M.C. and H.L.; validation, M.C., H.L. and R.P; formal analysis, M.C.; investigation, M.C.; data curation, R.P.; writing—original draft preparation, M.C.; writing—review and editing, H.L.; project administration, M.C. All authors have read and agreed to the published version of the manuscript.”
Funding
This work was supported by the research grant of Pai Chai University in 2024. (2024A0165)
Data Availability Statement
The data that support the findings of this study are available in National Bureau of Statistics of China at https://www.stats.gov.cn/english/ [accessed in February 2025].
Conflicts of Interest
The authors declare no conflicts of interest.
Abbreviations
The following abbreviations are used in this manuscript:
| GF | Green Finance |
| GTI | Green Technology Innovation |
| GTWR | Geographically and Temporally Weighted Regression |
| CCD | Coupling Coordination Degree |
References
- Pudryk, D.; Kwilinski, A.; Lyulyov, O.; Pimonenko, T. Towards achieving sustainable development: Interactions between migration and education. Forum Sci. Oecon. 2023, 11, 113–132. [Google Scholar] [CrossRef]
- Chen, Y.; Lyulyov, O.; Pimonenko, T.; Kwilinski, A. Green development of the country: The role of macroeconomic stability. Energy Environ. 2023, 35, 2273–2295. [Google Scholar] [CrossRef]
- Dzwigol, H.; Kwilinski, A.; Lyulyov, O.; Pimonenko, T. The role of environmental regulations, renewable energy, and energy efficiency in finding the path to green economic growth. Energies 2023, 16, 3090. [Google Scholar] [CrossRef]
- Chin, M.Y.; Ong, S.L.; Ooi, D.B.Y.; et al. The impact of green finance on environmental degradation in BRI region. Environ. Dev. Sustain. 2024, 26, 303–318. [Google Scholar] [CrossRef]
- Guidance on building a green financial system. Available online: https://www.mee.gov.cn/gkml/hbb/gwy/201611/t20161124_36 8163.htm (accessed on 10 May 2025).
- Wei, H.; Li, Y.H. Research on the relationship between economic growth and environmental quality from the perspective of green finance. Shandong Soc. Sci. 2023, 131–140. [Google Scholar]
- Wang, Y. Research on green credit policy promoting green innovation. Manag. World 2021, 37, 173–188. [Google Scholar]
- Meng, Y. Green financial policy and green technology innovation: Evidence from green financial reform and innovation pilot zones. Fujian Trib. 2021, 126–138. [Google Scholar]
- Hu, J.; Zhang, X.E. The impact of green finance development on green technology innovation of industrial enterprises: Empirical evidence from listed companies. Sci. Technol. Manag. Res. 2025, 45, 185–196. [Google Scholar]
- Li, X.; Deng, J. How green finance drives the synergy of pollution reduction and carbon mitigation: Evidence from Chinese A-share firms. Sustainability 2025, 17, 8185. [Google Scholar] [CrossRef]
- Song, Y.; Gao, W.; Lee, C.C. Does China’s Green Credit Interest Subsidies Policy Promote Enterprises’ Green Technology Innovation Quality? Based on the Perspective of Financial and Fiscal Coordination. J. Environ. Manage. 2025, 390, 126366. [Google Scholar] [CrossRef] [PubMed]
- Zhao, Y.; Zhao, N.; Lyu, R. The Dynamic Coupling and Spatio-Temporal Differentiation of Green Finance and Industrial Green Transformation: Evidence from China Regions. Heliyon 2023, 9, e22726. [Google Scholar] [CrossRef]
- Wang, B.J.; Cui, L.Y.; Wang, Z.L.; et al. Research on the impact of green finance pilot policy on technological innovation of new energy enterprises. J. Nanjing Univ. Financ. Econ. 2024, 67–77. [Google Scholar] [CrossRef]
- Lu, S.B. Research on the impact of green finance on enterprise technological innovation efficiency: Resource allocation and innovation incentive. Ecol. Civiliz. Res. 2025, 90–106. [Google Scholar]
- Liu, K.; Wang, Z.P.; Du, R.; et al. Measurement of coupling coordination development level of green finance and digital technology, spatio-temporal evolution and pollution reduction effect. Inq. Econ. Issues 2024, 113–129. [Google Scholar]
- Cui, Y.J.; Li, X.L.; Liu, Y.; et al. Research on the coupling coordination characteristics and influencing factors of green finance development and green low-carbon transformation: A case study of Hunan Province. Prog. Geogr. 2025, 44, 144–156. [Google Scholar]
- Chen, J.; Luo, Y.; Fang, J. Spatial-temporal evolution and driving factors of the synergistic development of green finance and low-carbon innovation. Sustainability 2025, 17, 8222. [Google Scholar] [CrossRef]
- Shen, L.; Zhang, H.Y. Research on the spatio-temporal pattern evolution and convergence of the coupling coordination between green finance and high-quality economic development in China. Chin. J. Manag. Sci. 2025, 33, 50–60. [Google Scholar] [CrossRef]
- White, M.A. Environmental finance: Value and risk in an age of ecology. Bus. Strategy Environ. 1996, 5, 198–206. [Google Scholar] [CrossRef]
- Linnenluecke, M.K.; Smith, T.; McKnight, B. Environmental finance: A research agenda for interdisciplinary finance research. Econ. Model. 2016, 59, 124–130. [Google Scholar] [CrossRef]
- Green Finance Study Group. G20 green finance synthesis report. G20 Hangzhou Summit. Hangzhou, China, September 2016.
- Wang, Z.; Teng, Y.-P.; Wu, S.; Chen, H. Does Green Finance Expand China’s Green Development Space? Evidence from the Ecological Environment Improvement Perspective. Systems 2023, 11, 369. [Google Scholar] [CrossRef]
- Yan, Z.; Zhong, W.; Yan, S. Unlocking Green Growth: How Digital Finance Fosters Urban Sustainability via Innovation and Policy Synergy. Sustainability 2025, 17, 9163. [Google Scholar] [CrossRef]
- Jia, J.; He, X.; Zhu, T.; et al. Does green finance reform promote corporate green innovation? Evidence from China. Pac.-Basin Financ. J. 2023, 82, 102165. [Google Scholar] [CrossRef]
- Wang, X.H.; Liu, J.H.; Zhao, Y.X. Effectiveness measurement of green finance reform and innovation pilot zone. J. Quant. Tech. Econ. 2021, 38, 107–127. [Google Scholar]
- Ji, X.L.; Li, W.T. Does green finance affect the fulfillment of social responsibility of heavily polluting enterprises? Yuejiang Acad. J. 2023, 112–122. [Google Scholar]
- Zhang, Q.; Wang, Y.; Chen, Q. Green Bond Issuance and the Spillover Effect of Green Technology Innovation from the Perspective of Market Attention: Evidence from China. Systems 2024, 12, 399. [Google Scholar] [CrossRef]
- Lu, J.; Yan, Y.; Wang, T.X. Research on the micro effects of green credit policy: From the perspective of technological innovation and resource reallocation. China Ind. Econ. 2021. [Google Scholar]
- Mi, K.; Cui, Z.; Zhu, X.; Zhuang, R. Can Green Credit Improve the Innovation of Enterprise Green Technology: Evidence from 271 Cities in China. Systems 2024, 12, 63. [Google Scholar] [CrossRef]
- Shen, Y.; Zhang, X. Intelligent manufacturing, green technological innovation and environmental pollution. J. Innov. Knowl. 2023, 8. [Google Scholar] [CrossRef]
- Sun, C.; Wang, Z.; Liu, J.Q. Research on the coupling between green technology innovation and green finance system development. Financ. Theory Pract. 2021, 22–33. [Google Scholar]
- Li, Z.; Liao, G.; Wang, Z.; et al. Green loan and subsidy for promoting clean production innovation. J. Clean. Prod. 2018, 187, 421–431. [Google Scholar] [CrossRef]
- Jiakui, C.; Abbas, J.; Najam, H.; et al. Green technological innovation, green finance, and financial development and their role in green total factor productivity: Empirical insights from China. J. Clean. Prod. 2023, 382, 135131. [Google Scholar] [CrossRef]
- Li, R.; Liu, L.Q. Green finance and corporate green innovation. Wuhan Univ. J. 2021, 126–140. [Google Scholar] [CrossRef]
- Ma, Y.; Mahmood, R.; Nassir, A.M.; Zhang, L. Digital Finance and Green Technology Innovation: A Dual-Layer Analysis of Financing and Governance Mechanisms in China. Sustainability 2025, 17, 8982. [Google Scholar] [CrossRef]
- Bai, R.; Lin, B. Nexus between green finance development and green technological innovation: A potential way to achieve the renewable energy transition. Renew. Energy 2023, 218, 119295. [Google Scholar] [CrossRef]
- Yin, Z.B.; Sun, X.Q.; Xing, M.Y. Research on the impact of green finance development on green total factor productivity. Stat. Decis. 2021, 139–144. [Google Scholar]
- Huang, Y.; Chen, C.; Lei, L.; et al. Impacts of green finance on green innovation: A spatial and nonlinear perspective. J. Clean. Prod. 2022, 365, 132548. [Google Scholar] [CrossRef]
- Han, K.Z. Research on the relationship between green finance development and green technology innovation efficiency: An empirical analysis based on spatial spillover perspective. Price Theory Pract. 2020, 144–147, 178. [Google Scholar]
- Zhu, X.D.; Huang, Y.Y.; Zhu, S.J.; Huang, H.F. The impact of green finance on technological innovation of polluting industries and its spatial differences in China. Sci. Geogr. Sin. 2021, 41, 777–787. [Google Scholar]
- Zhao, N. Does green credit promote regional green technology innovation? Based on regional green patent data. On Econ. Probl. 2021, 33–39. [Google Scholar]
- Zhao, K.; Wu, C.; Liu, J.; Liu, Y. Green Finance, Green Technology Innovation and the Upgrading of China’s Industrial Structure: A Study from the Perspective of Heterogeneous Environmental Regulation. Sustainability 2024, 16, 4330. [Google Scholar] [CrossRef]
- Cheng, X.; Yao, D.; Qian, Y.; et al. How does Fintech influence carbon emissions: Evidence from China's prefecture-level cities. Int. Rev. Financ. Anal. 2023, 87, 102655. [Google Scholar] [CrossRef]
- Xu, A.; Zhu, Y.; Wang, W. Micro green technology innovation effects of green finance pilot policy: From the perspectives of action points and green value. J. Bus. Res. 2023, 159, 113724. [Google Scholar] [CrossRef]
- Hou, X.H.; Wang, B. Research on the development of green finance under the background of financial supply-side structural reform. Seek. Truth 2020, 47, 13–20. [Google Scholar]
- Falcone, P.M. Environmental regulation and green investments: The role of green finance. Int. J. Green Econ. 2020, 14, 159–173. [Google Scholar] [CrossRef]
- Li, C.X.; Sun, C. Analysis of the spatial synergistic effect of green finance and high-quality economic development under the background of industrial structure upgrading. J. Hebei Univ. Eng. 2025, 42, 9–18. [Google Scholar]
- Zhang, Z.B.; Zhang, R.X. Research on the impact of green finance on enterprise green technology innovation: A quasi-natural experiment based on green bond issuance. J. Henan Univ. Sci. Technol. 2025, 43, 92–100. [Google Scholar] [CrossRef]
- Guo, X.; Tao, L.; Chen, Y. Decoding the green code: Digital technology, talent re-structuring, and the path to green innovation efficiency. Sustainability 2025, 17, 8347. [Google Scholar] [CrossRef]
- Wu, H.; Wen, X.; Wang, X.; Yu, X. A Study on the Spatiotemporal Coupling Characteristics and Driving Factors of China’s Green Finance and Energy Efficiency. Systems 2025, 13, 394. [Google Scholar] [CrossRef]
- Yang, L.; Sun, Z.C. Evaluation of the development level of new urbanization in Western China based on entropy method. On Econ. Probl. 2015, 115–119. [Google Scholar]
- Hua, Y.T.; Shi, B.F. Research on the impact of green finance on high-quality economic development. Front. Sci. Technol. Eng. Manag. 2023, 42, 90–96. [Google Scholar]
- Wang, X.W.; Chen, M.Y.; Chen, N.X. Digital economy, green technology innovation and industrial structure upgrading. On Econ. Probl. 2023, 19–28. [Google Scholar]
- Lee, C.C.; Lee, C.C. How does green finance affect green total factor productivity? Evidence from China. Energy Econ. 2022, 107, 105863. [Google Scholar] [CrossRef]
- Li, N.B.; Gao, C.L.; Zang, Y.T. Research on the coupling coordination mechanism of green technology innovation, environmental regulation and green finance. Sci. Technol. Manag. Res. 2021, 39, 100–108. [Google Scholar]
- Shao, X.F.; Fang, T.S. Analysis of the coupling coordination degree between regional green finance and industrial structure: From the perspective of new institutional economics. J. Ind. Technol. Econ. 2021, 40, 120–127. [Google Scholar]
- Zhu, J.H.; Wang, H.J.; Zheng, P. Research on the coupling coordination development of circular economy and green finance in Guizhou Province. Econ. Geogr. 2019, 39, 119–128. [Google Scholar]
- Jiang, H.B.; Li, Y.J. Evolution of manufacturing spatial pattern and its driving factors in Beijing-Tianjin-Hebei region. Prog. Geogr. 2021, 40, 721–735. [Google Scholar] [CrossRef]
- Du, T.; Xie, X.J.; Liang, H.Y.; et al. Comprehensive evaluation and spatial analysis of county economy in Chongqing based on entropy weight TOPSIS and GIS. Econ. Geogr. 2014, 34, 40–47. [Google Scholar]
- Huang, B.; Wu, B.; Barry, M. Geographically and temporally weighted regression for modeling spatio-temporal variation in house prices. Int. J. Geogr. Inf. Sci. 2010, 24, 383–401. [Google Scholar] [CrossRef]
Figure 2.
Comparison of the CCD between GF and GTI across different regions.
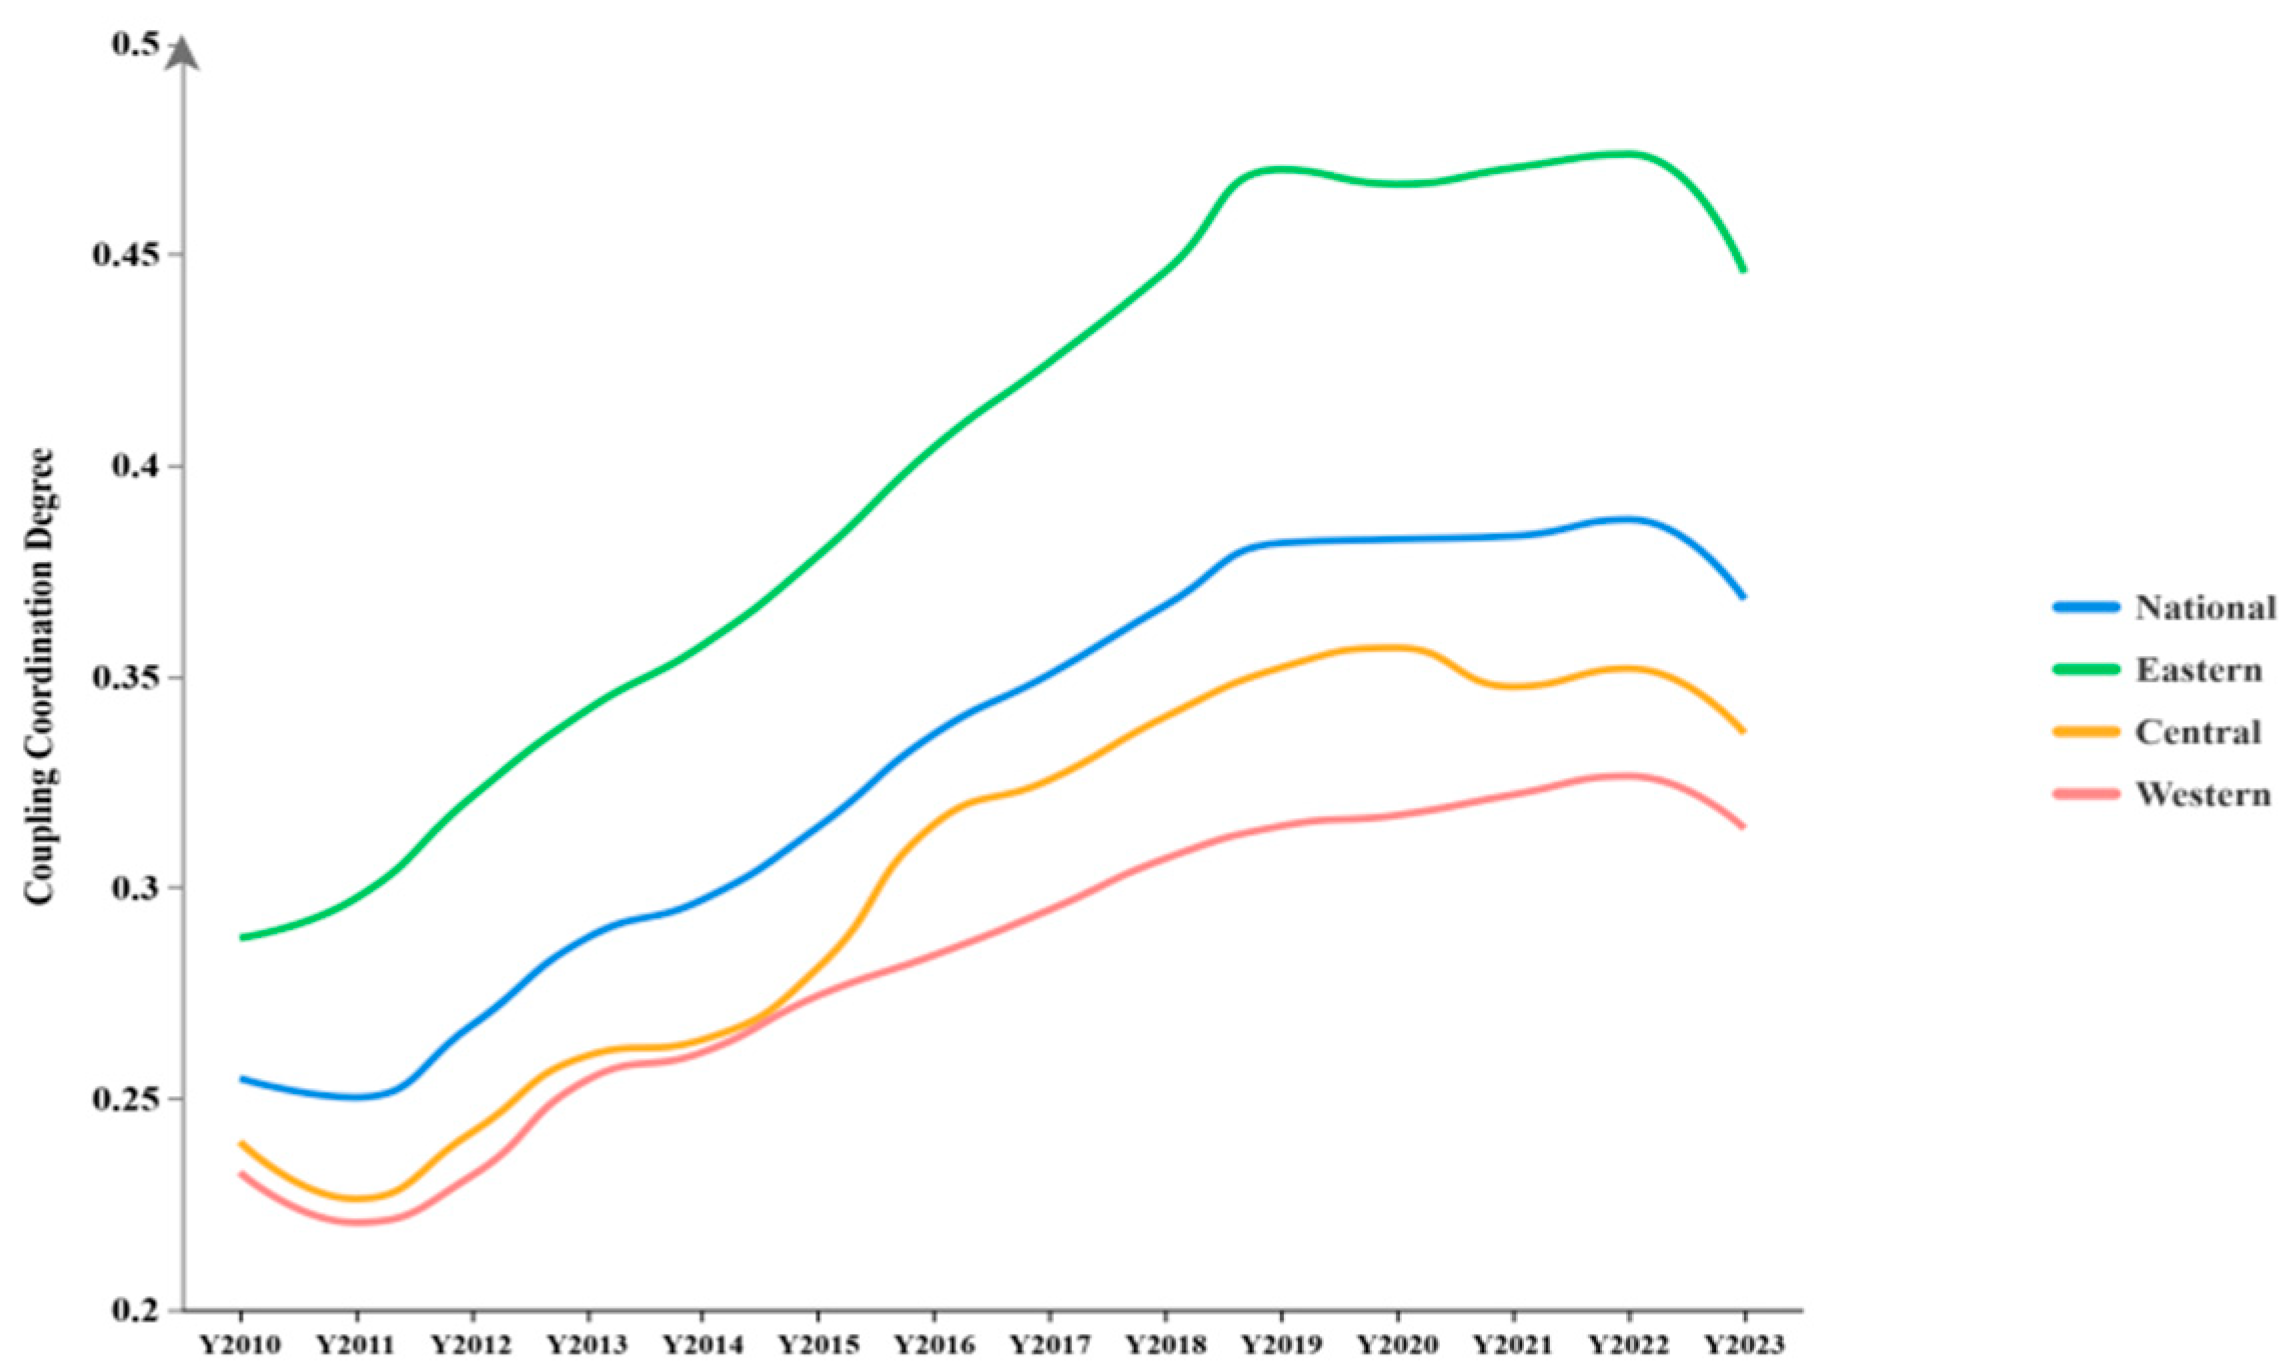
Figure 3.
Spatio-temporal evolution pattern of GF-GTI coupling coordination degree in 30 provinces.
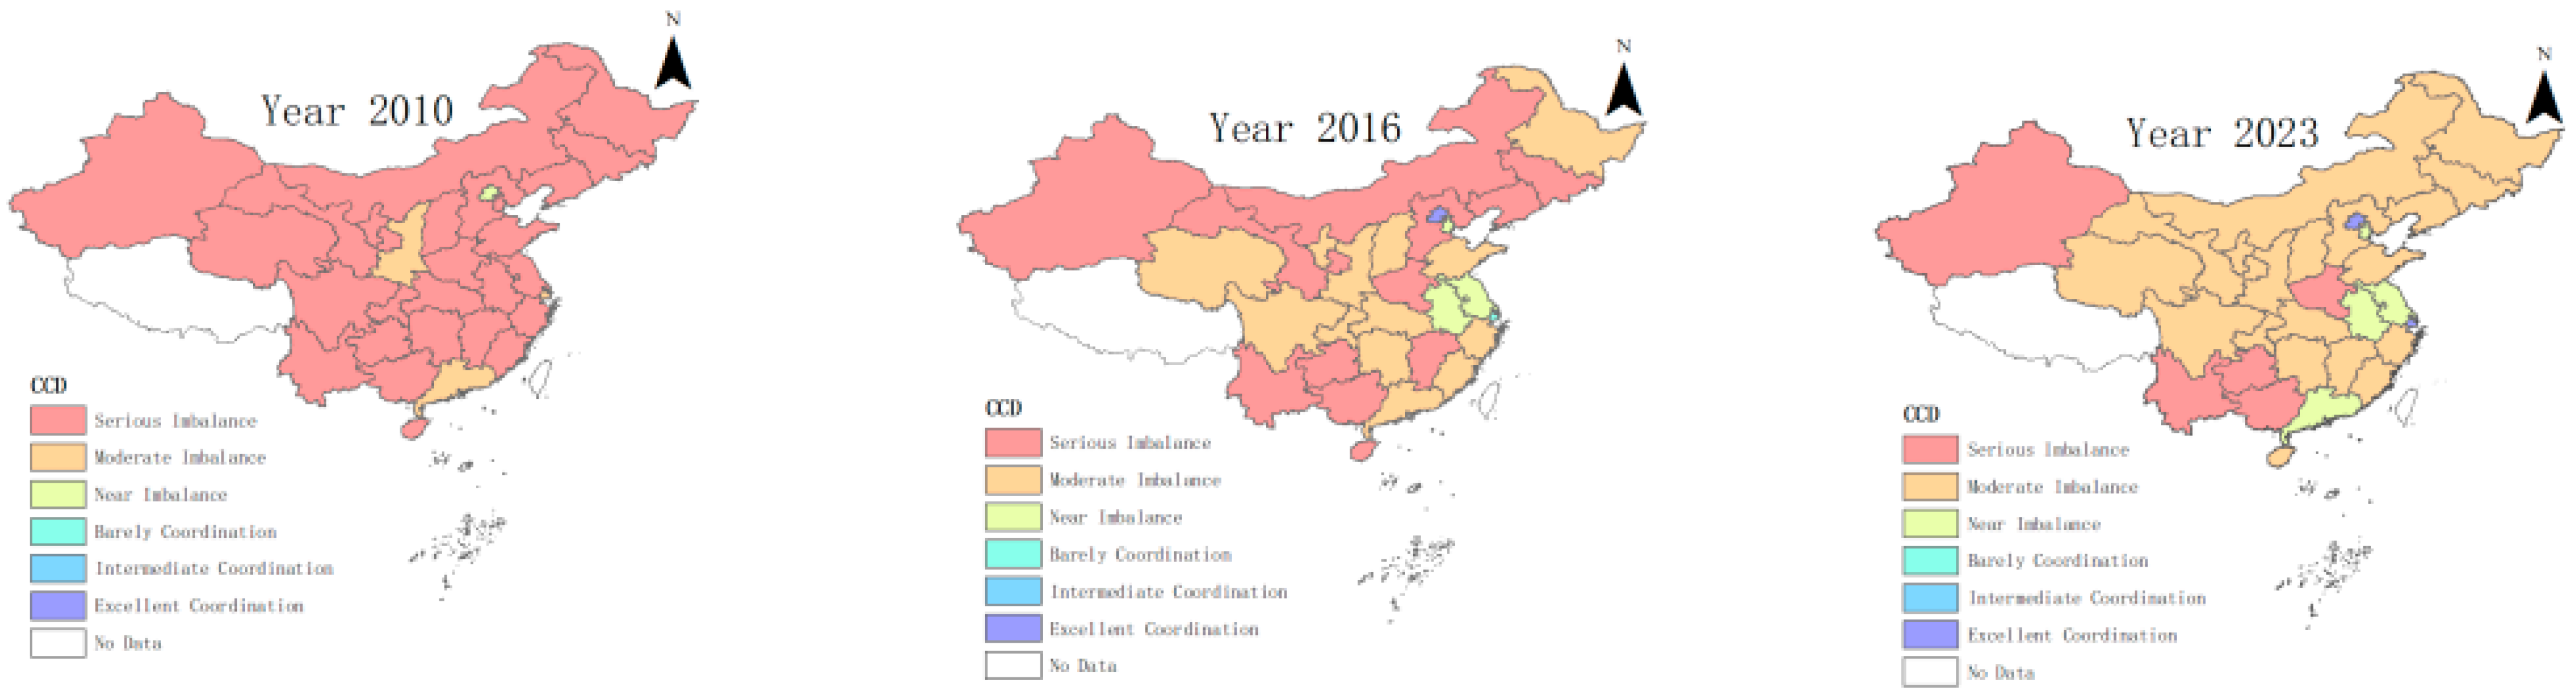
Figure 4.
the Contribution Rates of Gw, Gb and Gt.
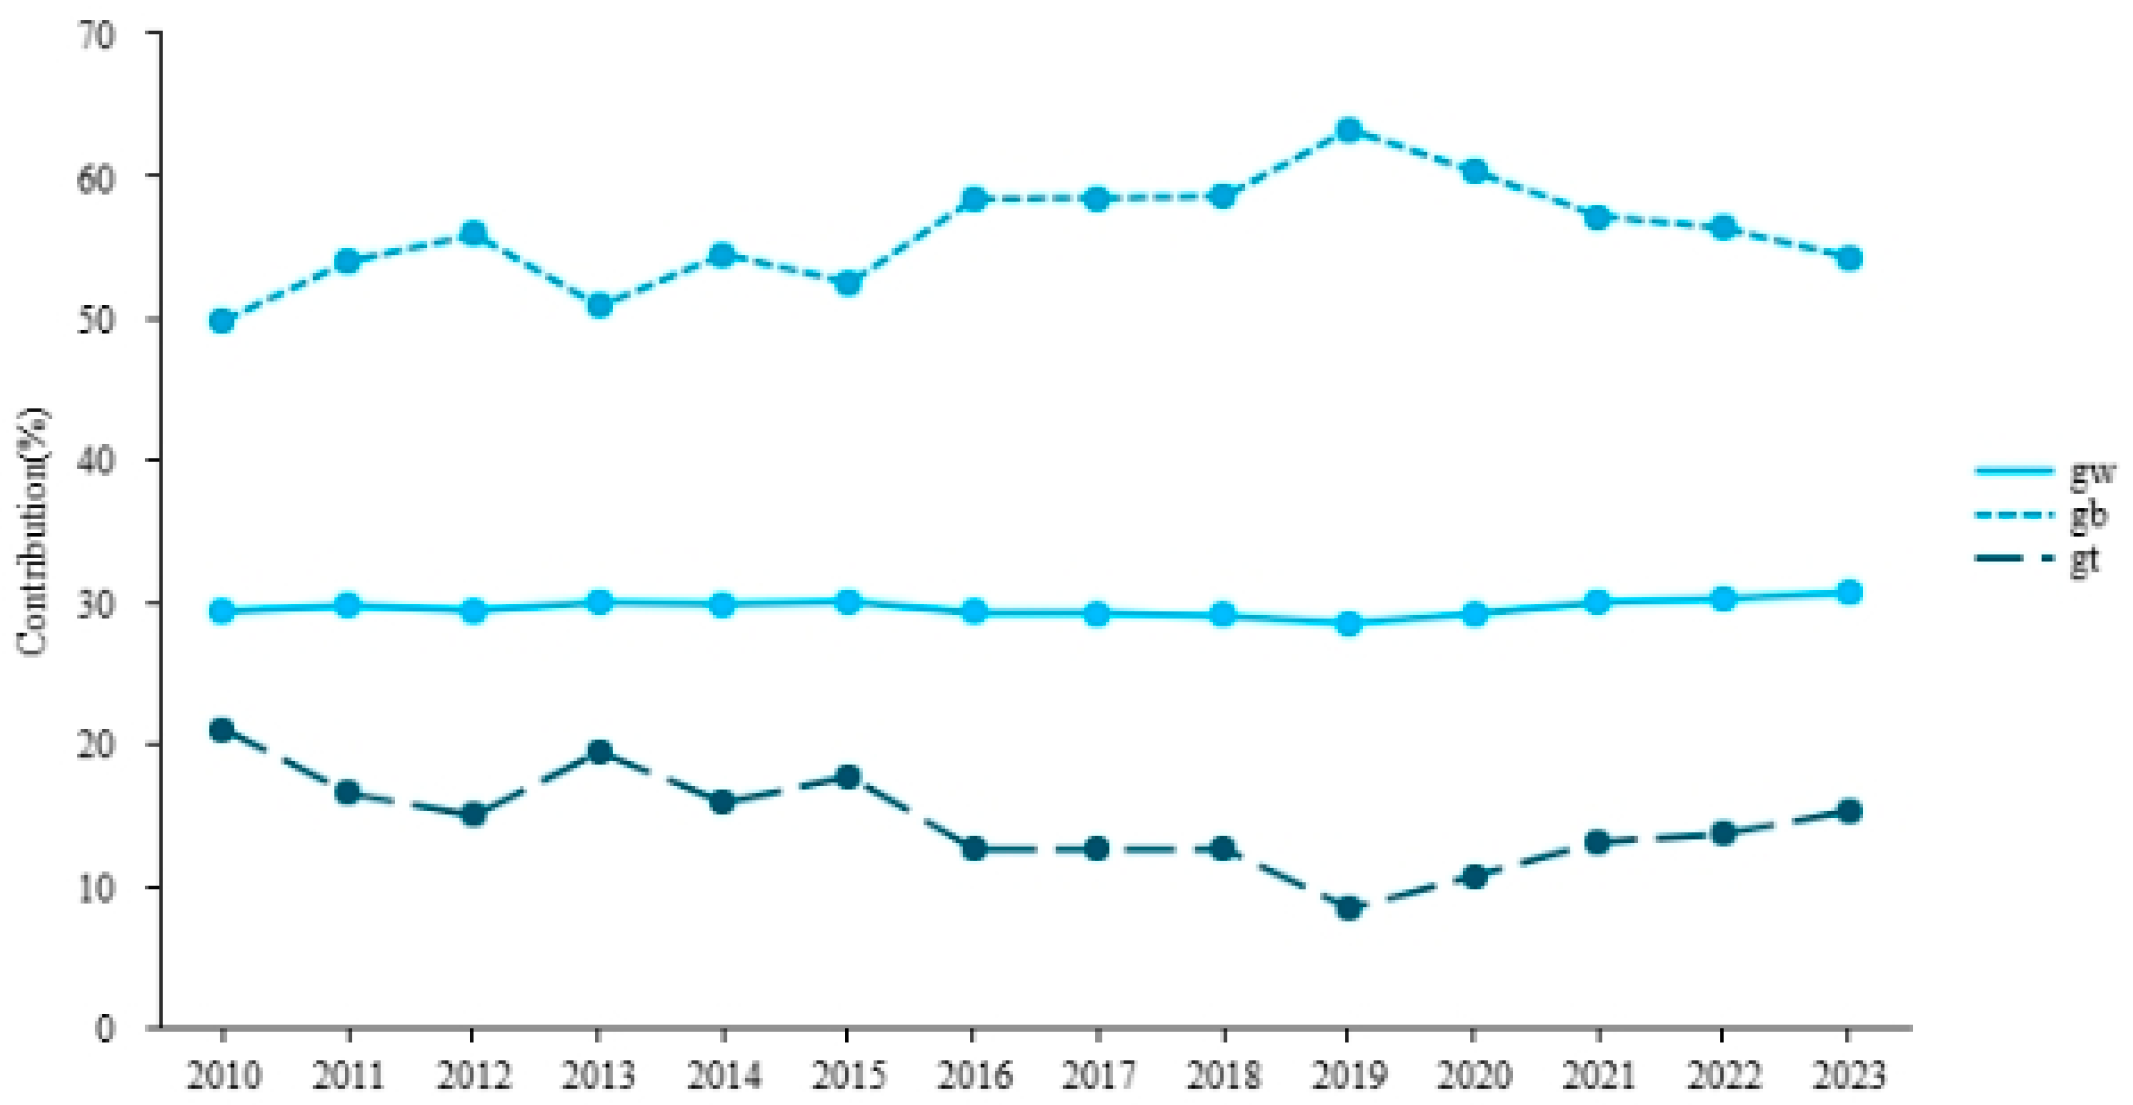
Figure 5.
Kernel density curves of CCD in 30 provinces in China.
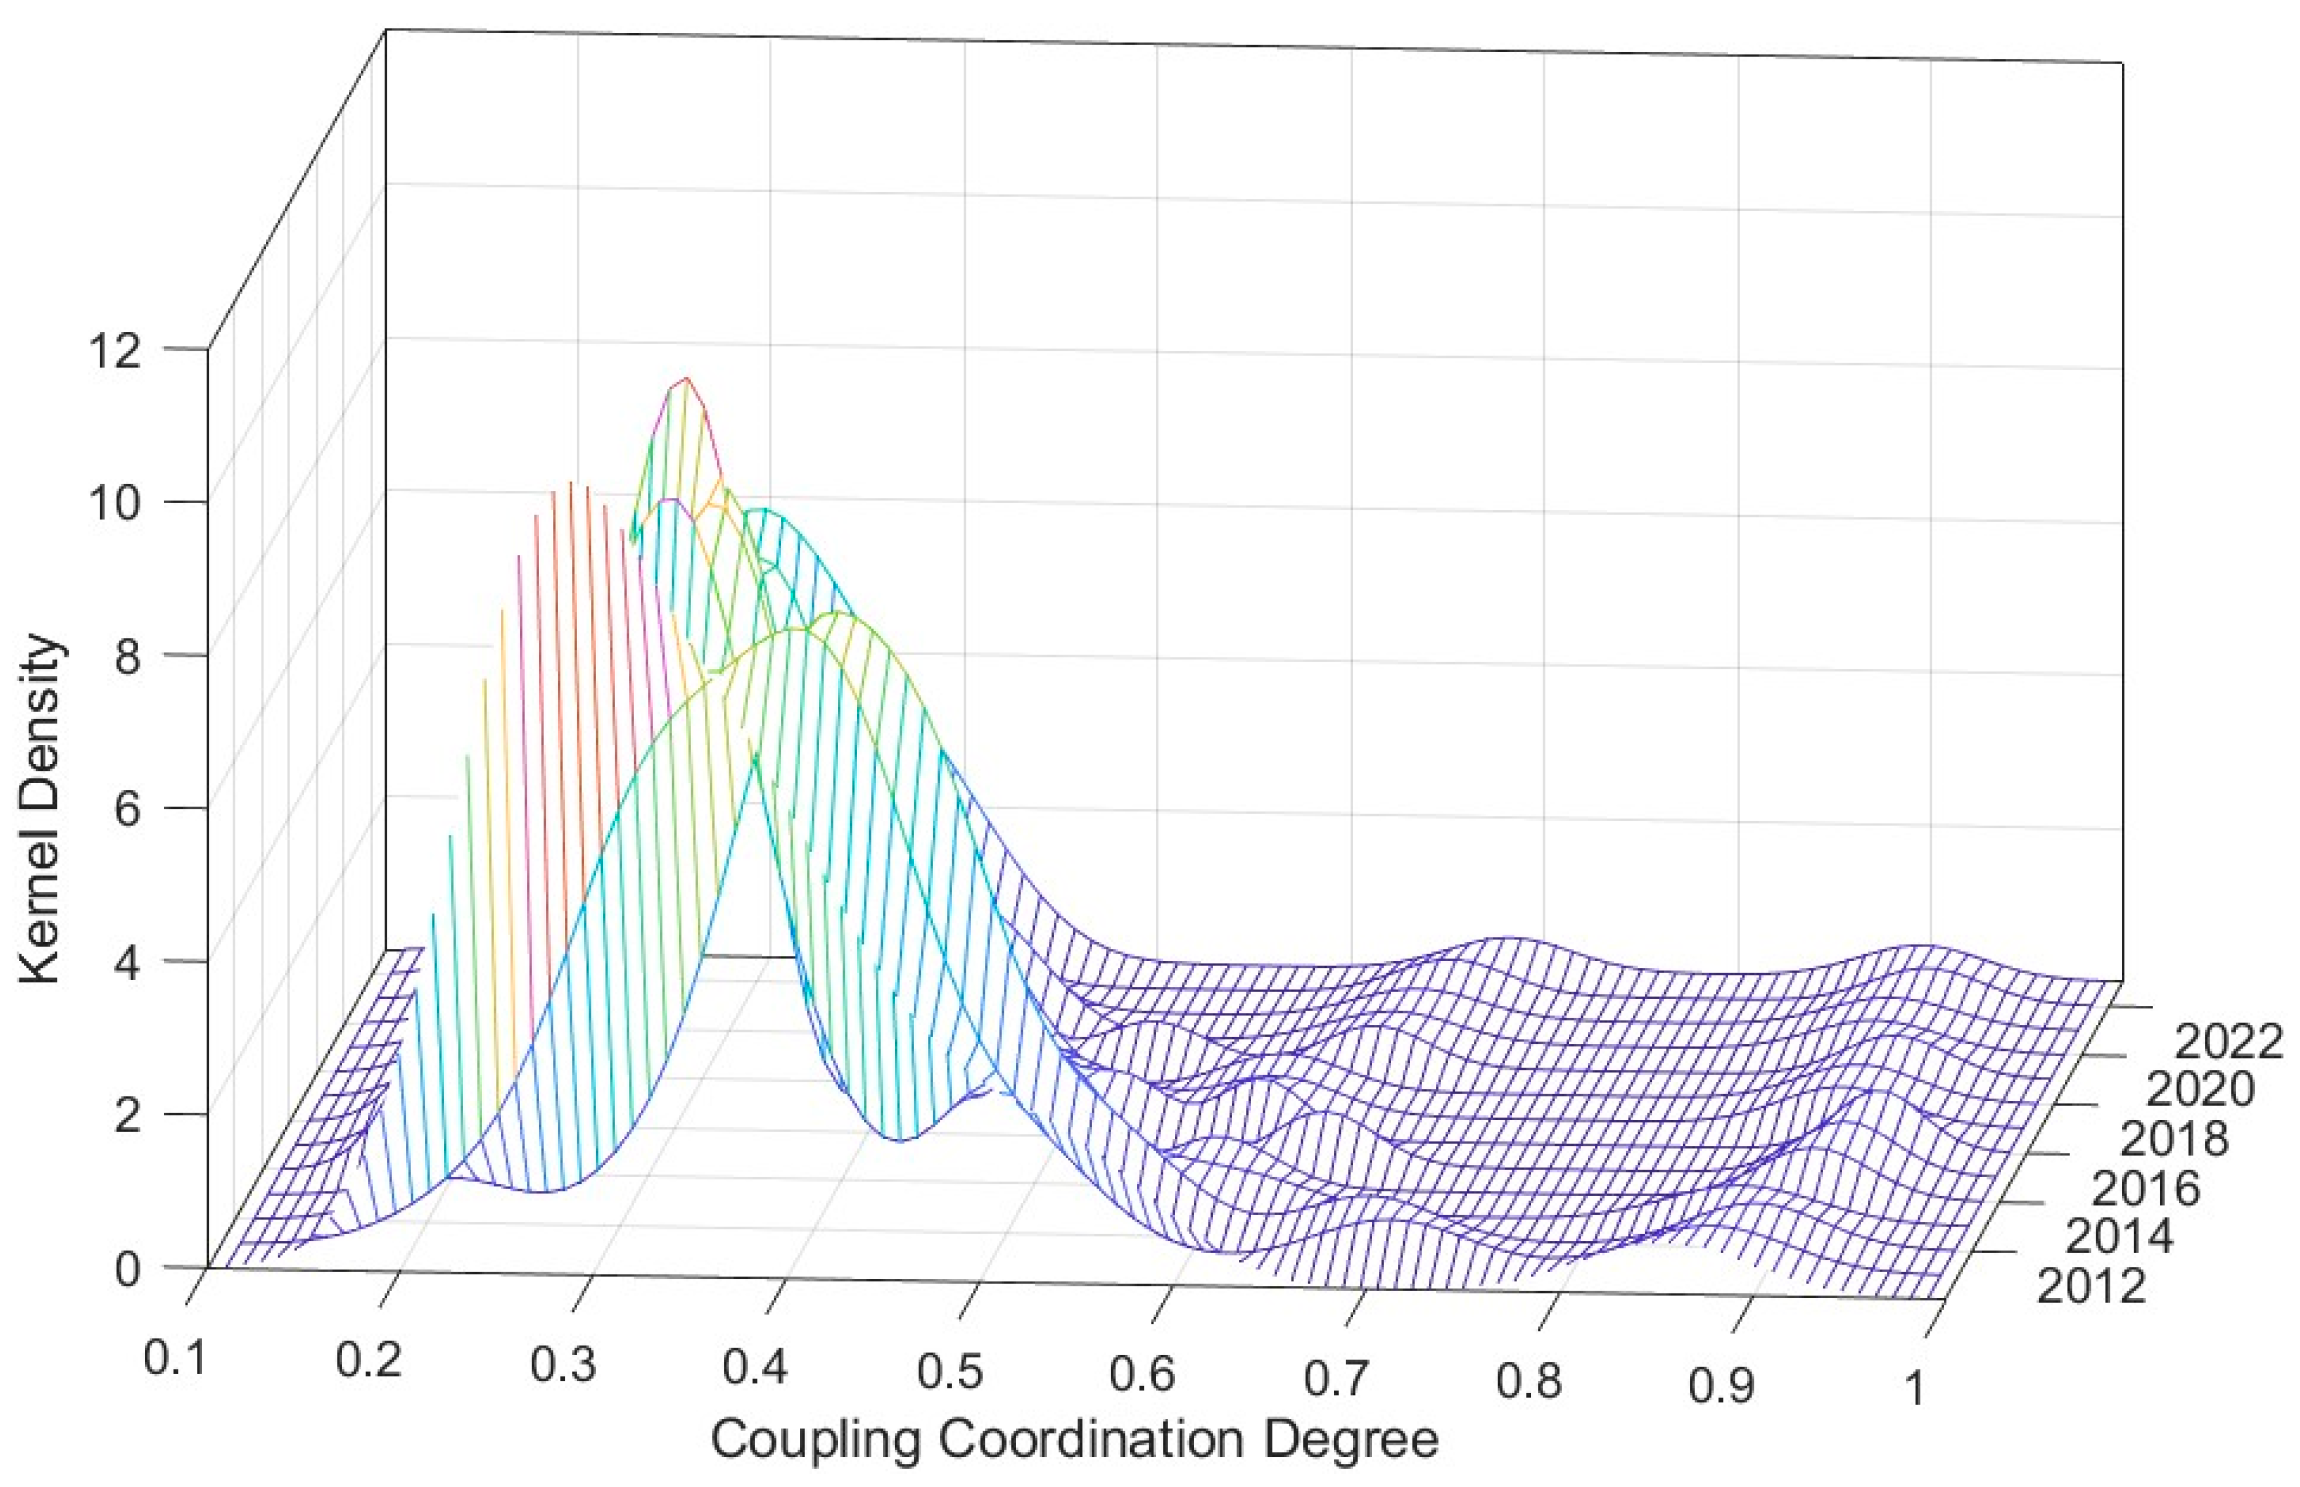
Figure 6.
high/low clustering distribution of the CCD in China.
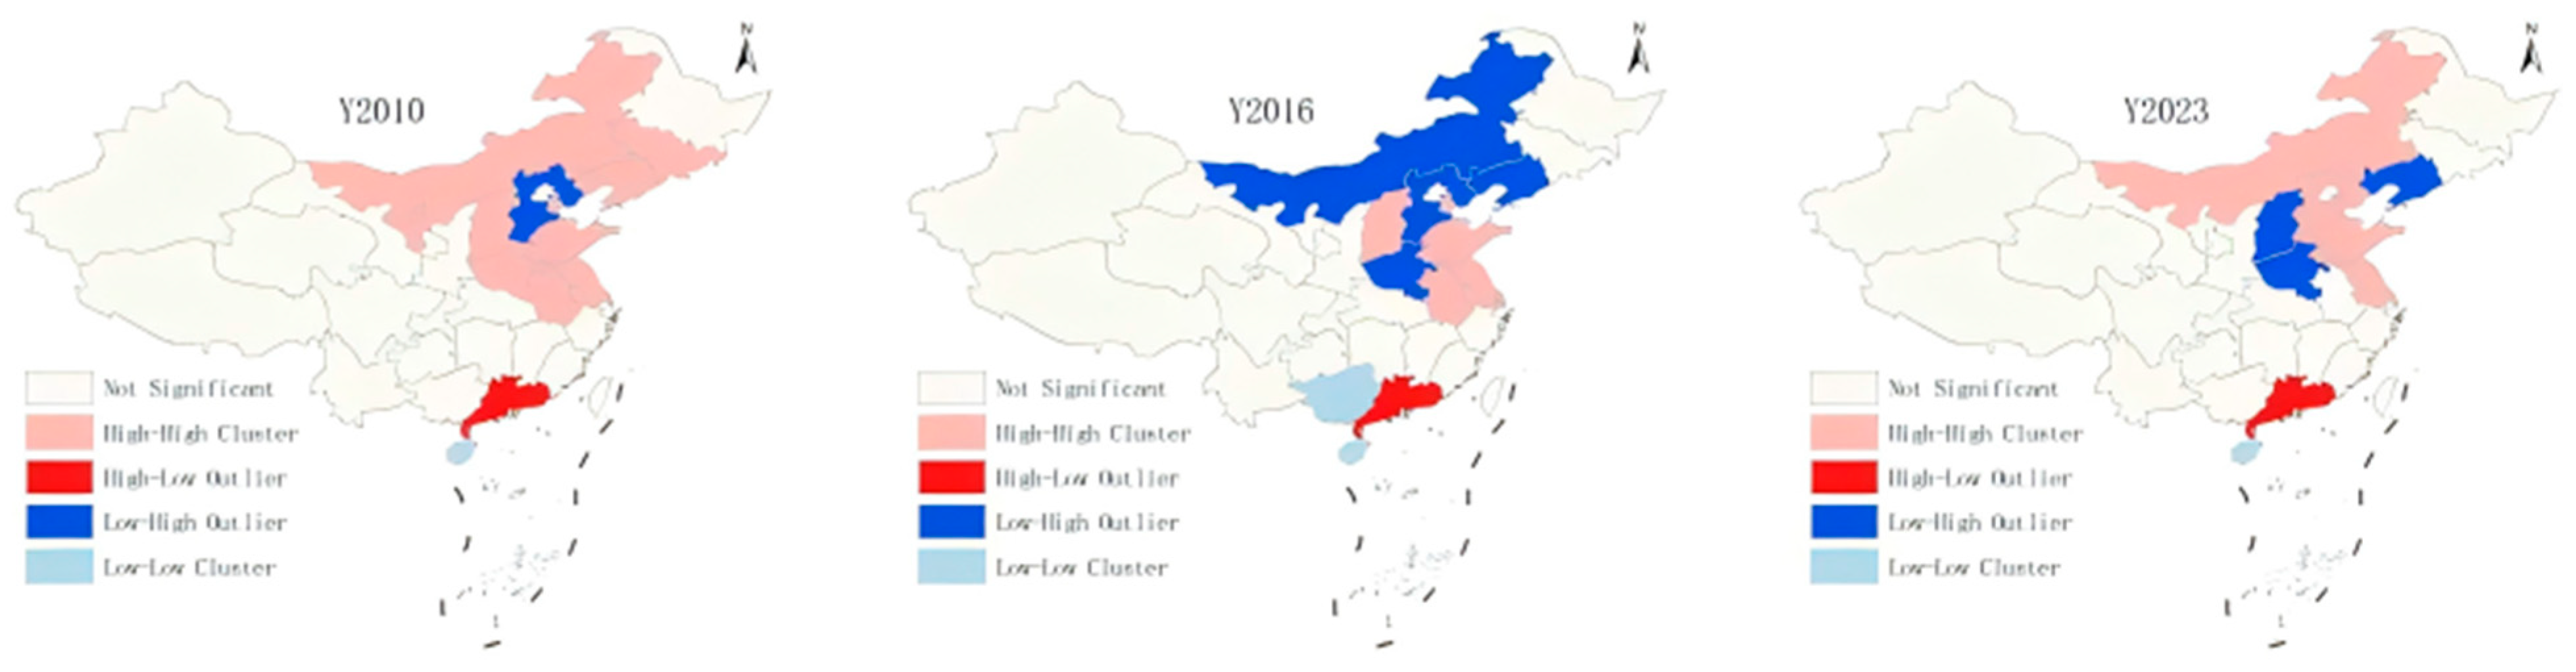
Figure 7.
Spatial distribution of influencing factors.
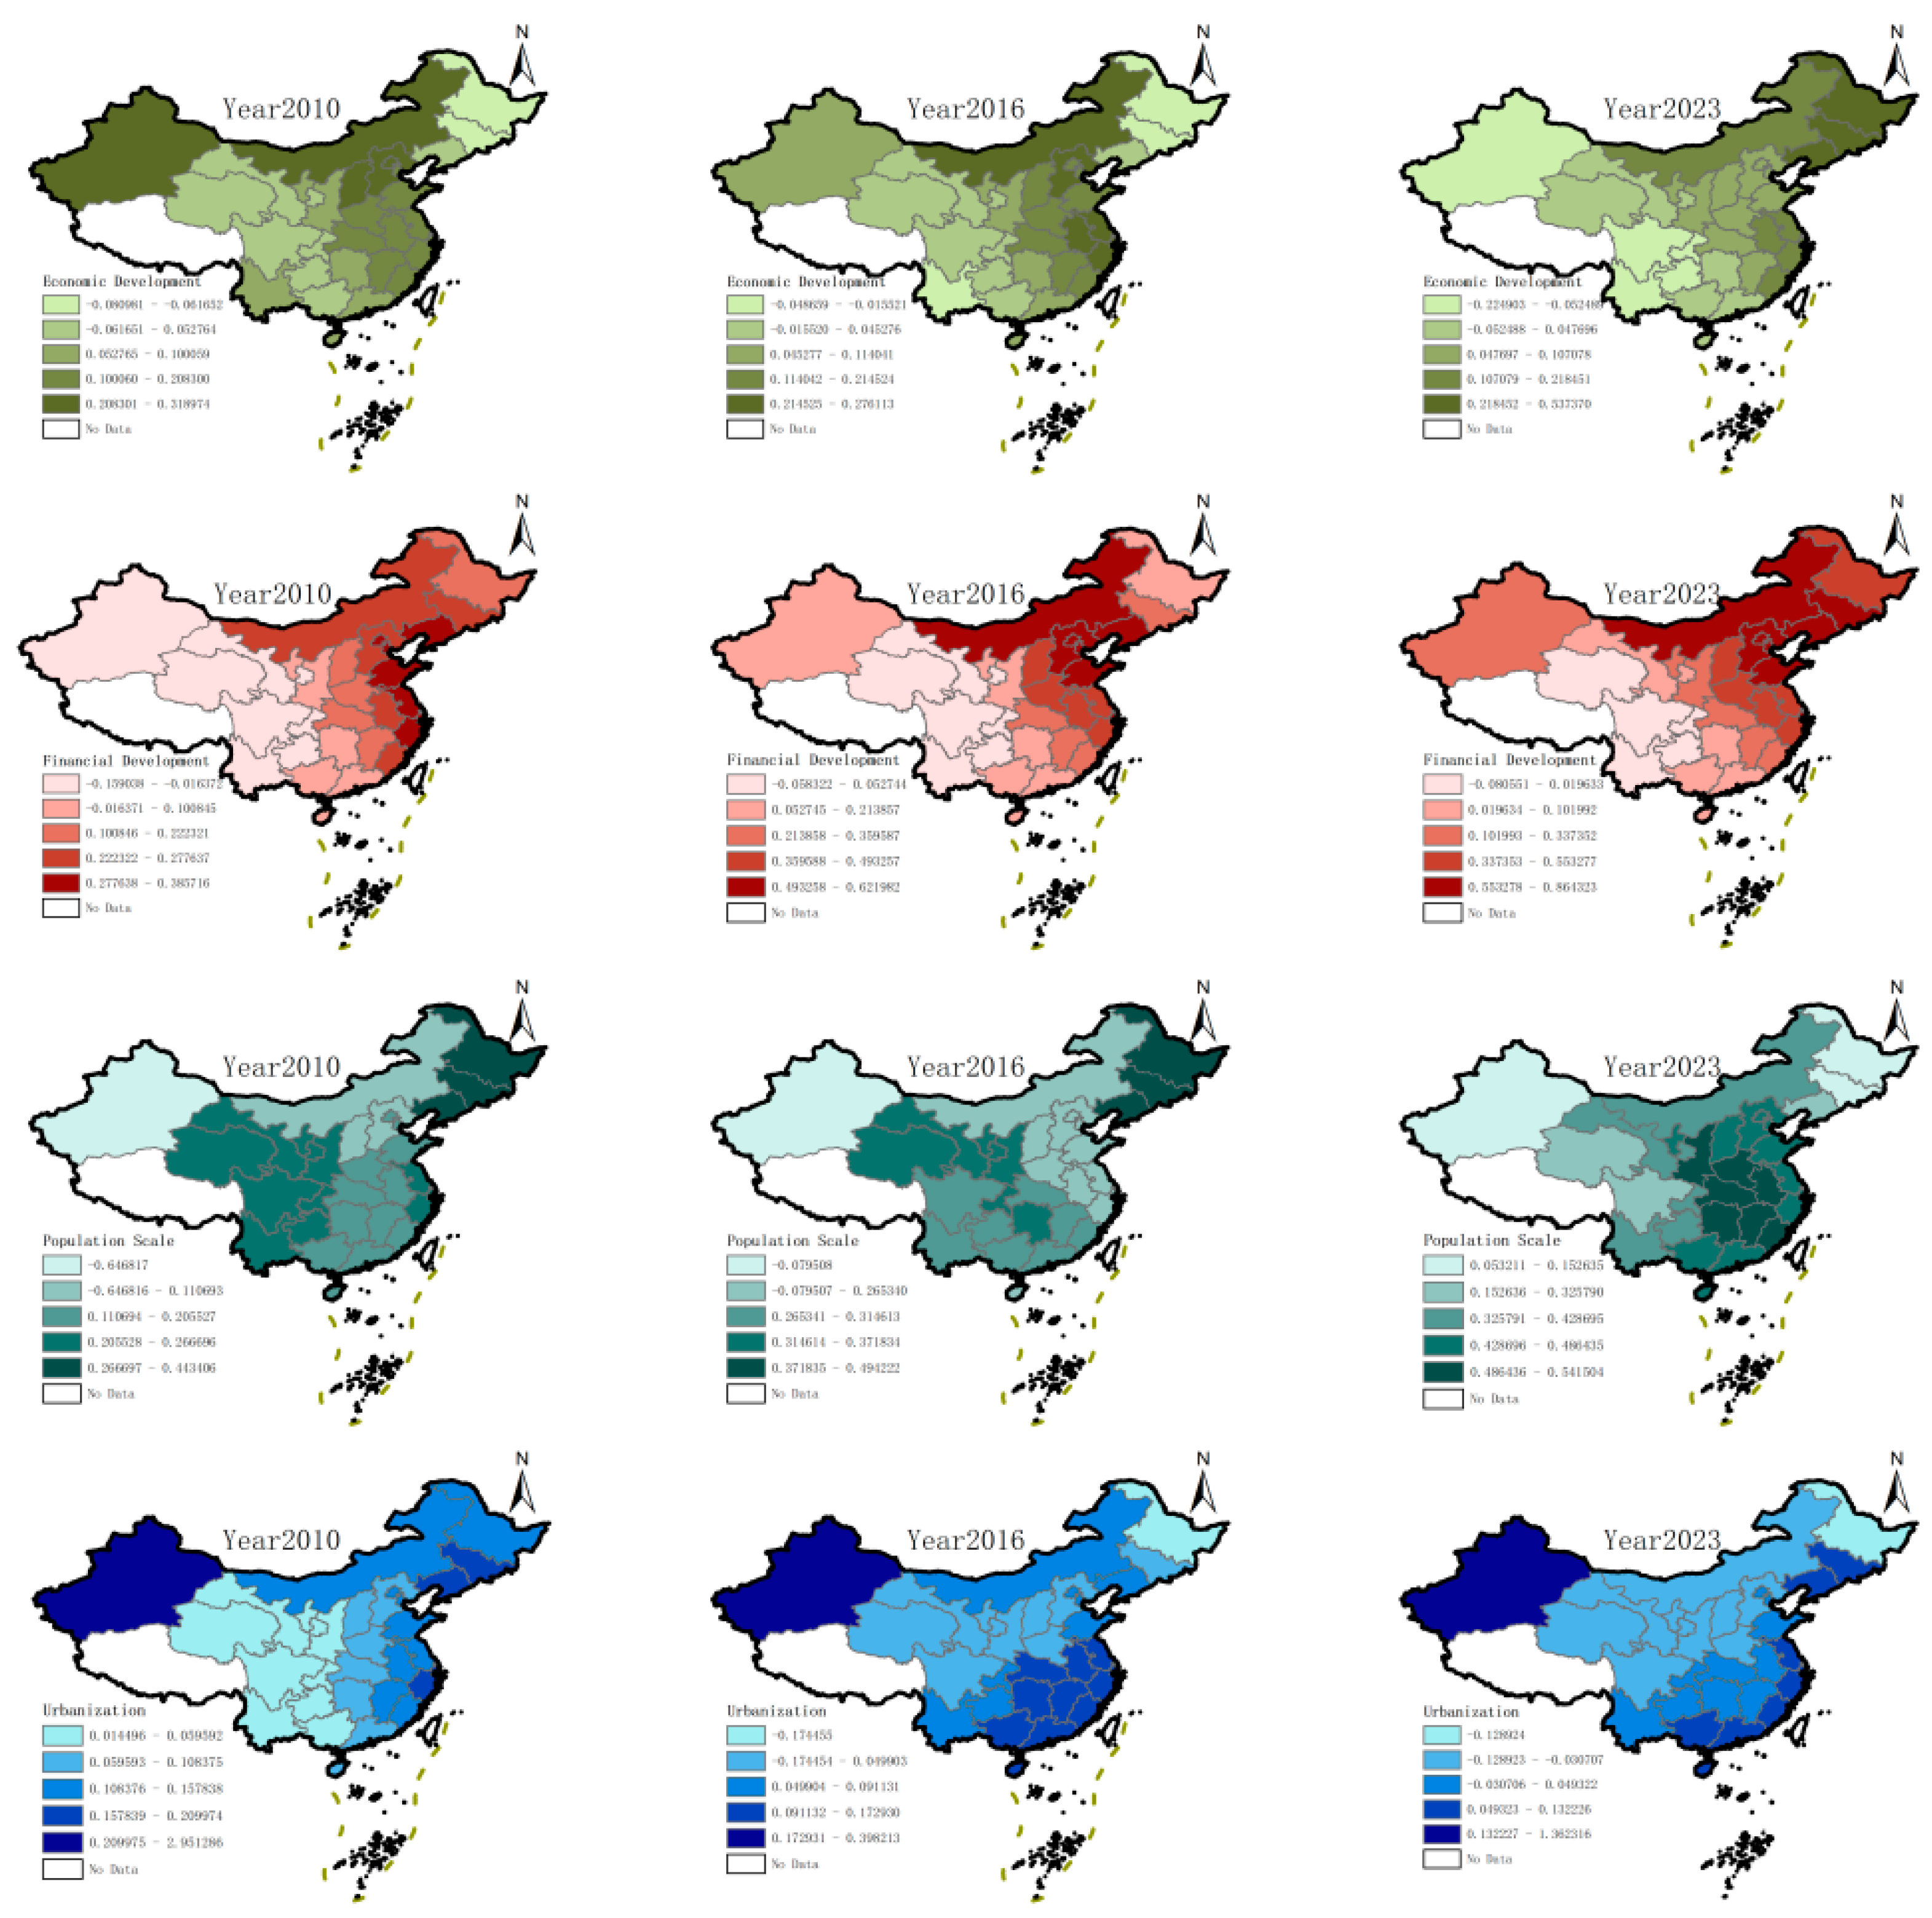
Figure 8.
Mean value of regression coefficient of different factors based on the GTWR.

Table 1.
Comprehensive evaluation index system of GF and GTI in China.
| System | Primary Indicators | Secondary Indicators | +/- | Weight |
|---|---|---|---|---|
| Green Finance (GF) |
Green Credit | proportion of interest in high-energy-consumption industries | - | 0.084 |
| Green Investment | share of investment in environmental pollution control | + | 0.252 | |
| share of environmental protection expenditure | + | 0.115 | ||
| Green Insurance | agricultural insurance density | + | 0.430 | |
| agricultural insurance loss ratio | + | 0.102 | ||
| Carbon Finance | carbon emission intensity | - | 0.017 | |
| Green Technology Innovation (GTI) | number of green patents granted per 10,000 persons | / | / | |
Table 2.
Classification criteria for CCD.
| CCD | Classification Criteria |
|---|---|
| 0≤C<0.2 | Serious Imbalance |
| 0.2≤C<0.4 | Moderate Imbalance |
| 0.4≤C<0.5 | Near Imbalance |
| 0.5≤C<0.6 | Barely Coordination |
| 0.6≤C<0.8 | Intermediate Coordination |
| 0.8≤C≤1 | Excellent Coordination |
Table 3.
Explanation and symbol of variables of driving factors.
| Driving Factors | Symbol | Definition Of Indicators |
|---|---|---|
| Economic Development | ED | ln GDP/ln Resident Population (10,000 persons) |
| Financial Development | FD | ln (Total Deposits & Loans) / GDP |
| Population Scale | PS | ln (Year-End Resident Population) |
| Urbanization | UR | Urban Population / Resident Population |
Table 4.
Regional Differences of the CCD between GF and GTI.
| Year | G | Gw | Gb | Gt | Eastern | Central | Western |
|---|---|---|---|---|---|---|---|
| 2010 | 0.102 | 0.030 | 0.051 | 0.021 | 0.125 | 0.043 | 0.063 |
| 2011 | 0.132 | 0.039 | 0.071 | 0.022 | 0.146 | 0.062 | 0.100 |
| 2012 | 0.140 | 0.041 | 0.078 | 0.021 | 0.155 | 0.068 | 0.098 |
| 2013 | 0.139 | 0.042 | 0.071 | 0.027 | 0.165 | 0.082 | 0.084 |
| 2014 | 0.138 | 0.041 | 0.075 | 0.022 | 0.175 | 0.073 | 0.070 |
| 2015 | 0.147 | 0.044 | 0.077 | 0.026 | 0.181 | 0.082 | 0.080 |
| 2016 | 0.142 | 0.042 | 0.083 | 0.018 | 0.179 | 0.079 | 0.065 |
| 2017 | 0.147 | 0.043 | 0.086 | 0.018 | 0.185 | 0.062 | 0.077 |
| 2018 | 0.151 | 0.044 | 0.088 | 0.019 | 0.182 | 0.065 | 0.085 |
| 2019 | 0.150 | 0.043 | 0.095 | 0.012 | 0.182 | 0.053 | 0.081 |
| 2020 | 0.151 | 0.044 | 0.091 | 0.016 | 0.187 | 0.053 | 0.087 |
| 2021 | 0.158 | 0.047 | 0.090 | 0.021 | 0.200 | 0.046 | 0.098 |
| 2022 | 0.157 | 0.047 | 0.088 | 0.021 | 0.201 | 0.071 | 0.086 |
| 2023 | 0.153 | 0.047 | 0.083 | 0.023 | 0.197 | 0.088 | 0.079 |
| Mean | 0.143 | 0.042 | 0.081 | 0.021 | 0.176 | 0.066 | 0.082 |
| Max | 0.158 | 0.047 | 0.095 | 0.027 | 0.201 | 0.088 | 0.1 |
| Min | 0.102 | 0.03 | 0.051 | 0.012 | 0.125 | 0.043 | 0.063 |
Table 5.
Inter-Regional Differences among the three groups.
| Year | Central & Western | Eastern & Central | Eastern & Western |
|---|---|---|---|
| 2010 | 0.063 | 0.118 | 0.133 |
| 2011 | 0.087 | 0.149 | 0.169 |
| 2012 | 0.085 | 0.163 | 0.182 |
| 2013 | 0.085 | 0.167 | 0.174 |
| 2014 | 0.075 | 0.173 | 0.175 |
| 2015 | 0.086 | 0.179 | 0.184 |
| 2016 | 0.081 | 0.166 | 0.189 |
| 2017 | 0.082 | 0.169 | 0.199 |
| 2018 | 0.088 | 0.170 | 0.203 |
| 2019 | 0.082 | 0.167 | 0.209 |
| 2020 | 0.086 | 0.164 | 0.208 |
| 2021 | 0.086 | 0.175 | 0.213 |
| 2022 | 0.087 | 0.180 | 0.206 |
| 2023 | 0.090 | 0.178 | 0.194 |
| Mean | 0.083 | 0.166 | 0.188 |
| Max | 0.09 | 0.18 | 0.213 |
| Min | 0.063 | 0.118 | 0.133 |
Table 6.
Global Moran's I of the CCD from 2010 to 2023.
| Year | Y2010 | Y2011 | Y2012 | Y2013 | Y2014 | Y2015 | Y2016 |
|---|---|---|---|---|---|---|---|
| Moran's I | 0.108 | 0.260 | 0.244 | 0.258 | 0.265 | 0.269 | 0.326 |
| P-value | 0.081 | 0.006 | 0.009 | 0.005 | 0.002 | 0.003 | 0.001 |
| Year | Y2017 | Y2018 | Y2019 | Y2020 | Y2021 | Y2022 | Y2023 |
| Moran's I | 0.302 | 0.255 | 0.319 | 0.254 | 0.186 | 0.160 | 0.127 |
| P-value | 0.001 | 0.004 | 0.001 | 0.004 | 0.023 | 0.044 | 0.100 |
Table 7.
Comparison of related parameters of OLS, GWR and GTWR.
| Parameters | OLS | GWR | GTWR |
|---|---|---|---|
| R² | 0.690 | 0.883 | 0.911 |
| R² Adjusted | - | 0.882 | 0.910 |
| AICc | -1067.049 | -1405.481 | -1487.161 |
| RSS | 1.893 | 0.714 | 0.543 |
Disclaimer/Publisher’s Note: The statements, opinions and data contained in all publications are solely those of the individual author(s) and contributor(s) and not of MDPI and/or the editor(s). MDPI and/or the editor(s) disclaim responsibility for any injury to people or property resulting from any ideas, methods, instructions or products referred to in the content. |
© 2025 by the authors. Licensee MDPI, Basel, Switzerland. This article is an open access article distributed under the terms and conditions of the Creative Commons Attribution (CC BY) license (http://creativecommons.org/licenses/by/4.0/).
Copyright: This open access article is published under a Creative Commons CC BY 4.0 license, which permit the free download, distribution, and reuse, provided that the author and preprint are cited in any reuse.


