
Submitted:
24 November 2025
Posted:
25 November 2025
You are already at the latest version
Abstract
Background/Objectives: Obesity is a major risk factor for diabetes, but the underlying mechanisms remain incompletely understood. Obesity is associated with alterations in circulating lipids. This study aimed to determine whether, and to what extent, circulating lipids mediate the pro-diabetic effect of obesity. Methods: We analyzed data from 26,627 US adults. Mediation analysis was performed using the PROCESS Version 4.3 Macro for SPSS. Parallel mediation analysis included total cholesterol, high-density lipoprotein (HDL) cholesterol, and triglycerides as simultaneous mediators. Low-density lipoprotein (LDL) cholesterol was excluded from the parallel model due to collinearity with total cho-lesterol and was assessed separately using simple mediation analysis adjusted for con-founders. Results: After adjustment for tested confounders, parallel mediation analysis showed that increases in triglycerides and reductions in HDL cholesterol mediated 24.0% (indirect effect coefficient = 0.23; 95% CI: 0.20–0.26; p < 0.05) and 3.8% (indirect effect coef-ficient = 0.04; 95% CI: 0.01–0.06; p < 0.05) of the pro-diabetic effect of obesity, respectively. An increase in total cholesterol negatively mediated the effect by 2.3% (indirect effect coef-ficient = -0.02; 95% CI: -0.03 to -0.01; p < 0.05). Simple mediation analysis indicated that LDL cholesterol was not a significant mediator. Conclusions: Triglycerides are the most influential circulating lipid in mediating the pro-diabetic effect of obesity, accounting for 24% of the total effect. Targeting triglyceride levels may represent an underrecognized therapeutic strategy to reduce obesity-related diabetes risk.
Keywords:
lipids
; type 2 diabetes
; triglyceride
; metabolic disease
1. Introduction
Obesity is defined as excessive fat accumulation in the body that can impair health [1]. Over the past three decades (1990–2021), global adult obesity prevalence has risen dramatically—by 105% in females (from 10.2% to 20.8%) and by 155% in males (from 5.8% to 14.8%) [2]. The World Health Organization (WHO) has classified obesity as a global epidemic [3]. According to the WHO, 890 million adults worldwide are living with diabetes, representing 16% of the global population [4]. Obesity in adults is particularly common in high-income countries, with prevalence rates of 28% in the UK [5], 29.5% in Canada [6], 32% in Australia [7], and 41.9% in the United States [8]. It is projected that by 2050, the number of adults with obesity will reach 1.95 billion [2].
Obesity has wide-ranging consequences for health and well-being [1]. Individuals with obesity often experience stigma and discrimination, which negatively impact quality of life [9,10] and increase the risk of depression [11]. Excess adipose tissue can also impair organ and tissue function; for example, it can damage joints, leading to osteoarthritis, pain, and reduced mobility [12]. Furthermore, obesity is a major risk factor for numerous diseases, including non-alcoholic fatty liver disease [13], chronic kidney disease, cardiovascular disease, and cancer [14,15].
Of particular concern, obesity substantially increases the risk of diabetes [16]. Currently, diabetes affects 537 million people worldwide [17], and both its prevalence and incidence continue to rise [17,18]. Diabetes can lead to severe complications, including blindness, kidney failure, heart attacks, stroke, and lower-limb amputation [19]. The World Obesity Federation and the International Diabetes Federation estimate that obesity accounts for 43% of type 2 diabetes cases [20], which itself represents approximately 90% of all diabetes diagnoses [21]. Both organizations emphasize that halting the global rise in type 2 diabetes requires prioritizing action on obesity [20].
Obesity contributes to diabetes through multiple mechanisms [16,22,23]. A key pathway involves obesity-induced insulin resistance and β-cell dysfunction [16], driven by increased oxidative stress and chronic inflammation [22,23]. Obesity is also strongly associated with dyslipidemia, characterized by elevated triglycerides [24], increased total cholesterol [25], higher low-density lipoprotein (LDL) cholesterol [26], and reduced high-density lipoprotein (HDL) cholesterol [27,28,29]. Approximately 60%–70% of individuals with obesity exhibit dyslipidemia [30]. However, the extent to which these circulating lipids mediate the pro-diabetic effect of obesity remains unclear.
To address this question, we analyzed data from 26,627 US adults who participated in the National Health and Nutrition Examination Survey (NHANES) between 1988 and 2014. Circulating lipids assessed included total cholesterol, HDL cholesterol, LDL cholesterol, and triglycerides.
2. Materials and Methods
2.1. Study Participants
This study included US civilian noninstitutionalized individuals who attended the NHANES from 1988 to 2014. These surveys were organized by the National Center for Health Statistics (NCHS) within the Centers for Disease Control and Prevention (CDC) [31]. The inclusion criteria of the current study were age of ≥ 20 years and the presence of the following data: body mass index, fasting triglycerides, total cholesterol, HDL cholesterol, fasting plasma glucose, and blood hemoglobin A1c (HbA1c). This resulted in a group of 26,724 participants. The following participants were excluded from the analysis: unknown education status (n = 74), unknown smoking status (n = 13), and unknown physical activity status (n = 10). Therefore, 26,627 participants were included in the final analysis (Figure 1).
In a further analysis investigating the effect of LDL cholesterol in mediating the pro-diabetic effect of obesity, 3110 participants were excluded due to missing LDL cholesterol values. Therefore, a total of 23,517 participants were included in this further analysis (Figure 1).
2.2. Exposure Variable
2.3. Outcome Variable
The outcome of the current study was diabetes, which was defined by one of the following criteria: HbA1c ≥6.5%, fasting plasma glucose ≥126 mg/dL, 2-hour plasma glucose during oral glucose tolerance test ≥200 mg/dL, the use of hypoglycemic medications, or self-reported diagnosis of diabetes [34,35].
2.4. Candidate Mediators
The mediators assessed in this study included total cholesterol, HDL cholesterol, LDL cholesterol, and triglycerides. Fasting blood samples were collected from participants who had fasted for at least 8 hours after their last caloric intake [35,36,37].
Total cholesterol was measured enzymatically using a series of coupled reactions: cholesteryl esters were hydrolyzed to cholesterol by cholesterol esterase; cholesterol was then oxidized by cholesterol oxidase, producing hydrogen peroxide; and hydrogen peroxide was converted into a red dye by peroxidase in the presence of 4-aminophenazone and phenol. The color intensity, directly proportional to cholesterol concentration, was determined photometrically at 500 nm [38].
HDL cholesterol was measured directly without removing apoB-containing lipoproteins [39]. A blocking reagent rendered LDL, very low-density lipoprotein (VLDL), and chylomicrons non-reactive with the enzymatic cholesterol reagent under assay conditions, effectively excluding them from detection. HDL cholesterol esters were converted to cholesterol by polyethylene glycol (PEG)-modified cholesterol esterase, then oxidized by cholesterol oxidase to Δ4-cholestenone and hydrogen peroxide. In the presence of peroxidase, hydrogen peroxide reacted with 4-amino-antipyrine and N-(2-hydroxy-3-sulfopropyl)-3,5-dimethoxyaniline (HSDA) to form a purple-blue dye. The color intensity, proportional to HDL cholesterol concentration, was measured photometrically.
Triglycerides were measured enzymatically through coupled reactions in which triglycerides were hydrolyzed to glycerol [40]. The resulting glycerol was phosphorylated and oxidized to produce hydrogen peroxide, which was then converted by peroxidase into a color product measured photometrically at 500 nm.
2.4. Confounding Variables
2.5. Statistical Analyses
Baseline characteristics of participants were summarized as follows: categorical variables were presented as numbers (percentages), non-normally distributed continuous variables as medians (interquartile ranges), and normally distributed continuous variables as means (standard deviations) [46]. Differences in categorical variables were assessed using Pearson’s chi-square test [47], while differences in continuous variables were evaluated using Student’s t-test for normally distributed variables and the Mann–Whitney U test for non-normally distributed variables [48]. Correlations among the lipids were analysed using bivariate Pearson correlation analysis.
The association between obesity and diabetes was examined using binary logistic regression [49], with and without adjustment for potential confounders. Mediation analysis was performed using the PROCESS Version 4.3 Macro for SPSS [50,51]. First, a simple mediation analysis was conducted (Figure 2A), where candidate mediators (total cholesterol, HDL cholesterol, and triglycerides) were analyzed individually to estimate their separate mediation effects on the obesity–diabetes association. Subsequently, a parallel mediation analysis was performed (Figure 2B), in which all three mediators were included simultaneously in the model.
Further analyses assessed the mediation effect of LDL cholesterol. Participants lacking LDL cholesterol data (n = 3,310) were excluded, leaving 23,517 participants for this analysis (Figure 1). Because LDL cholesterol was highly correlated with total cholesterol (Pearson correlation coefficient = 0.917, Table 1), it was excluded from the parallel mediation model to avoid collinearity. Instead, its mediation effect was examined using simple mediation analysis, adjusting for all tested confounders as well as HDL cholesterol and triglycerides.
Association coefficients were derived from mediation analysis (Figure 2). Coefficient a represented the association between obesity and the tested mediator, while coefficient b reflected the association between the mediator and diabetes. The direct effect (c’) was the association between obesity and diabetes after accounting for the mediator(s). The indirect effect, also referred to as the mediation effect, was calculated as a × b [34]. The 95% confidence interval (CI) for the indirect effect was estimated using bootstrapping [52,53]. A mediation effect was considered statistically significant (p < 0.05) if the 95% CI did not include zero [54]. The proportion mediated was calculated using the formula: Proportion mediated=a x b/(a x b + c’). This metric indicates the extent to which the tested mediator explains the effect of obesity on diabetes [34,55].
Additional analyses were performed by replacing obesity with body mass index (continuous) in the mediation models.
Triglycerides, body mass index, total cholesterol, and HDL cholesterol were natural log-transformed to improve data distribution prior to inclusion in regression and mediation models [56]. The null hypothesis was rejected for two-tailed p-values < 0.05. All statistical analyses were conducted using SPSS version 27.0 (IBM SPSS Statistics for Windows, Armonk, NY, IBM Corporation).
3. Results
3.1. General Characteristics
This study included 26,627 US adult participants, with a mean age of 48 years. Among these participants, 3958 individuals (14.9%) had diabetes, and 8425 individuals (31.6%) were obese. Compared to non-obese individuals, those with obesity had a higher prevalence of diabetes and hypertension, higher levels of triglycerides, higher levels of total cholesterol, higher levels of LDL cholesterol, lower levels of HDL cholesterol, and less physical activity (Table 2).
3.2. Association of Obesity with Diabetes Diagnosis
Obesity was associated with a 2.44-fold higher risk of diabetes (odds ratio, OR, 2.44; 95% CI, 2.25–2.65; p <0.001; Model 4, Table 3) after adjustment for risk factors except for the tested mediators (i.e., total cholesterol, HDL cholesterol, and triglycerides). After further adjustment for these tested mediators, obesity remained associated with a higher risk of diabetes (OR, 2.03; 95% CI, 1.87–2.21; p <0.001; Model 8, Table 3). This indicates that any mediation by total cholesterol, HDL cholesterol, or triglycerides is partial rather than complete [57].
3.3. Role of Circulating Lipids in Mediating the Effect of Obesity on Diabetes
The mediation coefficients of total cholesterol, HDL cholesterol, and triglycerides for the effect of obesity on diabetes are displayed in Figure 3, Figure 4 and Figure 5. When total cholesterol, HDL cholesterol, and triglycerides was added as single mediator in the mediation analysis (simple mediation), all of the three tested parameters were found to play a role in mediating the association between triglycerides and diabetes (Figure 3A), with triglycerides as the most dominant mediator (indirect effect coefficient, 0.18; 95% CI, 0.17–0.20; p <0.05) which accounted for 18% of the total effect of obesity on diabetes (Figure 3A).
When total cholesterol, HDL cholesterol, and triglycerides were included together as mediators in a parallel mediation model, all three continued to mediate the relationship between obesity and diabetes, both without adjustment (Figure 4A) and after adjusting for confounders (Figure 5A). After further adjustment for all the tested confounding factors, increases in triglycerides and reductions in HDL cholesterol mediated 24.0% and 3.8% of the total effect, respectively, whereas an increase in total cholesterol negatively mediated 2.3% of the total effect (Figure 5A).
3.4. Role of Circulating Lipids in Mediating the Effect of Body Mass Index on Diabetes
Further analyses were conducted when obesity was replaced with a continuous variable, i.e., body mass index (Figures 3B, 4B & 5B). After adjustment for all the tested confounders, the parallel mediation analysis showed that triglycerides remained the most dominant mediator among the three tested mediators, mediated 23.6% of the association between body mass index and diabetes, and total cholesterol remained to slightly and negatively mediate the association by 3.5% (Figure 5B). However, HDL cholesterol did not mediate the effect of body mass index on diabetes (Figure 5B, p >0.05)
3.5. Further Analyses of the Role of LDL Cholesterol in Mediating the Effect of Obesity (or Body Mass Index) on Diabetes
Further analyses were conducted in a sub-cohort of 23,517 participants after 3110 participants were excluded due to missing LDL cholesterol. After adjustment for all the tested confounders, an increase in LDL cholesterol negatively mediated 1% of the effect of obesity on diabetes, but this mediation effect was not significant (p >0.05, Figure 6). However, when obesity was replaced by the body mass index, an increase in LDL cholesterol negatively mediated 3% of the effect of body mass index on diabetes (p <0.05, Figure 6).
4. Discussion
Utilizing a large sample of US adults (n = 26,627), this study found that the increase in triglycerides and the decrease in HDL cholesterol mediated 24.0% (p < 0.05) and 3.8% (p < 0.05) of the pro-diabetic effect of obesity, respectively, after adjusting for tested confounders. In contrast, total cholesterol negatively mediated the effect by 2.3% (p < 0.05), and LDL cholesterol was not a significant mediator. These findings indicate that triglycerides are the most influential circulating lipid mediating the pro-diabetic effect of obesity.
Our analysis showed that total cholesterol negatively mediated the pro-diabetic effect of obesity by 2.3%, a small but statistically significant magnitude. LDL cholesterol showed a negative mediation of 1%, which was not statistically significant. However, when body mass index was used instead of obesity, LDL cholesterol significantly and negatively mediated the effect on diabetes, though the magnitude remained small (3.0%).
Overall, these results suggest that although obesity is associated with increased total and LDL cholesterol, these lipids do not play a major role in mediating its pro-diabetic effect. They may even provide slight protection against obesity-related diabetes risk. The mechanisms underlying these observations remain unclear. Nevertheless, our findings align with existing literature showing that lowering cholesterol and LDL cholesterol with statins slightly increases type 2 diabetes risk by approximately 10%–12% [58,59,60,61,62]. Statins reversibly and competitively inhibit HMG-CoA reductase, the rate-limiting enzyme in cholesterol biosynthesis [63], thereby reducing cholesterol production and circulating total cholesterol. Additionally, statin-induced reductions in intracellular cholesterol upregulate LDL receptors (LDLR) in the liver and peripheral tissues, enhancing LDL clearance and lowering circulating LDL cholesterol [62,64].
This study also found that HDL cholesterol mediated 3.8% of the effect of obesity on diabetes. Obesity was associated with decreased HDL cholesterol, consistent with previous reports [27,28,29]. This reduction contributed to increased diabetes risk, supporting evidence that HDL cholesterol protects against type 2 diabetes [65,66] through mechanisms such as stimulating pancreatic insulin synthesis and secretion [67] and enhancing skeletal muscle glucose uptake [68]. Similarly, treatment with cholesteryl ester transfer protein (CETP) inhibitors to raise HDL cholesterol improved glycemic control in patients with type 2 diabetes [69]. Notably, the reduction in HDL cholesterol played only a minor role (3.8%) in mediating the pro-diabetic effect of obesity, and this effect disappeared when body mass index replaced obesity in the analysis.
Triglycerides, unlike total cholesterol, LDL cholesterol, and HDL cholesterol, played a substantially greater role in mediating the pro-diabetic effect of obesity, accounting for 24% of the total effect. We observed that obesity was associated with elevated triglyceride levels, consistent with previous reports [24,26,70]. Furthermore, this increase in triglycerides was linked to a higher risk of diabetes, in agreement with existing literature [36,71,72]. Mechanistically, elevated circulating triglycerides promote intracellular triglyceride accumulation and reduce the capacity of cells to store excess glucose as triglycerides, thereby inducing insulin resistance [73]. In addition, high triglyceride levels contribute to β-cell dysfunction [74,75] and apoptosis [76], as well as increased hepatic gluconeogenesis [73,77,78]. Collectively, these mechanisms underscore the role of triglycerides in diabetes development.
The significance of triglycerides in mediating the pro-diabetic effect of obesity is further supported by evidence from bariatric surgery. Weight loss induced by bariatric surgery improves glycemic control and often leads to diabetes remission [79,80,81]. Notably, these improvements occur without significant changes in total cholesterol [79,81] or LDL cholesterol [80,81], reinforcing our observation that these lipids play only a minor role in mediating obesity’s pro-diabetic effect. Although bariatric surgery is frequently associated with increased HDL cholesterol [79,80], HDL cholesterol does not appear to be a major contributor to the anti-diabetic effect. For example, Genua et al. reported that blood glucose levels declined within three months post-surgery, while HDL cholesterol decreased during this period; although HDL cholesterol subsequently increased and remained elevated for up to five years, changes in body mass index were not associated with changes in HDL cholesterol [81].
In contrast, bariatric surgery consistently reduces circulating triglyceride levels [79,80,82,83]. This reduction parallels a decrease in intracellular triglyceride deposition in the liver and skeletal muscle [84]. These findings suggest that triglycerides may play a central role in mediating the anti-diabetic effects of weight loss, consistent with our observation that triglycerides accounted for 24% of the total effect of obesity.
Evidence from dietary energy restriction-induced weight loss further supports our findings. Lim et al. [85] reported that dietary energy restriction led to weight loss and reduced blood glucose levels within one week of intervention. However, at this time point, no changes in HDL cholesterol or LDL cholesterol were observed, suggesting that these lipids may not play a major role in mediating the antidiabetic effect of dietary energy restriction-induced weight loss—consistent with our results. In contrast, Lim et al. [88] found that the antidiabetic effect of dietary energy restriction-induced weight loss was accompanied by a reduction in circulating triglycerides. Moreover, a decline in intracellular triglyceride content in the pancreas was associated with restored insulin secretion, while a similar decline in the liver corresponded with reduced hepatic glucose production and lower fasting plasma glucose [85,86]. These findings suggest that lowering circulating triglycerides may contribute significantly to the antidiabetic effect of dietary energy restriction-induced weight loss.
Taken together, our results and evidence from weight-loss studies [79,80,81,82,83,84,85,86], support the notion that circulating triglycerides—rather than total cholesterol, HDL cholesterol, or LDL cholesterol—play a key role in mediating the pro-diabetic effect of obesity. Therefore, targeting circulating triglycerides may represent a promising therapeutic strategy to reduce obesity-induced diabetes risk.
Strengths of this study include its large sample size and adjustment for multiple confounding factors. However, the findings were based on US participants and may not be generalizable to other populations.
5. Conclusions
This study demonstrates that among circulating lipids, triglycerides play the central mediating role in the pro-diabetic effect of obesity. Consequently, targeting circulating triglycerides may be an underrecognized therapeutic approach for managing obesity-related diabetes
Author Contributions
Conceptualization, Y.W.; formal analysis, Y.W.; data curation, Y.W., Y.F.; writing—original draft preparation, Y.W., Y.F., F.J.C., G.R.D., C.G.S.; writing—review and editing, Y.W., Y.F., F.J.C., G.R.D., C.G.S.; visualization, Y.W.; funding acquisition, Y.W. All authors have read and agreed to the published version of the manuscript.
Funding
Y.W., G.R.D., and C.G.S. were supported by grants from the National Health and Medical Research Council of Australia (Y.W.: 1062671; G.R.D.: 2020452; G.G.S.: 2003156, 203760).
Institutional Review Board Statement
The study was conducted in accordance with the Declaration of Helsinki, and approved by the NHANES Institutional Review Board. Approval Code: NHANES Protocol #98–12, #2005–06, and #2011–17.
Informed Consent Statement
All participants provided written informed consent. The participants’ records were anonymized before being accessed by the author.
Data Availability Statement
All data in the current analysis are publicly available on the NHANES website (https://www.cdc.gov/nchs/nhanes/index.htm).
Conflicts of Interest
The author declares no conflicts of interest.
Abbreviations
The following abbreviations are used in this manuscript:
| BMI | Body mass index |
| CDC | Centers for Disease Control and Prevention |
| CETP | Cholesteryl ester transfer protein |
| CI | Confidence interval |
| DM | Diabetes |
| HbA1c | Hemoglobin A1c |
| HDL | High-density lipoprotein |
| HDL-C | High-density lipoprotein cholesterol |
| HSDA | N-(2-hydroxy-3-sulfopropyl)-3,5-dimethoxyaniline |
| IQR | Interquartile range |
| LDL | Low-density lipoprotein |
| LDL-C | Low-density lipoprotein cholesterol |
| LDLR | LDL receptor |
| n | Number; |
| NA | Not applicable |
| NCHS | National Center for Health Statistics |
| NHANES | National Health and Nutrition Examination Survey |
| OR | Odds ratio |
| PEG | Polyethylene glycol |
| SD | Standard deviation |
| TC | Total cholesterol |
| TG | Triglyceride |
| VLDL | Very low-density lipoprotein |
| WHO | World Health Organization |
References
- Lingvay, I.; Cohen, R.V.; Roux, C.W.L.; Sumithran, P. Obesity in adults. Lancet 2024, 404, 972-987. [CrossRef]
- Ng, M.; Gakidou, E.; Lo, J.; Abate, Y.H.; Abbafati, C.; Abbas, N.; Abbasian, M.; Abd ElHafeez, S.; Abdel-Rahman, W.M.; Abd-Elsalam, S.; et al. Global, regional, and national prevalence of adult overweight and obesity, 1990–2021, with forecasts to 2050: a forecasting study for the Global Burden of Disease Study 2021. The Lancet 2025, 405, 813-838. [CrossRef]
- World Health Organization. Obesity: preventing and managing the global epidemic. Report of a WHO consultation. World Health Organ. Tech. Rep. Ser. 2000, 894, 1-253.
- World Health Organization. Obesity and overweight. Available at https://www.who.int/news-room/fact-sheets/detail/obesity-and-overweight. Accessed on 14 October 2025.
- House of Commons Library. Obesity statistics. Available at https://commonslibrary.parliament.uk/research-briefings/sn03336/. Accessed on 15 October 2025.
- Public Health Agency of Canada. Obesity Statistics in Canada: Report. Available at https://www.canada.ca/en/public-health/services/publications/healthy-living/obesity-statistics-canada.html#a6. Accessed on 15 October 2025.
- Australian Institute of Health and Welfare. Overweight and obesity. Available at https://www.aihw.gov.au/reports/overweight-obesity/overweight-and-obesity/contents/summary. Accessed on 14 October 2025.
- Stierman, B.; Afful, J.; Carroll, M.D.; Chen, T.-C.; Davy, O.; Fink, S.; Fryar, C.D.; Gu, Q.; Hales, C.M.; Hughes, J.P. National Health and Nutrition Examination Survey 2017-March 2020 prepandemic data files-development of files and prevalence estimates for selected health outcomes. National health statistics reports 2021, number 158. [CrossRef]
- Buckell, J.; Mei, X.W.; Clarke, P.; Aveyard, P.; Jebb, S.A. Weight loss interventions on health-related quality of life in those with moderate to severe obesity: Findings from an individual patient data meta-analysis of randomized trials. Obes. Rev. 2021, 22, e13317. [CrossRef]
- Ul-Haq, Z.; Mackay, D.F.; Fenwick, E.; Pell, J.P. Meta-analysis of the association between body mass index and health-related quality of life among adults, assessed by the SF-36. Obesity (Silver Spring) 2013, 21, E322-327. [CrossRef]
- Luppino, F.S.; de Wit, L.M.; Bouvy, P.F.; Stijnen, T.; Cuijpers, P.; Penninx, B.W.; Zitman, F.G. Overweight, obesity, and depression: a systematic review and meta-analysis of longitudinal studies. Arch. Gen. Psychiatry 2010, 67, 220-229. [CrossRef]
- Nedunchezhiyan, U.; Varughese, I.; Sun, A.R.; Wu, X.; Crawford, R.; Prasadam, I. Obesity, Inflammation, and Immune System in Osteoarthritis. Front. Immunol. 2022, 13, 907750. [CrossRef]
- Pipitone, R.M.; Ciccioli, C.; Infantino, G.; La Mantia, C.; Parisi, S.; Tulone, A.; Pennisi, G.; Grimaudo, S.; Petta, S. MAFLD: a multisystem disease. Ther. Adv. Endocrinol. Metab. 2023, 14, 20420188221145549. [CrossRef]
- Centers for Disease Control and Prevention. Obesity and Cancer. Available at https://www.cdc.gov/cancer/risk-factors/obesity.html#:~:text=Overweight%20and%20obesity%20can%20cause,longer%20a%20person%20is%20overweight. Accessed on 15 October 2025.
- Onstad, M.A.; Schmandt, R.E.; Lu, K.H. Addressing the Role of Obesity in Endometrial Cancer Risk, Prevention, and Treatment. J. Clin. Oncol. 2016, 34, 4225-4230. [CrossRef]
- Klein, S.; Gastaldelli, A.; Yki-Järvinen, H.; Scherer, P.E. Why does obesity cause diabetes? Cell Metab. 2022, 34, 11-20. [CrossRef]
- Hossain, M.J.; Al-Mamun, M.; Islam, M.R. Diabetes mellitus, the fastest growing global public health concern: Early detection should be focused. Health Sci Rep 2024, 7, e2004. [CrossRef]
- Klonoff, D.C. The increasing incidence of diabetes in the 21st century. J. Diabetes Sci. Technol. 2009, 3, 1-2. [CrossRef]
- World Health Organization. Diabetes. Available at https://www.who.int/news-room/fact-sheets/detail/diabetes. Accessed on 18 October 2025.
- World Obesity Federation. Obesity and Type 2 Diabetes: a Joint Approach to Halt the Rise. Available at https://www.worldobesity.org/news/idf-and-wof-release-new-policy-brief-to-address-obesity-and-type-2-diabetes. Accessed on 15 October 2025.
- International Diabetes Federation. Diabetes facts and figures. Available at https://idf.org/about-diabetes/diabetes-facts-figures/. Accessed on 1 October 2025.
- Wondmkun, Y.T. Obesity, Insulin Resistance, and Type 2 Diabetes: Associations and Therapeutic Implications. Diabetes Metab. Syndr. Obes. 2020, 13, 3611-3616. [CrossRef]
- Ruze, R.; Liu, T.; Zou, X.; Song, J.; Chen, Y.; Xu, R.; Yin, X.; Xu, Q. Obesity and type 2 diabetes mellitus: connections in epidemiology, pathogenesis, and treatments. Front. Endocrinol. (Lausanne) 2023, 14, 1161521. [CrossRef]
- Shamai, L.; Lurix, E.; Shen, M.; Novaro, G.M.; Szomstein, S.; Rosenthal, R.; Hernandez, A.V.; Asher, C.R. Association of body mass index and lipid profiles: evaluation of a broad spectrum of body mass index patients including the morbidly obese. Obes. Surg. 2011, 21, 42-47. [CrossRef]
- Denke, M.A.; Sempos, C.T.; Grundy, S.M. Excess body weight. An under-recognized contributor to dyslipidemia in white American women. Arch. Intern. Med. 1994, 154, 401-410. [CrossRef]
- Klop, B.; Elte, J.W.; Cabezas, M.C. Dyslipidemia in obesity: mechanisms and potential targets. Nutrients 2013, 5, 1218-1240. [CrossRef]
- Feingold, K.R. Obesity and Dyslipidemia; MDText.com, Inc.: South Dartmouth (MA). Available from: https://www.ncbi.nlm.nih.gov/books/NBK305895/, 2000.
- Bays, H.E.; Toth, P.P.; Kris-Etherton, P.M.; Abate, N.; Aronne, L.J.; Brown, W.V.; Gonzalez-Campoy, J.M.; Jones, S.R.; Kumar, R.; La Forge, R.; et al. Obesity, adiposity, and dyslipidemia: a consensus statement from the National Lipid Association. J. Clin. Lipidol. 2013, 7, 304-383. [CrossRef]
- Oda, E. LDL cholesterol was more strongly associated with percent body fat than body mass index and waist circumference in a health screening population. Obes. Res. Clin. Pract. 2018, 12, 195-203. [CrossRef]
- Bays, H.E.; Chapman, R.H.; Grandy, S. The relationship of body mass index to diabetes mellitus, hypertension and dyslipidaemia: comparison of data from two national surveys. Int. J. Clin. Pract. 2007, 61, 737-747. [CrossRef]
- Zipf, G.; Chiappa, M.; Porter, K.S.; Ostchega, Y.; Lewis, B.G.; Dostal, J. National Health and Nutrition Examination Survey: Plan and operations, 1999–2010. National Center for Health Statistics. Vital Health Stat. 1 2013, 56, 1-37.
- Garvey, W.T.; Mechanick, J.I.; Brett, E.M.; Garber, A.J.; Hurley, D.L.; Jastreboff, A.M.; Nadolsky, K.; Pessah-Pollack, R.; Plodkowski, R. American Association of Clinical Endocrinologists and American College of Endocrinology Comprehensive Clinical Practice Guidelines for Medical Care of Patients with Obesity. Endocr. Pract. 2016, 22, 842-884. [CrossRef]
- Chauvin, S. Role of Granulosa Cell Dysfunction in Women Infertility Associated with Polycystic Ovary Syndrome and Obesity. Biomolecules 2025, 15, 923.
- Wang, Y.; Fang, Y.; Vrablik, M. Homeostasis Model Assessment for Insulin Resistance Mediates the Positive Association of Triglycerides with Diabetes. Diagnostics 2024, 14, 733. [CrossRef]
- American Diabetes Association. Classification and Diagnosis of Diabetes: Standards of Medical Care in Diabetes-2019. Diabetes Care 2019, 42, S13-s28. [CrossRef]
- Wang, Y. Higher fasting triglyceride predicts higher risks of diabetes mortality in US adults. Lipids Health Dis. 2021, 20, 181. [CrossRef]
- American Diabetes Association. 2. Classification and Diagnosis of Diabetes: Standards of Medical Care in Diabetes—2021. Diabetes Care 2021, 44, S15-S33. [CrossRef]
- Lipid Laboratory Johns Hopkins. Total Cholesterol. Laboratory Procedure Manual. NHANES 2005-2006. Available from: https://wwwn.cdc.gov/nchs/data/nhanes/public/2005/labmethods/tchol_d_met_h717.pdf. Access on 1 October 2025.
- Lipid Laboratory Johns Hopkins. HDL- Cholesterol. Laboratory Procedure Manual. NHANES 2005-2006. Available from: https://wwwn.cdc.gov/nchs/data/nhanes/public/2005/labmethods/hdl_d_met_cholesterol_hdl_h717.pdf. Access on 1 October 2025.
- Lipid Laboratory Johns Hopkins. Triglycerides. Laboratory Procedure Manual. NHANES 2005-2006. Available from: https://wwwn.cdc.gov/nchs/data/nhanes/2005-2006/labmethods/trigly_d_met_triglyceride_h717.pdf. Access on 1 October 2025.
- NHANES. Cholesterol - LDL & Triglycerides. Available from https://wwwn.cdc.gov/Nchs/Nhanes/2009-2010/TRIGLY_F.htm. Accessed on 1 March 2025.
- Friedewald, W.T.; Levy, R.I.; Fredrickson, D.S. Estimation of the concentration of low-density lipoprotein cholesterol in plasma, without use of the preparative ultracentrifuge. Clin. Chem. 1972, 18, 499-502.
- Wang, Y.; Fang, Y.; Witting, P.K.; Charchar, F.J.; Sobey, C.G.; Drummond, G.R.; Golledge, J. Dietary fatty acids and mortality risk from heart disease in US adults: an analysis based on NHANES. Sci. Rep. 2023, 13, 1614. [CrossRef]
- Wang, Y.; Fang, Y.; Magliano, D.J.; Charchar, F.J.; Sobey, C.G.; Drummond, G.R.; Golledge, J. Fasting triglycerides are positively associated with cardiovascular mortality risk in people with diabetes. Cardiovasc. Res. 2023, 119, 826–834. [CrossRef]
- Wang, Y.; Fang, Y.; Aberson, C.L.; Charchar, F.J.; Ceriello, A. Postprandial Plasma Glucose between 4 and 7.9 h May Be a Potential Diagnostic Marker for Diabetes. Biomedicines 2024, 12, 1313.
- Wang, Y.; Zhang, W.; Qian, T.; Sun, H.; Xu, Q.; Hou, X.; Hu, W.; Zhang, G.; Drummond, G.R.; Sobey, C.G.; et al. Reduced renal function may explain the higher prevalence of hyperuricemia in older people. Sci. Rep. 2021, 11, 1302. [CrossRef]
- Wang, Y. Stage 1 hypertension and risk of cardiovascular disease mortality in United States adults with or without diabetes. J. Hypertens. 2022, 40, 794–803. [CrossRef]
- Qian, T.; Sun, H.; Xu, Q.; Hou, X.; Hu, W.; Zhang, G.; Drummond, G.R.; Sobey, C.G.; Charchar, F.J.; Golledge, J.; et al. Hyperuricemia is independently associated with hypertension in men under 60 years in a general Chinese population. J. Hum. Hypertens. 2021, 35, 1020-1028, doi:doi:10.1038/s41371-020-00455-7.
- Cheng, W.; Wen, S.; Wang, Y.; Qian, Z.; Tan, Y.; Li, H.; Hou, Y.; Hu, H.; Golledge, J.; Yang, G. The association between serum uric acid and blood pressure in different age groups in a healthy Chinese cohort. Medicine (Baltimore) 2017, 96, e8953. [CrossRef]
- Preacher, K.J.; Hayes, A.F. Asymptotic and resampling strategies for assessing and comparing indirect effects in multiple mediator models. Behav. Res. Methods 2008, 40, 879-891. [CrossRef]
- Hayes, A.F. The PROCESS macro for SPSS, SAS, and R. Available from https://processmacro.org/index.html. Accessed on 21 July 2025.
- DiCiccio, T.J.; Efron, B. Bootstrap confidence intervals. Statistical Science 1996, 11, 189-228. [CrossRef]
- Li, L.; Zhong, H.Y.; Xiao, T.; Xiao, R.H.; Yang, J.; Li, Y.L.; Yao, Q.; Chen, X.J. Association between self-disclosure and benefit finding of Chinese cancer patients caregivers: the mediation effect of coping styles. Support. Care Cancer 2023, 31, 684. [CrossRef]
- Soares, M.J.; Calton, E.K.; Pathak, K.; Zhao, Y. Hypothesized pathways for the association of vitamin D status and insulin sensitivity with resting energy expenditure: a cross sectional mediation analysis in Australian adults of European ancestry. Eur. J. Clin. Nutr. 2022, 76, 1457-1463. [CrossRef]
- Ananth, C. Proportion mediated in a causal mediation analysis: how useful is this measure? BJOG 2019, 126, 983-983. [CrossRef]
- Wang, Y. Definition, prevalence, and risk factors of low sex hormone-binding globulin in US adults. J. Clin. Endocrinol. Metab. 2021, 106, e3946–e3956. [CrossRef]
- Gunzler, D.; Chen, T.; Wu, P.; Zhang, H. Introduction to mediation analysis with structural equation modeling. Shanghai Arch Psychiatry 2013, 25, 390-394. [CrossRef]
- Betteridge, D.J.; Carmena, R. The diabetogenic action of statins — mechanisms and clinical implications. Nature Reviews Endocrinology 2016, 12, 99-110. [CrossRef]
- Carter, A.A.; Gomes, T.; Camacho, X.; Juurlink, D.N.; Shah, B.R.; Mamdani, M.M. Risk of incident diabetes among patients treated with statins: population based study. BMJ 2013, 346, f2610. [CrossRef]
- Wang, S.; Cai, R.; Yuan, Y.; Varghese, Z.; Moorhead, J.; Ruan, X.Z. Association between reductions in low-density lipoprotein cholesterol with statin therapy and the risk of new-onset diabetes: a meta-analysis. Sci. Rep. 2017, 7, 39982. [CrossRef]
- Zaharan, N.L.; Williams, D.; Bennett, K. Statins and risk of treated incident diabetes in a primary care population. Br. J. Clin. Pharmacol. 2013, 75, 1118-1124. [CrossRef]
- Galicia-Garcia, U.; Jebari, S.; Larrea-Sebal, A.; Uribe, K.B.; Siddiqi, H.; Ostolaza, H.; Benito-Vicente, A.; Martín, C. Statin Treatment-Induced Development of Type 2 Diabetes: From Clinical Evidence to Mechanistic Insights. Int. J. Mol. Sci. 2020, 21. [CrossRef]
- Endo, A. A gift from nature: the birth of the statins. Nat. Med. 2008, 14, 1050-1052. [CrossRef]
- Endo, A. A historical perspective on the discovery of statins. Proc. Jpn. Acad. Ser. B Phys. Biol. Sci. 2010, 86, 484-493. [CrossRef]
- Femlak, M.; Gluba-Brzózka, A.; Ciałkowska-Rysz, A.; Rysz, J. The role and function of HDL in patients with diabetes mellitus and the related cardiovascular risk. Lipids Health Dis. 2017, 16, 207. [CrossRef]
- Barter, P.J. High Density Lipoprotein: A Therapeutic Target in Type 2 Diabetes. Endocrinol Metab 2013, 28, 169-177. [CrossRef]
- Fryirs, M.A.; Barter, P.J.; Appavoo, M.; Tuch, B.E.; Tabet, F.; Heather, A.K.; Rye, K.A. Effects of high-density lipoproteins on pancreatic beta-cell insulin secretion. Arterioscler. Thromb. Vasc. Biol. 2010, 30, 1642-1648. [CrossRef]
- Drew, B.G.; Duffy, S.J.; Formosa, M.F.; Natoli, A.K.; Henstridge, D.C.; Penfold, S.A.; Thomas, W.G.; Mukhamedova, N.; de Courten, B.; Forbes, J.M.; et al. High-density lipoprotein modulates glucose metabolism in patients with type 2 diabetes mellitus. Circulation 2009, 119, 2103-2111. [CrossRef]
- Barter, P.J.; Rye, K.A.; Tardif, J.C.; Waters, D.D.; Boekholdt, S.M.; Breazna, A.; Kastelein, J.J. Effect of torcetrapib on glucose, insulin, and hemoglobin A1c in subjects in the Investigation of Lipid Level Management to Understand its Impact in Atherosclerotic Events (ILLUMINATE) trial. Circulation 2011, 124, 555-562. [CrossRef]
- Hollister, L.E.; Overall, J.E.; Snow, H.L. Relationship of Obesity to Serum Triglyceride, Cholesterol, and Uric Acid, and to Plasma-Glucose Levels1. The American Journal of Clinical Nutrition 1967, 20, 777-782. [CrossRef]
- Wang, Y.; Fang, Y.; Zhang, X.; Wu, N.-Q. Non-Fasting Plasma Triglycerides Are Positively Associated with Diabetes Mortality in a Representative US Adult Population. Targets 2024, 2, 93-103. [CrossRef]
- Wilson, P.W.; Meigs, J.B.; Sullivan, L.; Fox, C.S.; Nathan, D.M.; D'Agostino, R.B., Sr. Prediction of incident diabetes mellitus in middle-aged adults: the Framingham Offspring Study. Arch. Intern. Med. 2007, 167, 1068-1074. [CrossRef]
- Wang, Y. Triglycerides, Glucose Metabolism, and Type 2 Diabetes. Int. J. Mol. Sci. 2025, 26, 9910. [CrossRef]
- Terauchi, Y.; Takamoto, I.; Kubota, N.; Matsui, J.; Suzuki, R.; Komeda, K.; Hara, A.; Toyoda, Y.; Miwa, I.; Aizawa, S.; et al. Glucokinase and IRS-2 are required for compensatory β cell hyperplasia in response to high-fat diet–induced insulin resistance. The Journal of Clinical Investigation 2007, 117, 246-257. [CrossRef]
- Boden, G.; Chen, X.; Rosner, J.; Barton, M. Effects of a 48-h Fat Infusion on Insulin Secretion and Glucose Utilization. Diabetes 1995, 44, 1239-1242. [CrossRef]
- Cunha, D.A.; Hekerman, P.; Ladrière, L.; Bazarra-Castro, A.; Ortis, F.; Wakeham, M.C.; Moore, F.; Rasschaert, J.; Cardozo, A.K.; Bellomo, E.; et al. Initiation and execution of lipotoxic ER stress in pancreatic β-cells. J. Cell Sci. 2008, 121, 2308-2318. [CrossRef]
- Weinman, E.O.; Strisower, E.H.; Chaikoff, I.L. Conversion of Fatty Acids to Carbohydrate: Application of Isotopes to this Problem and Role of the Krebs Cycle as a Synthetic Pathway. Physiol. Rev. 1957, 37, 252-272. [CrossRef]
- Borrebaek, B.; Bremer, J.; Davis, E.J.; Thienen, W.D.V.-v.; Singh, B. The effect of glucagon on the carbon flux from palmitate into glucose, lactate and ketone bodies, studied with isolated hepatocytes. Int. J. Biochem. 1984, 16, 841-844. [CrossRef]
- Dixon, J.B.; O’Brien, P.E.; Playfair, J.; Chapman, L.; Schachter, L.M.; Skinner, S.; Proietto, J.; Bailey, M.; Anderson, M. Adjustable Gastric Banding and Conventional Therapy for Type 2 DiabetesA Randomized Controlled Trial. JAMA 2008, 299, 316-323. [CrossRef]
- Kirwan, J.P.; Courcoulas, A.P.; Cummings, D.E.; Goldfine, A.B.; Kashyap, S.R.; Simonson, D.C.; Arterburn, D.E.; Gourash, W.F.; Vernon, A.H.; Jakicic, J.M.; et al. Diabetes Remission in the Alliance of Randomized Trials of Medicine Versus Metabolic Surgery in Type 2 Diabetes (ARMMS-T2D). Diabetes Care 2022, 45, 1574-1583. [CrossRef]
- Genua, I.; Ramos, A.; Caimari, F.; Balagué, C.; Sánchez-Quesada, J.L.; Pérez, A.; Miñambres, I. Effects of Bariatric Surgery on HDL Cholesterol. Obes. Surg. 2020, 30, 1793-1798. [CrossRef]
- Sjöström, L.; Lindroos, A.-K.; Peltonen, M.; Torgerson, J.; Bouchard, C.; Carlsson, B.; Dahlgren, S.; Larsson, B.; Narbro, K.; Sjöström Carl, D.; et al. Lifestyle, Diabetes, and Cardiovascular Risk Factors 10 Years after Bariatric Surgery. N. Engl. J. Med. 351, 2683-2693. [CrossRef]
- Heffron, S.P.; Lin, B.-X.; Parikh, M.; Scolaro, B.; Adelman, S.J.; Collins, H.L.; Berger, J.S.; Fisher, E.A. Changes in High-Density Lipoprotein Cholesterol Efflux Capacity After Bariatric Surgery Are Procedure Dependent. Arterioscler. Thromb. Vasc. Biol. 2018, 38, 245-254. [CrossRef]
- Kawano, Y.; Ohta, M.; Hirashita, T.; Masuda, T.; Inomata, M.; Kitano, S. Effects of Sleeve Gastrectomy on Lipid Metabolism in an Obese Diabetic Rat Model. Obes. Surg. 2013, 23, 1947-1956. [CrossRef]
- Lim, E.L.; Hollingsworth, K.G.; Aribisala, B.S.; Chen, M.J.; Mathers, J.C.; Taylor, R. Reversal of type 2 diabetes: normalisation of beta cell function in association with decreased pancreas and liver triacylglycerol. Diabetologia 2011, 54, 2506-2514. [CrossRef]
- Taylor, R. Type 2 Diabetes: Etiology and reversibility. Diabetes Care 2013, 36, 1047-1055. [CrossRef]
Figure 1.
Flow diagram of the study participants. HDL, high-density lipoprotein; LDL, low-density lipoprotein; NHANES, National Health and Nutrition Examination Survey.
Figure 1.
Flow diagram of the study participants. HDL, high-density lipoprotein; LDL, low-density lipoprotein; NHANES, National Health and Nutrition Examination Survey.
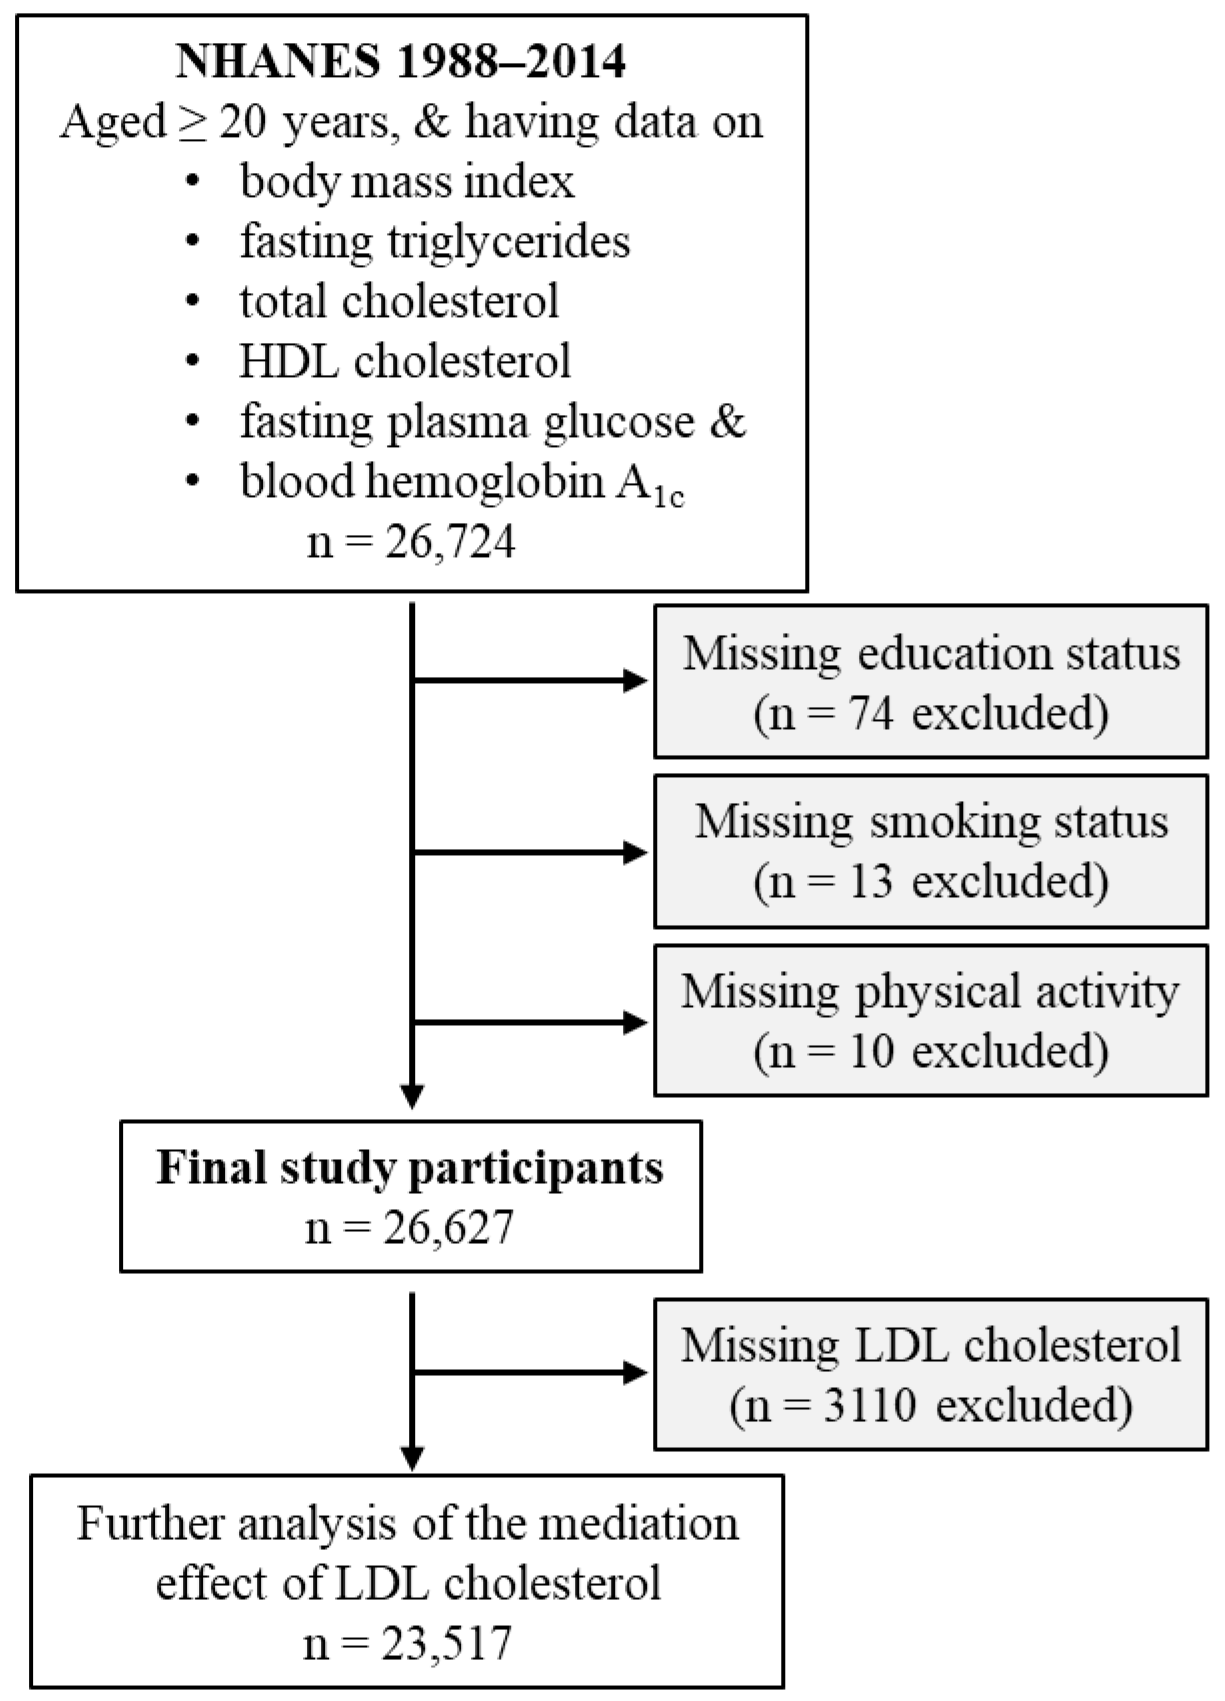
Figure 2.
Mediation analysis models. A, Simple mediation. Total cholesterol, HDL cholesterol, or triglyceride was added as single mediator between obesity and diabetes. B, Parallel mediation. In this analysis, total cholesterol, HDL cholesterol, and triglycerides were added simultaneously to assess their mediation effects between obesity and diabetes. a, association coefficient between obesity and the tested mediator; b, association coefficient between the tested mediator and diabetes; c’, also known as direct effect, referring to the association coefficient between obesity and diabetes in the presence of the tested mediator (simple mediation) or mediators (parallel mediation). DM, diabetes; HDL-C, high-density lipoprotein cholesterol; TC, total cholesterol; TG, triglycerides.
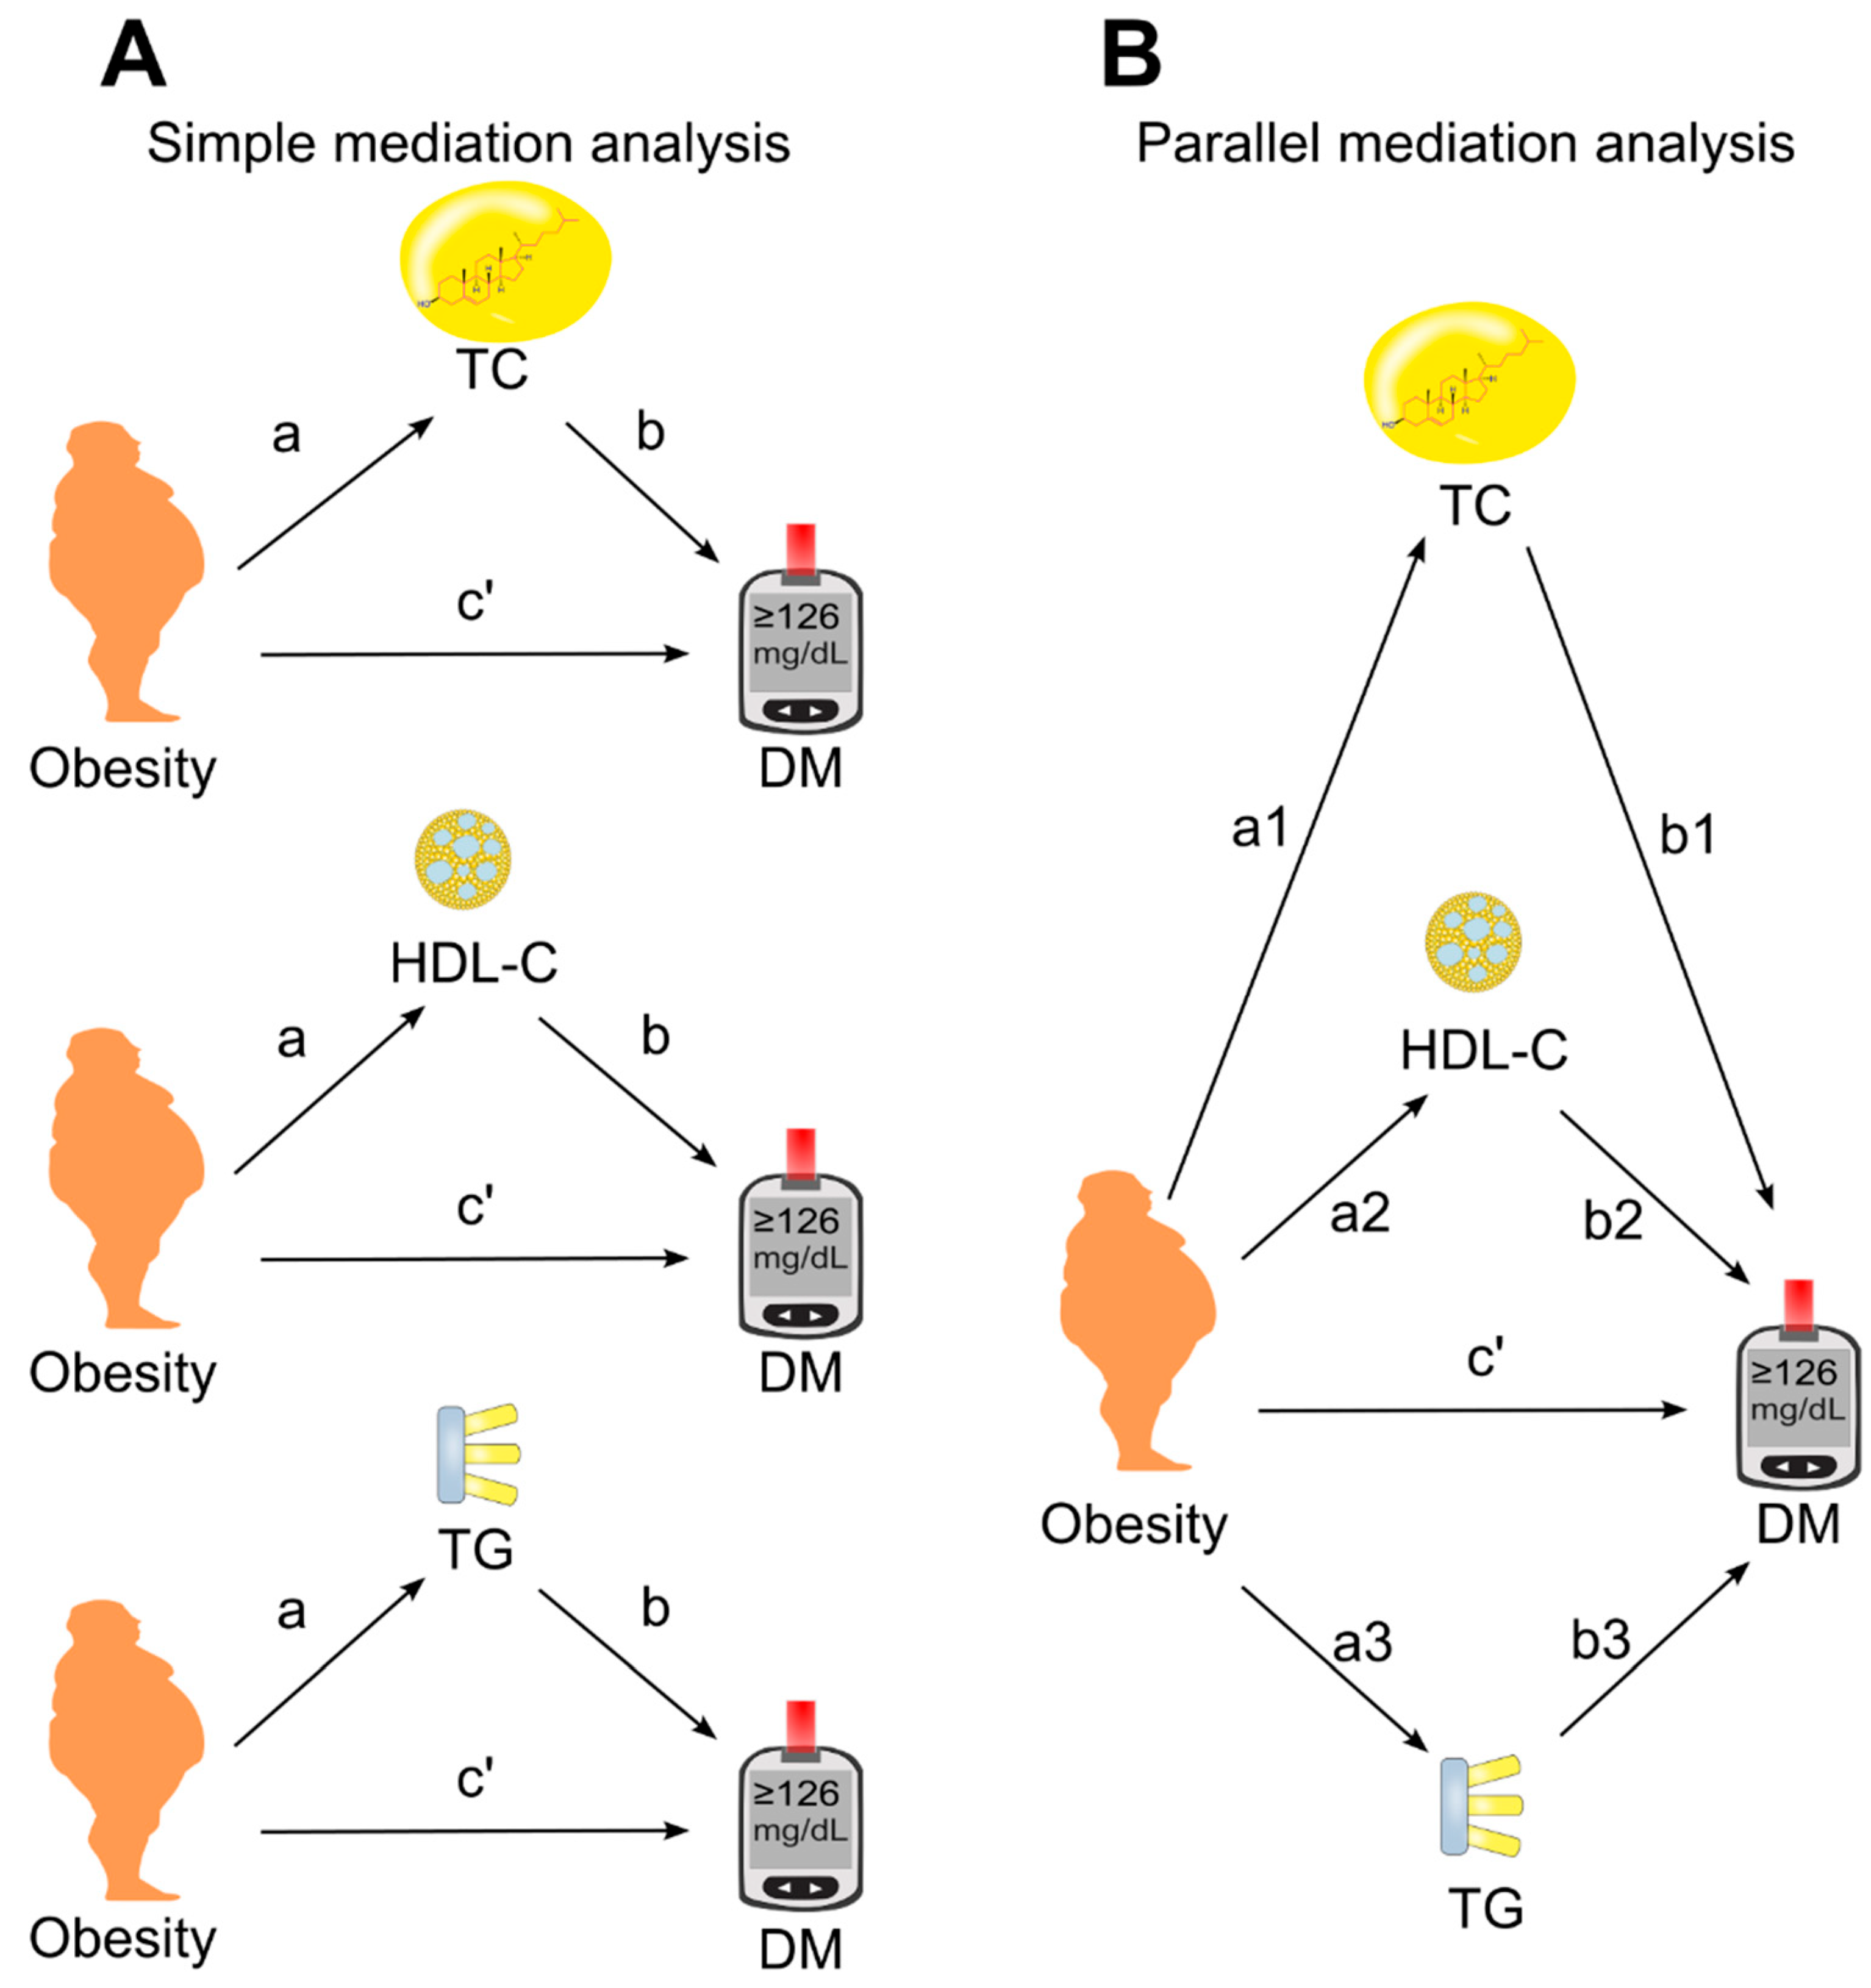
Figure 3.
Simple mediation analysis. Total cholesterol, HDL cholesterol, or triglyceride was added as single mediator for the effect of obesity or BMI on diabetes. a, association coefficient between obesity and the tested mediator or between BMI and the tested mediator; b, association coefficient between the tested mediator and diabetes; c’, association coefficient between obesity and diabetes or between BMI and diabetes in the presence of the tested mediator. BMI, body mass index; CI, confidence interval; DM, diabetes; HDL-C, high-density lipoprotein cholesterol; TC, total cholesterol; TG, triglycerides. Green tick=yes.
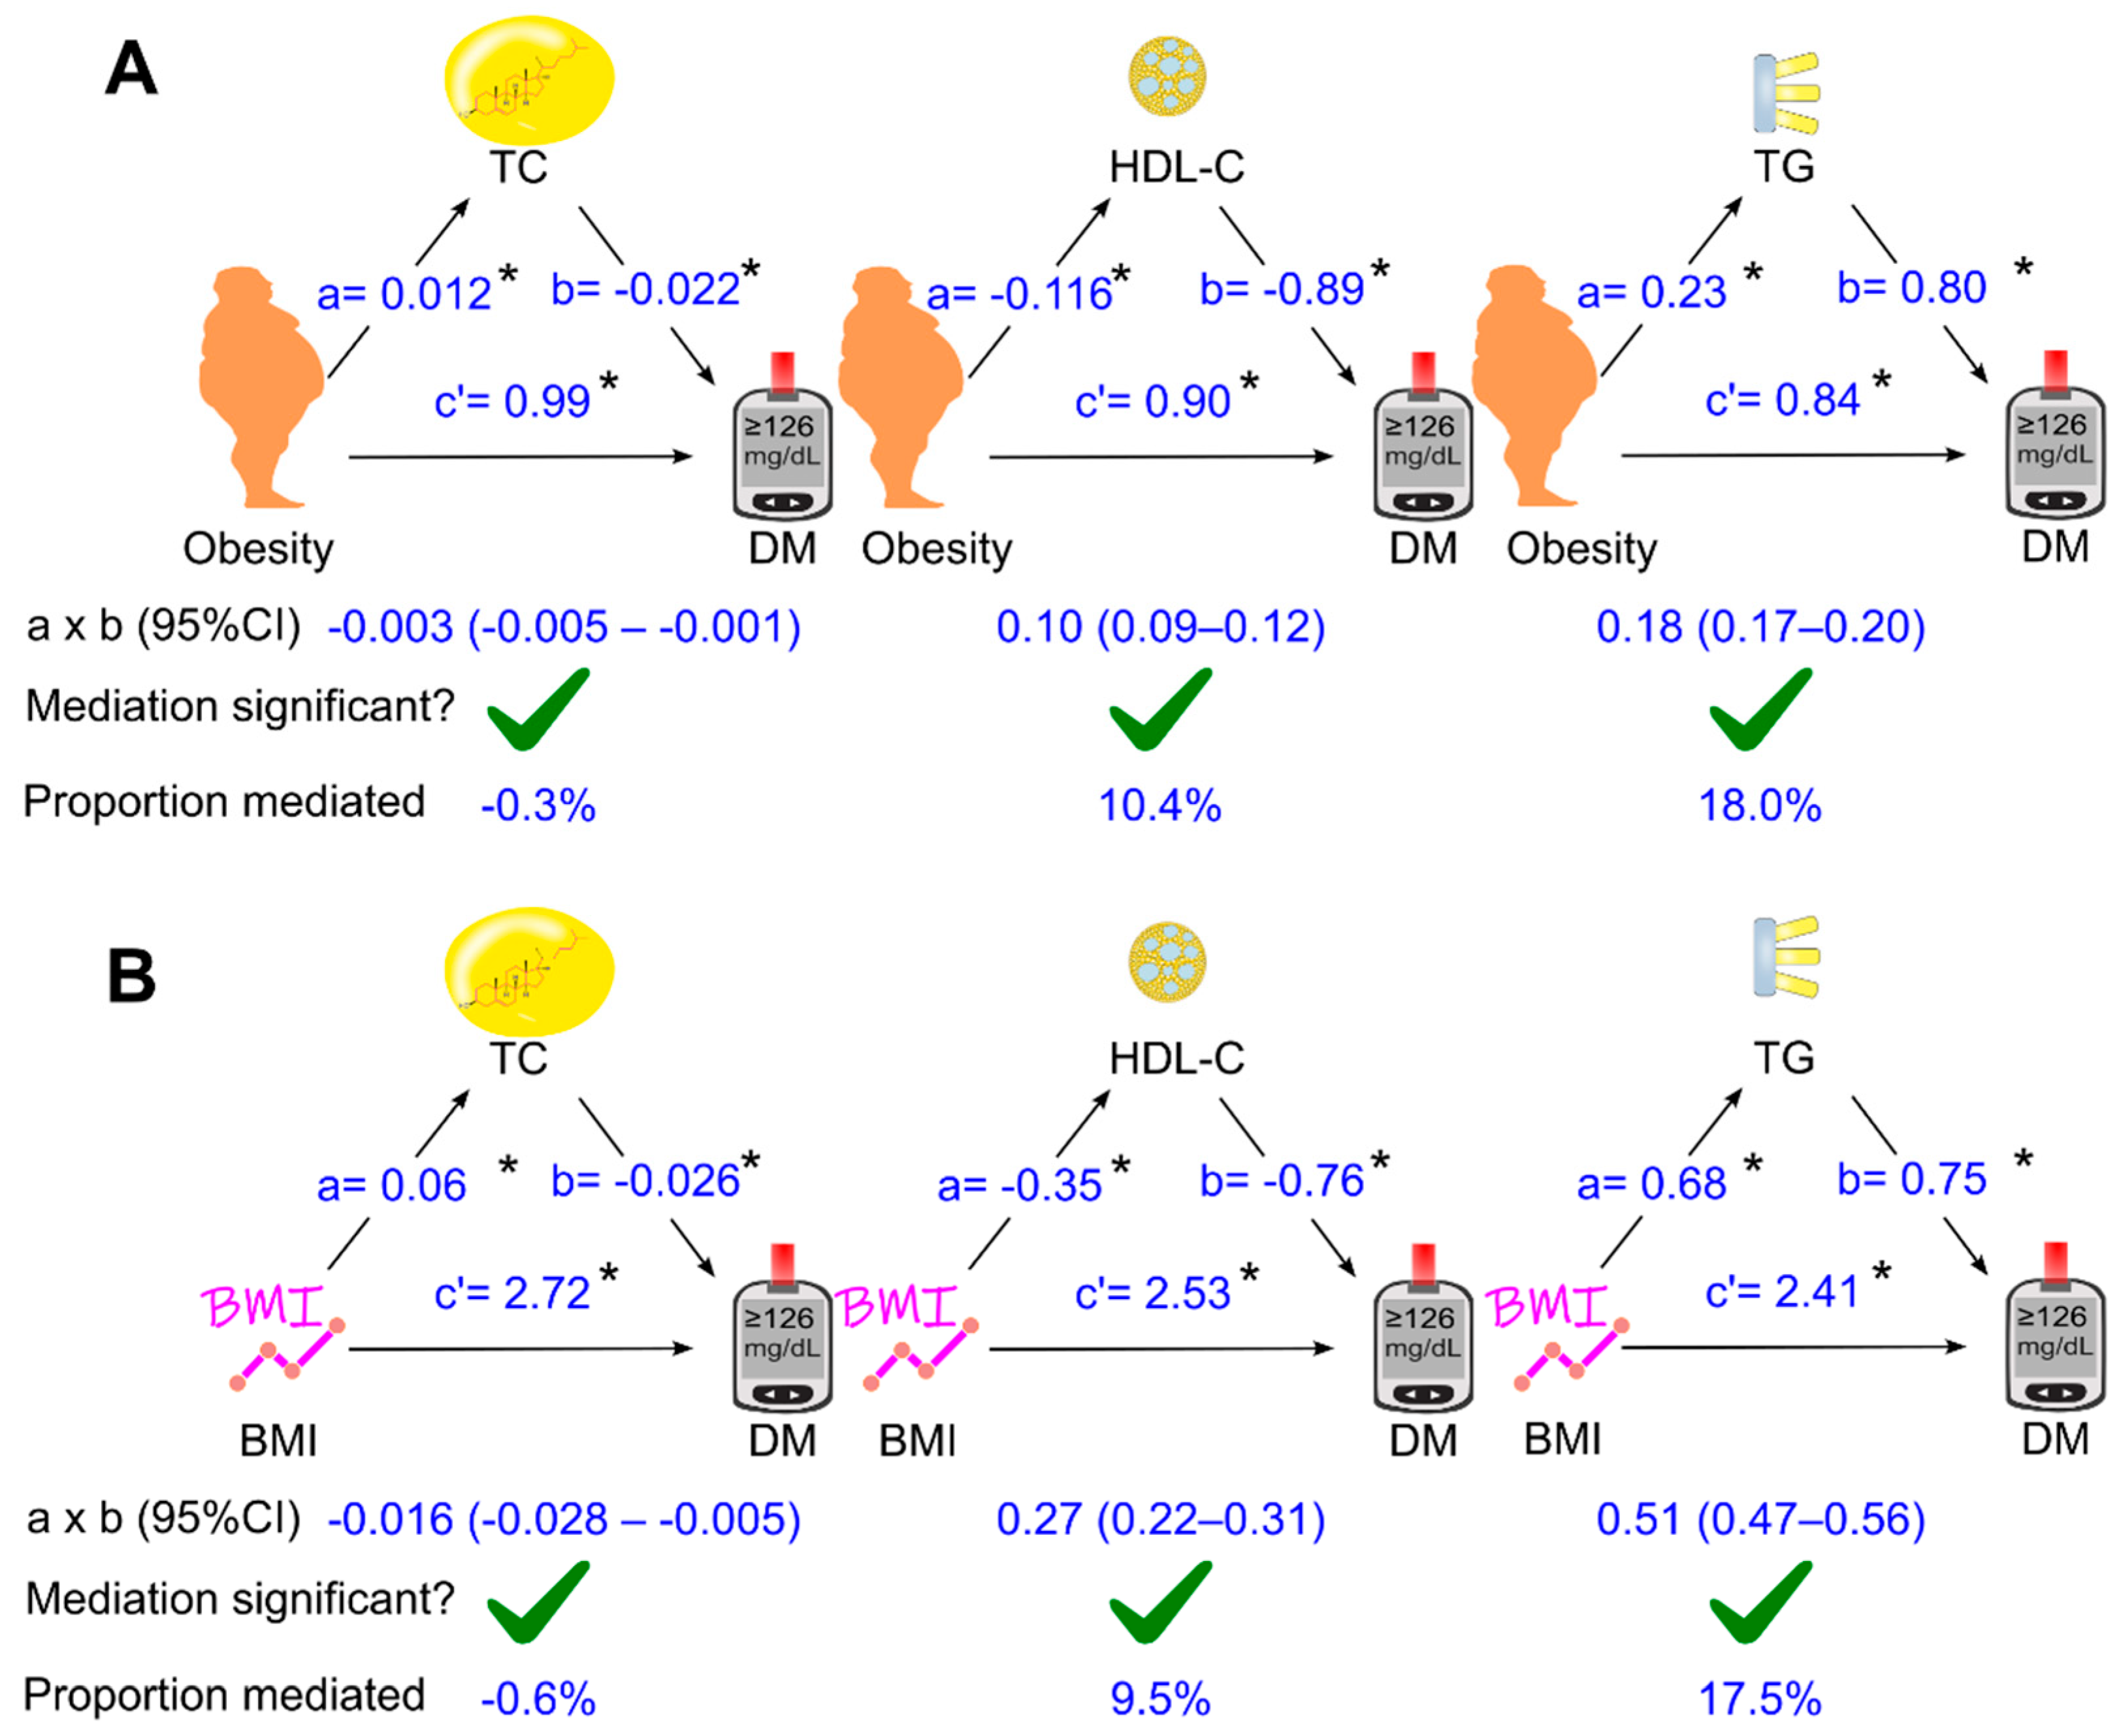
Figure 4.
Unadjusted parallel mediation analysis. Total cholesterol, HDL cholesterol, and triglycerides were added as parallel mediators for the effect of obesity (or BMI as continuous variable) on diabetes without adjustment for confounding factors. a, association coefficient between obesity and the tested mediator or between BMI and the teste mediator; b, association coefficient between the tested mediator and diabetes; c’, association coefficient between obesity and diabetes or between BMI and diabetes. BMI, body mass index; CI, confidence interval; DM, diabetes; HDL-C, high-density lipoprotein cholesterol; TC, total cholesterol; TG, triglycerides. Green tick = yes. Red cross = no.
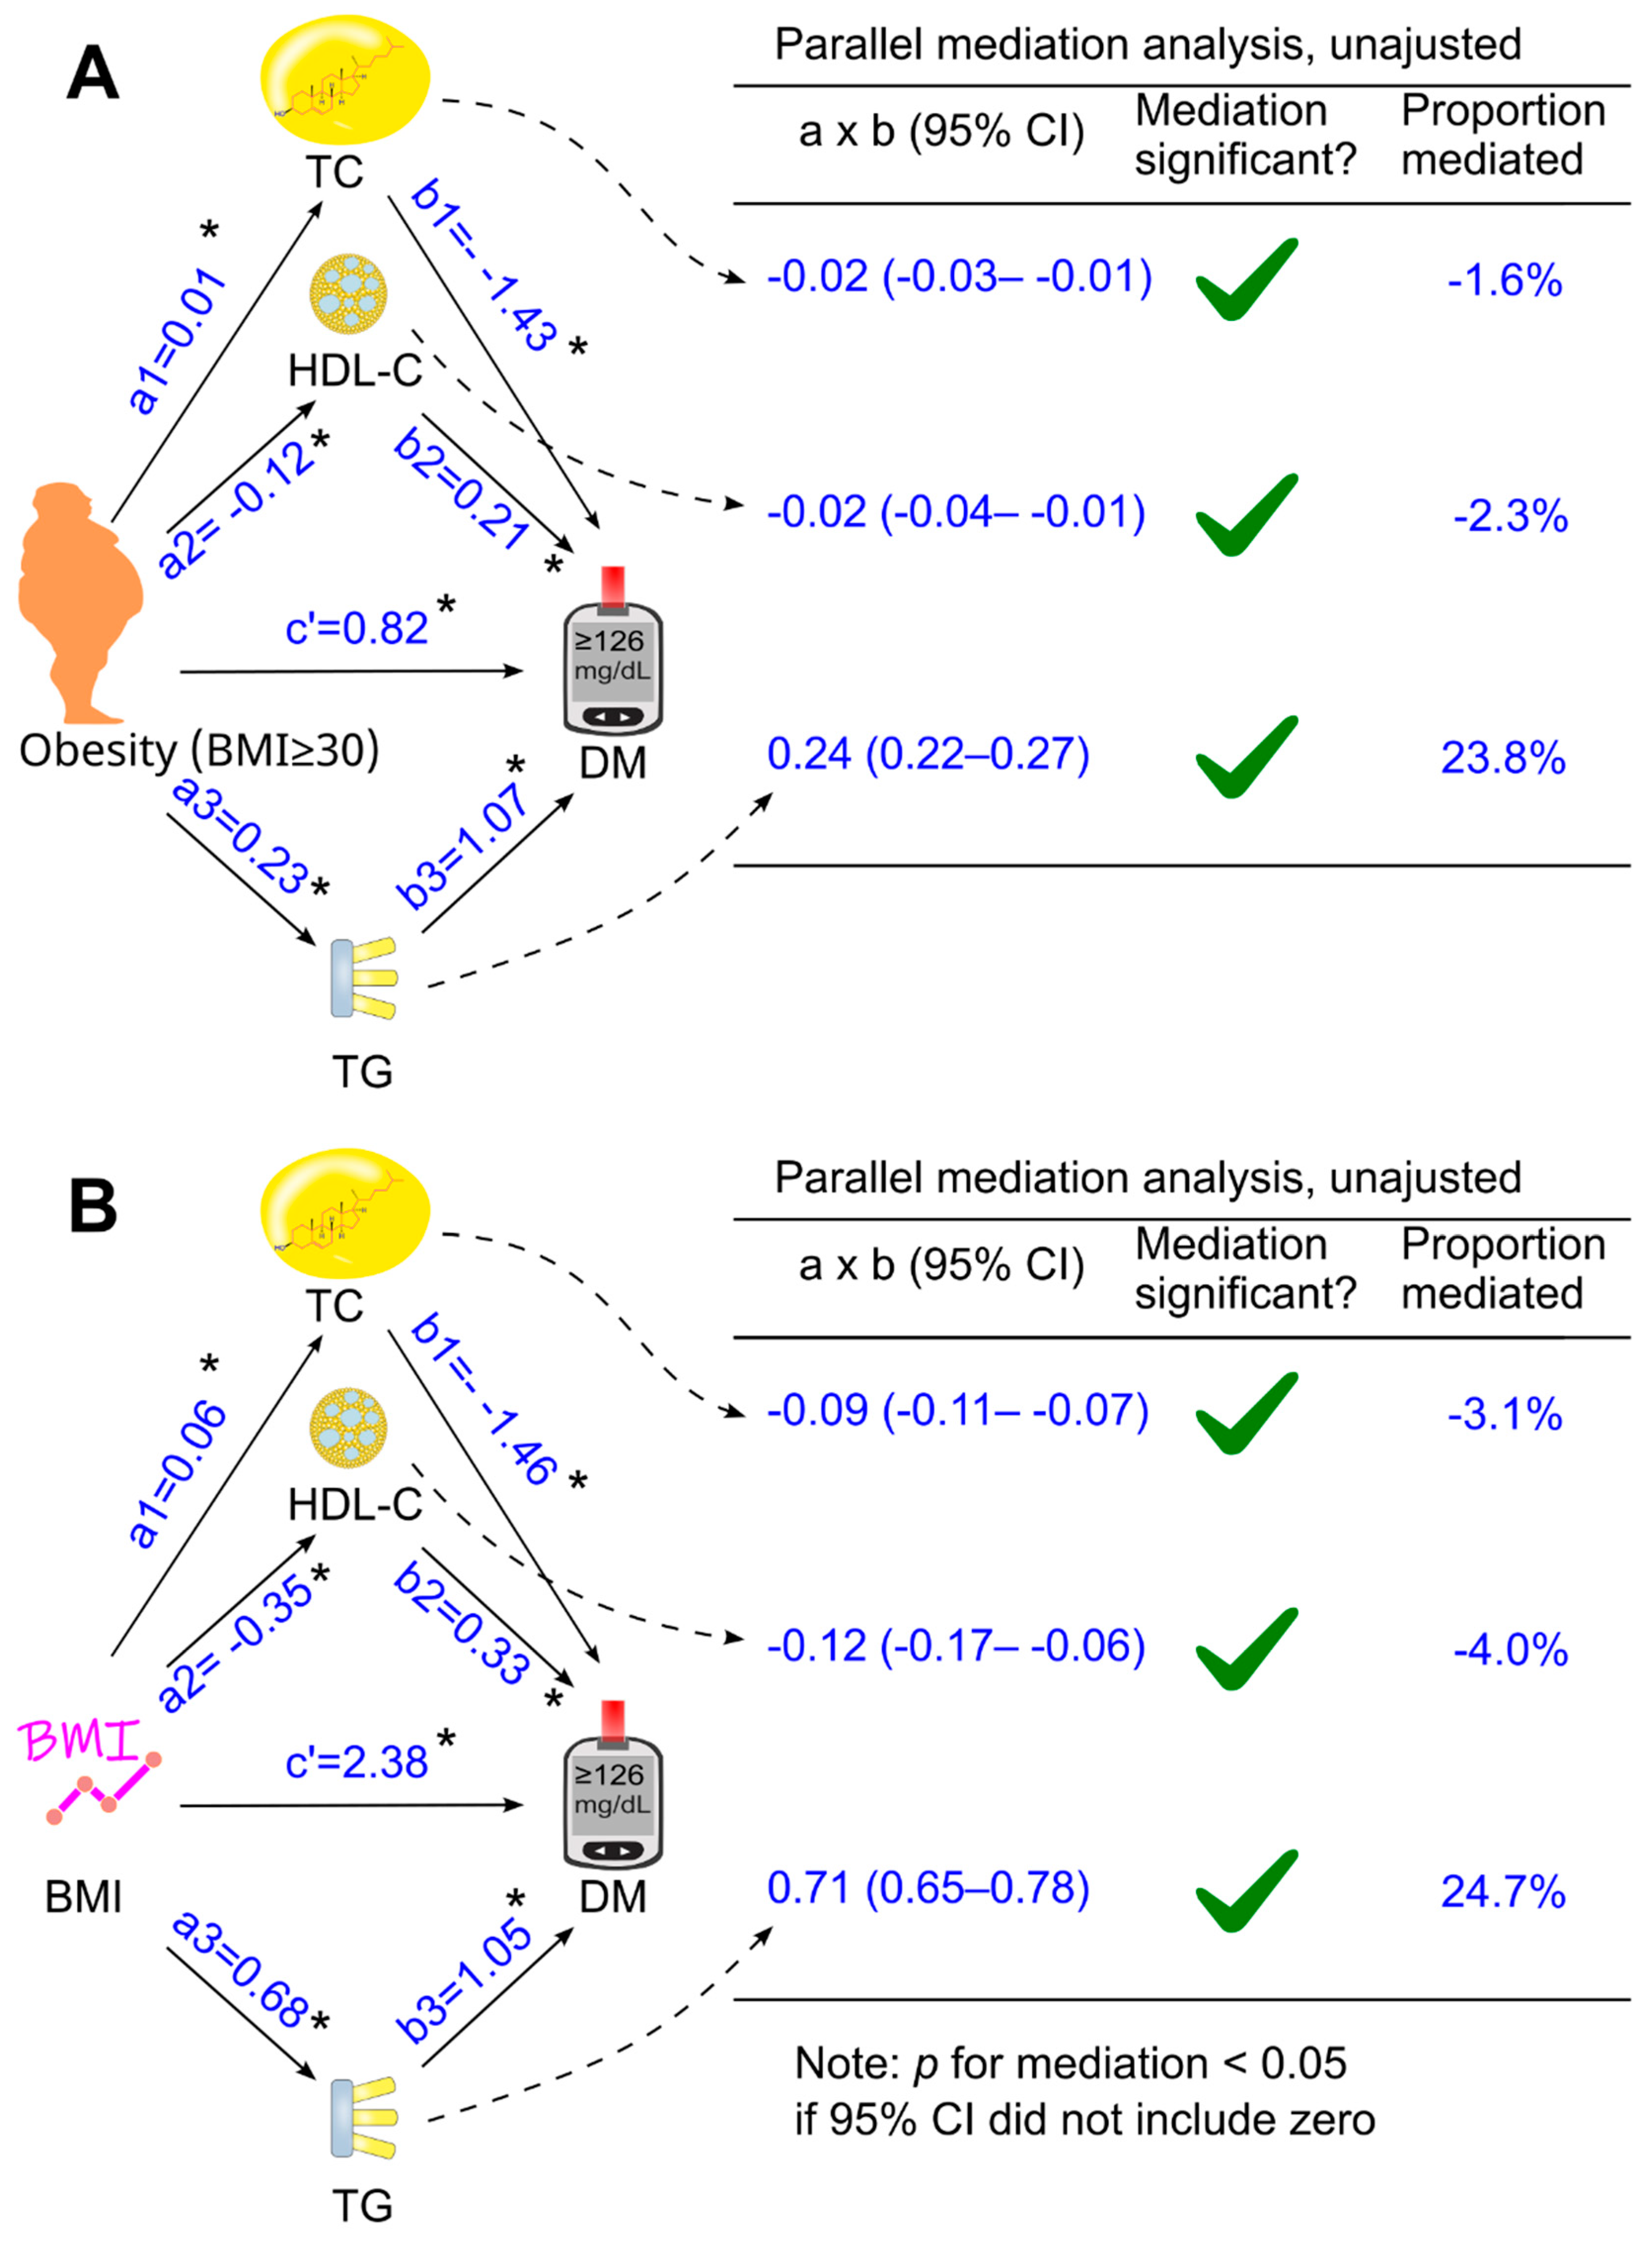
Figure 5.
Parallel mediation analysis with adjustment for confounding factors. Total cholesterol, HDL cholesterol, and triglycerides were placed simultaneously into the analysis as parallel mediators for the effect of obesity or BMI on diabetes. This analysis was adjusted for confounding factors, including age, sex, ethnicity, poverty-income ratio, education, survey period, lifestyle confounding factors (physical activity, alcohol consumption, and smoking status), clinical confounding factors (hypertension and family history of diabetes). Abbreviations: a, association coefficient between obesity and the tested mediator, or between BMI and the tested mediator; b, association coefficient between the tested mediator and diabetes; c’, association coefficient between obesity and diabetes or between BMI and diabetes in the presence of the tested mediators. BMI, body mass index; CI, confidence interval; DM, diabetes; HDL-C, high-density lipoprotein cholesterol; TC, total cholesterol; TG, triglycerides. The green tick represented yes and the red cross represented no.
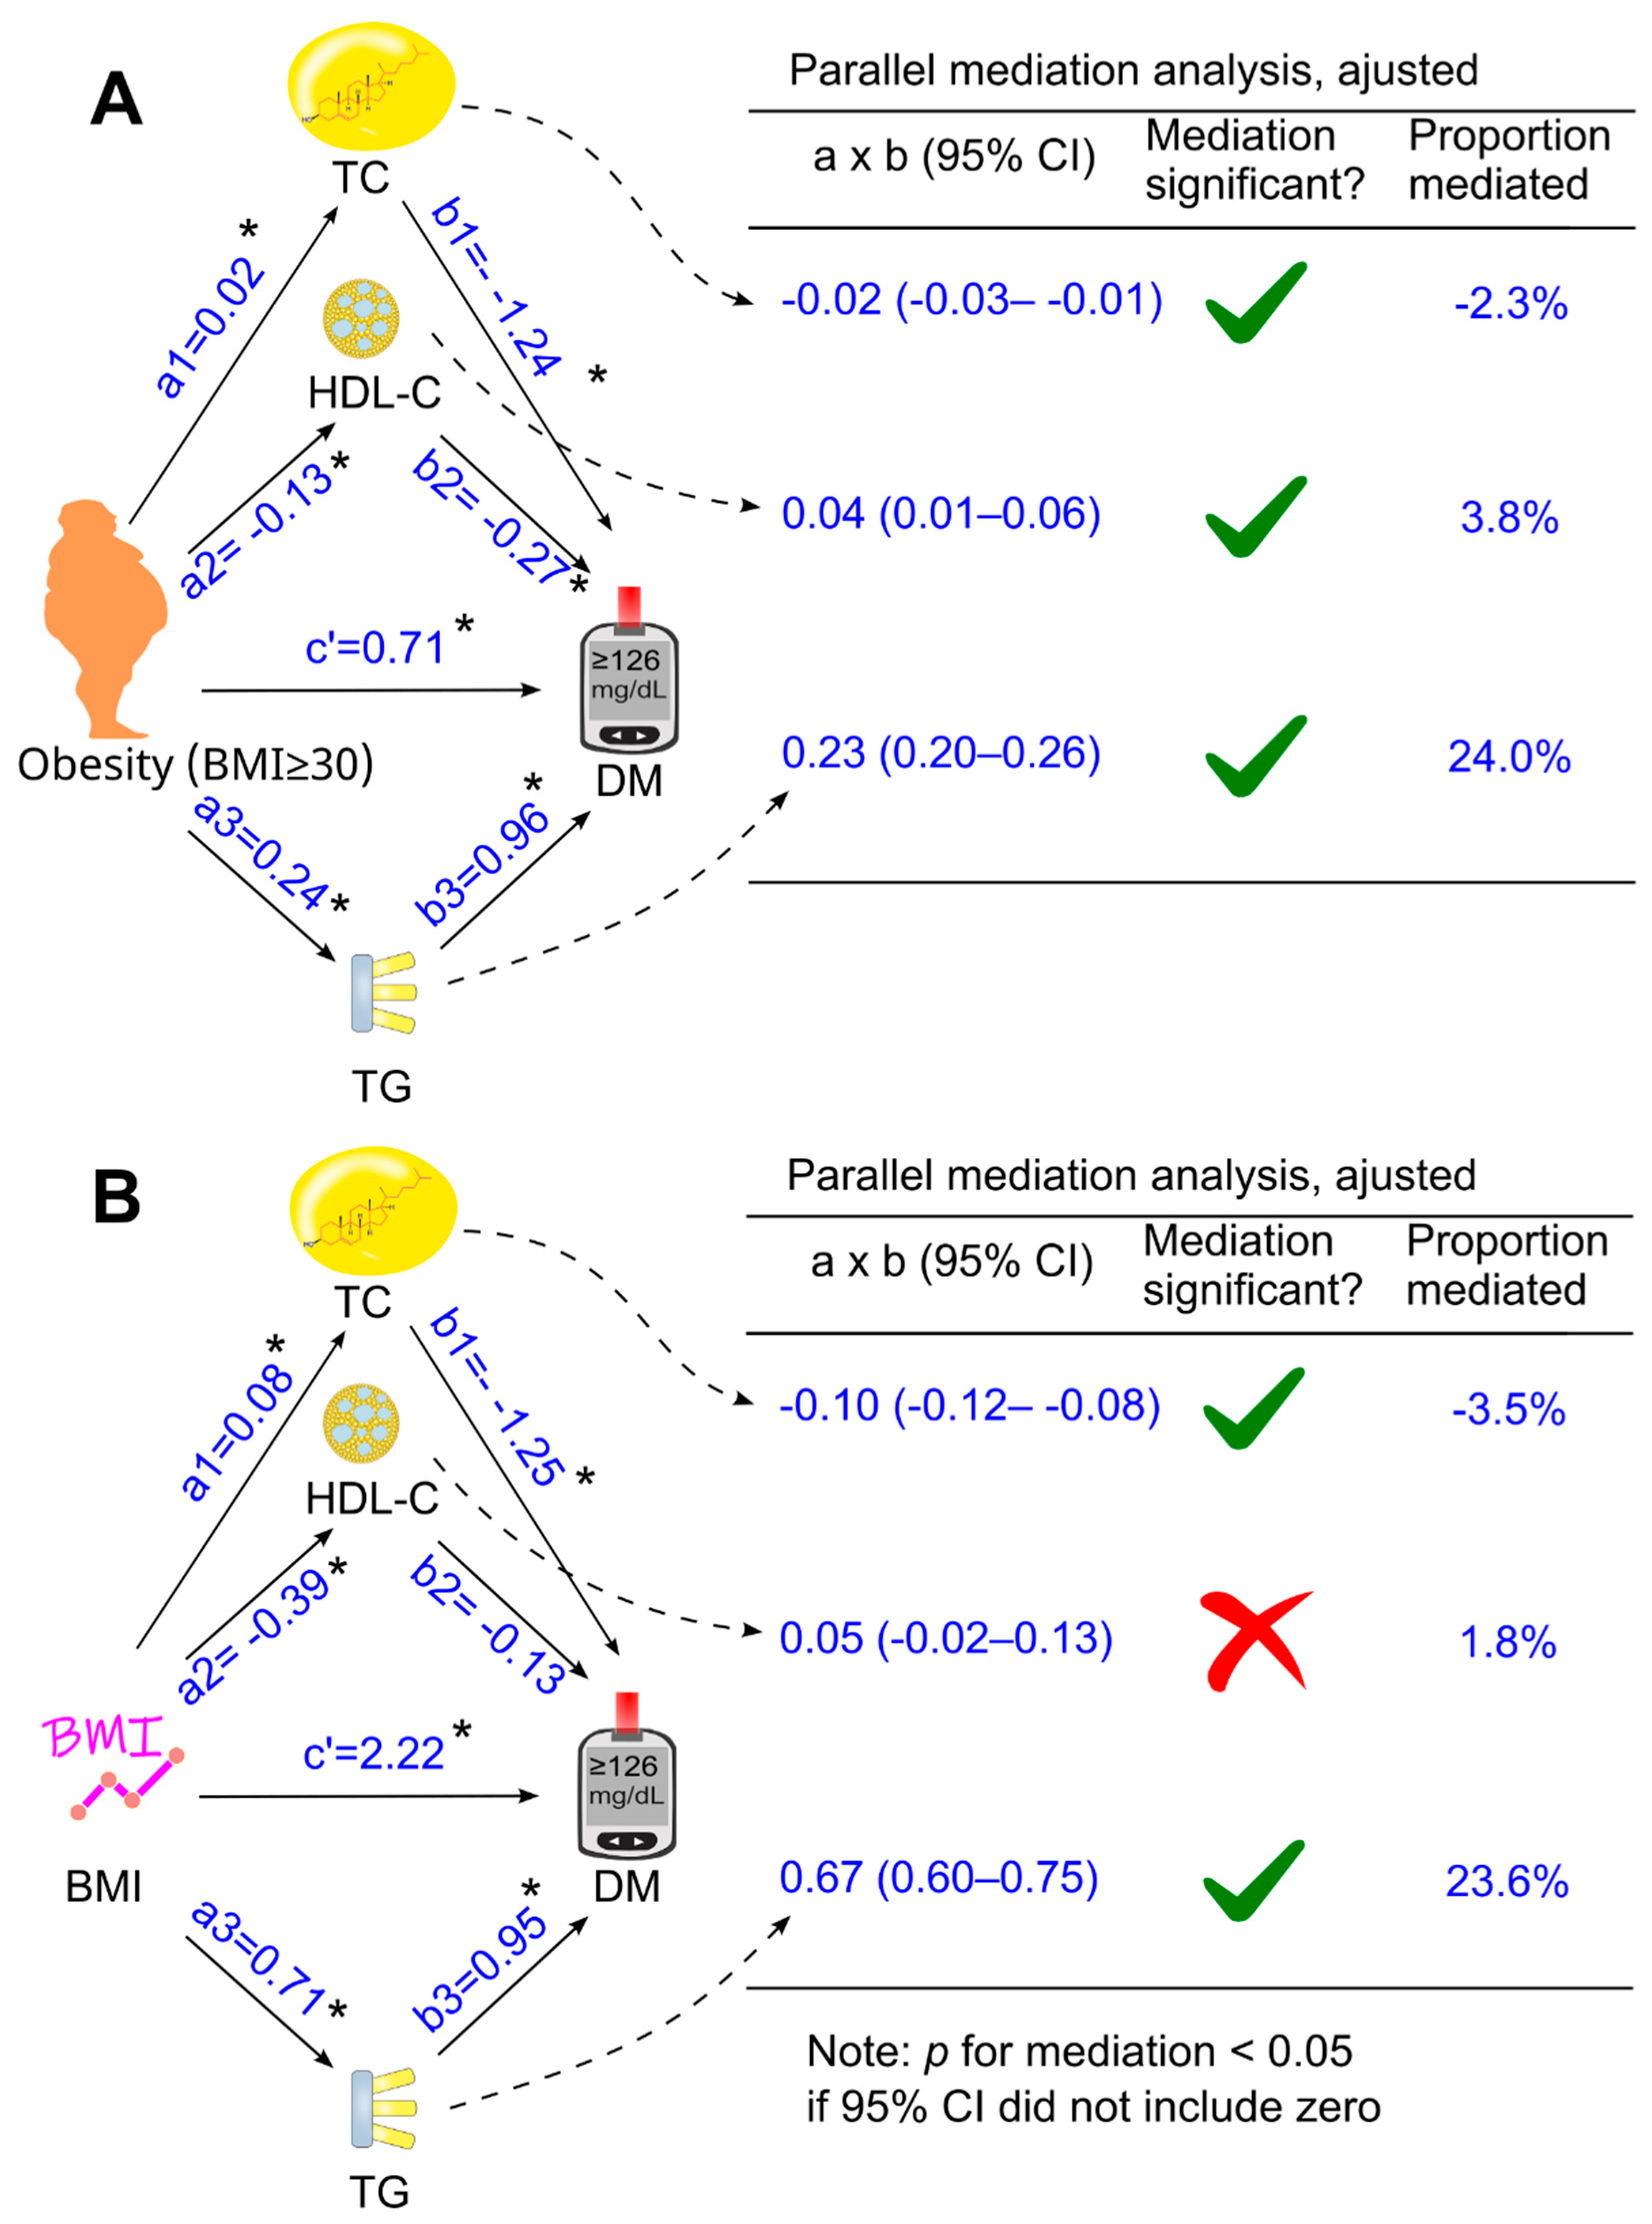
Figure 6.
Association coefficients of LDL cholesterol for mediating the effect of obesity or BMI on diabetes in 23,517 participants. The analysis was adjusted for age, sex, ethnicity, poverty-income ratio, education, survey period, lifestyle confounding factors (physical activity, alcohol consumption, and smoking status), clinical confounding factors (hypertension and family history of diabetes, HDL cholesterol and total cholesterol. Abbreviations: a, association coefficient between obesity and LDL cholesterol, or between BMI and LDL cholesterol; b, association coefficient between LDL cholesterol and diabetes; c’, association coefficient between obesity and diabetes or between BMI and diabetes in the presence of the tested mediators and confounders. BMI, body mass index; CI, confidence interval; DM, diabetes; HDL, high-density lipoprotein. The green tick represented yes and the red cross represented no.
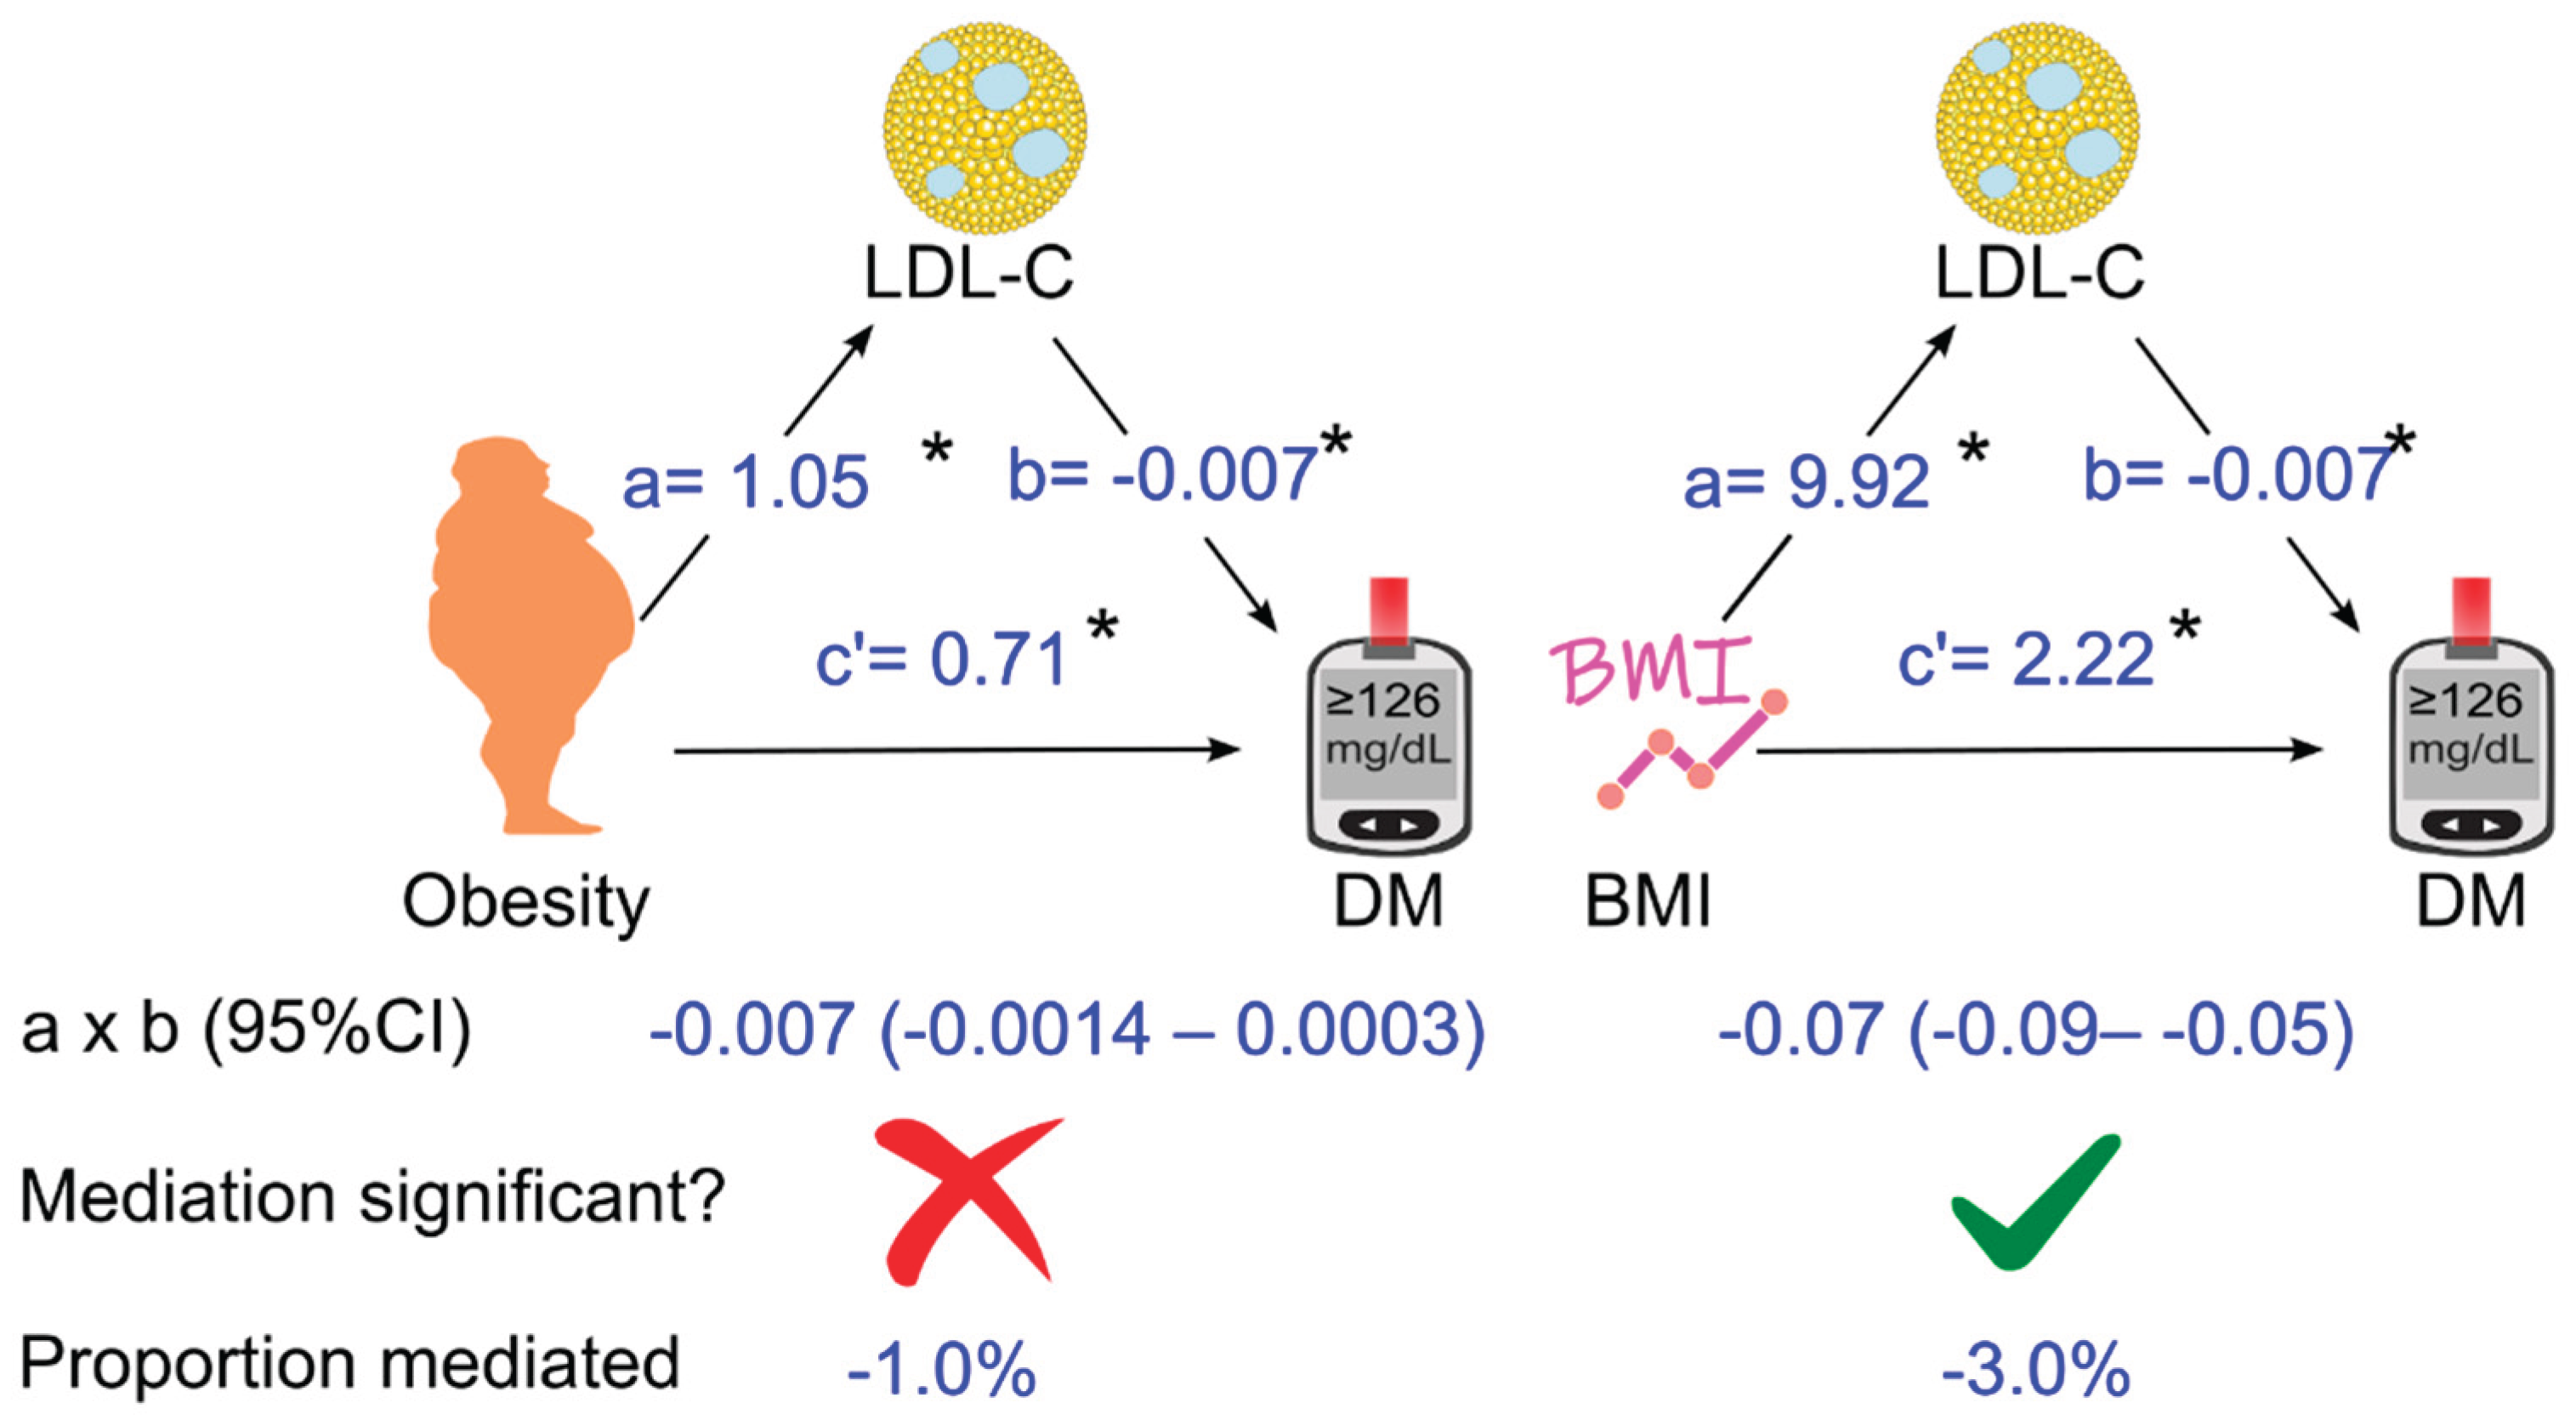

Table 1.
Bivariate Pearson correlation coefficient among the circulating lipids.
| Total cholesterol | HDL cholesterol | LDL cholesterol | |
| HDL cholesterol | 0.154 | ||
| LDL cholesterol | 0.917 | -0.070 | |
| Triglycerides | 0.367 | -0.317 | 0.178 |
HDL-C, high-density lipoprotein; LDL, low-density lipoprotein.
Table 2.
Characteristics of the 26,627 participants, stratified according to obesity1.
| Non obese | Obese | Overall | p value | |
| Sample size | 18,202 | 8425 | 26,627 | NA |
| BMI, kg/m2, median (IQR) | 25 (23–27) | 34 (32–38) | 27 (24–31) | <0.001 |
| Diabetes, n (%) | 1926 (10.6) | 2032 (24.1) | 3958 (14.9) | <0.001 |
| Glucose, mg/dL, median (IQR) | 95 (89–104) | 101 (94–114) | 97 (90–106) | <0.001 |
| HbA1c, %, median (IQR) | 5.3 (5.1–5.6) | 5.6 (5.3–6.0) | 5.4 (5.1–5.8) | <0.001 |
| TC, mg/dL, median (IQR) | 196 (169–225) | 198 (172–227) | 196 (170–225) | <0.001 |
| HDL-C, mg/dL, median (IQR) | 52 (43–64) | 46 (39–56) | 50 (42–61) | <0.001 |
| LDL-C 2, mg/dL, mean (SD) | 119.3 (36.8) | 121.3 (36.6) | 120.0 (36.8) | <0.001 |
| Triglycerides, mg/dL, median (IQR) | 102 (72–150) | 131 (91–189) | 110 (77–163) | <0.001 |
| Age, y, mean (SD) | 48 (19) | 49 (17) | 48 (19) | <0.001 |
| Sex (male), n (%) | 9248 (50.8) | 3503 (41.6) | 12,751 (47.9) | <0.001 |
| Ethnicity, n (%) | ||||
| Non-Hispanic white | 8522 (46.8) | 3464 (41.1) | 11,986 (45) | <0.001 |
| Non-Hispanic black | 3567 (19.6) | 2265 (26.9) | 5832 (21.9) | |
| Hispanic | 4963 (27.3) | 2463 (29.2) | 7426 (27.9) | |
| Other | 1150 (6.3) | 233 (2.8) | 1383 (5.2) | |
| Education, n (%) | ||||
| < High School | 5790 (31.8) | 2786 (33.1) | 8576 (32.2) | 0.01 |
| High School | 4651 (25.6) | 2209 (26.2) | 6860 (25.8) | |
| > High School | 7761 (42.6) | 3430 (40.7) | 11,191 (42.0) | |
| Poverty-income ratio, n (%) | ||||
| < 130% | 5008 (27.5) | 2585 (30.7) | 7593 (28.5) | <0.001 |
| 130%-349% | 6714 (36.9) | 3136 (37.2) | 9850 (37.0) | |
| ≥ 350% | 4929 (27.1) | 2032 (24.1) | 6961 (26.1) | |
| Unknown | 1551 (8.5) | 672 (8.0) | 2223 (8.3) | |
| Physical activity, n (%) | ||||
| Active | 5351 (29.4) | 1696 (20.1) | 7047 (26.5) | <0.001 |
| Insufficiently active | 6807 (37.4) | 3115 (37.0) | 9922 (37.3) | |
| Inactive | 6044 (33.2) | 3614 (42.9) | 9658 (36.3) | |
| Alcohol consumption, n (%) | ||||
| 0 drink/week | 2957 (16.2) | 1775 (21.1) | 4732 (17.8) | <0.001 |
| < 1 drink/week | 3846 (21.1) | 2166 (25.7) | 6012 (22.6) | |
| 1-6 drinks/week | 4004 (22.0) | 1392 (16.5) | 5396 (20.3) | |
| ≥ 7 drinks/week | 2606 (14.3) | 829 (9.8) | 3435 (12.9) | |
| Unknown | 4789 (26.3) | 2263 (26.9) | 7052 (26.5) | |
| Smoking status, n (%) | ||||
| Past smoker | 4435 (24.4) | 1587 (18.8) | 6022 (22.6) | <0.001 |
| Current smoker | 4413 (24.2) | 2260 (26.8) | 6673 (25.1) | |
| Nonsmoker | 9354 (51.4) | 4578 (54.3) | 13,932 (52.3) | |
| Hypertension, n (%) | ||||
| No | 11,963 (65.7) | 3919 (46.5) | 15,882 (59.6) | <0.001 |
| Yes | 5991 (32.9) | 4377 (52.0) | 10368 (38.9) | |
| Unknown | 248 (1.4) | 129 (1.5) | 377 (1.4) | |
| Family history of diabetes, n (%) | ||||
| Yes | 7239 (39.8) | 4340 (51.5) | 11,579 (43.5) | <0.001 |
| No | 10,626 (58.4) | 3931 (46.7) | 14,557 (54.7) | |
| Unknown | 337 (1.9) | 154 (1.8) | 491 (1.8) |
1Obesity was defined as BMI ≥30 kg/m2. 2LDL cholesterol was calculated in 23,517 participants, as 3110 participants did not have the data. Abbreviations: BMI, body mass index; HbA1c, hemoglobin A1c; HDL-C, high-density lipoprotein cholesterol; IQR, interquartile range; LDL-C, low-density lipoprotein cholesterol; n, number; NA, not applicable; SD, standard deviation; TC, total cholesterol.
Table 3.
Obesity-associated risk for diabetes in 26,627 participants.
| Models | Odds ratio | 95% CI | p value |
| Model 1 | 2.69 | 2.51–2.88 | <0.001 |
| Model 2 | 3.11 | 2.88–3.35 | <0.001 |
| Model 3 | 2.84 | 2.63–3.07 | <0.001 |
| Model 4 | 2.44 | 2.25–2.65 | <0.001 |
| Model 5 (Model 4 + TC) | 2.44 | 2.25–2.65 | <0.001 |
| Model 6 (Model 4 + HDL-C) | 2.14 | 1.97–2.32 | <0.001 |
| Model 7 (Model 4 + TG) | 2.13 | 1.96–2.31 | <0.001 |
| Model 8 (Model 4 + TC + HDL-C + TG) | 2.03 | 1.87–2.21 | <0.001 |
CI, confidence interval; HDL-C, high-density lipoprotein cholesterol; TC, total cholesterol; TG, triglycerides. Model 1: Not adjusted; Model 2: Adjusted for age, sex, and ethnicity; Model 3: Adjusted for factors in Model 2 plus poverty-income ratio, education, physical activity, alcohol consumption, smoking status, and survey period; Model 4: Adjusted for factors in Model 3 plus hypertension and family history of diabetes.
Disclaimer/Publisher’s Note: The statements, opinions and data contained in all publications are solely those of the individual author(s) and contributor(s) and not of MDPI and/or the editor(s). MDPI and/or the editor(s) disclaim responsibility for any injury to people or property resulting from any ideas, methods, instructions or products referred to in the content. |
© 2025 by the authors. Licensee MDPI, Basel, Switzerland. This article is an open access article distributed under the terms and conditions of the Creative Commons Attribution (CC BY) license (http://creativecommons.org/licenses/by/4.0/).
Copyright: This open access article is published under a Creative Commons CC BY 4.0 license, which permit the free download, distribution, and reuse, provided that the author and preprint are cited in any reuse.


