Submitted:
24 November 2025
Posted:
25 November 2025
You are already at the latest version
Abstract
Livestock production in Mexico takes place in a variety of agro-ecological regions, with a third of cattle raised in the tropics (28% of the country), where environmental conditions cause heat stress and the development of diseases in unadapted animals. Animals of the Mexican Sardo Negro breed (Bos indicus) are environmentally resilient and used for meat and milk production. Little information is available on their breeding management. Therefore, their genetic diversity and population structure will be characterised using pedigrees. In 6 herds dedicated to this breed in Veracruz and Chiapas, Mexico (8,653 head), the coefficients explaining their diversity and population structure were obtained using ENDOG V4.8, PopRep and GRain software. The result was an average inbreeding of 2.5%, with an increase of 0.9% per generation, a generation interval of 7.9 years, with a maximum of 9 generations traced, and low pedigree completeness in the most distant generations. The difference between the effective number of ancestors (32) and founders (37) indicates the presence of bottlenecks. Only 21 individuals explain 50% of the genetic variability. There is an acceptable level of inbreeding, which can be improved in subsequent generations to contribute to its conservation.
Keywords:
Cebu cattle
; cattle breeds
; synthetic populations
; pedigree
1. Introduction
The diversity of cattle species is the result of years of selection by humans to meet their needs in a wide range of ecological environments. These species have been able to maintain and increase their productivity and adapt to changing environments. This biodiversity provides us with alternatives to respond to future challenges in terms of the environment, disease, human dietary requirements and/or market changes [1]. Among these species, cattle (Bos taurus/Bos indicus) have successfully domesticated and now inhabit all continents [2], adapting to new habitats and forming populations with new traits under cultural and demographic influences [3]. The selection pressure exerted on livestock populations to maintain phenotype or improve productivity has increased inbreeding or mating between individuals of common ancestry, resulting in a reduction of heterozygosity and genetic variation, which in some cases has manifested itself in reduced fertility, hybrid vigour, disease resistance and changes in growth, among other things [4]; therefore, appropriate population management is required to conserve diversity[5,6].
In Mexico, livestock production contributes to economic and social development by providing animal protein for the population and for export [7]. It is the seventh largest livestock producer in the world. In terms of cattle, it is the eighth largest producer of meat and the 16th largest producer of milk [8]. The tropical region of Mexico is a major contributor to this production, where different production systems have been developed to satisfy market demand, using a wide variety of breeds and phenotypes due to the adverse environmental conditions [9]. The incorporation of productive animals from different environments has shown low productivity or high input costs to express their potential, so to achieve responsible and sustainable production, genetically resistant populations are needed to maintain productivity with physiological well-being and minimal external inputs to reduce the environmental impact on food production [1,10]. Bos indicus animals show excellent performance and form productive herds [11], as pure breeds or crossed with European cattle in different proportions to improve their productivity [12]. In this way, it is very important to preserve the diversity of locally adapted breeds, which constitute a genetic and economic resource, since they represent a germplasm that could be essential to maintain its survival percentage in the face of unexpected changes, to ensure the food supply of the population and to preserve their cultural heritage. [6,13].
Sardo Negro cattle were first registered in Mexico in 1978 by the Mexican Association of Zebu Cattle Breeders (AMCC, for its acronym in Spanish). The breed originated from crosses between Bos indicus cattle, imported to Mexico from Brazil in the 1940s, and Criollo zebu cattle, which had previously entered the country in smaller numbers via the Gulf of Mexico [14,15]. Local breeders recognised their productive and environmental adaptation merits and bred them until they were recognised by the AMCC and allowed them to be kept to this day[14].
The Sardo Negro is a medium-sized, robust animal with a strong skeleton, defined and longitudinally distributed muscles, with resistance to tropical climatic conditions in which it is far superior to Bos taurus [14,16]; producers of this breed describe its maternal, milk, meat and reproductive abilities as superior to other Bos indicus [17,18]. An important trait to highlight is their gentleness or docility in handling [14], a desirable trait in productive animals as it facilitates management and avoids the risk of damage to the physical integrity of the personnel handling the animals, the facilities or the animals themselves [19].
Since its recognition by the AMCC, the breed has spread to different livestock regions of the country, contributing to productivity as part of the Mexican agro-ecosystem. By 2020, the AMCC will have registered 46,000 individuals of the Sardo Negro breed. According to the Domestic Animal Diversity Information System (DAD-IS) [20], this breed is classified as locally adapted, with low risk of extinction and as a transboundary breed due to its recent incursion into other Latin American countries. However, due to selection during breeding, the breed may face several threats that could lead to the loss of this genetic heritage. These include inbreeding, which has been shown to have a negative effect on its productivity [21,22,23]; crossbreeding with other breeds or displacement by other more productive breeds; and habitat loss, among others [24,25].
It is known that there are several causes that can determine the diversity of a population. Migration and mutation can increase genetic diversity [26] and bottlenecks or high levels of inbreeding can reduce it [27], so knowing the relationship between a group of individuals is essential to maintaining their diversity when designing a breeding program or taking conservation measures [28,29].
Although today there are technologies that allow us to determine the diversity of a population using different molecular tools [30], the genealogical records are still a valid method to know this information [6,31].
Therefore, it is important to understand the genetic diversity and current population structure of the Sardo Negro breed. This breed is a locally adapted genetic resource of incalculable value, characterised by its hardiness and resilience to the region's specific environmental conditions.
This study aims to update and complement recent genomic evaluations by conducting a thorough pedigree analysis to quantify variability. The results will be crucial for developing active conservation strategies that allow for the management and preservation of genetic diversity during breeding, ensuring that genetic progress does not compromise the breed's defining characteristics.
Finally, this effort will promote knowledge of the breed in areas of productive interest, such as the assessment of its milk and meat yield. This will lay the foundations for supporting its strategic inclusion in production systems, demonstrating that conservation and productivity are complementary objectives in the management of our local zoogenetic resources.
2. Materials and Methods
Genealogical information from 8,653 Sardo Negro cattle born between 1985 and 2022 was used for this study. They belong to six different herds (subpopulations) that are members of the AMCC , these herds are representative of each regions in which this breed of cattle is raised and were selected at convenience. Each herd provided data on all their registered animals including individual identification, sire and dam identification, date of birth, sex and subpopulation to which they belong. Information on individuals who have left the herd without registration is not included. A physical check of the database eliminated duplicate records between subpopulations or those with inconsistencies such as incorrect data due to incompatible date or sex. It should be noted that not all individuals born in these herds receive the AMCC record for various reasons (phenotype, commercial destination, disease, death, etc.), so data from entire families are not included.
The herds are located in the tropical region of Mexico, with a warm sub-humid climate and summer rains. In the state of Veracruz, Gulf of Mexico region, in the municipalities of Medellín (temperature 24-28 °C, rainfall 1,900-2,600 mm; subpopulation 1) and Tlalixcoyan (temperature 24-28 °C, rainfall 1,400-1,600 mm, subpopulation 2), Jesús Carranza (temperature 24-26 °C, rainfall 1,200-2,500 mm; subpopulations 3 and 4). In the southeastern Mexico, in the state of Chiapas, the municipalities of Tonalá (temperature 14-30 °C, rainfall 1,200-3,500 mm; subpopulation 5) and Villa de Comatitlán (temperature 22-30 °C, rainfall 1 500-4,000 mm; subpopulation 6) [32]. According to Köppen's climate classification system, modified by García in 1988 to adapt it to the Mexican environment, subpopulations 3 and 4 are classified as climate Aw2, subpopulations 1 and 2 as climate Am and subpopulations 5 and 6 as Aw2"(w) [33] (Figure 1).
POPREP software was used for demographic description and population structure [34], and ENDOG v4.8 software [5], was used to estimate genetic diversity parameters: pedigree completeness, inbreeding, relatedness, effective population size, ancestry explaining genetic variability, individual genetic conservation index and contribution of subpopulations to total diversity. GRain software was used to calculate the ancestral inbreeding coefficient [35].
To determine the quality of the genealogical information analysed or pedigree completeness, the percentage of known ancestors per generation was calculated, as well as the completeness index (CI) [36]; in addition, the number of complete generations traced was estimated for each individual, which separates the offspring from its most distant generation in which two ancestors are known; the maximum number of generations traced as the number of generations separating the individual from its most distant ancestor and complete equivalent generations as the calculated sum of each known ancestor [5].
The generation interval (GI) was obtained as the unit of time it takes to replace a set of parents. The mean age of breeding males and females at the time of birth of their reproductive or non-reproductive offspring (AB) was also calculated [37]. These parameters were analysed in their four selection paths: sire-son, sire-daughter, dam-son, dam-daughter standard error was calculated by analytic method.
The Inbreeding coefficient (F), or the probability that two gametes forming an individual carry identical alleles by descend (IBD), as a result of mating between individuals with a common ancestor or relatives [38], was calculated for all pedigree members according to established equations [39]. The average relatedness coefficient (AR), defined as the probability that a randomly selected allele in the study population belongs to a particular animal, thus indicating its relationship to the herd independent of pedigree. Both were calculated for each individual and in each estimated generation. The effective population size (Ne), or the number of parents that would result in the actual increase in inbreeding if they contributed equally to the next generation. It is calculated by Ne=1/(2∆FOBS) from the increase in inbreeding per generation (ΔF) to compare the efficiency of the processes of natural selection, artificial selection or migration (ΔF=Ft-F (t-1)/ 1-F (t-1)). This metric tells us the size of an ideal population that loses heterozygosity at the same rate as the real population of interest and is always smaller than the real size [37,38]. However, this model may not adequately adjust for the size and depth of the pedigree, leading to an overestimation of the parameter, so we also consider calculating Ne from the decision tree constructed by Groeneveld et al. (2009), which compares different estimation methods and leads to the selection of the best method through its completeness and stability [34].
The coefficients of classical inbreeding, ancestral inbreeding as defined by Ballou (1997) (FaBAL), Kalinouski et al. (2000) (FaKAL) and the coefficient of ancestral history (AHC) were calculated using a stochastic method (gene dropping) with 10,000 replicates. FaBAL is defined as the probability that each allele of an individual has been identical by descent at least once in previous generations. FaKAL represents the part of the genome in which the alleles are currently in an autozygous state and were also present at least once in an ancestor of the animal. AHC is the number of times during pedigree segregation that a randomly selected allele is identical by descent [35].
The probability of origin of genes in the study population was calculated with the ancestries that explain the genetic variability: effective number of founders (ƒe) as the number of ancestors with unknown progenitors, of equal contribution that are expected to generate the same genetic diversity as in the population under study, expressed as a fraction of the genes contributed by the founders and maintained in the population; effective number of ancestors (ƒa), founders or not, the minimum necessary to explain the complete genetic diversity of a population. The difference between ƒe and ƒa, explains the presence of bottlenecks or the reduction of its members in a given period, with a consequent change in allele frequencies as population evolves [38].
In order to identify the animals with the highest contribution to conservation and to maintain the full range of alleles in the population, the Genetic Conservation Index (GCI) was calculated for each individual in the analysed population, which identifies the genetic contribution of the founders and shows the degree of individual conservation from the base population [40].
Wright's (1965) F-statistics were also estimated to assess genetic diversity due to inbreeding. They indicate the degree to which heterozygosity in the population has been reduced from the identity by descent in the pedigree analysis. FIS was calculated as the inbreeding coefficient of an individual with respect to its subpopulation, indicates the reduction in random mating, and is defined as the probability that two alleles in an individual are identical by descent with respect to the subpopulation. FST refers to the correlation of alleles in different individuals of the same population and was calculated from the average inbreeding of a subpopulation relative to the total population, it is the expected inbreeding from random mating. Finally, FIT indicates whether two alleles of the same locus in an individual are IBD relative to the metapopulation, calculated as the inbreeding coefficient of an individual relative to the total population [37,38].
Finally, the genetic significance of herds was calculated using the contribution of breeding males to determine whether subpopulations were isolated [41]. Subpopulations are identified as nucleus herds if breeders use only their own males, multiplier herds if they use external males and sell their own, and commercial herds if they accept males from other herds and never sell their own.
3. Results
Genealogical data were obtained for 8,653 animals registered from 1985 to 2022 from the six subpopulations that made up the present study. Each subpopulation contributed from 1 to 6: 2,817, 176, 1002, 430, 3,872 and 356 animals respectively.
3.1. Population Structure
3.1.1. Population
Table 1 shows the demographic characteristics of the study population. The total number of individuals is composed of 56% females and 44% males, where 49% of the females were dams and only 6% of the males had registered offspring, the average was 3 offspring per cow and 31 per bull; 70% of the individuals had no registered progeny. Likewise, the reference population is 79% with both parents known, 20% with both parents unknown and 0.8% with at least one parent known.
Figure 2 shows the number of offspring born each year. It also shows the number of sires and dams that mated to produce these offspring. It can be seen that the population has increased over time. In the first 10 years less than 200 calves were born per year, from 2,000 onwards 200 to 400 calves were born per year, and in the last 10 years up to 600 calves per year. Of these, the proportion of dams is related to the number of calves born, but the number of sires used for breeding has been low, a trend that has continued over the years. This confirms that the population has been subject to artificial selection. It has a reduced number of males, which limits the diversity of traits passed on to the next generations.
3.1.2. Pedigree Completeness
Figure 3 shows the percentage of known ancestors per generation. It can be seen that approximately 80% of the animals have known parents. However, this percentage decreases in subsequent generations: 60% of paternal grandparents, 45% of maternal grandparents, 28% of paternal great-grandparents and 20% of maternal great-grandparents are known. The percentage decreases further in more distant generations. This trend may be due to the lower number of males used for breeding and the fact that herds try to include males with a proven track record. Figure 4 shows the pedigree completeness index (CI) across generations, where it can be seen that the most recent generations have a higher index, which decreases due to the lack of genealogical information from the more distant generations. This lack of information on the most distant ancestors may lead to an underestimation of the level of inbreeding and other parameters in the population.
The average and maximum values of 2.8 and 9 maximum traced generations (MG), 1.2 and 4 complete generations (CG), and 1.8 and 5.2 equivalent generations (EG) were determined as the pedigree depth of the population. From this information, it can be seen that there are few generations to record. This is due to the recent origin of the breed. There is also an increase in inbreeding per MG of 0.89%, 3.12% in each CG and 2.08% in the EG is also identified.
3.1.3. Generational Interval
The average generation interval (GI) was 7.9 years and the average age of the parents at the birth of their offspring (AB) was 8.2 years, a slightly higher parameter if we do not take into account whether the offspring reproduce or not. The trends between the four selection routes are shown in Table 2, where no statistical difference was expressed between the different breeding routes. A long generation interval is expected to result in a slow response to selection, but this interval also increases the probability of producing more offspring from an animal in controlled matings and delays the loss of heterozygosity in the population due to inbreeding effects. Current reproductive management, using artificial insemination and embryo transfer techniques [42,43], has led populations to increase individual offspring and decrease the number of breeding animals that make up the next generations, which contributes to the maintenance of high GI and AB.
3.2. Inbreeding and Diversity
3.2.1. Inbreeding and Relatedness
Table 3 shows the averages of inbreeding coefficient (F), average relatedness coefficient (AR) and effective population size (Ne) by maximum generation of the individuals making up the population. The average F calculated for each individual of the analysed pedigrees was 2.5%, a parameter that varies from 0 to 5.2% throughout the GM. In general, 6.25% inbreeding is considered acceptable in a herd and from 12.5% the herd is at a critical level [44,45], so this population has an acceptable inbreeding value, which implies a good state of conservation of genetic diversity or a low loss of heterozygotes. According to the information presented in Figure 5, the average inbreeding per year of birth has increased over time, but has remained within acceptable limits, and the number of inbred animals in the population shows a similar trend.
In the inbred population and its average F, it can be seen that generations 2 and 3 have an average F higher than the critical level (15.7 and 13.2%), but since there are few individuals (9.5 and 28.4% of the population), this is not reflected in the average of the generation. Likewise, in more distant generations, where the number of inbred individuals is higher, up to 75% of the population, they have a lower average F (4.0%). Some of the events that contribute to the F of this population are the identification of 0.08% of crosses between siblings, 5.2% between half-siblings and 1.5% between parents and offspring. The inbreeding coefficient in the population could be reduced if these events were reduced in practice.
When the degree of inbreeding is related to the number of CG (4 complete generations), values of 14.9% were obtained in the most distant generation (fourth), 8.3%, 5.6%, 0.5% and 0.0% in the third, second, first and most recent generations, respectively. It should be noted that as the pedigree becomes more complete, the population shows a critical level of inbreeding, which has improved over the generations.
On the other hand, different inbreeding values were found in each of the herds included in this study. Herds 1 to 6 reported F values of 3.2%, 1.2%, 1.3%, 1.8%, 2.5% and 2.6%, respectively. As can be seen, herds with a larger number of animals report higher levels of inbreeding, although these are all below the acceptable average.
The average relatedness coefficient (AR) of 2.5% indicates a low relationship between individuals in the population. This situation reduces the possibility of interbreeding between related individuals and increases inbreeding in subsequent generations. The values of MG ranging from 0.1 to 4.2 also indicate that it was higher in earlier generations but has decreased in recent generations. In animal breeding, identifying and using animals with the lowest AR as reproducers can help to maintain genetic diversity in the long term.
According to the classical inbreeding coefficient estimated by the gene dropping method, the average of the individuals in this population is 2.6%, as well as the averages of faBAL 2.7%, FaKAL 2.9% and AHC 0.006. Of the total population, 15% of the individuals are inbred, 46% of them have no ancestral inbreeding, but 17% of the non-inbred animals have a percentage of ancestral inbreeding, so they have previously been exposed to inbreeding by their ancestors, but this inbreeding is low. Furthermore, according to the AHC, values range from 0 to 4, animals with an ancest as mentioned aboveral history have an average of 1.2, so the frequency that these animals have been exposed to ancestral inbreeding at least once is low (5% of the population).
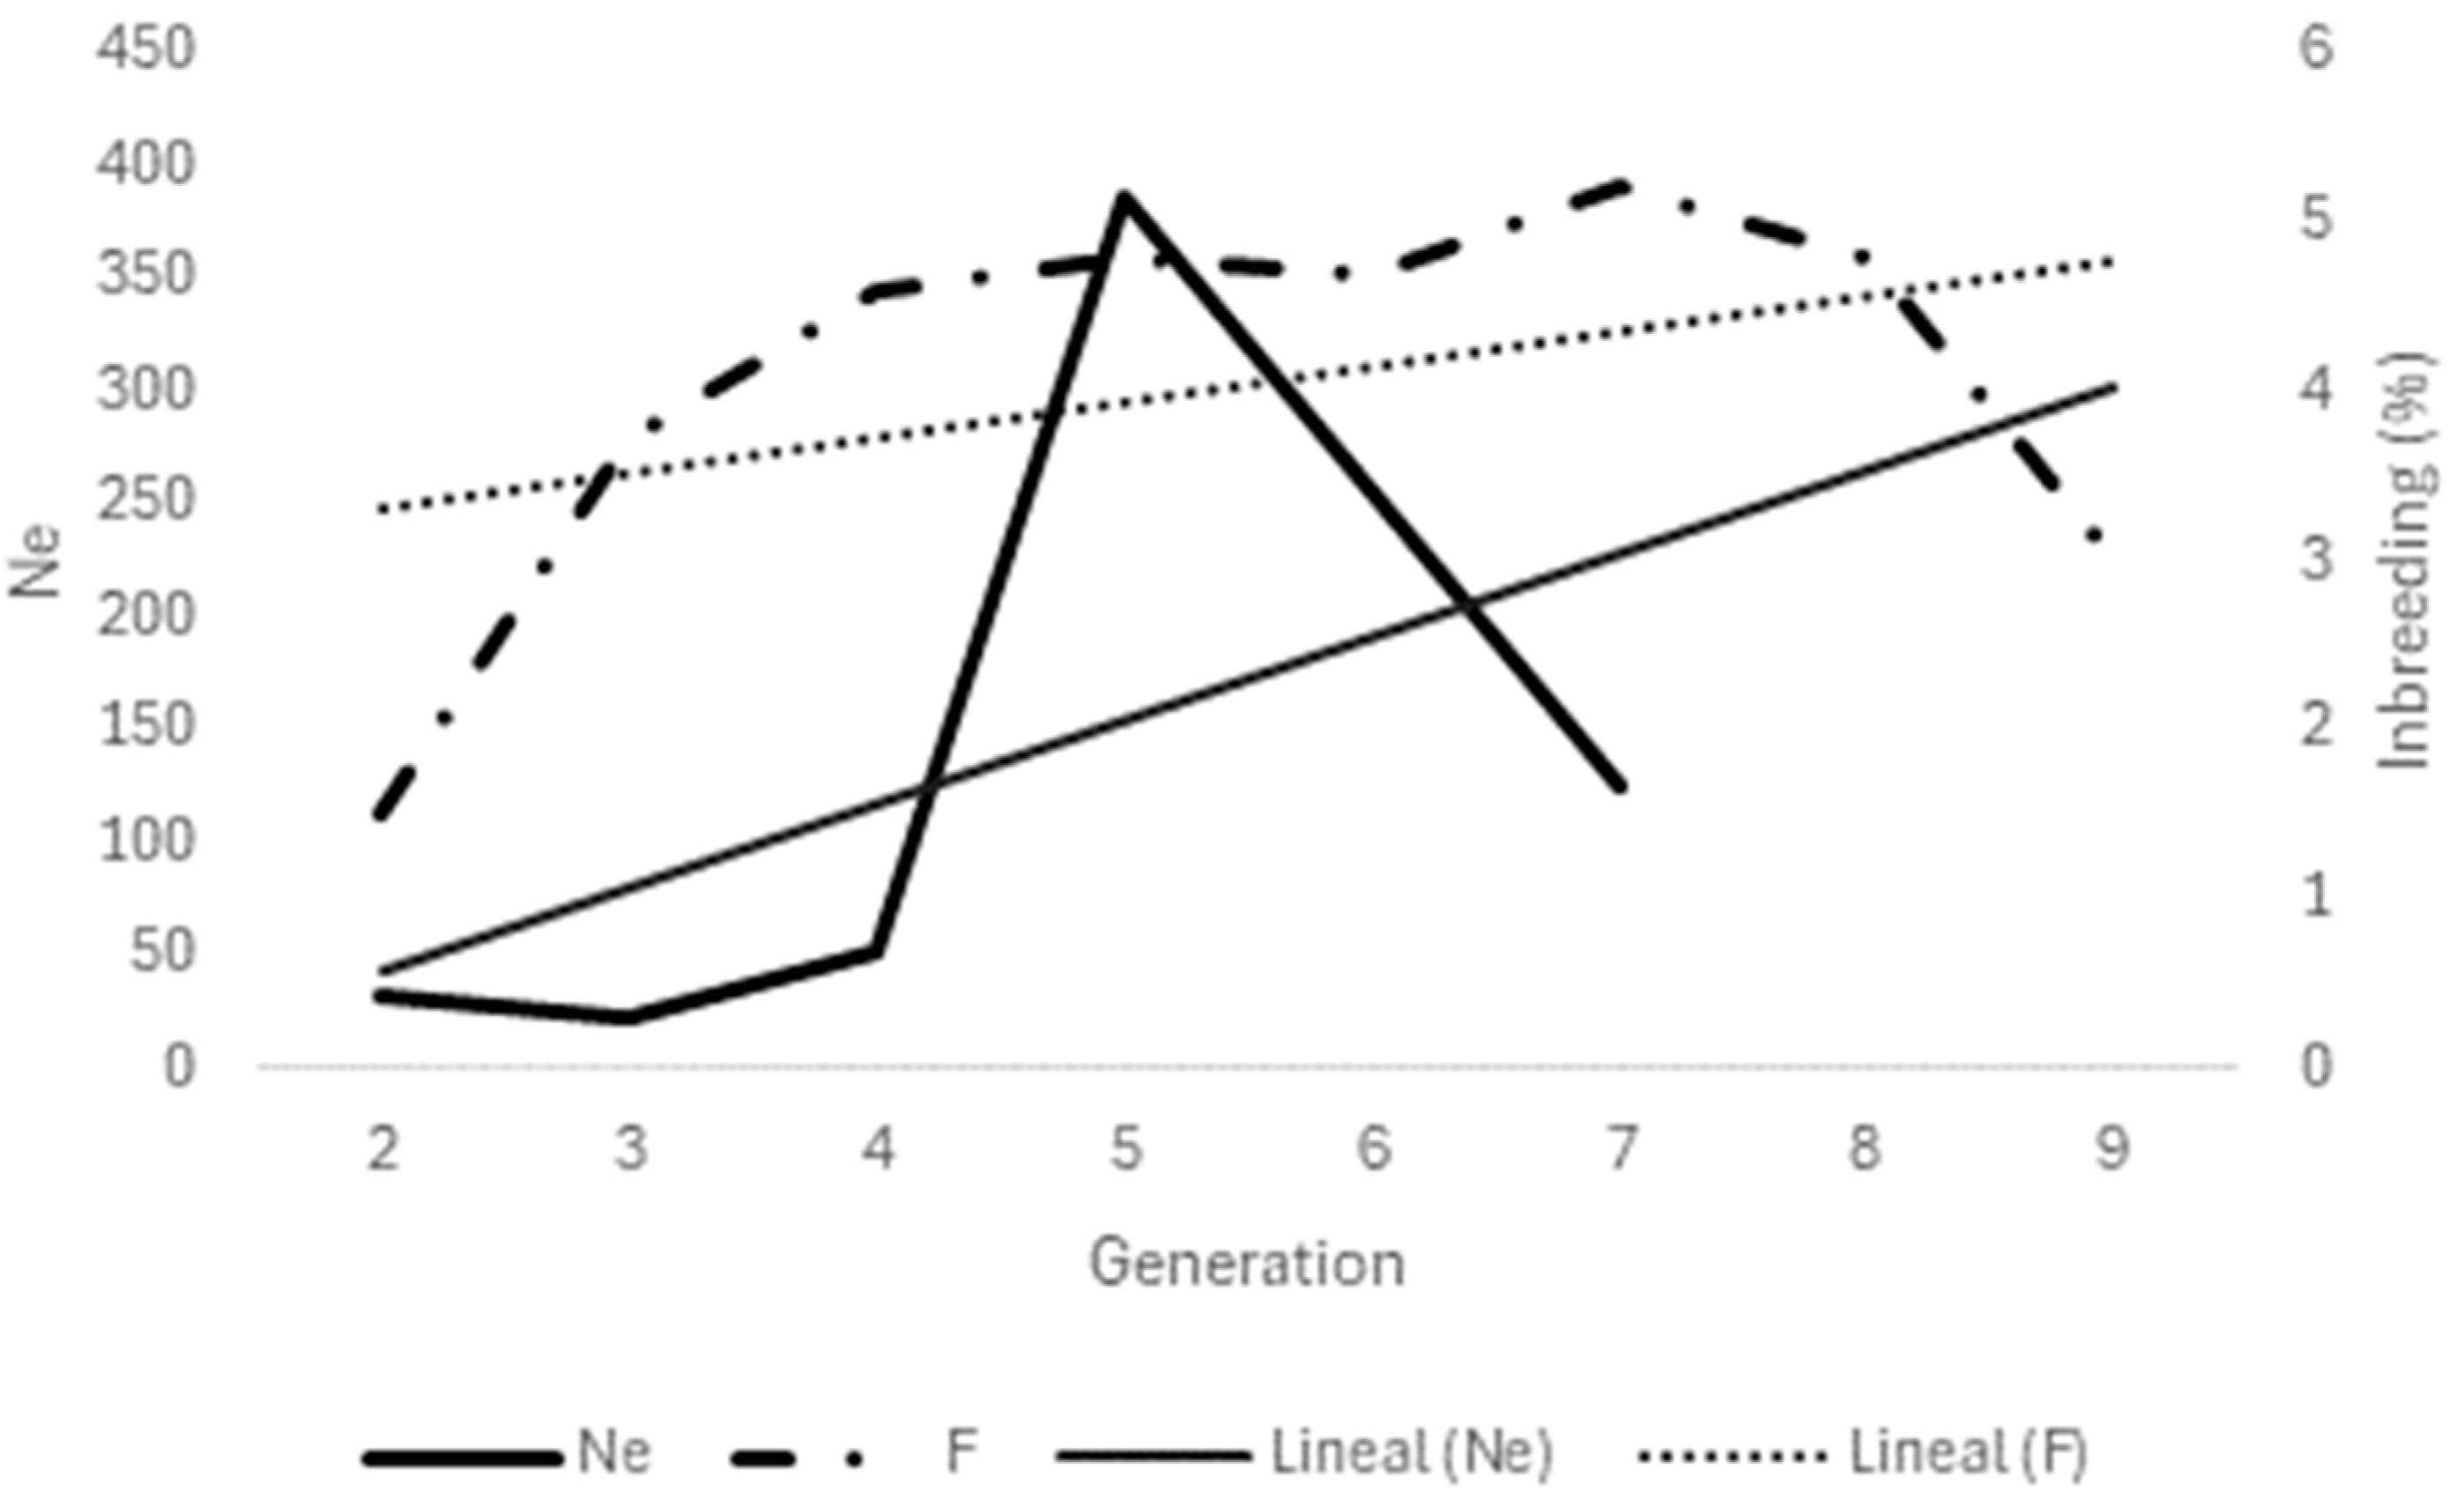
3.2.2. Effective Population Size
The Ne of the population is 57.6 for the maximum number of generations traced, but it is 22.1 computed via individual increase in inbreeding, a low value compared to the census. In its estimation through the generations (Table 3), a Ne of 124 is observed in the seventh generation, which increases to 387 individuals in the fifth generation, but decreases to 22 in the more recent generations, which implies a loss of diversity by reducing and counting less than 50 individuals. However, as negative estimates are observed in some generations, the model is considered to be poorly fitted due to artefactual conditions, derived from a wide generational interval, the overlap of generations, and the unbalanced ratio between males and females.
Ne was calculated by different methods and subjected to the decision tree; it was found that the method with the highest applicability is the one that identifies the complete ancestors born in that generation. The goodness of fit of the model is assessed in terms of its stability and completeness. The Ne obtained by this method supports the Ne of 22.
Although the population is large, the low value of Ne is explained by the difference between the sex ratio used for breeding and the unequal distribution of offspring between families, typical of cattle breeding where controlled crossbreeding is carried out with artificial insemination. This is confirmed by a high generation interval. Under these conditions, it is a loss of heterozygosity rather than a loss of alleles.
Figure 6.
Inbreeding coefficient (F) and number of inbreed animals in Sardo Negro cattle, by year of birth.
Figure 6.
Inbreeding coefficient (F) and number of inbreed animals in Sardo Negro cattle, by year of birth.
3.2.3. Ancestors
The population of 8,653 individuals has a reference population of 6,838 animals (Table 4) with the contribution of 1,175 founders, i.e. 13.6% of the total population. In addition, there is a base population of 1,815 individuals with one or both parents unknown (21.1%). As ƒe 37 founders were recognised as equal contributors and are expected to produce the same genetic diversity as in the population; ƒa 32 ancestors, founders or not, whose ratio (ƒe/ ƒa) indicates a balance between the contributions of the founders and the possible absence of the bottleneck effect in the evolution of the population. Only 21 ancestors explain 50% of the genetic variability of the study population.
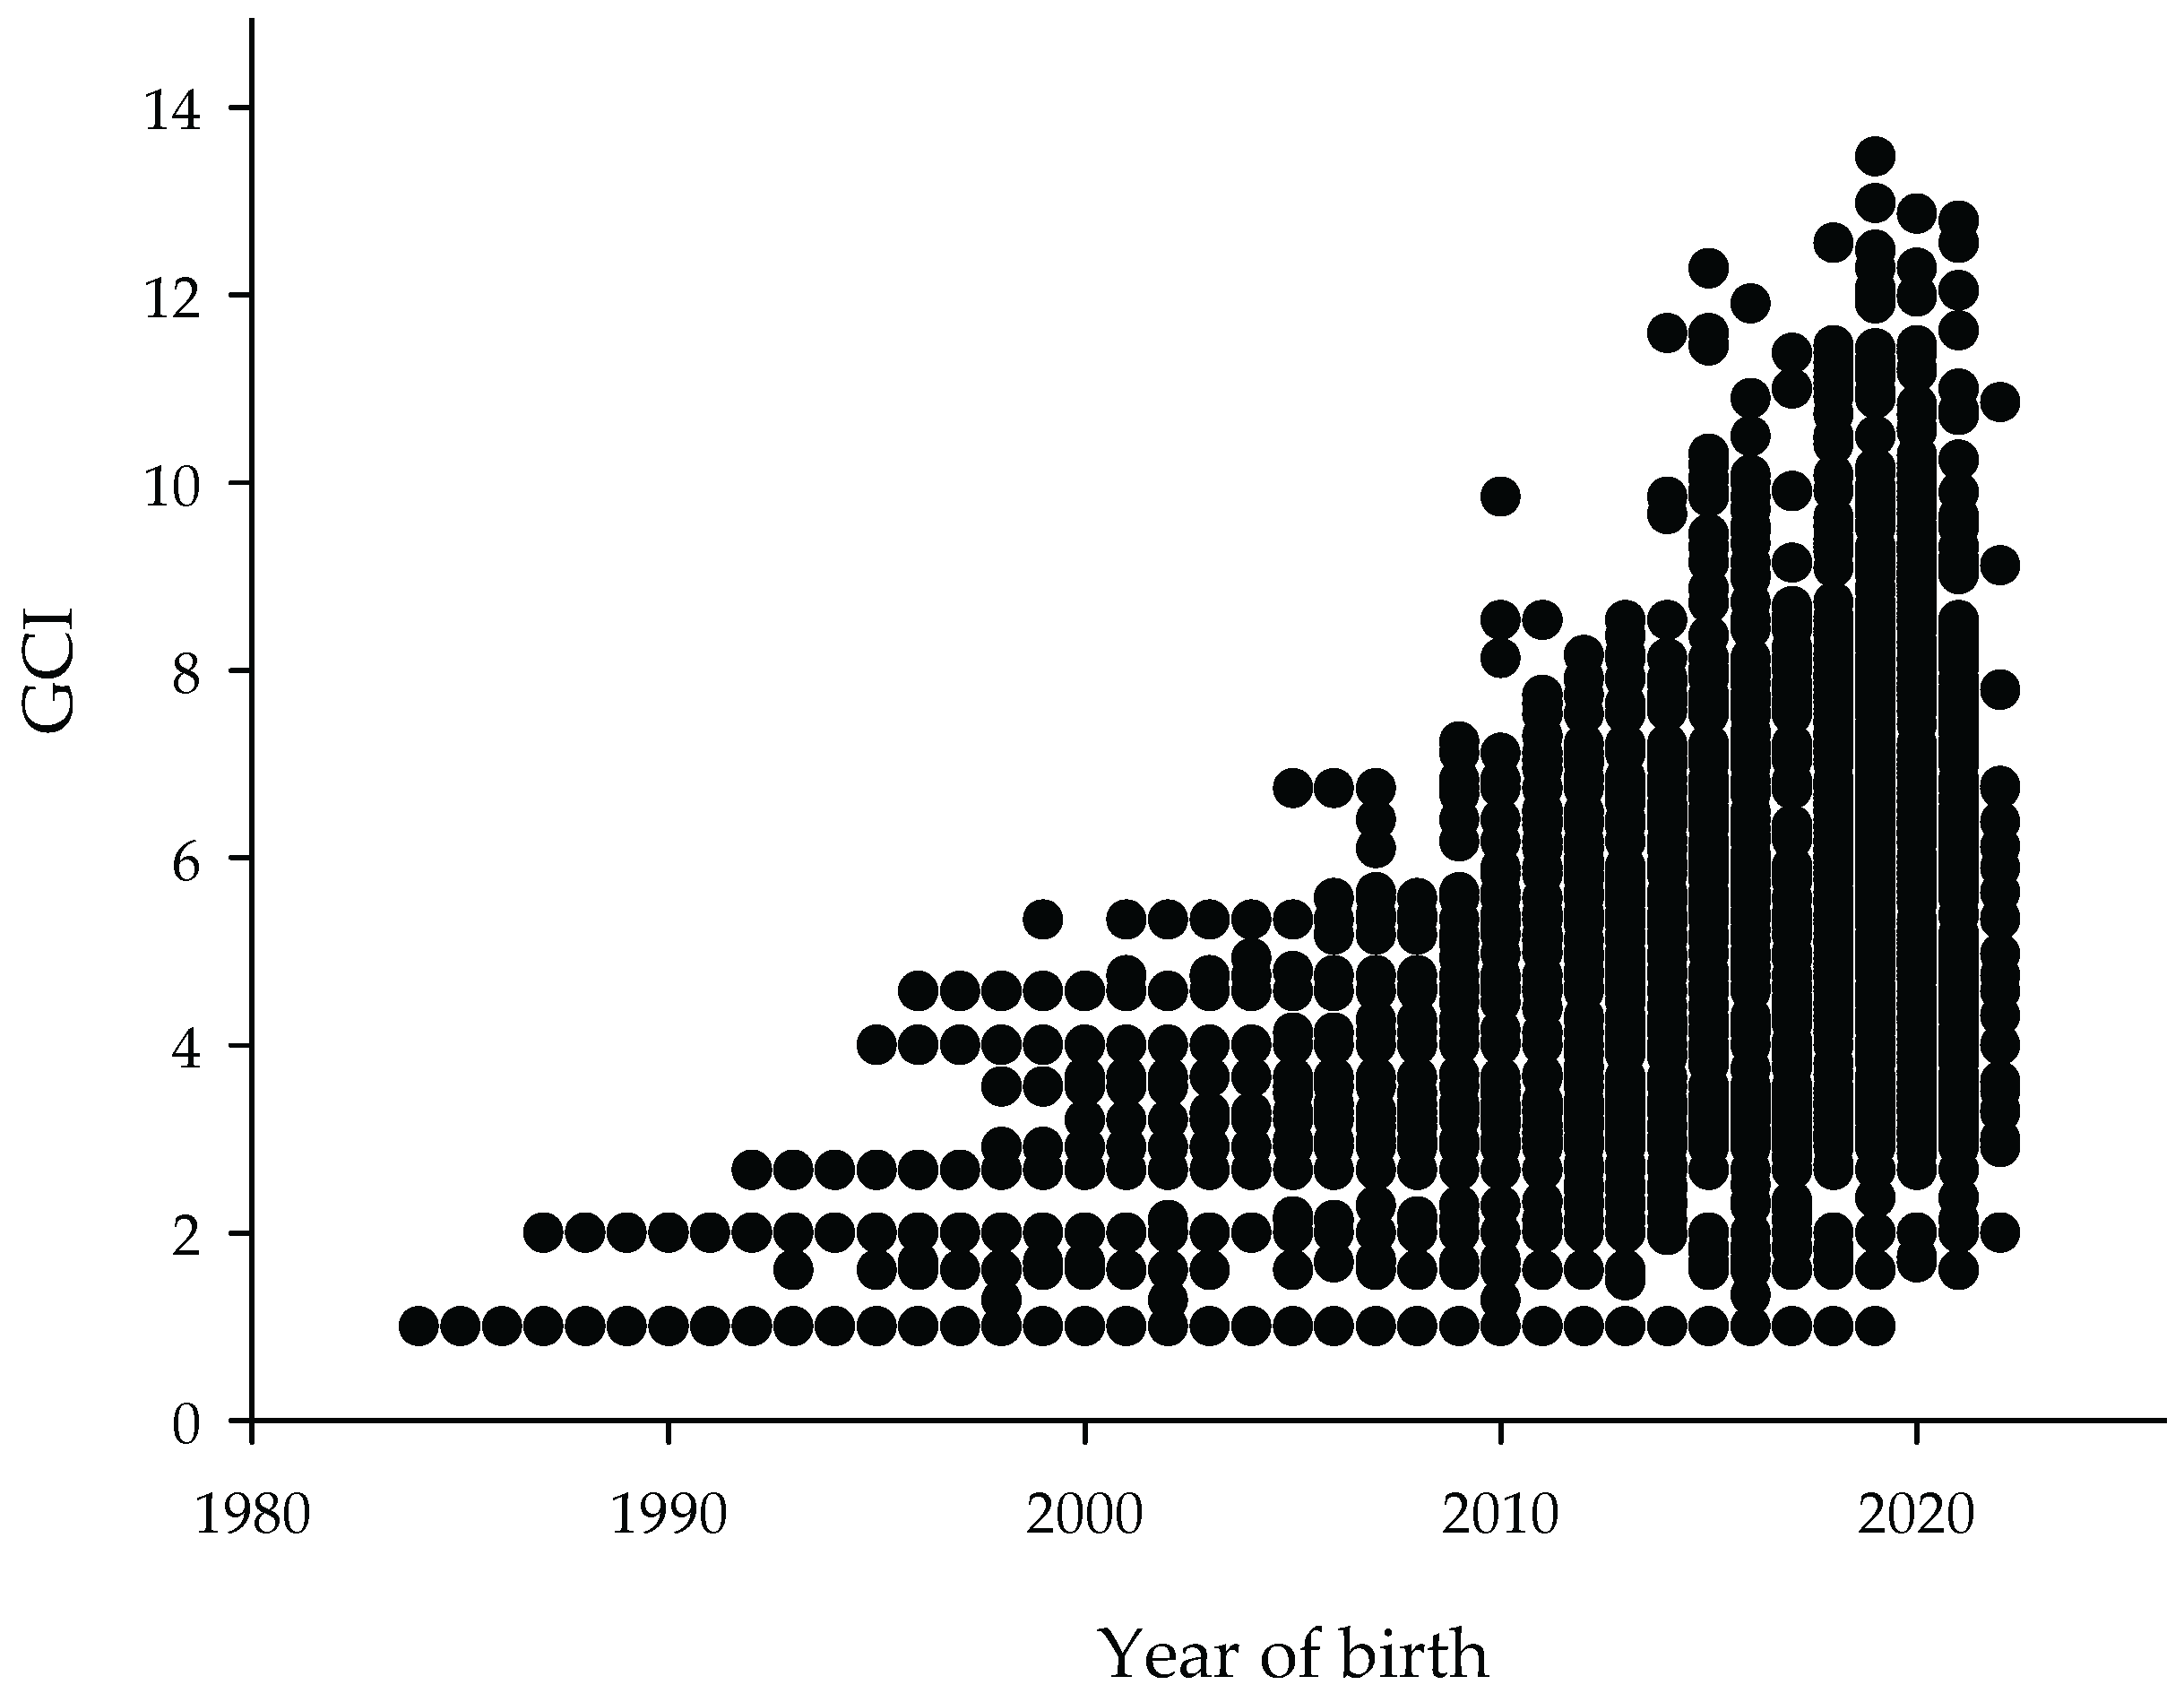
3.2.4. Genetic Conservation Index
The GCI calculated for each individual ranged from 1 to 13.47. Higher values indicate a greater contribution from the founders. The population as a whole had an average index of 3.3. Figure 6 shows that the population born in recent years has animals with GCI across the whole range. In order to maintain the founder alleles, it is recommended that breeders carry out selective crossbreeding between animals with a high GCI. However, when the data for this study was collected, livestock farmers did not consider this indicator when crossbreeding.
Figure 6.
Distribution of Genetic Conservation Index (GCI) by year of birth in Sardo Negro cattle.
3.2.5. Genetic Differentiation Between Subpopulations
The F-statistics of Wright (1965) was used to evaluate genetic differentiation in subdivided populations; the FST value was 0.018, which, being close to zero, indicates that there is no divergence between populations, allowing mating between them, as opposed to 1 or its closer values, which indicate differentiation or isolation of the metapopulation [37]. The parameter FIS = -0.005 indicates that the population is close to Hardy-Weinberg equilibrium, since this index varies between -1 and 1, with negative values indicating an excess of heterozygotes and positive values a deficiency of heterozygotes. The FIT value = 0.013, which indicates a minimum individual deviation with respect to the metapopulation, since it is close to zero. From these data, it can be concluded that by not isolating subpopulations and maintaining an intermediate level of differentiation, the population maintains substantial genetic variation that allows it to have a higher probability of long-term survival [37].
This is supported by the analysis of the genetic importance of the herds according to the contribution of breeding males. The results show that five subpopulations in this trial are considered multiplier herds as they use external males (33%) and sell their own males as sires. Only one subpopulation is commercial as it uses external bulls (39%) but does not share its males for breeding with other herds. Most herds use the highest proportion of their own sires, up to 75%. However, the proportion of progeny from other herds is low, ranging from 0.6 to 8.2% in multiplier herds (Table 5).
4. Discussion
4.1. Population Structure
In this population, where the number of animals is increasing every year and which is selected by the breeders, it is important to have a proper management of the crosses made in order to preserve the genetic diversity that has allowed this breed to adapt to the environment and to maintain itself in the face of future changes. To this end, the herds the breeders have applied the genealogical tracking, artificial insemination and the introduction of external bulls to improve the breed.
The ratio of females to males in this Sardo Negro population is similar to that observed in other cattle populations, such as Gyr and Sindi cattle, with a slightly higher proportion of females compared to other zebu breeds in Brazil [46], all close to 50%. This is also observed in AI pregnancies [47], although natural mating has been shown to favour the higher proportion of females born [48]. It is possible that this proportion is also related to the selection of animals for AMCC registration, where animals that do not achieve desirable phenotypic or health traits are not included in the pedigree. However, not all animals have the same opportunity to reproduce; a low proportion of males had offspring compared to females, as reported in different meat breeds in Mexico (Bos taurus and Bos taurus/Bos indicus) [49], mainly because in breeding production systems it is common to keep most of the females and only the outstanding males, as it is more profitable to keep few males in the herd [50]. Males are sold as sires to other herds or for commercial crossbreeding for meat or milk production and are not registered in the relevant association [51].
It is worth noting that in wild populations there is also no equal proportion of females and males that reproduce. In a study of deer, where males establish hierarchies and fight for females, the number of males that produce offspring is limited, with older and heavier males having an advantage [52]. This is reflected in the number of offspring per cow and bull, where similar results were obtained for Berrenda animals: 3 and 36 respectively [53]. Although its habitat is in the Iberian Peninsula, it has been catalogued as an endangered native breed that contributes to the ecological balance of the Dehesa. Since the number of breeding animals determines the genetic structure of the population in subsequent generations, and the rate of genetic progress depends on the age of the breeders and their rotation [37], it is essential to take this into account in the genetic improvement of the populations, while maintaining diversity. As mentioned before, these parameters may be related to the proportion of animals that are registered in the AMCC, not including dead calves, and those sold without any registry, or destined for supply.
It is known that changes in livestock population are determined by an interaction between genetic [54], environmental [55], management [56] and market-driven factors [57].
In the case of the Negra Andaluza breed, for example, its population has declined mainly due to changes in management and the introduction of foreign meat producing breeds [58]. Conversely, populations of Bos taurus breeds have experienced demographic growth and have colonised different geographical areas. However, this does not guarantee their success, as it has been demostrated that the loss of genetic diversity can threaten their survival [59,60]. Therefore, the population increase of the Sardo Negro breed, as demonstrated in this study, must be managed carefully to avoid the negative consequences of artificial selection. This is similar to what happened with the Belgian Campine breed, where its genetic diversity has favoured its reintroduction [61].
In general, the results of the analysis are more accurate when there is a better quality of the pedigree and a greater number of known generations [6], therefore it is necessary to have a greater history of genealogical records, more and more complete and reliable [62]. It is assumed that the low quality of this pedigree is related to the young age of the breed, which leads to an underestimation of the parameters related to the kinship of the animals.
In different populations of cattle breeds destined for meat production in Mexico, Bos taurus or hybrids with Bos indicus, the percentage of known ancestors was found to be between 67% and 93% in the first generation, between 49% and 92% in the grandparents' generation, and between 38% and 87% in the great-grandparents' generation [49], The main difference is between breeds: those with a longer registration time show a higher percentage of known ancestors. Additionally, as observed in the present study, a slightly higher percentage was noted in the paternal line, which can be attributed to the smaller number of carefully selected sires with known ancestry. In this sense, the present results show similarities with Romosinuano cattle populations in Mexico, where the CI is reported at the lowest level in the sixth generation and reaches 0.8 in recent generations [63]. In contrast Bos taurus Holstein cattle have 60 years of records, with the most recent half having a CI higher than 0.8 [64]. For these reasons, a low pedigree depth (EG = 1.8) was also observed. This is in contrast to other cattle populations, as studies with a higher pedigree background and a higher CI report an EG ranging from 4.8 in Sindi cattle to 7.2 in Brahman [46].
The GI presented is an average of those reported for other Bos indicus breeds and is higher than that observed for Bos taurus cattle, although there is no distinction between sires and dams. This may be because Zebu cattle have been developed in tropical climates, where resistant breeds are necessary, and their physiological characteristics mean they start their reproductive lives at a later age than European cattle and to remain in the herd for a longer time [65]. A previous study of Sardo Negro cattle indicated an average GI of 7.5 years [31]. In other Brazilian zebu breeds, the lowest GI was found in the Brahman breed, at 6.9 years, and the highest, at 9.8 years [46], in the Indubrasil breed, where the longest interval was found in the progeny of males. The differences observed in the GI between females and males of different breeds can be explained by the age at which the animals intended for reproduction are replaced, the number of offspring they produce and the specific years of reproductive life of each herd or area.
The lack of difference between fathers and mothers can be explained by the fact that both have been identified as more popular than the rest of the population and have been used as breeders for long periods. In Romosinuano Creole cattle, the GI was reported to be between 6.5 and 7.2 years [63] and in Berrendo cattle it was between 4.9 and 7.3 years. The GI was higher in females due to their long reproductive life [66]. De Rezende mentions that the generation interval in Limoisine and Charolais animals has been reduced by selection to improve economically important traits [67], as in Mexican beef breeds, which have a GI between 5.1 and 6.5 years. However, local European breeds with little reproductive management can also have a longer generation interval (8 to 13 years on average) than that reported in the present study, unlike cosmopolitan breeds (6 to 7 years on average) included in artificial insemination programs [6], so the introduction of reproductive technologies could be one of the main factors causing a lower GI.
Therefore, reduction of GI allows genetic improvement in less time, and maintenance of higher GI is a way to reduce the rate of diversity loss as a function of time [68], so it is essential to have a crossbreeding program that avoids diversity loss even if a lower GI is sought.
4.2. Inbreeding and Diversity
Inbreeding (F), resulting from the systematic selection of related breeding animals to maintain phenotypic characteristics, can be highly variable in domestic animals. One factor that causes this is a small population size [4]. Since the selection started with some animals of superior phenotype coming from Brazil, crossed with Creole Zebu animals, there were few individuals that started the Sardo Negro breed. This could have generated a high number of crosses of related individuals in the beginning, but there are no records to support this information, as CI shows in the most distant generations. The average F in the study population is considered acceptable since it is less than 6.25% [44,45]. As reported in the previous study, the average F for the Sardo Negro breed was 3.6% [31].
In Brazil, an average F of 1.9 to 6.2% has been reported in different zebu breeds [46] and an average of 2.4 to 12.9% in fighting cattle herds in Mexico [69], both of which are known to develop under harsh conditions. Fighting cattle reached a critical percentage of inbreeding, mainly because it is also considered a population that started with a small group of animals as founders. The different local European breeds reported by Fabbri (2019) show F from 1.2 to 7.3%, although they have a low percentage of crossbreeding between siblings and half-siblings, the main difference with the highest values is given by the crossbreeding between parents and their offspring, which indicates a low reproductive control of the herd characteristic of local breeds [6].
However, the low percentage of crossbreeding between siblings and between parents and offspring, and the higher percentage of crossbreeding between half-siblings, suggests that crossbreeding is directed to fix some desirable phenotype in the animals. On the other hand, in the American Angus population there is an average F of 5.9%, although depression in growth traits is mentioned [70]. In addition, although 2.6% inbreeding has been recorded in Holstein cattle in Mexico [22], a value similar to that reported here, it has been found that individuals with F greater than 5% show a decrease in milk, fat and protein production. Considering that these animals come from a reduced number of herds that produce their replacements and have a low sire population, similar to the management of Sardo Negro cattle, it is necessary to monitor and maintain low F levels to avoid inbreeding depression.
The ancestral inbreeding coefficients of 0.027 in FaBAL and 0.029 in FaKAL are on average similar to those reported by other authors, but their differences indicate different selection patterns. In the work of Hindrichs et al. in 2015 [71], the former is higher with FaBAL 0.082, indicating a higher probability that each allele has been IBD at least once in previous generations, and the latter with FaKAL 0.007 has a lower probability of being IBD both at present and in its ancestors, so the inbreeding could have originated in more distant generations; the above in Holstein cattle with 3% of F; this author mentions that about 26% of non-inbred animals show ancestral inbreeding, higher than what is presented here (17%), perhaps because they are dairy cattle that have had a strong intensity of selection for several generations. On the other hand, Wirth et. al (2023) in German Brown cattle with an average F of 2.3% reported ancestral inbreeding coefficients of 0.002 for FaKAL and 0.012 for AHC, which may indicate that the intensity of selection and consequent inbreeding may be recent [72].
Contrary to the present research (GE=1.8), these studies had an average GE of 4.8 and 6.2, respectively, so that with a greater pedigree depth, the values could be more accurate, especially since these authors mention an important depression by inbreeding in different productive traits [72], which could limit the survival capacity of individuals. Since inbreeding is manifested by the presence of deleterious alleles and represents a considerable threat to the survival of populations [73], it is necessary to eliminate these negative effects when inbreeding is combined with selection [74], i.e. if deleterious alleles are effectively eliminated by selection when they are in the homozygous state, it is recommended to establish selection strategies that allow avoiding the loss of genetic diversity. According to the population structure found in the Sardo Negro breed, this would avoid falling into inbreeding depression.
The 2.5% value of relatedness presented here suggests a high percentage of individuals sharing alleles with the rest of the population, which can increase in breeding by increasing the probability of mating between related individuals if reproduction in the population is not controlled [75], so it is suggested that breeding programs include breeders with AR values less than 1. In the study conducted by Fabbri et al. (2019), it was observed that the higher the inbreeding, the higher the average number of relatives, especially in local breeds with very little reproductive control [6], so neglecting the relatedness of the population compromises inbreeding in future generations.
According to FAO, a Ne of at least 50 animals is recommended to avoid loss of diversity [1], although in previous generations it was higher than this figure, in the last generation a Ne of 20 animals has been reported with a population that has increased every year, which can lead to loss of variability. In local Italian breeds, the Ne ranges from 14 to 40, unlike cosmopolitan breeds in the same country, where the Ne reported is 90 and 133 in two different populations [6]. On the other hand, in Mexico, different cosmopolitan breeds dedicated to meat production report Ne from 24 to 155, although being transboundary breeds, it is possible to induce the flow of genetic material to avoid loss of diversity [49]. In general, the variability of Ne among different cattle breeds reflects the differences in breeding strategies and genetic history of each breed. Under these conditions, it is considered a loss of heterozygosity rather than a loss of allelic diversity [37]. It is important to mention that the present study considers only a part of the total population of Sardo Negro animals bred in Mexico, so the Ne of the total population in this country has been greater [31].
The fe/fa ratio is similar to that published by [6], where the local breeds evaluated had fe/fa between 1.1 and 1.2, so no bottleneck is identified, unlike the cosmopolitan Charolais and Limousine breeds in Italy with values between 2 and 3, which demonstrated the presence of a bottleneck in the populations, mainly due to the selection they receive, as also occurs in the Mexican Charolais cattle population [76]. However, it is possible that a founder effect is present due to the reduced number of animals explaining the 50% of the population, as occurs in the Italian Tuscan breed [6]. Although the Sardo Negro animals presented here are also selected, it can be concluded that irreversible changes in the structure of the study population have not yet been provoked, but if the effective number of the population is not increased and a balanced use of breeders is not made, a possible loss of diversity or heterozygosity could be induced.
4.3. Implications for Conservation
Regarding the GCI, the results obtained are similar to those obtained by Figueredo, et al. (2019) in the Brazilian Somali sheep, which suggest that animals with a higher CGI, that is, with a higher contribution of the founders, can be used strategically for breeding to maintain the founder alleles [77], so it is necessary to perform targeted matings from animals with a high GCI, in which each subpopulation should identify these individuals. Contrary to the result obtained in the Murciano Granadina goat [78], with an average GCI of 1.64, where the low and unbalanced contribution of the founders hinders the conservation of the original diversity of the breed.
Based on the Wrigth statistics obtained in the present study (FIS 0.005, FST 0.01, FIT 0.013), a similar FST with an average value of 0.0086 was reported in Mexican fighting cattle populations, although the lower FIS -0.167, which could indicate an increase in heterozygotes [79]. On the other hand, Ribeiro et al. (2021), reported FIS values -0.157, FST 0.104 and FIT -0.036, indicating a balance in the presence of homozygotes and heterozygotes, despite the inbreeding between subpopulations [5]. Therefore, these data show that the population is at an intermediate level of differentiation. This is consistent with a previous genome-wide study of this breed [80]. This gives the breed a substantial amount of genetic variation, thereby increasing its chances of long-term survival.
This is supported by the population structure by herd, based on the contribution of breeding males, where most herds are multipliers with exchange of genetic material between subpopulations, as occurs in different populations around the world, especially with the use of assisted reproductive technologies. Although García-Atance et., al (2023) recommend the exchange of animals between herds to avoid the loss of genetic diversity [68], these exchanges must be managed with care to guarantee the conservation of diversity [81], above all by knowing the background of the breeding individuals to avoid inducing inbreeding not foreseen by the ancestors.
According to the FAO, the countries of Latin America and the Caribbean have a very rich national biodiversity, but few active conservation programmes [1]. As with other species and breeds used in this region, the ancestors of the Sardo Negro breed were imported and improved through breeding programmes to become purebreds adapted to local conditions, so there is a need to care for and maintain their diversity. The results of this research suggest that maintaining genetic diversity in Sardo Negro cattle requires careful management of crossbreeding within the breeding herd. This should take into account the effective population size, F and CGI, particularly given that the population is currently growing (see Figure 2). Furthermore, zebu cattle breeding is essential for ensuring food security in tropical regions.
For all of the above reasons, conservation measures must be taken to avoid irreversible loss of the genetic resources that constitute the assets of each region, in order to maintain biodiversity, food supply and protection against future threats [82].
5. Conclusions
The Sardo Negro breed in Mexico has a sire/male ratio close to 50%, with 3 progeny per cow and 31 per bull. The pedigree records of this breed show a significant population growth over the years, although they have a low pedigree completeness in the older generations.
In this study, inbreeding and relatedness averages are quite low considering that this is a population derived from controlled breeding, but due to the low pedigree integrity some of these indicators could be underestimated. In addition, conditions that can lead to loss of genetic diversity in this population have been identified, such as highly inbred individuals, low effective population size and the founder effect, despite which diversity is still conserved, so strategies should be implemented to mitigate such situations.
The wide GI presented is considered an advantage because it can prevent the rapid loss of genetic diversity; the identification and inclusion of animals with a high genetic conservation index in the reproduction programs, as well as the opening to reproduction between subpopulations, can make it possible to preserve the diversity of the breed and its genetic relationship without isolation, conditions that confer a higher probability of long-term survival in the face of unexpected changes.
It is considered necessary to continue the registration, analysis and dissemination of genealogical data in herds dedicated to the breeding of Sardo Negro cattle, as well as to review and improve the breeding strategy in order to carry out adequate management of the population and to ensure the conservation of its diversity over the years.
An effective management programme for conserving the Sardo Negro breed must involve identifying key breeding males and planning matings to control inbreeding. The programme should prioritise animals with a high genetic conservation index and consider crossbreeding between animals from different herds to maintain breed diversity. Crossbreeding between related individuals should also be avoided.
Author Contributions
Conceptualization, B.C. and P.C.; methodology B.C., A.H. and V.V.; software, V.V., B.D. and V.L.; validation A.H. and V.L.; formal analysis, B.C..; investigation, B.C., V.V. A.H. and V.L.; data curation, B.C. and B.D.; writing—original draft preparation, B.C. and P.C.; writing—review and editing, B.D., V.V. and A.H.; visualization, V.L.; supervision, P.C. and A.H. All authors have read and agreed to the published version of the manuscript.
Funding
This research received no external funding.
Institutional Review Board Statement
Not applicable.
Informed Consent Statement
Informed consent was obtained from all herd owners who participated in the study.
Data Availability Statement
The data sets presented in this article are not available due to privacy restrictions imposed by livestock breeders.
Acknowledgments
The authors would like to thank the Sardo Negro cattle breeders for providing the genealogical data of their animals. Involved herds: Oro Verde, Valle Hermoso, El Tucán, Zapoteco, El Redentor, and Don Juan in the states of Veracruz and Chiapas, Mexico.
Conflicts of Interest
The authors declare no conflict of interest.
References
- Food and Agriculture Organization of the United Nations Sustainable Agriculture for Biodiversity – Biodiversity for Sustainable Agriculture; Roma, Italia, 2018.
- Robinson, T.P.; William Wint, G.R.; Conchedda, G.; Van Boeckel, T.P.; Ercoli, V.; Palamara, E.; Cinardi, G.; D’Aietti, L.; Hay, S.I.; Gilbert, M. Mapping the Global Distribution of Livestock. PLoS One 2014, 9. [Google Scholar] [CrossRef]
- Leroy, G.; Baumung, R.; Boettcher, P.; Besbes, B.; From, T.; Hoffmann, I. Animal Genetic Resources Diversity and Ecosystem Services. Glob Food Sec 2018, 17. [Google Scholar] [CrossRef]
- Vizmanos Pérez, J.L. Claves de La Genética de Poblaciones; Elsevier España: Barcelona, España, 2014. [Google Scholar]
- Gutiérrez, J.P.; Goyache, F. A Note on ENDOG: A Computer Program for Analysing Pedigree Information. Journal of Animal Breeding and Genetics 2005, 122. [Google Scholar] [CrossRef] [PubMed]
- Fabbri, M.C.; de Rezende, M.P.G.; Dadousis, C.; Biffani, S.; Negrini, R.; Carneiro, P.L.S.; Bozzi, R. Population Structure and Genetic Diversity of Italian Beef Breeds as a Tool for Planning Conservation and Selection Strategies. Animals 2019, 9. [Google Scholar] [CrossRef]
- SIAP (Servicio de información Agroalimentaria y pesquera) Avance de La Producción Mensual Por Estado. Producción Mensual Ganadera. SADER, 2021.
- FAOSTAT Crops and Livestock Production. Statistical database 2021.
- Osorio-Arce, M.M.; Segura-Correa, J.C. Sustentabilidad de Los Sistemas de Producción Bovina En El Trópico: Mejoramiento Genético. Livestock Research for Rural Development 2011, 23. [Google Scholar]
- Mehrabi, Z.; Gill, M.; van Wijk, M.; Herrero, M.; Ramankutty, N. Livestock Policy for Sustainable Development. Nat Food 2020, 1. [Google Scholar] [CrossRef]
- Hansen, P.J. Physiological and Cellular Adaptations of Zebu Cattle to Thermal Stress. In Proceedings of the Animal Reproduction Science; 2004; Vol. 82–83.
- Cooke, R.F.; Cardoso, R.C.; Cerri, R.; Lamb, G.C.; Pohler, K.G.; Riley, D.G.; Vasconcelos, J.L.M. Cattle Adapted to Tropical and Subtropical Environments: Genetic and Reproductive Considerations. J Anim Sci 2020, 98. [Google Scholar] [CrossRef]
- Sponenberg, D.P. Conserving the Genetic Diversity of Domesticated Livestock. Diversity (Basel) 2020, 12. [Google Scholar] [CrossRef]
- Ortega R., E.; Belk, T.; Castañeda, J. El Cebú Origen y Desarrollo En México; Asociación Mexicana de Criadores de Cebú, 2012.
- Castañeda, J.; Ortiz Lanz, C. La Odisea Del Cebú En México. Centenario de La Llegada Del Ganado Brasileño; Asociación Mexicana de Criadores de Cebú, 2024.
- Asociación Mexicana de Criadores de Cebú Patrón de La Raza Sardo Negro Available online: https://cebumexico.com/patrones-raciales/.
- Domínguez V., J.; Rodríguez A., F.A. Resumen de Evaluaciones Genéticas En Bovinos Cebú de México 2018; 2018.
- Asociación Mexicana de Criadores de Cebú Sardo Negro Available online: https://cebumexico.com/sardo-negro/.
- Cooke, R.F. 385 Awardee Talk: Impacts of Temperament on Productive and Reproductive Responses of Bos Taurus and B. Indicus Females. J Anim Sci 2020, 98. [Google Scholar] [CrossRef]
- FAO Sistema de Información Sobre La Diversidad de Los Animales Domésticos (DAD-IS). FAO 2020.
- Santana, M.L.; Oliveira, P.S.; Pedrosa, V.B.; Eler, J.P.; Groeneveld, E.; Ferraz, J.B.S. Effect of Inbreeding on Growth and Reproductive Traits of Nellore Cattle in Brazil. Livest Sci 2010, 131. [Google Scholar] [CrossRef]
- García-Ruiz, A.; Martínez-Marín, G.J.; Cortes-Hernández, J.; Ruiz-López, F.D.J. Niveles de Consanguinidad y Sus Efectos Sobre La Expresión Fenotípica En Ganado Holstein. Rev Mex Cienc Pecu 2022, 12. [Google Scholar] [CrossRef]
- Mc Parland, S.; Kearney, J.F.; MacHugh, D.E.; Berry, D.P. Inbreeding Effects on Postweaning Production Traits, Conformation, and Calving Performance in Irish Beef Cattle. J Anim Sci 2008, 86. [Google Scholar] [CrossRef] [PubMed]
- Tisdell, C. Socioeconomic Causes of Loss of Animal Genetic Diversity: Analysis and Assessment. Ecological Economics 2003, 45. [Google Scholar] [CrossRef]
- Nardelli, M.; Túnez, J.I. Aportes de La Genética de La Conservación al Estudio de Los Mamíferos Neotropicales: Revisión y Análisis Crítico. Ecología Austral 2017, 27. [Google Scholar] [CrossRef]
- Colli, L.; Milanesi, M.; Talenti, A.; Bertolini, F.; Chen, M.; Crisà, A.; Daly, K.G.; Del Corvo, M.; Guldbrandtsen, B.; Lenstra, J.A.; et al. Genome-Wide SNP Profiling of Worldwide Goat Populations Reveals Strong Partitioning of Diversity and Highlights Post-Domestication Migration Routes. Genetics Selection Evolution 2018, 50. [Google Scholar] [CrossRef] [PubMed]
- Dadar, M.; Mahyari, S.A.; Rokouei, M.; Edriss, M.A. Rates of Inbreeding and Genetic Diversity in Iranian Holstein Cattle. Animal Science Journal 2014, 85. [Google Scholar] [CrossRef]
- Poirier, M.A.; Coltman, D.W.; Pelletier, F.; Jorgenson, J.; Festa-Bianchet, M. Genetic Decline, Restoration and Rescue of an Isolated Ungulate Population. Evol Appl 2019, 12. [Google Scholar] [CrossRef]
- Santana, M.L.; Pereira, R.J.; Bignardi, A.B.; El Faro, L.; Tonhati, H.; Albuquerque, L.G. History, Structure, and Genetic Diversity of Brazilian Gir Cattle. Livest Sci 2014, 163. [Google Scholar] [CrossRef]
- Dash, S.; Singh, A.; Bhatia, A.K.; Jayakumar, S.; Sharma, A.; Singh, S.; Ganguly, I.; Dixit, S.P. Evaluation of Bovine High-Density SNP Genotyping Array in Indigenous Dairy Cattle Breeds. Anim Biotechnol 2018, 29. [Google Scholar] [CrossRef]
- Domínguez-Viveros, J.; Reyes-Cerón, A.; Saiz-Pineda, J.F.; Villegas-Gutiérrez, C.; Aguilar-Palma, G.N.; Rodríguez-Almeida, F.A. Structure and Genetic Variability of the Mexican Sardo Negro Breed. Ciência Rural 2022, 52. [Google Scholar] [CrossRef]
- INEGI (Instituto Nacional de Estadística, G. en I. Compendio de Información Geográfica Municipal 2010 2010.
- Vidal, R. Las Regiones Climáticas de México. Instituto de Geografía, UNAM 2005, 2.
- Groeneveld, E.; Westhuizen, B.D.; Maiwashe, A.; Voordewind, F.; Ferraz, J.B. POPREP: A Generic Report for Population Management. Genet Mol Res 2009, 8. [Google Scholar] [CrossRef] [PubMed]
- Baumung, R.; Farkas, J.; Boichard, D.; Mészáros, G.; Sölkner, J.; Curik, I. Grain: A Computer Program to Calculate Ancestral and Partial Inbreeding Coefficients Using a Gene Dropping Approach. Journal of Animal Breeding and Genetics 2015, 132. [Google Scholar] [CrossRef] [PubMed]
- Maccluer, J.W.; Boyce, A.J.; Dyke, B.; Weitkamp, L.R.; Pfenning, D.W.; Parsons, C.J. Inbreeding and Pedigree Structure in Standardbred Horses. Journal of Heredity 1983, 74. [Google Scholar] [CrossRef]
- Allendorf, F.W.; Funk, W.C.; Aitken, S.N.; Byrne, M.; Luikart, G. Conservation and the Genomics of Populations; 3rd ed.; Oxford University Press, 2022.
- Caballero, R.A. Cuantitative Genetics; 1st ed.; Cambridge University Press, 2020.
- Meuwissen, T.H.E.; Luo, Z. Computing Inbreeding Coefficients in Large Populations. Genetics, Selection, Evolution 1992, 24. [Google Scholar] [CrossRef]
- Alderson, G.L.H. A System to Maximize the Maintenance of Genetic Variability in Small Populations. Genetic Conservation of Domestic Livestock 1992, 2, 18–29. [Google Scholar]
- Vassallo, J.M.; Diaz, C.; Garcia-Medina, J.R. A Note on the Population Structure of the Avileña Breed of Cattle in Spain. Livest Prod Sci 1986, 15. [Google Scholar] [CrossRef]
- Bó, G.; Carballo, D.; Tribulo, A.; Tribulo, H.; Tribulo, R.; Mapletoft, R. Nuevos Tratamientos Hormonales Para La Superovulación De Donantes De Embriones Bovinos. Zona Rural General Paz 2011, 13. [Google Scholar]
- García, D.B. Generalinades de Inseminación Artificial a Tiempo ( IATF ) En Bovinos. Universidad Cooperativa de Colombia 2019. [Google Scholar]
- Florio, J. Consanguinidad En La Ganadería Bovina. In Manual de ganadería doble propósito 2005; González-Stagnaro, C., Soto B., E., Eds.; Ediciones Astro Data: Maracaibo Venezuela.
- FAO In Vivo Conservation of Animal Genetic Resources; 2013.
- Santana Jr., M. L.; Pereira, R.J.; Bignardi, A.B.; Ayres, D.R.; Menezes, G.R.O.; Silva, L.O.C.; Leroy, G.; Machado, C.H.C.; Josahkian, L.A.; Albuquerque, L.G. Structure and Genetic Diversity of Brazilian Zebu Cattle Breeds Assessed by Pedigree Analysis. Livest Sci 2016, 187, 6–15. [Google Scholar] [CrossRef]
- Roelofs, J.B.; Bouwman, E.B.; Pedersen, H.G.; Rasmussen, Z.R.; Soede, N.M.; Thomsen, P.D.; Kemp, B. Effect of Time of Artificial Insemination on Embryo Sex Ratio in Dairy Cattle. Anim Reprod Sci 2006, 93. [Google Scholar] [CrossRef] [PubMed]
- Delesa, E.K.; Yohannes, A.; Alemayehu, M.; Samuel, T.; Yehualaeshet, T. Calves’ Sex Ratio in Naturally and Artificially Bred Cattle in Central Ethiopia. Theriogenology 2014, 82. [Google Scholar] [CrossRef]
- Ramírez-Valverde, R.; Delgadillo-Zapata, A.R.; Domínguez-Viveros, J.; Hidalgo-Moreno, J.Á.; Núñez-Domínguez, R.; Rodríguez-Almeida, F.A.; Reyes-Quiroz, C.; García-Muñiz, J.G. Análisis de Pedigrí En La Determinación de La Diversidad Genética de Poblaciones Bovinas Para Carne Mexicanas. Rev Mex Cienc Pecu 2018, 9. [Google Scholar] [CrossRef]
- Filipini, V.T.; Isola, J.V.V.; Neves, A.P.; Barbosa, M.R.; Wienke, B.C.D.S.; Scherer, N.P.; da Fontoura Júnior, J.A.S. Simulation Model for Bull: Cow Ratio in Beef Cattle. Braz J Vet Res Anim Sci 2020, 57. [Google Scholar] [CrossRef]
- Román, P.H.; Aguilera, S.R.; Patraca, F.A. Producción y Comercialización de Ganado y Carne de Bovino En El Estado de Veracruz. Comté Nacional del Sistema Producto Bovinos Carne 2012, Volume 1.
- Kie, J.G.; Johnson, B.K.; Noyes, J.H.; Williams, C.L.; Dick, B.L.; Rhodes, O.E.; Stussy, R.J.; Bowyer, R.T. Reproduction in North American Elk Cervus Elaphus: Paternity of Calves Sired by Males of Mixed Age Classes. Wildlife Biol 2013, 19. [Google Scholar] [CrossRef] [PubMed]
- González-Cano, R.; González-Martínez, A.; Muñoz-Mejías, M.E.; Valera, P.; Rodero, E. Analyses of Genetic Diversity in the Endangered"Berrenda" Spanish Cattle Breeds Using Pedigree Data. Animals 2022, 12. [Google Scholar] [CrossRef]
- Elayadeth-Meethal, M.; Thazhathu Veettil, A.; Maloney, S.K.; Hawkins, N.; Misselbrook, T.H.; Sejian, V.; Rivero, M.J.; Lee, M.R.F. Size Does Matter: Parallel Evolution of Adaptive Thermal Tolerance and Body Size Facilitates Adaptation to Climate Change in Domestic Cattle. Ecol Evol 2018, 8. [Google Scholar] [CrossRef]
- Murray-Tortarolo, G.N.; Jaramillo, V.J. Precipitation Extremes in Recent Decades Impact Cattle Populations at the Global and National Scales. Science of the Total Environment 2020, 736. [Google Scholar] [CrossRef]
- Chawala, A.R.; Banos, G.; Peters, A.; Chagunda, M.G.G. Farmer-Preferred Traits in Smallholder Dairy Farming Systems in Tanzania. Trop Anim Health Prod 2019, 51. [Google Scholar] [CrossRef]
- Blackburn, H.; Plante, Y. North American Animal Breeding and Production: Meeting the Needs of a Changing Landscape. Journal of Animal Breeding and Genetics 2014, 131. [Google Scholar] [CrossRef] [PubMed]
- Cartuche Macas, L.F.; Camacho Vallejo, M.E.; González Ariza, A.; León Jurado, J.M.; Delgado Bermejo, J.V.; Marín Navas, C.; Navas González, F.J. Analysis of Endangered Andalusian Black Cattle (Negra Andaluza) Reveals Genetic Reservoir for Bovine Black Trunk. Animals 2024, 14. [Google Scholar] [CrossRef]
- Mc Parland, S.; Kearney, J.F.; Rath, M.; Berry, D.P. Inbreeding Trends and Pedigree Analysis of Irish Dairy and Beef Cattle Populations. J Anim Sci 2007, 85. [Google Scholar] [CrossRef]
- Ablondi, M.; Sabbioni, A.; Stocco, G.; Cipolat-Gotet, C.; Dadousis, C.; Kaam, J.T. van; Finocchiaro, R.; Summer, A. Genetic Diversity in the Italian Holstein Dairy Cattle Based on Pedigree and SNP Data Prior and After Genomic Selection. Front Vet Sci 2022, 8. [Google Scholar] [CrossRef]
- François, L.; Wijnrocx, K.; Colinet, F.G.; Gengler, N.; Hulsegge, B.; Windig, J.J.; Buys, N.; Janssens, S. Genomics of a Revived Breed: Case Study of the Belgian Campine Cattle. PLoS One 2017, 12. [Google Scholar] [CrossRef]
- Cassell, B.G.; Adamec, V.; Pearson, R.E. Effect of Incomplete Pedigrees on Estimates of Inbreeding and Inbreeding Depression for Days to First Service and Summit Milk Yield in Holsteins and Jerseys. J Dairy Sci 2003, 86. [Google Scholar] [CrossRef] [PubMed]
- Núñez-Domínguez, R.; Martínez-Rocha, R.E.; Hidalgo-Moreno, J.A.; Ramírez-Valverde, R.; García-Muñiz, J.G. Evaluation of the Romosinuano Cattle Population Structure in Mexico Using Pedigree Analysis. Revista Colombiana de Ciencias Pecuarias 2020, 33. [Google Scholar] [CrossRef]
- Stachowicz, K.; Sargolzaei, M.; Miglior, F.; Schenkel, F.S. Rates of Inbreeding and Genetic Diversity in Canadian Holstein and Jersey Cattle. J Dairy Sci 2011, 94. [Google Scholar] [CrossRef]
- Sartori, R.; Bastos, M.R.; Baruselli, P.S.; Gimenes, L.U.; Ereno, R.L.; Barros, C.M. Physiological Differences and Implications to Reproductive Management of Bos Taurus and Bos Indicus Cattle in a Tropical Environment. Soc Reprod Fertil Suppl 2010, 67. [Google Scholar] [CrossRef]
- González-Cano, R.; González-Martínez, A.; Muñoz-Mejías, M.E.; Valera, P.; Rodero, E. Analyses of Genetic Diversity in the Endangered"Berrenda" Spanish Cattle Breeds Using Pedigree Data. Animals 2022, 12. [Google Scholar] [CrossRef] [PubMed]
- de Rezende, M.P.G.; Malhado, C.H.M.; Biffani, S.; Souza Carneiro, P.L.; Bozzi, R. Genetic Diversity Derived from Pedigree Information and Estimation of Genetic Parameters for Reproductive Traits of Limousine and Charolais Cattle Raised in Italy. Ital J Anim Sci 2020, 19. [Google Scholar] [CrossRef]
- García-Atance, M.A.; Carleos, C.; Andrino, S.; Justo, J.R.; Rivero, C.J.; Fernández, M.; Cañon, J.; Cortes, O. Genetic Diversity of Five Galician (Northwestern Spain) Local Primitive Bovine Breeds Using Pedigree Records. Diversity (Basel) 2023, 15. [Google Scholar] [CrossRef]
- Domínguez Viveros, J.; Rodríguez Almeida, F.A.; Núñez Domínguez, R.; Ramírez Valverde, R.; Ortega Gutierrez, J.A.; Ruíz Flores, A. Análisis Del Pedigrí y Efectos de La Consanguinidad En El Comportamiento Del Ganado de Lidia Mexicano. Archivos de Zootecnia 2010, 59. [Google Scholar] [CrossRef]
- Lozada-Soto, E.A.; Maltecca, C.; Lu, D.; Miller, S.; Cole, J.B.; Tiezzi, F. Trends in Genetic Diversity and the Effect of Inbreeding in American Angus Cattle under Genomic Selection. Genetics Selection Evolution 2021, 53. [Google Scholar] [CrossRef]
- Hinrichs, D.; Bennewitz, J.; Wellmann, R.; Thaller, G. Estimation of Ancestral Inbreeding Effects on Stillbirth, Calving Ease and Birthweight in German Holstein Dairy Cattle. Journal of Animal Breeding and Genetics 2015, 132. [Google Scholar] [CrossRef]
- Wirth, A.; Duda, J.; Distl, O. Impact of Inbreeding and Ancestral Inbreeding on Longevity Traits in German Brown Cows. Animals 2023, 13. [Google Scholar] [CrossRef] [PubMed]
- Frankham, R.; Gilligan, D.M.; Morris, D.; Briscoe, D.A. Inbreeding and Extinction: Effects of Purging. Conservation Genetics 2001, 2. [Google Scholar] [CrossRef]
- J. , A.; Crow, J.F.; Kimura, M. An Introduction to Population Genetics Theory. Population (French Edition) 1971, 26. [Google Scholar] [CrossRef]
- Mwangi, S.I.; Muasya, T.K.; Ilatsia, E.D.; Kahi, A.K. Effect of Controlling Future Rate of Inbreeding on Expected Genetic Gain and Genetic Variability in Small Livestock Populations. Anim Prod Sci 2020, 60. [Google Scholar] [CrossRef]
- Ríos-Utrera, Á.; Montaño-Bermúdez, M.; Vega-Murillo, V.E.; Martínez-Velázquez, G.; Baeza-Rodríguez, J.J.; Román-Ponce, S.I. Genetic Diversity Evolution in the Mexican Charolais Cattle Population. Anim Biosci 2021, 34. [Google Scholar] [CrossRef]
- Figueredo, J.S.; Cruz, J.F.; Sousa, L.S.; Teixeira Neto, M.R.; Carneiro, P.L.S.; Brito, N.D.; Pinheiro, R.G.S.; Lacerda, K.S.O.; Mottin, V.D. Genetic Diversity and Population Structure Estimation of Brazilian Somali Sheep from Pedigree Data. Small Ruminant Research 2019, 179. [Google Scholar] [CrossRef]
- Oliveira, R.R.; Brasil, L.H.A.; Delgado, J. V.; Peguezuelos, J.; León, J.M.; Guedes, D.G.P.; Arandas, J.K.G.; Ribeiro, M.N. Genetic Diversity and Population Structure of the Spanish Murciano–Granadina Goat Breed According to Pedigree Data. Small Ruminant Research 2016, 144. [Google Scholar] [CrossRef]
- Domínguez-Viveros, J.; Ortega-Gutiérrez, J.Á.; Rodríguez-Almeida, F.A.; Cárdenas-Rivera, J.Á. Variabilidad Genética En Ganaderías de Lidia Mexicanas a Partir de La Información Del Registro Genealógico. ACTA ZOOLÓGICA MEXICANA (N.S.) 2014, 30. [Google Scholar] [CrossRef]
- Martínez-Rocha, R.; Reyes-Ceron, A.; Domínguez-Viveros, J.; Hidalgo, J.; Núñez-Domínguez, R.; Ramírez-Valverde, R.; Larios-Sarabia, N.; Villegas-Gutiérrez, C. Genome-Wide Assessment of Genetic Diversity in Mexican Sardo Negro Breed. Livest Sci 2023, 274. [Google Scholar] [CrossRef]
- Honda, T.; Nomura, T.; Mukai, F. Conservation of Genetic Diversity in the Japanese Black Cattle Population by the Construction of Partially Isolated Lines. Journal of Animal Breeding and Genetics 2005, 122. [Google Scholar] [CrossRef] [PubMed]
- Taberlet, P.; Coissac, E.; Pansu, J.; Pompanon, F. Conservation Genetics of Cattle, Sheep, and Goats. C R Biol 2011, 334. [Google Scholar] [CrossRef] [PubMed]
Figure 1.
Location of the herds on the Mexican map.
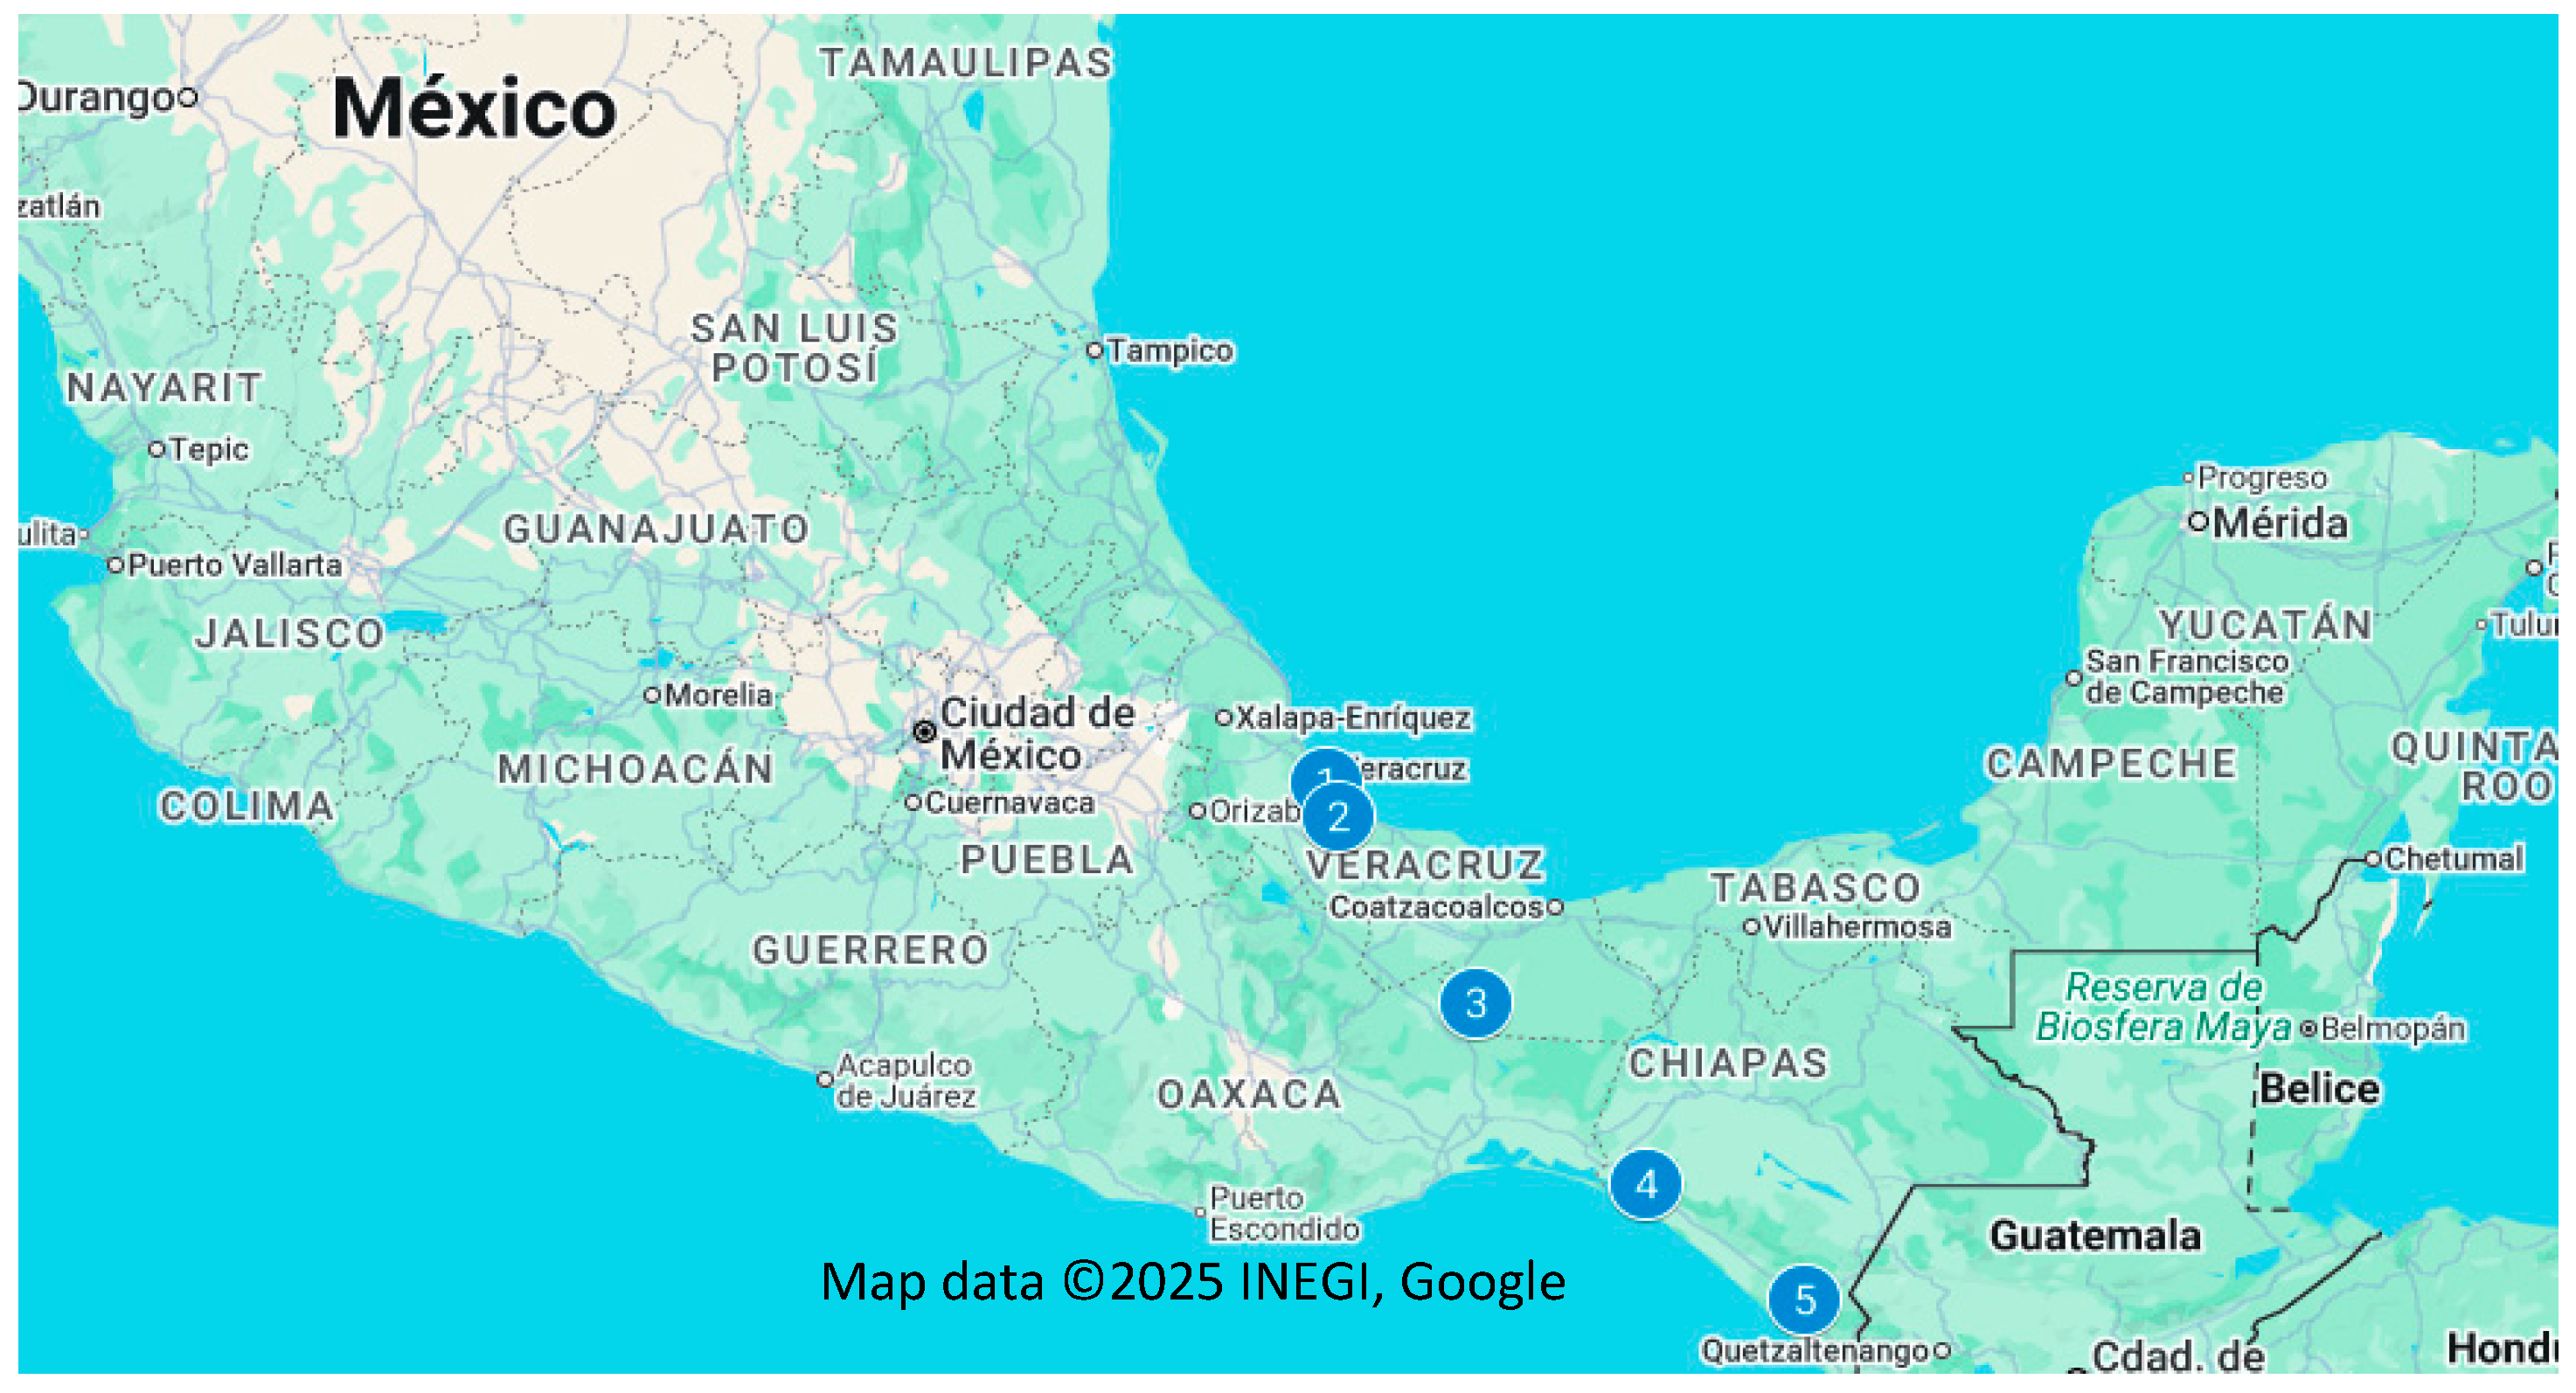
Figure 2.
Number of descendants per year of birth and number of dams and sires who bore them.

Figure 3.
Percentage of known ancestors.
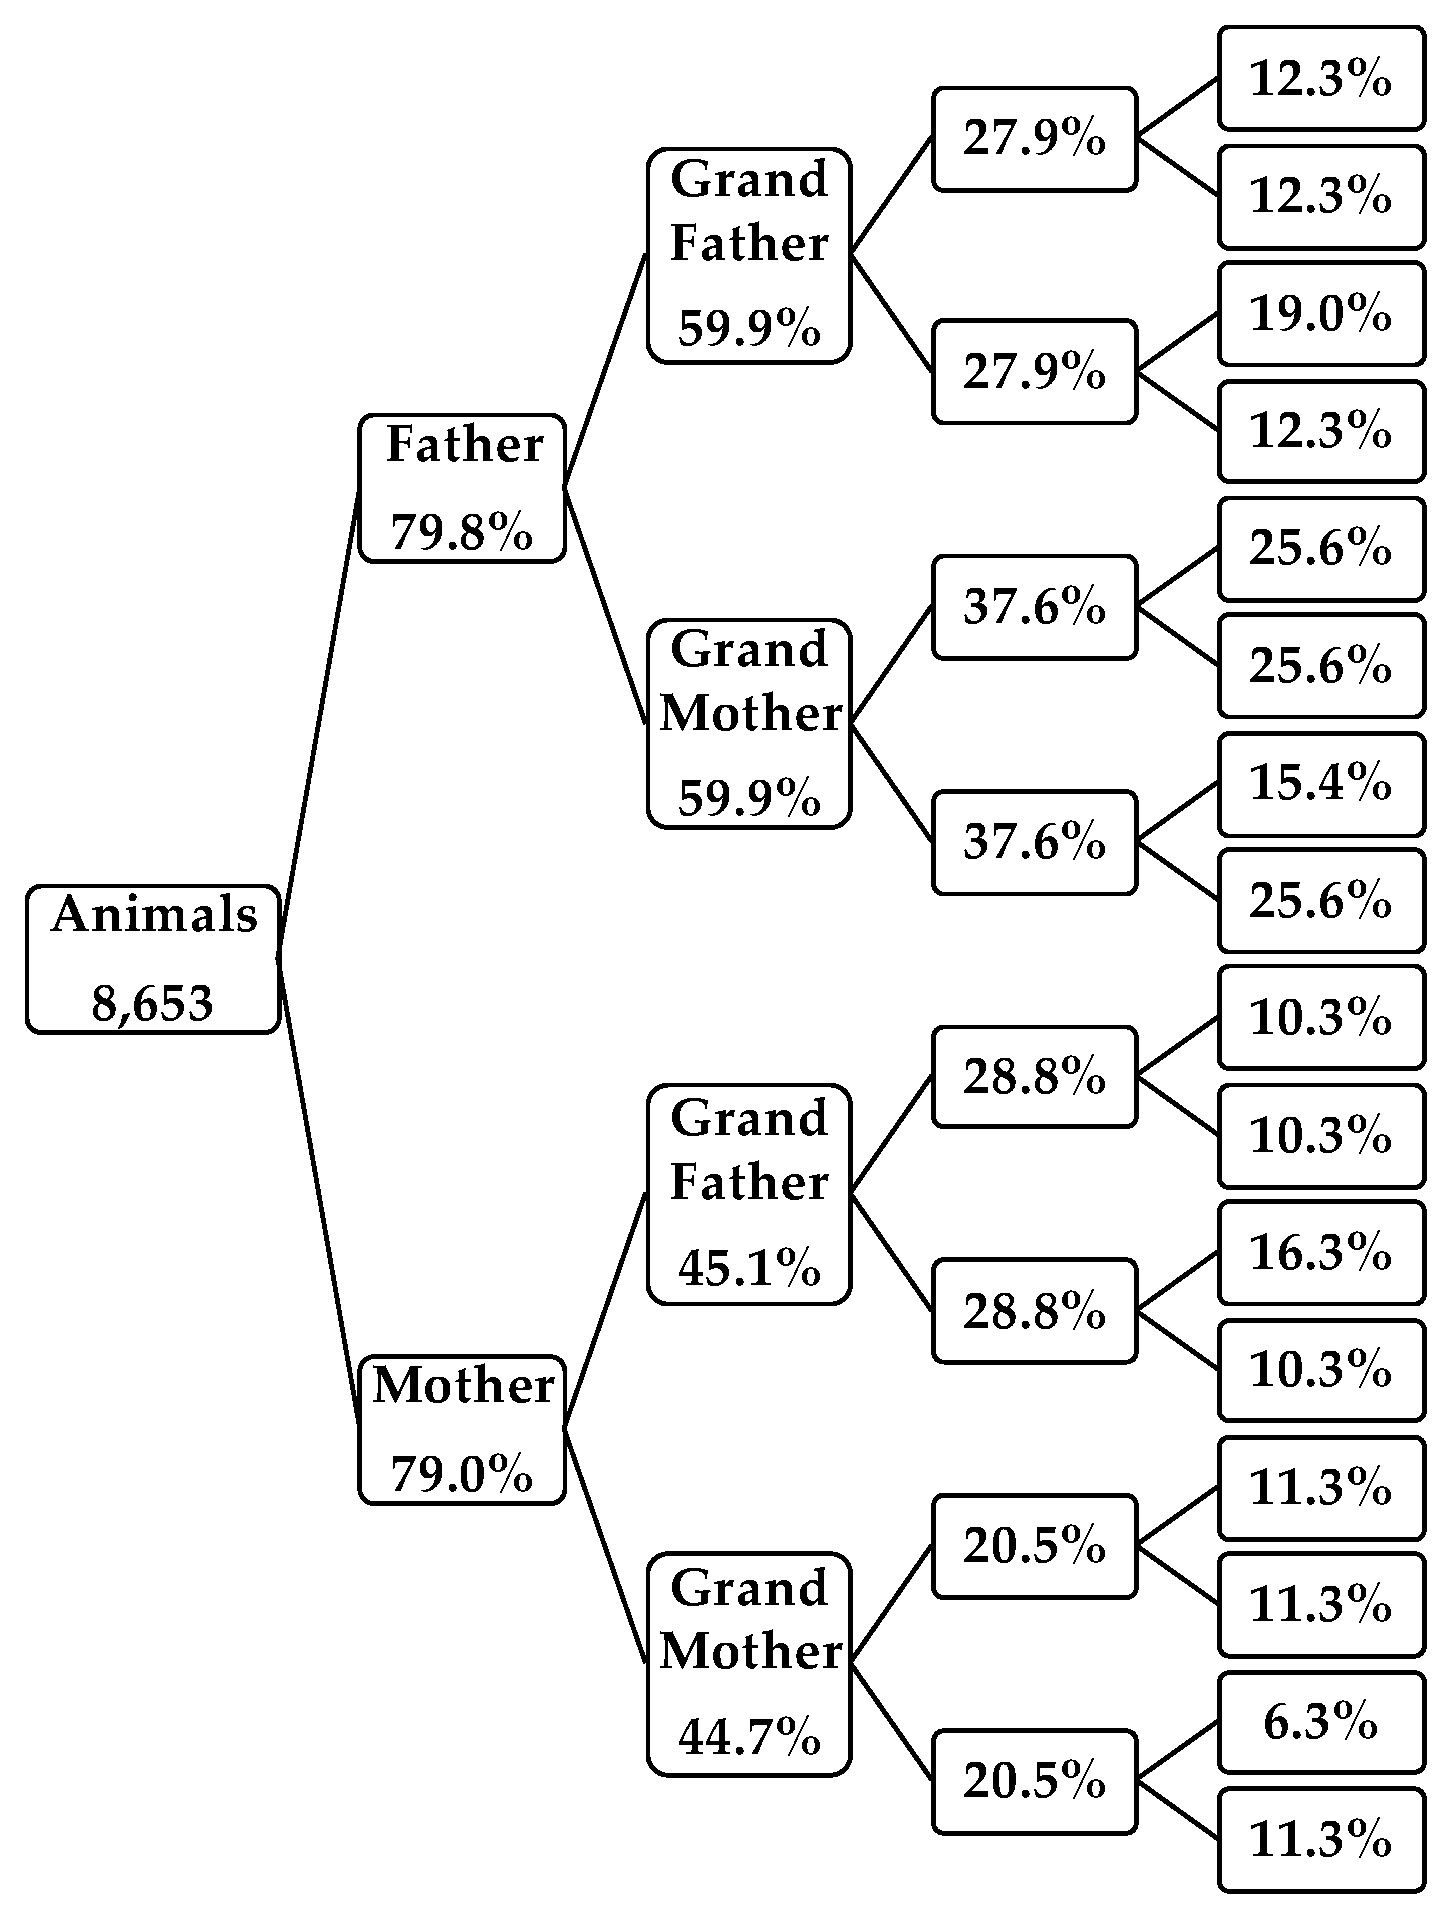
Figure 4.
Pedigree Completeness Index (CI).
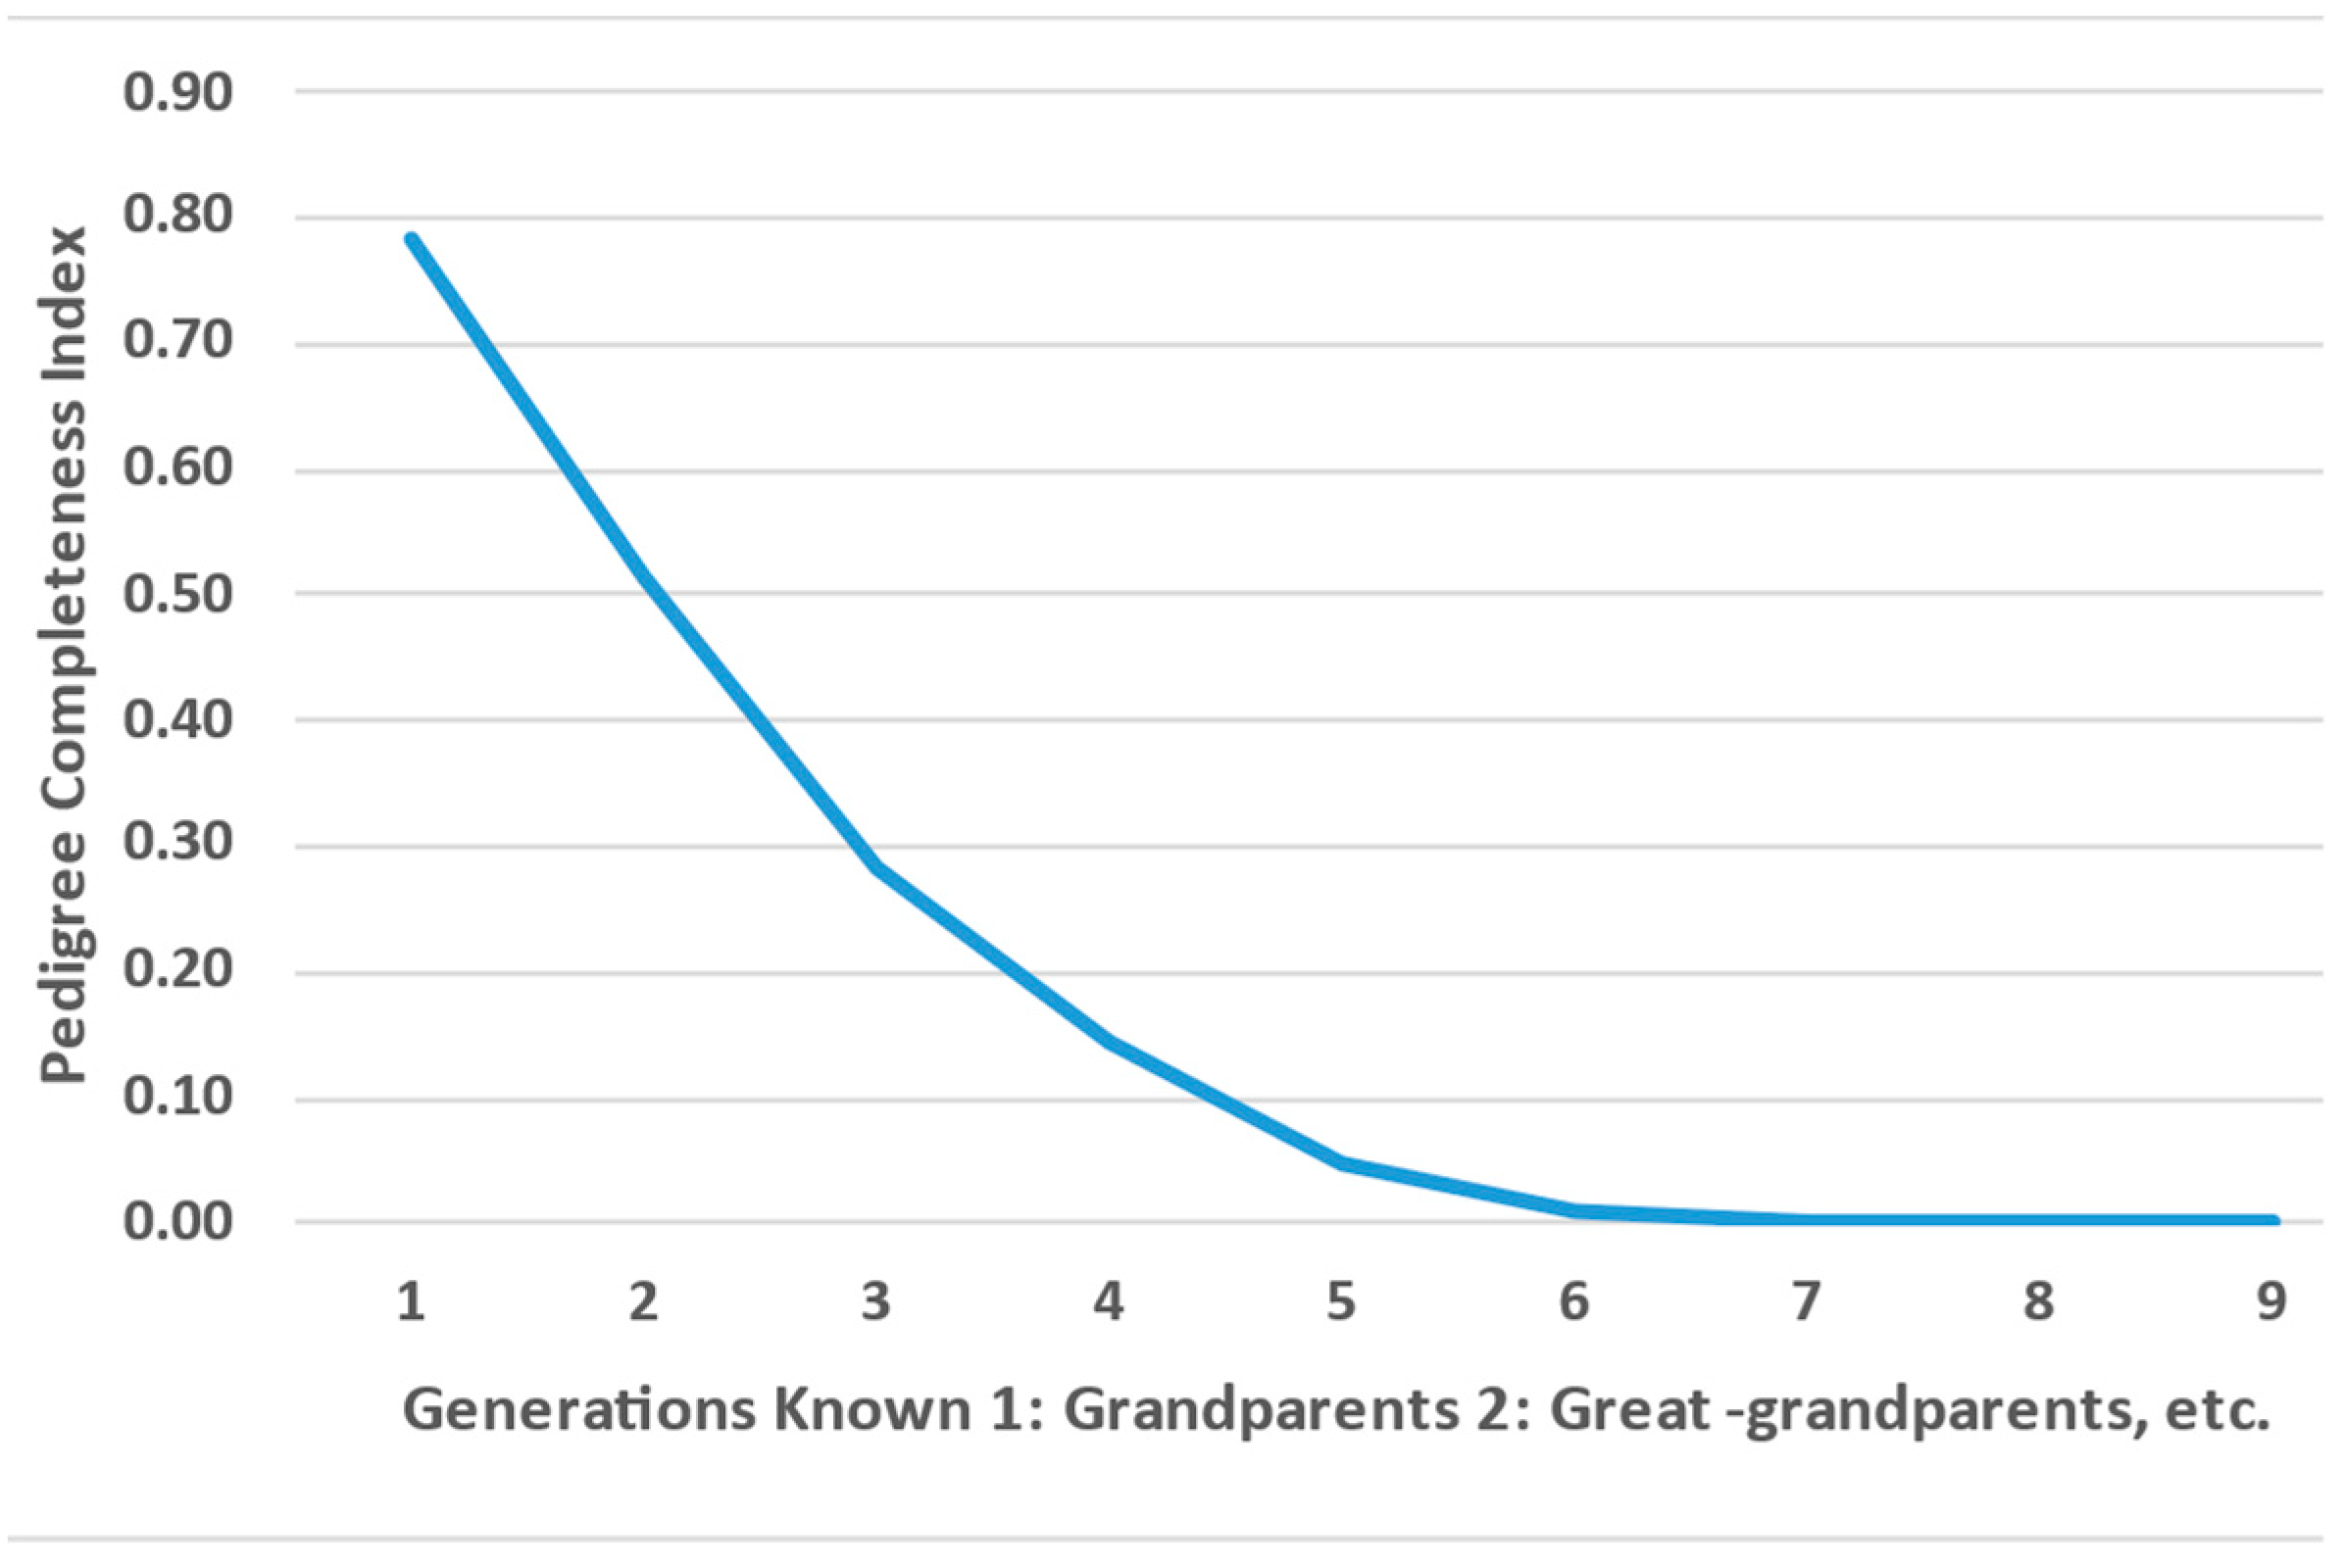
Figure 5.
Inbreeding coefficient (F) and number of inbreed animals in Sardo Negro cattle, by year of birth.
Figure 5.
Inbreeding coefficient (F) and number of inbreed animals in Sardo Negro cattle, by year of birth.
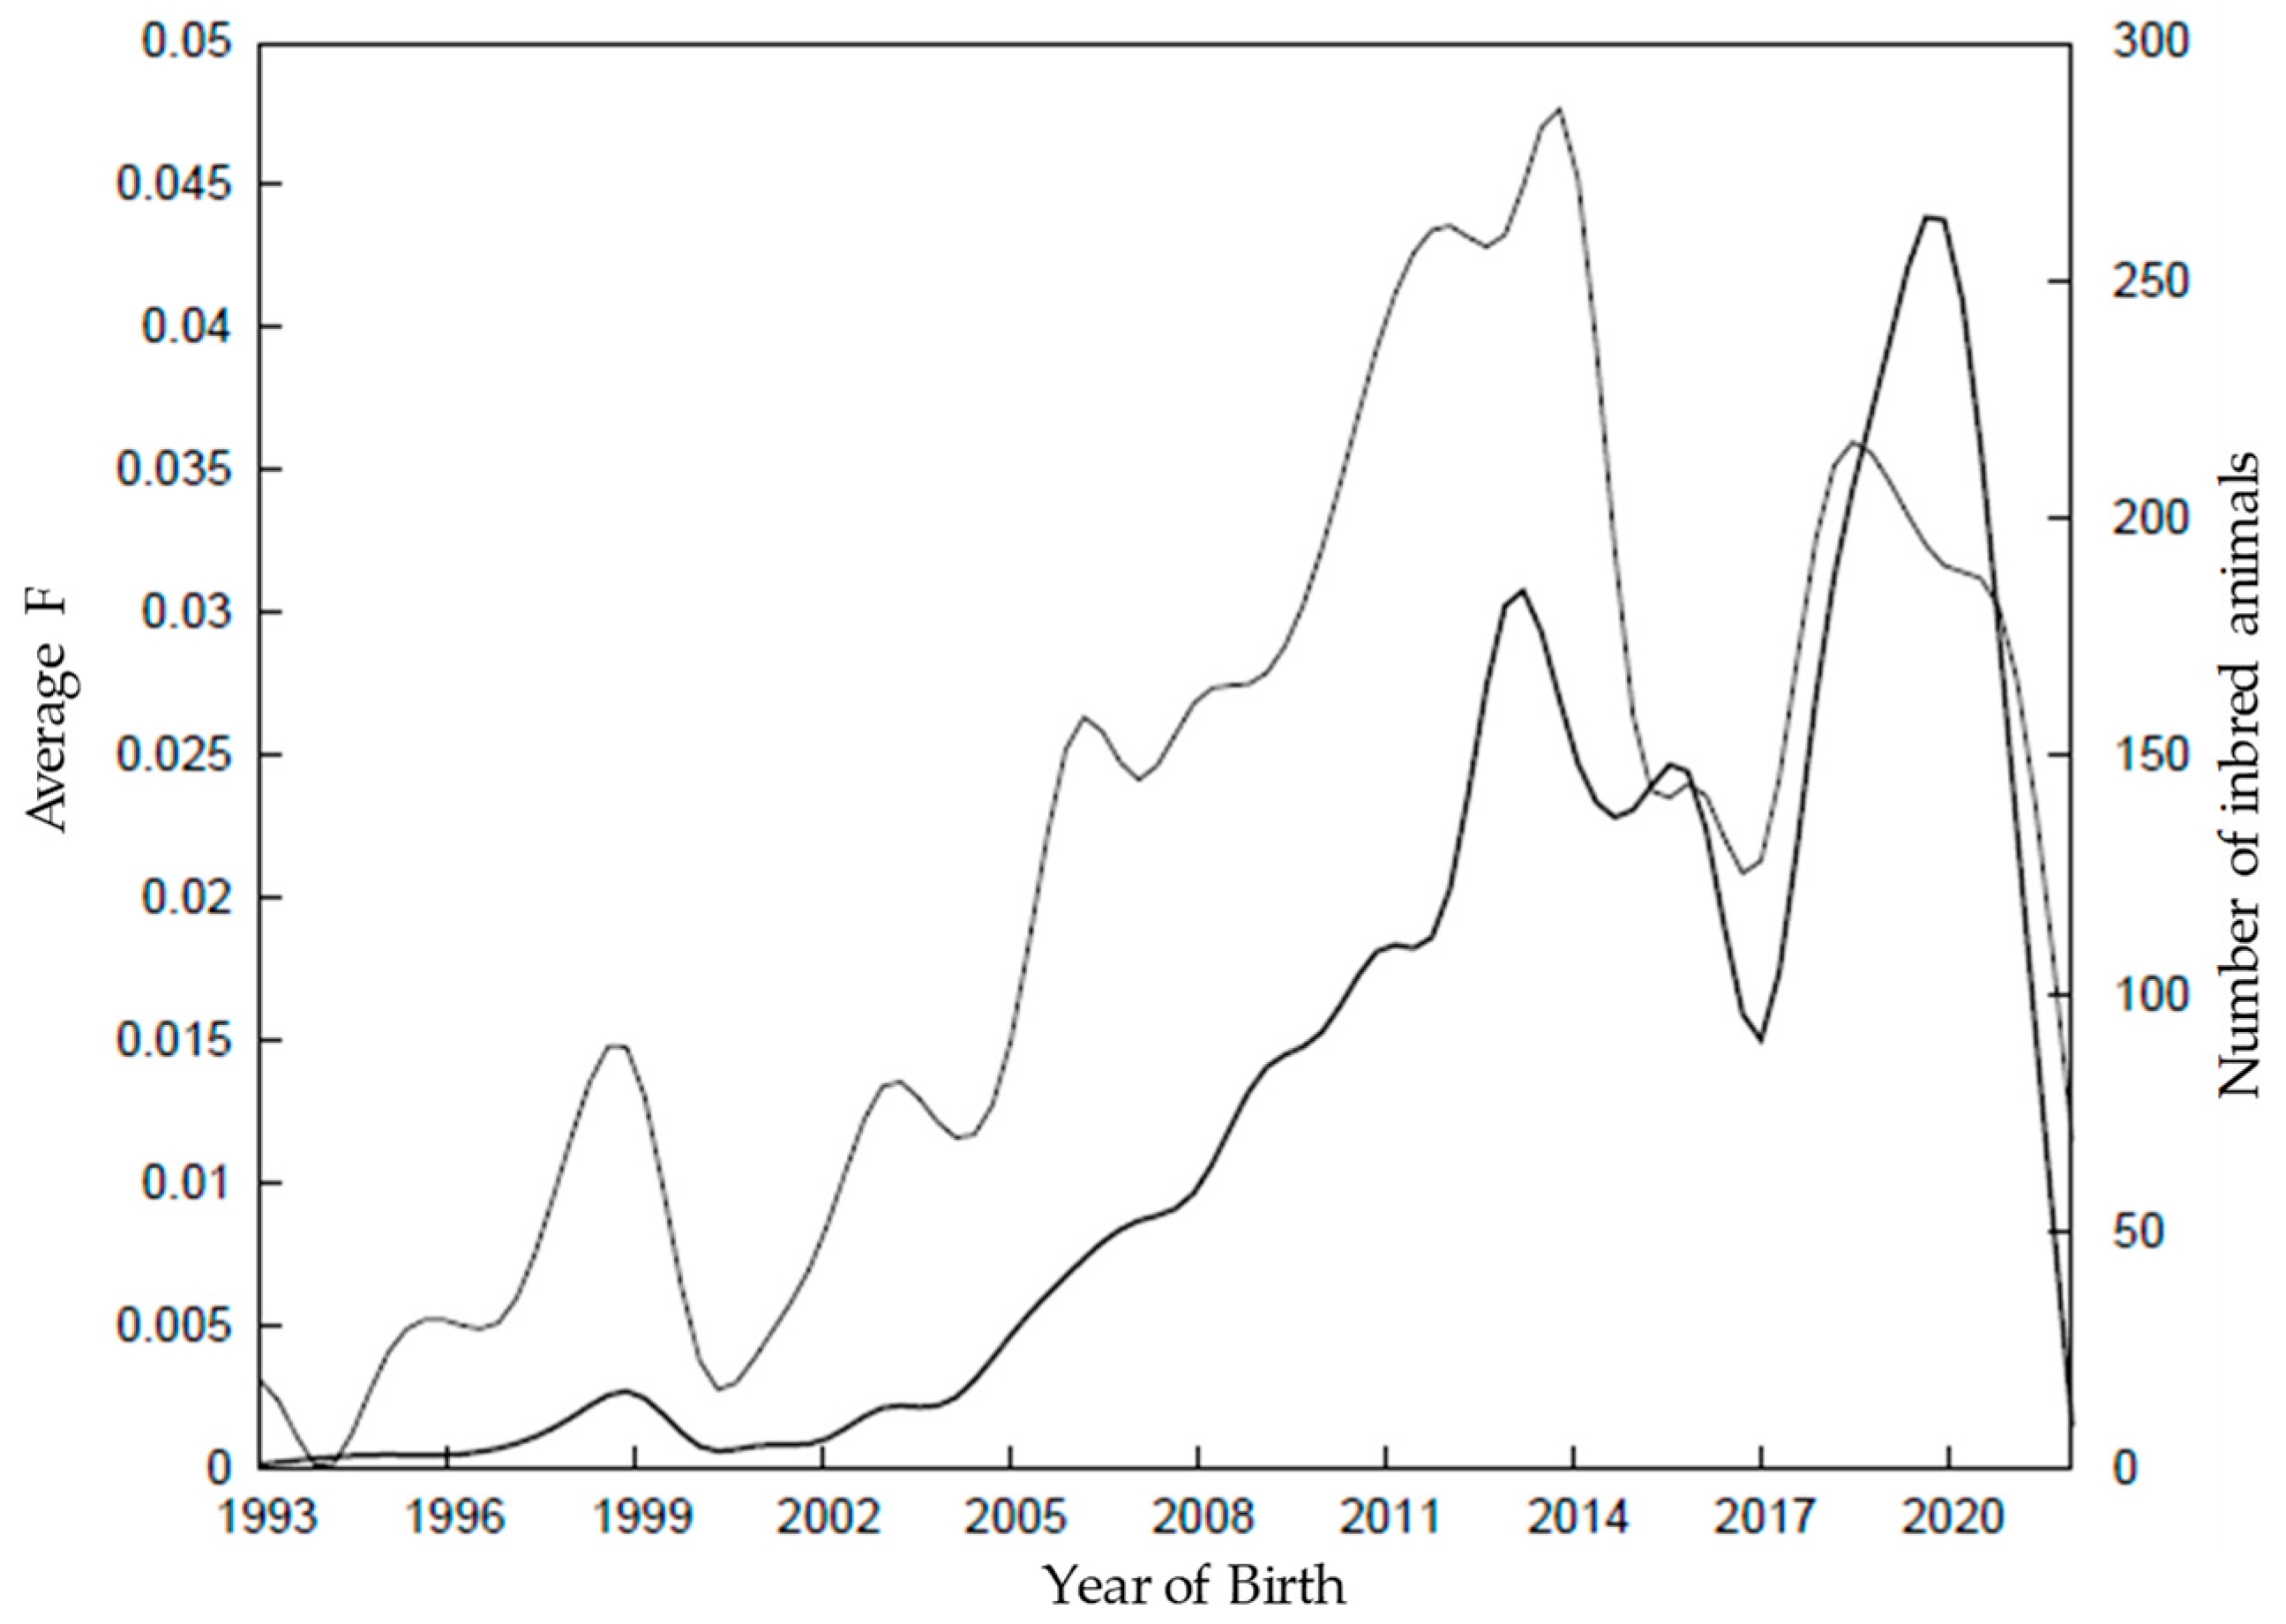

Table 1.
Description of the population: Sardo Negro cattle in some subpopulations in Mexico.
| Population | N | Percentaje (%) |
| Total | 8,653 | 100 |
| Females | 4,867 | 56 |
| Males | 3,786 | 44 |
| Dams | 2,367 | 491 |
| Sires | 223 | 6 2 |
| Individuals without progeny | 6,063 | 70 |
| Reference population | 6,840 | 79 |
| Individuals with one known parent | 67 | 0.8 |
| Individuals with both parents unknown. | 1,763 | 20 |
1 Relative to the female population. 2 Relative to the male population.
Table 2.
Generation interval and mean age at birth of offspring.
| Pathways | GI | SE | AB | SE |
| Sire-Son | 8.9 | ± 0.5 | 8.1 | ± 0.08 |
| Sire-Daughter | 7.6 | ± 0.1 | 7.7 | ± 0.07 |
| Dam-Son | 8.3 | ± 0.4 | 8.6 | ± 0.07 |
| Dam-Daughter | 8.0 | ± 0.1 | 8.3 | ± 0.07 |
GI: generation interval, AB: average age at birth of offspring, SE: Stadard error.
Table 3.
Inbreeding and relatedness coefficient, inbred animals with F and effective population number by maximum generations traced in Sardo Negro cattle.
Table 3.
Inbreeding and relatedness coefficient, inbred animals with F and effective population number by maximum generations traced in Sardo Negro cattle.
| Generation |
No. Animals |
Average F % |
No Inbred animals % (Average F %) | AverageAR % | Ne |
| 0 | 1748 | 0.0 | --- | 0.1 | |
| 1 | 1022 | 0.0 | --- | 1.6 | |
| 2 | 1634 | 1.5 | 9.6 (15.7) | 2.2 | 33 |
| 3 | 846 | 3.7 | 28.4 (13.2) | 3.6 | 22 |
| 4 | 1128 | 4.6 | 42.0 (11.1) | 4.2 | 53 |
| 5 | 1137 | 4.8 | 51.1 (9.3) | 3.6 | 387 |
| 6 | 574 | 4.7 | 57.0 (8.2) | 3.7 | |
| 7 | 360 | 5.2 | 81.4 (6.3) | 3.6 | 124 |
| 8 | 196 | 4.8 | 85.2 (5.7) | 3.4 | |
| 9 | 8 | 3.0 | 75.0 (4.0) | 3.6 |
1 Generations range from 1 recent to 9 distant.
Table 4.
Ancestors, probability of origin of diversity, Sardo Negro cattle.
| Population, metrics | N |
| Total | 8,653 |
| Base population | 1,815 |
| Effective number of founders | 57.4 |
| Number of animals in the reference population | 6,838 |
| Number of founders | 1,187 |
| Number of ancestors contributing to the reference population | 1,175 |
| Effective number of ancestors in the reference population | 32 |
| Effective number of founders in the reference population | 37 |
| Number of ancestors explaining 50% of the ancestry | 21 |
Table 5.
Sires and calvings in their subpopulations or in separate herds.
| Herd | Calvings | Own sires %1 | Foreign calvings % 2 |
| 1 | 2,817 | 75.9 | 6.8 |
| 2 | 3,872 | 38.1 | 8.2 |
| 3 | 176 | 68.6 | 0.6 |
| 4 | 430 | 68.6 | 1.3 |
| 5 | 1,002 | 83.5 | 2.9 |
| 6 | 356 | 61.0 | 0.0 |
1 The remaining percentage corresponds to external sires. 2 The remaining percentage corresponds to offspring in the same subpopulation.
Disclaimer/Publisher’s Note: The statements, opinions and data contained in all publications are solely those of the individual author(s) and contributor(s) and not of MDPI and/or the editor(s). MDPI and/or the editor(s) disclaim responsibility for any injury to people or property resulting from any ideas, methods, instructions or products referred to in the content. |
© 2025 by the authors. Licensee MDPI, Basel, Switzerland. This article is an open access article distributed under the terms and conditions of the Creative Commons Attribution (CC BY) license (http://creativecommons.org/licenses/by/4.0/).
Copyright: This open access article is published under a Creative Commons CC BY 4.0 license, which permit the free download, distribution, and reuse, provided that the author and preprint are cited in any reuse.


