
Submitted:
24 November 2025
Posted:
25 November 2025
You are already at the latest version
Abstract
This study investigated the energy, economic, and environmental performance of one of the most promising building insulation materials that has been overlooked in the residential sector. Structural thermal break is a typical passive design component which is installed to reinforce structural connections vulnerable to thermal bridging effects on the building envelope. Recently, the market expansion for structural thermal break has been active throughout many developed nations in Europe and North America. However, the public awareness of such building material is still very low in East Asia, which in fact has the highest population density around the world. Perceiving this situation in mind, this study presents the energy, economic, and environmental performance guidelines for structural thermal breaks that can be practically referenced in East Asian multi-residentials. The results show that structural thermal breaks are highly efficient in reducing heating energy demand. However, the high investment cost of structural thermal break may likely be the main obstacle for its market expansion worldwide. Therefore, this study also presents the economic cost reduction rates (%) for structural thermal break to become more cost-effective in field applications. Meanwhile, this study also shows that the environmental payback period for structural thermal break is approximately 8.58 years, which is much shorter than the average lifespan of typical apartment buildings. Conclusively, this study will contribute to presenting clear improvement tasks for the widespread use of structural thermal break in the East Asian multi-residential context by conducting an integrative approach towards analyzing its energy, economic, and environmental perspectives.
Keywords:
structural thermal break
; linear thermal transmittance
; discounted payback period (DPP)
; environmental payback period
1. Introduction
Over the past few years, the residential sector has been responsible for approximately 25% of final energy demand and 20% of CO2 emissions across OECD countries [1]. Although many previous studies have introduced new technologies that can help to reduce building energy demand and GHG emissions, these state-of-the-art developments are often applicable to facilities equipped with advanced technologies. The limited application of new technologies often ends up giving benefits to few social communities. Therefore, considering the public awareness and economic situation of the global average, this paper aims to discover the practical guidelines to improve energy, economic, and environmental performance of residential buildings by investigating one of the fundamental technologies that has been overlooked. Structural thermal break is a typical passive design component which is installed to reinforce structural connections vulnerable to thermal bridging effects on the building envelope [2]. For reference, Figure 1 compares the internal heat movement depending on the presence of structural thermal break. To be specific, this structural insulation material helps maintaining consistent indoor temperature, which in turn contributes to reducing significant amount of building energy demand. This high-potential energy conservation measure will be an important construction material for implementing net-zero emission buildings (NZEB) and other types of high-performance buildings in the future [3]. Surprisingly, however, the practical guideline for this passive design component is still insufficient, since not many previous studies have performed energy, economic, and environmental analysis on structural thermal breaks by using empirical datasets [4]. Therefore, this paper is aiming to present the future vision and applicability of structural thermal breaks by utilizing experimental outcomes derived from the ISO 8990 (i.e., International Organization for Standardization) mock-up testing procedure [5].
Starting in Germany, the market demand for structural thermal break has been growing mainly in Europe and North American developed countries (i.e., United States and Canada). Unfortunately, however, this building material is still largely unapplied in the East Asian residential sector, which has enormous market potential with one-fifth of the global population being located in (20.29%) [6]. For reference, countries in East Asia are mostly filled with multi-residential apartments due to high population density. As a result, this paper focuses on the region where structural thermal break can maximize its market distribution in the future. In this paper, the authors insist that investigating the solutions to improve the energy efficiency, economic feasibility and eco-friendliness of structural thermal breaks will be an important task to promote the applicability of such building material in the East Asian residential sector. Conclusively, this study will serve as an integrative performance guideline, outlining the three major (i.e., energy, economic, and environmental) perspectives of structural thermal breaks, that can be referenced throughout East Asian multi-residential apartments.
2. Literature Review
This section mainly presents the standardized legal codes for structural thermal breaks in some of the major developed regions around the globe. First, this chapter illustrates the standards in Europe and North America, where the application of structural thermal break is relatively more common than in East Asia. This study finally appeals the need for applying the building insulation material to multi-residential apartments located in densely populated areas. For reference, Table 1 presents the summary of key outlines related to the application of structural thermal breaks (i.e., type of residentials, standardized legal codes, and economic feasibility) to several countries located in Europe, North America, and Ease Asia.
2.1. European Standards for Thermal Break
The history of structural thermal break began in 1983 with a German company (i.e., Schöck Isokorb) [22]. The invention of structural thermal break revolutionized the construction industry by minimizing the thermal bridging effects on projected building components (e.g., balconies, canopies, and parapets). Since this building component was introduced in Europe, the institutional measures for its application in residential buildings have been well established [23]. To be specific, the EOTA (European Organization for Technical Assessment) provides the “European association for construction products” with technical framework established under the Construction Products Regulation (CPR). For reference, in Europe, the CE (Conformité Européenne) mark is mandatorily required for most building products, including structural thermal breaks, to highly ensure that they meet the safety, health, and environmental regulations established by the European Union (EU) [24].
The EOTA also presented the standards for evaluating the insulation performance of structural thermal breaks required for balcony connections in EAD (i.e., European Assessment Document) [25]. This documentation is the basis for issuing European technical assessments, which mainly adopts the ISO standards [26]. Although the ISO standards are developed by technical committees from all over the world, this global federation of national standards bodies (i.e., ISO) is headquartered in Geneva, Switzerland. Thus, when evaluating the performance of structural thermal breaks, most European countries calculate linear (or point) thermal transmittance (U-value) according to the relevant standard layout, ISO 10211 [27]. Furthermore, ISO 8990 presents a standardized mock-up testing procedure for evaluating the linear thermal transmittance of thermal breaks [28]. In short, the European residential sector evaluates the performance of structural thermal breaks according to the ISO standard layouts and applies them mandatorily to building overhangs such as balconies, canopies, and parapets.
2.2. North American Standards for Thermal Break
Recently, in 2020, two major cities in the United States, New York City and Seattle, implemented mandatory regulations to mitigate thermal bridging effects at building overhangs [29]. Specifically, these two cities offer financial incentives to builders for installing structural thermal breaks at projected building components such as balconies and canopies. According to ASHRAE standard 90.1, the NYCECC (New York City Energy Conservation Code) requires the installation of structural thermal breaks with a minimum performance of R-3 (U-value: 1.85 W/m2·K) [30]. Meanwhile, in Seattle, where builders should mandatorily meet the insulation code standards for climate zone 4, all residential buildings located in the city must apply structural thermal breaks with a performance of R-10 (U-value: 0.55 W/m2·K) or higher.
The use of structural thermal break is greatly effective in reducing heat transmission losses, especially in cold climates such as Canada. The National Energy Code of Canada for Buildings (NECB) has introduced new technical requirements for improving the thermal performance of building envelopes in 2020. As a practical measure to reduce thermal bridging effect in Canadian residentials, some studies have previously been conducted to analyze the energy saving and economic effects of structural thermal breaks. Ge et al., discovered that building energy demand for space heating can be reduced by 5~13% when using balcony thermal breaks in the climate of Toronto [31]. According to a report from RDH Building Science, the payback period for thermal break was 22, 26, and 41 years in Calgary, Toronto, and Vancouver, respectively [17]. Overall, most North American countries have high demand for installing structural thermal breaks in residential buildings. However, since huge proportion of dwellings in this region are single family housings, these institutional approaches related to thermal insulation codes cannot be directly applied to East Asian multi-residential context.
2.3. East Asian Standards for Thermal Break
Compared to European and North American standards for installing structural thermal breaks in residentials, most East Asian countries lack their own regulations for applying such insulation components. Japan was the first in Asia to devise a method for measuring the insulation performance (i.e., U-value) of building components through its own standard, the Japanese Industrial Standards (JIS) [32]. Specifically, JSI-R-2618 provides the testing method for calculating the thermal conductivity of insulation materials, including structural thermal breaks. Ironically, however, Japan is the only G7 country that does not impose mandatory requirements for installing thermal insulation materials on residential buildings [33]. Nonetheless, the JIS standard had a significant influence on the development of Korean Standards (KS) for measuring the linear thermal transmittance of insulation materials.
In South Korea, the method for measuring the thermal transmittance of insulation materials (KS-F-2277) has been established with reference to ISO 8990 and JIS-R-2618. Due to the distinct climate differences between summer and winter, the demand for installing structural thermal breaks will inevitably be high in South Korean local housings. In addition, the Korean government is pursuing a policy drive for implementing NZEBs by 2050, which will hardly be met without the prevention of thermal bridging effects. Although the application of thermal break is still optional in South Korean residential sector, the market potential for this passive design element is increasing with more public awareness. As shown in Figure 2, the population of East Asia is highly concentrated in Japan, South Korea, and China. To be specific, China accounts for the majority of East Asian population and the expectations for the applicability of this study results are considerably high. Unlikely, however, although China has implemented mandatory regulations for installing thermal insulations, the Guobiao Standards (i.e., national mandatory standards for China) currently lacks the specific details regarding the application of structural thermal breaks to residential buildings [34]. As a result, once the Chinese government establishes mandatory regulations for applying thermal breaks to new constructed housings at the national level, the potential for cutting down building energy demand and GHG emissions would be significant across East Asia.
Conclusively, the most common type of dwelling in East Asia is multi-residential apartment, which is quite different from those in the Western countries with relatively low population densities. As shown in Table 1, most East Asian countries lag behind in examining the overall performance of structural thermal breaks. Therefore, this paper will provide the building engineers with energy, economic, and environmental performance guidelines for applying structural thermal breaks to multi-residential apartments located in East Asia.
3. Methodology
This chapter illustrates the research methodology used in this study. The first subchapter describes the basic settings of the study, such as the research location and target building. The second chapter explains the experimental procedure for measuring the linear thermal transmittance (U-value) of concrete floor lines with and without the installation of structural thermal breaks. Based on these experimental results, this study simulated the object building using the TRNSYS dynamic software tool. Finally, the third section conceptually describes the process of analyzing the energy, economic, and environmental performance of structural thermal breaks. This integrative analysis will serve as a technological measure for estimating the quantitative amount of energy, economic, and environmental byproducts resulting for the use of such building insulation material. For reference, Figure 3 presents a flowchart illustrating the methodological process of this study.
3.1. Research Setup
3.1.1. Research Location: Seoul, South Korea
In this study, the building energy simulation was limited to a multi-residential apartment located in Seoul, South Korea. However, although this paper is currently analyzing a specific region, the scope of this study ultimately expands to East Asia, where the type of residentials and climatic conditions are quite similar. According to Köppen’s climate classification scheme, Seoul, the capital city of South Korea falls in between the cold-winter dry (Dwa) and hot-summer humid continental (Dfa) climate zones like most part of East Asia [35]. The climatic features of Seoul can be summarized by its wide range of annual temperature. To be specific, the lowest winter temperature in Seoul is around -15℃, while the highest temperature in summer reaches up to 35℃. In fact, the Korean Peninsula is strongly affected by air masses that change every season rather than by ocean currents. Therefore, most regions in South Korea, including Seoul, are characterized by various climate types: Siberian air mass (cold and dry), Sea of Okhotsk air mass (cold and humid), Yangtze River air mass (warm and dry), and North Pacific air mass (warm and humid) [36]. Overall, Seoul is often considered one of the largest cities in the world with the most dynamic differences in annual temperature and humidity levels. For these reasons, Seoul was selected as the research location of this study since its climatic feature spectrum is broad enough to cover that of most meteorological regions in East Asia.
3.1.2. Research Object: Multi-Residential Apartment
One of the most distinctive characteristics of East Asian housing is the high proportion of multi-residential apartments due to population density. Specifically, the proportion of high-rise apartments increases more significantly in large cities such as Seoul, Tokyo, Beijing, and Shanghai. For reference, Table 2 summarizes the construction outline and passive design elements of the object building analyzed in this study. The object building of this paper is a typical 20-story apartment building in South Korea, with each floor consisting of two households. The thermal zone area of each unit is similar to the size of national average housing in Korea, which is approximately 84(m2) [37]. The physical quantities of building passive design elements presented in Table 2 are all unchangeable values, except for the thermal transmittance (U-value) of the wall-slab conjunction floor line, which varies depending on the presence of structural thermal breaks. In terms of the HVAC system, this object building is operated by applying an air-source heat pump (ASHP), which is widely used in residential buildings. More specifically, the heat pump system applied in this study is an “air-to-air split unit system” which is connected to the radiant floor heating system [38]. For reference, the COP-value of a typical ASHP ranges between 2.5 and 3.0 when the external air temperature is around 0 to 10℃ [39]. The next chapter introduces a method to calculate the linear thermal transmittance (U-value) of wall-slab conjunctions, with and without structural thermal breaks installed.
3.2. Research Methodology
This subchapter illustrates the process of analyzing the building energy demand by using both experimental and simulation methods. First, the linear thermal transmittance (U-value) of a concrete floor line was experimentally measured with and without the application of structural thermal breaks. These experimental results were then used to simulate the building envelope of the target multi-residential apartment via TRNSYS.
3.2.1. Experimental Setup
In this study, two samples of structural component layers were designed, one with the inclusion of structural thermal break and the other without it. For both structural component samples, the linear thermal transmittance (U-value) of concrete floor lines were measured. To be specific, each specimen was manufactured with a size of 1.0m (H) × 1.0m (D) × 0.3m (W). The two specimens are identical in all conditions except for the presence (or absence) of structural thermal breaks. Figure 4 shows the thermal transmittance of wall-slab conjunctions with and without the application of structural thermal break. For reference, the thermal break used in this study is an internal insulation material composed of the following materials: 1) stainless steel, 2) carbon steel, 3) CRC (Cellulose Fiber Reinforced Cement) board and 4) EPS (Expanded polystyrene) insulation. Note that each building material is discussed in chapter 3.3.3. The experiment was conducted in compliance with the ISO 8990 standards.
In this experiment, a 1.0m (H) × 1.0m (D) × 0.3m (W) scaled specimen was placed between two rooms with different temperature conditions to measure the linear thermal transmittance (U-value) of the structural thermal break. More specifically, these two rooms are (1) constant temperature room and (2) low temperature room, each imitating the indoor and outdoor environment with a wall in between. In regards of the experimental settings, the condition of the constant temperature room was set to an indoor temperature of 20℃, and a relative humidity of 50%. Similarly, the low temperature room was controlled to maintain an indoor temperature of 0℃, and an airflow speed of 2.0m/s. For reference, Figure 5 describes the conceptual diagram of the experimental setting. The two rooms (i.e., constant- and low-temperature room) are completely separated by a concrete wall structure into which the specimen is inserted. For reference, the guarded hot box (i.e., metering box) surrounds the surface of the wall-slab specimen exposed to the constant temperature room and simulates the indoor (heated) environment. The primary role of the guarded hot box is to maintain a controlled and uniform temperature on one side of the test specimen, minimizing heat loss and ensuring accurate measurement conditions. In this experimental setup, the linear thermal transmittance (U-value) of the specimen is measured in two cases: with and without structural thermal breaks applied to exterior walls.
Additionally, Figure 6 illustrates the test instruments and equipment used in this study. To be specific, Figure 6(a) presents the configuration of two separate test specimens, with and without the application of structural thermal break. This figure compares the wall-slab test specimens prior to the attachment of EPS insulation, clearly describing the installment of structural thermal break. Note that this study was conducted in accordance with “KS-F-2277: Thermal insulation—Determination of steady-state thermal transmission properties—Calibrated and guarded hot box”. Therefore, these test specimens were manufactured in compliance with South Korean thermal insulation code, with thermal transmittance (U-value) of the walls and floor set to 0.17 and 0.15(W/m2·K), respectively.
Figure 6(b) and Figure 6(c) show how the “T-type thermocouple” is attached to both sides of the test specimen. As shown in the figures, the “T-type thermocouple” was attached to 9 locations (3 × 3), evenly distributed on both surfaces of the test body with a size of 1.0(m) × 1.0(m). For reference, the South Korean standard for measuring the thermal insulation performance of building materials (i.e., KS-F-2277) specifies the number of thermocouples that should be installed to accurately measure surface temperatures. The exact number may vary slightly depending on the size and configuration of the test specimen. However, for stability reason, “KS-F-2277” stipulates that at least 9 thermocouples must be installed on each measurement surface. In other words, according to this standard, a total of 18 thermocouples (9 on each heating and cooling surfaces of the test body) must be installed [42].
Finally, the thermocouples used in this experiment is connected to a high-precision data logger known as the “HIOKI U8550”. This digital instrument a 15-channel measurement module which is configurable for multiple inputs, including temperatures measured through various types of thermocouples. Therefore, the “HIOKI U8550” data logger module can precisely interface with the “T-type thermocouple” to display the surface temperature at multiple points simultaneously. The data integrity through such device is essential for thermal property testing commonly required by the “KS-F-2277 standard”.
In regards of the experimental outcomes, Table 3 shows the key indicators measured to calculate the thermal transmittance (U-value) of the concrete floor line when the structural thermal break is not applied. The U-value of the test specimen was calculated by measuring (1) the difference in surface temperature on both sides of the specimen [K], (2) the amount of heat transfer through the specimen [W], and (3) the area of the test specimen [m2]. First, the surface temperature of the test specimens in the constant- and low-temperature room is measured by using the “T-type thermocouples” attached to each surface. For reference, in the guarded hot box method, an electric heater is used to supply heat inside the hot box to maintain a constant indoor temperature (i.e., 20 ± 1℃). Note that the guarded hot box is only located in the constant temperature room. In this experimental setup, the surface temperatures of the test specimen exposed to the constant- and low-temperature rooms were measured respectively. Second, the amount of heat transfer through the test specimen can be calculated by subtracting the “calibrated heat” from the “total heat supply”. As previously mentioned, heat is supplied to the guarded hot box using an electric heater. In this study, the total heat supply was estimated by measuring the electric heater output and temperature distribution inside the guarded hot box. Meanwhile, the calibrated heat is the net amount of heat that compensates for the heat loss occurring in the guarded hot box. This physical indicator quantifies the heat loss of the guarded hot box by measuring the surface temperature difference and thermal resistance (R-value) across a standard plate. Third, the area of the wall-slab test specimen used in this experiment was 1.0(m2). Finally, the linear thermal transmittance (U-value) of the concrete floor line in the test specimen can be calculated by using Equation 1 [43]. Likewise, Table 4 shows the main indicators for calculating the U-value of the concrete floor line when applying the structural thermal break. In both cases, Table 3 and Table 4, the linear thermal transmittance (U-value) of the concrete structures were calculated using the average value of three independent measurements.
= thermal transmittance (U-value) [W/m2·K]
= surface temperature on one side of the wall [K]
= surface temperature on the other side of the wall [K]
= heat transfer through the test specimen [W]
= area of the wall [m2]
3.2.2. Simulation Setup
The thermal transmittance (U-value) of the concrete floor line, with and without the application of structural thermal break, was measured through the experiment conducted in the previous subchapter. In this section, a multi-residential apartment building in Seoul, South Korea was simulated by reflecting the wall U-values obtained from the previous experiment. Figure 7 describes the floor plan of a multi-residential unit simulated in this study. The apartment unit was modeled by using the TRNSYS dynamic software tool, and each thermal zone (e.g., living room, bathroom, kitchen, etc.) was simulated by applying an operation schedule suitable for its purpose. The exterior floor lines where structural thermal breaks are installed are outlined in red marks.
Additionally, Figure 8 presents the process flow diagram of TRNSYS dynamic simulation tool used in this study. Specifically, this simulation is designed to calculate the 1) ambient dry-bulb temperature of the study area, 2) COP-value of the installed HVAC system (i.e., ASHP) and 3) annual heating & cooling power loads (W) from building operation. Since the main goal of this study is to analyze the building energy demand with and without the installation of structural thermal breaks, most passive design conditions including the U-value of each structural element can be modified in “Building—Type 56”.
The physical properties of the building passive design elements were designed as shown in Table 2. The thermal transmittance (U-value) of the roof, floor, and wall was set to 0.15, 0.15, and 0.17(W/m2·K), respectively, which complies with the South Korean thermal insulation code [44]. Meanwhile, the thermal transmittance (U-value) of the concrete floor line, where thermal bridges mainly occur, was set to the values obtained from the experimental results shown in Table 3 and Table 4. The U-value of the concrete floor line is 0.972(W/m2·K) when the structural thermal break is not applied to exterior floor lines. However, the U-value of these outer floor lines, which are vulnerable to thermal bridging effects, can be improved to 0.349(W/m2·K) simply by installing thermal breaks. For reference, however, due to the limitations of TRNSYS simulation tool, the physical properties of the intersection between building elements such as the wall-slab conjunction cannot be adjusted. Thus, in this study, the average thermal transmittance (i.e., U-value) of the wall and floor planes were simulated by precisely estimating the U-values of the wall-slab conjunction depending on the presence of structural thermal break (See Figure 4). Specifically, in this research environment, the heights of the interior wall and wall-slab test specimen is 2,400(mm) and 425(mm), respectively. Therefore, the average U-value of the wall plane was calculated as an internal division of the thermal transmittance of the above-mentioned building elements, according to their height ratio. As a result, the average thermal transmittance of the wall plane calculated using this method was around 0.295(W/m2·K) without, and 0.185(W/m2·K) with the installation of structural thermal break. For reference, the U-value of floor surface was also calculated using the same principle. Based on these research settings, this study aims to investigate the effectiveness of applying structural thermal breaks to East Asian multi-residential apartments in terms of reducing the following by-products: (1) building energy demand, (2) operation costs, and (3) GHG emissions.
3.3. Integrative Analysis of Structural Thermal Break
This section describes the process of analyzing the comprehensive performance of structural thermal break from energy, economic, and environmental perspectives. From an energetic perspective, this paper mainly discusses the effect of reducing building energy demand (i.e., heating and cooling) owing to the application of structural thermal breaks. In terms of the economic perspective, this study derives the discounted payback period (DPP) of the structural thermal break by comparing the initial cost of the product with the building energy operation costs that can be reduced by applying such passive design building component. Finally, this paper evaluates the environmental performance of structural thermal break by comparing the GHG emissions generated during the manufacturing process of the building product (i.e., embedded CO2 emission) and the GHG emissions that can be reduced by installing thermal breaks during the building operational stage. Note that this environmental index does not represent a complete life-cycle assessment (LCA) of the structural thermal break. However, for most building materials and systems, CO2 emissions generated during the “embedded” and “operational” phases account for more than 90% of the pollutants generated throughout the entire process [45].
3.3.1. Energetic Analysis
This subchapter introduces a method of analyzing the savings in heating and cooling energy demand when applying structural thermal breaks to the multi-residential apartment building described in Table 2. First, in this study, the building energy demand for heating and cooling was operated according to the building occupancy schedule of a typical residential building in South Korea with four family members. Figure 9 shows the daily occupancy schedule for the multi-residential apartment analyzed in this study. For reference, the operation for space heating and cooling were made at the indoor temperature below 20℃ and above 26℃, respectively [46].
In general, heating energy demand can be significantly reduced by reinforcing insulation materials (such as structural thermal breaks) at building discontinuities where thermal bridges frequently occur [47]. On the other hand, well insulated thermal zones tend to have less heat loss, which in turn increases the amount of cooling energy demand. In other words, the slight increase in cooling energy mainly results from the internal heat trapped inside these spaces. However, according to the characteristics of South Korean climate, heating degree days (HDD) are much higher than cooling degree days (CDD) [48]. Therefore, the total amount of heating and cooling energy demand is expected to be reduced significantly by installing structural thermal breaks.
3.3.2. Economic Analysis
Second, this study analyzes the effect of reducing annual heating and cooling operation costs owing to the application of structural thermal breaks. Additionally, this paper attempts to calculate the payback period for structural thermal break by comparing its initial investment cost with the annual savings in building operation costs previously mentioned. In South Korea, the study area, progressive billing system is the most commonly applied electricity tariff system for multi-residential apartments. For reference, the electricity rate in time-of-use (TOU) electricity tariff system is determined by the unit price of on/off-peak hours [49]. Meanwhile, the progressive billing system has a structure in which the unit price of electricity is set according to the rate interval to which the real-time building energy demand falls into. Table 5 shows electricity rates based on the progressive billing system applied to typical multi-residential apartments in South Korea. Specifically, the power usage interval is divided into three levels, and the electricity rate for the energy demand between 0 to 200(kWh) is approximately 6.7(cent/kWh). Similarly, for real-time energy demand “200 ~ 400(kWh)” and “over 400(kWh)”, the unit price of electricity is 13.6(cent/kWh) and 20.3(cent/kWh), respectively. The hourly building operation costs for heating and cooling were calculated by dividing the real-time building energy demand by the COP-value of ASHP, then multiplying each value by the hourly price of electricity according to the progressive billing system. Finally, the annual heating and cooling operation costs is equal to the summation of all these hourly electricity costs (Equation 2 and 3).
EH, annual = Annual utility cost_heating [$USD]
EC, annual = Annual utility cost_cooling [$USD]
QH = Energy demand_heating [kWh]
QC = Energy demand_cooling [kWh]
COPASHP_H = COP-value of ASHP_heating
COPASHP_C = COP-value of ASHP_cooling
eH = Electricity rate_heating [cent/kWh]
eC = Electricity rate_cooling [cent/kWh]
t = Annual time sequence (0 t 8760)
In this study, the investment cost of structural thermal break was calculated as the sum of product cost and construction cost (labor cost + material cost + expense). For reference, Table 6 details the total investment cost of the structural thermal break applied in this study. This study evaluates the economic feasibility of structural thermal break by calculating its discounted payback period (DPP) using the equation below (equation 4). The average inflation rate in South Korea is approximately 3.15% per year [50], and the annual cashflow corresponds to the reduction in heating and cooling energy demand owing to the use of structural thermal breaks. In practice, the economic cost of structural thermal break has yet been stabilized due to the low market demand for such building element. Therefore, the purpose of this study if to present a reasonable threshold for the investment cost of structural thermal breaks in addition to the calculation of discounted payback periods.
DPP = Discounted payback period
O1 = Investment cost (Outflow)
r = Inflation rate (= 3.15%)
CF = Periodic cash flow
3.3.3. Environmental Analysis
The environmental performance of structural thermal break can be investigated by comparing the amount of 1) CO2 emissions generated during the manufacturing process and 2) annual CO2 reduction through building operation. Although this indicator known as the “environmental payback period” does not cover a complete life-cycle assessment (LCA) of the structural thermal break, the CO2 emissions generated during the “embedded” and “operational” stages take responsible for more than 90% of the GHG emissions generate throughout the entire process. Building typically produce GHG emissions while supplying electricity from the power grid. Figure 10 illustrates the electricity generation fuel mix in South Korea (Source: KEEI, 2022.12) [51]. For reference, the balance of electricity supply and demand is controlled by a single electricity market in South Korea. More specifically, Table 7 presents the monthly average electric fuel mixing ratio in the study area. The emission factor of electricity can be estimated by the weighted average of the emission factor of each fuel source (Equation 5). Finally, the amount of CO2 emissions from building operations can be derived by multiplying the “heating and cooling energy demand” by the “emission factor of electricity” at each time interval (Equation 6).
EFCO2, fuel = CO2 emission factor by fuel source (gCO2e/kWh)
GHGCO2 = Amount of CO2 emissions (tCO2e)
δfuel = Weighted ratio by fuel source (%)
QH = Heating energy demand (kWh)
QC = Cooling energy demand (kWh)
t = Annual time sequence (0 t 8760)
This study compares the total CO2 emissions generated during the manufacturing of structural thermal break to the annual reduction in GHG emissions resulting from building operation. The structural thermal break used in this study consists of four building materials as shown in Table 8. To be specific, the four components that make up the structural thermal break are stainless steel, carbon steel, CRC (Cellulose Fiber Reinforced Cement) board, and EPS (Expanded polystyrene) insulation. Both stainless and carbon steel serve as the structural body of the thermal break material. In particular, stainless steel offers strength and low thermal conductivity, making it effective in minimizing heat transfer between building elements [52]. Additionally, CRC board supports the physical strength and rigidity of structural thermal break by withstanding external loads. CRC boards offer high resistance to temperature changes and are made of natural fiber materials, making them environmentally friendly [53]. Finally, EPS insulation is widely used as structural thermal break material owing to its low thermal conductivity and durability, making it suitable for creating a continuous thermal environment [54].
The amount of embedded carbon (CO2/kg) varies by each construction material, and total CO2 emissions from manufacturing structural thermal break can be estimated by calculating the weight of each building material contained per unit module (1m) and the amount of thermal break needed. For reference, the total amount of structural thermal break required for the object building is 1,248(m). Since the CO2 emissions generated per unit module (1m) are 167.72 (gCO2e), the total CO2 emissions during the manufacturing process of structural thermal break is approximately 209.31 (kgCO2e).
4. Results
This section presents the results of the 1) energetic, 2) economic, and 3) environmental performance of the structural thermal break illustrated in the previous methodology chapter. Each by-product from the three perspectives is a key indicator [58] that determines the overall performance and future market value of structural thermal breaks. Therefore, this study seeks to clearly demonstrate the effects of reducing 1) grid energy demand, 2) building operation costs, and 3) GHG emissions by applying such thermal blockage material to multi-residential apartments.
4.1. Thermal Break: Energetic Performance
Basically, the energetic performance of structural thermal breaks can be measured by the difference in annual grid energy demand with and without their application to buildings (see Figure 11). As described in the figure, the grid energy demand for heating can be significantly reduced by installing thermal breaks. Meanwhile, the amount of indoor heat generation increases in well insulated apartment buildings, leading to a slight increase in cooling energy demand during the summer. Specifically, the increase in cooling energy demand mainly results from the internal heat trapped inside the insulated spaces. Table 9 presents the annual reduction rate in grid energy demand (kWh/m2·year) when applying structural thermal breaks. The results show that 44.70% of heating energy demand can be reduced annually. However, due to the increase in cooling energy demand (i.e., 8.61%), the annual decrease in grid energy demand was found to be no more than 21.63%.
4.2. Thermal Break: Economic Performance
The economic feasibility of structural thermal break will be a crucial indicator for the future market demand of this building material in the construction sector. First, this study presents the savings in annual heating and cooling operation costs owing to the use of structural thermal breaks. Figure 12 compares the annual building operation costs ($USD/m2·year) with and without the installation of thermal breaks. Similar to the trend of grid energy demand, the annual heating operation costs can be dramatically reduced by the use of structural thermal break. On the other hand, cooling operation costs tend to increase with the use of insulation material. Referring to the table shown below, heating operation cost was reduced by 57.63% annually (Table 10). However, due to the increase in cooling operation cost (12.42%), the annual building operation cost was reduced by no more than 24.63%.
The aim of this study is to estimate the economic payback period of structural thermal break by comparing its investment cost (see Table 6) with the annual savings in building operation cost discussed earlier. First, Figure 13 compares the current investment cost of structural thermal breaks with the upfront costs that must be adjusted to meet a simple payback period (SPP) of 7 to 20 years. However, the inflation rate of products cannot be neglected in realistic economic calculations. Figure 14 shows a more realistic approach by presenting the recommended investment costs for structural thermal breaks to meet a discounted payback period (DPP) between 7 and 20 years. As a result, the threshold for meeting a reasonable payback period becomes quite stringent when considering an inflation rate of 3.15%. Table 11 summarizes the recommended cost reduction rates to make structural thermal breaks economically feasible. For reference, the results show that structural thermal break will meet a DPP of 10 years once its initial cost is reduced by 69.40%. Although there are no absolute standards for a reasonable payback period [59], there is no doubt that the investment cost of structural thermal break must be lowered significantly for its future demand.
4.3. Thermal Break: Environmental Performance
Over the past few years, building energy research has moved towards examining the environmental impacts of various building elements. In line with this research trend, this paper analyzed the environmental performance of structural thermal breaks. Figure 15 illustrates the annual CO2 emissions from the object building (kgCO2/m2·year), with and without the installation of structural thermal breaks. As with the two by-products discussed earlier, grid energy demand and building operation cost, the application of structural thermal breaks can significantly reduce the CO2 emissions resulting from heating energy demand. Specifically, the reduction rates (%) in CO2 emissions from heating and cooling are presented in Table 12. For reference, the amount of GHG emissions from building operations are proportional to the real-time grid energy demand. Thus, the annual reduction in GHG emissions owing to the use of structural thermal break was also 21.63%.
Finally, this study presents the environmental payback period of structural thermal break by comparing two indicators related to its production and application: (1) embedded CO2 emissions during its manufacturing process, and (2) operational CO2 emissions that can be reduced annually (Figure 16). According to the results, the application of structural thermal break requires 8.58 years of building operation to achieve carbon neutrality. In conclusion, this paper strongly suggests the application of structural thermal break to new construction sites, since the building material has relatively short environmental payback period (8.58 years) compared to the average lifespan of typical residential apartments (50 years) [60].
5. Discussion
This paper investigated the energy, economic, and environmental performance of structural thermal breaks to highly recommend its application to East Asian multi-residential apartments. First, this study clearly demonstrates the benefits of applying structural thermal breaks to multi-residential apartments, especially in reducing annual building energy demand for heating. Although there is still a lack of case studies on the application of structural thermal break in East Asian context, the effectiveness of this building material in reducing heating energy demand will highly depend on the climatic features of a construction site, regardless of the continent. In other words, the energy saving efficiency of structural thermal break is undoubtedly reliable in climates with high heating energy demand. Rather, this study focused additionally on analyzing the economic, and environmental performance of structural thermal break to propose realistic measures to expand the market distribution of such building material.
Therefore, this study systematically analyzed the economic feasibility of structural thermal break by estimating its discounted payback period (DPP). In fact, there are still not many studies that have performed economic analysis on this structural insulation material. In Italy, G. Evola et al., performed an energy and economic assessment of structural thermal breaks in the Mediterranean climate zone [10]. In their study, the discounted payback period for thermal breaks applied to terraced house was reached after 18~20 years, assuming an inflation rate of 3.15%. In Portugal, P. Silva et al., proposed multiple prefabricated retrofit modules (PRMs) for structural thermal break and demonstrated a payback period of 6.90 years under the most cost-effective conditions [11]. However, it is unclear whether the economic payback period calculated in this study takes into account the inflation rate of the product. There may be some other papers that have estimated the payback period of structural thermal breaks. However, few studies have provided clear baseline (or improvement tasks) for this building material to become cost-effective in the future. The key findings learned through the economic analysis of this study is that the high upfront cost of structural thermal break would likely be the main hindrance for its market distribution. Thus, this paper will contribute to presenting the reasonable cost level of structural thermal break for its future application in the residential sector.
Similar to the analysis of economic perspective, few studies have investigated the environmental performance of structural thermal breaks. In this paper, the environmental payback period of structural thermal break was carefully derived by comparing its embedded CO2 emissions with the annual reduction in operational GHG emissions through its application. As a result, this study found that the environmental impact of installing structural thermal break is relatively low since net-zero emission can be met in 8.58 years, which is much shorter than the average lifespan of typical buildings. Overall, this paper analyzed the energy, economic, and environmental performance of structural thermal break and proposes several key tasks for expanding its market distribution in the future. Although structural thermal break was found to be energy efficient and environmentally sound, its initial cost must be significantly reduced to become cost-effective in field applications. Overall, this paper will serve as an integrative guideline, outlining the three major perspectives of structural thermal break, that can be used as a reference for densely populated multi-residential apartments.
Finally, the current study will serve as a foundation for integrating structural thermal breaks with sustainable technologies in the built environment. Future studies on structural thermal break will likely focus on optimizing its energy, economic, and environmental performances through material innovation and integration with smart building technologies [61]. To be specific, research into aerogels, vacuum-insulated panels (VIPs), and phase-change materials (PCMs) can enable structural thermal breaks to achieve ultra-low thermal conductivity (0.015 ~ 0.020(W/m·K)) while maintaining structural integrity [62]. For this reason, researchers should focus on analyzing the economic feasibility of structural thermal break to facilitate the market expansion of such high-performance thermal barrier products. In addition, the economical use of structural thermal break will promote its potential for coupling with dynamic insulation systems utilizing renewable energy systems. Integrating structural thermal break with solar power technology offers a synergistic approach to enhancing building energy efficiency by reducing building energy demand through thermal insulation and generating additional power using a renewable energy source. Conclusively, the authors will conduct follow-up research to demonstrate that the integration of structural thermal break with renewable energy systems can economically promote the implementation of net-zero emission building (NZEB) in the future.
6. Limitation & Preventive Solutions
This chapter addresses some limitations encountered while conducting the study. There are roughly three major limitations outlined, which needs to be resolved in the future research. First, this paper analyzed a typical multi-residential apartment located in Seoul, South Korea and expanded the scope of research to East Asia. Specifically, the logical fallacy of this generalization begins with the rough assumption that East Asia has similar climatic conditions and residential patterns overall. In fact, according to a study by Wang et al., the East Asian region of our target scope is classified into three major climate zones (i.e., semiarid, humid continental, and humid subtropical) [63]. In addition, although these study areas are commonly populated with similar types of residential housings, the social contents such as inflation rates and electricity tariff systems will be different when performing an economic analysis. Therefore, in order to compensate for these limitations, the follow-up research should perform energy, economic, and environmental analysis of structural thermal breaks in the East Asian context by at least classifying the target areas according to their country and climatic conditions.
Second, the energy simulation modeling via TRNSYS software tool was conducted with absolute confidence in the experimental results. As shown in Table 3 and Table 4, the linear thermal transmittance (i.e., U-value) of the specimens with and without structural thermal break was measured as the average value of three experimental trials, which may be more reliable than a single measurement. However, most studies that involve experiments and simulations undergo a validation process between the two methodologies. Although this study referred to one of the previous studies to set the COP-value of ASHP [38], the insulation performances of building elements were modeled rather simply based on experimental results. Overall, the experiment covered in this study measures the linear thermal transmittance (U-value) of structural thermal breaks, which is required prior to evaluating the building energy performance. Thus, unlike most studies that basically undergo validation between experiments and simulations, the verification process between the two methodologies could not be performed in this study due to their different purposes in measurement. For reference, when establishing the mock-up testing standard for structural thermal breaks in the future, the criteria will be more complete if the U-values of the walls and floors are experimentally measured and verified with simulation outcomes. However, in this study, additional experiments were omitted because the U-values of building components other than the concrete floor line are not the physical quantities intended to be compared through this standardized procedure. Future studies could address these limitations by establishing systematic experimental standards that can significantly reduce the time and cost required for mock-up testing.
Another limitation that inevitably appeared in conducting this study came from the process of estimating the embedded CO2 emissions of structural thermal break during its manufacturing process. For reference, the structural thermal break used in this study is composed of four building materials, which are: 1) stainless steel, 2) carbon steel, 3) CRC board, and 4) EPS insulation. Due to the lack of studies calculating the embedded CO2 emissions of structural thermal break, this study estimated the total carbon footprint of the building insulator by simply adding up the amount of CO2 emissions generated during the manufacturing process of each four element. However, to be more precise, the embodied CO2 emissions of the target material should include not only the carbon footprint of each building element, but also CO2 emissions generated during the welding process between these components. Perhaps, if the calculation had been made accurately by considering all possible factors, the environmental payback period of structural thermal break might have been estimated to be longer than 8.58 years. Therefore, to compensate for this simplification problem in the future, LCA of various building materials should be compiled into a well-organized database.
7. Conclusions
This study examined the energy, economic, and environmental performance of one of the basic technologies that has been overlooked in the building sector. Structural thermal break was first introduced in Europe in the 1980s, and the market demand for this building material has recently expanded to North American countries such as the United States and Canada. The spread of structural thermal break is gradually increasing throughout many developed nations, since this insulation material deals with building envelope, which is essential for implementing high-performance buildings in the future. However, despite this trend, the public awareness of structural thermal break is still low in East Asia, which has the highest population density in the world. Perceiving this in mind, the current paper aims to present the energy, economic, and environmental performance guideline for structural thermal breaks that can be referenced throughout East Asian multi-residential buildings.
This study estimated the energy efficiency and economic viability of structural thermal break by calculating its discounted payback period (DPP) when applied to a multi-story apartment located in Seoul, South Korea. The results show the application of structural thermal break can lead to 21.63% and 24.63% annual reduction in building energy demand and operation costs, respectively. However, in terms of the economic perspective, the investment will never be paid back at a discount rate of 3.15% due to the high upfront cost of this building material. One of the key findings of this study is that the high initial cost of structural thermal break may likely be the main hindrance for its widespread use in the built environment. Therefore, this paper additionally presents the economic cost reduction rates for structural thermal breaks to achieve a DPP of less than 20 years. In terms of the environmental perspective, this study found that residentials installed with structural thermal break can neutralize its embedded CO2 emissions within 8.58 years, which is much shorter than the average lifespan of typical buildings (50 years). Overall, although structural thermal break has relatively low environmental impact, the initial cost of this building material should be significantly reduced to become cost-effective in field applications. In conclusion, this paper will contribute to presenting clear improvement tasks for the widespread use of structural thermal break in the East Asian multi-residential context by comprehensively analyzing its 1) energy, 2) economic, and 3) environmental potentials.
Funding
This study was conducted with support from the Ministry of Land, Infrastructure and Transportation & Korea Agency for Infrastructure technology Advancement (Project No. 21DPSC-C163230-01, Development of standardized mock-up testing procedures for residential performance).
Data Availability Statement
Data will be made available on request.
Acknowledgments
The author would like to express sincere appreciation to Dr. Bo-Kyoung Koo for providing technical advice on structural thermal break.
Conflicts of Interest
The author declares that he (or she) has no known competing financial interests or personal relationships that could have appeared to influence the work reported in this paper.
Abbreviations
| ASHP | Air-Source Heat Pump |
| CDD | Cooling Degree Days |
| CPR | Construction Products Regulation |
| CRC | Cellulose fiber Reinforced Cement |
| DPP | Discounted Payback Period |
| EOTA | European Organization for Technical Assessment |
| EPS | Expanded Polystyrene |
| GHG | Greenhouse Gas |
| HDD | Heating Degree Days |
| ISO | International Organization for Standardization |
| JIS | Japanese Industrial Standards |
| KS | Korean Standards |
| LCA | Life-Cycle Assessment |
| NECB | National Energy Code of Canada for Buildings |
| NYCECC | New York City Energy Conservation Code |
| NZEB | Net-Zero Emission Building |
| PCM | Phase-Change Material |
| SPP | Simple Payback Period |
| VIP | Vacuum-Insulated Panel |
References
- Nejat, P.; Jomehzadeh, F.; Taheri, M.M.; Gohari, M.; Majid, M.Z.A. A global review of energy consumption, CO 2 emissions and policy in the residential sector (with an overview of the top ten CO 2 emitting countries). Renew. Sustain. Energy Rev. 2015, 43, 843–862. [CrossRef]
- Aghasizadeh, S.; Kari, B.M.; Fayaz, R. Thermal performance of balcony thermal bridge solutions in reinforced concrete and steel frame structures. J. Build. Eng. 2022, 48. [CrossRef]
- Magrini, A.; Marenco, L.; Bodrato, A. Energy smart management and performance monitoring of a NZEB: Analysis of an application. Energy Rep. 2022, 8, 8896–8906. [CrossRef]
- Susorova, I.; Stephens, B.; Skelton, B. The Effect of Balcony Thermal Breaks on Building Thermal and Energy Performance: Field Experiments and Energy Simulations in Chicago, IL. Buildings 2019, 9, 190. [CrossRef]
- International Organization for Standardization. (1994). Thermal Insulation: Determination of Steady-state Thermal Transmission Properties: Calibrated and Guarded Hot Box. International Organization for Standardization. https://www.iso.org/standard/16519.html.
- Worldometer—Real Time World SMetatisticser. Available online: https://www.worldometers.info/ (accessed on 12 January 2022).
- Statista 2024. Share of adults living in detached and semi-detached housing 2016. https://www.statista.com/statistics/503301/ share-of-population-living-in-houses-europe-eu-by-type/.
- Ibrahim, J.E.F.; Tihtih, M.; Kurovics, E.; Gömze, L.A.; Kocserha, I. Innovative glass-ceramic foams prepared by alkali activation and reactive sintering of clay containing zeolite (zeolite-poor rock) and sawdust for thermal insulation. J. Build. Eng. 2022, 59. [CrossRef]
- Green Building Advisor (2013.10). https://www.greenbuildingadvisor.com/question/concrete-balconies-and-thermal-breaks.
- Evola, G.; Margani, G.; Marletta, L. Energy and cost evaluation of thermal bridge correction in Mediterranean climate. Energy Build. 2011, 43, 2385–2393. [CrossRef]
- Silva, P.C.; Almeida, M.; Bragança, L.; Mesquita, V. Development of prefabricated retrofit module towards nearly zero energy buildings. Energy Build. 2013, 56, 115–125. [CrossRef]
- Plannl Home, Housing Analysis. Source: U.S. Census Bureau American Community Survey 2013-2017 (5-year estimates). https://plannl.org/housing-analysis.html.
- New York Energy Code, Summary of key residential energy code requirements, (2020.05). Source: The Energy Conservation Construction Code of New York State (ECCCNYS). https://insulationinstitute.org/wp-content/uploads/2020/07/NY_Code_ FINAL.pdf.
- Susorova, I.; Stephens, B.; Skelton, B. The Effect of Balcony Thermal Breaks on Building Thermal and Energy Performance: Field Experiments and Energy Simulations in Chicago, IL. Buildings 2019, 9, 190. [CrossRef]
- Statistics Canada, Type of dwelling reference guide (2022.04), Table 3. Source: Statistics Canada, Census of Population, 2021. https://www12.statcan.gc.ca/census-recensement/2021/ref/98-500/001/98-500-x2021001-eng.cfm.
- ICF Builder, Energy Codes and ICFS (2013.05). New Canadian Energy Code Standards, Ontario (SB-10). https://www.icfmag.com/2013/05/energy-codes-and-icfs/.
- The importance of slab edge & balcony thermal brides. Report #3: Energy consumption and cost savings of slab thermal breaks, RDH Building Engineering, (2013.09). https://www.rdh.com/wp-content/uploads/2017/07/Part-3-EnergySavings.pdf.
- Global Market Surfer, Share by housing type_11 countries (2020) | Data. https://www.global-market-surfer.com/market/ detail/461/Share+by+housing+type_11+countries.html?l=en.
- Shui, B.; Evans, M.; Lin, H.; Jiang, W.; Liu, B.; Song, B.; Somasundaram, S. Country report on building energy codes in China (No. PNNL-17909). Pacific Northwest National Lab.(PNNL), Richland, WA (United States). [CrossRef]
- Evans, M., Shui, B., & Takagi, T. (2009). Country report on building energy codes in Japan (No. PNNL-17849). Pacific Northwest National Lab.(PNNL), Richland, WA (United States). [CrossRef]
- Evans, M., McJeon, H. C., Shui, B., & Lee, S. E. (2009). Country Report on Building Energy Codes in Korea (No. PNNL-17851). Pacific Northwest National Lab.(PNNL), Richland, WA (United States). [CrossRef]
- 40 years of Isokorb® thermal breaks – simply the original (Germany, 2023.04). https://www.schoeck.com/en-us/news/40-years-of-isokorb-reg-thermal-breaks.
- European Technical Assessment ETA-17/0261, English translation prepared by DIBt (i.e., Deutsches Institut für Bautechnik), (2017.09). https://www.schoeck.com/view/8814.pdf.
- Gonçalves, M.; Simões, N.; Serra, C.; Flores-Colen, I. A review of the challenges posed by the use of vacuum panels in external insulation finishing systems. Appl. Energy 2020, 257. [CrossRef]
- European Assessment Document – EAD 050001-00-0301 (2018.02), Load bearing thermal insulating elements which form a thermal break between balconies and internal floors. https://www.eota.eu/download?file=/2013/13-05-0001/ead%20for%20ojeu/ ead%20050001-00-0301_ojeu2018.pdf.
- Xu, H.; Wang, H.; Huo, Q.; Qin, Y.; Zhou, H. Comparative study of Chinese, European and ISO external thermal insulation composite system (ETICS) standards and technical recommendations. J. Build. Eng. 2022, 68. [CrossRef]
- Borelli, D.; Cavalletti, P.; Marchitto, A.; Schenone, C. A comprehensive study devoted to determine linear thermal bridges transmittance in existing buildings. Energy Build. 2020, 224. [CrossRef]
- Stonkuvienė, A.; Bliūdžius, R.; Burlingis, A.; Ramanauskas, J. The impact of connector’s thermal and geometrical characteristics on the energy performance of facade systems. J. Build. Eng. 2020, 35, 102085. [CrossRef]
- Hallander, A. (2022), Structural thermal breaks – Components that insulate concrete and steel penetrations, Structure magazine. https://www.structuremag.org/wp-content/uploads/2022/09/292210-C-StructuralComponents-Hallander.pdf.
- Schöck, North America building energy codes. Paths to compliance – United States. New York City Energy Conservation Code (NYCECC). https://www.schoeck.com/en-us/code-requirements.
- Ge, H.; McClung, V.R.; Zhang, S. Impact of balcony thermal bridges on the overall thermal performance of multi-unit residential buildings: A case study. Energy Build. 2013, 60, 163–173. [CrossRef]
- Lertwattanaruk, P.; Suntijitto, A. Properties of natural fiber cement materials containing coconut coir and oil palm fibers for residential building applications. Constr. Build. Mater. 2015, 94, 664–669. [CrossRef]
- Holzhueter, K.; Itonaga, K. The Potential for Light Straw Clay Construction in Japan: An Examination of the Building Method and Thermal Performance. J. Asian Arch. Build. Eng. 2017, 16, 209–213. [CrossRef]
- Xu, H.; Wang, H.; Huo, Q.; Qin, Y.; Zhou, H. Comparative study of Chinese, European and ISO external thermal insulation composite system (ETICS) standards and technical recommendations. J. Build. Eng. 2022, 68. [CrossRef]
- Singh, K. 24 Koppen’s Climatic Classification. https://ebooks.inflibnet.ac.in/geop14/chapter/koppens-climatic-classification/.
- Eck, T.F.; Holben, B.; Kim, J.; Beyersdorf, A.; Choi, M.; Lee, S.; Koo, J.-H.; Giles, D.; Schafer, J.; Sinyuk, A.; et al. Influence of cloud, fog, and high relative humidity during pollution transport events in South Korea: Aerosol properties and PM2.5 variability. Atmos. Environ. 2020, 232, 117530. [CrossRef]
- Jeong, Y.-S.; Lee, S.-E.; Huh, J.-H. Estimation of CO2 emission of apartment buildings due to major construction materials in the Republic of Korea. Energy Build. 2012, 49, 437–442. [CrossRef]
- Liu, Y.; Nan, X.; Han, H.; Li, J. The variable water temperature control strategy of the air-source heat pump compatible with floor heating system for an apartment. J. Build. Eng. 2024, 90. [CrossRef]
- Kim, H.; Junghans, L. Integrative economic framework incorporating the Emission Trading Scheme (ETS) for U.S. Residential energy systems. Energy Convers. Manag. X 2022, 14. [CrossRef]
- Lim, H.S.; Kim, G. The renovation of window mechanism for natural ventilation in a high-rise residential building. Int. J. Vent. 2017, 17, 17–30. [CrossRef]
- Kim, H.; Junghans, L. Economic feasibility of achieving net-zero emission building (NZEB) by applying solar and geothermal energy sources to heat pump systems: A case in the United States residential sector. J. Clean. Prod. 2023, 416. [CrossRef]
- Korea Standard Association. (2002). KS F-2277: Thermal insulation-Determination of steadystate thermal transmission properties-Calibrated and guarded hot box. https://www.kssn.net/search/stddetail.do?itemNo=K001010137174.
- Kim, S.-I.; Choi, J.-S.; Jo, J.-H.; Joe, J.; Cho, Y.-H.; Kim, E.-J. Simulation-based comparative analysis of U-value of field measurement methods. Case Stud. Therm. Eng. 2023, 50. [CrossRef]
- Kim, J.-M.; Park, Y.J.; Son, K.; Kim, Y.-J. Public housing lifecycle cost analysis for optimal insulation standards in South Korea. Energy Build. 2018, 161, 55–62. [CrossRef]
- Peng, C.; Wu, X. Case Study of Carbon Emissions from a Building’s Life Cycle Based on BIM and Ecotect. Adv. Mater. Sci. Eng. 2015, 2015, 1–15. [CrossRef]
- Lim, J.W.; Kim, H. Predicting the energy, economic, and environmental performance of next-generation photovoltaic technologies in residential buildings. Appl. Energy 2025, 390. [CrossRef]
- Zhao, K.; Jiang, Z.; Huang, Y.; Sun, Z.; Wang, L.; Gao, W.; Ge, J. The method of reducing heat loss from thermal bridges in residential buildings with internal insulation in the hot summer and cold winter zone of China. J. Build. Eng. 2022, 62. [CrossRef]
- Lee, K.; Baek, H.-J.; Cho, C. The Estimation of Base Temperature for Heating and Cooling Degree-Days for South Korea. J. Appl. Meteorol. Clim. 2014, 53, 300–309. [CrossRef]
- Kim, H. (2023). Economic Feasibility of Achieving Net-Zero Energy in Residential Buildings in the USA (Doctoral dissertation). [CrossRef]
- Trading Economics, South Korea Inflation Rate (2024.03). https://tradingeconomics.com/south-korea/inflation-cpi.
- Korea Energy Economics Institute (KEEI), 2022. https://kosis.kr/statHtml/statHtml.do?orgId=731&tblId=DT_73101_F001010&vw_cd=&list_id=00000202&scrId=&seqNo=&lang_mode=ko&obj_var_id=&itm_id=&conn_path=R1&path=.
- Simmons, J.C.; Chen, X.; Azizi, A.; Daeumer, M.A.; Zavalij, P.Y.; Zhou, G.; Schiffres, S.N. Influence of processing and microstructure on the local and bulk thermal conductivity of selective laser melted 316L stainless steel. Addit. Manuf. 2020, 32. [CrossRef]
- Vitrone, F.; Ramos, D.; Ferrando, F.; Salvadó, J. Binderless fiberboards for sustainable construction. Materials, production methods and applications. J. Build. Eng. 2021, 44. [CrossRef]
- Reynoso, L.E.; Romero, Á.B.C.; Viegas, G.M.; Juan, G.A.S. Characterization of an alternative thermal insulation material using recycled expanded polystyrene. Constr. Build. Mater. 2021, 301. [CrossRef]
- City of Winnipeg, Emission factors in kg CO2-equivalent per unit. https://legacy.winnipeg.ca/finance/findata/matmgt/documents/2012/682-2012/682-2012_appendix_h-wstp_south_end_plant_ process_selection_report/appendix%207.pdf.
- Billion Trees.com, Carbon Footprint of Steel Per kg & lb (Calculator & Full List of Steel Items), 2024.03. https://8billiontrees.com/carbon-offsets-credits/carbon-footprint-of-steel/.
- Insulfoam, Expanded Polystyrene Insulation, Environmental Product Declaration, EPS Industry Alliance. https://www.insulfoam.com/wp-content/uploads/2016/08/EPS-Insulation-EPD.pdf.
- Chontanawat, J. Relationship between energy consumption, CO2 emission and economic growth in ASEAN: Cointegration and causality model. Energy Rep. 2020, 6, 660–665. [CrossRef]
- Zhang, Z. & Zhang, Z. (2013). Valuation Based on Required Payback Period. Finance–Fundamental Problems and Solutions, 23-50. [CrossRef]
- Ji, S.; Lee, B.; Cho, Y.; Yi, M.Y. Effect of realistically estimated building lifespan on life cycle assessment: A case study in Korea. J. Build. Eng. 2023, 75. [CrossRef]
- Wang, G.; Fang, J.; Yan, C.; Huang, D.; Hu, K.; Zhou, K. Advancements in smart building envelopes: A comprehensive review. Energy Build. 2024, 312. [CrossRef]
- Johansson, P.; Wahlgren, P. Interior insulation using super insulation materials: saving energy and Johansson, P., & Wahlgren, P. (2020, November). Interior insulation using super insulation materials: saving energy and space. In IOP Conference Series: Earth and Environmental Science (Vol. 588, No. 5, p. 052017). IOP Publishing. [CrossRef]
- Wang, L.; Chen, W.; Huang, G.; Zeng, G. Changes of the transitional climate zone in East Asia: past and future. Clim. Dyn. 2016, 49, 1463–1477. [CrossRef]
Figure 1.
Concept diagram of internal heat movement depending on the presence of structural thermal break. Sectional drawings (a) without and (b) with the application of structural thermal break.
Figure 1.
Concept diagram of internal heat movement depending on the presence of structural thermal break. Sectional drawings (a) without and (b) with the application of structural thermal break.
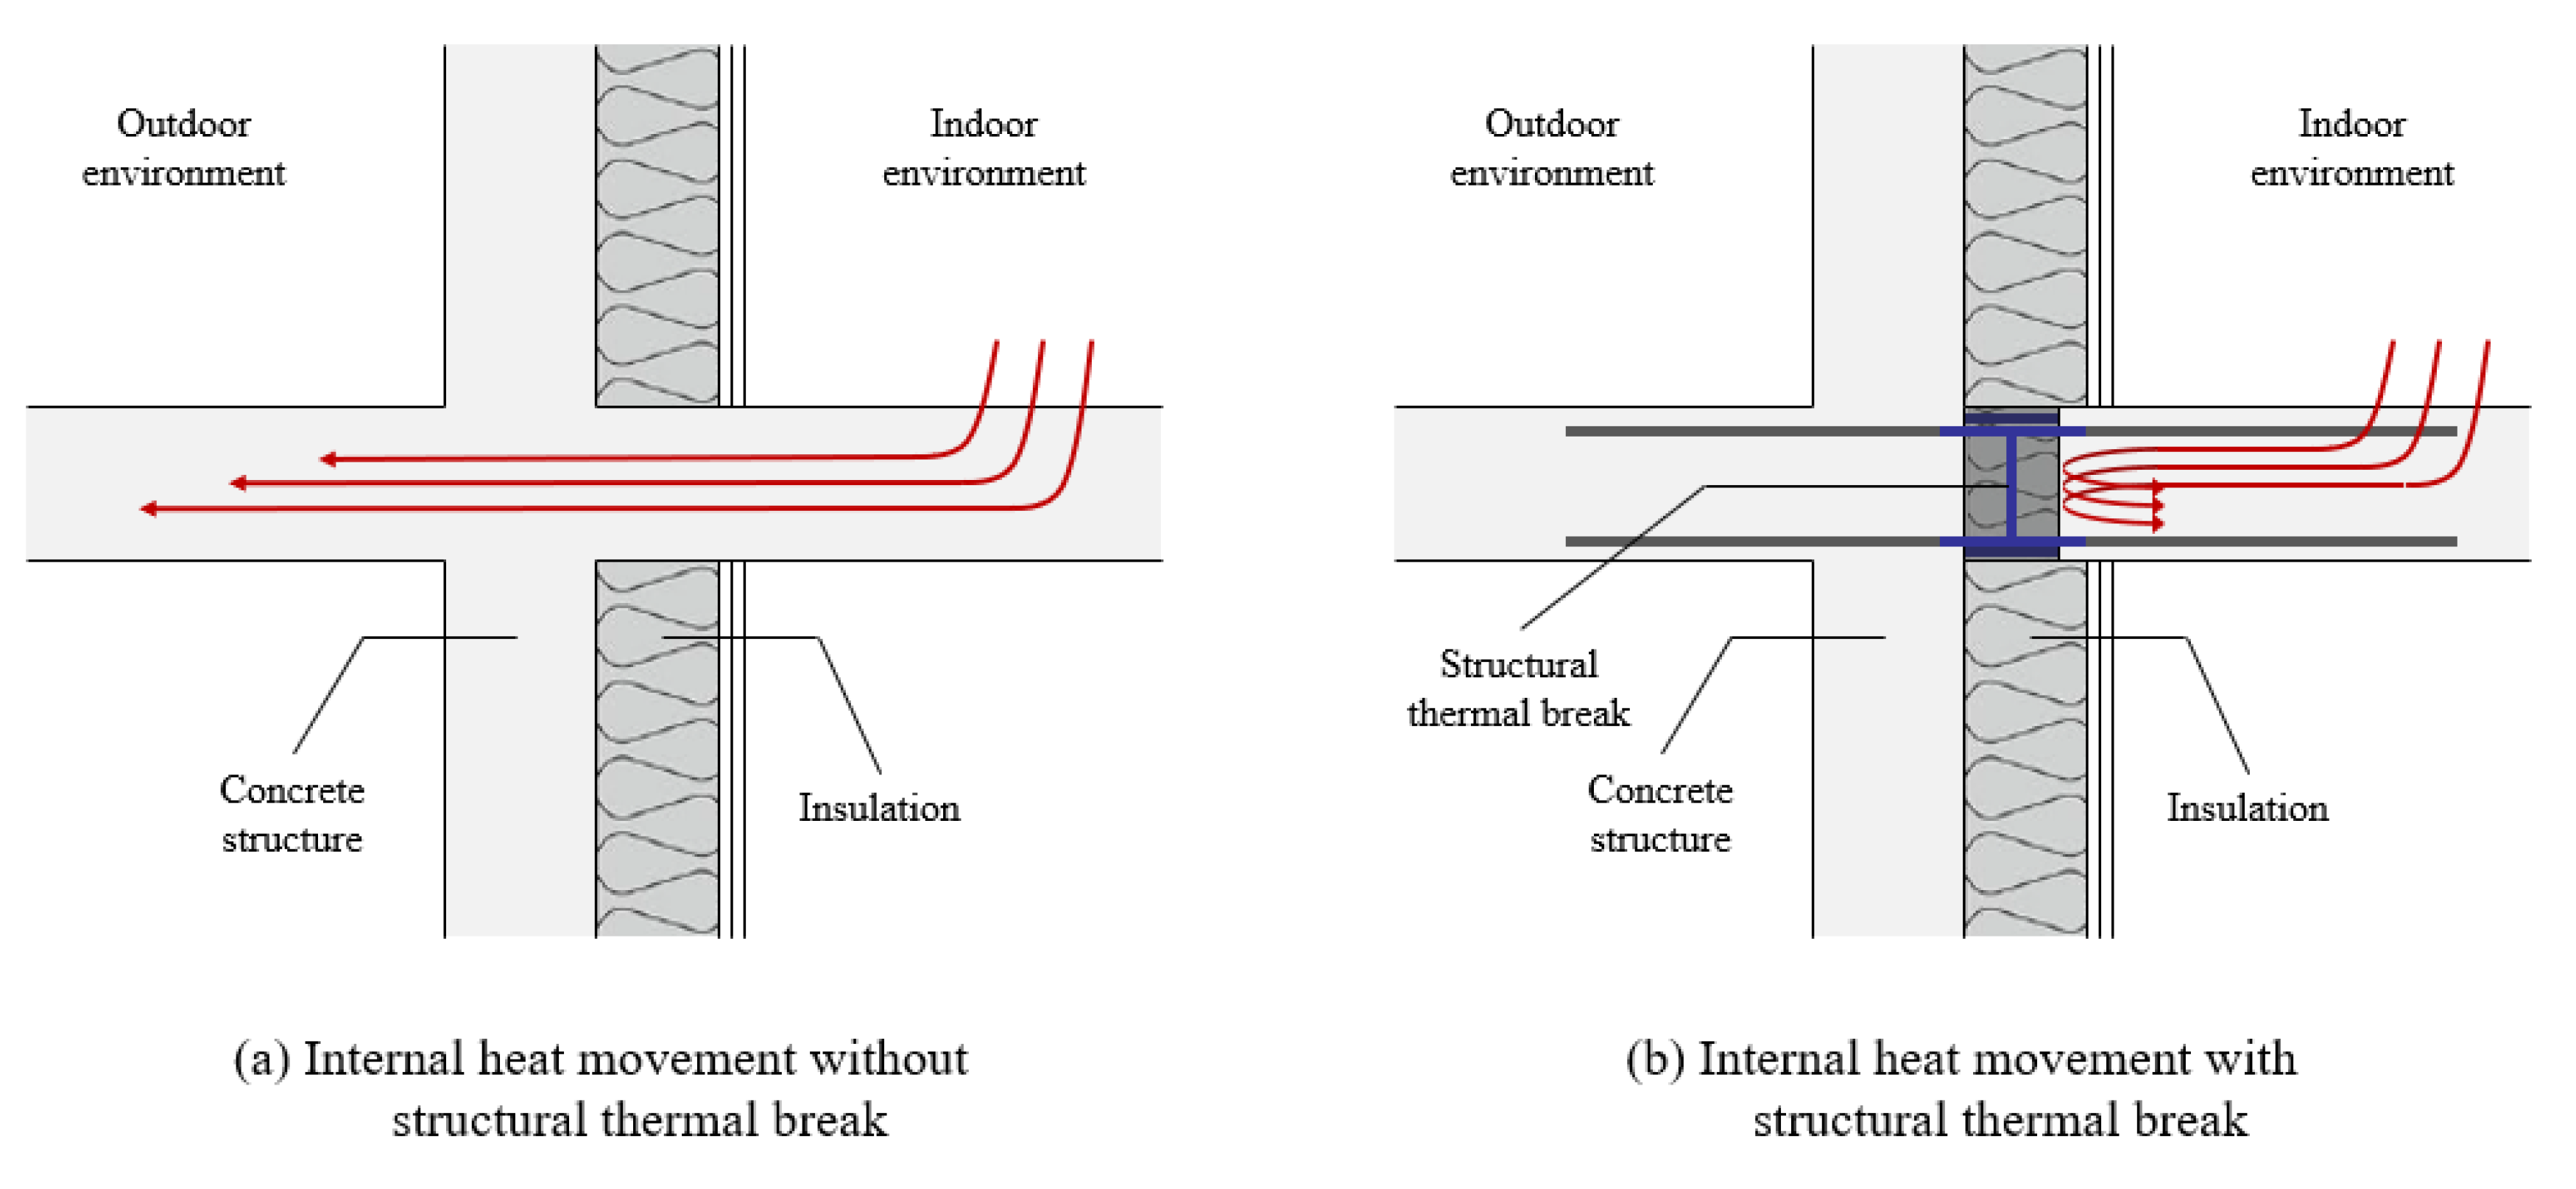
Figure 2.
Population density map of East Asia (Worldometer, 2025).
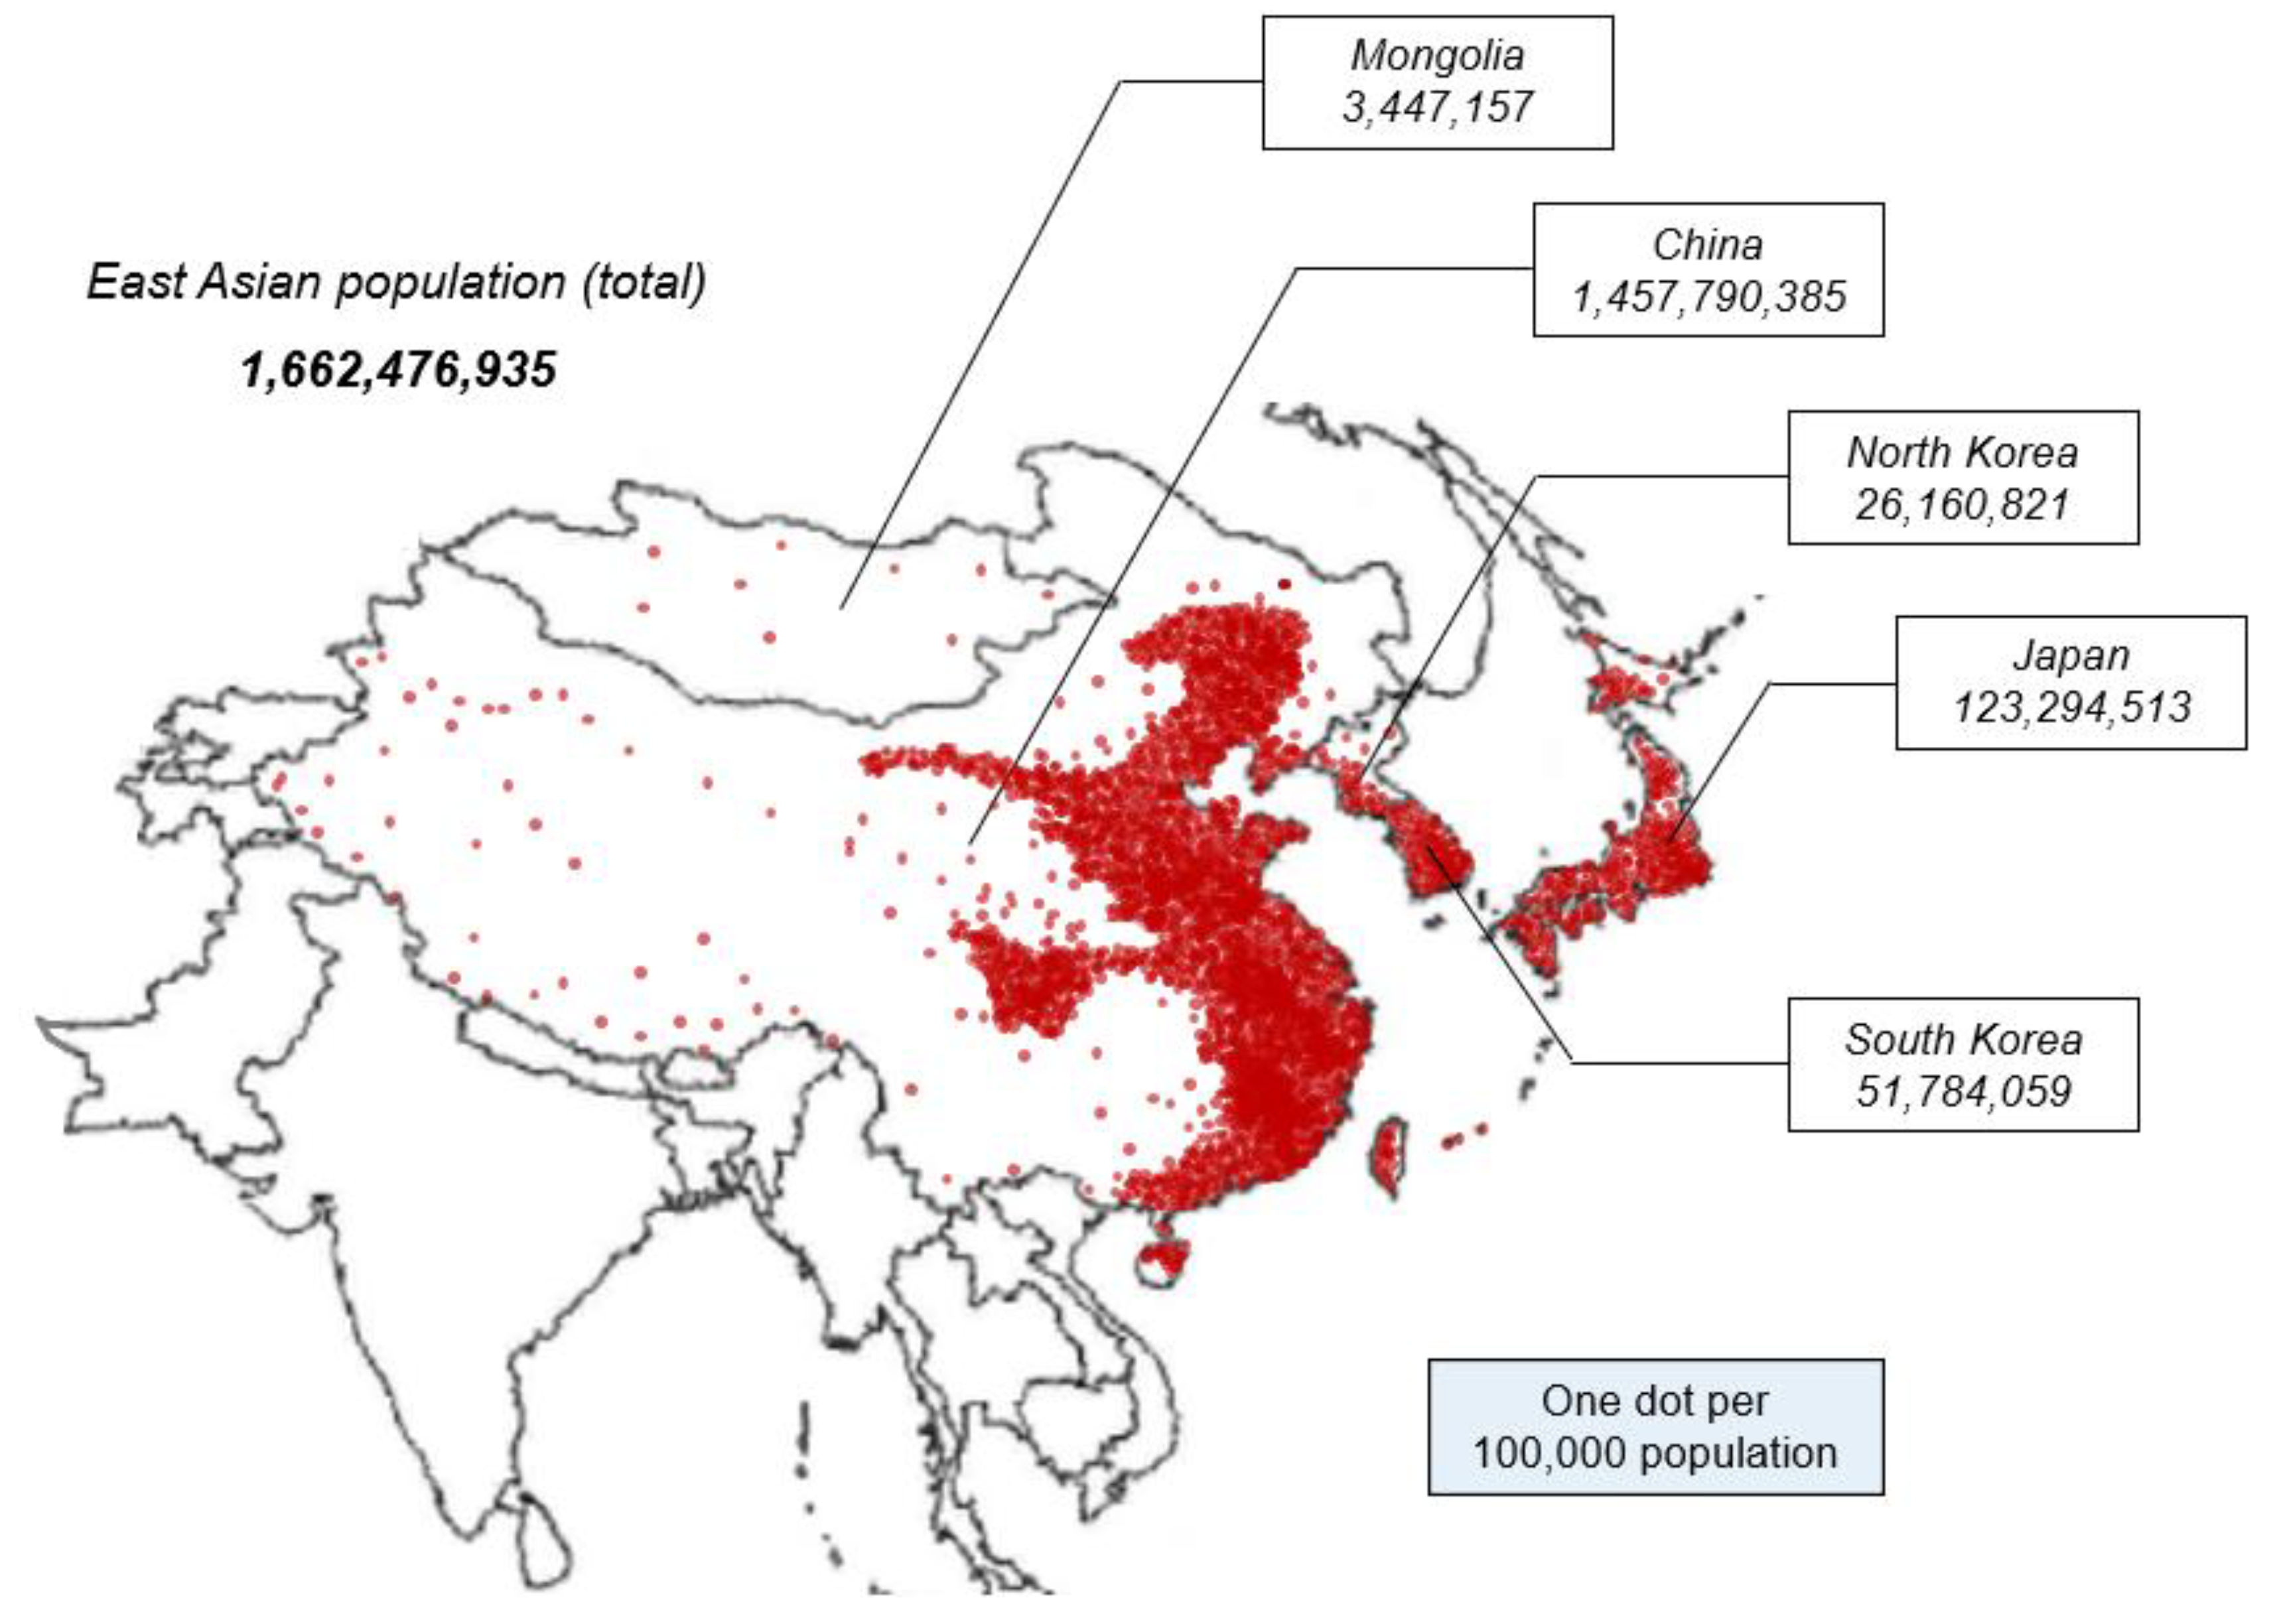
Figure 3.
Methodological process of the research framework. This figure shows a flowchart illustrating the calculation process for estimating the energy, economic, and environmental loads resulting from the use of structural thermal breaks.
Figure 3.
Methodological process of the research framework. This figure shows a flowchart illustrating the calculation process for estimating the energy, economic, and environmental loads resulting from the use of structural thermal breaks.
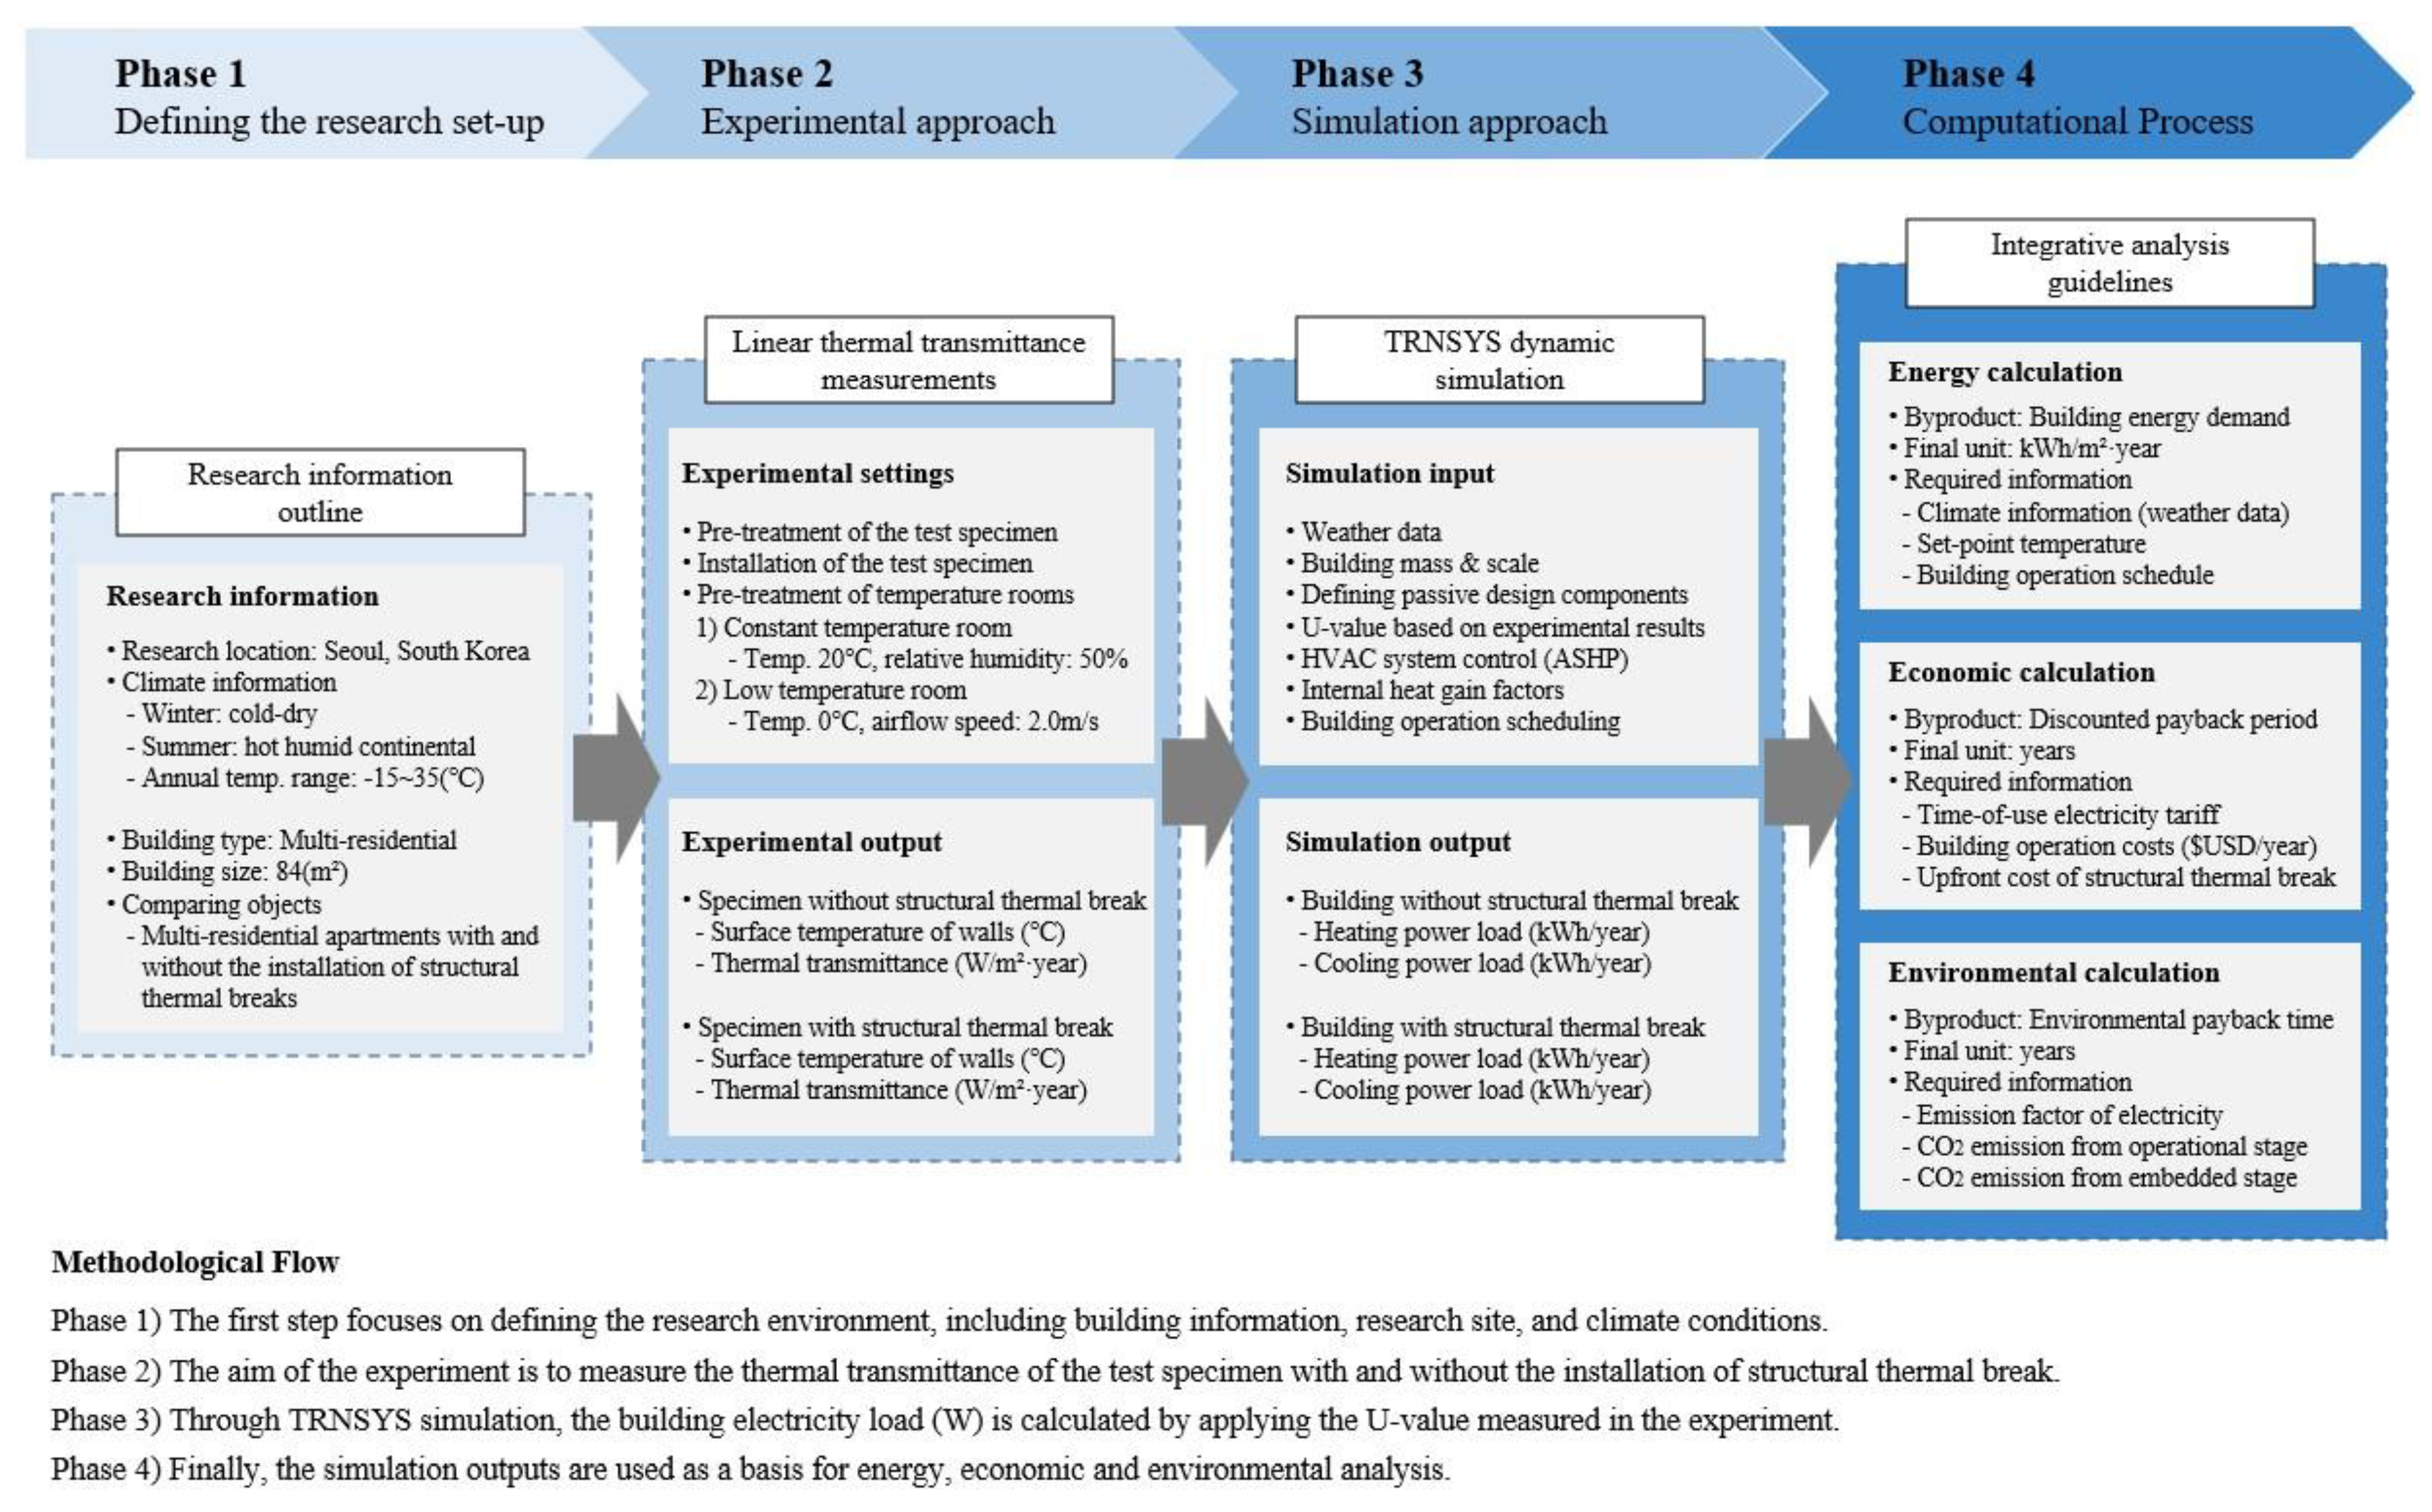
Figure 4.
Thermal transmittance of wall-slab conjunctions (a) with and (b) without structural thermal breaks installed. The U-value of the concrete floor lines were simulated by applying the experimental measurements.
Figure 4.
Thermal transmittance of wall-slab conjunctions (a) with and (b) without structural thermal breaks installed. The U-value of the concrete floor lines were simulated by applying the experimental measurements.
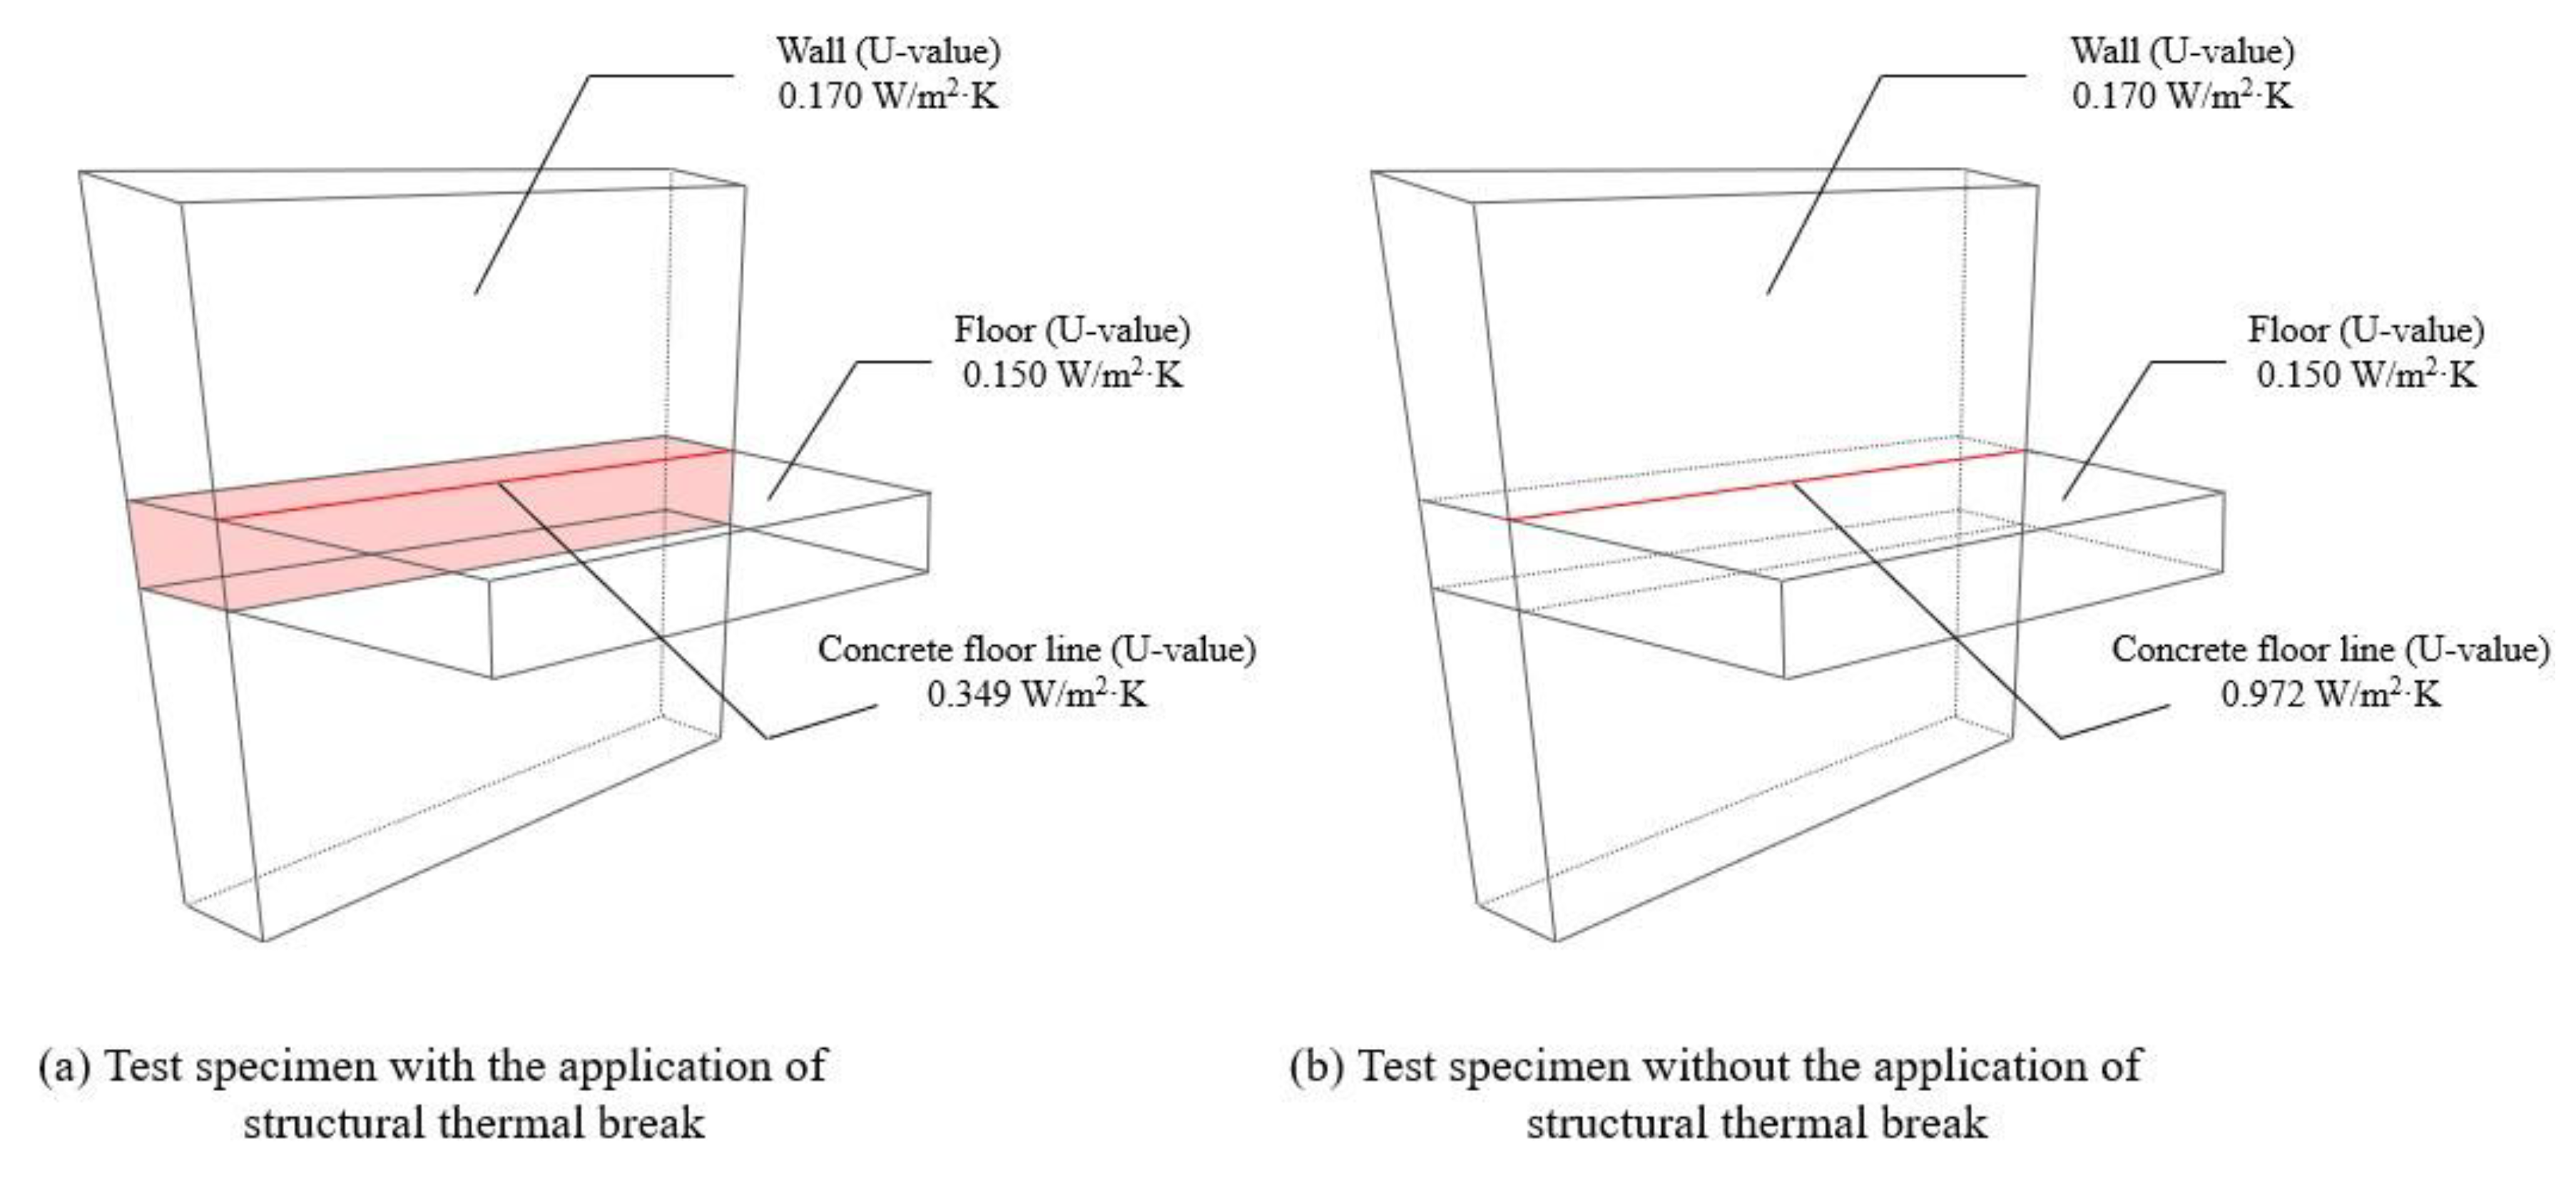
Figure 5.
Conceptual diagram of the experimental setup. The two rooms (i.e., constant- and low-temperature room) are separated by a wall structure into which the specimen is inserted.
Figure 5.
Conceptual diagram of the experimental setup. The two rooms (i.e., constant- and low-temperature room) are separated by a wall structure into which the specimen is inserted.
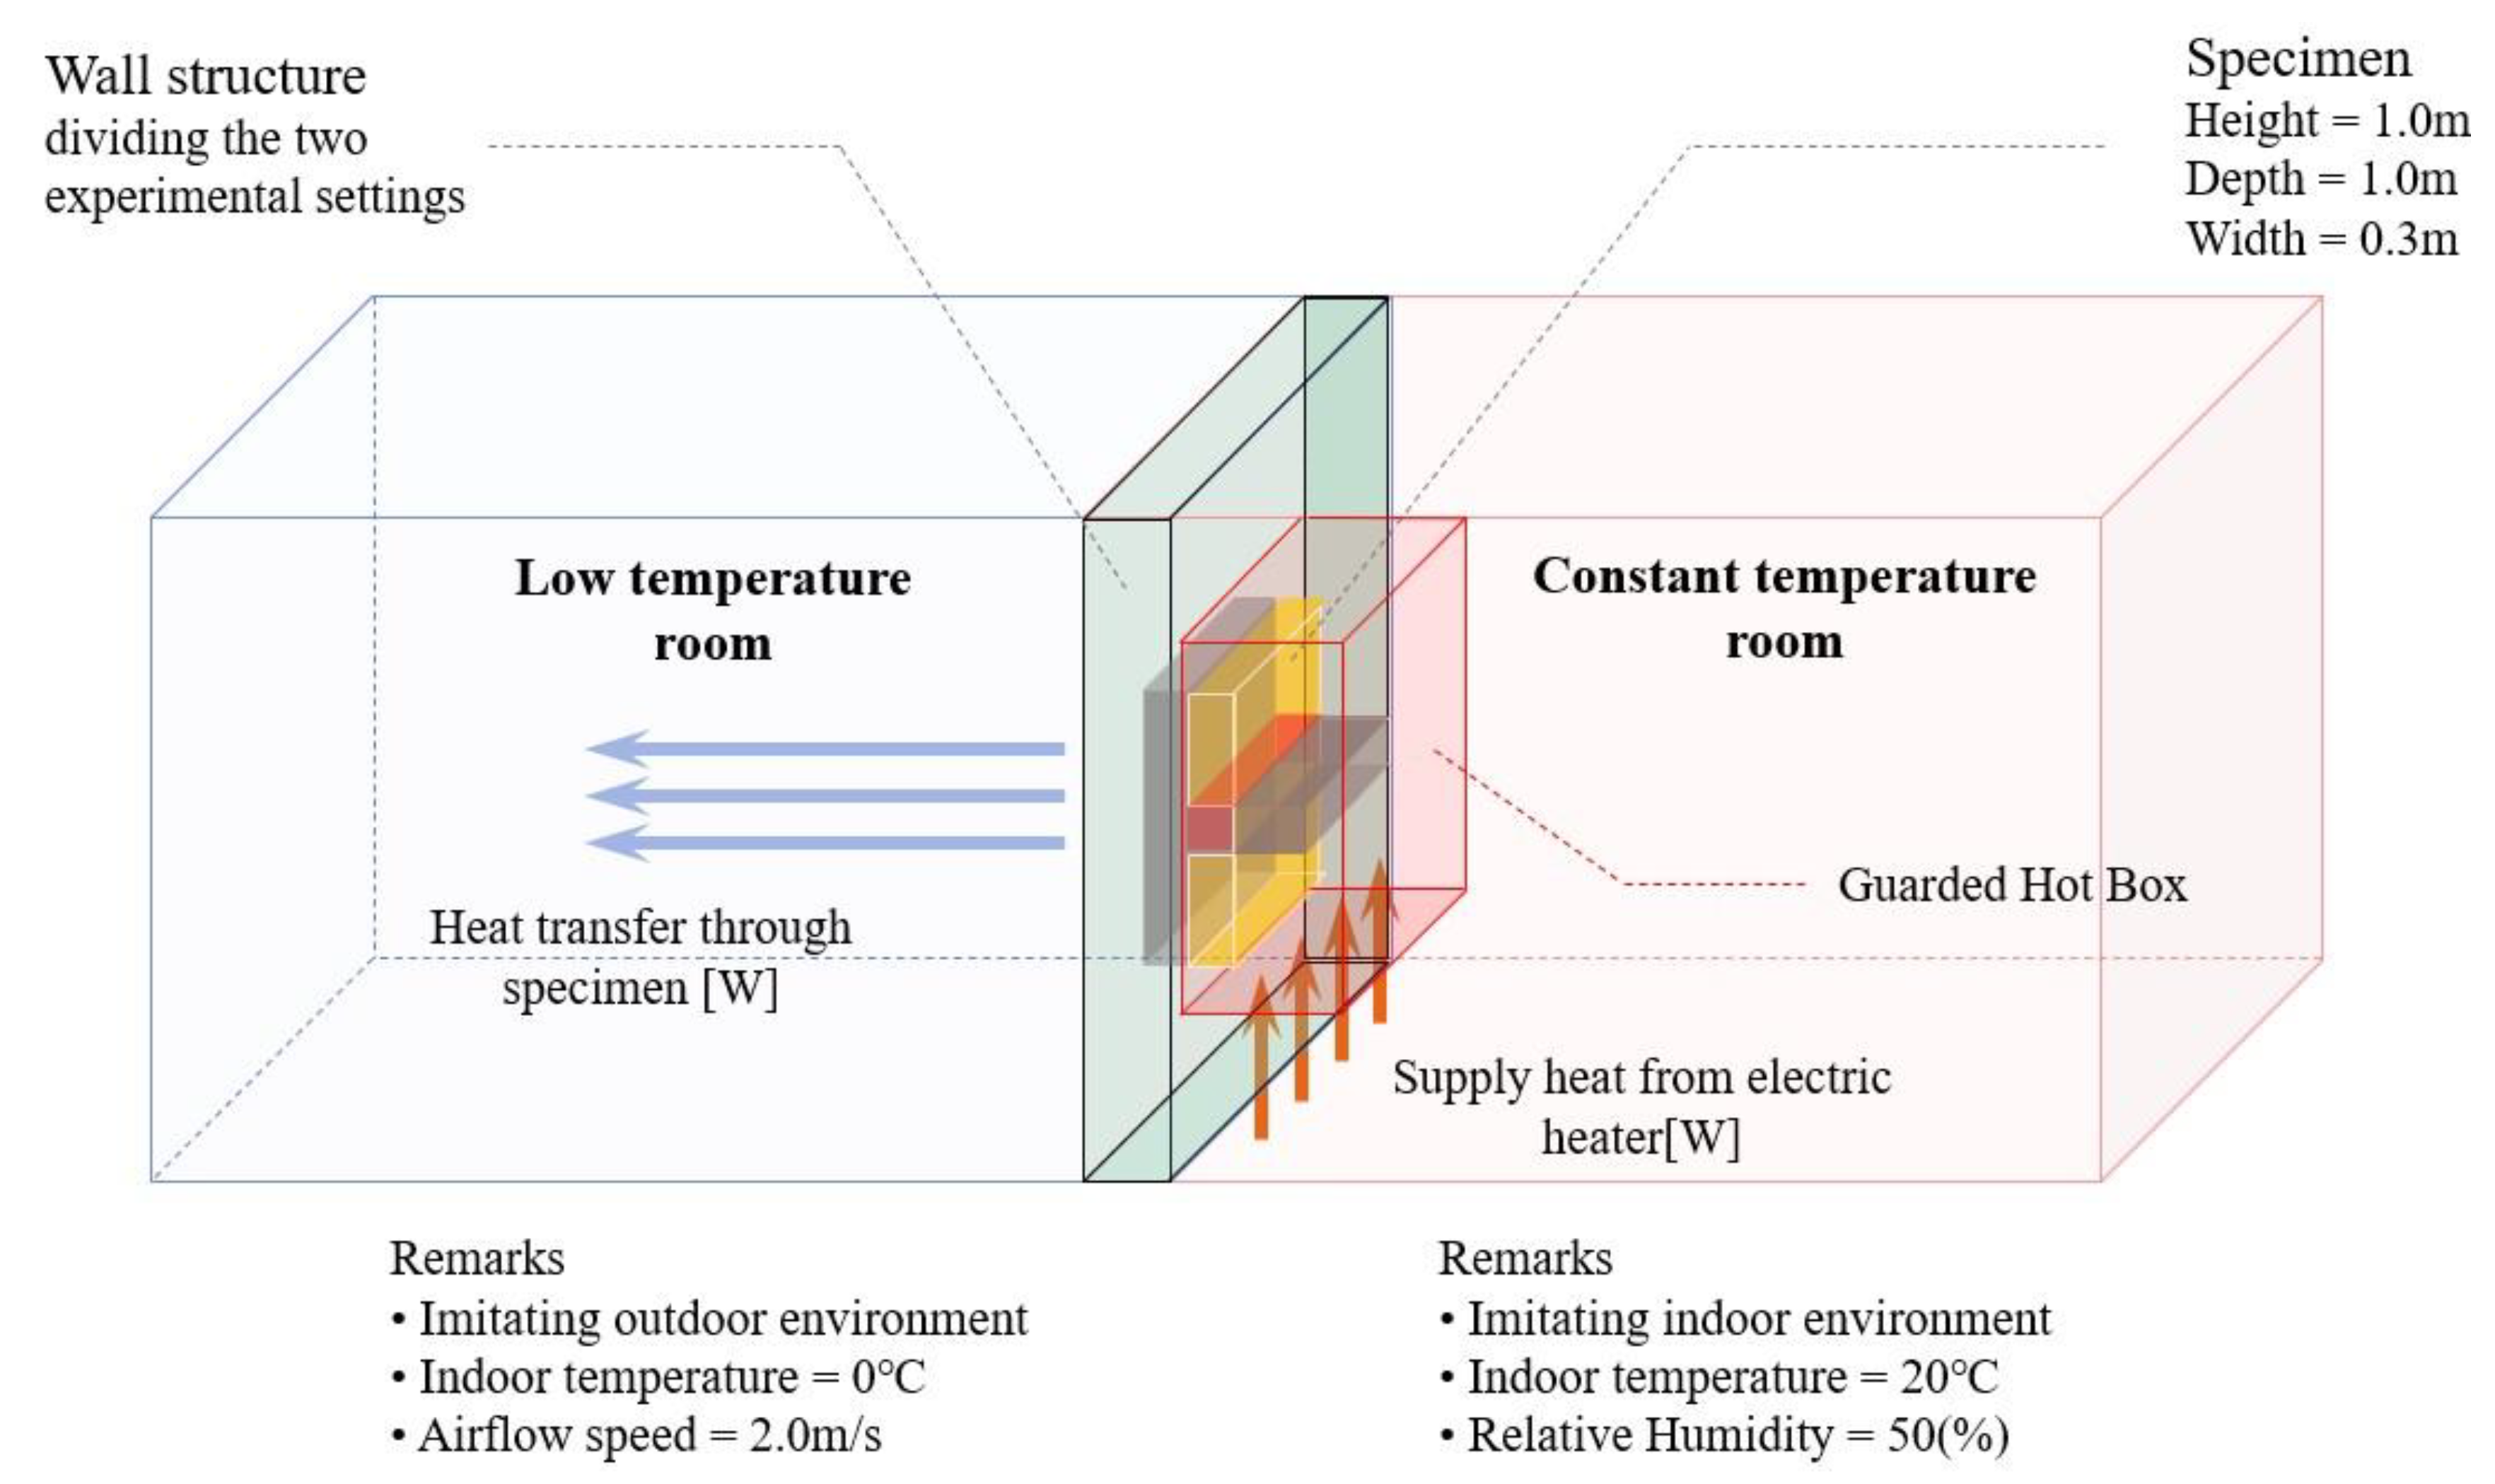
Figure 6.
Test instruments and equipment used in this study. T-type thermocouples were attached to both surfaces of the wall-slab test specimens, with and without the installation of structural thermal break.
Figure 6.
Test instruments and equipment used in this study. T-type thermocouples were attached to both surfaces of the wall-slab test specimens, with and without the installation of structural thermal break.
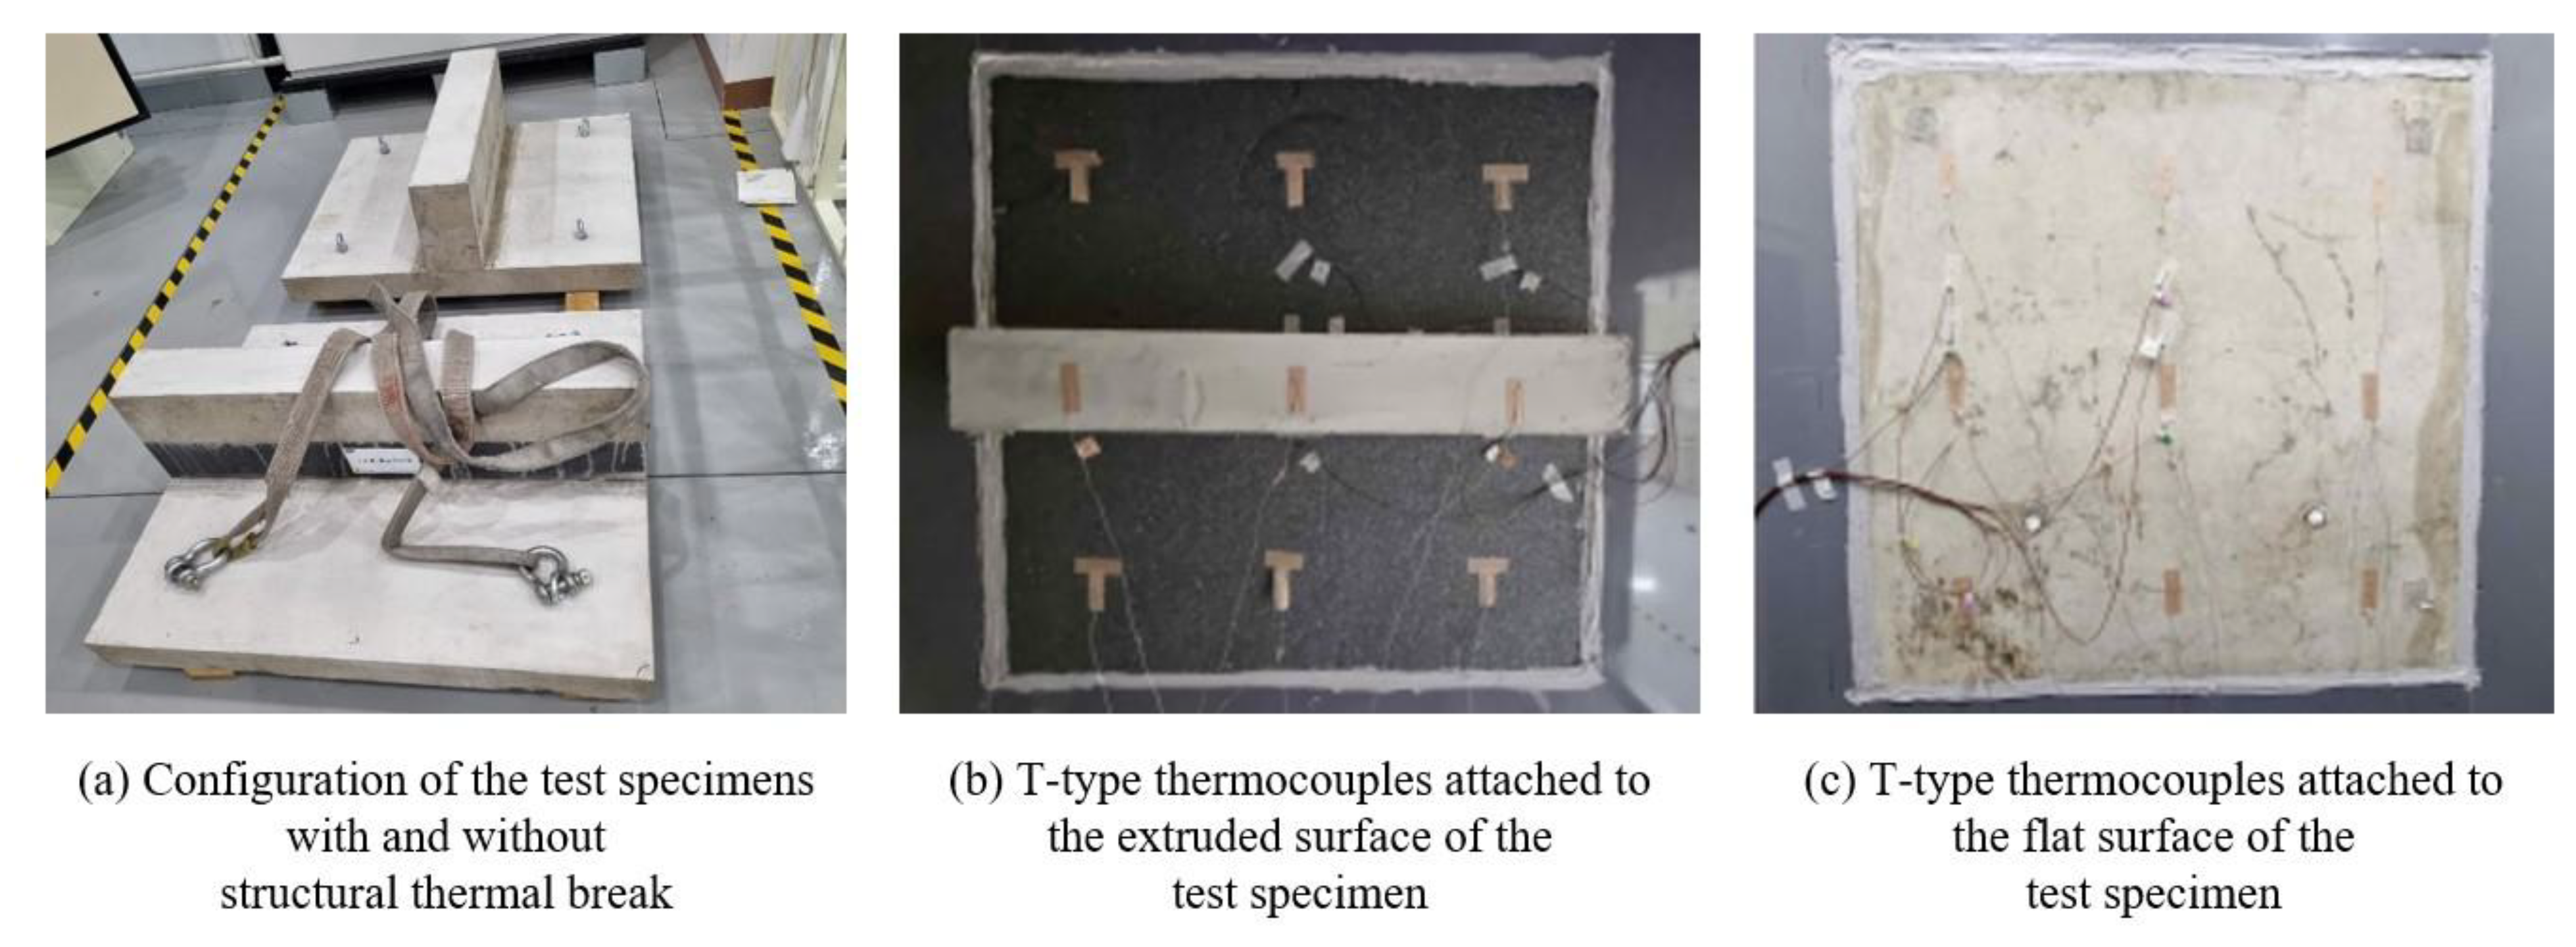
Figure 7.
A typical floor plan of a multi-residential apartment unit located in Seoul, South Korea. Each zone was simulated based on the operation schedule suitable for its purpose. In addition, the red mark indicates exterior floor lines where structural thermal breaks are applied.
Figure 7.
A typical floor plan of a multi-residential apartment unit located in Seoul, South Korea. Each zone was simulated based on the operation schedule suitable for its purpose. In addition, the red mark indicates exterior floor lines where structural thermal breaks are applied.
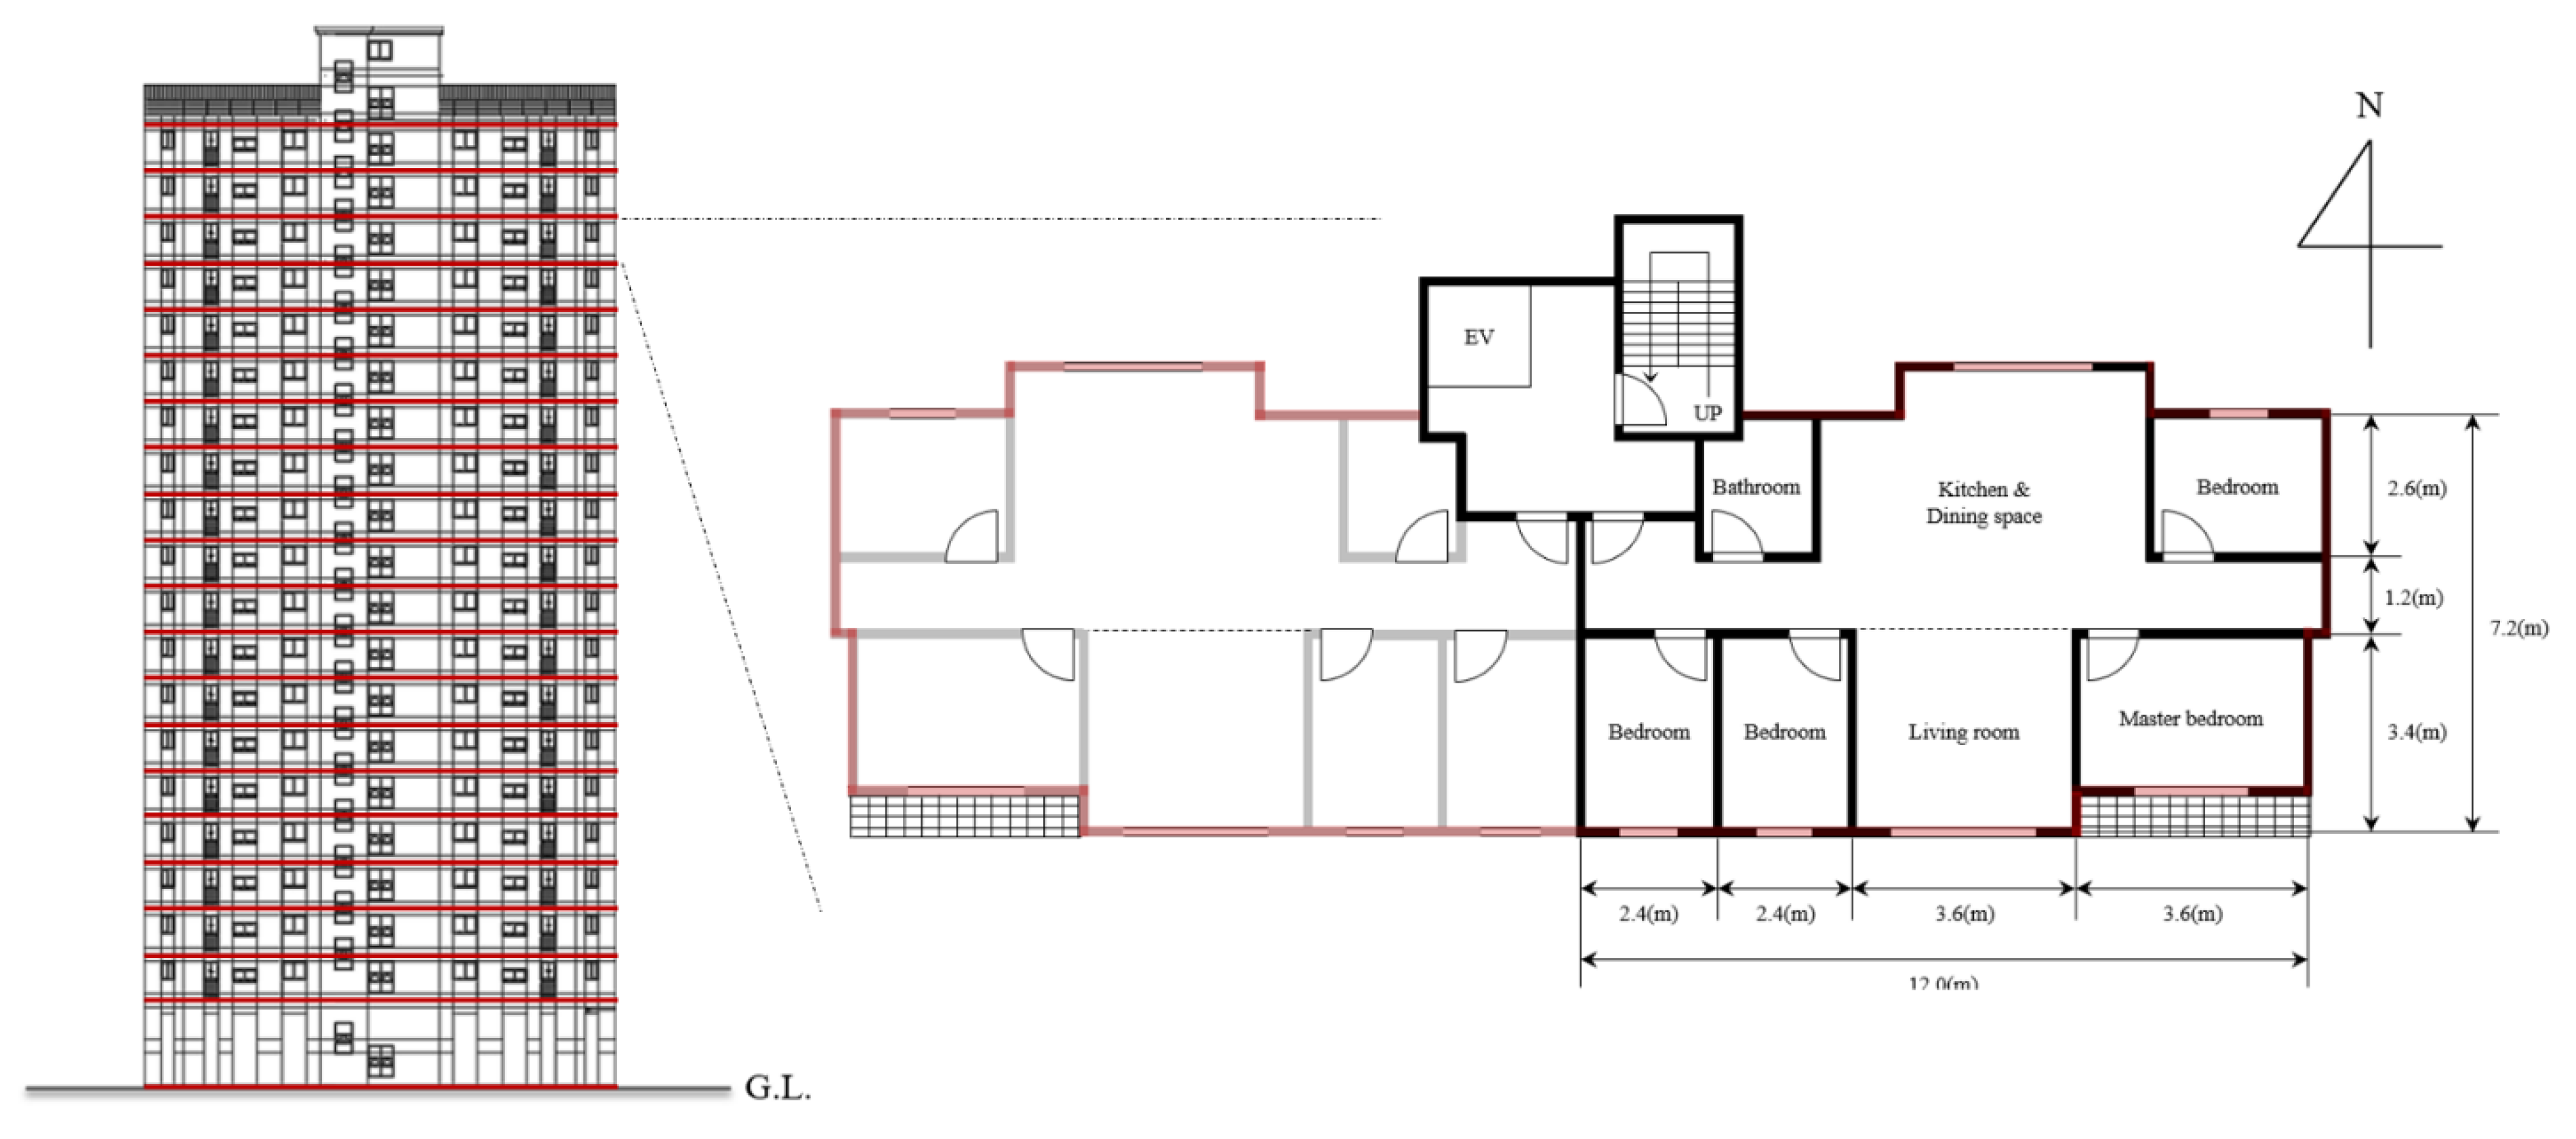
Figure 8.
Process flow diagram of TRNSYS dynamic simulation. This simulation is designed to produce three outputs as follows: 1) ambient temperature of the study area (i.e., Seoul, South Korea), 2) COP-value of air-source heat pump (ASHP) and 3) electricity loads for heating and cooling in hourly interval.
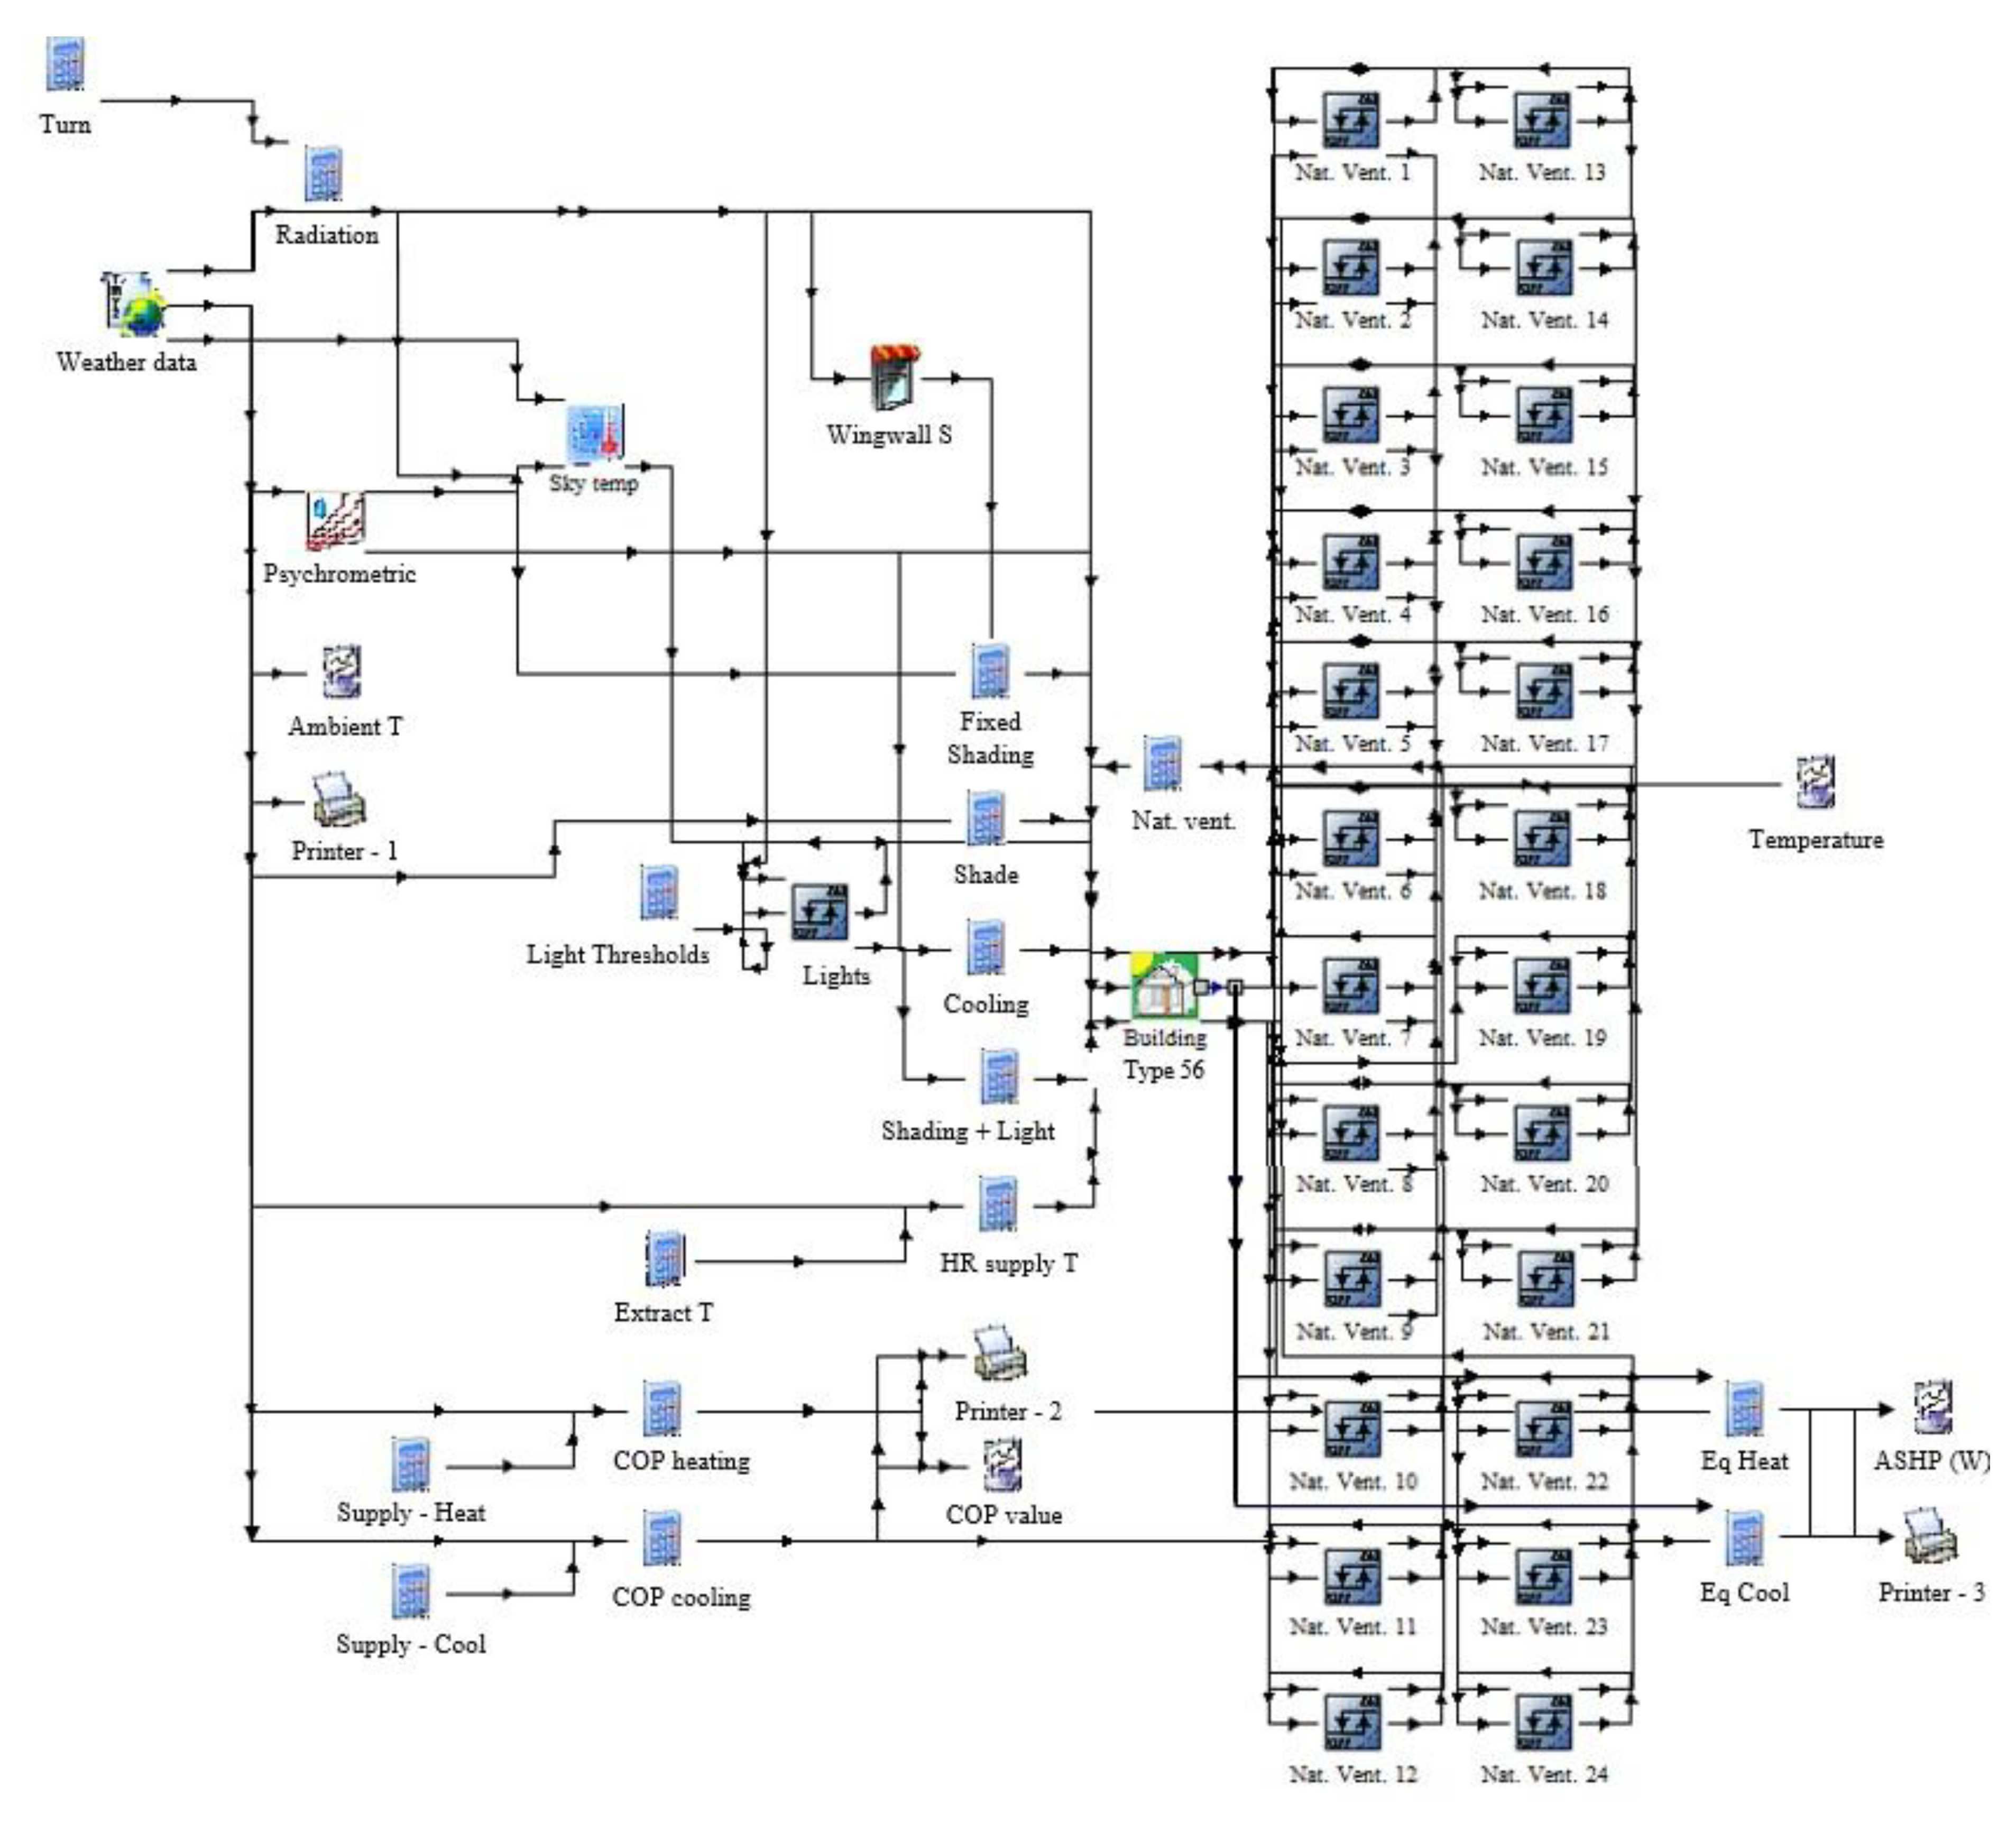
Figure 9.
Occupancy schedule of a typical multi-residential apartment building in South Korea (hourly interval).
Figure 9.
Occupancy schedule of a typical multi-residential apartment building in South Korea (hourly interval).
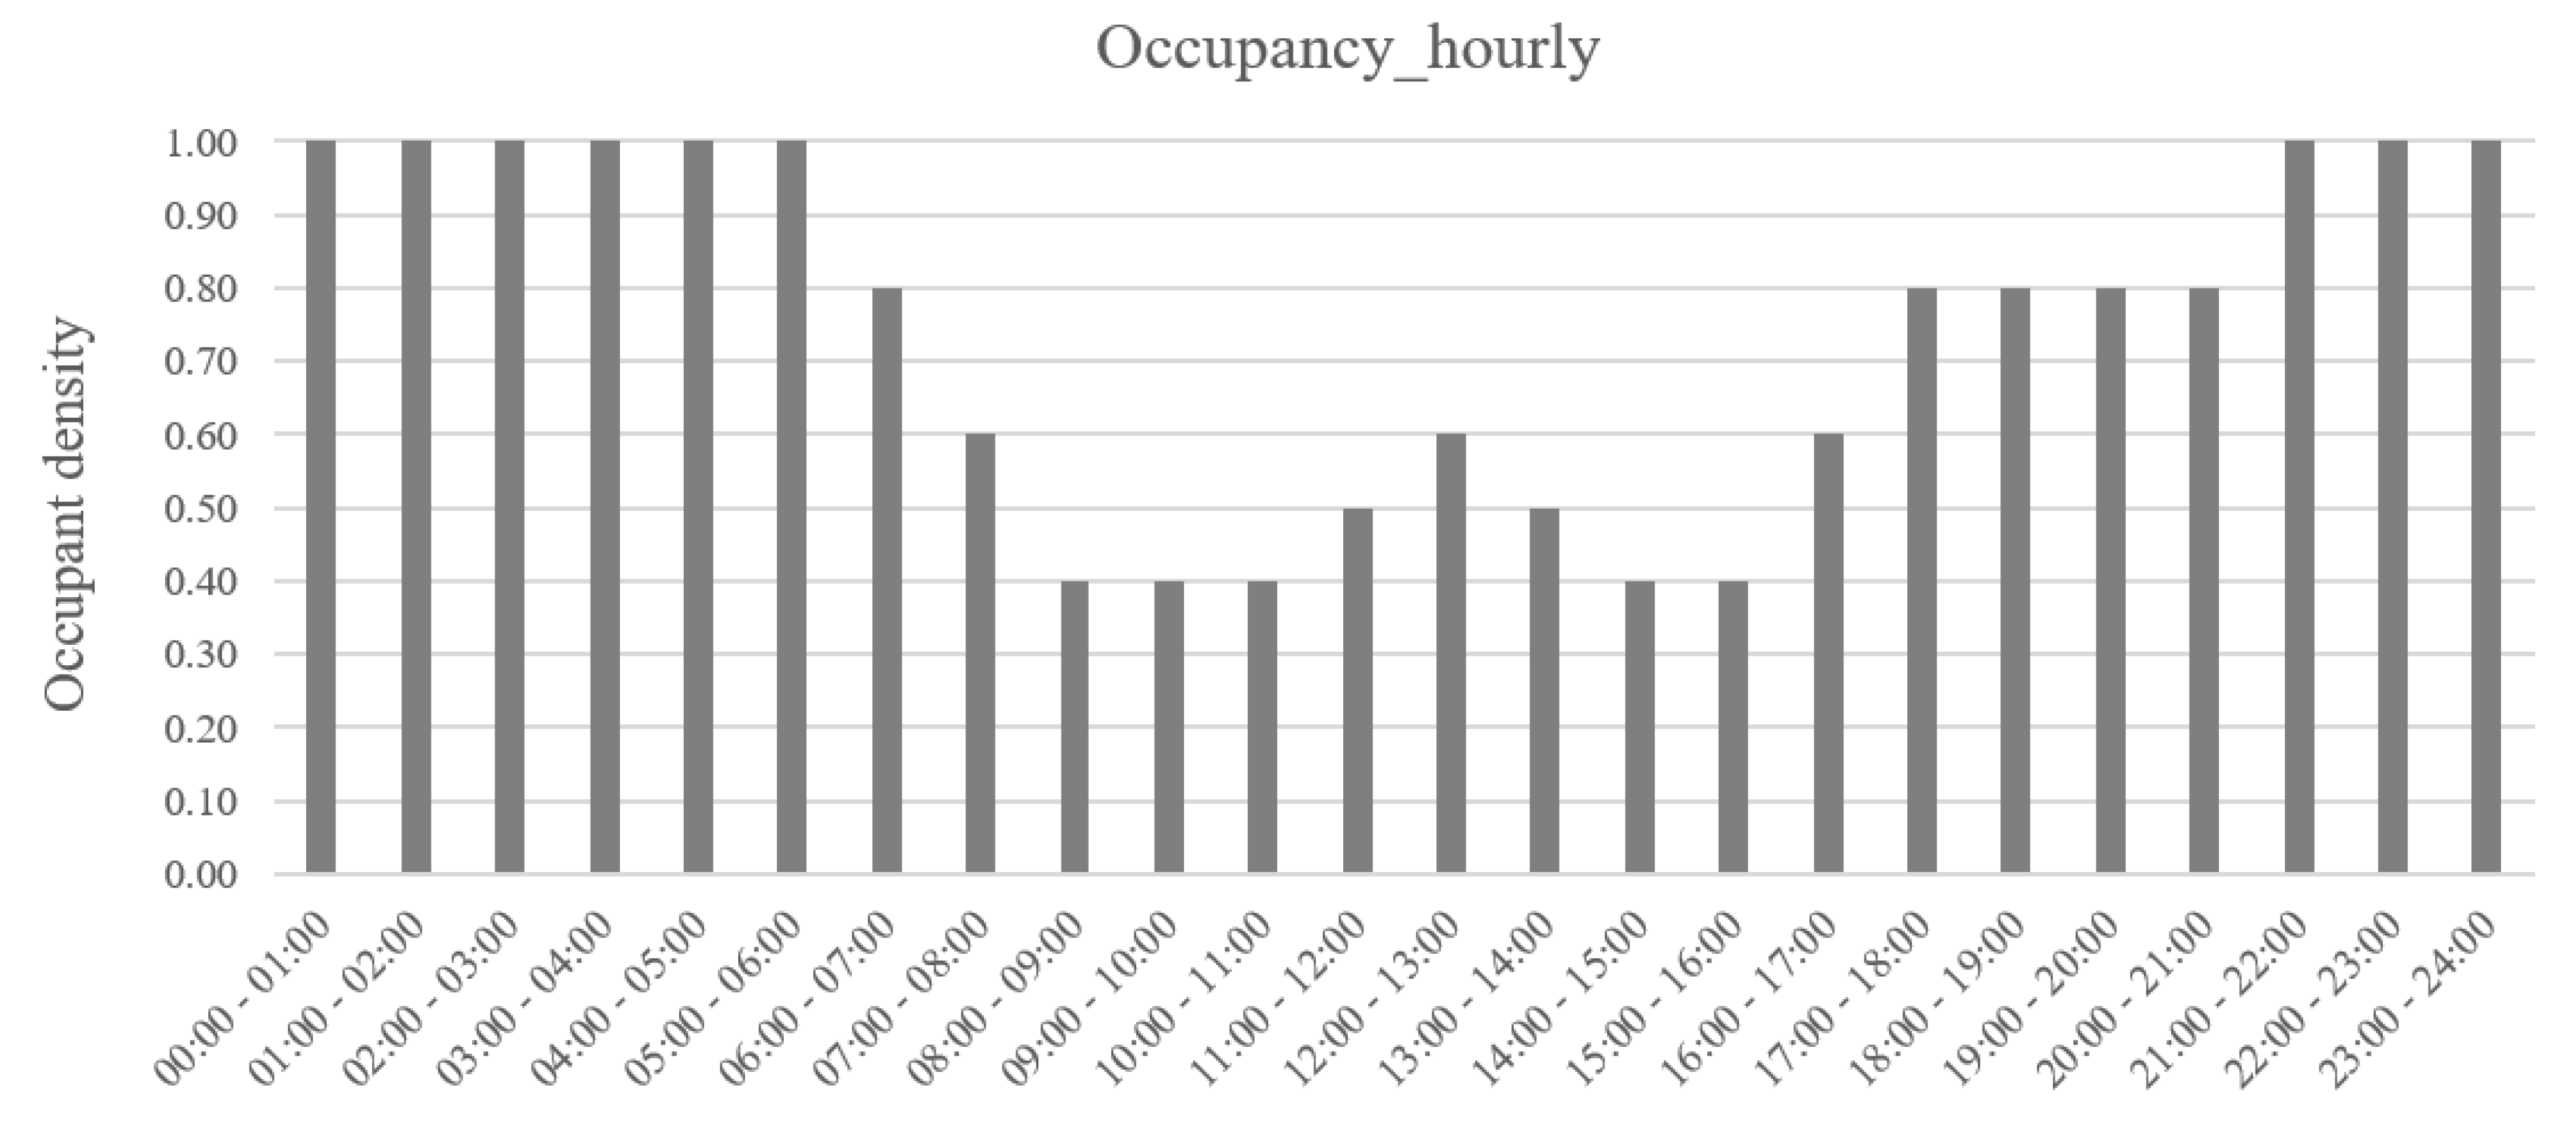
Figure 10.
Electricity generation by fuel source in South Korea (KEPCO, 2023). This diagram represents the monthly average demand of each fuel source required to produce electricity.
Figure 10.
Electricity generation by fuel source in South Korea (KEPCO, 2023). This diagram represents the monthly average demand of each fuel source required to produce electricity.
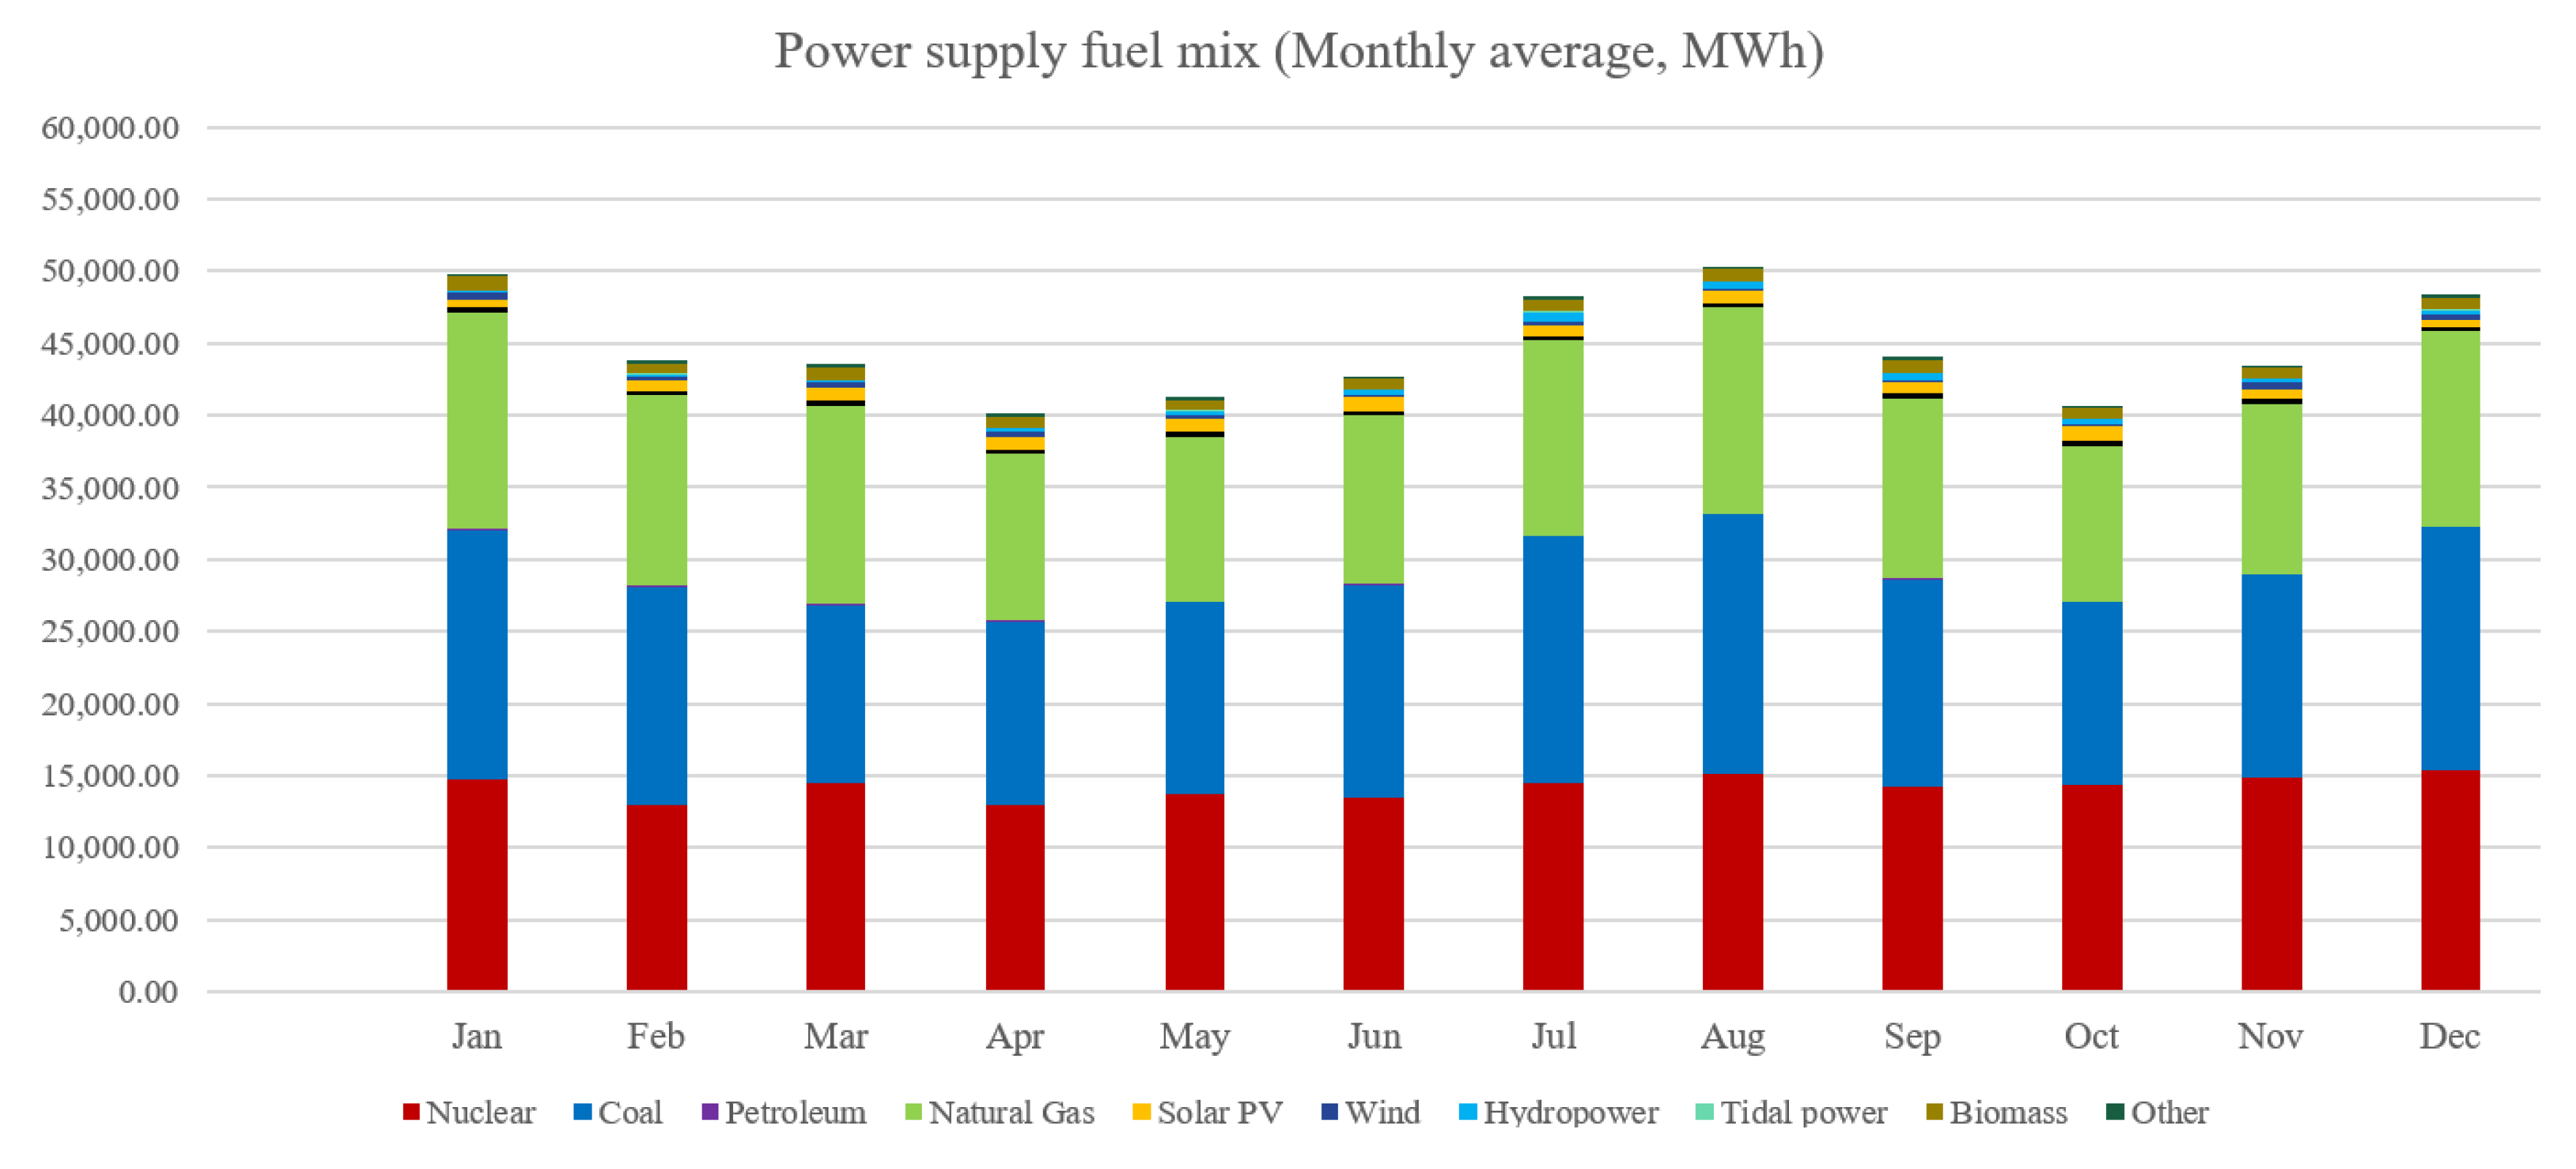
Figure 11.
Comparison of annual grid energy demand (kWh/m2·year) with and without the application of structural thermal breaks.
Figure 11.
Comparison of annual grid energy demand (kWh/m2·year) with and without the application of structural thermal breaks.
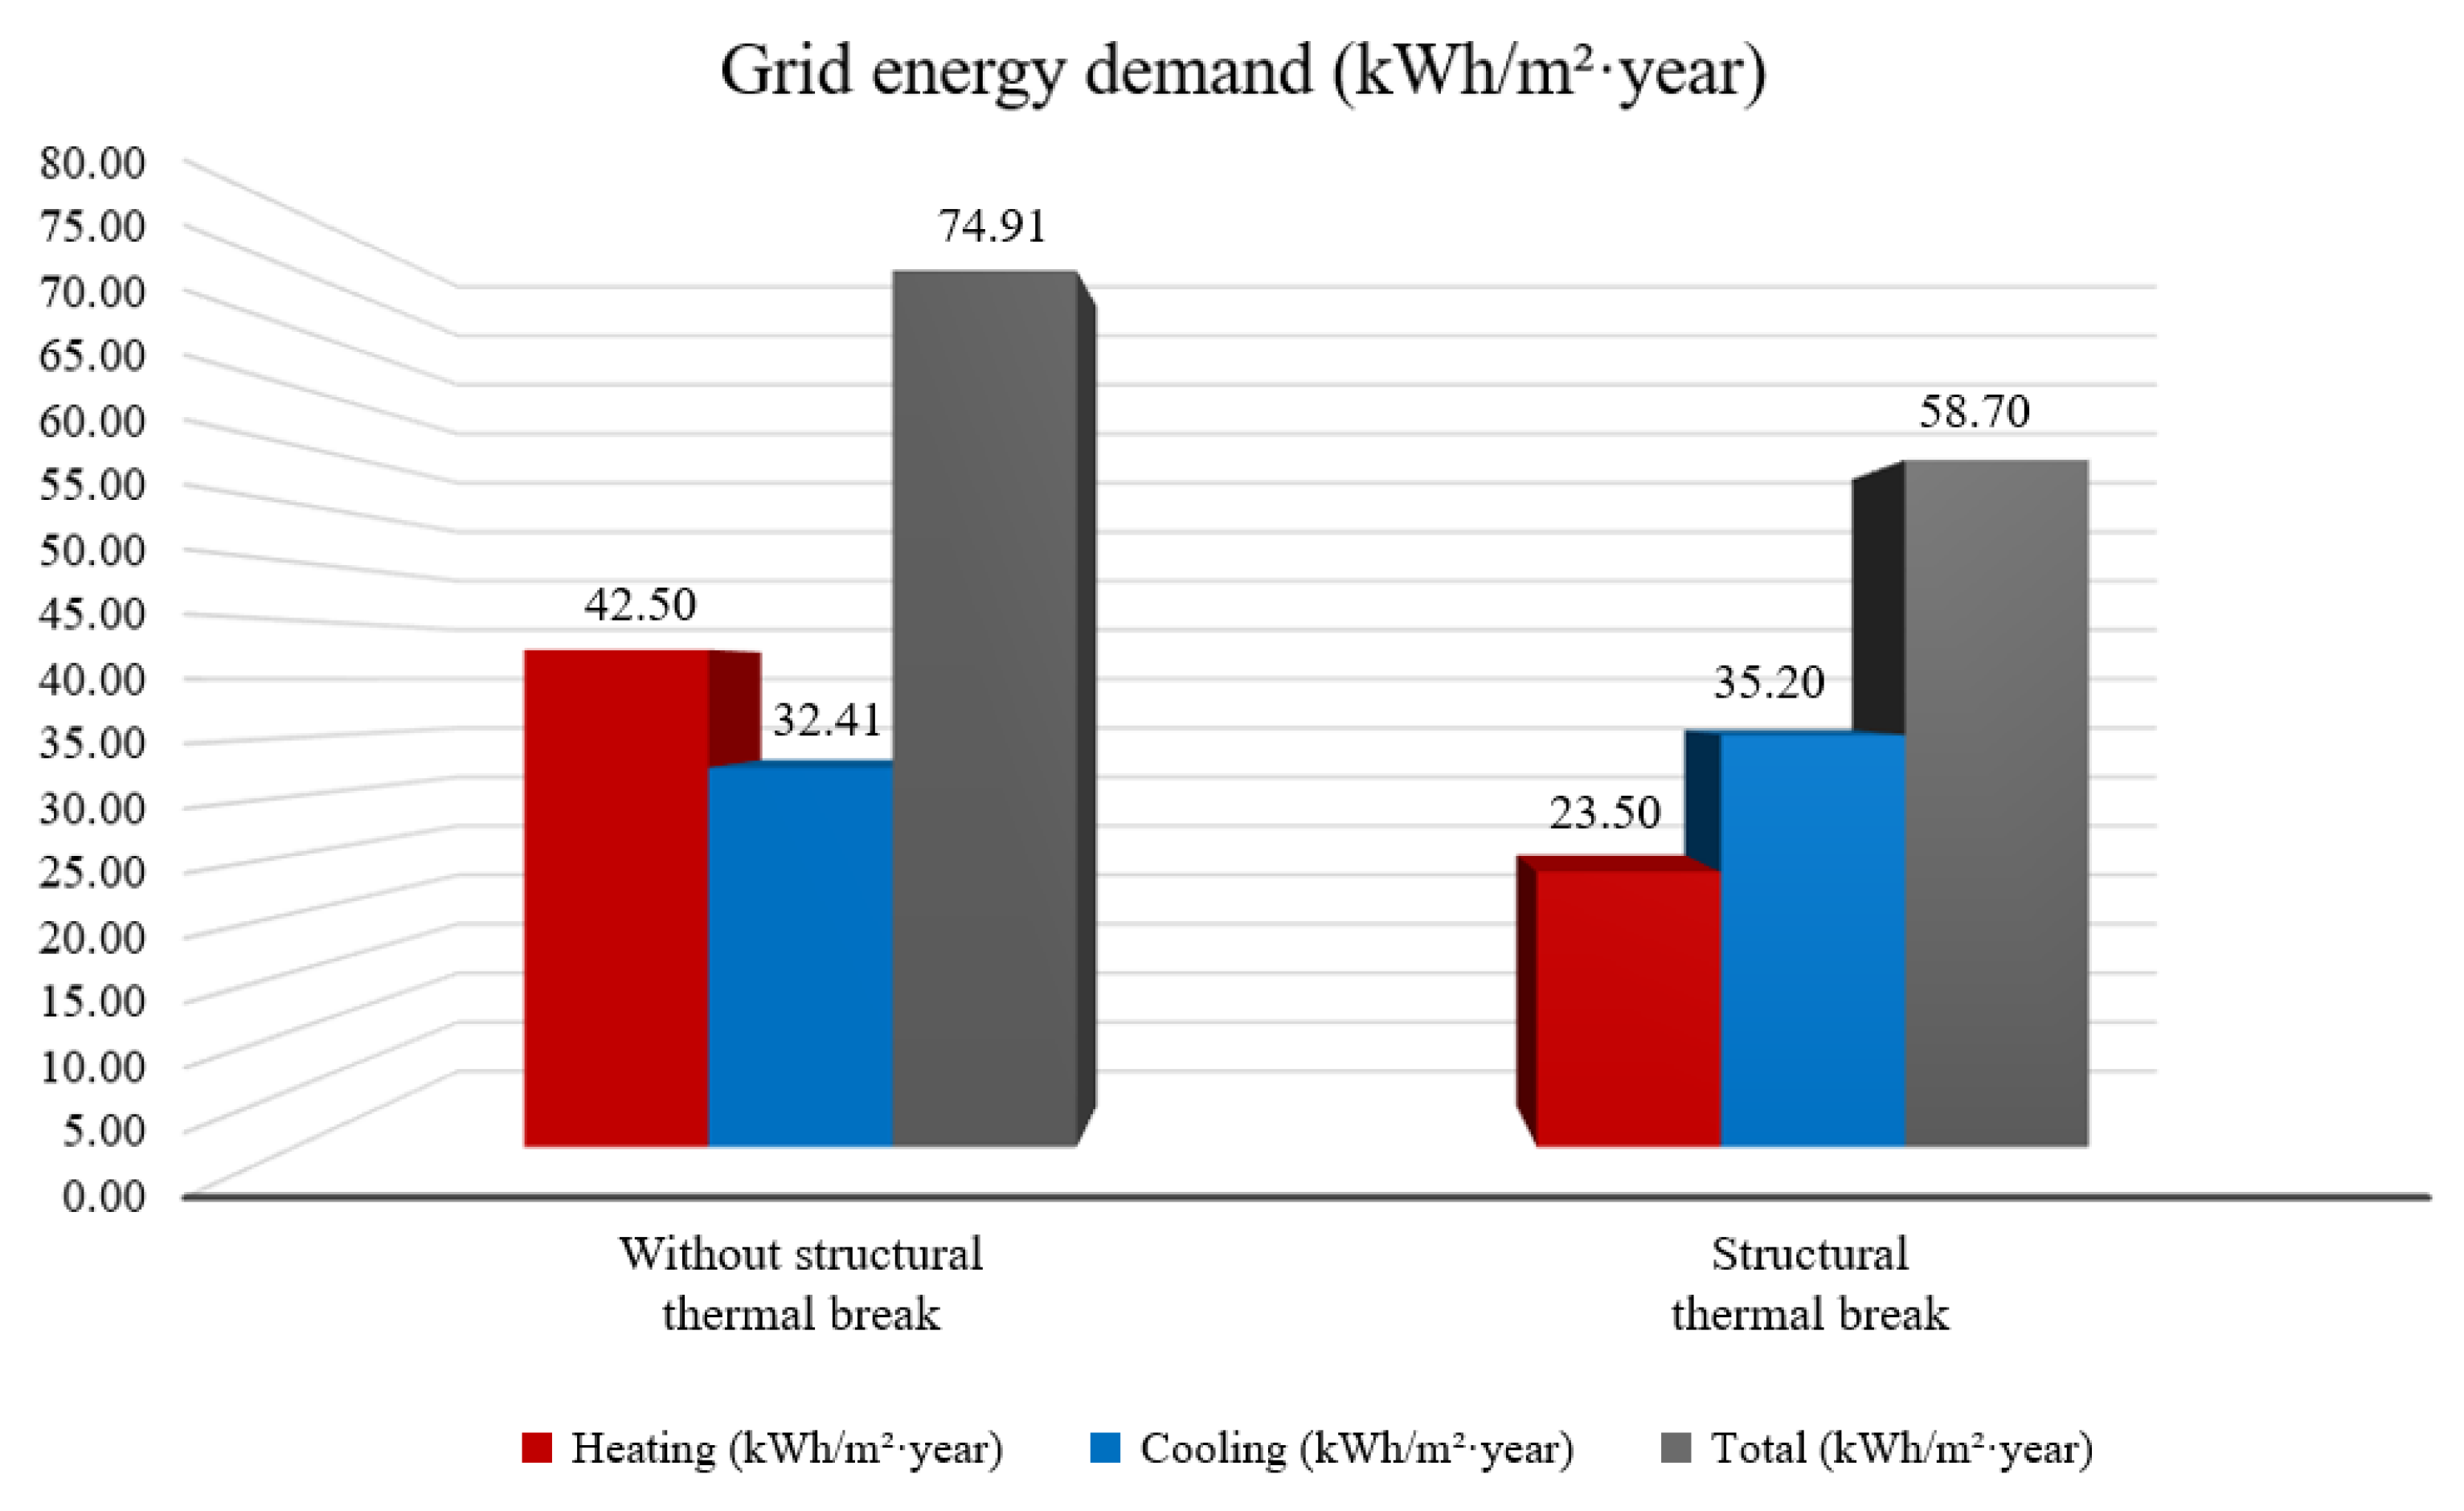
Figure 12.
Comparison of annual building operation costs ($USD/m2·year) with and without the application of structural thermal breaks.
Figure 12.
Comparison of annual building operation costs ($USD/m2·year) with and without the application of structural thermal breaks.
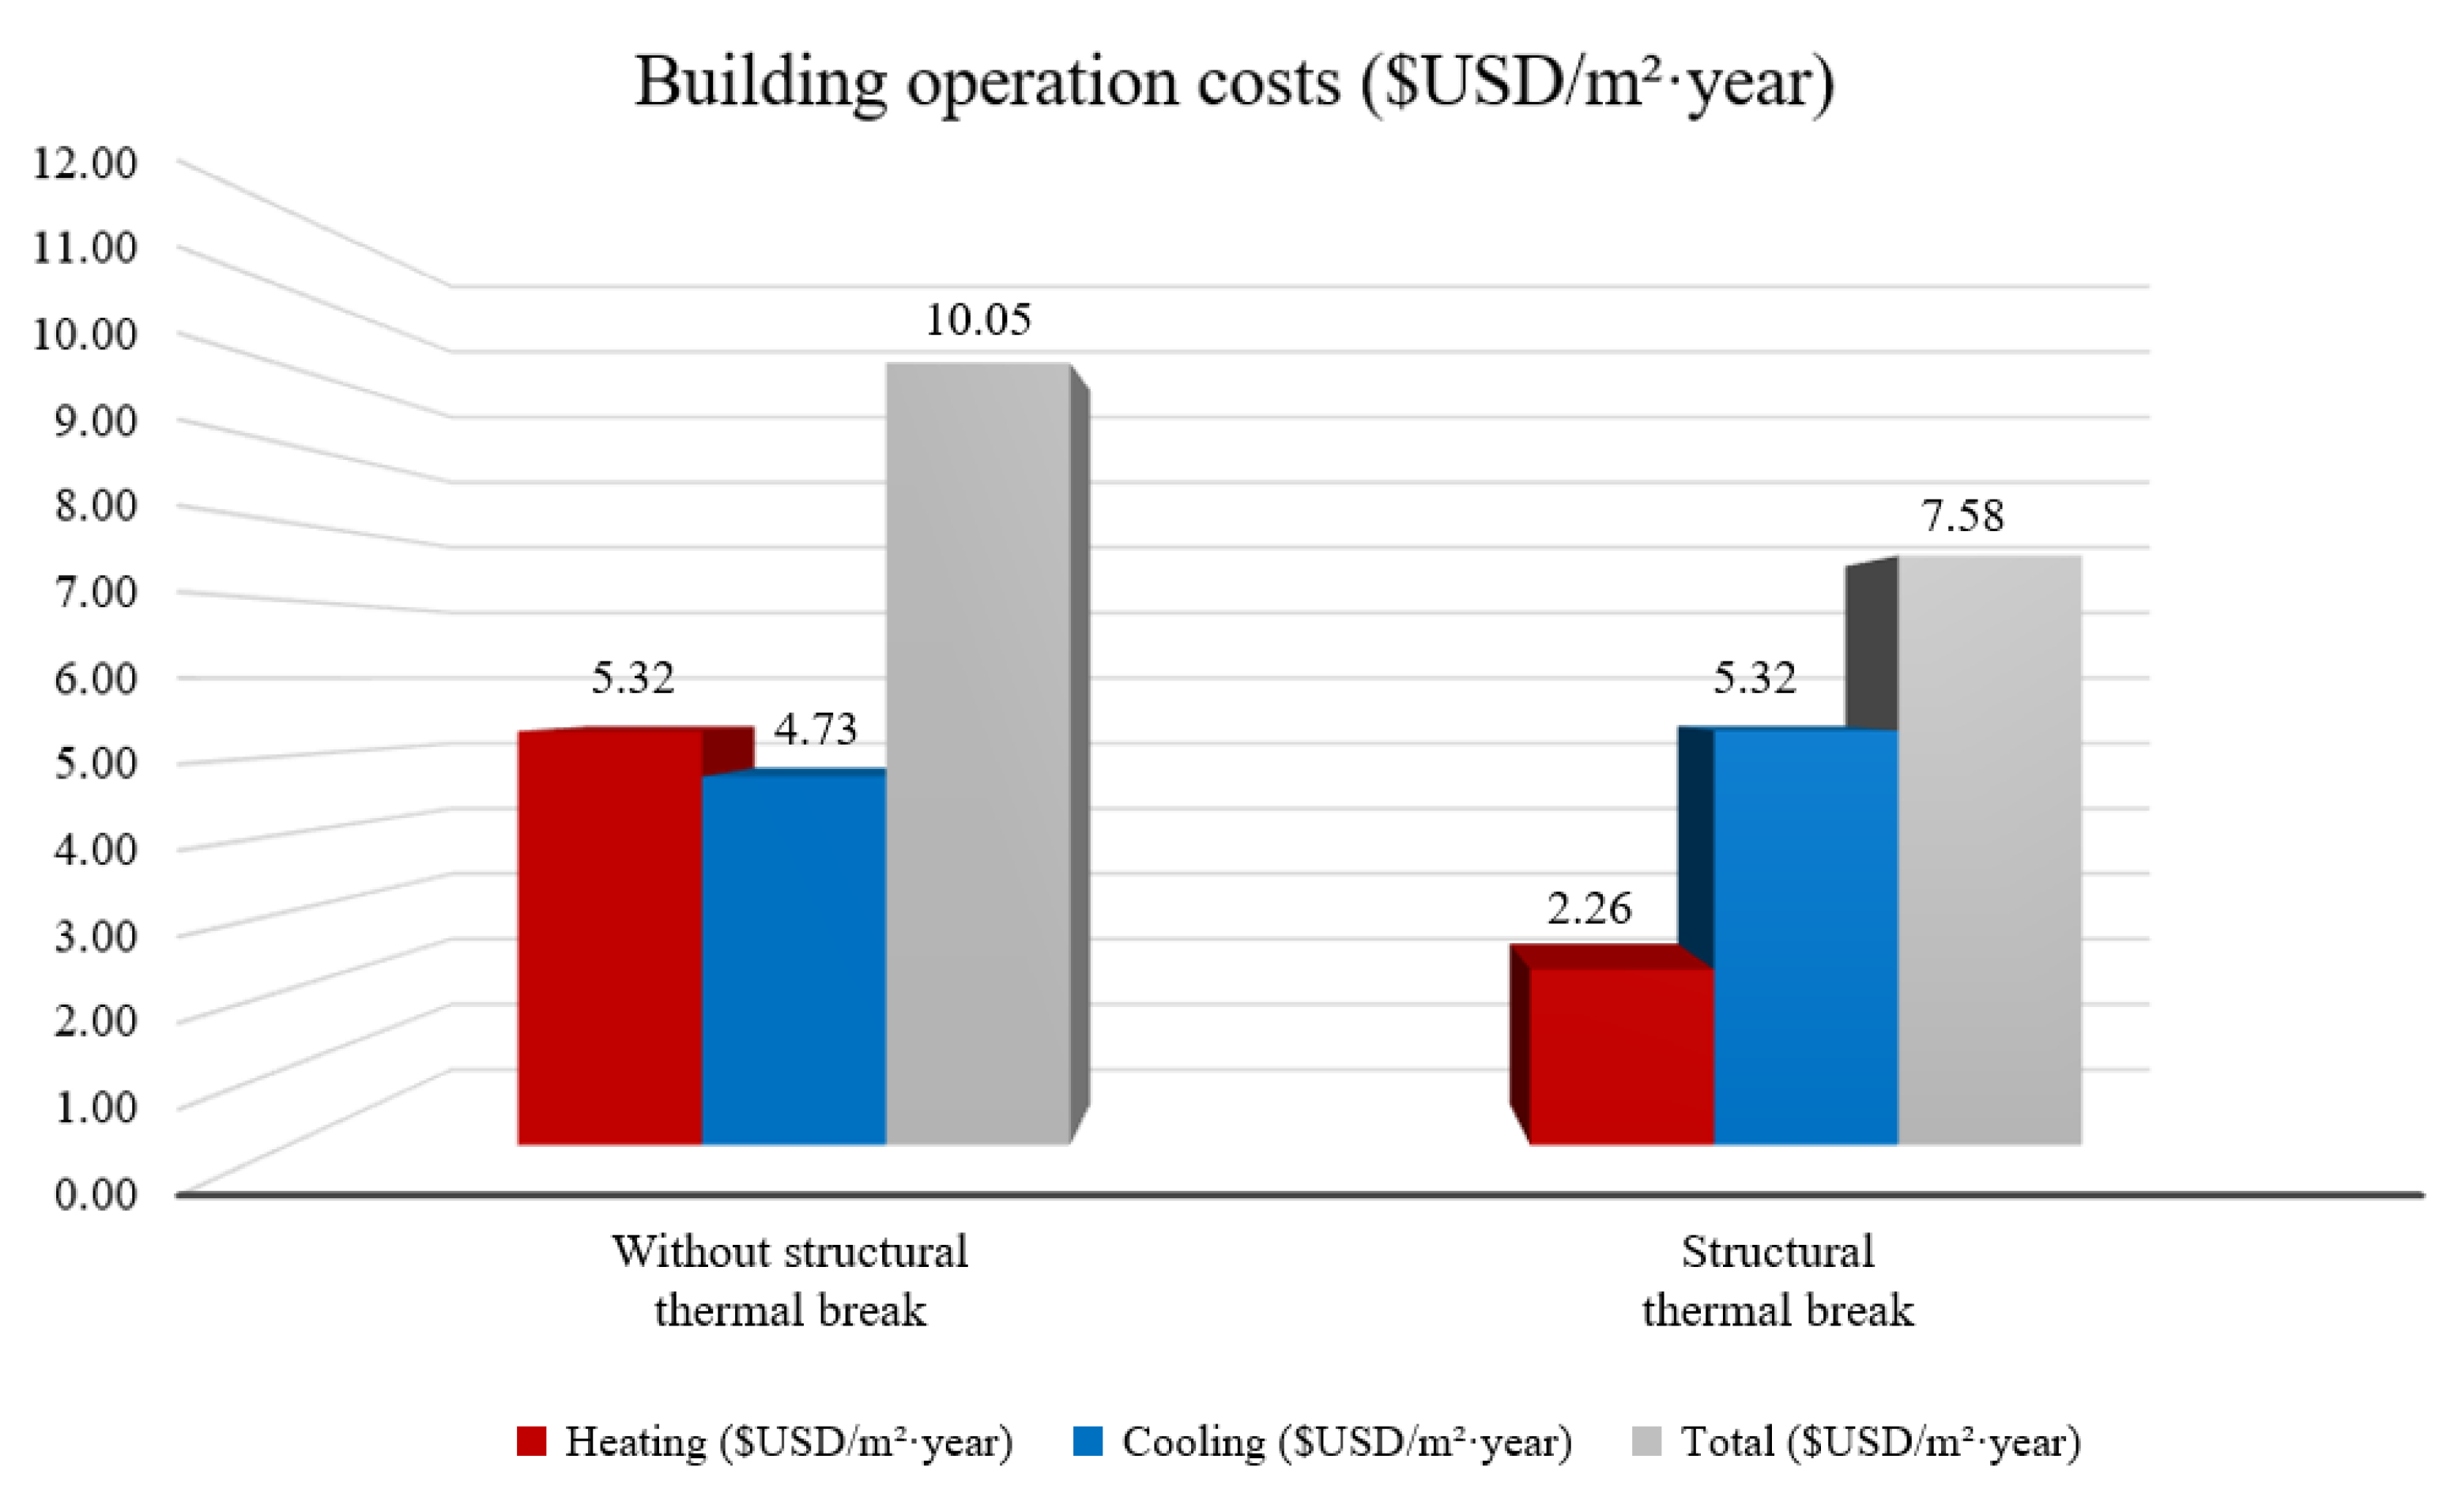
Figure 13.
Recommended investment cost of structural thermal breaks to satisfy each simple payback period (SPP). The calculation of SPP does not consider the annual inflation rate of 3.15%.
Figure 13.
Recommended investment cost of structural thermal breaks to satisfy each simple payback period (SPP). The calculation of SPP does not consider the annual inflation rate of 3.15%.
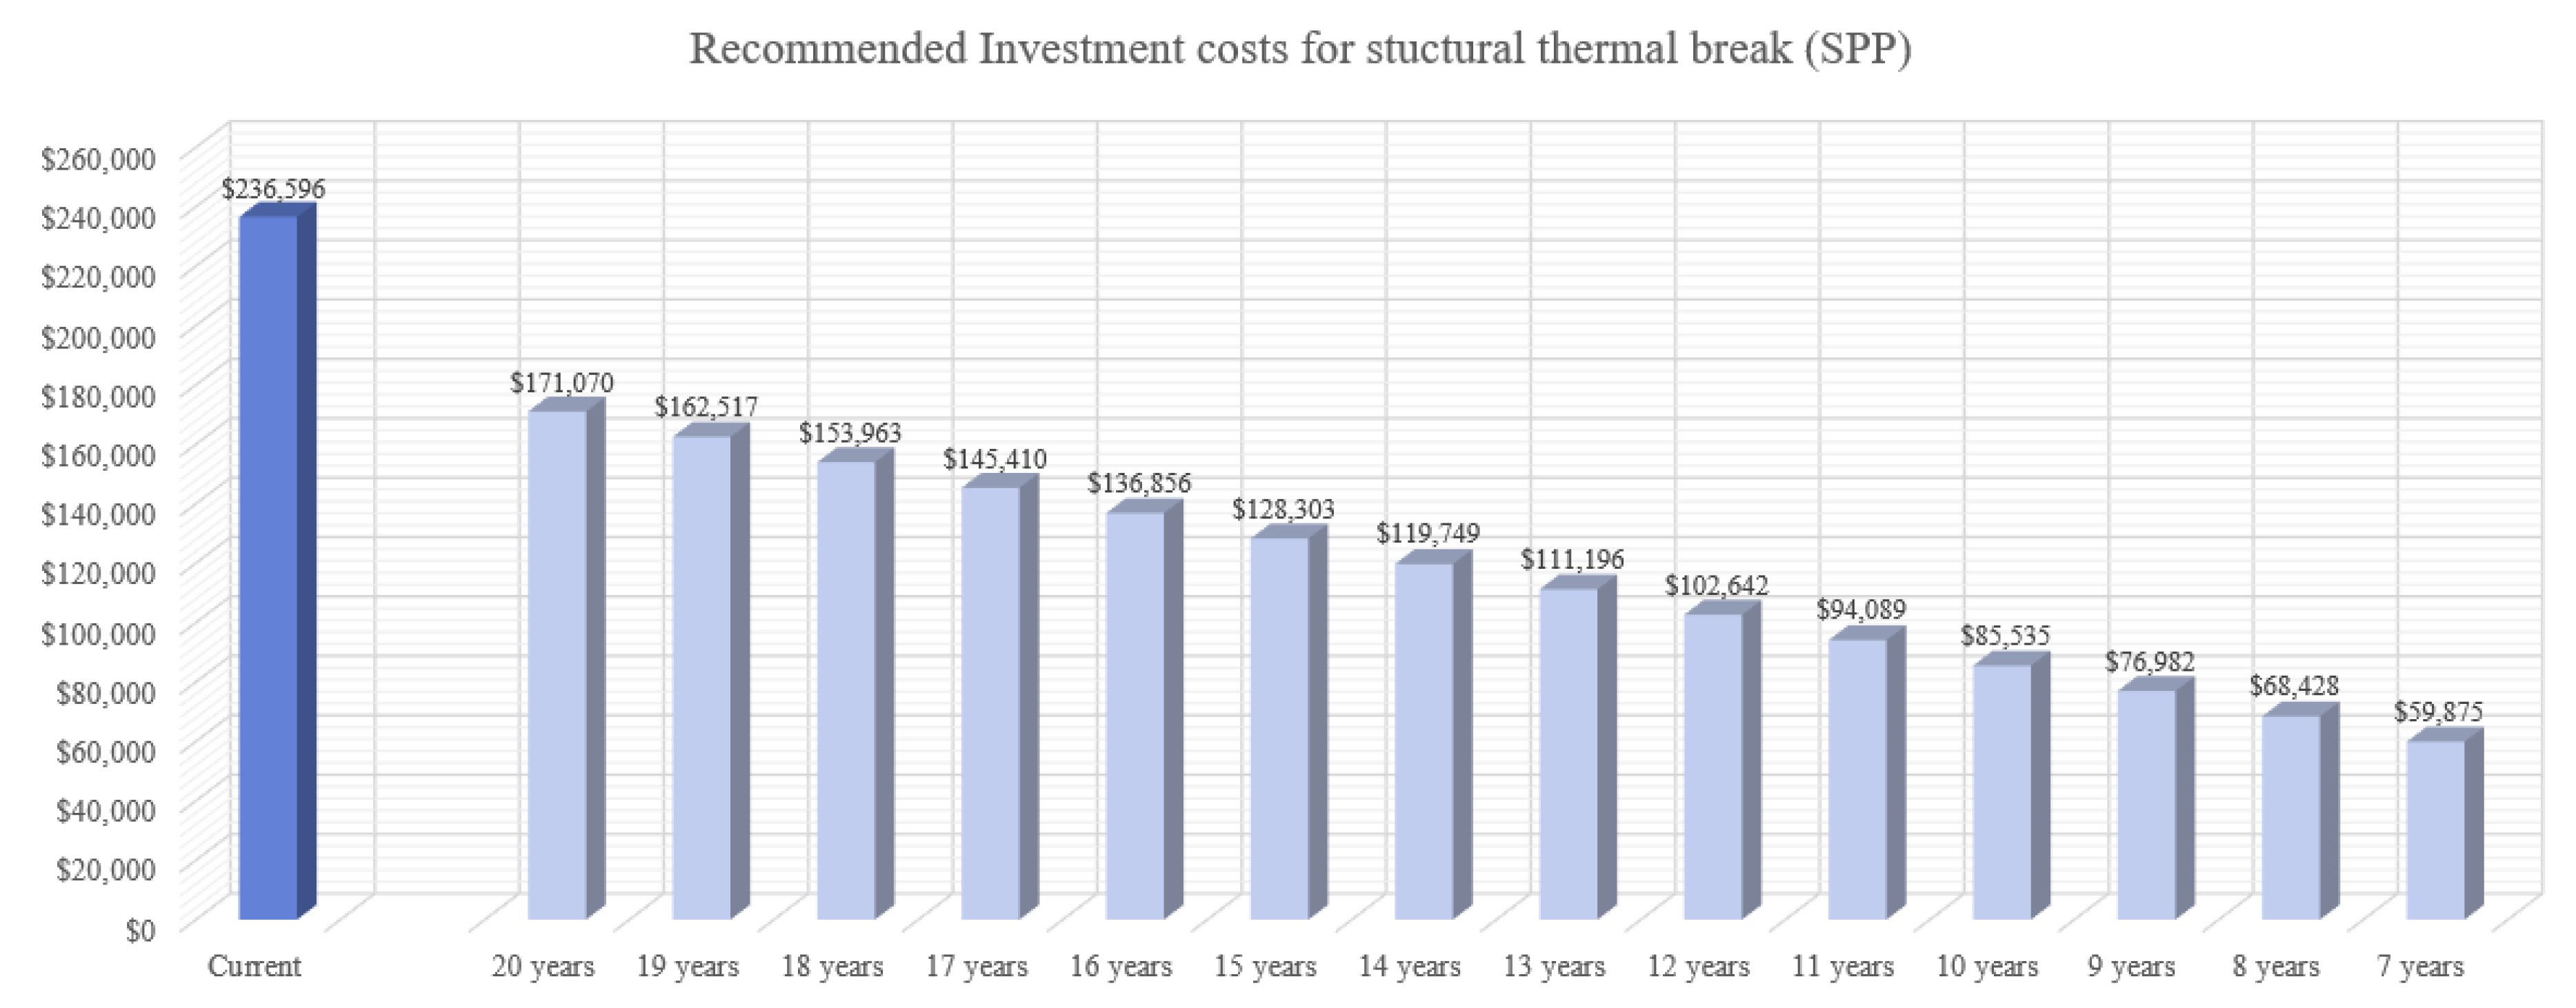
Figure 14.
Recommended investment cost of structural thermal breaks to satisfy each discounted payback period (DPP). Compared to SPP, DPP is considered a more realistic economic indicator.
Figure 14.
Recommended investment cost of structural thermal breaks to satisfy each discounted payback period (DPP). Compared to SPP, DPP is considered a more realistic economic indicator.
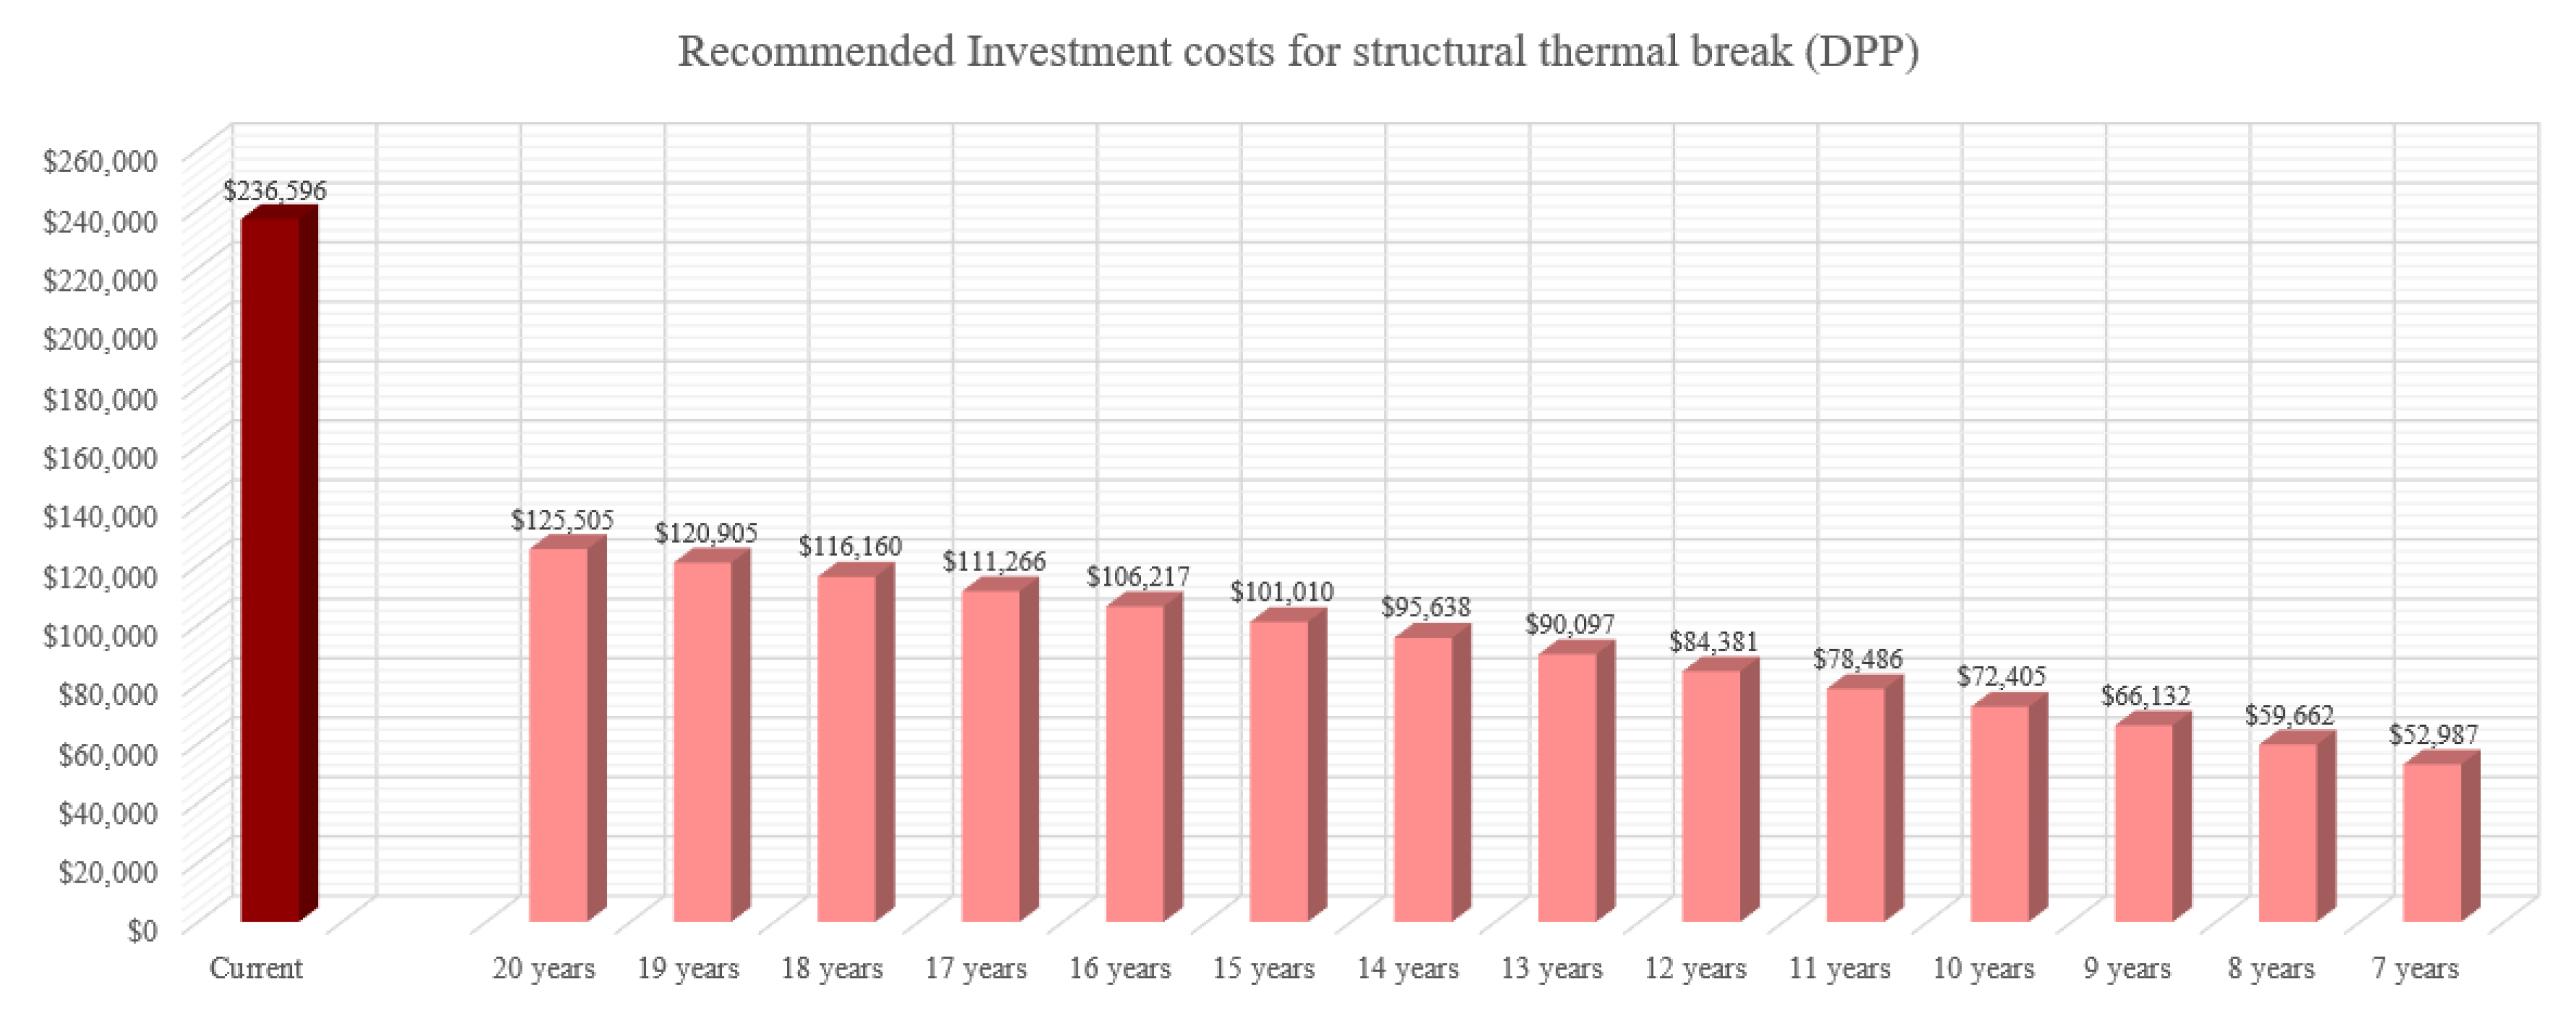
Figure 15.
Comparison of annual GHG emissions (kgCO2/m2·year) resulting from building operation, with and without the application of structural thermal breaks.
Figure 15.
Comparison of annual GHG emissions (kgCO2/m2·year) resulting from building operation, with and without the application of structural thermal breaks.
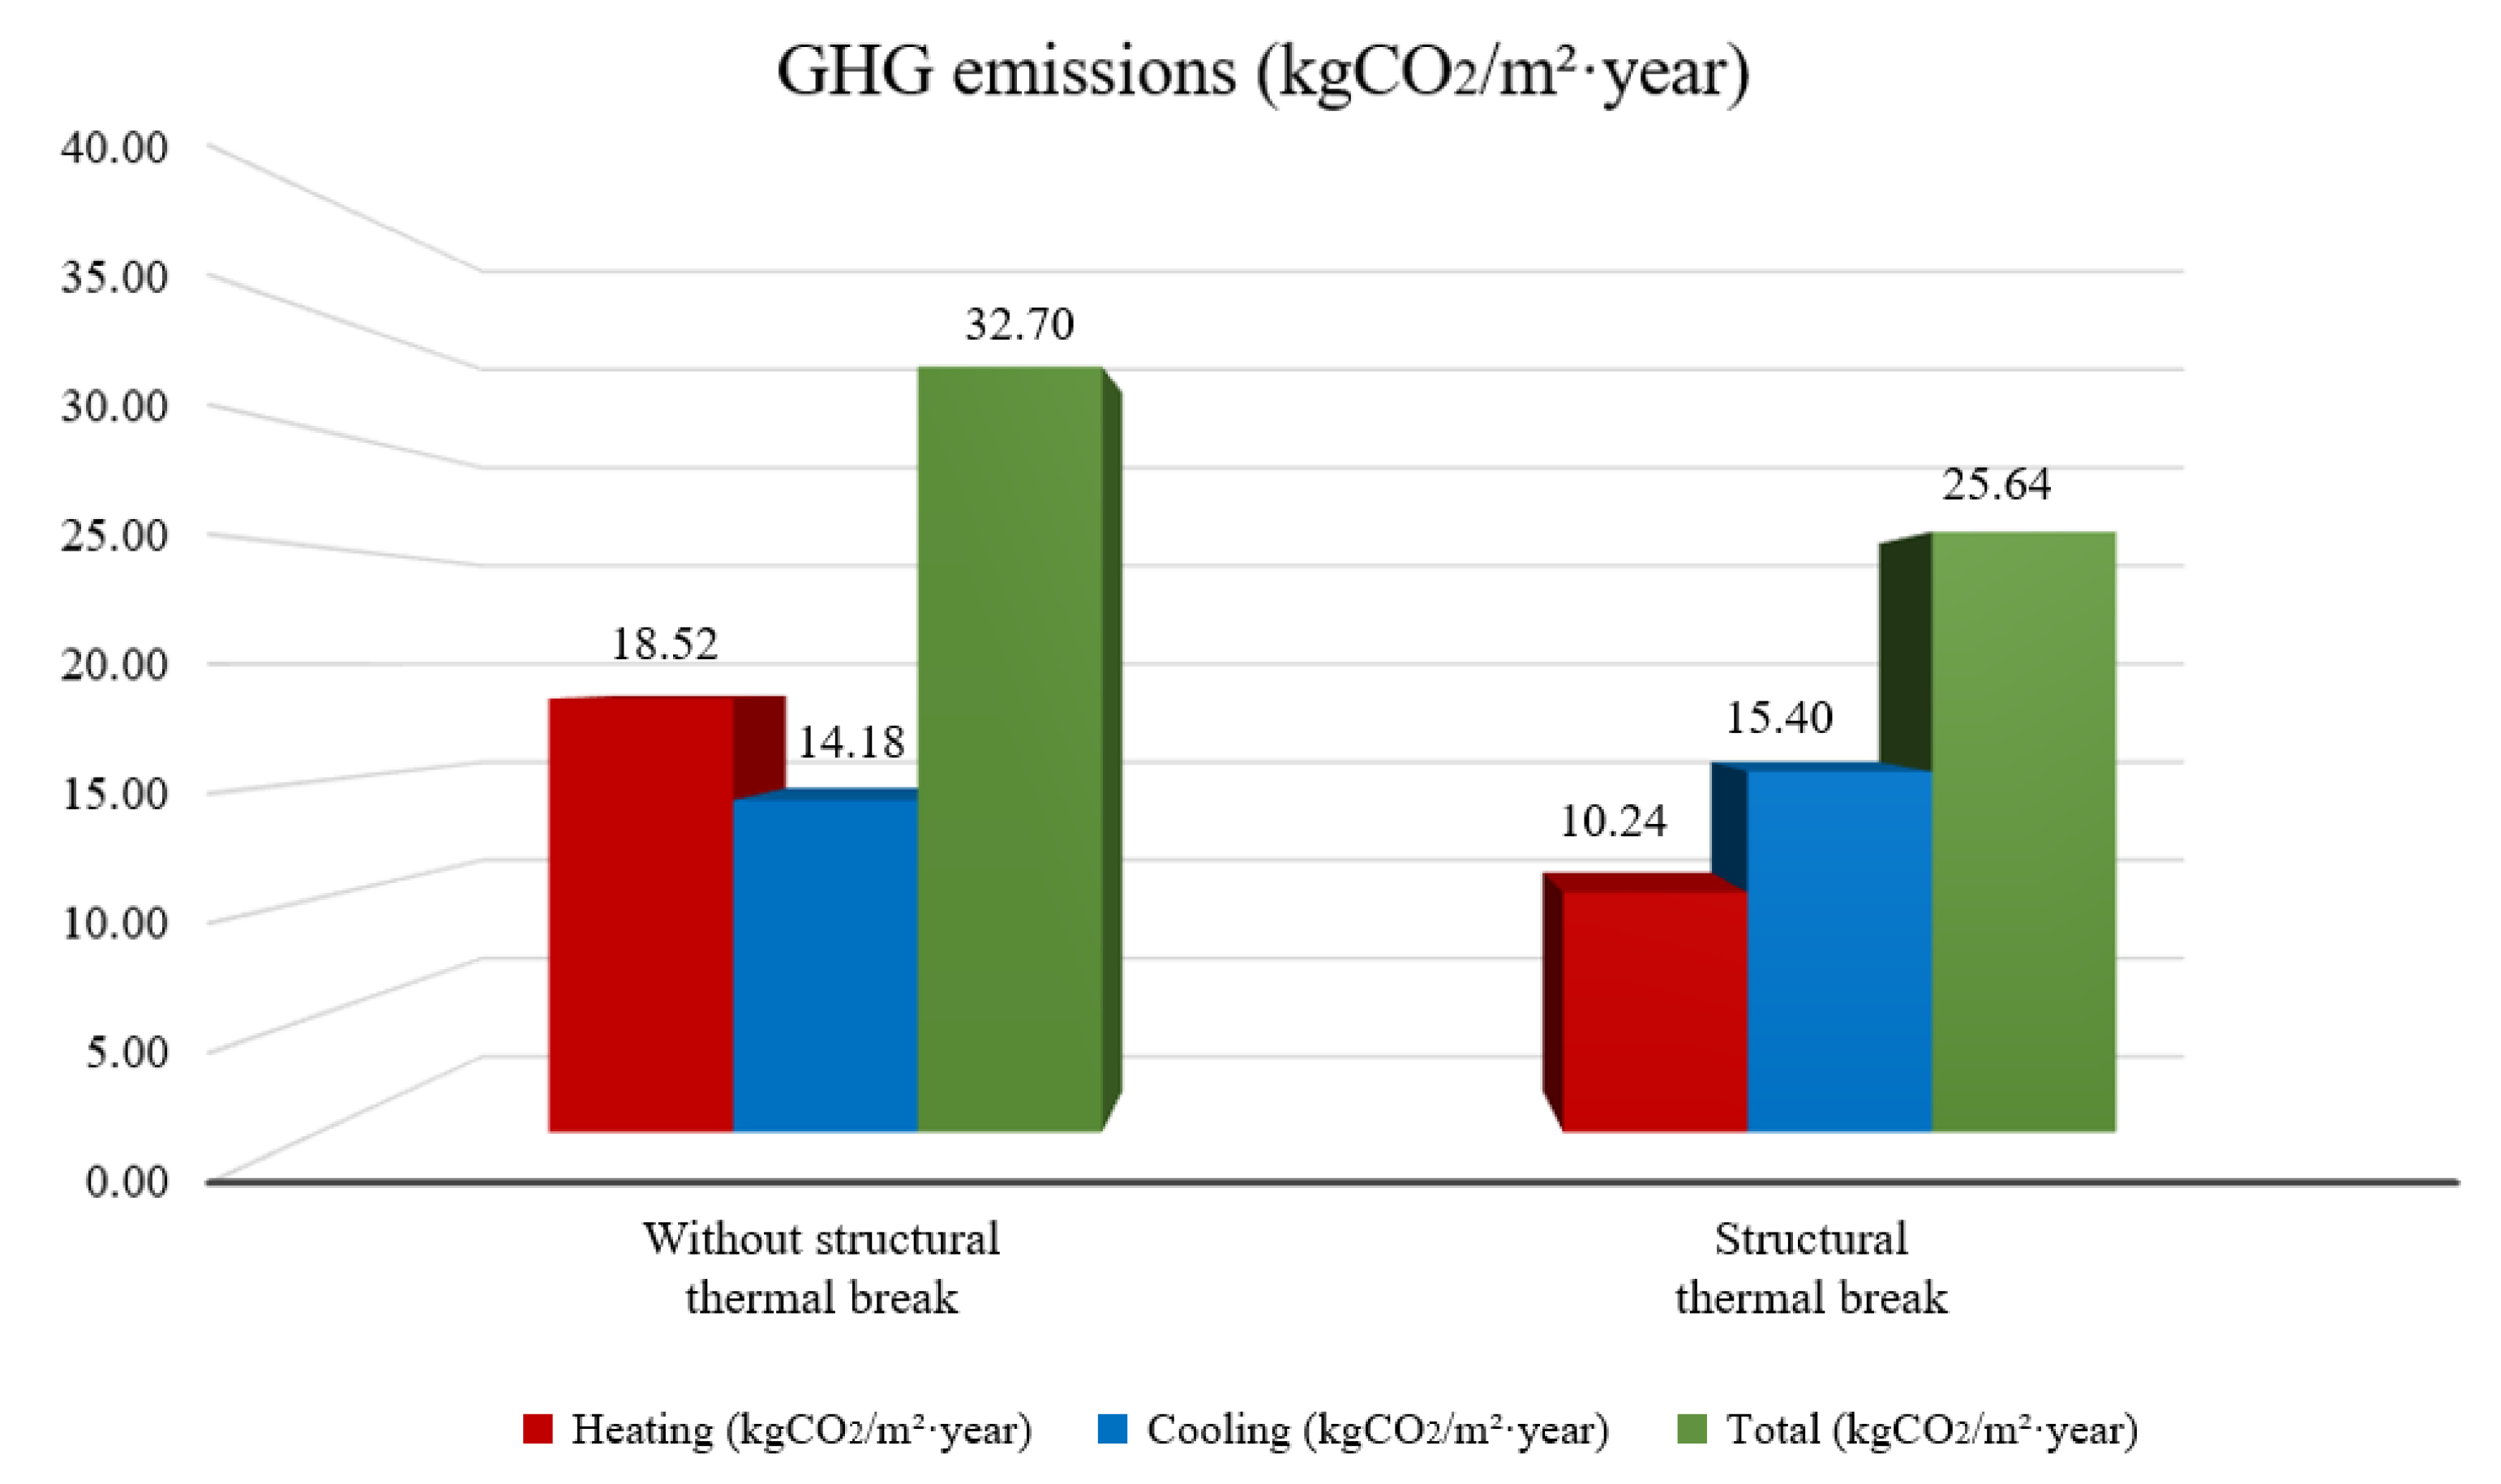
Figure 16.
Total embedded CO2 emissions during the manufacturing process of structural thermal breaks (left). Annual reduction in operational CO2 emissions by applying structural thermal breaks (right). The building operation period to achieve carbon neutrality is approximately 8.58 years.
Figure 16.
Total embedded CO2 emissions during the manufacturing process of structural thermal breaks (left). Annual reduction in operational CO2 emissions by applying structural thermal breaks (right). The building operation period to achieve carbon neutrality is approximately 8.58 years.
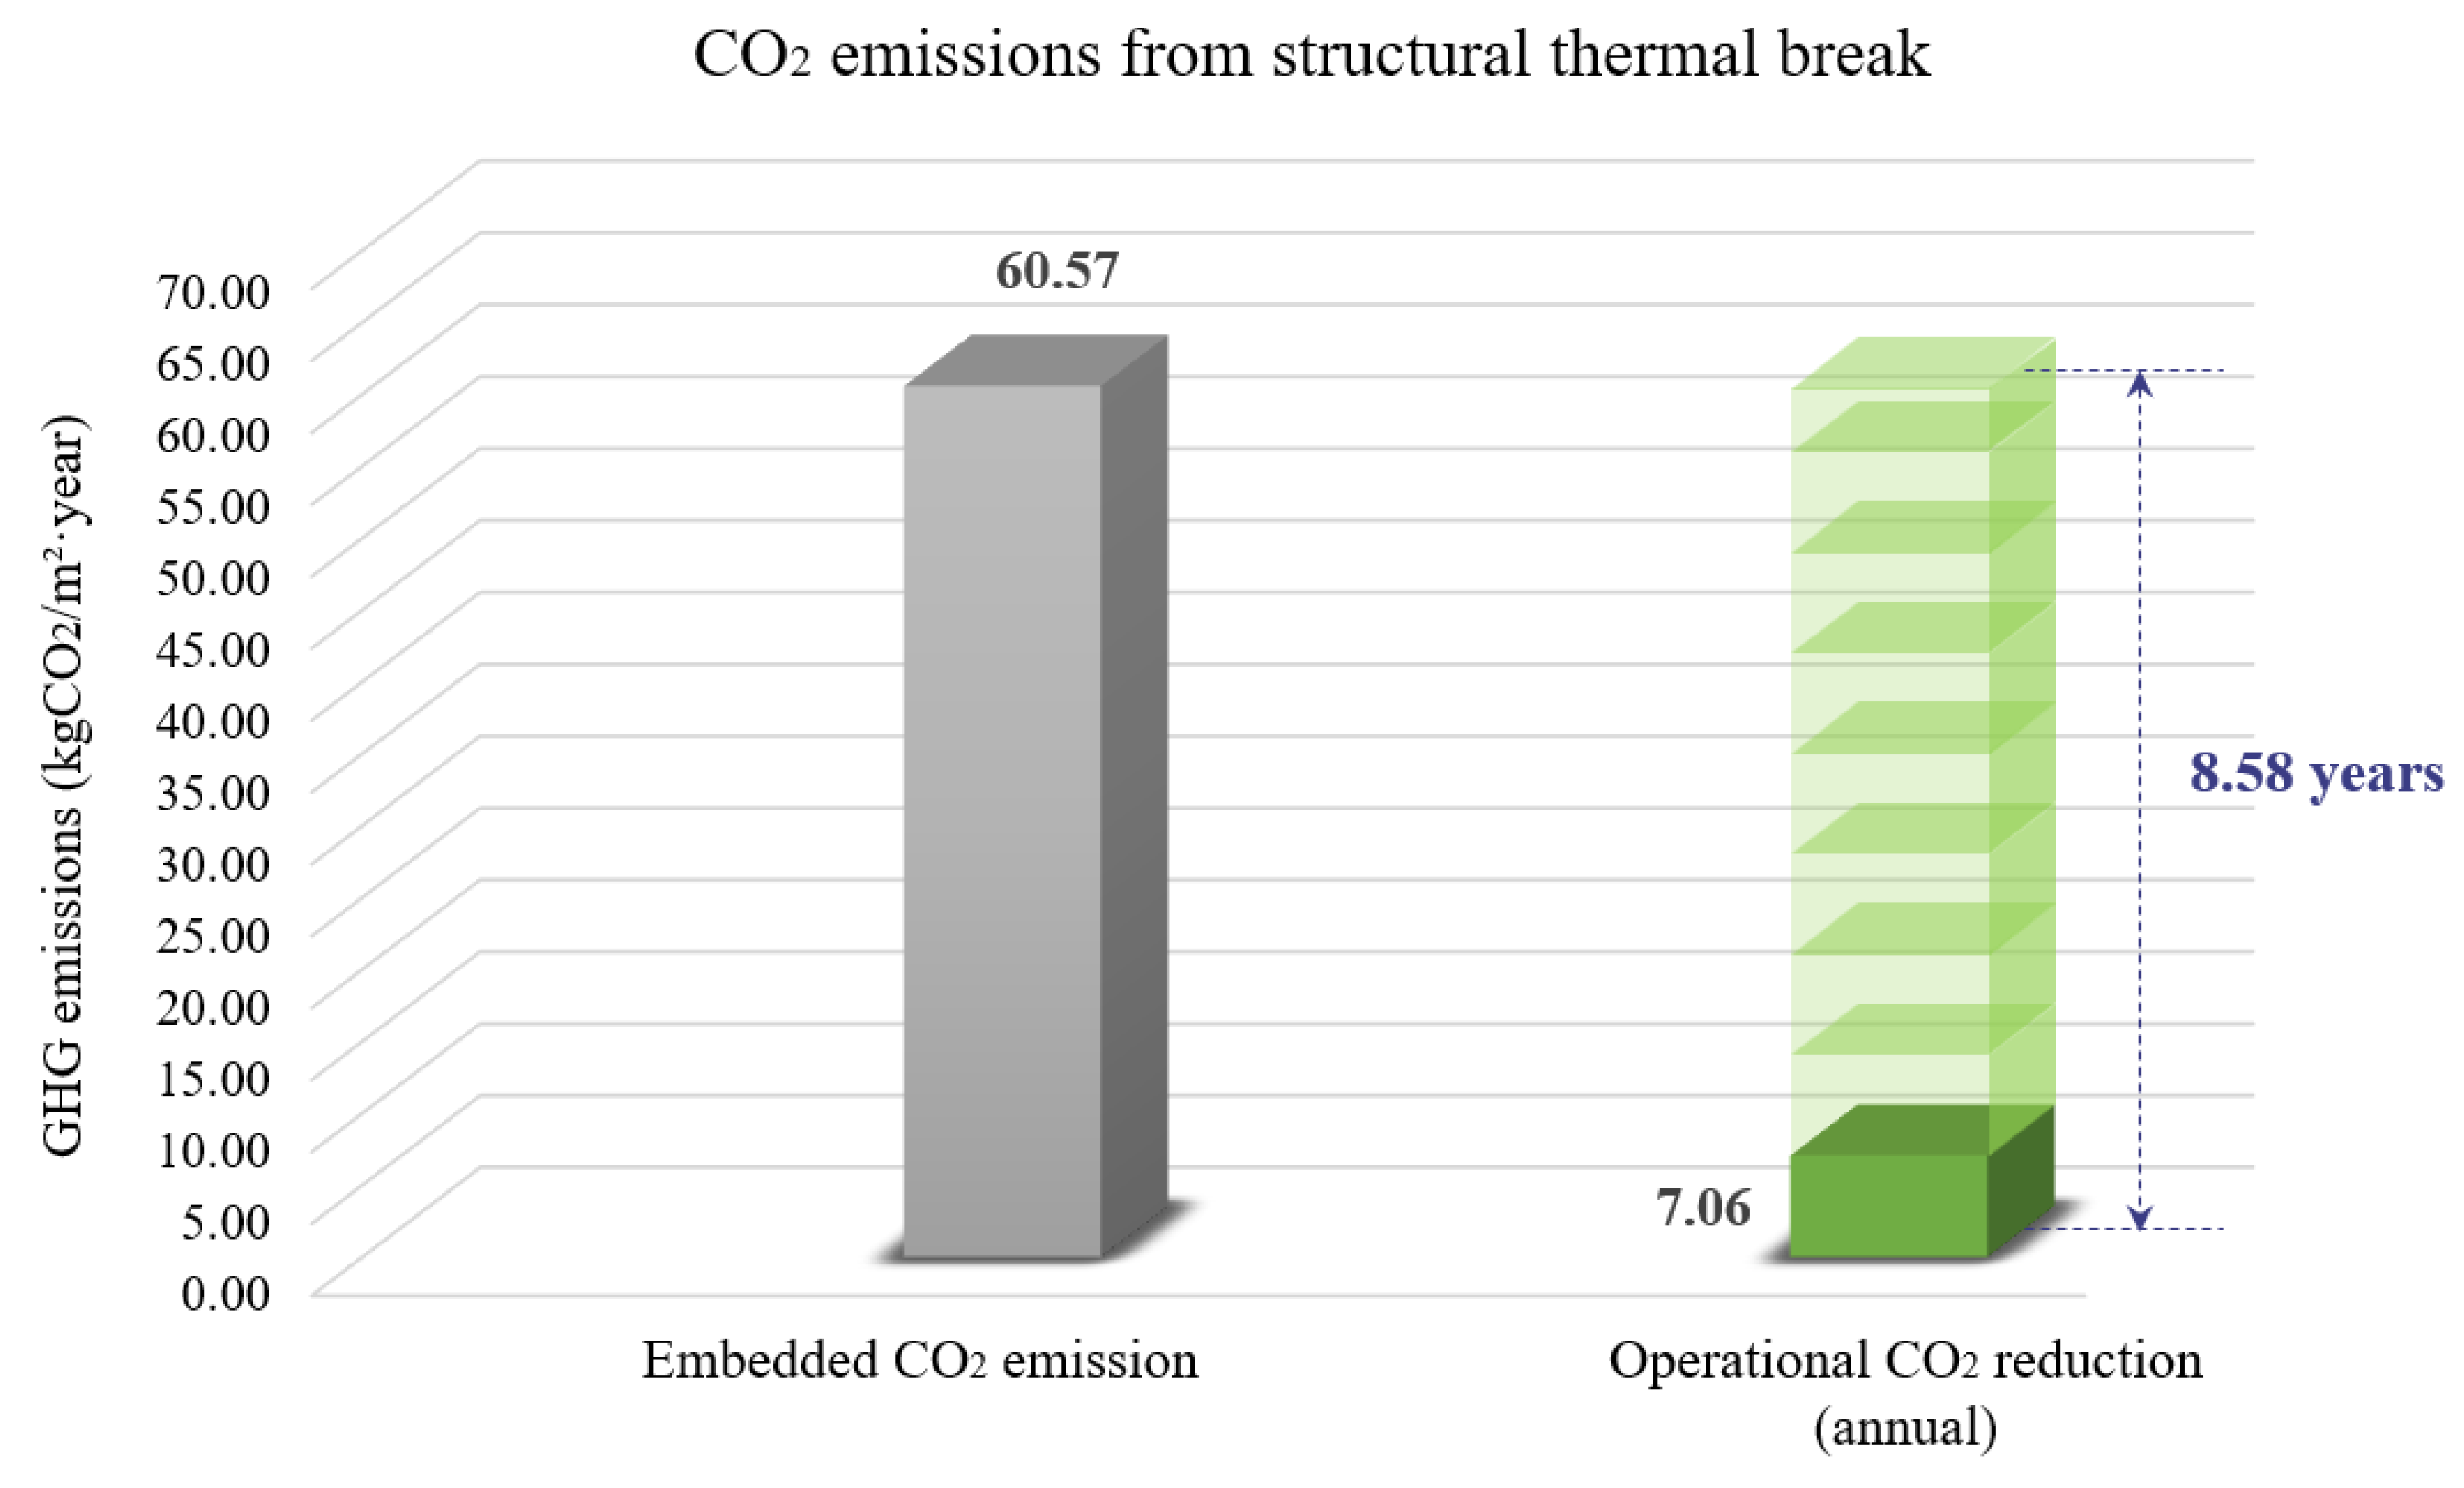

Table 1.
A major overview of structural thermal breaks in the European, North American, and East Asian contexts.
Table 1.
A major overview of structural thermal breaks in the European, North American, and East Asian contexts.
| Region | Country (Population) |
Residential type | Standardized legal code (U-value) |
Structural thermal break (Economic feasibility) |
| Europe | Germany (83,263,320) [6] |
Detached (26.1%) Semi-detached (15.5%) Flat / Apartments (58.4%) [7] |
0.168 ~ 0.312 W/m2·K European standard of (EN16798-3:2018) [8] |
Payback period info (N/A), unit cost of 260 $USD per linear meter [9] |
| Italy (58,742,215) |
Detached (22.5%) Semi-detached (24.8%) Flat / Apartments (52.7%) |
0.168 ~ 0.312 W/m2·K (EN16798-3:2018) |
Payback period of 18 ~ 20 years, unit cost of 149 ~ 158 €/m² (160.9 ~ 170.6 $USD/m²) [10] |
|
| Portugal (10,228,930) |
Detached (36.8%) Semi-detached (18.1%) Flat / Apartments (45.1%) |
0.168 ~ 0.312 W/m2·K (EN16798-3:2018) |
Payback period of 6.9 ~ 9.2 years. unit cost of 46.9 €/m² (50.6 $USD/m²) [11] |
|
| North America |
United States (341,345,748) |
Detached (77.0%) Semi-detached (10.0%) Flat / Apartments (7.0%) [12] |
U-value: 0.30 W/m2·K (R-20, wall) Climate zone 4 to 6 [13] |
Payback period of 18 ~ 20 years, Cost saving of 6,000 $USD for a 20-story building [14] |
| Canada (39,022,969) |
Detached (52.6%) Semi-detached (5.0%) Flat / Apartments (10.7%) [15] |
0.20 ~ 0.25 W/m2·K (R-22 ~ R-27, Zone A-B) 0.19 ~ 0.25 W/m2·K (R-22 ~ R-29, Zone C-D) [16] |
Payback period under R-20 wall Vancouver (Zone 5): 41 years Toronto (Zone 6): 26 years Calgary (Zone 7): 22 years [17] |
|
| East Asia | China (1,457,791,385) |
Detached (N/A) Semi-detached (N/A) Flat / Apartments (N/A) [18] |
Severe cold: 0.40 W/m2·K Cold: 0.50 W/m2·K Hot summer cold winter: 1.00 W/m2·K [19] |
N/A |
| Japan (123,294,513) |
Detached (53.6%) Semi-detached (2.6%) Flat / Apartments (43.8%) |
Zone 1: 0.39 W/m2·K Zone 2: 0.49 W/m2·K Zone 3~5: 0.75 W/m2·K [20] |
N/A | |
| South Korea (51,784,059) |
Detached (31.0%) Semi-detached (2.1%) Flat / Apartments (66.9%) |
Wall: 0.47 W/m2·K Floor: 0.35 W/m2·K Roof: 0.29 W/m2·K [21] |
N/A |
Table 2.
A detailed overview of building passive design elements (Seoul, South Korea).
| Building specifics | |
| Number of floors | 20.00 |
| Number of units | 40.00 |
| Zone area (per unit) | 86.40 (m2) |
| Gross floor area | 3,456.00 (m2) |
| Interior height | 2.40 (m) |
| Infiltration rate | 0.15 (ACH) [40] |
| Natural ventilation rate | 32 (m3 / person per hour) [41] |
| Window-to-wall ratio | South (40%), North (12%), East (N/A), West (N/A) |
| Internal heat gain factors | Occupants, lighting, and electric devices |
| Glazing type | Clear triple glazing |
| SHGC (glazing) | 0.55 |
| U-value (glazing) | 0.70 W/m2·K (R-8) |
| U-value (roof) | 0.15 W/m2·K (R-38) |
| U-value (floor) | 0.15 W/m2·K (R-38) |
| U-value (wall) | 0.17 W/m2·K (R-33) |
| U-value (floor line) with structural thermal breaks | 0.35 W/m2·K (R-16) |
| U-value (floor line) without structural thermal breaks | 0.97 W/m2·K (R-6) |
Table 3.
Thermal transmittance (U-value) of concrete floor line without the application of structural thermal break.
Table 3.
Thermal transmittance (U-value) of concrete floor line without the application of structural thermal break.
| Physical quantities | 1st Measurement | 2nd Measurement | 3rd Measurement | Average | |
| Surface Temperature [℃] |
Constant temperature room |
19.78 | 19.78 | 19.79 | 19.78 |
| Low temperature room |
0.01 | 0.01 | 0.02 | 0.01 | |
| Temp. difference | 19.77 | 19.77 | 19.77 | 19.77 | |
| Total heat supply [W] | 28.88 | 28.88 | 28.77 | 28.84 | |
| Calibrated heat [W] | 10.15 | 10.15 | 10.15 | 10.15 | |
| Heat through specimen [W] | 18.73 | 18.73 | 18.62 | 18.69 | |
| R-value [(m²•K)/W] | 1.027 | 1.027 | 1.033 | 1.029 | |
| U-value [W/(m²•K)] | 0.974 | 0.974 | 0.968 | 0.972 | |
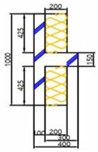 |
[Remarks] 1. Pretreatment of the specimen The test was conducted after curing the concrete specimen for more than 24 hours in a room with constant indoor temperature (i.e., 20 ± 1℃) and relative humidity level (i.e., 50 ± 5%). 2. Experimental settings_1 Conditions of the constant temperature room: indoor temperature 20℃, relative humidity: 50%. 3. Experimental settings_2 Conditions of the low temperature room: indoor temperature 0℃, airflow speed: 2.0m/s |
||||
Table 4.
Thermal transmittance (U-value) of concrete floor line by applying a structural thermal break.
Table 4.
Thermal transmittance (U-value) of concrete floor line by applying a structural thermal break.
| Physical quantities | 1st Measurement | 2nd Measurement | 3rd Measurement | Average | |
| Surface Temperature [℃] |
Constant temperature room |
19.82 | 19.81 | 19.81 | 19.82 |
| Low temperature room |
0.04 | 0.04 | 0.04 | 0.04 | |
| Temp. difference | 19.78 | 19.77 | 19.77 | 19.78 | |
| Total heat supply [W] | 16.91 | 16.98 | 17.03 | 16.97 | |
| Calibrated heat [W] | 10.15 | 10.15 | 10.15 | 10.15 | |
| Heat through specimen [W] | 6.76 | 6.83 | 6.88 | 6.82 | |
| R-value [(m²•K)/W] | 2.895 | 2.866 | 2.844 | 2.868 | |
| U-value [W/(m²•K)] | 0.345 | 0.349 | 0.352 | 0.349 | |
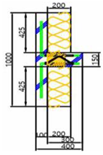 |
[Remarks] 1. Pretreatment of the specimen The test was conducted after curing the concrete specimen for more than 24 hours in a room with constant indoor temperature (i.e., 20 ± 1℃) and relative humidity level (i.e., 50 ± 5%). 2. Experimental settings_1 Conditions of the constant temperature room: indoor temperature 20℃, relative humidity: 50%. 3. Experimental settings_2 Conditions of the low temperature room: indoor temperature 0℃, airflow speed: 2.0m/s |
||||
Table 5.
Electricity rate in multi-residentials (South Korean Ministry of Trade, Industry and Energy, 2022).
Table 5.
Electricity rate in multi-residentials (South Korean Ministry of Trade, Industry and Energy, 2022).
| Progressive billing system | ||
| Electricity usage range [kWh] | Electricity rate [won (cent)/kWh] | |
| Phase 1 | 0 ~ 200 | 93.3 (6.7) |
| Phase 2 | 200 ~ 400 | 187.9 (13.6) |
| Phase 3 | 400 ~ | 280.6 (20.3) |
Table 6.
Investment cost of structural thermal break per unit product (1m in length). In this study, the investment cost includes product cost and construction cost (labor cost + material cost + expense).
Table 6.
Investment cost of structural thermal break per unit product (1m in length). In this study, the investment cost includes product cost and construction cost (labor cost + material cost + expense).
| Breakdown | Quantity | Product cost ($USD) | Material cost ($USD) | Labor cost ($USD) | Expense ($USD) | Total ($USD) |
|||||
| unit | cost | unit | cost | unit | cost | unit | cost | unit | cost | ||
| Thermal break | 1 | 180.66 | 180.66 | - | - | - | - | - | - | 180.66 | 180.66 |
| U-bar rebar | 3.56 | - | - | 0.69 | 2.46 | - | - | - | - | 0.69 | 2.46 |
| Silicon glue | 60.00 | - | - | 0.01 | 0.76 | - | - | - | - | 0.01 | 0.76 |
| Iron worker | 0.0187 | - | - | - | - | 161.22 | 3.02 | - | - | 161.22 | 3.02 |
| Ordinary Worker | 0.0217 | - | - | - | - | 113.50 | 2.48 | - | - | 113.50 | 2.48 |
| Tool damaging fee | 1.00 | - | - | - | - | - | - | 0.20 | 0.20 | 0.20 | 0.20 |
| Total | 180.66 | 3.22 | 5.50 | 0.20 | 189.58 | ||||||
Table 7.
Electricity fuel mix ratio in South Korea (KEEI, 2022).
| Generation mix (South Korea) |
Monthly average ratio by fuel source (%) | |||||||||||
| Jan | Feb | Mar | Apr | May | Jun | Jul | Aug | Sep | Oct | Nov | Dec | |
| Nuclear | 29.49 | 29.59 | 33.20 | 32.18 | 33.33 | 31.55 | 29.91 | 29.96 | 32.35 | 35.37 | 34.12 | 31.67 |
| Coal | 34.73 | 34.45 | 28.24 | 31.86 | 32.10 | 34.66 | 35.66 | 35.79 | 32.69 | 31.15 | 32.45 | 34.96 |
| Petroleum | 0.28 | 0.25 | 0.24 | 0.17 | 0.12 | 0.08 | 0.07 | 0.07 | 0.04 | 0.04 | 0.04 | 0.07 |
| Natural Gas | 30.10 | 30.34 | 31.61 | 28.80 | 27.70 | 27.38 | 28.11 | 28.41 | 28.43 | 26.52 | 27.37 | 28.04 |
| Solar PV | 1.18 | 1.62 | 2.19 | 2.21 | 2.31 | 2.25 | 1.56 | 1.87 | 1.88 | 2.31 | 1.54 | 0.94 |
| Wind | 0.84 | 0.59 | 0.66 | 0.86 | 0.58 | 0.45 | 0.51 | 0.32 | 0.31 | 0.57 | 1.05 | 0.84 |
| Hydropower | 1.03 | 0.97 | 1.20 | 1.36 | 1.59 | 1.38 | 1.95 | 1.35 | 1.75 | 1.62 | 1.29 | 1.18 |
| Tidal | 0.07 | 0.08 | 0.08 | 0.09 | 0.09 | 0.08 | 0.07 | 0.08 | 0.08 | 0.10 | 0.08 | 0.07 |
| Biomass | 1.90 | 1.66 | 1.95 | 1.98 | 1.72 | 1.75 | 1.72 | 1.74 | 1.96 | 1.82 | 1.70 | 1.80 |
| Other | 0.38 | 0.44 | 0.61 | 0.49 | 0.45 | 0.41 | 0.43 | 0.42 | 0.51 | 0.49 | 0.37 | 0.44 |
| Renewables (%) | 5.03 | 4.93 | 6.09 | 6.51 | 6.29 | 5.91 | 5.81 | 5.35 | 5.99 | 6.42 | 5.65 | 4.82 |
Table 8.
Quantity of embedded CO2 emissions from manufacturing structural thermal breaks.
| Embedded Carbon | Weight per unit module |
CO2 emissions per unit module | Total CO2 emissions | |
| Stainless steel | 6.15 (CO2/kg) [55] | 17.91 (kg) | 110.14 (gCO2e) | 137.46 (kgCO2e) |
| Carbon steel | 1.85 (CO2/kg) [56] | 26.86 (kg) | 49.70 (gCO2e) | 62.02 (kgCO2e) |
| CRC board | 1.44 (CO2/kg) | 4.17 (kg) | 6.00 (gCO2e) | 7.48 (kgCO2e) |
| EPS insulation | 2.79 (CO2/kg) [57] | 0.68 (kg) | 1.88 (gCO2e) | 2.35 (kgCO2e) |
| Total | - | 49.62 (kg) | 167.72 (gCO2e) | 209.31 (kgCO2e) |
Table 9.
Reduction rate in annual grid energy demand (kWh/m2·year) by applying structural thermal breaks.
Table 9.
Reduction rate in annual grid energy demand (kWh/m2·year) by applying structural thermal breaks.
| Without structural thermal break | Structural thermal break |
Reduction rate | |
| Heating energy demand (kWh/m2·year) | 42.50 | 23.50 | 44.70% |
| Cooling energy demand (kWh/m2·year) | 32.41 | 35.20 | -8.61% |
| Total (kWh/m2·year) | 74.91 | 58.70 | 21.63% |
Table 10.
Reduction rate in annual building operation costs ($USD/m2·year) by applying structural thermal breaks.
Table 10.
Reduction rate in annual building operation costs ($USD/m2·year) by applying structural thermal breaks.
| Without structural thermal break | Structural thermal break |
Reduction rate | |
| Heating operation costs ($USD/m2·year) | 5.32 | 2.26 | 57.63% |
| Cooling operation costs ($USD/m2·year) | 4.73 | 5.32 | -12.42% |
| Total ($USD/m2·year) | 10.05 | 7.58 | 24.63% |
Table 11.
Economic cost reduction rates recommended to meet 7~20-year payback periods (i.e., SPP and DPP).
Table 11.
Economic cost reduction rates recommended to meet 7~20-year payback periods (i.e., SPP and DPP).
| Simple payback period (SPP) | Discounted payback period (DPP) | |||
| Economic cost ($USD) | Reduction rate | Economic cost ($USD) | Reduction rate | |
| Current cost | 236,596 | - | 236,596 | - |
| 20 years | 171,070 | 27.70% | 125,505 | 46.95% |
| 19 years | 162,517 | 31.31% | 120,905 | 48.90% |
| 18 years | 153,963 | 34.93% | 116,160 | 50.90% |
| 17 years | 145,410 | 38.54% | 111,266 | 52.97% |
| 16 years | 136,856 | 42.16% | 106,217 | 55.11% |
| 15 years | 128,303 | 45.77% | 101,010 | 57.31% |
| 14 years | 119,749 | 49.39% | 95,638 | 59.58% |
| 13 years | 111,196 | 53.00% | 90,097 | 61.92% |
| 12 years | 102,642 | 56.62% | 84,381 | 64.34% |
| 11 years | 94,089 | 60.23% | 78,486 | 66.83% |
| 10 years | 85,535 | 63.85% | 72,405 | 69.40% |
| 9 years | 76,982 | 67.46% | 66,132 | 72.05% |
| 8 years | 68,428 | 71.08% | 59,662 | 74.78% |
| 7 years | 59,875 | 74.69% | 52,987 | 77.60% |
Table 12.
Reduction rate in annual GHG emissions (kgCO2/m2·year) by applying structural thermal breaks.
Table 12.
Reduction rate in annual GHG emissions (kgCO2/m2·year) by applying structural thermal breaks.
| Without structural thermal break | Structural thermal break |
Reduction rate | |
| Heating GHG emissions (kgCO2/m2·year) | 18.52 | 10.24 | 44.70% |
| Cooling GHG emissions (kgCO2/m2·year) | 14.18 | 15.40 | -8.61% |
| Total (kgCO2/m2·year) | 32.70 | 25.64 | 21.63% |
Disclaimer/Publisher’s Note: The statements, opinions and data contained in all publications are solely those of the individual author(s) and contributor(s) and not of MDPI and/or the editor(s). MDPI and/or the editor(s) disclaim responsibility for any injury to people or property resulting from any ideas, methods, instructions or products referred to in the content. |
© 2025 by the author. Licensee MDPI, Basel, Switzerland. This article is an open access article distributed under the terms and conditions of the Creative Commons Attribution (CC BY) license (http://creativecommons.org/licenses/by/4.0/).
Copyright: This open access article is published under a Creative Commons CC BY 4.0 license, which permit the free download, distribution, and reuse, provided that the author and preprint are cited in any reuse.


