
Submitted:
22 November 2025
Posted:
24 November 2025
You are already at the latest version
Abstract
The anatomy and mechanical strength of aortic valve leaflets are critical determinants of the valve biomechanical behavior and long-term structural integrity. The embryonic de-velopmental period, when valves are forming, is critical in establishing baseline leaflet properties. Yet, final stages of valve development are not well understood. This study employs a parametric approach to model the leaflet anatomy of an HH40 chick embryo aortic valve approximating its native curvature. To perform biomechanical analysis, a pressure profile derived from in-ovo Doppler ultrasound measurements was applied, and an Ogden hyper elastic material model was employed following a sensitivity analysis. To determine the effect of valve anatomy on leaflet tissue deformation and stresses, we changed the leaflet midline curve from its native curvature to a linear profile, and quan-tified biomechanical responses. Our analysis revealed a strong decrease in average leaflet effective stress as its midline curvature was shifted towards a linear profile. However, this reduction in average stress was at the expense of a biomechanical trade-off. The shift induced a progressive localization of stress concentration at the leaflet tips and commis-sures, and a distinct bending deformation mode at the tip under peak load. Moreover, the midline curvature shift had a non-linear impact on function: the valve geometric orifice area (GOA) increased initially with the anatomy shift but then reached a maximum and subsequently decreased. Our findings demonstrate that while the curvature of the leaflet midline modulates tissue stress during valve opening a low-stress anatomy does not align with hemodynamic performance. This work characterizes competing leaflet biomechan-ical responses that shape valve leaflet formation, providing fundamental insights into developmental valve biomechanics.
Keywords:
aortic valve
; finite element analysis (FEA)
; parametric valve modelling
; belly curve
; chick embryo
; leaflet kinematics
1. Introduction
The aortic valve, one of the four main valves of the heart, is subjected to high pressures and flow rates that change fast [1]. The aortic valve functions as a semilunar gateway between the left ventricle and the aorta, ensuring unidirectional systemic blood flow by opening during ventricular systole and closing during diastole [2,3]. Its anatomy consists of three crescent-shaped leaflets with a trilaminar microarchitecture (fibrosa, spongiosa, and ventricularis) that exhibits anisotropic mechanical behavior, allowing the leaflets to undergo large deformations during systolic ejection while sustaining large loads during diastolic closure [4,5,6,7,8].
The valve's functional integrity depends on a complex interplay between biomechanical forces and multi-scale architecture extending from molecular organization to the tri-layered leaflet microstructure [9]. Mechanotransduction processes allow leaflet cells to maintain their extracellular matrix strength and overall tissue homeostasis [10,11]. During cardiac development, when the valve layered leaflets are forming, biomechanical forces are essential to guide leaflet tissue formation, and disruptions can lead to malformed valve leaflets with impaired function. Yet, we do not completely understand how biomechanics guides leaflet formation.
The chick embryo provides an advantageous experimental model for valve formation research due to its external development, allowing direct access for surgical manipulations and advanced imaging [12,13,14] .Hemodynamic parameters can be measured non-invasively using Doppler echocardiography, providing quantitative blood flow velocities and pressure gradients essential for computational modeling [15,16,17]. However, the critical period of valve formation when the heart is fully formed and the embryonic valve layers are developing, has been understudied.
The interplay between the local hemodynamic environment and mechanical stress is known to actively regulate leaflet anatomy and structural composition during valvulogenesis [18,19,20]. Valve function is governed by a host of geometric parameters as well as leaflet material properties [21]. But studies addressing structure-function relationships during development are lacking. Among other anatomical characteristics, the leaflet midline curve or “belly curve” is a critical determinant of valve biomechanics [22,23]. Previous studies have shown that variations in the belly curve alter stress distributions, with changes in curvature leading to redistribution of von Mises, tensile, and compressive stress across the leaflet [23,24]. Moreover, anatomical leaflet modifications directly influence hemodynamic performance by affecting geometric orifice area, coaptation dynamics, and transvalvular pressure gradients [22,25]. Curvature-induced alterations in leaflet motion modify jet characteristics and wall shear stress patterns, stimulating mechanobiological pathways that link anatomy to cellular responses and tissue remodeling [26,27].
To investigate intricate structural-functional relationships in valve leaflets, finite element analysis (FEA) has been extensively employed to model adult and prosthetic valves. FEA has been used to quantify aortic valve leaflet deformation, estimate leaflet stresses, and guide prosthesis and repair design under physiological and pathological loading conditions [28,29]. Studies include pure biomechanical (structural) FEA with prescribed pressure loads to determine transient structural response and design-level stress estimates [30,31] as well as fluid-structure interaction (FSI) [32] models that account for the dynamic interaction of the valve leaflets with blood flow.
Using FEA we analyzed here the biomechanics of chick embryo developing aortic valves. For our studies we chose embryos at the Hamburger-Hamilton [33] stage 40 (HH40 – about 14 days of incubation), since at this stage the heart is fully formed and aortic valves are developing their structure and maturing. Using a parametric model of the HH40 chick embryo aortic valves, we investigated the influence of the belly curve on leaflet deformation and stress distribution during systole, when the valve leaflets open to allow blood to flow from the ventricle to the aorta. Our modeling framework enabled detail analysis of displacement patterns, effective stress distribution, and kinematic behavior, while also providing new insights into how anatomical and material variations shape the mechanical environment of developing embryonic valves.
2. Materials and Methods
2.1. Doppler Ultrasound Measurement of Aortic Flow in Chick Embryo
White leghorn chicken eggs were incubated for about 14 days to the Hamburger-Hamilton [33] avian developmental stage 40 (HH40). Chick embryos were imaged in ovo by creating a small window in the eggshell to expose the chorioallantoic membrane and underlying cardiovascular structures. In vivo imaging was performed with high-resolution ultrasound using the Vevo 2100 system (VisualSonics, Fujifilm) equipped with an MS550S-0018 transducer (center frequency: 40 MHz, axial resolution: ~40 µm). Long-axis B-mode images of the left ventricle and ascending aorta were acquired to guide Doppler measurement. Pulsed wave (PW) Doppler mode was used to assess blood flow velocity. The Doppler sample volume (gate) was positioned distal to the valve to capture the systolic outflow velocities. The insonation angle was maintained below 60° to minimize angular error in velocity estimation (Figure 1A). Recorded velocity-time waveforms (Figure 1B) were converted to pressure-time profiles using Bernoulli’s equation to apply as a load boundary condition in FEA (Figure 1C).
2.2. Cryostat Sectioning
A heart, carefully dissected from an HH40 chick embryo, was arrested in the diastolic phase by immersion in cold Phosphate-Buffered Saline (PBS) containing 10% potassium chloride (KCl). Subsequently, the heart was carefully positioned and embedded in optimal cutting temperature (OCT) compound, and flash-frozen on crushed dry ice.
After equilibrating to -20°C within a cryostat (LEICA CM1860), the tissue block was serially sectioned at a thickness of 8-10 µm. The sections were mounted on positively charged slides (Superfrost Plus™). For morphological visualization, the sections were subjected to a standard Hematoxylin and Eosin (H&E) staining protocol.
Stained sections were imaged using a light microscope (LEICA M205 A) equipped with a digital camera (sCMOS pco.edge 5.5mm). The resulting digital images were used to analyze the aortic valve leaflets for modeling (Figure 2).
2.3. Aortic Valve Modelling
Three representative consecutive cryostat sections that clearly show the HH40 aortic valve leaflets (Figure 2B and Figure 2C), were selected for measurement and parametric valve design. The images were registered and calibrated using ImageJ (National Institutes of Health, USA) software. Subsequently, the calibrated images were imported into Autodesk Fusion 360 (Autodesk Inc., USA) and positioned on the x–y plane. The images were aligned so that the annulus plane and the centerline were coincident. The leaflet curve profiles on each image were drawn using a Bezier curve based on three reference points (upper, middle, and outer points, see Figure 2C and Figure 3A) that were localized (and aligned) on the image x-y plane. A representative curve was then obtained by averaging each point group (upper, middle, and outer) and generating an average leaflet midline (belly curve) profile (displayed on Figure 2C for each image). Based on the location of the average points and imaging data the valve height and annulus radius were 0.46 mm and 0.3 mm, respectively (see Figure 2C). To avoid geometric inconsistencies (overlapping) during reconstruction of the valve three leaflets, the axis of the belly curve was shifted by 0.005 mm in the x-direction generating a small gap (0.01mm) between the leaflets in the reconstructed geometry (Figure 3A). Thus, the three points of the Bézier curve defining the belly curve were: upper (0.005 mm, 0.46 mm); middle (0.005 mm, 0 mm); and outer (0.3mm,0mm). The leaflet free edge was created by rotating the x-y plane containing the belly curve 60 degrees counterclockwise, at the intersection with a perpendicular plane at y = 0.46mm (see Figure 3A). Finally, the belly curve and free edge were connected by an attachment curve, generated by projecting a five-point Bézier curve onto a cylindrical surface created by extruding the annulus circle along the y-axis (Figure 3A). The five points x, y and z coordinates in mm were: (P1: 0.473, 0.10, 0.00); (P2: 0.398, 0.23, 0.00); (P3: 0.324, 0.358, -0.001); (P4: 0.324, 0.359, 0.203); (P5: 0.323, 0.36, 0.46). Through this construction, the geometric contours of half of the aortic valve were completed. A surface was generated over the resulting sketches using the surface patch method. This half-valve leaflet was then mirrored through the x-y plane (the plane of the belly curve) and tripled around the central axis using a circular pattern to form the complete aortic valve (consisting of three identical leaflet surfaces). Finally, the generated surfaces were converted into solid geometry using the average valve thickness (0.05mm) measured from cryostat images.
2.4. Middle Curve Shift-Based Parametric Modeling of Aortic Valve Leaflets
To determine how valve anatomy affects leaflet biomechanics, we generated 11 distinct leaflet profiles by parametrically changing the belly line curve. To this end we shifted the middle point of the Bézier curve representing the midline curve in increments of 0.03mm in the belly curve plane x-direction (see Figure 4), corresponding to 10% increments. This resulted in a transition from the native (measured) curved to a nearly linear belly curve profile. All other parameters used in the construction of the leaflet anatomy were kept the same. Note that with increasing middle point shift, marked changes in leaflet curvature are accompanied by an increase in the leaflet attachment angle to the aortic wall (from 0 to about 57 degrees), which will affect stress concentrations along the belly curve.
2.5. Finite Element Analysis Setup
Dynamic implicit finite element simulations were performed in ADINA 24.00 (Bentley, 2024), incorporating large displacement and large strain formulations to accurately capture the nonlinear structural response of valve leaflets. Frictionless face-to-face contact was defined on the inner (ventricularis) leaflet surfaces, while side boundaries were fixed (to the outside cylindrical shape). Moreover, a transient pressure profile was applied normal to the leaflet ventricularis surface (pink arrows in Figure 5A with the time-dependent pressure profile in Figure 5B). The simulations were performed using a maximum time step of 0.001 s and ADINA automatic time stepping (ATS) method, which adaptively reduces the time step size to facilitate convergence when a solution fails to converge. Finite element analysis (FEA) was initially performed to determine leaflet mechanical properties, and then for the eleven belly-curve shifted valve geometries (0%–100%; Figure 4). Each simulation was run for 0.155 s, corresponding to the effective duration of the HH40 chick embryo cardiac systolic phase. Simulations therefore included the opening of the valve followed by partial closure (to the initial configuration). Full valve closure was not simulated.
2.6. Mesh Generation and Convergence
The FEA leaflet model was meshed with tetrahedral elements generated on the default (non-shifted) valve geometries using HyperMesh NVH (Student License, Version 2024; Altair Engineering Inc., Troy, MI, USA). For mesh convergence analysis, four different mesh configurations were created using the following settings: (1) 28,902 nodes and 17,990 elements with an element size of 0.03 mm and a growth ratio of 1.2; (2) 35,730 nodes and 32,578 elements with an element size of 0.025 mm and a growth ratio of 1.2; (3) 74,304 nodes and 49,071 elements with an element size of 0.021 mm and a growth ratio of 1.2; and (4) 99,858 nodes and 66,545 elements with an element size of 0.019 mm and a growth ratio of 1.2. To ensure mesh quality across all geometries, the tetrahedral collapse value was kept above 0.3.
2.7. Material Sensitivity Analysis
The material properties of the chick embryo aortic valve have not been defined in the literature. Hence, we adopted a multi-stage methodology to both estimate the material properties of valve leaflets and select an appropriate mesh element size. First, a preliminary mesh convergence analysis was performed using human aortic valve material properties from the literature (see Table 1, Test 0). Using the mesh derived from this initial convergence analysis, a material sensitivity analysis was performed with distinct material parameters (defined in Table 1) to determine suitable material parameters for the chick aortic leaflets. Once material parameters were selected from the sensitivity analysis, a second mesh convergence analysis was performed. The resulting mesh and material properties were used in FEA to simulate the biomechanical effects of changing the middle curve of the chick aortic valve leaflets through a progressive shift in the parametric model.
While the chick embryo serves as a well-established experimental model for cardiac morphogenesis and mechanobiology studies [34,35], there is a notable lack of experimentally derived material properties for the chick embryo aortic valve. To overcome this lack of data, human aortic leaflet material properties [36] were initially employed as an approximation, using an Ogden hyper elastic model. Material model parameters were then refined through a material sensitivity analysis aimed at maximizing the effective orifice area, used as a proxy criterion for determining chick embryo aortic valve material properties.
The Ogden strain-energy function, W, has the form:
where the are the principal components of the stretch tensor, and N, and are material constants. For small deformations, the shear modulus can be approximated as [37]:
Following previous works [36] we used N = 1. For human leaflet tissues, with μ₁=577.6 Pa, and α₁=26.26, rendering Pa. For the chicken embryo, we found material parameters for a much earlier developmental stage (HH12, Day 2), when the valve leaflets are not yet formed [37]. The study characterized, however, Ogden material properties for the myocardium and cardiac jelly (the latter giving rise to valve leaflets later during development), with initial shear modulus (G₀) of about 80 Pa and 27 Pa, respectively. The HH40 aortic valve, the focus of our study, is expected to be significantly stiffer than this early-stage cardiac tissue [38]. The parameters selected for Test 10 (μ₁=105 Pa, α₁=10), the lower bound for leaflet material properties in our sensitivity analysis, yield G₀ ≈ 525 Pa. This value was chosen as a conservative lower bound for the HH40 aortic valve, representing a stiffness about 20 times greater than the cardiac jelly at HH12 [37] to reflect the expected developmental stiffening. The other values (Tests 1-9) were linearly interpolated between the upper bound from Test 0 (based on human aortic valve data[36]) and Test 10 lower bound (Table 1).
2.8. Frequency Analysis and Damping Coefficient Calculation
When analyzing the dynamic behavior of structural systems, undamped vibrations near resonance modes could result in unrealistic solutions. Typically, vibrations are physically dampened (at least to some extent) by natural energy dissipation mechanisms. To suppress non-physical vibrations, frequency analysis is often performed to identify the natural frequencies of the system and determine appropriate Rayleigh damping coefficients [39]. For a given vibration mode, the modal damping parameter () can be expressed in terms of the Rayleigh damping coefficients and as follows:
where is the natural angular frequency of mode i in rad/s, represents the mass-proportional damping coefficient, which predominantly damps lower modes, whereas is the stiffness-proportional damping coefficient, which primarily targets higher modes. Unless high-frequency damping is specifically needed, it is generally recommended to set = 0 or assign a very small value, especially if explicit analysis is performed (as can severely reduce the critical time step for time stability) [40]. In this project, we performed frequency analysis of the valve leaflet geometry and used the lowest natural frequency to determine the Rayleigh damping coefficient (α) based on different damping levels. Given distinct α values, we then tested the oscillation of the valve leaflet under the pressure load (Figure 5B) and selected the minimum damping required to avoid unwanted leaflet oscillations.
3. Results
3.1. Mesh Convergence and Material Sensitivity
An initial mesh convergence analysis was performed using the material properties corresponding to the adult human valves. For this initial analysis, high accuracy was not considered critical, and differences of 3-5% were acceptable for convergence. Four mesh sizes were evaluated by plotting the displacement of the leaflet tip over time when the aortic pressure load (Figure 5B) was applied (see Figure 6). We selected the mesh with an element size of 0.025 mm, as the difference in the tip displacement with respect to the finer mesh (with element size 0.0191) was within 4%.
Using the selected mesh (size 0.025 mm), we conducted a leaflet material sensitivity analysis. To this end, we applied the aortic pressure load previously estimated from aortic velocity measurements (Figure 5B). We then examined the valve configuration at 0.08 s, which corresponds to the time point of peak aortic pressure in the HH40 chick embryo, as progressively softer leaflet material properties were simulated (see Figure 7). As the parameters in the Ogden strain-energy function progressively decrease, valve leaflet stiffness decreases, and the valves open more, until the leaflets become fully open. The optimal material model selected (μ₁=199.52 Pa, α₁=13.252) was based on two criteria: (1) achieving the largest effective orifice area, and (2) the maximum leaflet tip displacement remained within the annular diameter of the valve.
After selecting the valve leaflet material properties, a second mesh convergence analysis was performed before proceeding with further analysis. The same four mesh configurations employed previously (Figure 6A) were used in this new convergence analysis, and we required a difference of < 1% in tip displacement (at peak pressure, t = 0.08 s) from progressively finer meshes as a criterium for convergence. Based on our results, the mesh with an element size of 0.025 mm (with 0.06% difference with respect to the displacement of the 0.0191 mm element size mesh) was again selected as an optimal mesh for our studies.
However, while at peak pressure, the displacement of the leaflet tips was almost insensitive to the mesh element size, easily satisfying our mesh convergence criteria, during the rapid opening and closing phases, tip displacements were more sensitive to the element size. To examine this behavior, two characteristic time points were selected: (i) the valve opening phase (t = 0.031 s) and (ii) the valve closing phase (t = 0.131 s). Both times correspond to the middle of the opening and closing transition periods (see Figure 8). These are highly dynamic instants within the cardiac cycle, for which precise leaflet motion is difficult to characterize. While differences in leaflet configuration and tip displacement were negligible during opening (t = 0.031 s); they were evident during closing (t = 0.131 s) but quickly stabilized to similar values upon further closing (t > 0.031 s). Comparing average errors over the systolic phase (with respect to the finer mesh) demonstrated that the mesh with element size 0.025mm (with 0.7% average error) provides a balance between computational efficiency and physical accuracy.
3.2. Damping Coefficient Sensitivity
The fast valve opening and closing generate oscillations in the leaflet motion (see Figure 8). To damp these oscillations, mass-proportional damping coefficients (, see Eqn. 3) were calculated based on the first-mode angular frequency of the aortic valve, = 4779.47 rad/s, so that the modal damping parameter, ξ ranged from 0.001 to 0.2 (the latest corresponding to 20% damping, see Table 2). These α values were then used to conduct a damping sensitivity analysis, employing the same element size and material properties determined in the mesh and material convergence analyses.
The leaflet tip point displacement results in Figure 9 indicate that the mass-proportional damping value of = 1911.79 s⁻¹ (corresponding to 20% critical damping ratio) successfully damped excessive valve motion. Therefore, this specific value was selected for the subsequent analysis of the aortic valve.
3.3. Valve Leaflet Middle Curve Shift
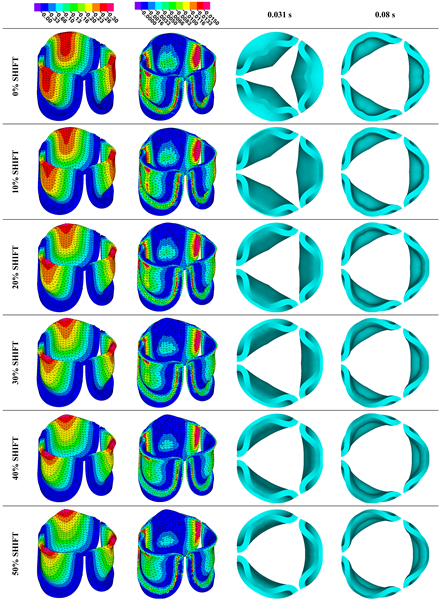
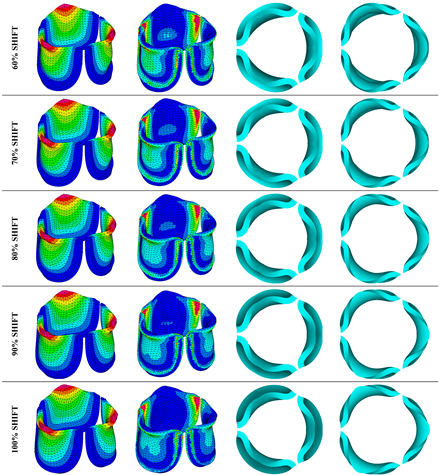
To determine how changes in valve leaflet anatomy affect valve motion and effective stress, we changed the curvature of the middle leaflet curve (the belly curve) as shown in Figure 4. We then performed FEA for the eleven belly-curve shifted valve geometries (0%–100%), utilizing the leaflet mesh and material properties determined before (element size 0.025mm; Ogden parameters µ1 = 199.520 and α1 = 13.252; and Rayleigh damping coefficient α = 1911.79) and applying the time-dependent systolic blood pressure profile determined previously (Figure 5B). Simulated valve displacement and effective stress contour plots, as well as the valve configuration during opening (ascending transition) and at peak pressure are shown in Table 3. Examination of the leaflet configuration during opening and peak pressure reveals that the tip displaces faster than the valve base. While interesting, this behavior could be due to the pressure boundary conditions applied simultaneously to the whole valve ventricularis surface. Not surprisingly, since displacements are higher at the leaflet tip (top of the middle leaflet curve), effective stresses are also higher in this region. At 0% shift, broader regions of the leaflets exhibit high displacement; however, this distribution gradually decreases up to the 20% shift and nearly disappears at 30%. Beyond 30%, the previously wide high-displacement regions become localized near the leaflet tip, and between 70% and 100% shift they are confined to smaller areas of the leaflet tips. Thus, the increasing linear geometry of the belly curve also restricts leaflet motion.
As expected, effective stress plots show that regions of high displacement are often accompanied by elevated effective stress concentrations (≥ 0.015 MPa, see Table 3), particularly in the upper belly curve region. Stress plots, moreover, show a progressive redistribution and mitigation of stress with increasing belly-curve shift. Concurrently, as the shift increases from 0% to 100%, the regions of maximum effective stress (≥ 0.015 MPa) become progressively localized at the commissure edge (the joining edge between two valve leaflets).
Next, we determined the valve middle orifice area (MOA), on a plane orthogonal to the valves and located half-way between the base and the tip of the valve leaflet (z=0.23 mm, see Figure 3A and Figure 10) both during valve opening (t = 0.031 s) and peak pressure (t = 0.08 s). During valve opening the MOA increases with belly curve shift. In contrast, the MOA at peak pressure exhibits a slight but consistent decrease with increasing belly curve shift (Figure 10).
Examining the ventricularis belly curve profiles of the aortic valve leaflet (Figure 11) reveals how the shift alters the leaflet motion. As the shift increases the total length of the belly curve decreases, and the attachment angle to the aortic wall increases, also affecting leaflet motion and stresses. Analysis of the geometric orifice area (GOA; see Figure 11, bottom panel) reveals a non-linear trend. Unlike MOA at t = 0.08 s (Figure 10) which decreases slightly, the GOA at t = 0.08 s (Figure 11) after slightly decreasing from 0 to 10% shift, progressively increases and reaches a maximum at 70% shift, but then reduces as the shift further increases. This trend is directly linked to leaflet deformation shape at peak pressure load (see Figure 11). From 0 to 70% shift, the GOA plane remains stable near z=0.05 mm. However, from 80% to 100% shift, the GOA plane switches positions to z=0.35 mm. This switch in the GOA plane, due to the leaflet deformation profile, results in a sudden drop in GOA at 80% to a value nearly identical to that of the 40% shift, which then holds steady through the 100% shift.
Dynamically, at 0% shift, the valve leaflet is the slowest to displace during valve opening, and its base restricts the effective orifice area. In contrast, during aortic valve opening, the shorter length of the belly curve at 100% shift, and its increased attachment angle, allows it to displace faster, but at the expense of increased tip bending during peak pressure (see Figure 11). During the valve opening phase (t = 0.031 s), the valve tip closely followed the curvature of the belly curve without noticeable bending. At the peak pressure phase (t = 0.08 s), however, the leaflet tip exhibited progressive linear bending as the belly curve shift increased from 0% to 100%, reaching nearly 90° at 100% shift. The position of the tip, moreover, changes substantially with the belly-curve shift (Figure 12).
Figure 13 presents the time-dependent displacement magnitude at the uppermost point (tip) of the leaflet belly curve. Note that oscillations develop after the rapid opening phase and then in the region of maximum pressure as the shift increases. At t = 0.08 s, when the maximum pressure acts on the leaflet, the tip displacement profile exhibits a nearly linear increase from 0% to 100% shift (R² = 0.9953, Figure 12). At t = 0.031 s, when the valve is opening, there is significant variation in the tip position (see also Figure 12 and Figure 11).
We then quantified the average effective stress along the belly curve on the fibrosa surface (highlighted by the red dashed lines in Figure 14). At the peak pressure (t = 0.08 s), the 0% shift configuration exhibits the highest average effective stress while the 100% shift shows the lowest (Figure 14). Overall, we found a linear decrease in the belly curve average stress as the belly curve shift increases from 0% to 100% (R² = 0.9875).
4. Discussion
This study investigates the biomechanics of developing aortic valves. We extracted geometrical data from HH40 chicken embryo developing valves from imaged frozen sections of the heart and used parametric analysis to reconstruct the 3D leaflet anatomy. We then tested different leaflet material properties in silico, starting with measured human adult leaflet nonlinear properties and progressively reducing the stiffness until the leaflets, subjected to pre-determined pressure load (approximated from aortic flow measurements in the embryo), completely open under the applied pressure profile. Finally, we investigated the effect of the valve leaflet anatomy by progressively changing the leaflet middle curve (belly curve) and quantifying systolic biomechanical changes (displacement, stress), while keeping the leaflet properties constant. While the study focused on developing chick embryonic valves, the methodology presented could be applied to any other study of valve biomechanics. Moreover, while we found that leaflet biomechanics is sensitive to anatomy and material properties, which need to be carefully determined, trends obtained here are useful to better understand valve biomechanics and their dynamic behavior under flow.
4.1. Limitations
The strength of our study is the methodological approach, which was designed to isolate the leaflet material properties and functional role of the aortic valve, with a focus on the role of the belly curve. Limitations of this study are mainly associated with a lack of data on HH40 valve function and valve tissue properties. This lack of data is partly due to the tiny dimensions of the inner aortic root (< 1mm), leaflet thickness (< 0.1mm), and fast heartbeat (0.15 s systolic phase). It is extremely difficult to image the dynamic motion of leaflets, resolve their native anatomy, and test their material properties. To overcome this lack of data, we have resourced to various assumptions as well as sensitivity analyses. While actual stress and strain quantifications within chick aortic leaflets may be different than those reported here, trends found, and general leaflet opening/closing characteristics provide valuable insights into the aortic leaflet dynamic behavior during embryonic development.
It is important to first acknowledge the limitations associated with the physical sectioning of the embryonic heart for our baseline model. Achieving a perfect cryostat section precisely aligned with the true belly curve of a single leaflet is challenging, given the small size of the HH40 embryo heart and its aorta and the manual process of orienting the tissue within the block for sectioning. Evidence of this misalignment is presented in Figure 2B and 2C, where two leaflets are visible in the sectioning plane; a perfectly parallel cut through a single leaflet's belly curve would capture only one leaflet (see Figure 3). Therefore, the baseline belly curved profile used in our model should be understood as a high-fidelity approximation derived from the best achievable sections (with n = 1), rather than an exact anatomical trace. The analysis performed here altering the belly curve, therefore, is useful to understand the effect of model uncertainties.
A second limitation of this study was the unavailability of mechanical properties for HH40 chick embryo aortic leaflets. Direct use of adult human material properties (or even chicken adult properties) is inadvisable, since we expect large changes in material properties as valve leaflets mature and grow from embryonic development to adult size. For example, human leaflets scaled to an equivalent annulus diameter are nearly 7.8 times thinner (see Figure 3B). As expected, when we attempted to use human leaflet material properties with the developing chick valve anatomy, the valves were too stiff and would not fully open under the applied pressure profile (see Figure 7). To overcome this lack of data, we developed a set of material properties. We started with human material properties in the form of an Ogden hyper elastic model and adjusted the parameters to reflect the presumed higher elasticity of embryonic leaflet tissue. In the absence of validation data, we adopted the principle of maximum functional efficacy: we chose material properties that allowed full opening of the leaflets under the peak applied pressure (see Figure 7, parameter set 8 from Table 1). These material properties then represent a physiologically effective outcome for the given systolic peak load and anatomy.
Another key limitation of this study is the approximation of the applied pressure profile from measured velocity data. While this approximation is frequently employed in cardiology, it comes as its own expense, particularly in the case of tiny developing hearts in which viscous effects are important and by ignoring them in the estimation we might have underestimated pressure data.
Rayleigh damping was implemented, and a suitable parameter value was determined based on a damping sensitivity analysis. As a result of this analysis (Figure 9), a coefficient corresponding to 20% of critical damping was selected, which effectively eliminated leaflet oscillations. The primary reason behind this deliberate choice was the absence of experimental data characterizing the natural vibration profile of the HH40 embryonic aortic valve. Our objective was to achieve numerical stability rather than to replicate a speculative oscillation pattern. Accordingly, leaflet vibration was intentionally minimized in the model.
Another key (yet common) simplifications in the model are the stress-free configuration, assumed to be the initial leaflet configuration (Figure 4), the leaflet sharp change in overall curvature across the belly curve, the lack of contact within leaflets (with a small gap in between), and restriction of the analysis to the opening (systolic) behavior. It is evident that the stress and displacement fields quantified under these assumptions will differ from physiological conditions. However, assumptions made in this study also allowed for a consistent analysis of how changes in material properties and leaflet anatomy influence valve mechanics.
Despite limitations, the methodology employed in this study provides a platform for testing scenarios as well as refining models as data on chick embryonic valves becomes available. Moreover, our approach could also be employed to model valve biomechanics in other animal models and with human data, including prosthetic valve design.
4.2. Parametric Valve Modeling
Parametric aortic valve modeling is a common method, largely because the valve's thin leaflets are difficult to resolve in their native morphology, even for large animal models and humans [41]. This approach defines the complex, three-dimensional anatomy of the leaflets using a limited set of controllable parameters. Adopting this methodology in the present study, the leaflets were constructed using key anatomical curves: the free edge (top of the leaflet), the attachment line, and the belly curve. The flexibility of parametric modeling is evident in literature, where alternative functions such as hyperbolic curves [42] and definitions based on key anatomical points [43,44] have been successfully employed. This overall strategy has been extended to create unified 3D representations of the entire valve and root [45]. In this study, we specifically utilized Bézier curves to represent the leaflet belly curve (3-point Bézier) and the attachment line (5-point Bézier). The use of Bézier curves to represent leaflet geometry is a technique consistent with other contemporary approaches [46]. We take advantage of parametric valve modeling to not only generate a representation of the embryonic valve leaflets in 3D, but also to alter the valve leaflet anatomy in a relatively simple way to perform a geometric sensitivity analysis.
4.3. Leaflet Material Properties
The mechanical response of the leaflet tissue was described in this study using an Ogden-type hyper elastic constitutive model. The Ogen model [37] is a nonlinear isotropic model frequently employed to describe the behavior of soft tissues. While studies in the literature on prosthetic or well-characterized leaflet tissues often favor anisotropic models such as the Fung-type [43,47,48] or Holzapfel [49,50] to account for fiber orientation, the Ogden model provides a robust phenomenological framework suitable for biological materials for which detailed microstructural data is unavailable. The most important point to emphasize here is that our study does not aim to propose a definitive material model for embryonic valve tissues, but rather to investigate the mechanical effects of leaflet properties and anatomy. By using a consistent hyper elastic model across all simulations when altering anatomy, the relative changes in stress and leaflet deformation could be directly attributed to parametric geometry.
4.4. Biomechanical Analysis
For the biomechanical analysis of the parametric valve model developed here, a FEA approach was adopted. As noted in the literature [47,48,49], the primary advantage of FEA is its high computational efficiency, which provides an ideal framework for parametric sensitivity investigations. The primary trade-off of this approach is the exclusion of the flow dynamics around valve leaflets (that would be instead achieved through a fully coupled fluid-structure interaction – FSI – analysis). FEA thus sacrifices the accuracy of the dynamic interplay between the fluid and leaflets. Nevertheless, the biomechanical FEA analysis provided here is a pre-requisite for FSI methods, as it allows us to test for structural integrity of the valve, and its response to loads, prior to including the more involved interaction with the flow of blood in the model.
4.5. Effect of Leaflet Midline Curve on Valve Biomechanics
We performed a biomechanical analysis looking at the effect of changing the leaflet belly curve (midline curvature). Our analysis revealed that as the belly curve changes from a baseline curvature to a linear profile (0 to 100% shift), high-stress regions, initially distributed along the belly curve and attachment line, become progressively concentrated at the leaflet tips and the commissure edges. Numerous studies on various valve configurations have identified the commissures and attachment regions, which are regions that present sharp edges, as primary sites for stress concentration [42,47,48,49,51]. The novel finding of this study that diverges from literature is the progressive concentration of stress at the leaflet tips, which is directly attributable to the increasing belly curve shift. Therefore, the key contribution of our study is the previously uncharacterized stress concentration at the leaflet tips as the belly curve changes. This dual stress localization pattern (at the tips as well as commissure edges) points to a more complex mechanical behavior than previously described.
Previous studies confirm that the belly region is a critical area for stress concentration within the leaflet [52]. Research has shown that targeted optimization of the leaflet surface, guided by the midline curve, can significantly reduce the peak von Mises stress and lead to a smoother, more uniform stress distribution, thereby enhancing the valve's predicted durability [42]. A key finding of the present study is the observation of a strong, linear decrease (R²=0.9875) in average effective stress as the belly curve is progressively shifted from a curved profile towards a linear shape. This result demonstrates that belly curve modifications are a highly effective and predictable means of modulating stress that could play a role during development.
An important point for consideration is that a distinct deformation mode emerges at peak load, absent during the initial opening phase. This mode manifests as a progressive linear bending of up to 90° in the distal leaflet region as the belly curve shift increases from 0% to 100%. While this behavior is distinct from the high frequency "fluttering" described by De Hart et al. (2002) [51] or the complex "twisting" motion observed by Li & Sun (2016) [48], it shows a significant mechanistic similarity to the phenomenon of "folding" described by Smuts et al. (2010) [47] and identified as a primary cause of mechanical damage. Our results confirm that the concentration of maximum stress at the leaflet tip, which intensifies with increasing belly curve linearity corresponds to the bending behavior observed in this very region. This bending may represent a precursor mechanism leading to sliding and inappropriate coaptation [53]. Our study demonstrated that the belly curve shift initiates a "folding-like" bending at the leaflet tips, which in turn may trigger a failure pathway. This is a finding that begins with a stable geometric reconfiguration underload and reveals how belly curve shift fundamentally alters leaflet mechanics.
While an almost linear belly curve profile yields the lowest average stress, the physiological and functional viability of such geometry is a critical consideration. For instance, a belly curve with too little curvature can be detrimental, as it will limit the leaflets' ability to displace outward, resulting in a non-optimal GOA [42] and hindering coaptation. Moreover, studies have found that actively increasing the belly curve's curvature can paradoxically decrease the GOA [43]. This finding is supported by a direct comparison in which replacing an arc-shaped radial curve with a straight-line curve was shown to increase the average GOA [53]. Our results show that the GOA exhibits a contrasting, non-linear relationship. Interestingly, the GOA did not increase uniformly with the belly curve change to linearity; instead, it peaked at the 70% shift and then decreased sharply at 80% (see Figure 11). Notably, the GOA at the 100% shift was not maximal and remained at a sub-optimal level, indicating that this geometry is also hemodynamically less favorable. While the 100% shift geometry (linear belly curve profile) reduces overall leaflet stress, it is not only unrealistic but may also be functionally suboptimal during coaptation, as the shift shortens the leaflet length at the critical mid-curve. These findings suggest that, although increasing the linearity of the belly curve reduces stress, the optimal low-stress configuration at 100% shift does not necessarily represent the functionally optimal valve design. A truly optimal configuration must balance mechanical durability, hemodynamic performance (GOA), and effective leaflet sealing.
Our biomechanical aortic valve study showed an intricate interplay of leaflet anatomy and material properties. Anatomy and leaflet properties play essential roles in valve function that the embryo needs to balance as its valves are forming.
5. Concluding Remarks
This study employed a parametric in silico methodology to investigate the systolic biomechanics of the developing chick embryo aortic valve, focusing on the distinct roles of leaflet material properties and "belly curve" geometry. The analysis revealed that while adult human material properties rendered the embryonic valve non-functional, a computationally derived set of softer properties (Test 8, Table 1) achieved full leaflet opening, establishing a functional baseline for the HH40 developmental stage.
The study's main finding is that belly curve geometry is a critical modulator of both mechanical stress and hemodynamic performance, but these factors exist in a complex trade-off. We demonstrated that progressively linearizing the belly curve (0% to 100% shift) yields a strong, predictable decrease in average effective stress (R²=0.9875). However, this structural benefit did not correlate with optimal function. The 100% linear profile, while lowest in stress, produced a sub-optimal geometric orifice area (GOA), which peaked at a 70% shift. Furthermore, this linear geometry induced a severe, 90° folding-like bending at the leaflet tips, a deformation mode linked to mechanical damage. Thus, an optimal valve anatomy is not merely the one with the lowest stress. A viable valve must represent a functional compromise, balancing the competing demands of mechanical durability (stress), hemodynamic performance (GOA), and effective sealing (coaptation not investigated here). The parametric framework developed here, despite its limitations, provides a robust methodology for future studies exploring these functional trade-offs in both developmental biology and prosthetic valve engineering.
While this study offers important insights into the fundamental effects of a specific parameterization of the valve leaflets, it also opens new avenues for future research. Future work should aim to create more precise and realistic three-dimensional models of both the leaflets and the dynamics of the aortic root using high-resolution micro-CT (Computed Tomography) and echocardiography imaging, partially overcoming geometric limitations encountered in the present study. This high anatomical fidelity should be complemented by experimentally measured mechanical properties for the aortic tissue and leaflets, thus moving beyond the material assumptions made in the current model.
Ultimately, the goal is to integrate high-fidelity anatomy and material data into FSI analysis, which would include the fluid effects neglected in this study. Through this integrated approach, it will be possible to accurately simulate critical diastolic events, such as valve coaptation, and analyze the effect of flow-induced systolic wall shear stress on valve leaflets. Such a model will build upon the fundamental mechanical understanding gained in this parametric study to offer a more comprehensive and physiologically holistic perspective on developing valve biomechanics.
Author Contributions
O.M. and S.R.: project development; O.M.: data collection, manuscript writing, manuscript revision; S.R: manuscript revision, review and double checking. All authors have read and agreed to the published version of the manuscript.
Funding
This research was funded by the US National Institutes of Health (NIH) to S.R., grant number R01HL170097.
Acknowledgments
We extend our gratitude to Scott Howsden for his technical support regarding egg incubation, ultrasound imaging, and cryostat sectioning.
Conflicts of Interest
The authors declare no conflicts of interest.
References
- P. T. Crawford, T. C. Arbor, and B. Bordoni, “Anatomy, Thorax, Aortic Valve,” StatPearls, Sep. 2023, Accessed: Aug. 18, 2025. [Online]. Available: https://www.ncbi.nlm.nih.gov/books/NBK559384/.
- C.-P. D. ; Hsu et al., “Valve Endothelial Cell Exposure to High Levels of Flow Oscillations Exacerbates Valve Interstitial Cell Calcification,” Bioengineering 2022, Vol. 9, Page 393, vol. 9, no. 8, p. 393, Aug. 2022. [CrossRef]
- B. R. Lindman and J. N. Patel, “Multimorbidity in Older Adults with Aortic Stenosis,” Clin Geriatr Med, vol. 32, no. 2, pp. 305–314, May 2016. [CrossRef]
- A. Hulin, A. Hego, P. Lancellotti, and C. Oury, “Advances in Pathophysiology of Calcific Aortic Valve Disease Propose Novel Molecular Therapeutic Targets,” Front Cardiovasc Med, vol. 5, p. 358601, Mar. 2018. [CrossRef]
- M. V. Gomez-Stallons et al., “Calcification and extracellular matrix dysregulation in human postmortem and surgical aortic valves,” Heart, vol. 105, no. 21, pp. 1616–1621, Nov. 2019. [CrossRef]
- K. M. Kodigepalli et al., “Biology and Biomechanics of the Heart Valve Extracellular Matrix,” J Cardiovasc Dev Dis, vol. 7, no. 4, p. 57, Dec. 2020. [CrossRef]
- S. Ayoub, G. Ferrari, R. C. Gorman, J. H. Gorman, F. J. Schoen, and M. S. Sacks, “Heart Valve Biomechanics and Underlying Mechanobiology,” Compr Physiol, vol. 6, no. 4, p. 1743, Oct. 2016. [CrossRef]
- S. Arjunon, S. Rathan, H. Jo, and A. P. Yoganathan, “Aortic valve: Mechanical environment and mechanobiology,” Jul. 21, 2013, Springer. [CrossRef]
- I. El-Hamamsy, A. H. Chester, and M. H. Yacoub, “Cellular regulation of the structure and function of aortic valves,” J Adv Res, vol. 1, no. 1, pp. 5–12, Jan. 2010. [CrossRef]
- Balachandran, P. Sucosky, and A. P. Yoganathan, “Hemodynamics and Mechanobiology of Aortic Valve Inflammation and Calcification,” Int J Inflam, vol. 2011, pp. 1–15, 2011. [CrossRef]
- W. D. Merryman and F. J. Schoen, “Mechanisms of Calcification in Aortic Valve Disease: Role of Mechanokinetics and Mechanodynamics,” Curr Cardiol Rep, vol. 15, no. 5, p. 355, May 2013. [CrossRef]
- J. England and S. Loughna, “Vertebrate Embryo: An Overview of Heart Development and the Utilisation of Multiple Animal Models in Research,” Encyclopedia of Life Sciences, pp. 1–11, Mar. 2018. [CrossRef]
- K. L. Pang, M. Parnall, and S. Loughna, “Effect of altered haemodynamics on the developing mitral valve in chick embryonic heart,” J Mol Cell Cardiol, vol. 108, pp. 114–126, Jul. 2017. [CrossRef]
- M. Midgett and S. Rugonyi, “Congenital heart malformations induced by hemodynamic altering surgical interventions,” Front Physiol, vol. 5 JUL, p. 100654, Aug. 2014. [CrossRef]
- S. Baratchi et al., “Adaptation of a Mice Doppler Echocardiography Platform to Measure Cardiac Flow Velocities for Embryonic Chicken and Adult Zebrafish,” Front Bioeng Biotechnol, vol. 7, p. 445257, May 2019. [CrossRef]
- L. M. Goddard et al., “Hemodynamic Forces Sculpt Developing Heart Valves through a KLF2-WNT9B Paracrine Signaling Axis,” Dev Cell, vol. 43, no. 3, pp. 274-289.e5, Nov. 2017. [CrossRef]
- S. Goenezen, V. K. Chivukula, M. Midgett, L. Phan, and S. Rugonyi, “4D subject-specific inverse modeling of the chick embryonic heart outflow tract hemodynamics,” Biomech Model Mechanobiol, vol. 15, no. 3, pp. 723–743, Jun. 2016. [CrossRef]
- H. E. Salman and H. C. Yalcin, “Computational Modeling of Blood Flow Hemodynamics for Biomechanical Investigation of Cardiac Development and Disease,” Journal of Cardiovascular Development and Disease 2021, Vol. 8, Page 14, vol. 8, no. 2, p. 14, Jan. 2021. [CrossRef]
- K. L. Pang, M. Parnall, and S. Loughna, “Effect of altered haemodynamics on the developing mitral valve in chick embryonic heart,” J Mol Cell Cardiol, vol. 108, pp. 114–126, Jul. 2017. [CrossRef]
- L. M. Goddard et al., “Hemodynamic Forces Sculpt Developing Heart Valves through a KLF2-WNT9B Paracrine Signaling Axis,” Dev Cell, vol. 43, no. 3, pp. 274-289.e5, Nov. 2017. [CrossRef]
- ManoJ. Thubrikar, “The Aortic Valve,” pp. 8–9, 2018.
- Y. Dabiri, J. Ronsky, I. Ali, A. Basha, A. Bhanji, and K. Narine, “Effects of Leaflet Design on Transvalvular Gradients of Bioprosthetic Heart Valves,” Cardiovasc Eng Technol, vol. 7, no. 4, pp. 363–373, Dec. 2016. [CrossRef]
- J. Zhou, Y. Wu, L. Chen, T. Li, Y. Xiong, and Y. Chen, “Numerical Simulation Studies on the Design of the Prosthetic Heart Valves Belly Curves,” Fluids 2024, Vol. 9, Page 209, vol. 9, no. 9, p. 209, Sep. 2024. [CrossRef]
- Y. Dabiri and K. Narine, “Roles of the Leaflet Geometry in the Structural Deterioration of Bioprosthetic Aortic Valves,” May 2025. [CrossRef]
- S. Kaule et al., “Influence of leaflet geometry on hydrodynamic performance of transcatheter aortic valve prostheses,” Current Directions in Biomedical Engineering, vol. 5, no. 1, pp. 473–475, Sep. 2019. [CrossRef]
- H. E. Salman, L. Saltik, and H. C. Yalcin, “Computational Analysis of Wall Shear Stress Patterns on Calcified and Bicuspid Aortic Valves: Focus on Radial and Coaptation Patterns,” Fluids 2021, Vol. 6, Page 287, vol. 6, no. 8, p. 287, Aug. 2021. [CrossRef]
- A. A. Bakhaty, S. Govindjee, and M. R. K. Mofrad, “A Coupled Multiscale Approach to Modeling Aortic Valve Mechanics in Health and Disease,” Applied Sciences 2021, Vol. 11, Page 8332, vol. 11, no. 18, p. 8332, Sep. 2021. [CrossRef]
- A. Gilmanov, H. Stolarski, and F. Sotiropoulos, “Flow-Structure Interaction Simulations of the Aortic Heart Valve at Physiologic Conditions: The Role of Tissue Constitutive Model,” J Biomech Eng, vol. 140, no. 4, Apr. 2018. [CrossRef]
- V. Flamini, A. DeAnda, and B. E. Griffith, “Immersed boundary-finite element model of fluid–structure interaction in the aortic root,” Theor Comput Fluid Dyn, vol. 30, no. 1–2, pp. 139–164, Apr. 2016. [CrossRef]
- A. Hasan, E. M. Kolahdouz, A. Enquobahrie, T. G. Caranasos, J. P. Vavalle, and B. E. Griffith, “Image-based immersed boundary model of the aortic root,” Med Eng Phys, vol. 47, pp. 72–84, Sep. 2017. [CrossRef]
- O. Bialas and J. Zmudzki, “Fea of displacements and stresses of aortic heart valve leaflets during the opening phase,” Journal of Achievements in Materials and Manufacturing Engineering, vol. 92, no. 1–2, pp. 29–35, Jan. 2019. [CrossRef]
- A. G. Kuchumov, A. Makashova, S. Vladimirov, V. Borodin, and A. Dokuchaeva, “Fluid–Structure Interaction Aortic Valve Surgery Simulation: A Review,” Fluids 2023, Vol. 8, Page 295, vol. 8, no. 11, p. 295, Nov. 2023. [CrossRef]
- V. Hamburger and H. L. Hamilton, “A SERIES O F NORMAL STAGES I N THE DEVELOPMENT O F THE CHICK EMBRYO,” 1992.
- J. G. Wittig and A. Münsterberg, “The Early Stages of Heart Development: Insights from Chicken Embryos,” Journal of Cardiovascular Development and Disease 2016, Vol. 3, Page 12, vol. 3, no. 2, p. 12, Apr. 2016. [CrossRef]
- R. E. Poelmann and A. C. Gittenberger-de Groot, “Hemodynamics in Cardiac Development,” Journal of Cardiovascular Development and Disease 2018, Vol. 5, Page 54, vol. 5, no. 4, p. 54, Nov. 2018. [CrossRef]
- A. M. Tango, J. Salmonsmith, A. Ducci, and G. Burriesci, “Validation and Extension of a Fluid–Structure Interaction Model of the Healthy Aortic Valve,” Cardiovasc Eng Technol, vol. 9, no. 4, pp. 739–751, Dec. 2018. [CrossRef]
- M. J. Lohr, G. P. Sugerman, S. Kakaletsis, E. Lejeune, and M. K. Rausch, “An introduction to the Ogden model in biomechanics: Benefits, implementation tools and limitations,” Philosophical Transactions of the Royal Society A: Mathematical, Physical and Engineering Sciences, vol. 380, no. 2234, Oct. 2022. [CrossRef]
- J. Yao, V. D. Varner, L. L. Brilli, J. M. Young, L. A. Taber, and R. Perucchio, “Viscoelastic material properties of the myocardium and cardiac jelly in the looping chick heart,” J Biomech Eng, vol. 134, no. 2, 2012. [CrossRef]
- K. J. Bathe, Finite Element Procedures. 1996.
- Dassault Systèmes, “ABAQUS 2023 Documentation: Effects of damping on the stable time increment in ABAQUS/Explicit. Section 20.1.1,” 2023.
- R. Haj-Ali, G. Marom, S. Ben Zekry, M. Rosenfeld, and E. Raanani, “A general three-dimensional parametric geometry of the native aortic valve and root for biomechanical modeling,” J Biomech, vol. 45, no. 14, pp. 2392–2397, 2012. [CrossRef]
- S. H. Gharaie and Y. Morsi, “A novel design of a polymeric aortic valve,” International Journal of Artificial Organs, vol. 38, no. 5, pp. 259–270, Jun. 2015. [CrossRef]
- F. Xu et al., “A framework for designing patient-specific bioprosthetic heart valves using immersogeometric fluid–structure interaction analysis,” Int J Numer Method Biomed Eng, vol. 34, no. 4, Apr. 2018. [CrossRef]
- M. Saraeian, A. M. Corpuz, M. C. Hsu, and A. Krishnamurthy, “PARAVALVE: An open source framework for parametric design and fluid–structure interaction simulation of bioprosthetic heart valves in patient-specific aortic geometries,” Comput Aided Geom Des, vol. 120, Jul. 2025. [CrossRef]
- R. Haj-Ali, G. Marom, S. Ben Zekry, M. Rosenfeld, and E. Raanani, “A general three-dimensional parametric geometry of the native aortic valve and root for biomechanical modeling,” J Biomech, vol. 45, no. 14, pp. 2392–2397, Sep. 2012. [CrossRef]
- G. Pase, E. Brinkhuis, T. De Vries, J. Kosinka, T. Willems, and C. Bertoglio, “A parametric geometry model of the aortic valve for subject-specific blood flow simulations using a resistive approach,” Biomech Model Mechanobiol, vol. 22, no. 3, pp. 987–1002, Jun. 2023. [CrossRef]
- A. N. Smuts, D. C. Blaine, C. Scheffer, H. Weich, A. F. Doubell, and K. H. Dellimore, “Application of finite element analysis to the design of tissue leaflets for a percutaneous aortic valve,” J Mech Behav Biomed Mater, vol. 4, no. 1, pp. 85–98, Jan. 2011. [CrossRef]
- K. Li and W. Sun, “Simulated transcatheter aortic valve deformation: A parametric study on the impact of leaflet geometry on valve peak stress,” Int J Numer Method Biomed Eng, vol. 33, no. 3, Mar. 2017. [CrossRef]
- S. Travaglino et al., “Computational optimization study of transcatheter aortic valve leaflet design using porcine and bovine leaflets,” J Biomech Eng, vol. 142, no. 1, Jan. 2020. [CrossRef]
- P. Corso and D. Obrist, “On the role of aortic valve architecture for physiological hemodynamics and valve replacement, Part I: Flow configuration and vortex dynamics,” Comput Biol Med, vol. 176, Jun. 2024. [CrossRef]
- J. De Hart, F. P. T. Baaijens, G. W. M. Peters, and P. J. G. Schreurs, “A computational fluid-structure interaction analysis of a fiber-reinforced stentless aortic valve,” J Biomech, vol. 36, no. 5, pp. 699–712, May 2003. [CrossRef]
- S. Wertheimer, L. Habayib, R. Nudelman, S. Richter, and H. A. Rami, “Soft-coral collagen fiber biocomposites for aortic valve leaflet engineering: From material design to computational analysis,” Mechanics of Advanced Materials and Structures, 2025. [CrossRef]
- N. Sarrafzadeh-Ghadimi, F. Ghalichi, H. Niroomand-Oscuii, and N. Fatouraee, “Design of an aortic polymeric valve with asymmetric leaflets and evaluation of its performance by finite element method,” Comput Biol Med, vol. 145, Jun. 2022. [CrossRef]
Figure 1.
Doppler ultrasound–based acquisition and processing of aortic velocity over the cardiac cycle from HH40 (Day 14) chick embryo. A) Imaging setup and location of the Doppler sample volume (gate) positioned distal to the aortic valve, with an insonation angle of about 35 degrees. B) Pulsed-wave Doppler velocity waveform. C) Aortic blood flow velocity from a single cardiac cycle extracted from the Doppler waveform (left) and its corresponding pressure-time profile obtained using the simplified Bernoulli equation (right), used as a load boundary condition in FEA.
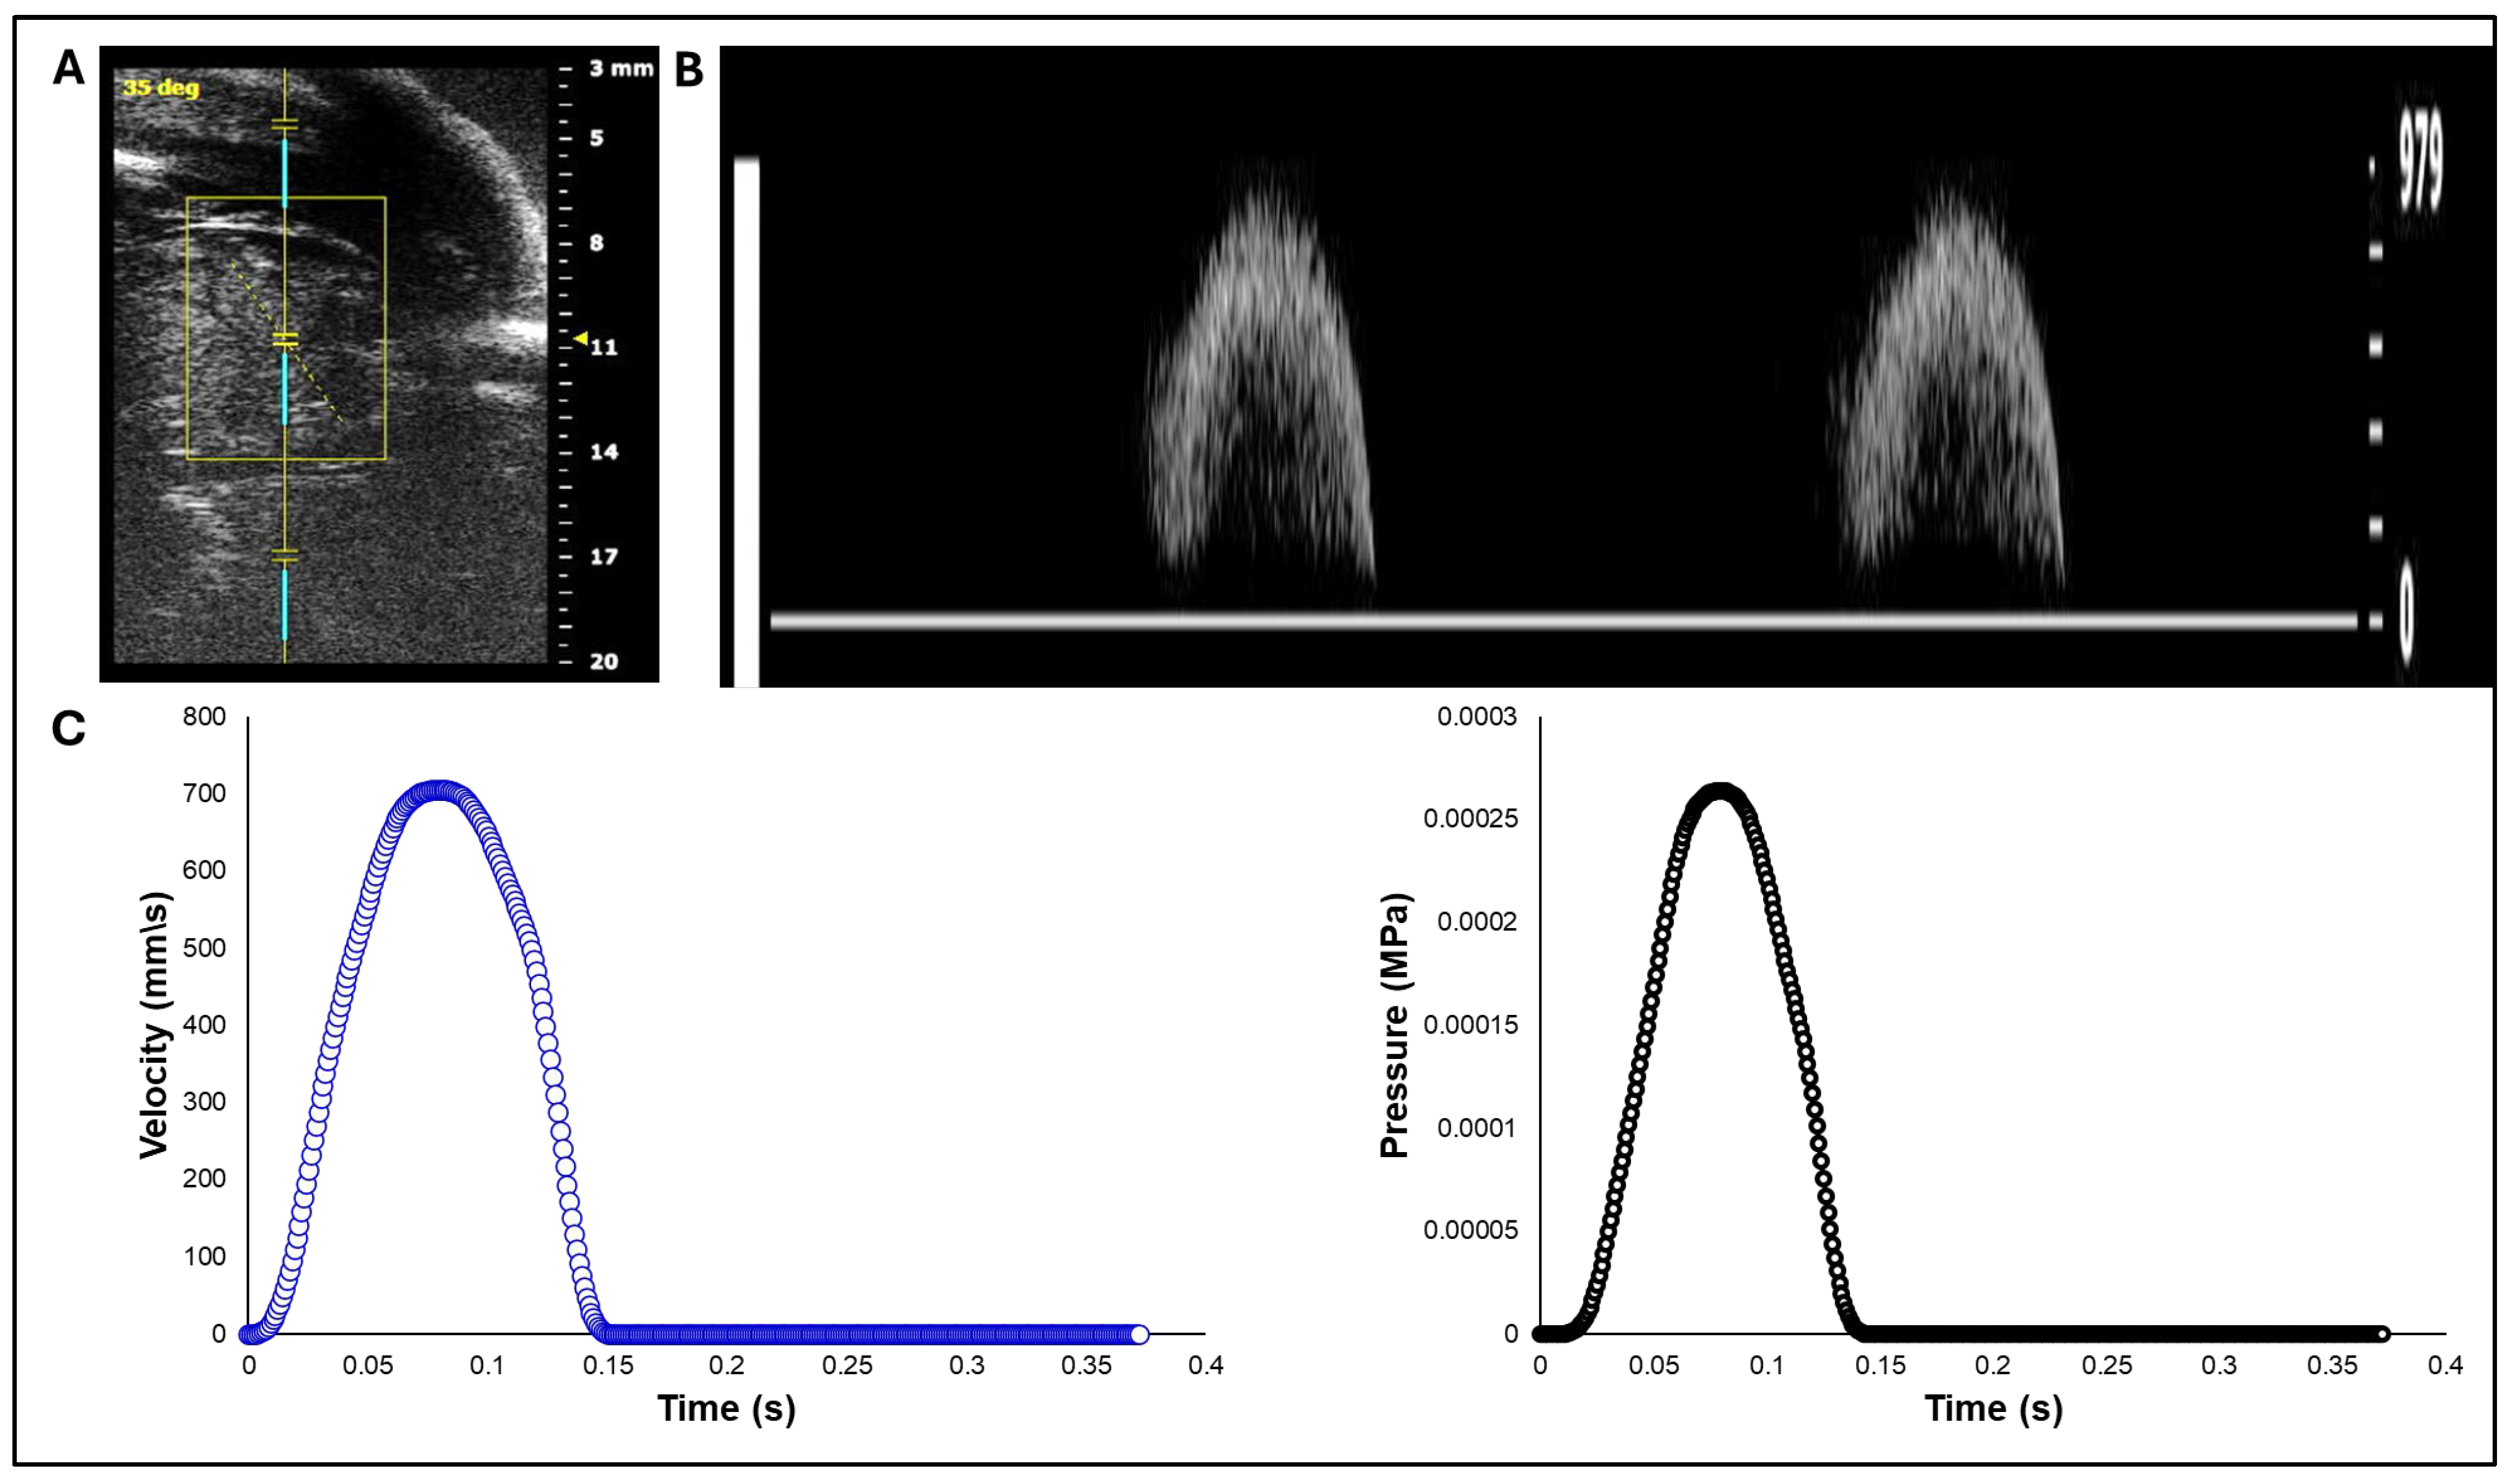
Figure 2.
Images of the chick embryo heart at HH40. A) 3D micro-CT image of the HH40 heart showing the approximate cryostat section plane location and anatomical landmarks including the right ventricle (RV), left ventricle (LV), left atrium (LA), aorta (AO), right atrium (RA), right brachiocephalic artery (RBA), and left brachiocephalic artery (LBA). B) Representative cryostat section image. C) Three registered cryostat sections, each showing the aortic valve leaflet profile. The belly curve profile was extracted from each of the three images and subsequently averaged. The resulting mean profile is displayed as a blue line overlaid on the three sections for comparison.
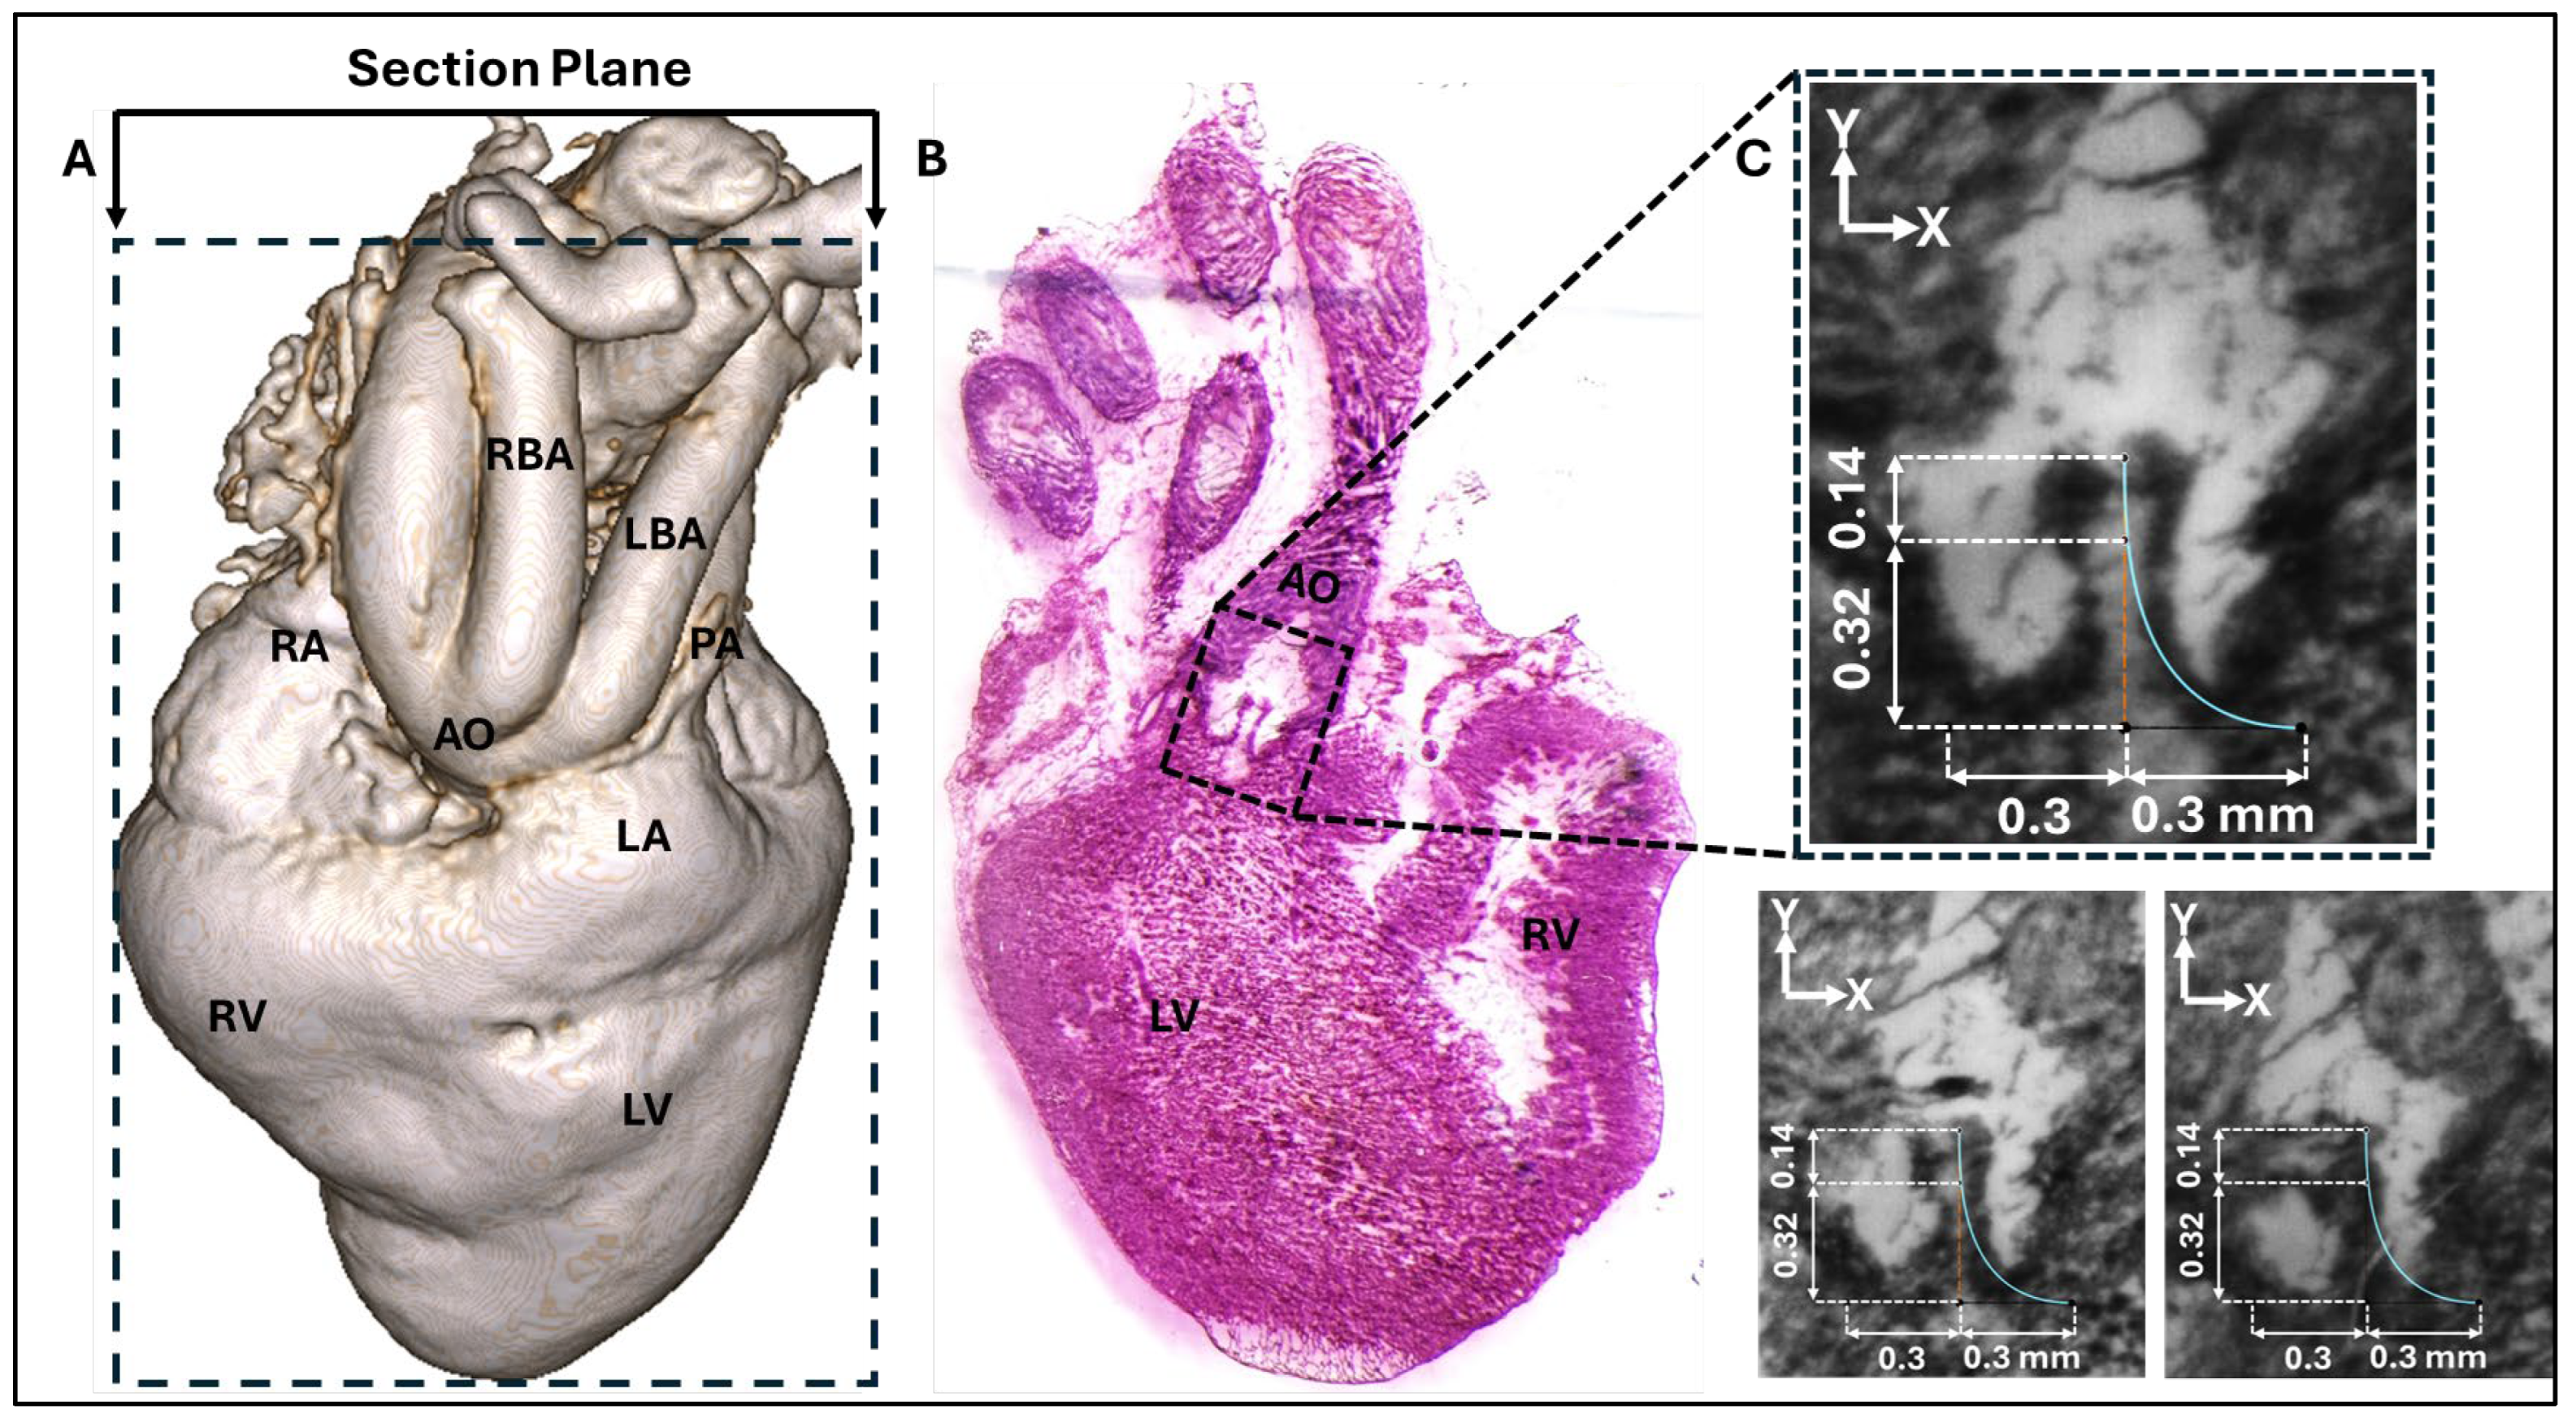
Figure 3.
Geometric construction of the HH40 aortic valve parametric model. A) 3D modeling steps based on the belly curve (middle leaflet curve) extracted from cryostat images. By construction, the belly curve divides each leaflet into two identical halves but also defines a region of elevated stress, as the curvature along this line becomes much larger than in the rest of the leaflet. B) Comparative visualization of chick embryo (left) and human (right) aortic valves scaled to the same annulus radius (0.3 mm).
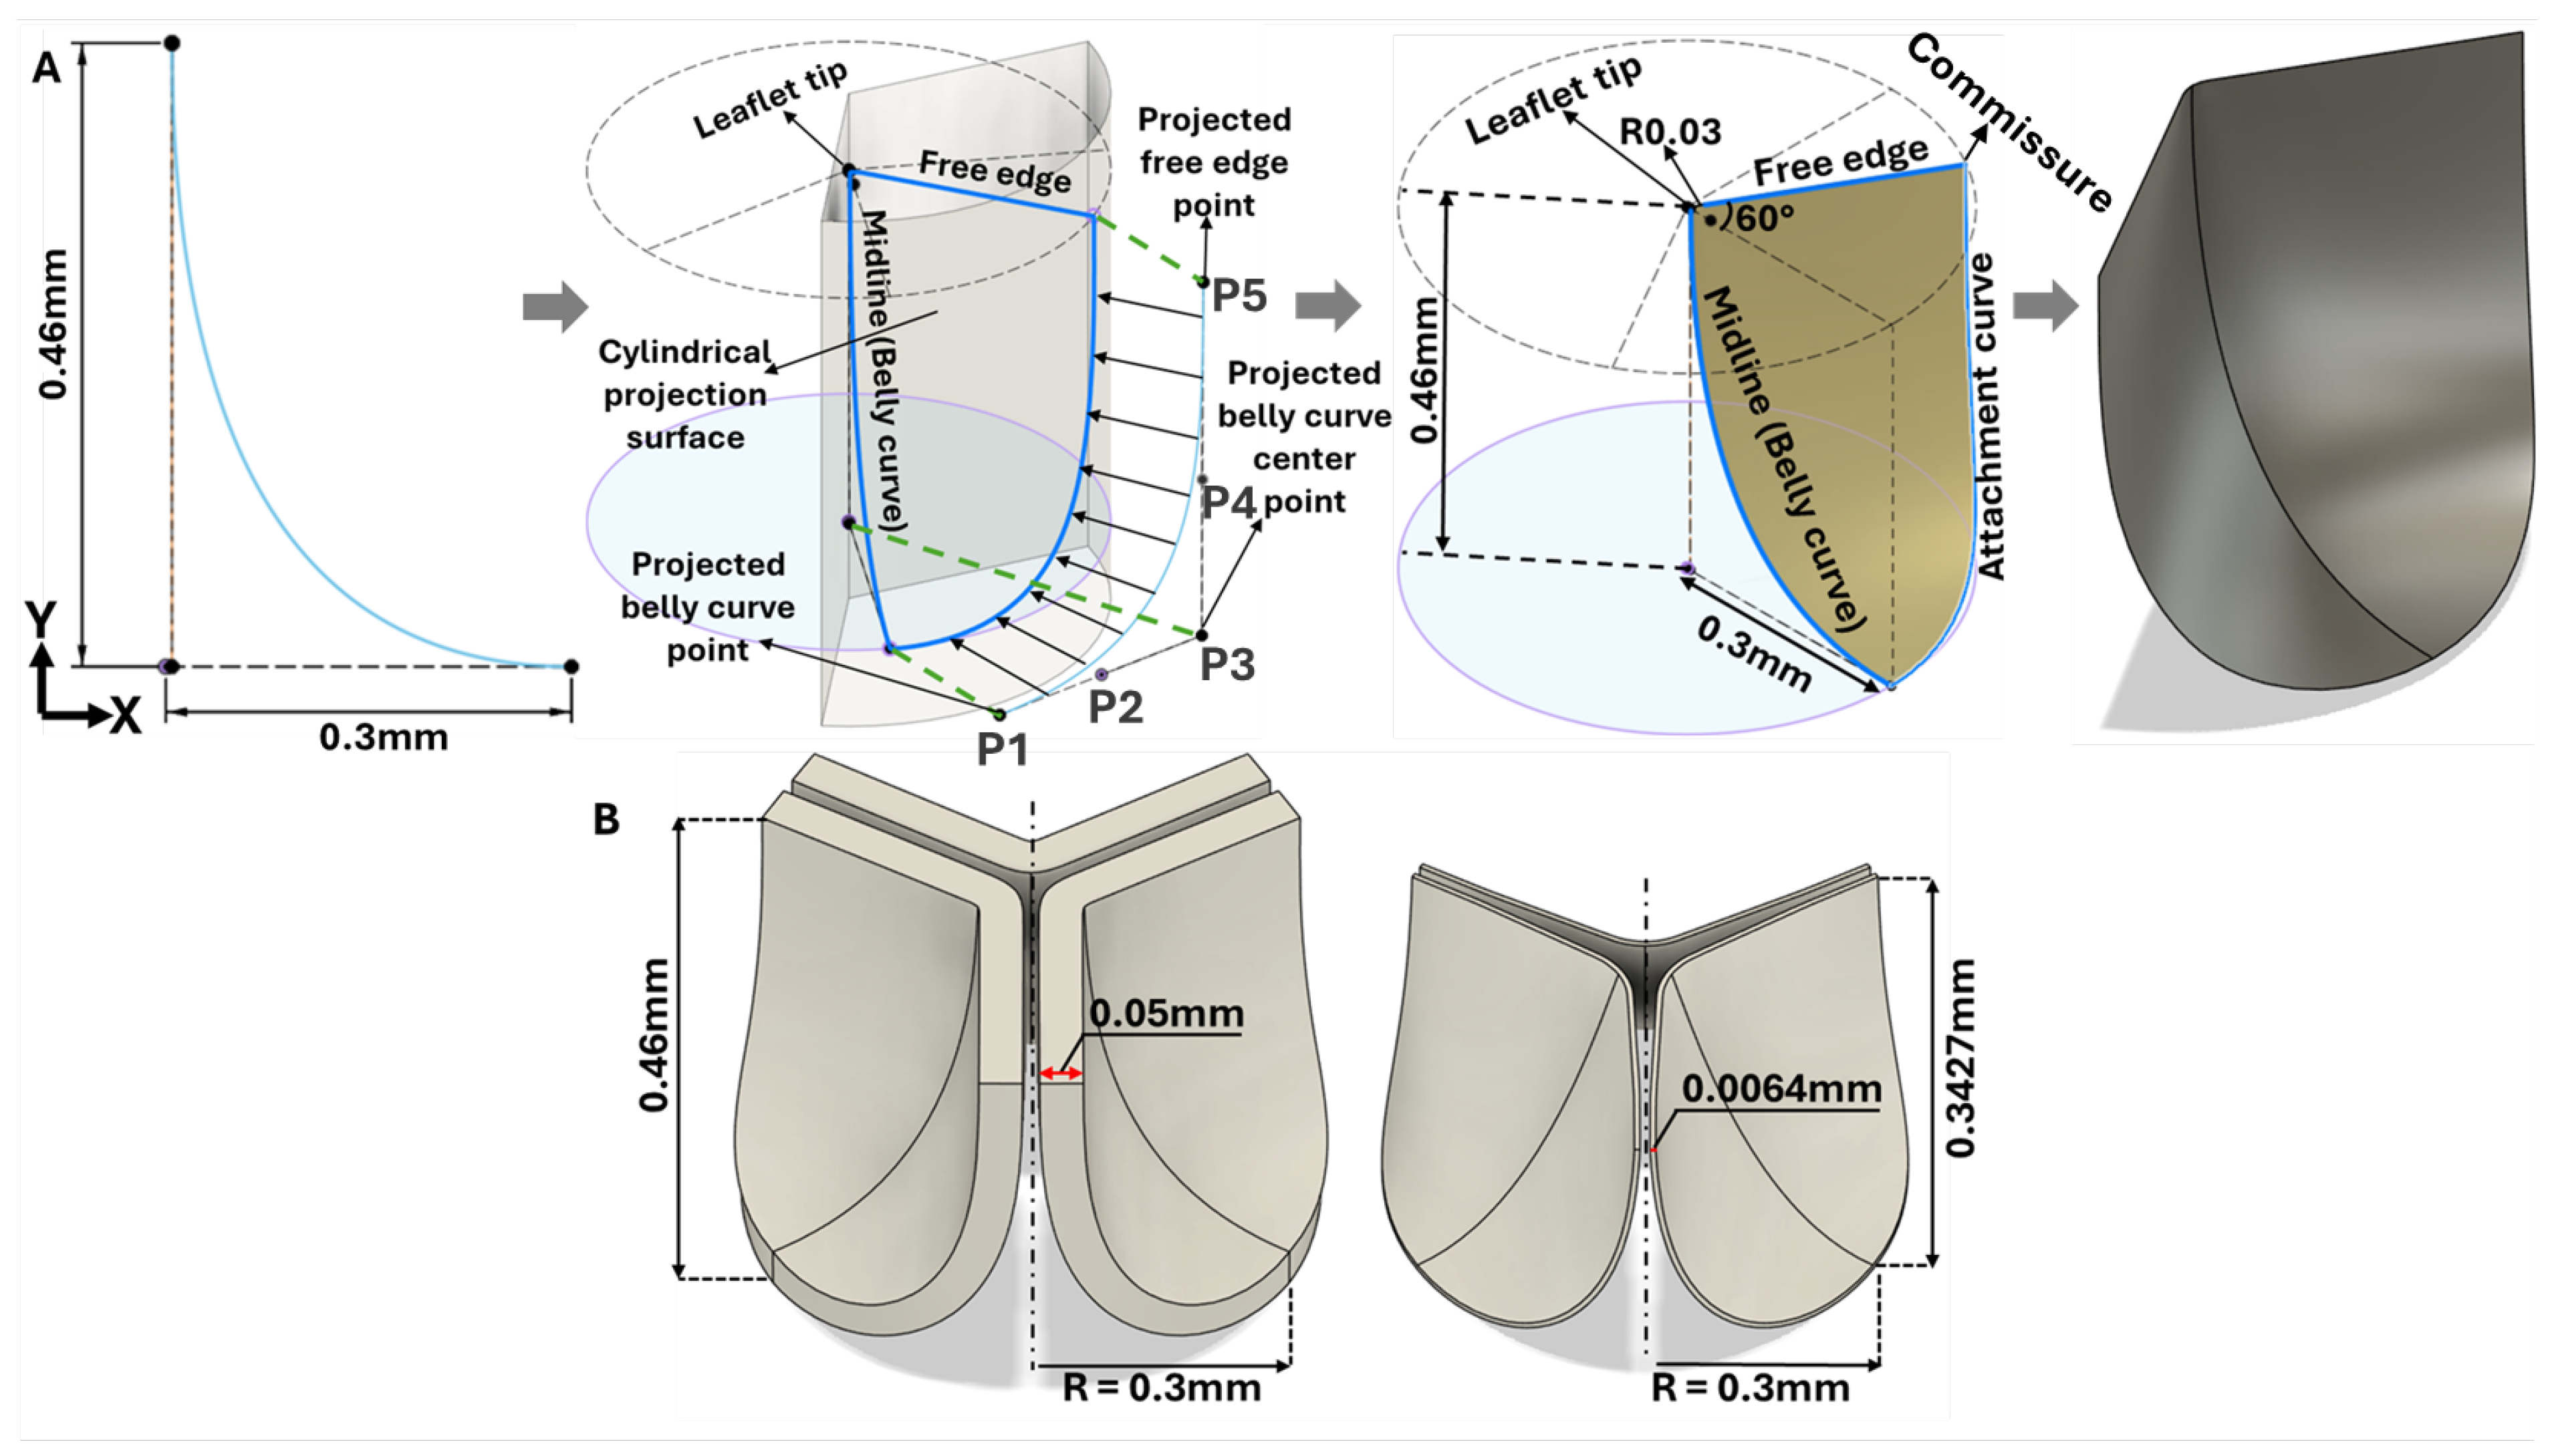
Figure 4.
Generation of distinct aortic valve leaflet anatomies. The parametric leaflet geometries were altered by systematically displacing the middle point of the three-point Bézier curve representing the belly curve ("S", blue) toward the maximum annulus radius. The displacement was performed in 10% increments from 0% to 100%. A total of 11 leaflet surface geometries were generated: six (0–50%) in the top row and five (60–100%) in the bottom row. At the end of the second row, a 3D model of the aortic valve is also shown, with the highlighted blue surface corresponding to the leaflet region depicted in all 11 geometries.
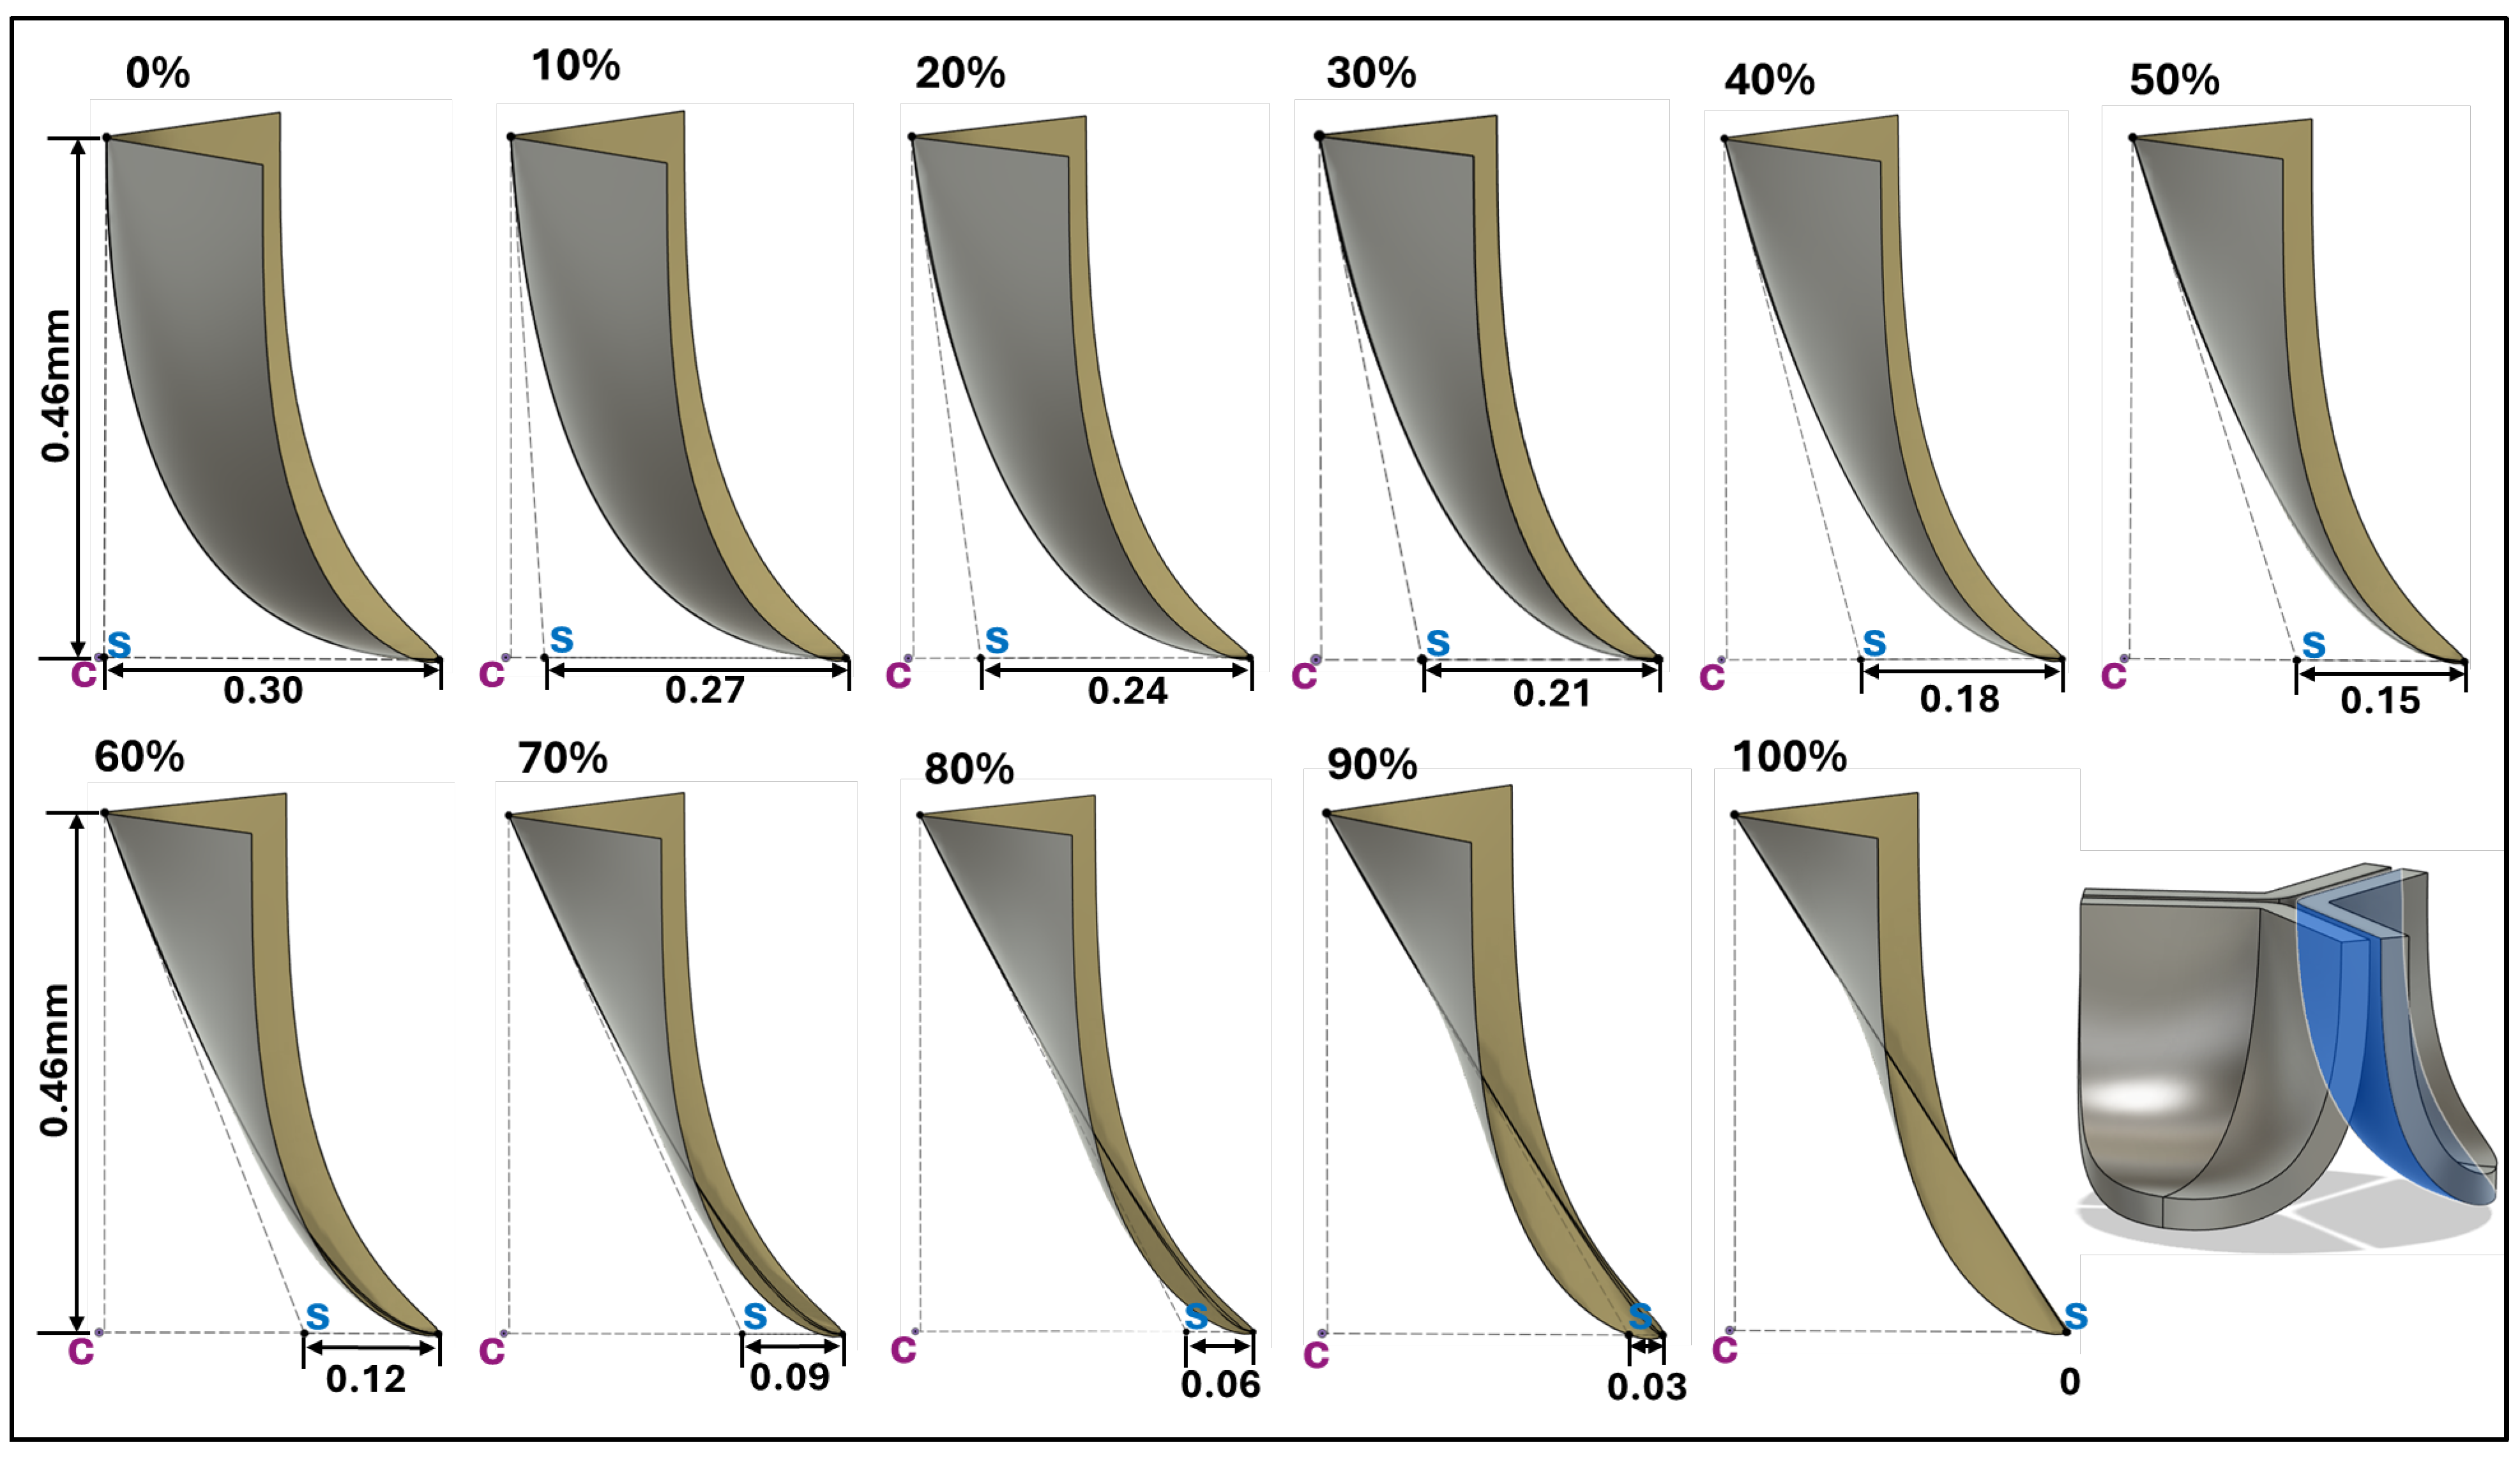
Figure 5.
FEA boundary conditions. A) Visualization of the applied boundary conditions on the aortic valve model, including frictionless face-to-face contact (green inner surfaces) and fixed side constraints (also in green). B) Transient pressure–time profile applied normal to the inner (ventricularis) valve surfaces and used as the loading condition in the finite element simulations.
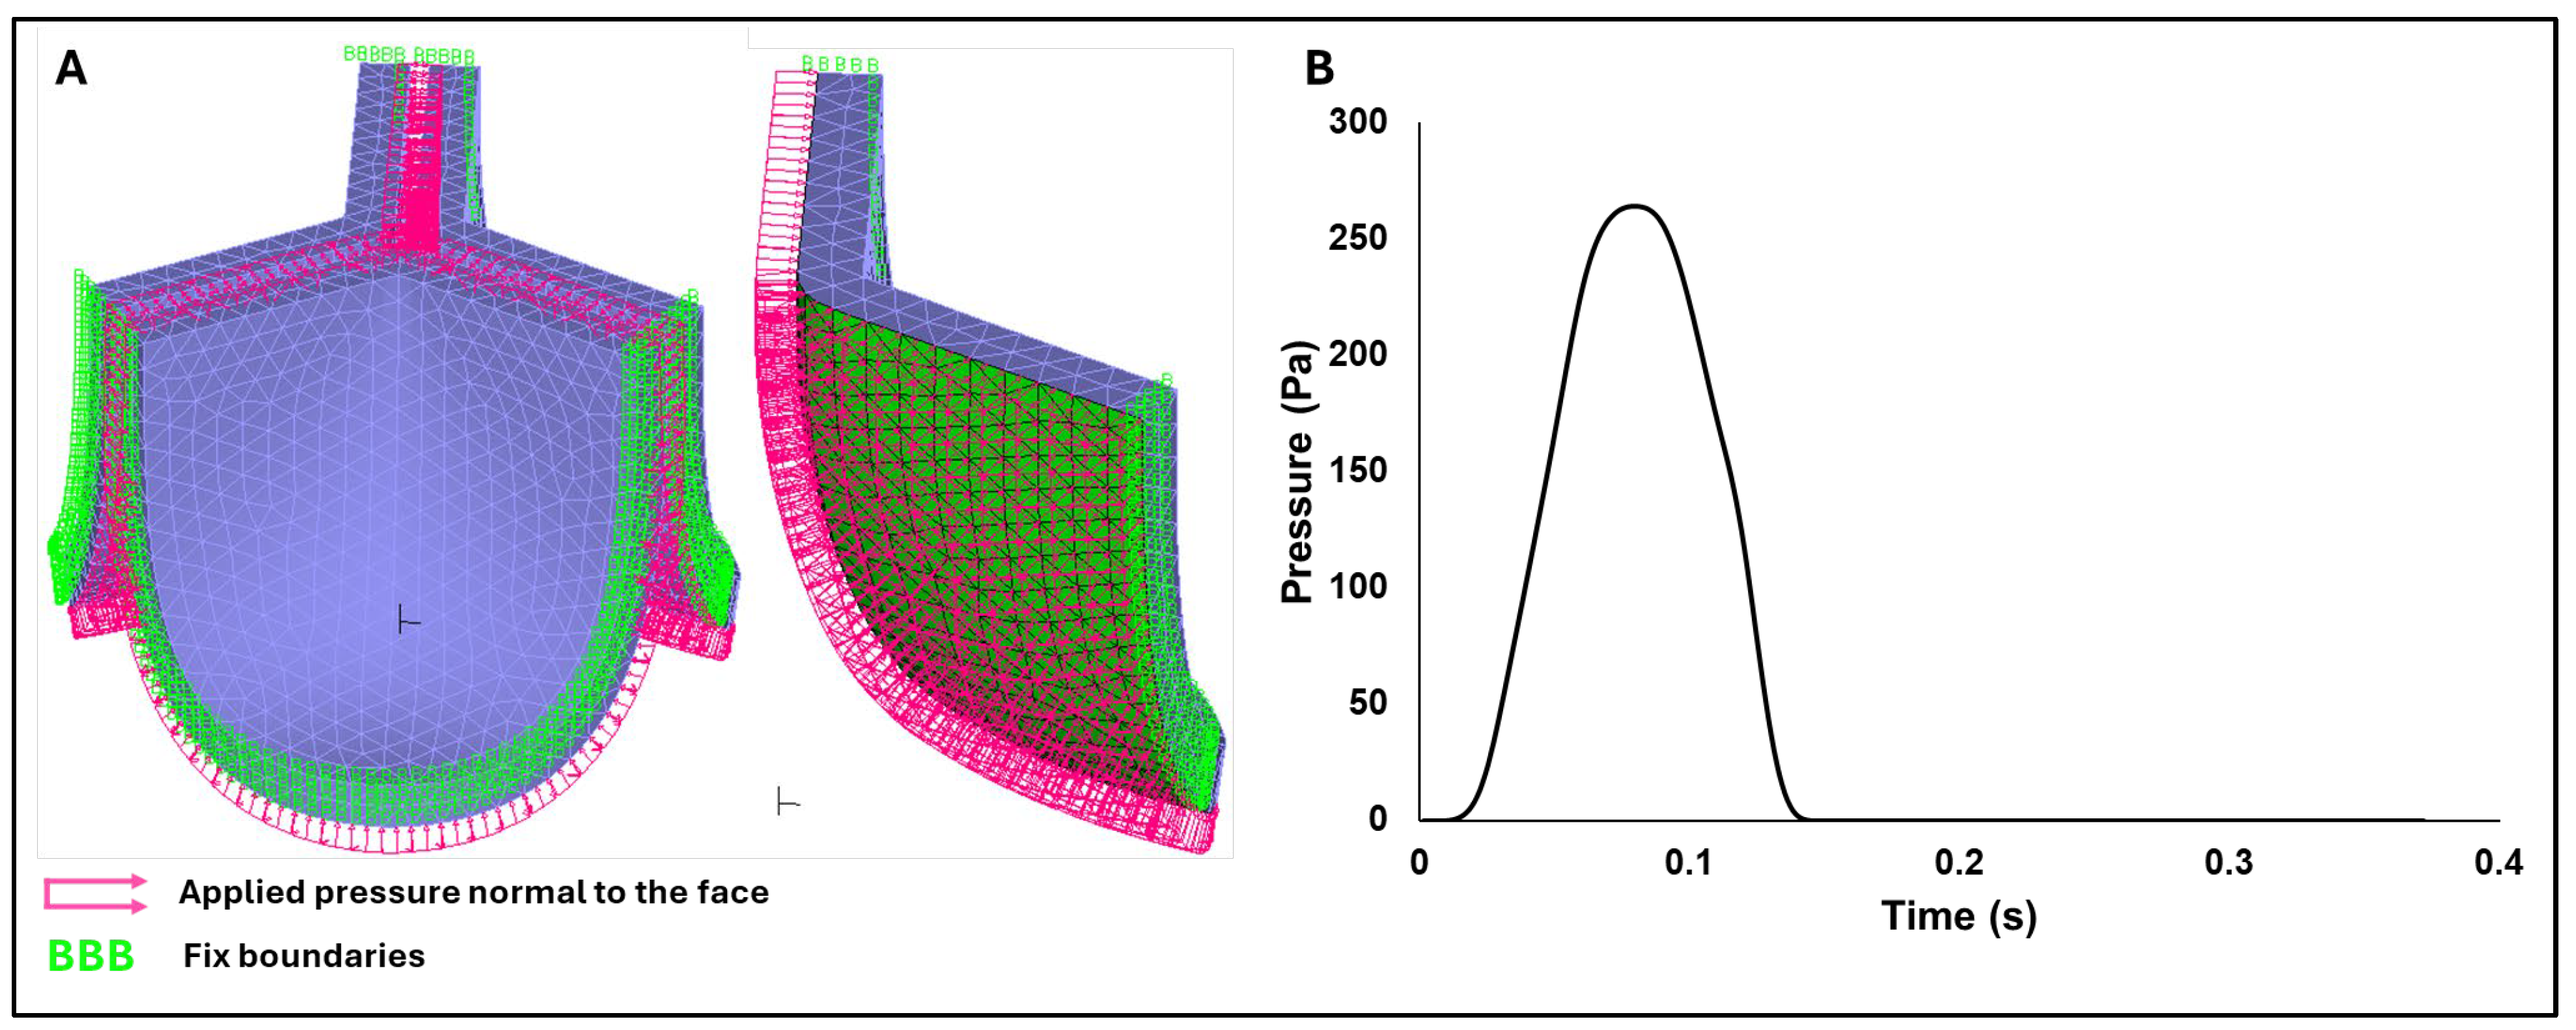
Figure 6.
Initial mesh convergence analysis. A) Tetrahedral mesh configurations generated on the default (non-shifted) valve geometry with four different element sizes (ES): 0.030 mm, 0.025 mm, 0.0218 mm, and 0.0191 mm. B) Time-dependent displacement magnitude at the tip of the valve leaflet computed during initial mesh convergence analysis. The measurement point (leaflet tip) is indicated in red on the aortic valve mesh shown below the plot.
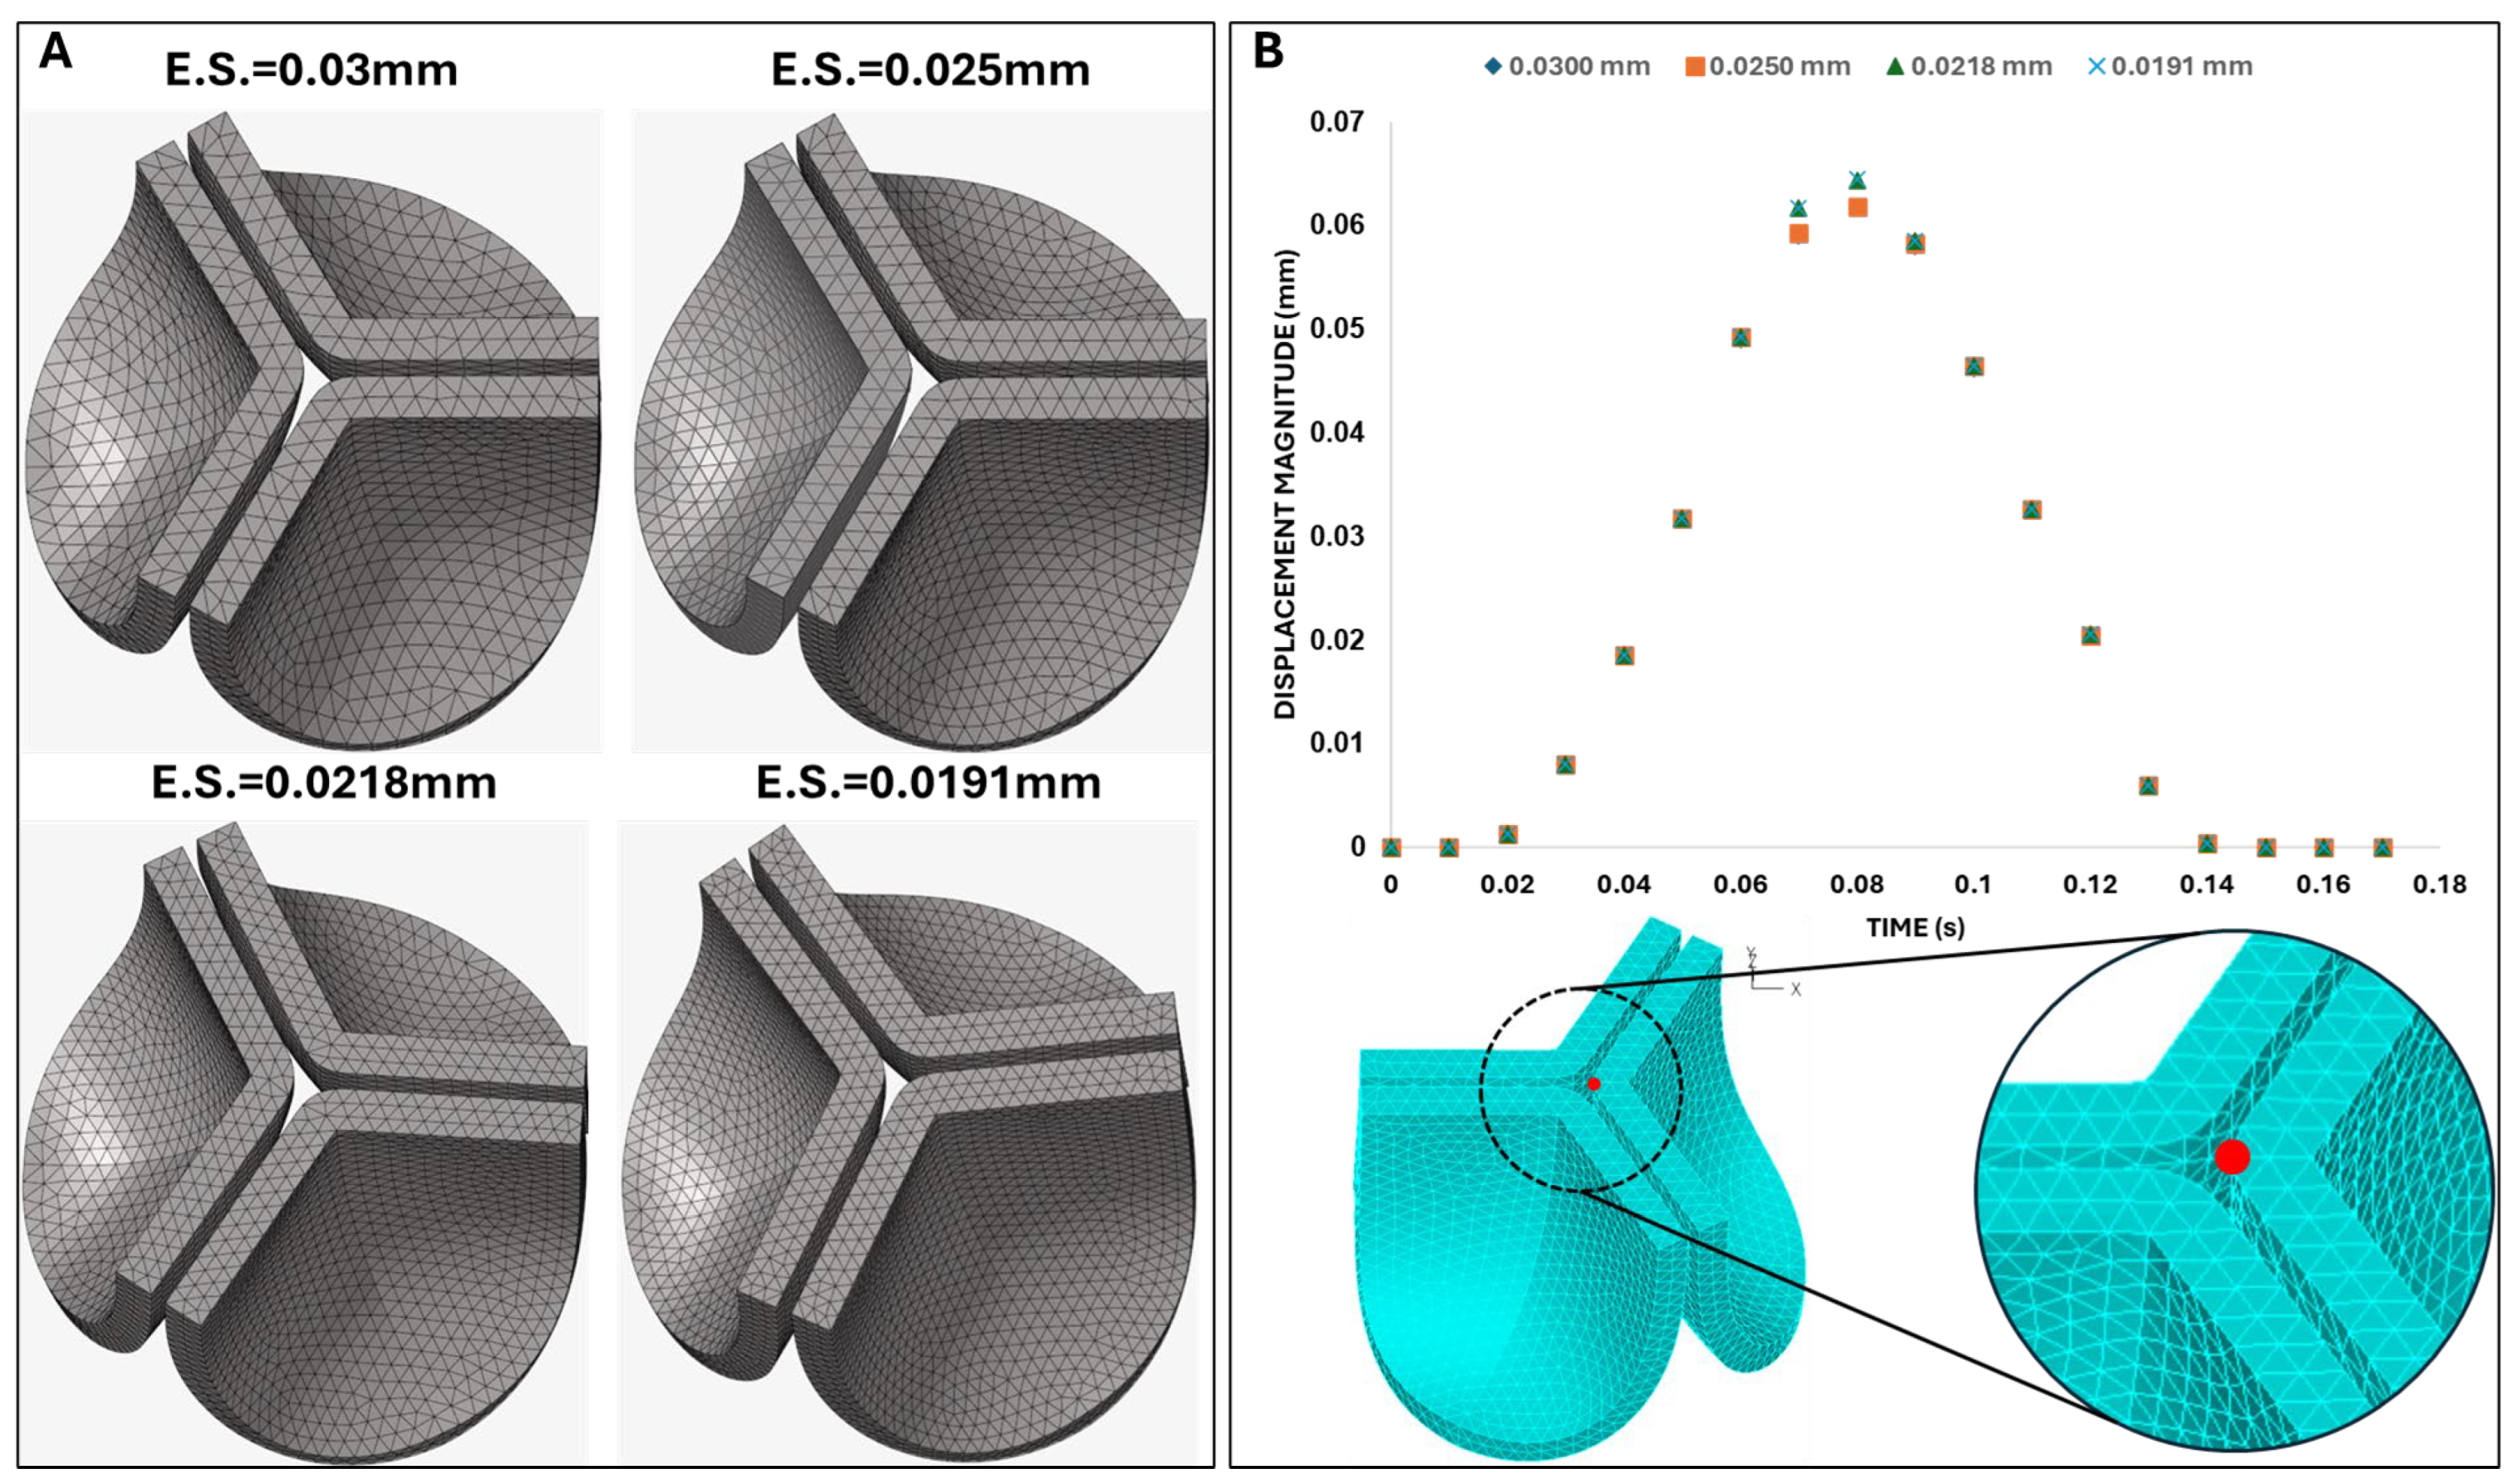
Figure 7.
Valve leaflet configurations at peak blood pressure (t = 0.08s). Columns indicate progressively softer (less stiff) material properties, starting from adult human leaflet properties (from [36]). Top: perspective views of the aortic valve; Bottom: Top view of valve leaflets for selected material cases tested during sensitivity analysis. The comparison illustrates the effect of varying material properties on valve opening and leaflet displacement.
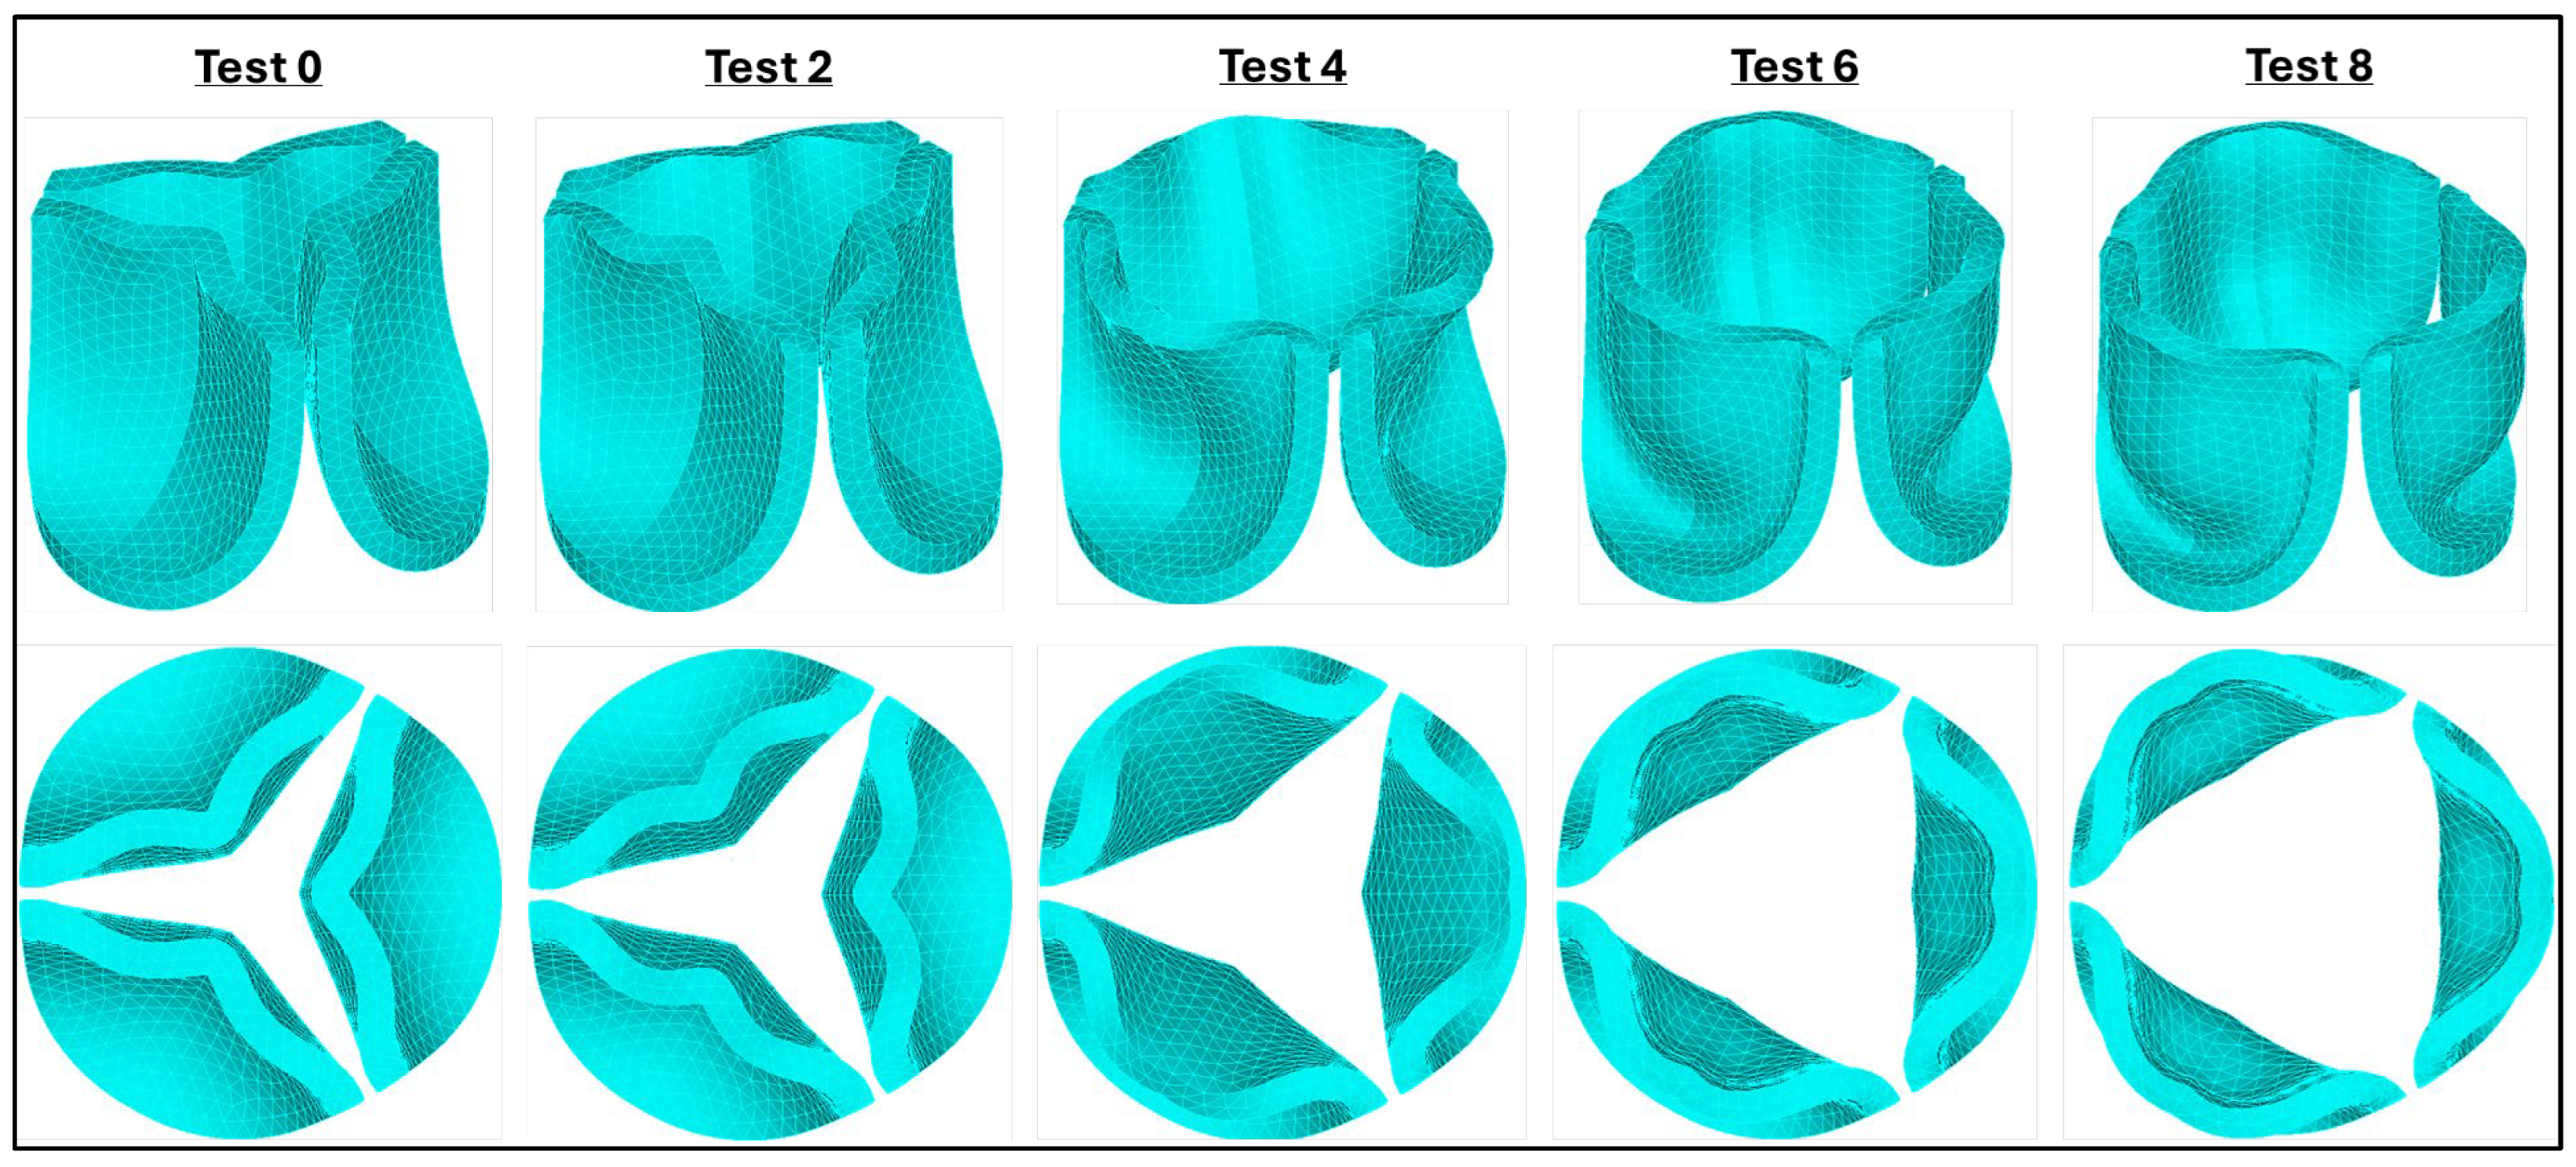
Figure 8.
Aortic valve configuration and leaflet tip displacement during the second (final) mesh convergence analysis. Top-view comparisons of aortic valve deformation patterns for different element sizes (ES = 0.030 mm, 0.025 mm, 0.0218 mm, and 0.0191 mm) during the transition phases. Left column: valve leaflet deformation during the opening phase (t = 0.031 s). Right column: corresponding deformation during the closing phase (t = 0.131 s). Center: time-dependent leaflet tip displacement magnitude for all element sizes, used to evaluate convergence behavior. Mesh refinement beyond 0.025 mm produced negligible overall changes in displacement/configuration over the cardiac cycle and was used in further analyses.
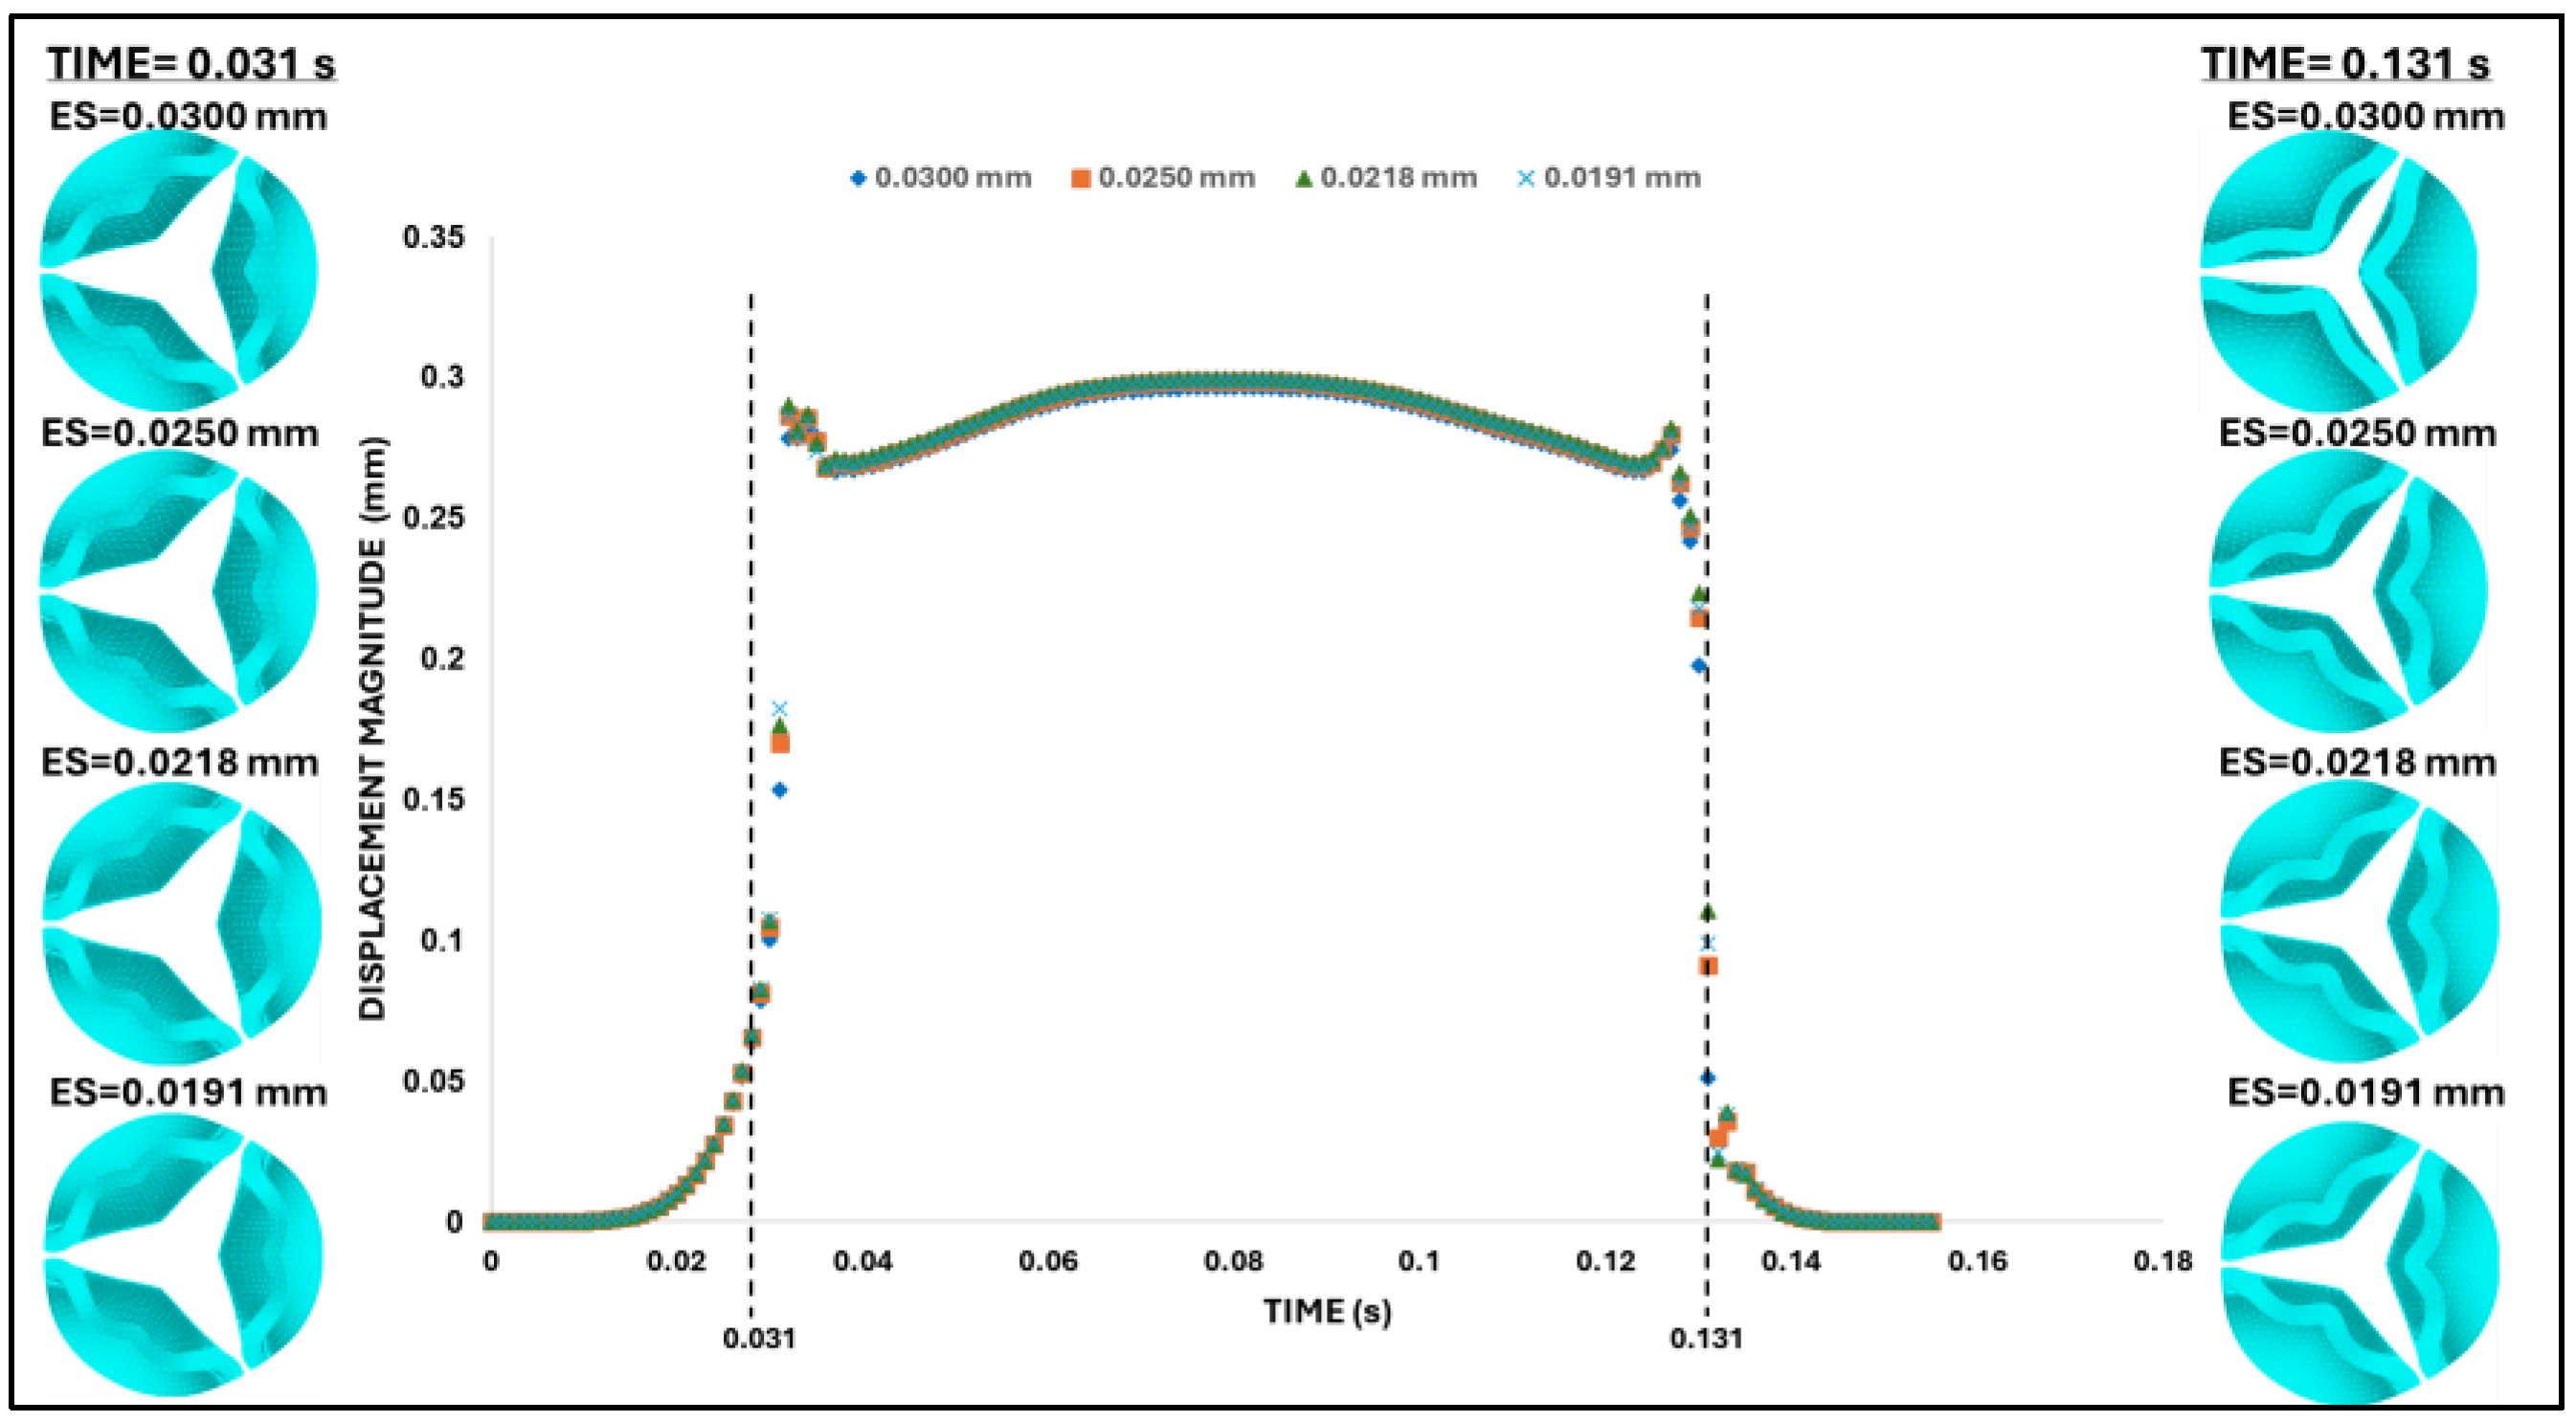
Figure 9.
Damping sensitivity analysis. Displacements in the X-direction (on the belly curve plane) quantified for the leaflet tip (red-marked point on the aortic valve leaflet) during valve opening and closing simulated with different mass-proportional damping values (α). The left graph shows the valve opening response (between t = 0.02 s and 0.05 s), while the right graph focuses on the valve closing interval (between t = 0.12 s and 0.14 s). Both graphs indicate that the system is effectively damped when α = 1911.7880 s⁻¹ (highlighted in red), corresponding to 20% critical damping.
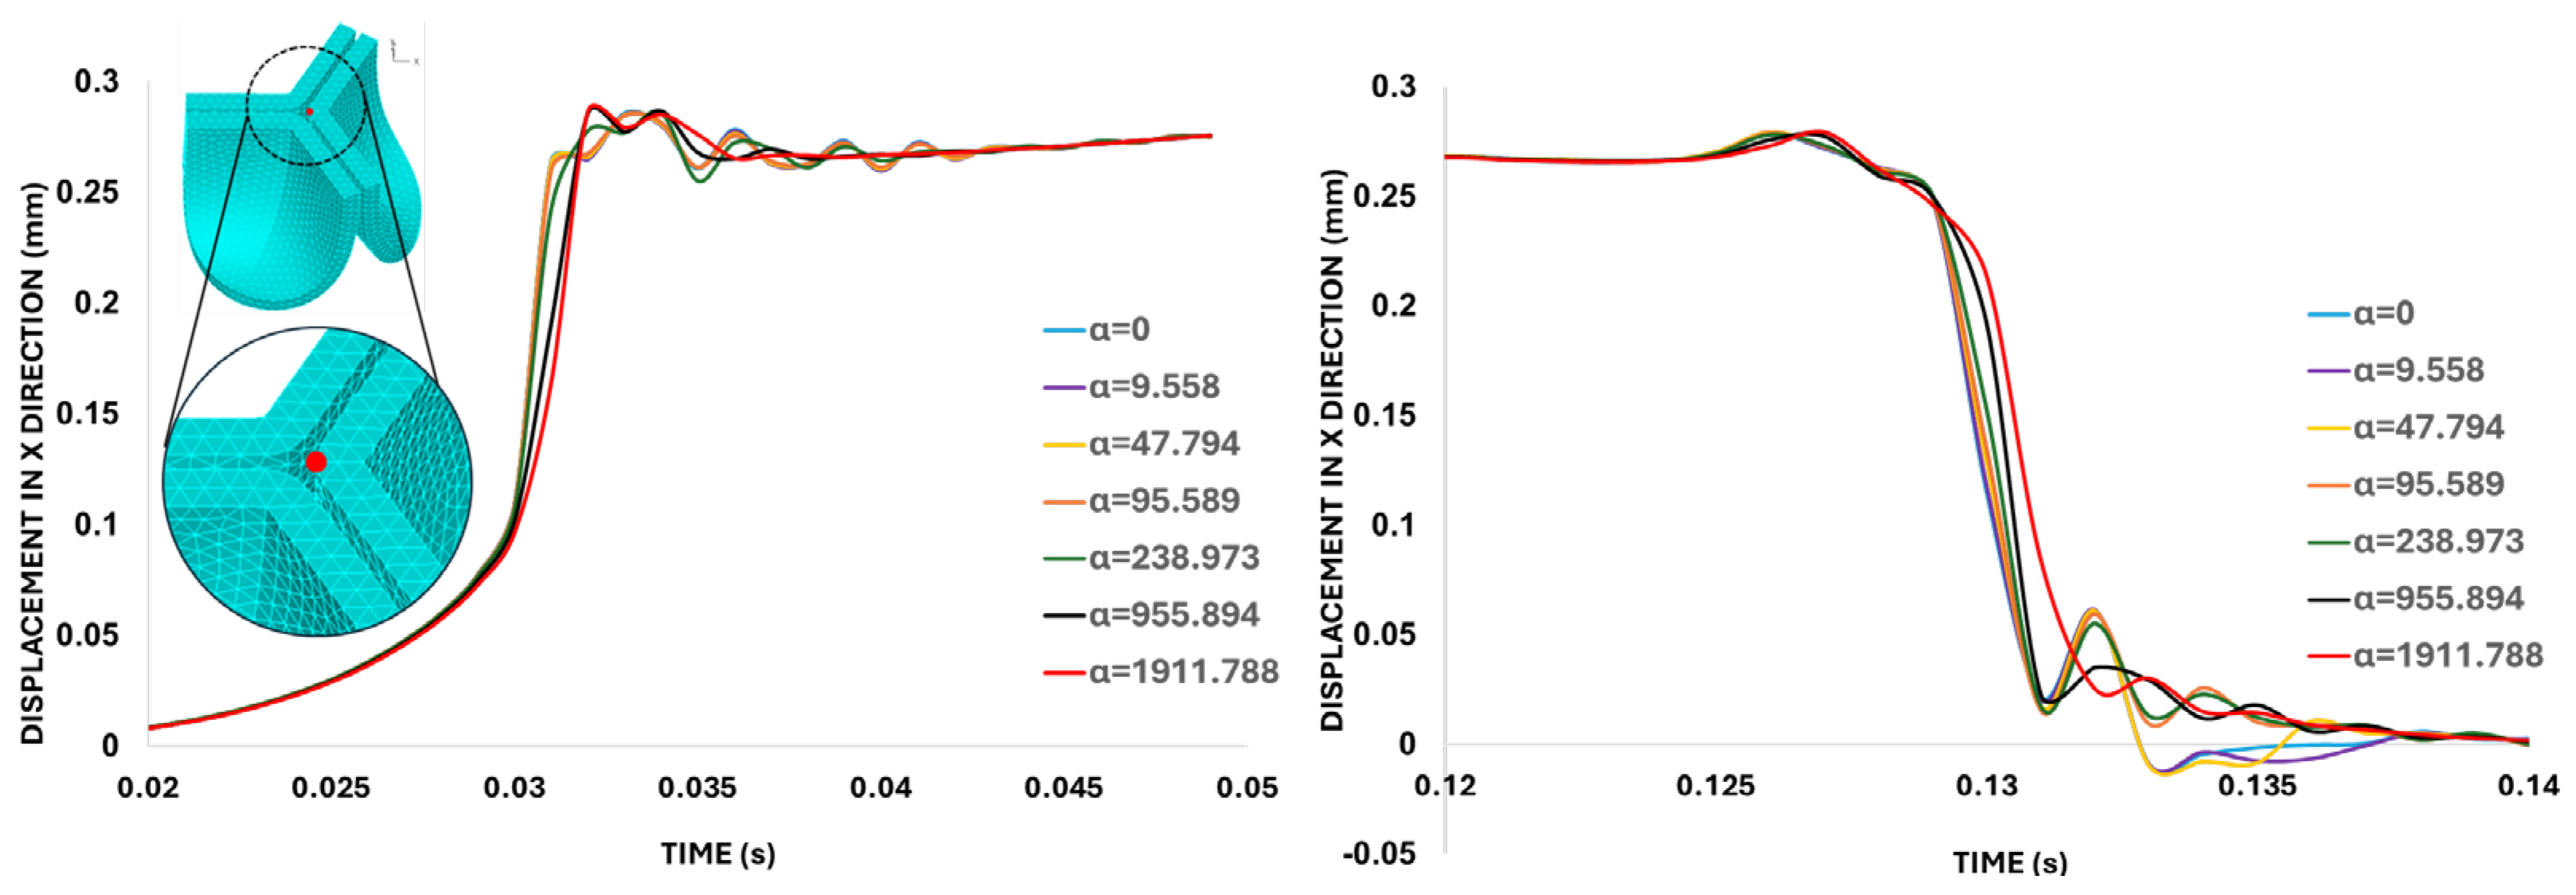
Figure 10.
Middle orifice area (MOA) variation over time for different belly curve-shifted valve geometries. The blue curve represents MOA measured at the ascending transition phase (t = 0.031 s), and the orange curve represents MOA at the peak pressure (t = 0.08 s). The right panel shows the plane used for MOA calculation, with the upper image depicting the valve cross-section at t = 0.031 s and the lower image showing the cross-section at t = 0.08 s.
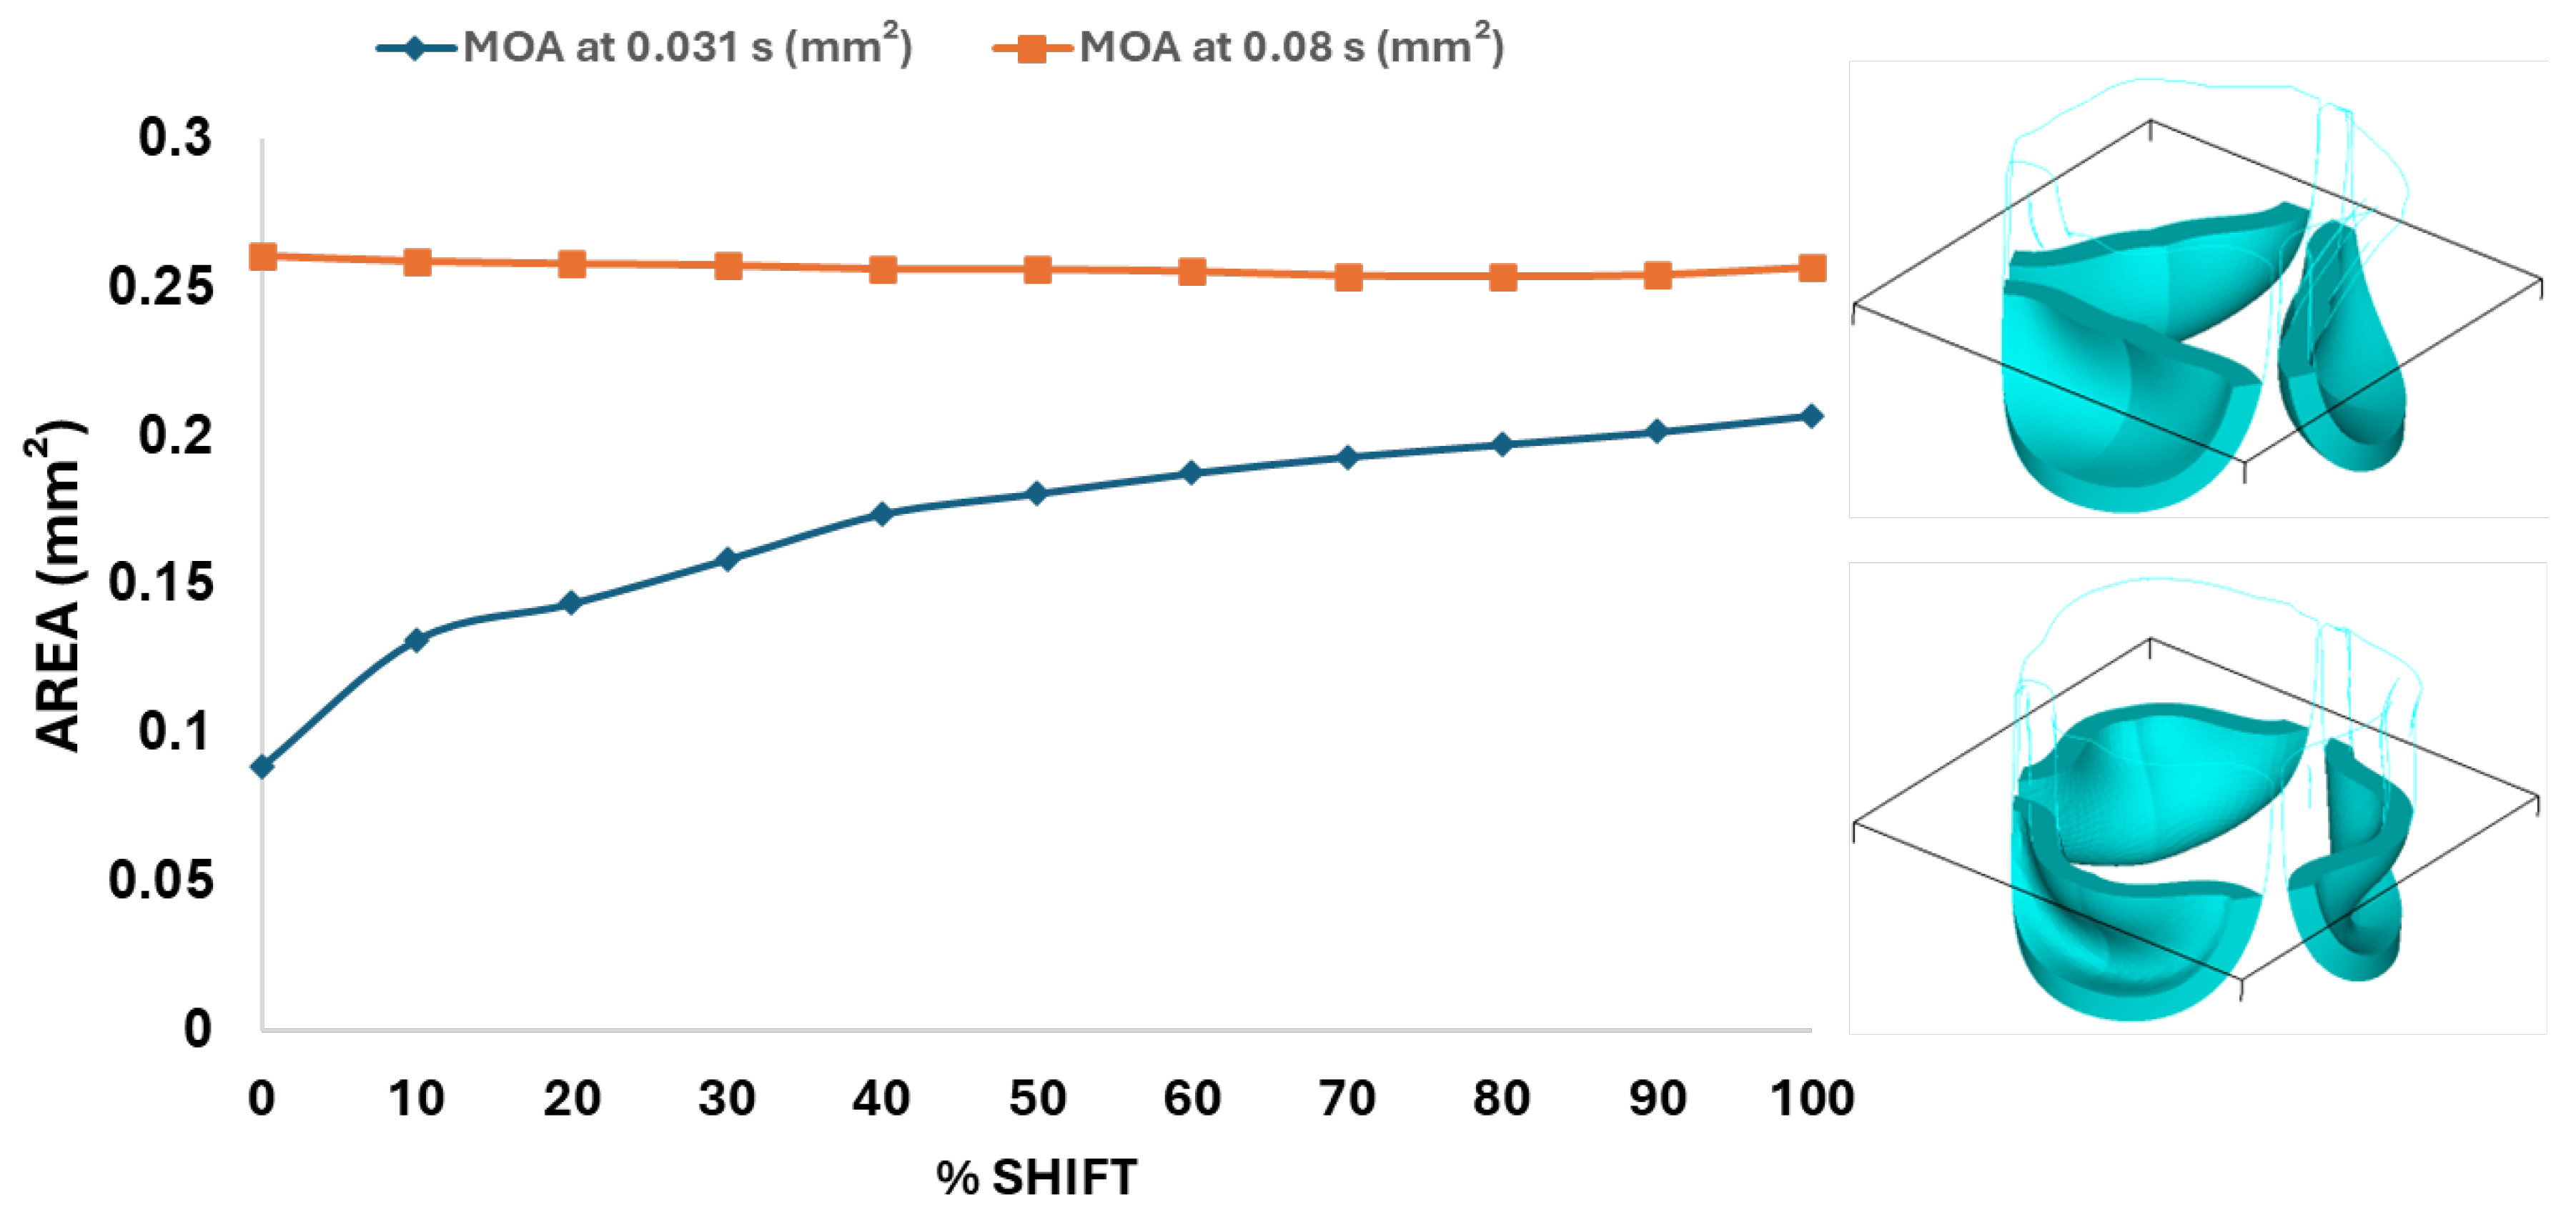
Figure 11.
Ventricularis belly curve profiles of the aortic valve leaflet and resulting geometrical changes. Top-left panel: midline leaflet deformation at t = 0.031s (valve opening). Top-right panel: superimposed belly curve profiles at t = 0.08 s during peak pressure. On each midline profile, a color-matched circular marker indicates the point closest to the centerline. Bottom panel: Geometric Orifice Area (GOA) as a function of the belly curve shift percentage. In the upper panels, the red dashed lines indicate the location of the middle orifice area (MAO) plane (see Figure 10), and circular markers indicate the variable GOA planes.
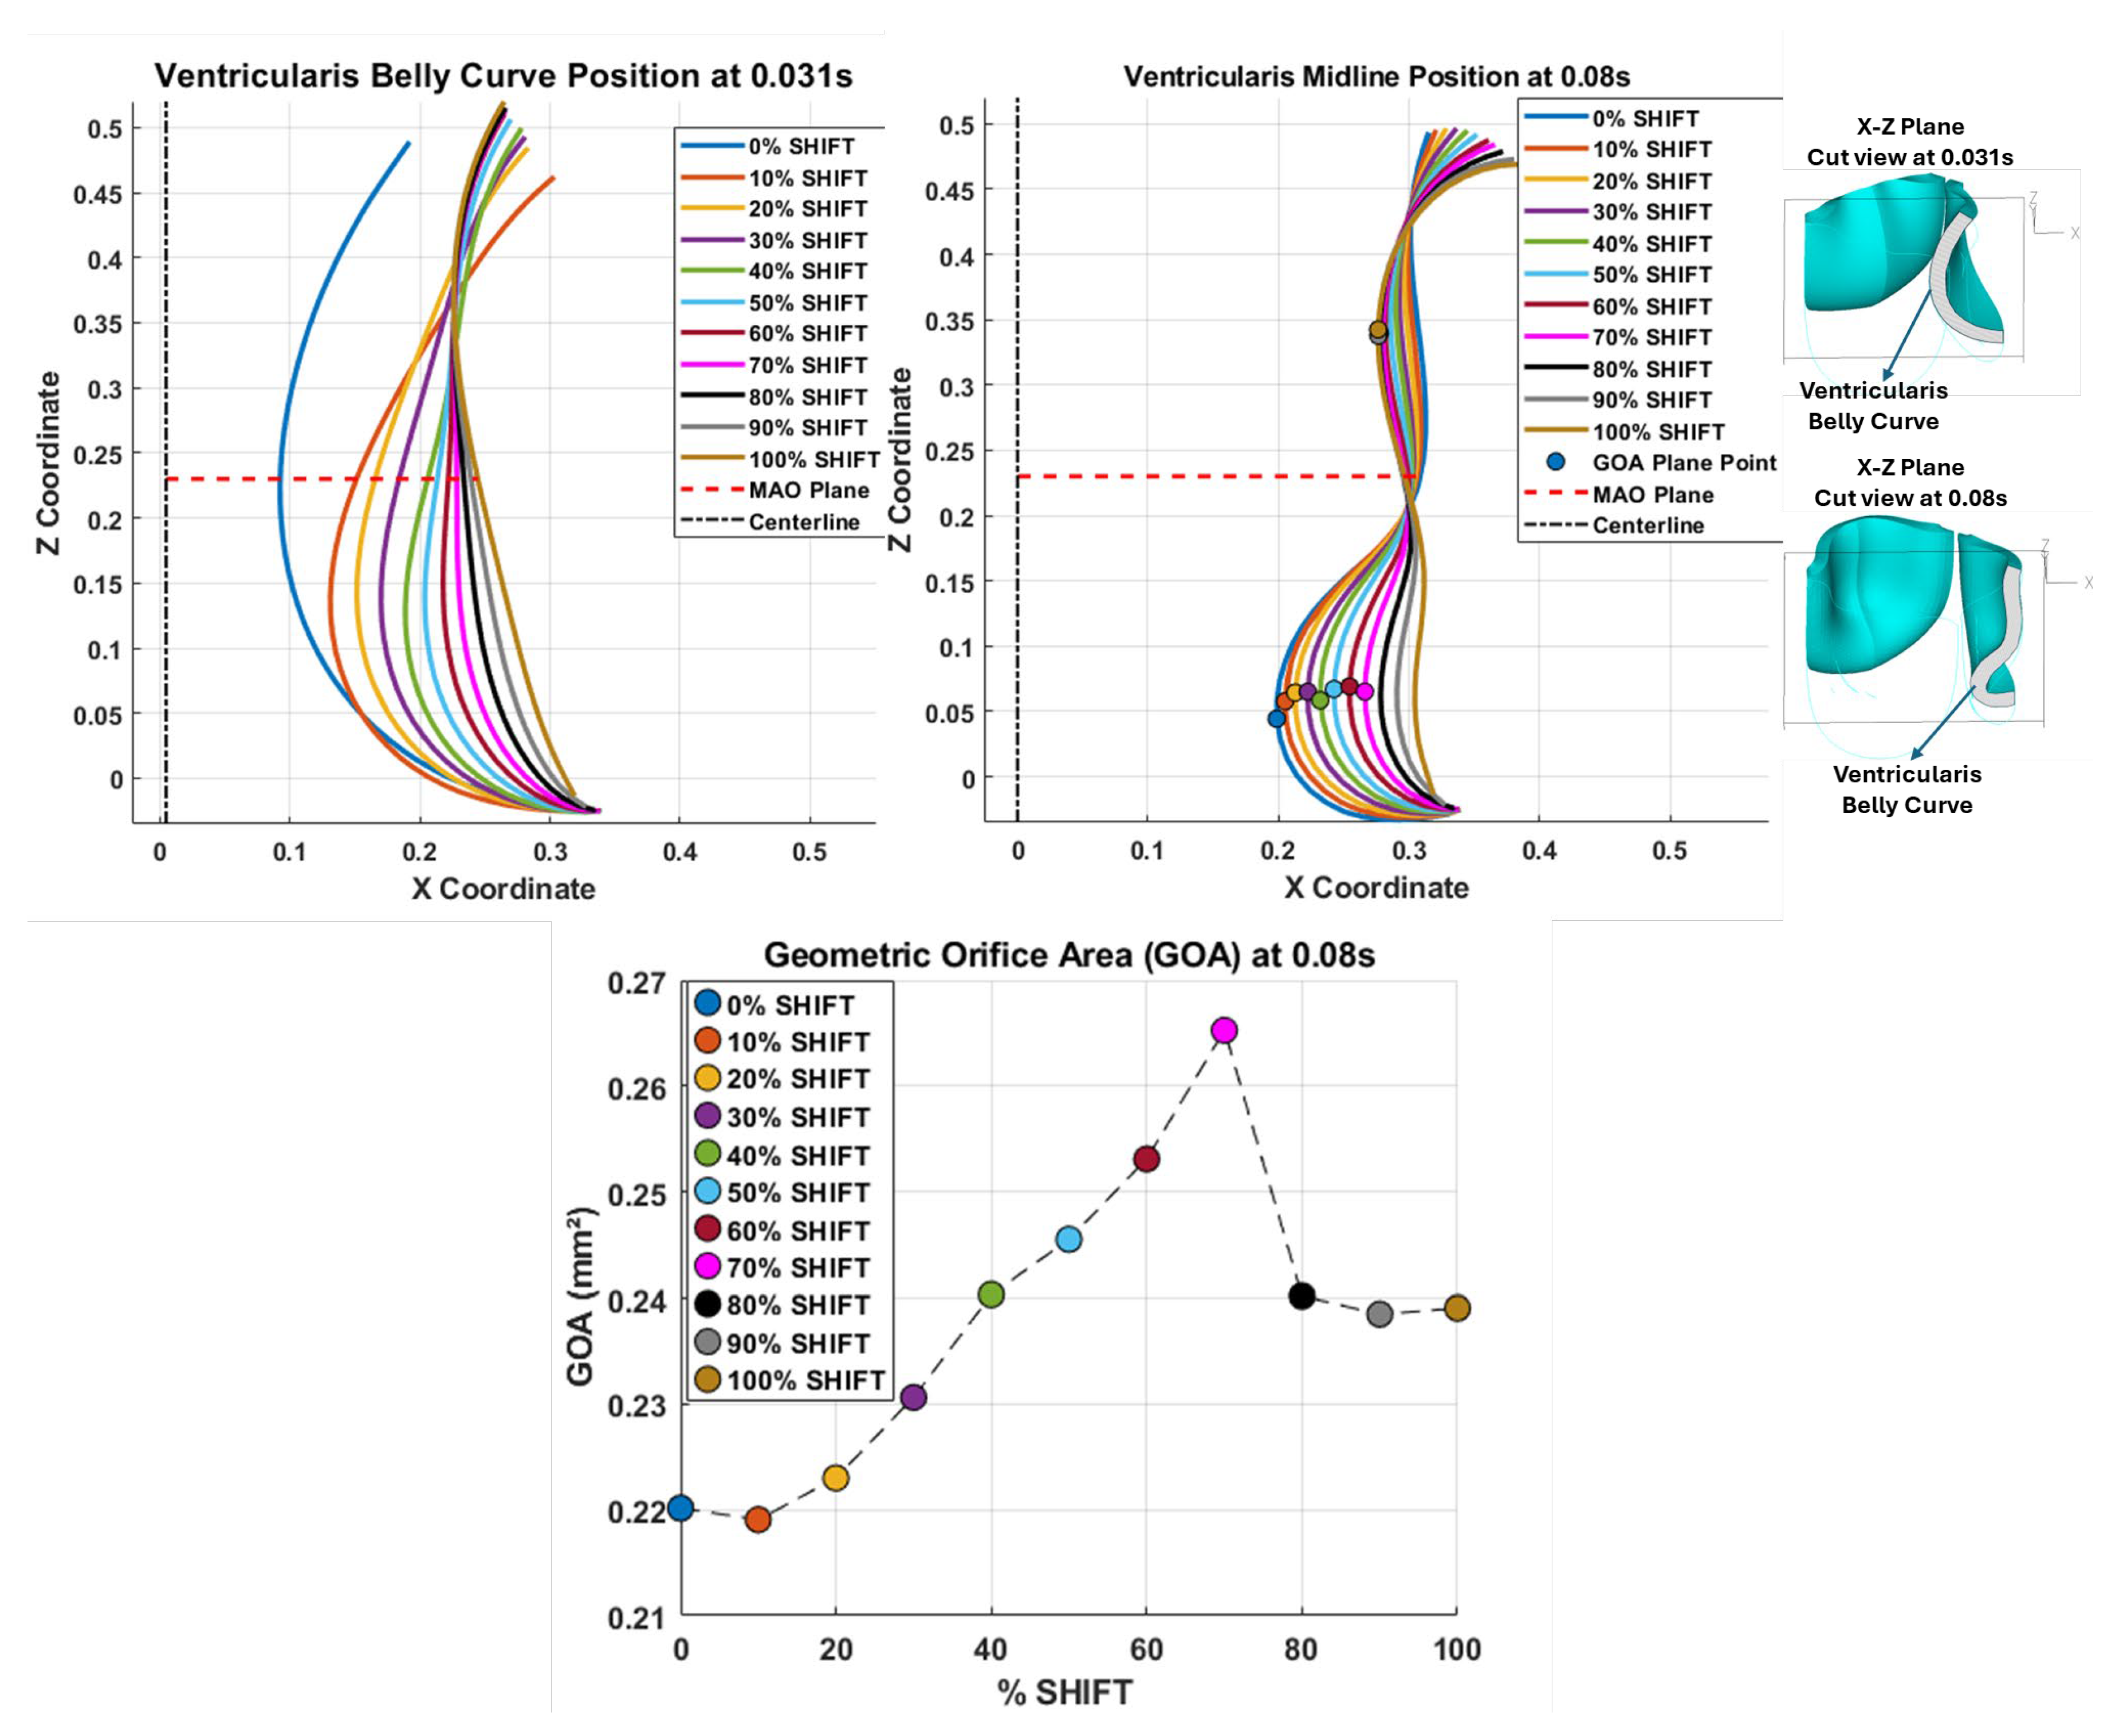
Figure 12.
Leaflet tip displacement from the valve centerline axis (x-direction in the x-y midline curve plane) versus belly-curve shift. The leaflet tip is indicated by the red dot on the rightmost panel. The graph shows the tip position at t = 0.031 s and t = 0.08 s, corresponding to the ascending transition and peak pressure phases of valve opening, respectively.
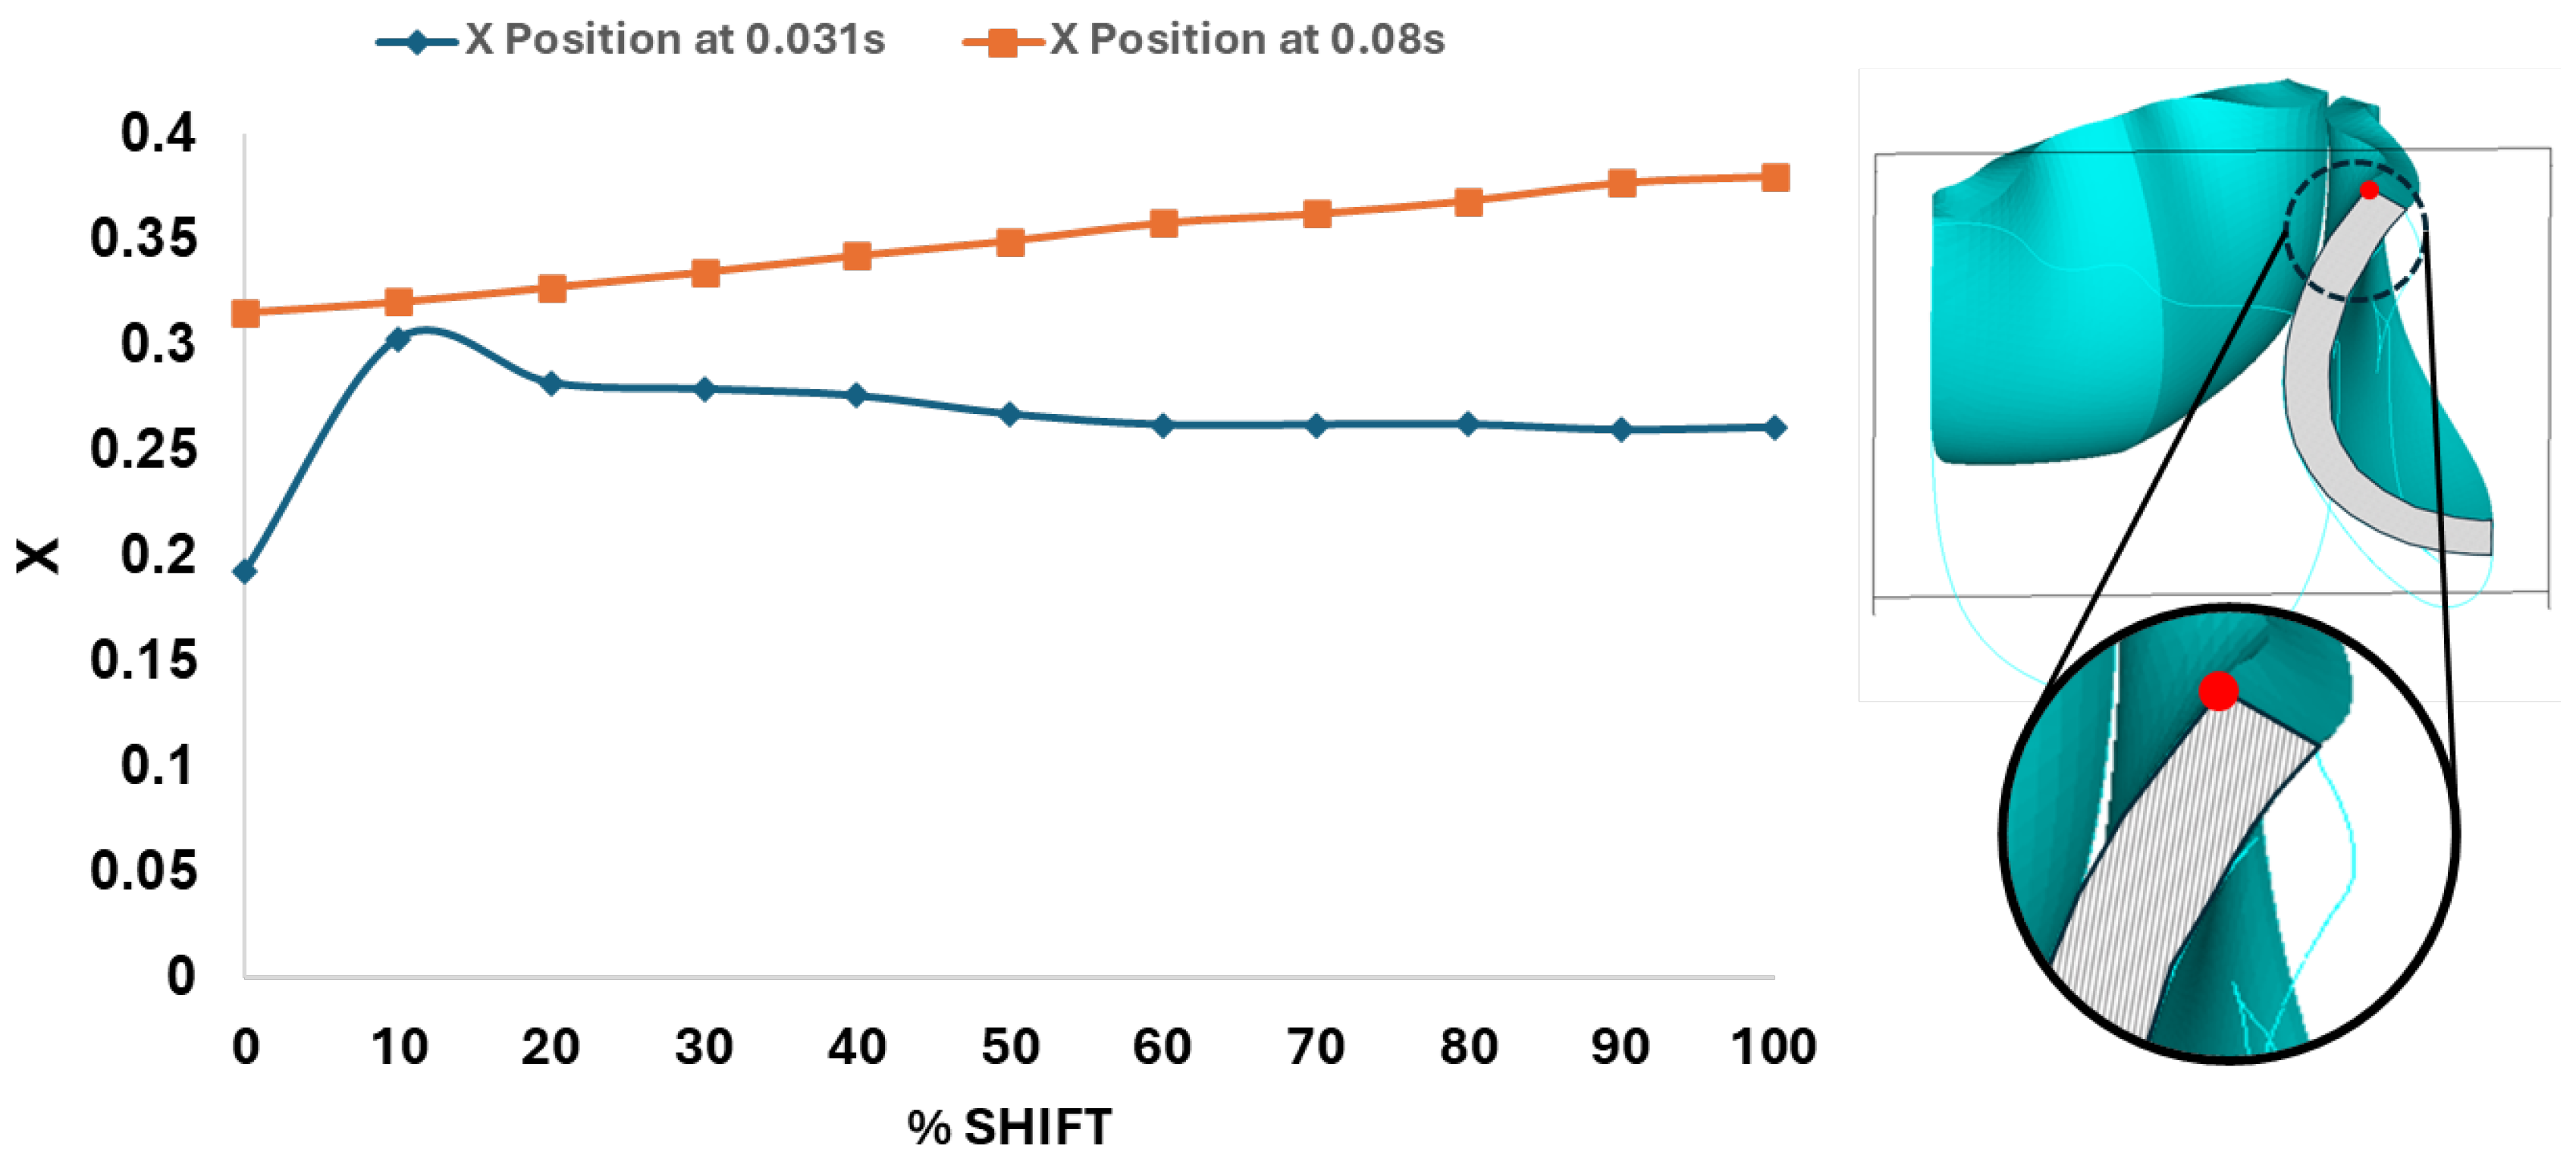
Figure 13.
Summary displacement analysis results across different visualization levels. Left: Displacement magnitude–time curve color-coded by percentage belly-curve shift. The plot also shows the belly curve shift profile and location of the tip point (red dot on upper plot) Right: Maximum tip displacement values as the belly-curve shifts from 0% to 100%.
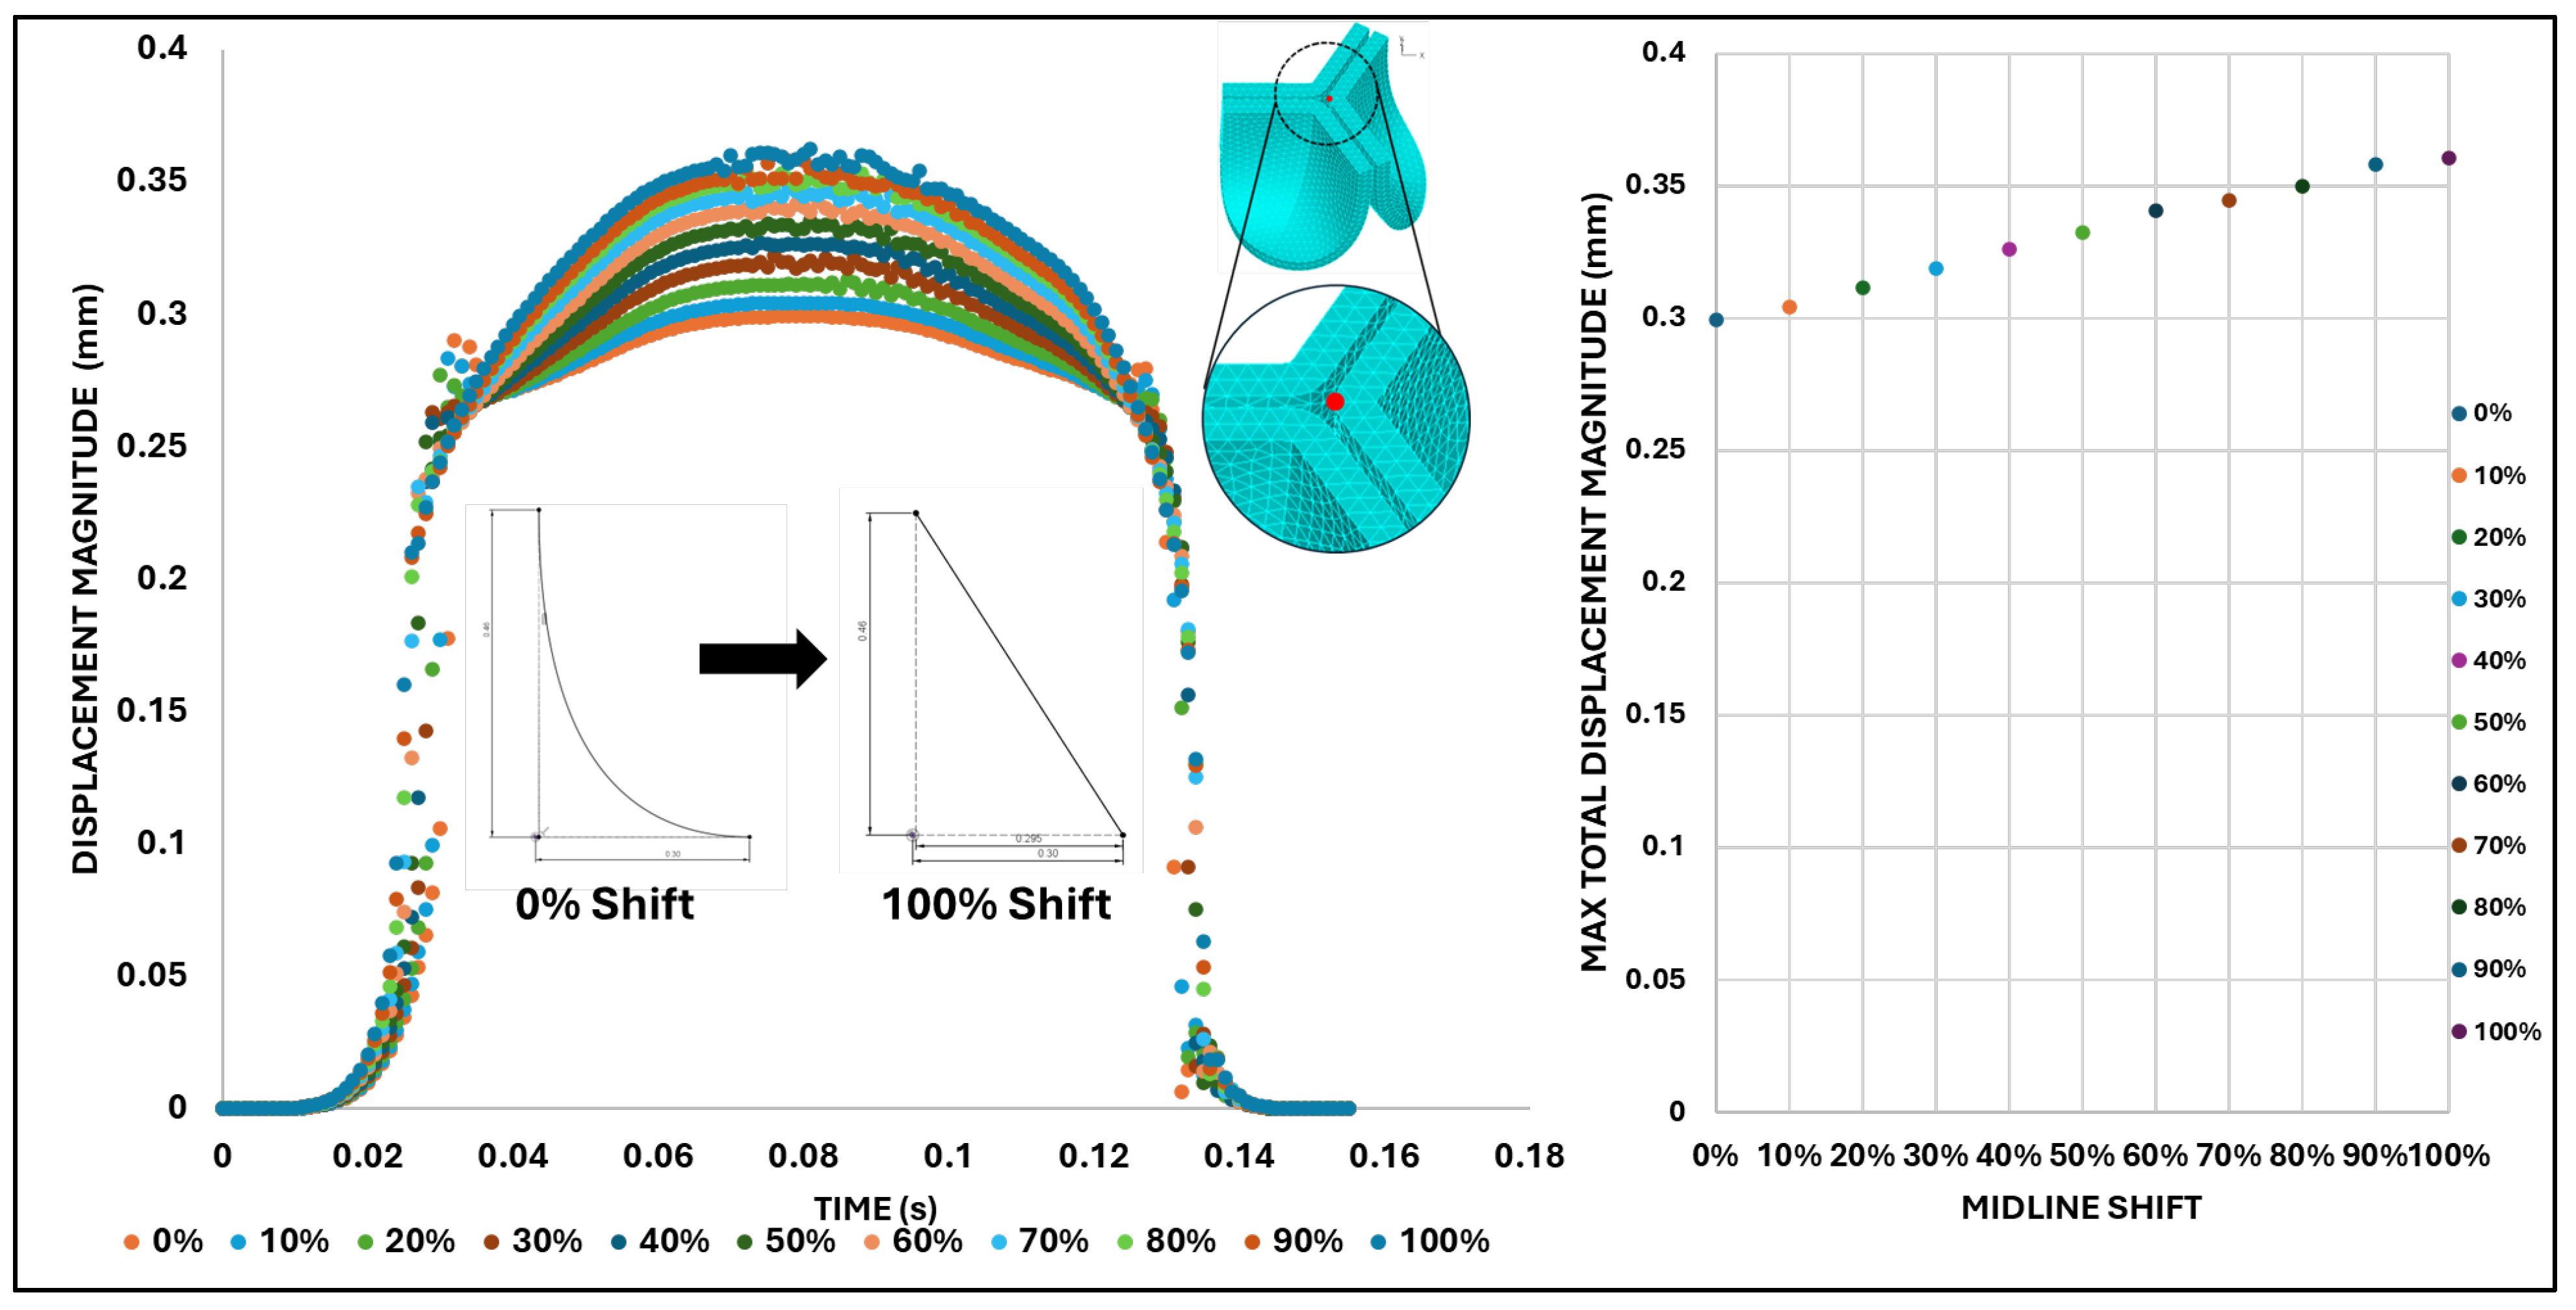
Figure 14.
Average effective stress along the fibrosa surface of the aortic valve for eleven belly curve-shifted geometries (0–100%). The measurement line is indicated by red dashed lines, and the corresponding average stress values at peak pressure (t = 0.08 s) are shown on the right-side graph.
Figure 14.
Average effective stress along the fibrosa surface of the aortic valve for eleven belly curve-shifted geometries (0–100%). The measurement line is indicated by red dashed lines, and the corresponding average stress values at peak pressure (t = 0.08 s) are shown on the right-side graph.
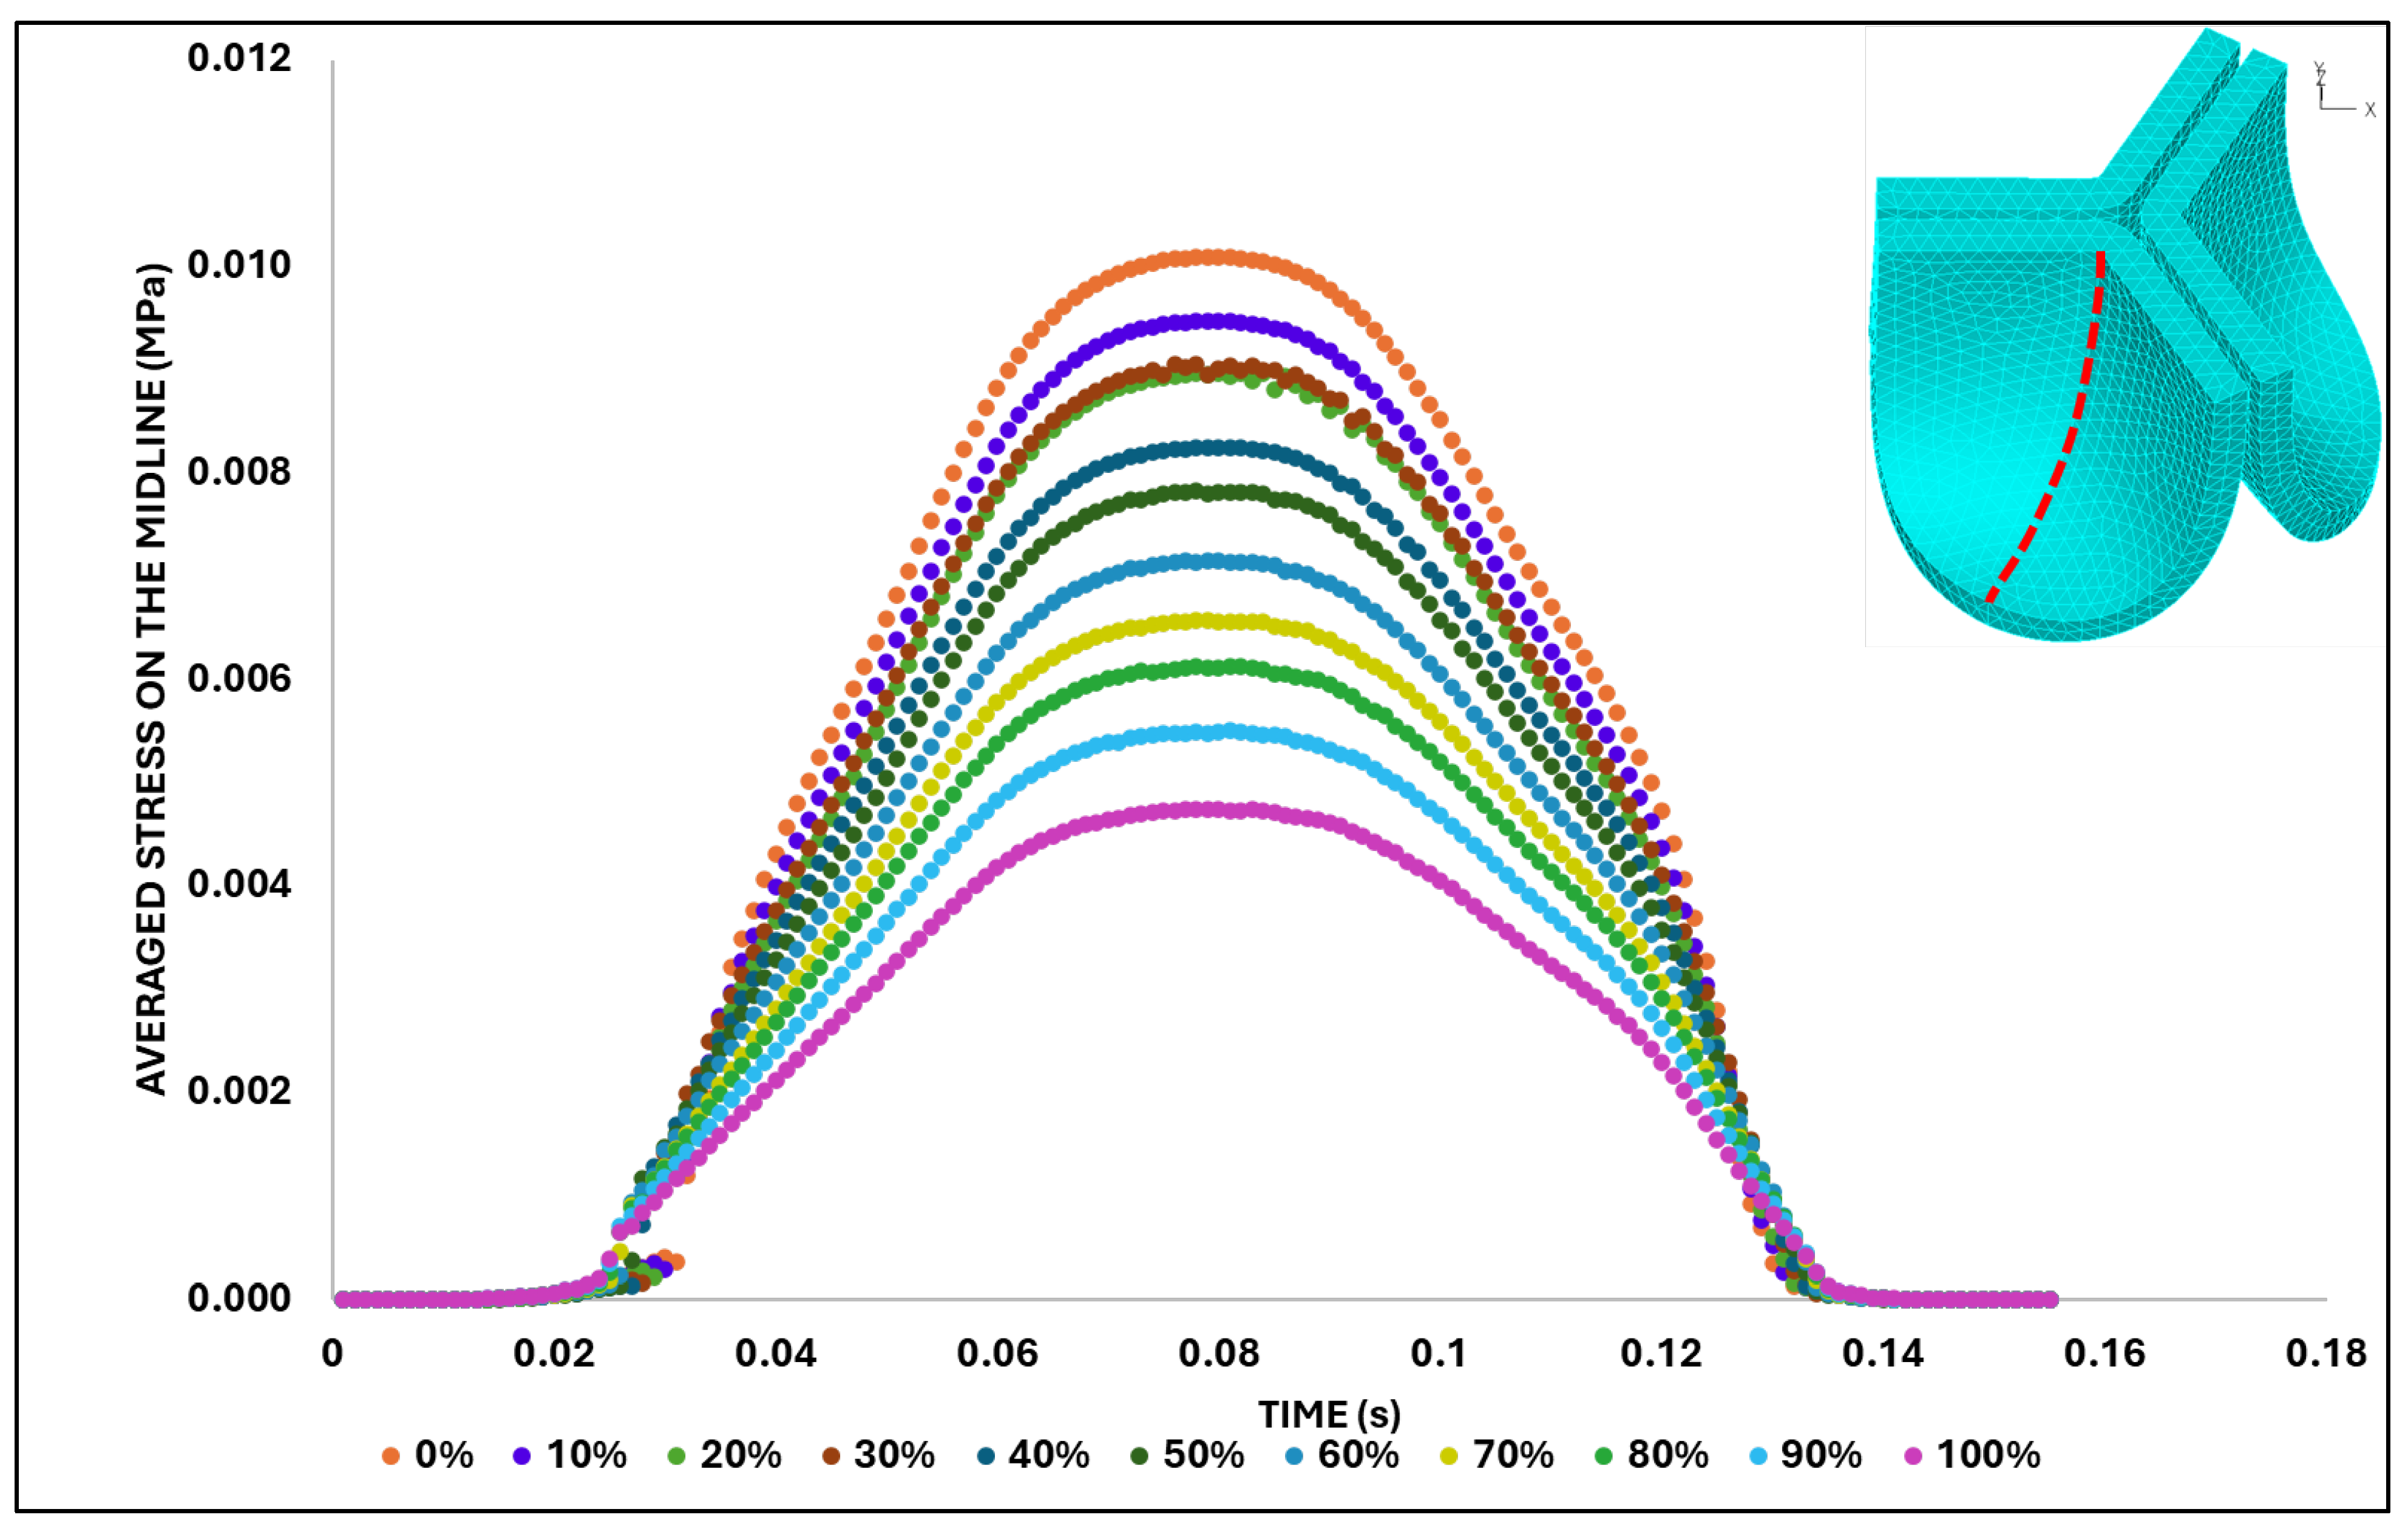

Table 1.
Ogden hyper elastic material parameter sets used in sensitivity tests, since HH40 (Day 14) chick embryo aortic valve properties were not available. Test 0 corresponds to human adult leaflet properties [36] , and test 8 (bold) was chosen here for the HH40 aortic valve leaflets (see Results).
| TEST | μ1 (Pa) | α1 |
| 0 | 577.60 | 26.260 |
| 1 | 530.34 | 24.634 |
| 2 | 483.08 | 23.008 |
| 3 | 435.82 | 21.382 |
| 4 | 388.56 | 19.756 |
| 5 | 341.30 | 18.130 |
| 6 | 294.04 | 16.504 |
| 7 | 246.78 | 14.878 |
| 8 | 199.52 | 13.252 |
| 9 | 152.26 | 11.626 |
| 10 | 105 | 10 |
Table 2.
Mass-proportional damping coefficients () calculated for mode 1 of the aortic valve based on different percentages of critical damping using a natural frequency of 4779.47 rad/s. Bold values (20% critical damping) were chosen here for the HH40 aortic valve leaflets and subsequent analysis.
Table 2.
Mass-proportional damping coefficients () calculated for mode 1 of the aortic valve based on different percentages of critical damping using a natural frequency of 4779.47 rad/s. Bold values (20% critical damping) were chosen here for the HH40 aortic valve leaflets and subsequent analysis.
| % of ξ =1 | (s-1) |
| 0.1 | 9.5589 |
| 0.5 | 47.7947 |
| 1 | 95.5894 |
| 2.5 | 238.9735 |
| 10 | 955.8940 |
| 20 | 1911.7880 |
Table 3.
Displacement and effective stress contour plots of the eleven belly-curve-shifted valve geometries (0%–100%), along with valve configurations at the ascending transition and at peak pressure. Displacement and stress legends were fixed to 0–0.3 mm and 0–0.015 MPa, respectively, for consistent comparison across all cases.
|
Disclaimer/Publisher’s Note: The statements, opinions and data contained in all publications are solely those of the individual author(s) and contributor(s) and not of MDPI and/or the editor(s). MDPI and/or the editor(s) disclaim responsibility for any injury to people or property resulting from any ideas, methods, instructions or products referred to in the content. |
© 2025 by the authors. Licensee MDPI, Basel, Switzerland. This article is an open access article distributed under the terms and conditions of the Creative Commons Attribution (CC BY) license (http://creativecommons.org/licenses/by/4.0/).
Copyright: This open access article is published under a Creative Commons CC BY 4.0 license, which permit the free download, distribution, and reuse, provided that the author and preprint are cited in any reuse.


