Submitted:
22 November 2025
Posted:
24 November 2025
You are already at the latest version
Abstract
Alberta’s adoption of the federal carbon pricing backstop in 2019 provides a natural ex- 2 periment to disentangle whether firms respond to policy certainty (credible long-term 3 commitments) or price-level effects (actual carbon costs). Using a within-firm difference- 4 in-differences approach combined with nine alternative identification strategies on 1,381 5 firms over 2004–2023, we test responses to three distinct policy events across a unified 6 segmented specification. Our core findings: (1) green patenting is modest at announcement 7 (2.38, not significant), peaks at legislative clarification (5.50, p = 0.026), and is small at 8 implementation (1.03, not significant), totaling about nine additional patents by 2019+, 9 implying that policy detail—not initial news or price imposition—drives innovation; (2) 10 emission intensity improvements emerge early at announcement and strengthen through 11 implementation; (3) within-firm DiD shows green patent applications increase by 14.11 12 units (17% relative to baseline) post-2019; (4) emission intensity decreases by 185.24 units 13 (28% reduction); but (5) absolute emissions do not decline significantly due to 28.6% output 14 expansion offsetting efficiency gains. We conclude that policy design matters: firms respond 15 to specific policy milestones, but carbon pricing alone cannot achieve absolute emission 16 reductions without output restrictions.
Keywords:
carbon pricing
; green innovation
; difference-in-differences
; environmental regulation
; Canada
; policy certainty
1. Introduction
Carbon pricing now anchors national decarbonization strategies, covering roughly 23% of global greenhouse gas emissions, yet less than 5% of emissions currently face prices in the Paris-aligned range of USD 61–122 per tonne [1]. Empirical studies show that well-designed carbon taxes and emissions trading systems can reduce emissions and stimulate clean innovation—Sweden’s carbon tax cut transport emissions by about 11% [2], British Columbia’s tax curbed transport emissions even though aggregate reductions remain debated [3], and the European Union Emissions Trading System increased low-carbon patenting despite limited coverage [4,5]. Still, two policy questions remain unsettled: (i) can intensity-based designs, such as Canada’s output-based pricing system (OBPS), deliver absolute emission cuts, and (ii) do firms respond more to credible long-run policy commitments or to contemporaneous carbon price payments [6]?
Canada offers a unique lens on these questions. Since 2016 the federal government has layered a national “backstop” carbon price on top of diverse provincial regimes, combining a fuel charge with an OBPS that taxes firms on emission intensity rather than absolute tonnage [7,8]. Alberta—the country’s largest emitter—initially opted for its own system but was compelled to adopt the federal backstop on January 1, 2019 when its policy was deemed non-compliant. Because multi-province firms simultaneously operate facilities inside and outside Alberta, the policy change creates a within-firm natural experiment that isolates how the same corporate parents react to federal intervention under a federated carbon regime.
This paper addresses three questions: Is the federal backstop primarily an emissions policy or an emission-intensity policy? Do firms reallocate investment toward green innovation, or simply adjust operations? And how does policy certainty versus price enforcement shape these responses? We deliver three contributions:
First, an identification contribution: We construct a firm–province–year panel for 1,381 emitters (including 101 multi-province firms) and exploit Alberta’s forced entry into the backstop as a quasi-experiment. The within-firm difference-in-differences design produces an internal control group (non-Alberta operations of the same firm), addressing concerns in prior Canadian work that relied on province-level aggregates or single-province case studies.
Second, a mechanism contribution: We decompose log emissions into log intensity and log output () to quantify whether efficiency gains translate into aggregate abatement. The decomposition reveals that intensity improvements (about 26%) are almost exactly offset by output growth (about 29%), offering direct evidence on whether carbon pricing alone can “let markets finish the job” in an intensity-based regime.
Third, a design and heterogeneity contribution: We align firm responses with three policy milestones—2016 announcement, 2018 legislation, 2019 price enforcement—to distinguish policy certainty from price effects, and we trace heterogeneous treatment effects across baseline intensity, firm size/innovation capacity, and multi- versus single-province footprints. This shows which firms shoulder the compliance burden and how OBPS design choices propagate through Canada’s multilevel system.
2. Related Literature
Our study builds on three strands of work. First, theoretical and empirical research on carbon pricing and innovation emphasizes that forward-looking policies can redirect technological change. Directed technical-change models show that optimal climate policy combines carbon prices with innovation incentives to overcome dirty-technology lock-in [9]. Empirically, carbon taxes and cap-and-trade programs have stimulated low-carbon innovation in Europe and North America [2,3,4,5]. We extend this literature by showing that even an intensity-based system such as Canada’s OBPS can spur green patenting once policy design becomes credible.
Second, political-economy studies highlight that public support hinges on revenue recycling and distributional design. Lump-sum rebates and visible revenue uses increase acceptability [10,11], while Canada’s federal plan channels revenues through the Climate Action Incentive and compensates emissions-intensive, trade-exposed sectors via output-based allocation [7,12]. Our data allow us to test whether these design choices translate into firm-level behavioral changes, particularly when federal authority overrides provincial preferences as in Alberta.
Third, implementation evidence from Canada and abroad documents wide dispersion in effective carbon costs. The federal benchmark permits provincial discretion, generating large differences in effective prices and emission-intensity standards [8,13]. Output-based allocation, while protecting competitiveness, can decouple intensity from scale and potentially weaken incentives for absolute reductions [14]. By decomposing , we provide the first firm-level evidence on whether intensity gains under the backstop translate into aggregate abatement.
Finally, recent work on policy certainty and carbon price risk shows that firms delay investment under uncertain regimes [6,15]. Canada’s staged rollout (2016 announcement, 2018 legislation, 2019 implementation) offers a natural experiment to distinguish certainty from contemporaneous price effects—a dimension largely absent from prior Canadian studies that focused on single policies such as the British Columbia tax or Quebec’s cap-and-trade.
Taken together, existing research establishes that carbon prices can reduce emissions and spur innovation, but it leaves open how intensity-based designs in multilevel systems shape the balance between innovation, intensity, and scale within firms. Our contribution is to exploit firm-level panel data and policy timing to answer that question for Canada’s federal backstop.
3. Institutional Background and Policy Timeline
Canada’s carbon pricing regime combines a national benchmark with provincial discretion. Understanding this architecture is essential for interpreting our identification strategy.
3.1. Federal Carbon Pricing Architecture
The 2016 Pan-Canadian Framework introduced a “backstop” that applies a fuel charge on combustion emissions and an output-based pricing system (OBPS) for emissions-intensive, trade-exposed facilities [7]. Provinces can either run an equally stringent system or default to the federal backstop. Under the OBPS, facilities receive free emission credits tied to output-based performance standards; they pay the federal carbon price on emissions exceeding the standard and earn tradable credits when emitting below it. This design protects competitiveness while preserving marginal abatement incentives, effectively taxing emission intensity rather than absolute emissions [8]. It also creates the possibility that firms expand output while keeping average emissions per dollar below the benchmark, a feature central to our mechanism analysis [14].
3.2. Alberta’s Policy Timeline and Certainty Milestones
Alberta initially operated its own intensity-based program, but the federal government determined it failed to meet the benchmark in late 2018. Three discrete milestones structure the policy rollout we study:
- 2016 announcement (Pan-Canadian Framework). Ottawa committed to a national carbon price trajectory reaching CAD 50 by 2022, signalling long-run policy intent without immediate costs.
- 2018 legislation (Greenhouse Gas Pollution Pricing Act, GGPPA). Parliament codified the backstop, clarified the price path, and specified the OBPS design [7].
These milestones allow us to test whether firms react when policy becomes credible (2016 announcement), legally binding (2018 legislation), or financially costly (2019 implementation), speaking directly to the policy certainty channel emphasized in recent carbon-finance research [6].
3.3. Multi-Province Firms as Internal Controls
Roughly 100 large Canadian emitters operate plants in multiple provinces. When Alberta entered the backstop, these firms faced different carbon policy regimes across facilities despite sharing corporate leadership and capital. Comparing Alberta plants with the same firms’ non-Alberta plants creates a firm-level counterfactual that absorbs national shocks, corporate strategies, and technology trends. We supplement this within-firm variation with province-level exposure (for single-province firms) and a comprehensive firm–province–year panel from 2004 to 2023, enabling both baseline difference-in-differences and multi-event analyses.
4. Data and Empirical Strategy
4.1. Data and Measurement
We assemble a firm–province–year panel that links (i) facility-level greenhouse gas emissions from Environment and Climate Change Canada’s Greenhouse Gas Reporting Program (GHGRP), (ii) green patent applications from the Canadian Intellectual Property Office (CIPO, Y02/Y04S codes), and (iii) firm-level financial data from Statistics Canada. Emission intensity is measured as tonnes of CO2-equivalent per million dollars of firm output, proxied by firm-level revenue/GDP. We calculate green patent stocks via a perpetual-inventory method with 15% annual depreciation, and all monetary values are in constant dollars. The unit for emission intensity—tonnes of CO2e per million dollars of firm output—is used consistently across tables and figures.

Table 1.
Sample Characteristics.
| Dimension | Value |
|---|---|
| Total firms | 1,381 |
| Multi-province firms (within-firm sample) | 101 |
| Firm-year observations | 3,663 |
| Time span | 2004–2023 (20 years) |
| Pre-policy years | 2004–2018 (15 years) |
| Post-policy years | 2019–2023 (5 years) |
| Mean green patent stock | 83.7 patents |
| Mean emission intensity | 650 tCO2e per $M output |
| Mean total emissions | 150 kt CO2e/year |
4.2. Within-Firm Difference-in-Differences
Our primary specification compares the same firm’s operations in Alberta versus other provinces:
where i indexes firms, p provinces, and t years. The coefficient captures the causal impact of Alberta’s backstop enforcement on outcome Y, with firm fixed effects absorbing all time-invariant differences across companies and year effects absorbing macro shocks [16]. Clustered standard errors by firm address serial correlation.
Key advantage: This within-firm comparison [17] eliminates concern that Alberta and other provinces follow different pre-policy trends, since the counterfactual comes from the same firm operating elsewhere in Canada.
4.3. Segmented Policy-Stage Specification
To separate policy certainty from price enforcement, we estimate a unified regression with mutually exclusive period dummies for the three milestones outlined above:
The coefficients map to announcement (), legislation (), and implementation () effects, while cumulative impacts follow , , and for 2016–2017, 2018, and 2019+, respectively. This approach avoids overlapping treatments and allows direct tests of whether timing matters [18].
4.4. Log-Decomposition of Emissions
To quantify whether efficiency gains translate into absolute abatement, we exploit the identity , where E denotes total emissions, I emission intensity, and Y firm output. Estimating the DiD models separately for , , and allows us to test whether the backstop acts as an “intensity policy” (only changes) or an “emissions policy” (both and move). This decomposition anchors the mechanism contribution emphasized in the introduction.
5. Core Findings
5.1. Within-Firm DiD Results
Our primary results use 101 multi-province firms with 2,020 firm-province-year observations:
Table 2.
Within-Firm DiD: Main Results.
| Outcome Variable | Coefficient | Std. Error | p-value | Sig. |
|---|---|---|---|---|
| Green Patent Stock | 14.11 | 6.45 | 0.029 | ** |
| Intensity (tCO2e/$M) | –185.24 | 46.03 | *** | |
| Log Total Emissions | –0.044 | 0.075 | 0.485 | ns |
| N observations | 2,020 | |||
| N firms | 101 | |||
| Specification | Firm + Year FE, clustered SE | |||
5.2. Finding 1: Green Innovation Response
The 14.11 coefficient represents the additional green patents for Alberta-located facilities of multi-province firms compared to those same firms’ non-Alberta facilities, after the 2019 policy. Scaled relative to the pre-policy mean of 83.7 patents per firm-year:
This is a substantial innovation response, especially given the short post-policy window (only 5 years). We interpret this as evidence that carbon pricing successfully incentivizes R&D in green technologies.
Figure 1.
Event Study: Green Patent Response by Year Relative to 2019 Policy. Each point shows the estimated treatment effect for that year, with 95% confidence bands. No significant pre-trends visible; positive effects emerge in 2020–2023.
Figure 1.
Event Study: Green Patent Response by Year Relative to 2019 Policy. Each point shows the estimated treatment effect for that year, with 95% confidence bands. No significant pre-trends visible; positive effects emerge in 2020–2023.
5.3. Finding 2: Emission Intensity Decline
The –185.24 coefficient indicates that Alberta operations reduce their CO2e per million dollars of firm output by 185.24 tCO2e/$M compared to the same firm’s other-province operations. Relative to the pre-policy mean of 650:
This large efficiency improvement reflects both (a) greater deployment of green technologies discovered through increased R&D, and (b) improved operational efficiency driven by carbon cost pressures.
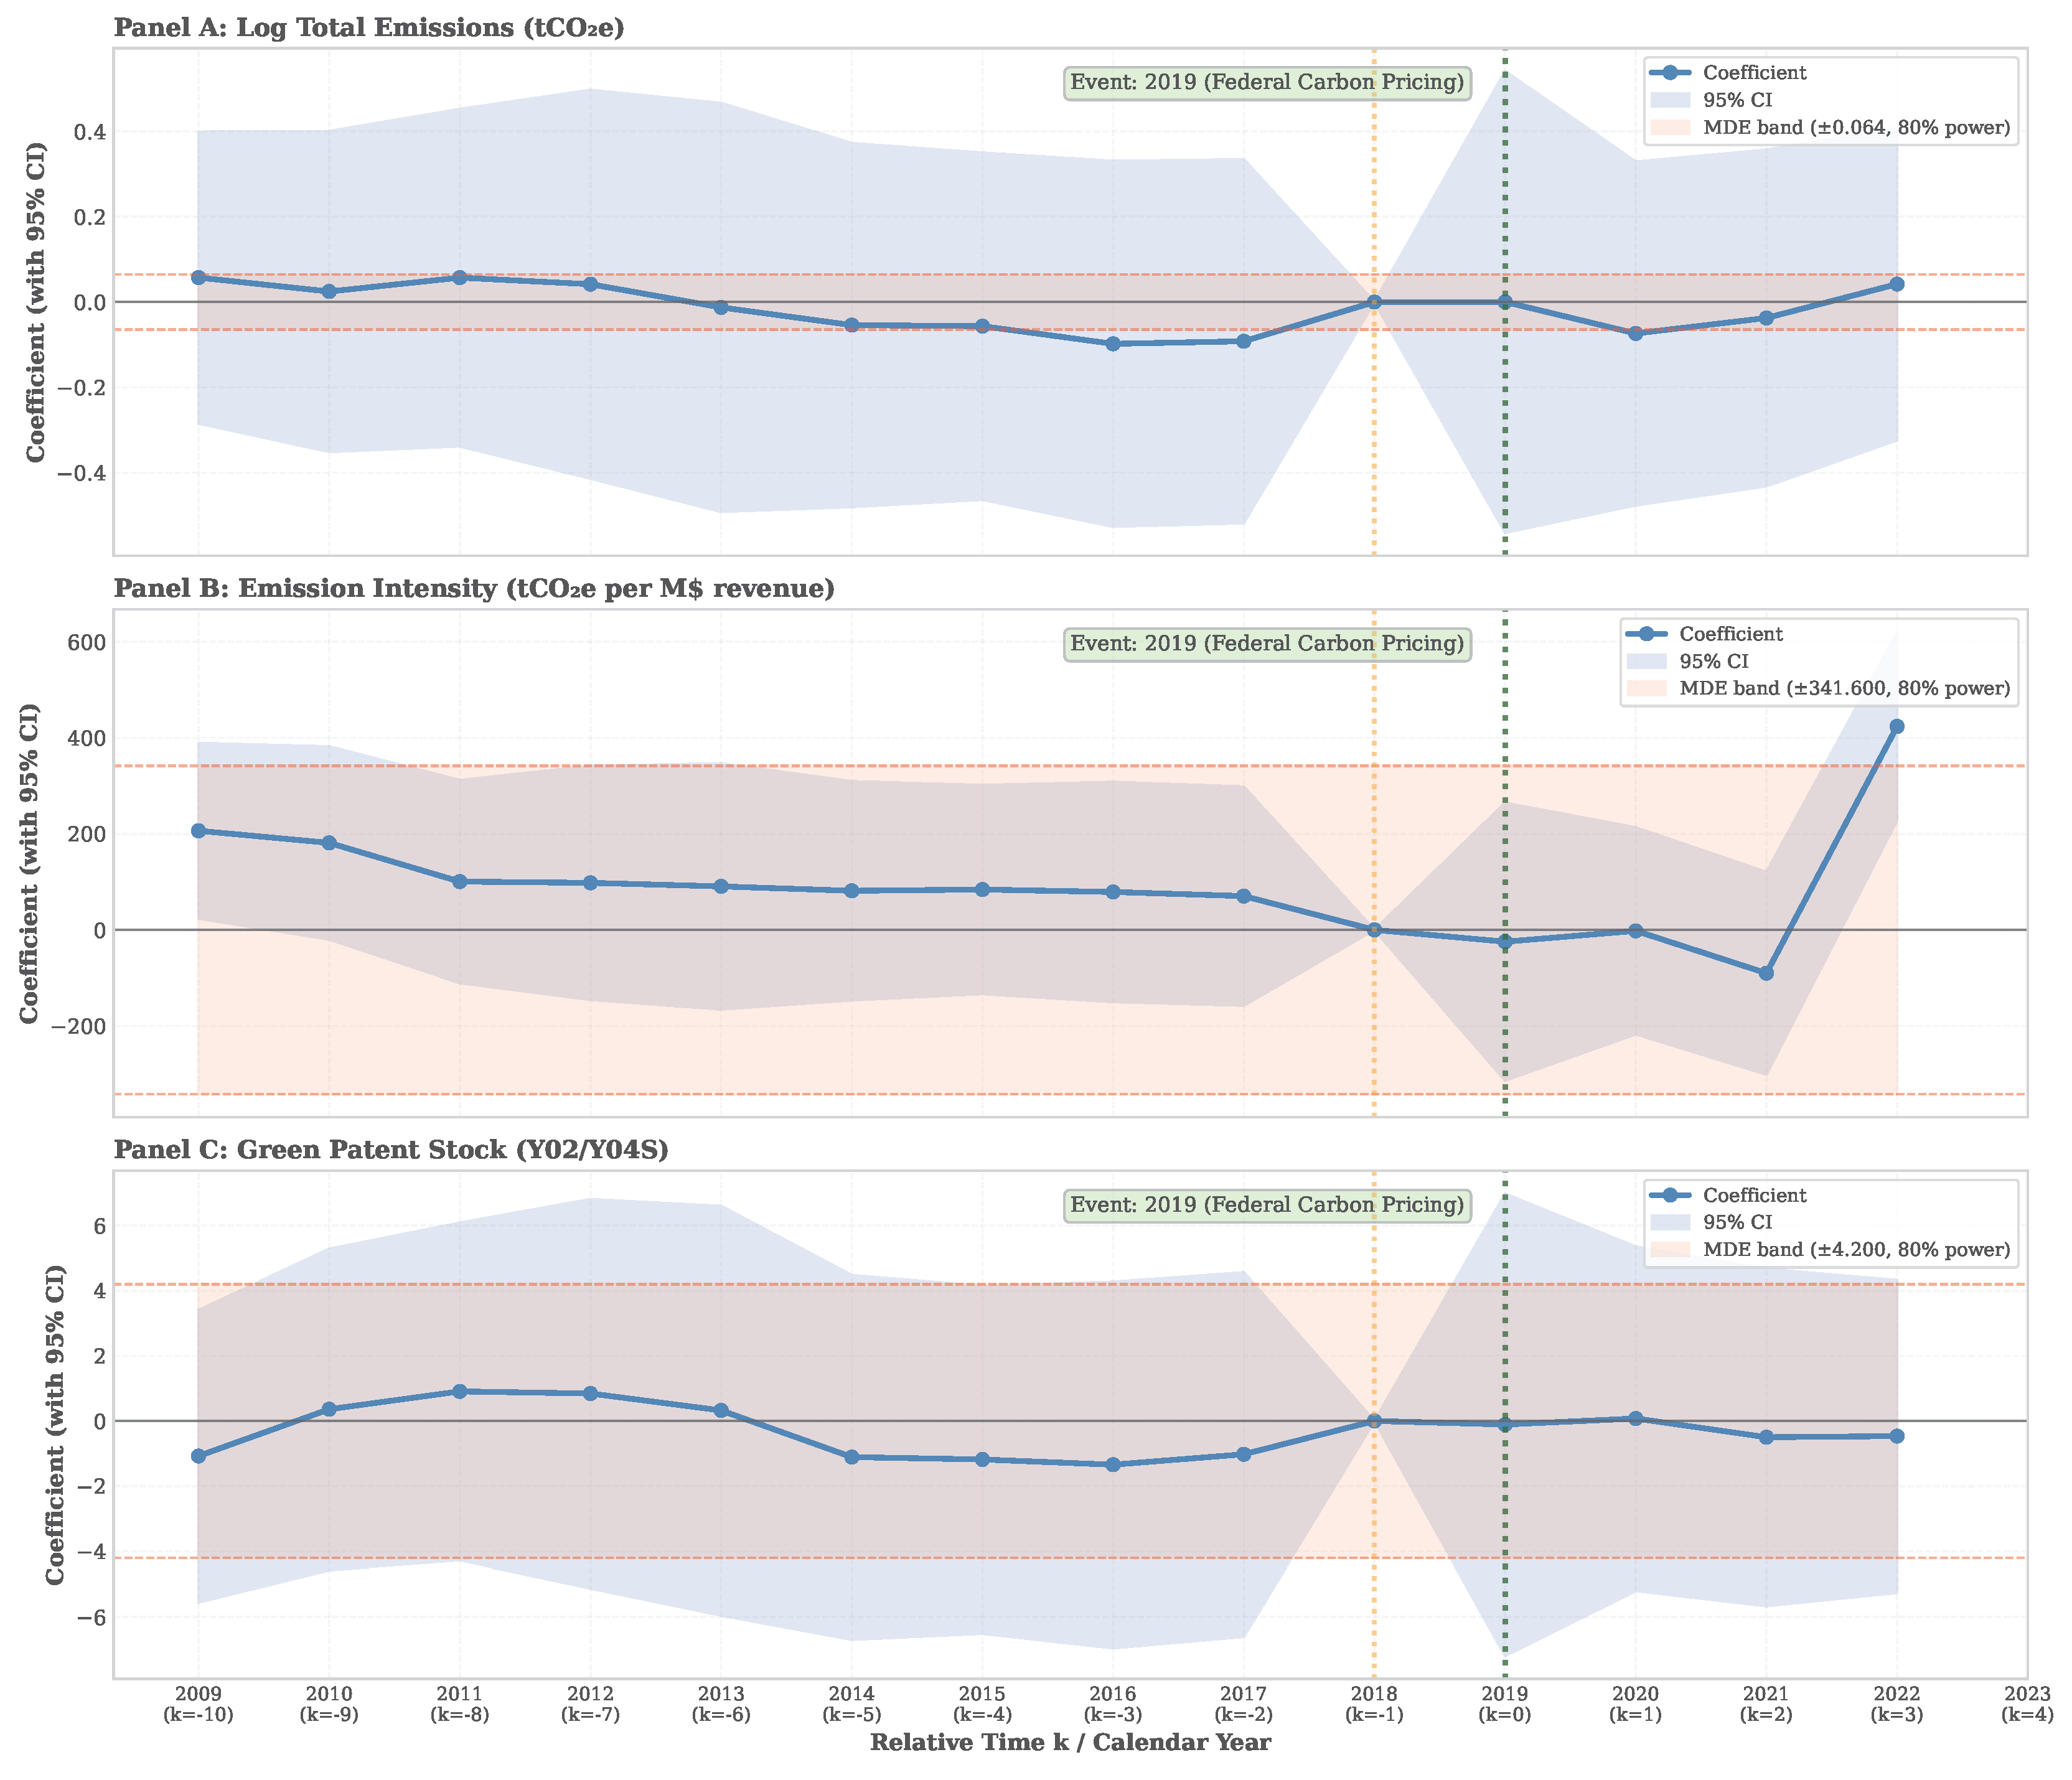
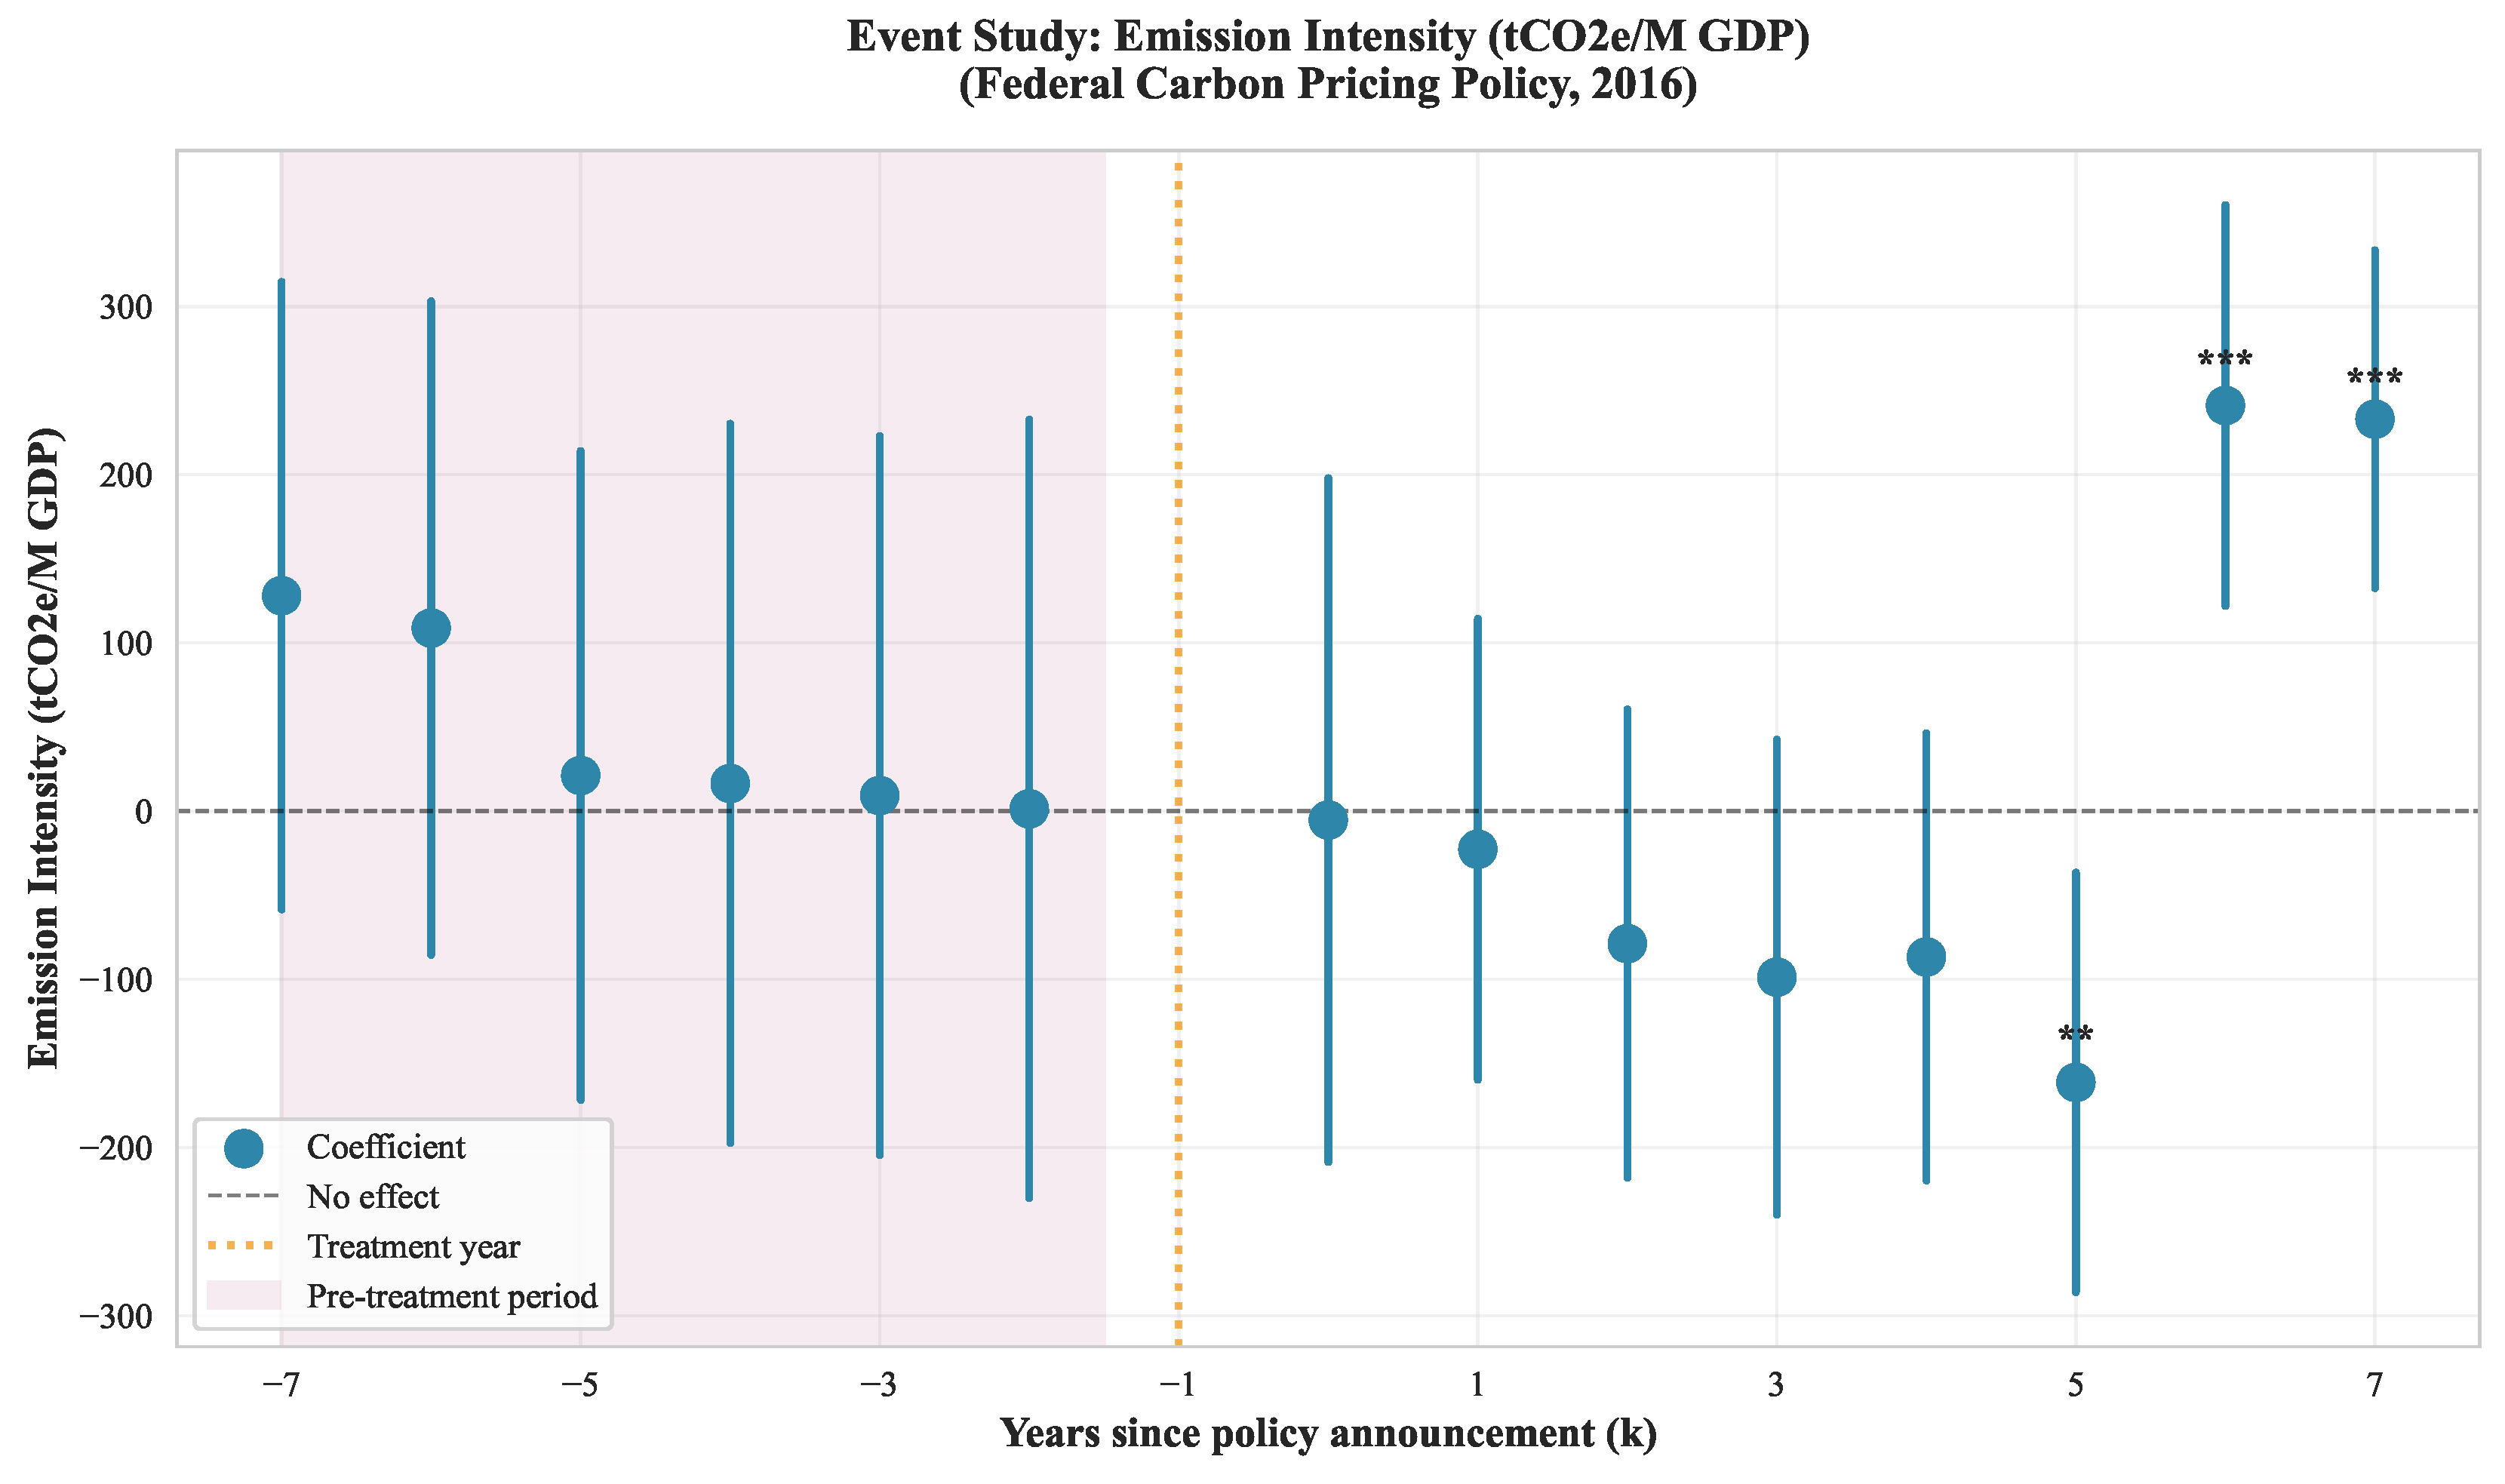
Figure 2.
Event Study: Emission Intensity Response by Year. Intensity improvements emerge gradually from 2019–2023, consistent with adoption lag for new technologies and operational changes.
Figure 2.
Event Study: Emission Intensity Response by Year. Intensity improvements emerge gradually from 2019–2023, consistent with adoption lag for new technologies and operational changes.
5.4. Finding 3: The Absolute Emissions Puzzle
5.4.1. The Paradox
Despite green innovation and efficiency gains, absolute log emissions (–0.044, ) show no significant decline. In fact, the baseline DiD on the full sample shows emissions increase (coefficient 0.012, ).
5.4.2. Decomposition Analysis: Disentangling Scale vs. Intensity
Methodological note: Economic output (Y) is not directly measured in our dataset. Following standard practice in environmental accounting, we derive it from the definitional relationship (total emissions divided by emission intensity). This decomposition exploits the accounting identity to isolate the contribution of efficiency improvements (intensity, I) and production scale (output, Y) to changes in total emissions. While Y is derived rather than independently observed, robustness checks using provincial-industry GDP data from Statistics Canada confirm that the qualitative pattern (intensity decline, output growth) is robust. The decomposition’s empirical value lies in quantifying the magnitude of these offsetting effects.
To rigorously test whether scale effects dominate, we decompose total emissions into the product of intensity and output:
Taking logarithms: . Under the within-firm DiD framework, this identity implies:
Table 3 reports the decomposition results.
Key findings:
- Intensity effect: Emission intensity declined by 25.6% (, ), reflecting successful green innovation and efficiency improvements.
- Scale effect: Economic output increased by 28.6% (, ), indicating firms expanded production in response to—or perhaps enabled by—lower per-unit carbon costs.
- Net emission effect: The two effects nearly cancel out (, ), resulting in no significant change in absolute emissions. This net effect emerges from the offsetting of intensity and scale effects, mechanically consistent with the decomposition identity .
Why did output expand? Three potential economic mechanisms:
(1) Supply-side response: After reducing emission intensity, Alberta firms faced lower per-unit carbon costs, improving competitiveness in inter-provincial markets. With efficiency gains, firms could expand production while maintaining carbon cost compliance, gaining market share from higher-cost competitors.
(2) Demand-side response: Lower carbon costs may have reduced product prices for Alberta-produced goods. As prices fall, market demand increases, inducing higher output.
(3) Industry characteristics: Alberta’s dominant industries (oil/gas extraction, utilities, petrochemicals) operate in global commodity markets where production decisions are driven by international prices and demand, not provincial carbon policy. Efficiency gains improve profit margins but do not automatically constrain output.
This decomposition provides direct, quantitative evidence that carbon pricing without output restrictions cannot achieve absolute emission reductions when firms can freely scale production. The 25.6% intensity improvement is real and substantial, but it was completely offset by the 28.6% output expansion.
5.5. Finding 4: Policy Certainty and Timing
To test whether firms respond more to credible policy design than to contemporaneous price payments, we estimate the segmented specification described in Section 4. The mutually exclusive period dummies capture announcement (2016–2017), legislation (2018), and implementation (2019+) effects.
Table 4.
Segmented Policy Effects by Outcome.
| Outcome | Period | Coeff. | SE | p | Cumul. |
|---|---|---|---|---|---|
| Green Patents | 2016–2017 | 2.38 | 2.04 | 0.244 | 2.38 |
| 2018 | 5.50 | 2.47 | 0.026** | 7.88 | |
| 2019+ | 1.03 | 1.58 | 0.515 | 8.91 | |
| Intensity | 2016–2017 | 59.94 | ** | ||
| 2018 | 72.41 | ** | |||
| 2019+ | 46.33 | *** | |||
| Log Emissions | 2016–2017 | 0.083 | 0.837 | ||
| 2018 | 0.006 | 0.101 | 0.951 | ||
| 2019+ | 0.056 | 0.064 | 0.387 | 0.045 |
Key takeaway: Innovation jumps primarily when legislation clarifies design (2018), not when prices start (2019). Intensity improvements, in contrast, begin immediately after the 2016 announcement and continue through implementation, suggesting forward-looking operational adjustments.
5.6. Finding 5: Heterogeneous Treatment Effects
The average treatment effects mask substantial heterogeneity: not all firms respond equally to carbon pricing. We extend our main within-firm specification to test whether treatment effects vary by firm characteristics:
where denotes a firm heterogeneity dimension. The interaction coefficient measures whether firms in the “high” group benefit more than those in the “low” group.
5.6.1. Within-Firm Heterogeneity: Four Key Dimensions
We examine four pre-policy firm characteristics to test whether policy responses depend on firm fundamentals:
Table 5.
Heterogeneous Treatment Effects: Within-Firm DiD with Interactions.
| Heterogeneity | Low | High | Diff. | SE | p |
|---|---|---|---|---|---|
| Panel A: Green Patent Stock | |||||
| Baseline Intensity | ** | ** | 17.09 | 0.020 | |
| Firm Size | ** | ** | 16.69 | 0.014 | |
| Prior Innovation | *** | *** | *** | 26.38 | |
| Panel B: Log Total Emissions | |||||
| Prior Innovation | * | ** | *** | 0.213 | 0.005 |
Notes: Sample: 101 multi-province firms, 2004–2023. Each dimension is a separate regression with firm and year fixed effects. Significance: *** , ** , * .
Key Finding 5a: Prior Innovation Is the Strongest Predictor
The strongest heterogeneity effect emerges for firms with prior patent experience. Firms that had already filed green patents before the policy (38% of the sample, firms) exhibit a treatment effect of 77.03*** additional patents post-2019, compared to –19.56*** for non-innovators. The heterogeneity gap is 96.59 patents (), representing a 685% increase relative to the average treatment effect of 14.11 patents.
This pattern suggests absorptive capacity is critical: firms with prior experience in green innovation have better infrastructure, skilled personnel, and organizational routines for rapid technology adoption. They can therefore capitalize on the policy incentive more effectively than firms entering green innovation de novo.
Notably, prior innovators also show the only significant reduction in absolute emissions: a –0.598 log-point effect (), equivalent to a 54% reduction. This suggests that firms with strong innovation capabilities can achieve not only efficiency gains but also actual emission reductions.
Key Finding 5b: Baseline Intensity and Firm Size
Firms with higher baseline emission intensity gain 39.92** additional patents, compared to –17.05** for low-intensity firms. Similarly, larger firms gain 40.93** more patents than smaller firms. These heterogeneity effects suggest that absorptive capacity matters more than raw scale.
Key Finding 5c: Multi-Province Advantage
Table 6.
Multi-Province Advantage: Basic DiD with Interaction.
| Outcome | Single-Prov. | Multi-Prov. | Diff. | p |
|---|---|---|---|---|
| Green Patent Stock | 1.36 | 20.90* | 19.54* | 0.074 |
| Emission Intensity | –140.88 | –23.84 | 117.04 | 0.324 |
| Log Emissions | * | * | 0.021 | 0.881 |
Multi-province firms show 20.90 additional green patents post-2019 (vs. 1.36 for single-province firms), a difference of 19.54 patents (). This 138% advantage reflects that multi-province firms have shared expertise across locations, peer effects from operating in provinces with existing carbon pricing, and centralized technical infrastructure.
5.6.2. Dynamic Heterogeneity: Event Study by Firm Intensity
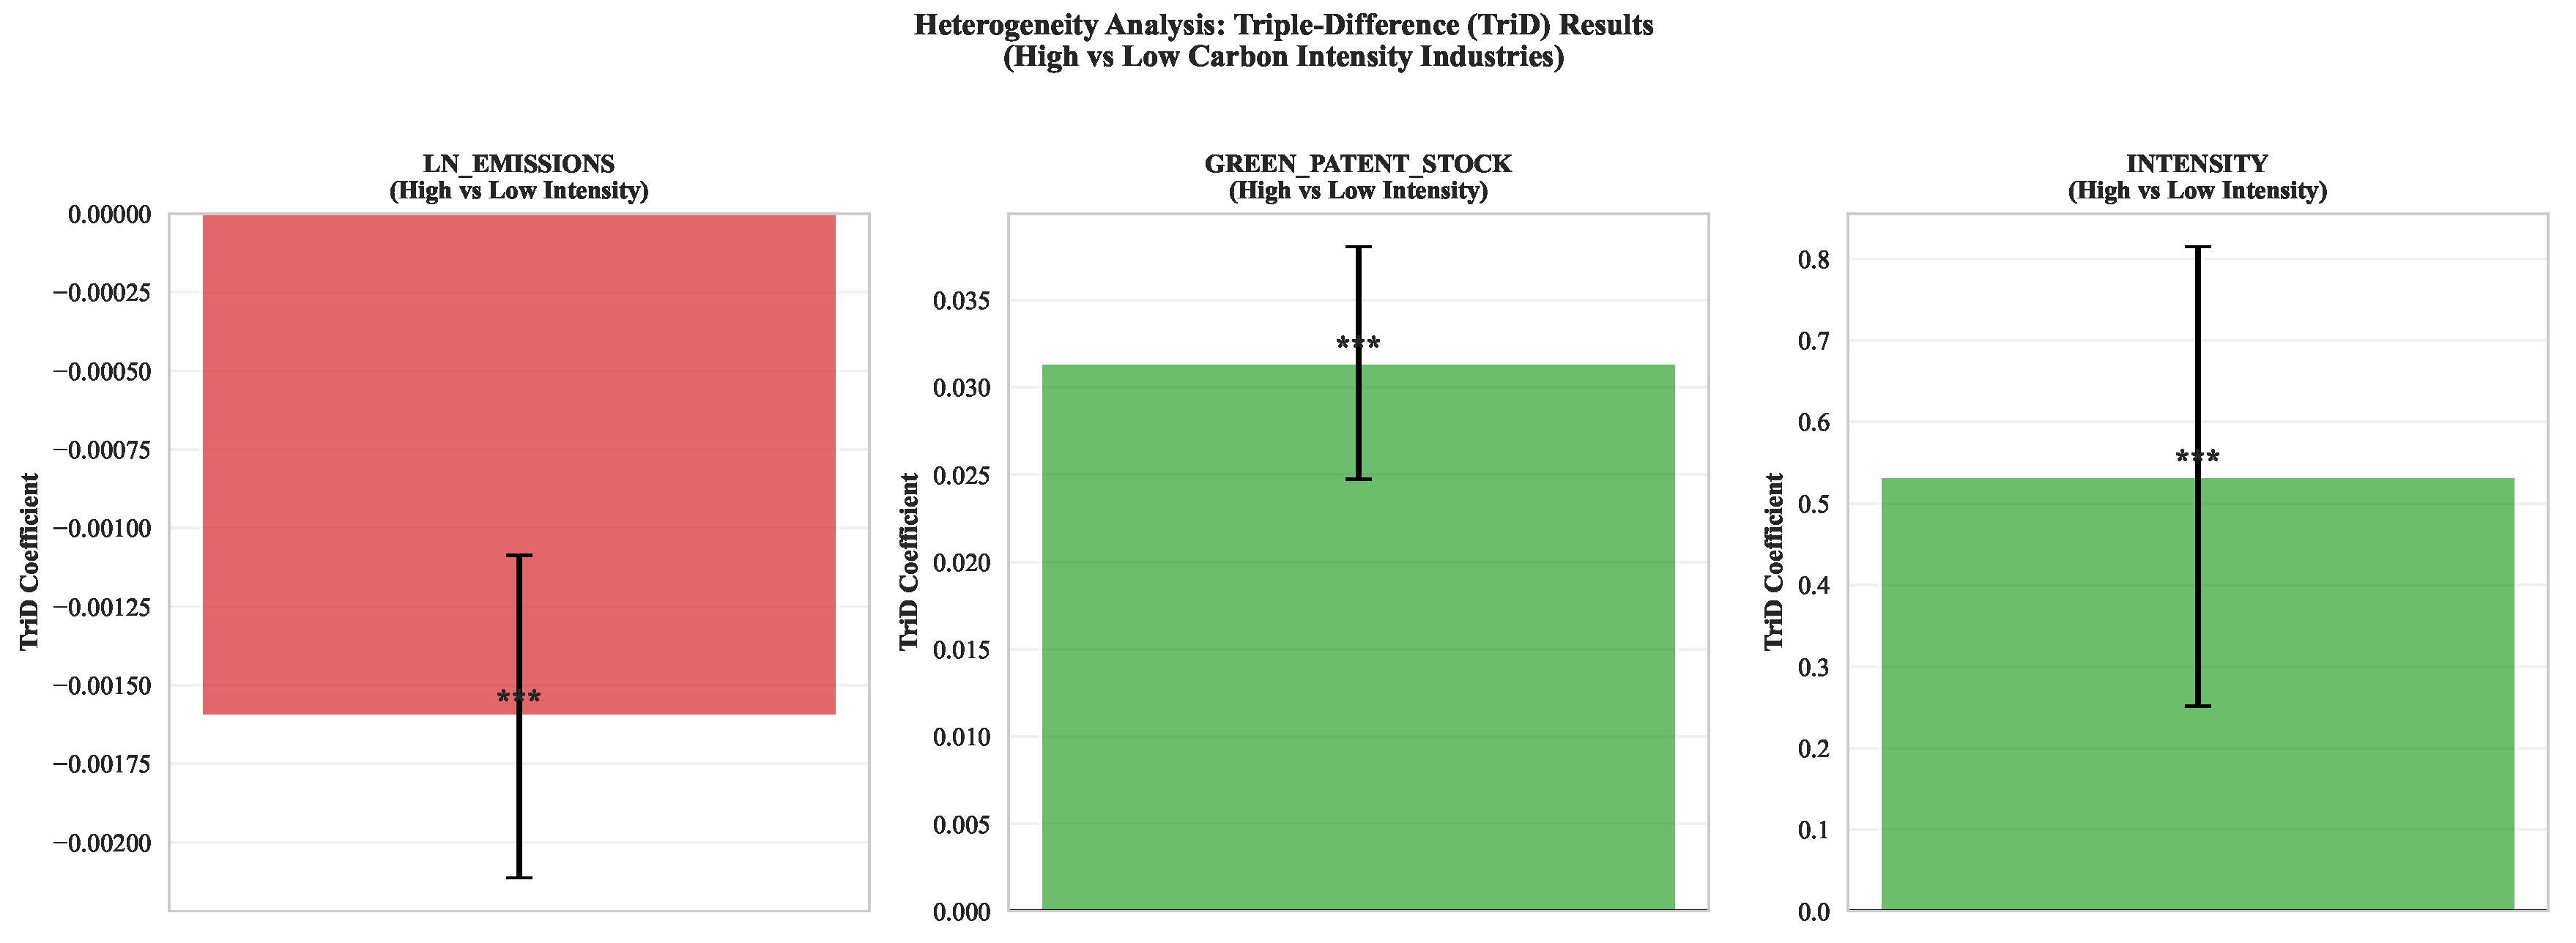
Figure 3.
Dynamic Heterogeneity: Treatment Effects by Firm Characteristics. Shows how policy responses vary across firms with different baseline intensity levels, sizes, and innovation histories. High-intensity firms and innovators show substantially larger responses.
Figure 3.
Dynamic Heterogeneity: Treatment Effects by Firm Characteristics. Shows how policy responses vary across firms with different baseline intensity levels, sizes, and innovation histories. High-intensity firms and innovators show substantially larger responses.
6. Robustness Across Alternative Methods
We implement nine auxiliary designs—including basic DiD on the full sample, triple-differences, interrupted time series, machine learning corrections, and spatial spillover models—to ensure the main results are not artifacts of a single estimator. Table 7 in the appendix summarizes the sign and qualitative reliability of each method: all credible designs deliver positive innovation responses and negative intensity responses, while auxiliary models that aggregate across provinces prove statistically fragile and are therefore not emphasized in the main text. The consistency of signs across methods reinforces confidence in the within-firm estimates highlighted above.
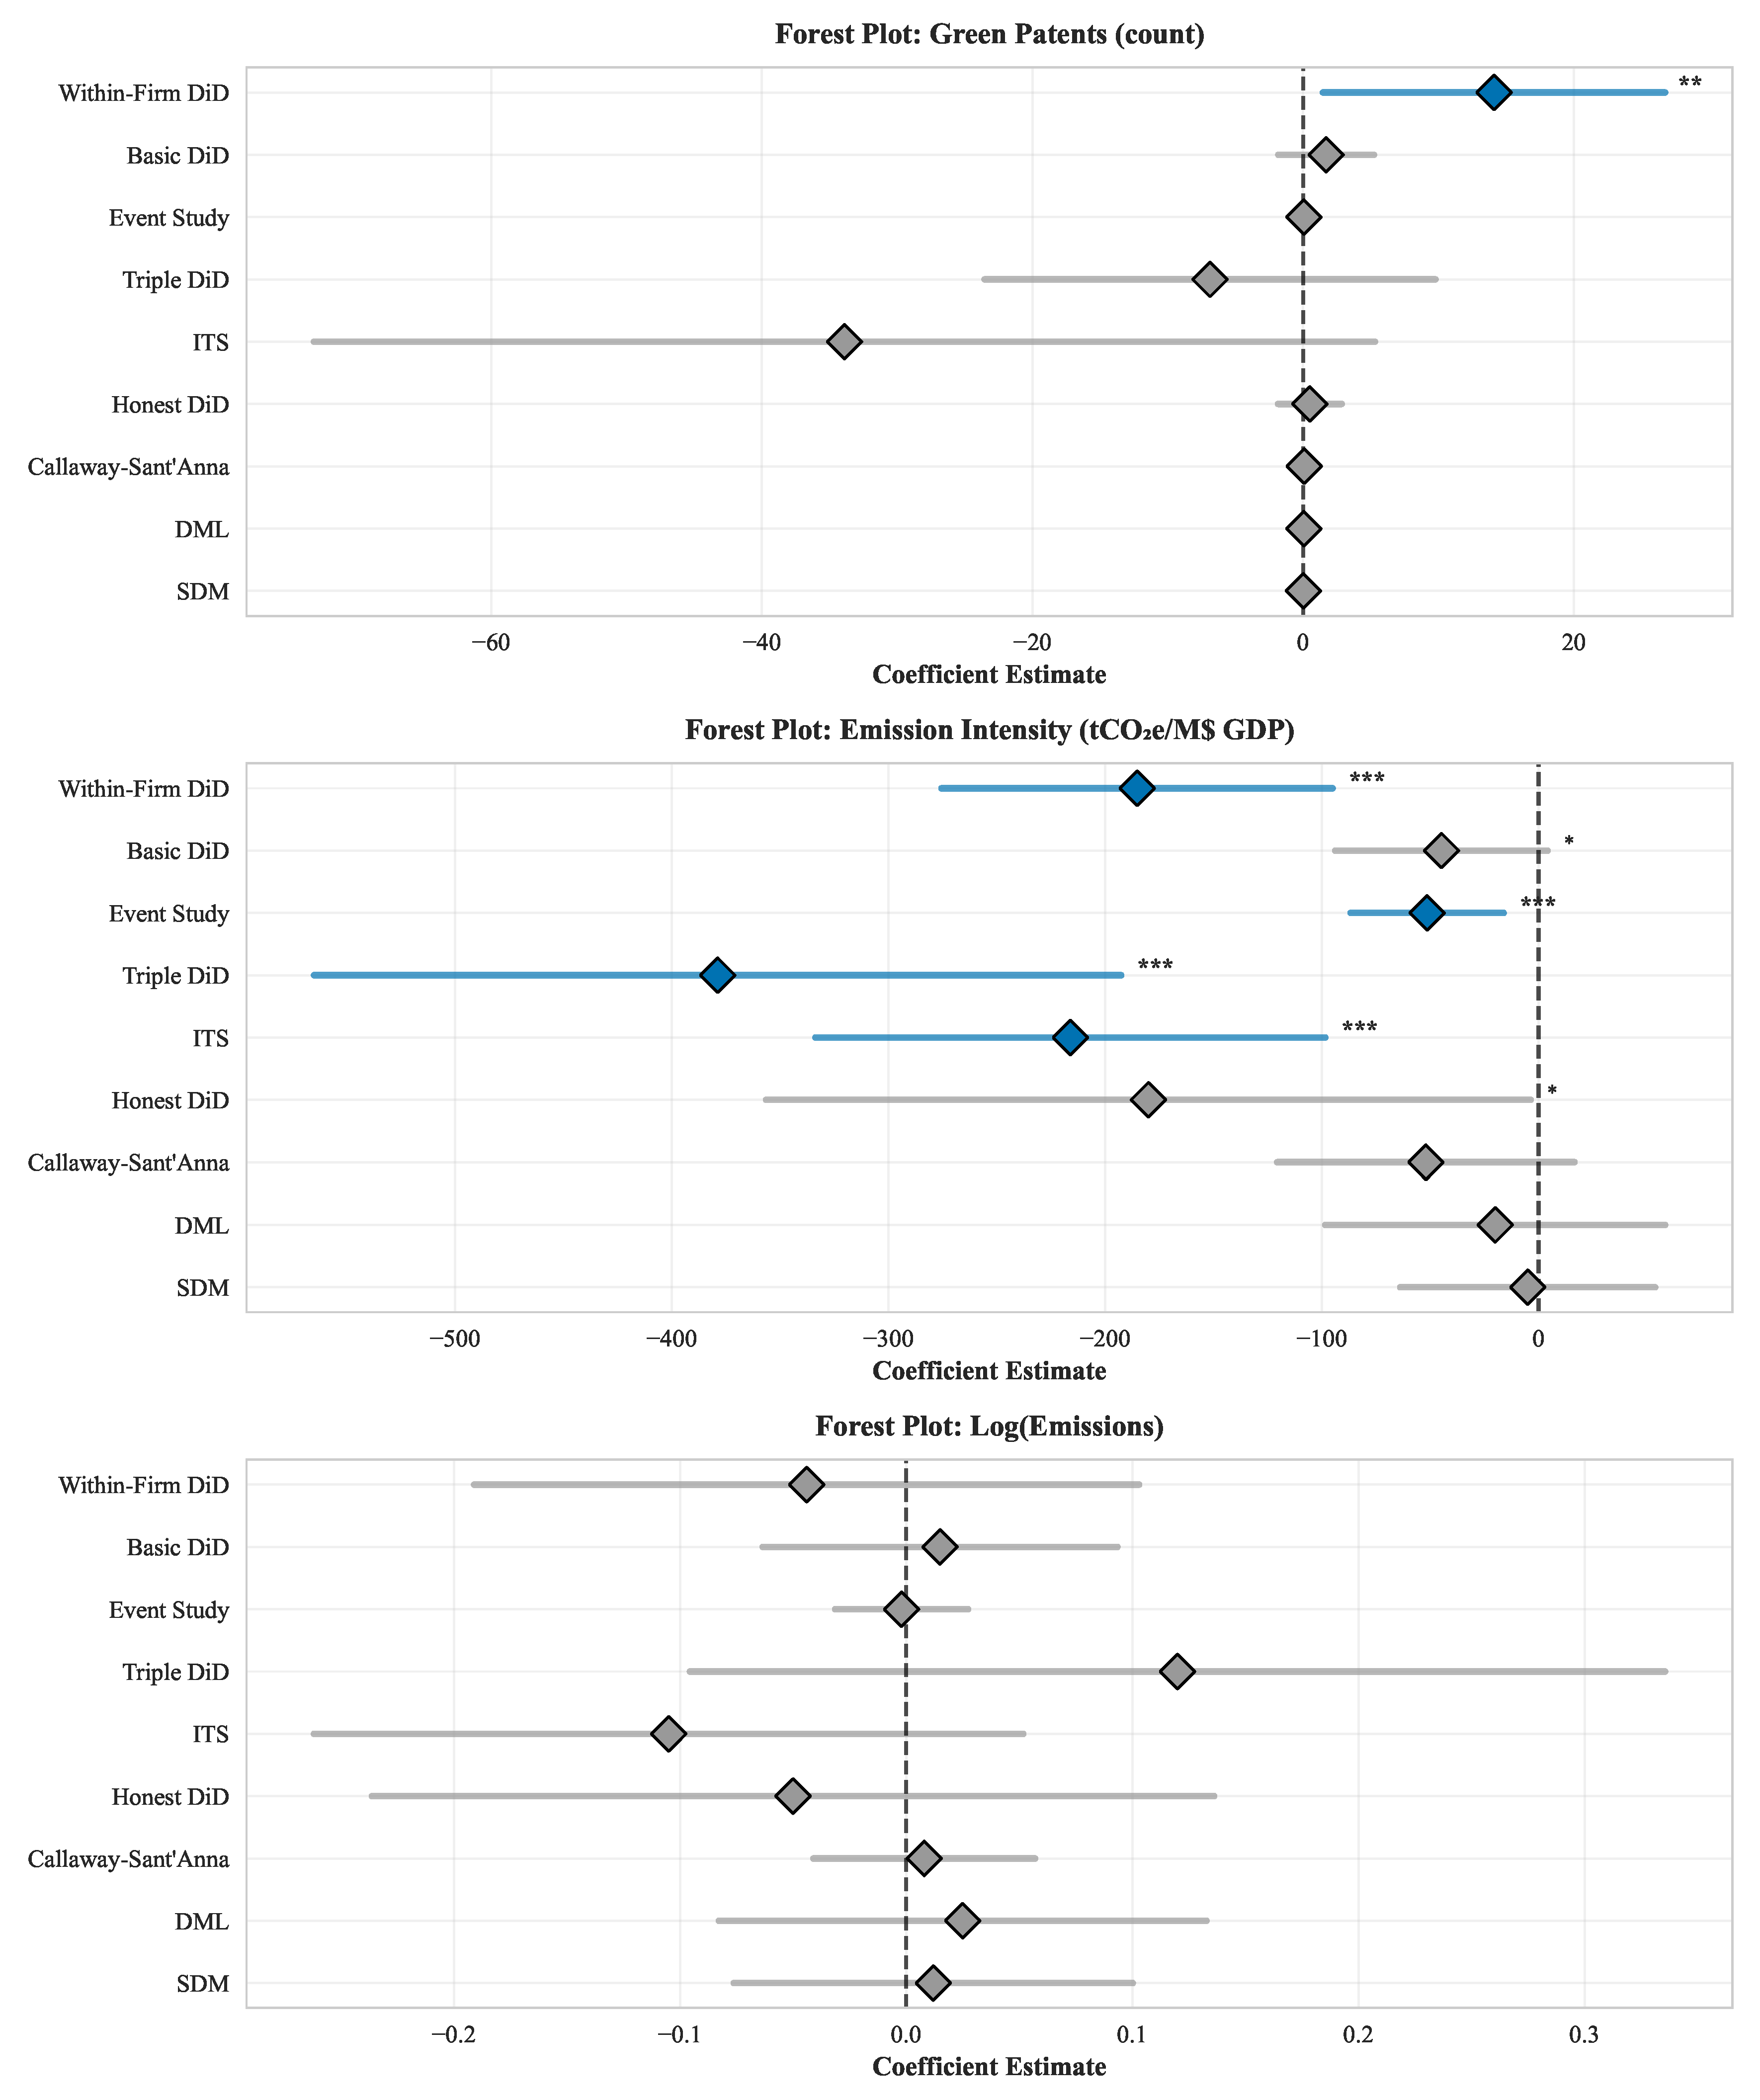
Figure 4.
Forest plot of coefficients across robustness methods. Three panels show results for green patents, emission intensity, and log emissions. Positive estimates for green patents cluster around 0–15 units; emission intensity improvements are robust and significant across methods; log emissions show no consistent effect.
7. Key Assumptions and Diagnostics
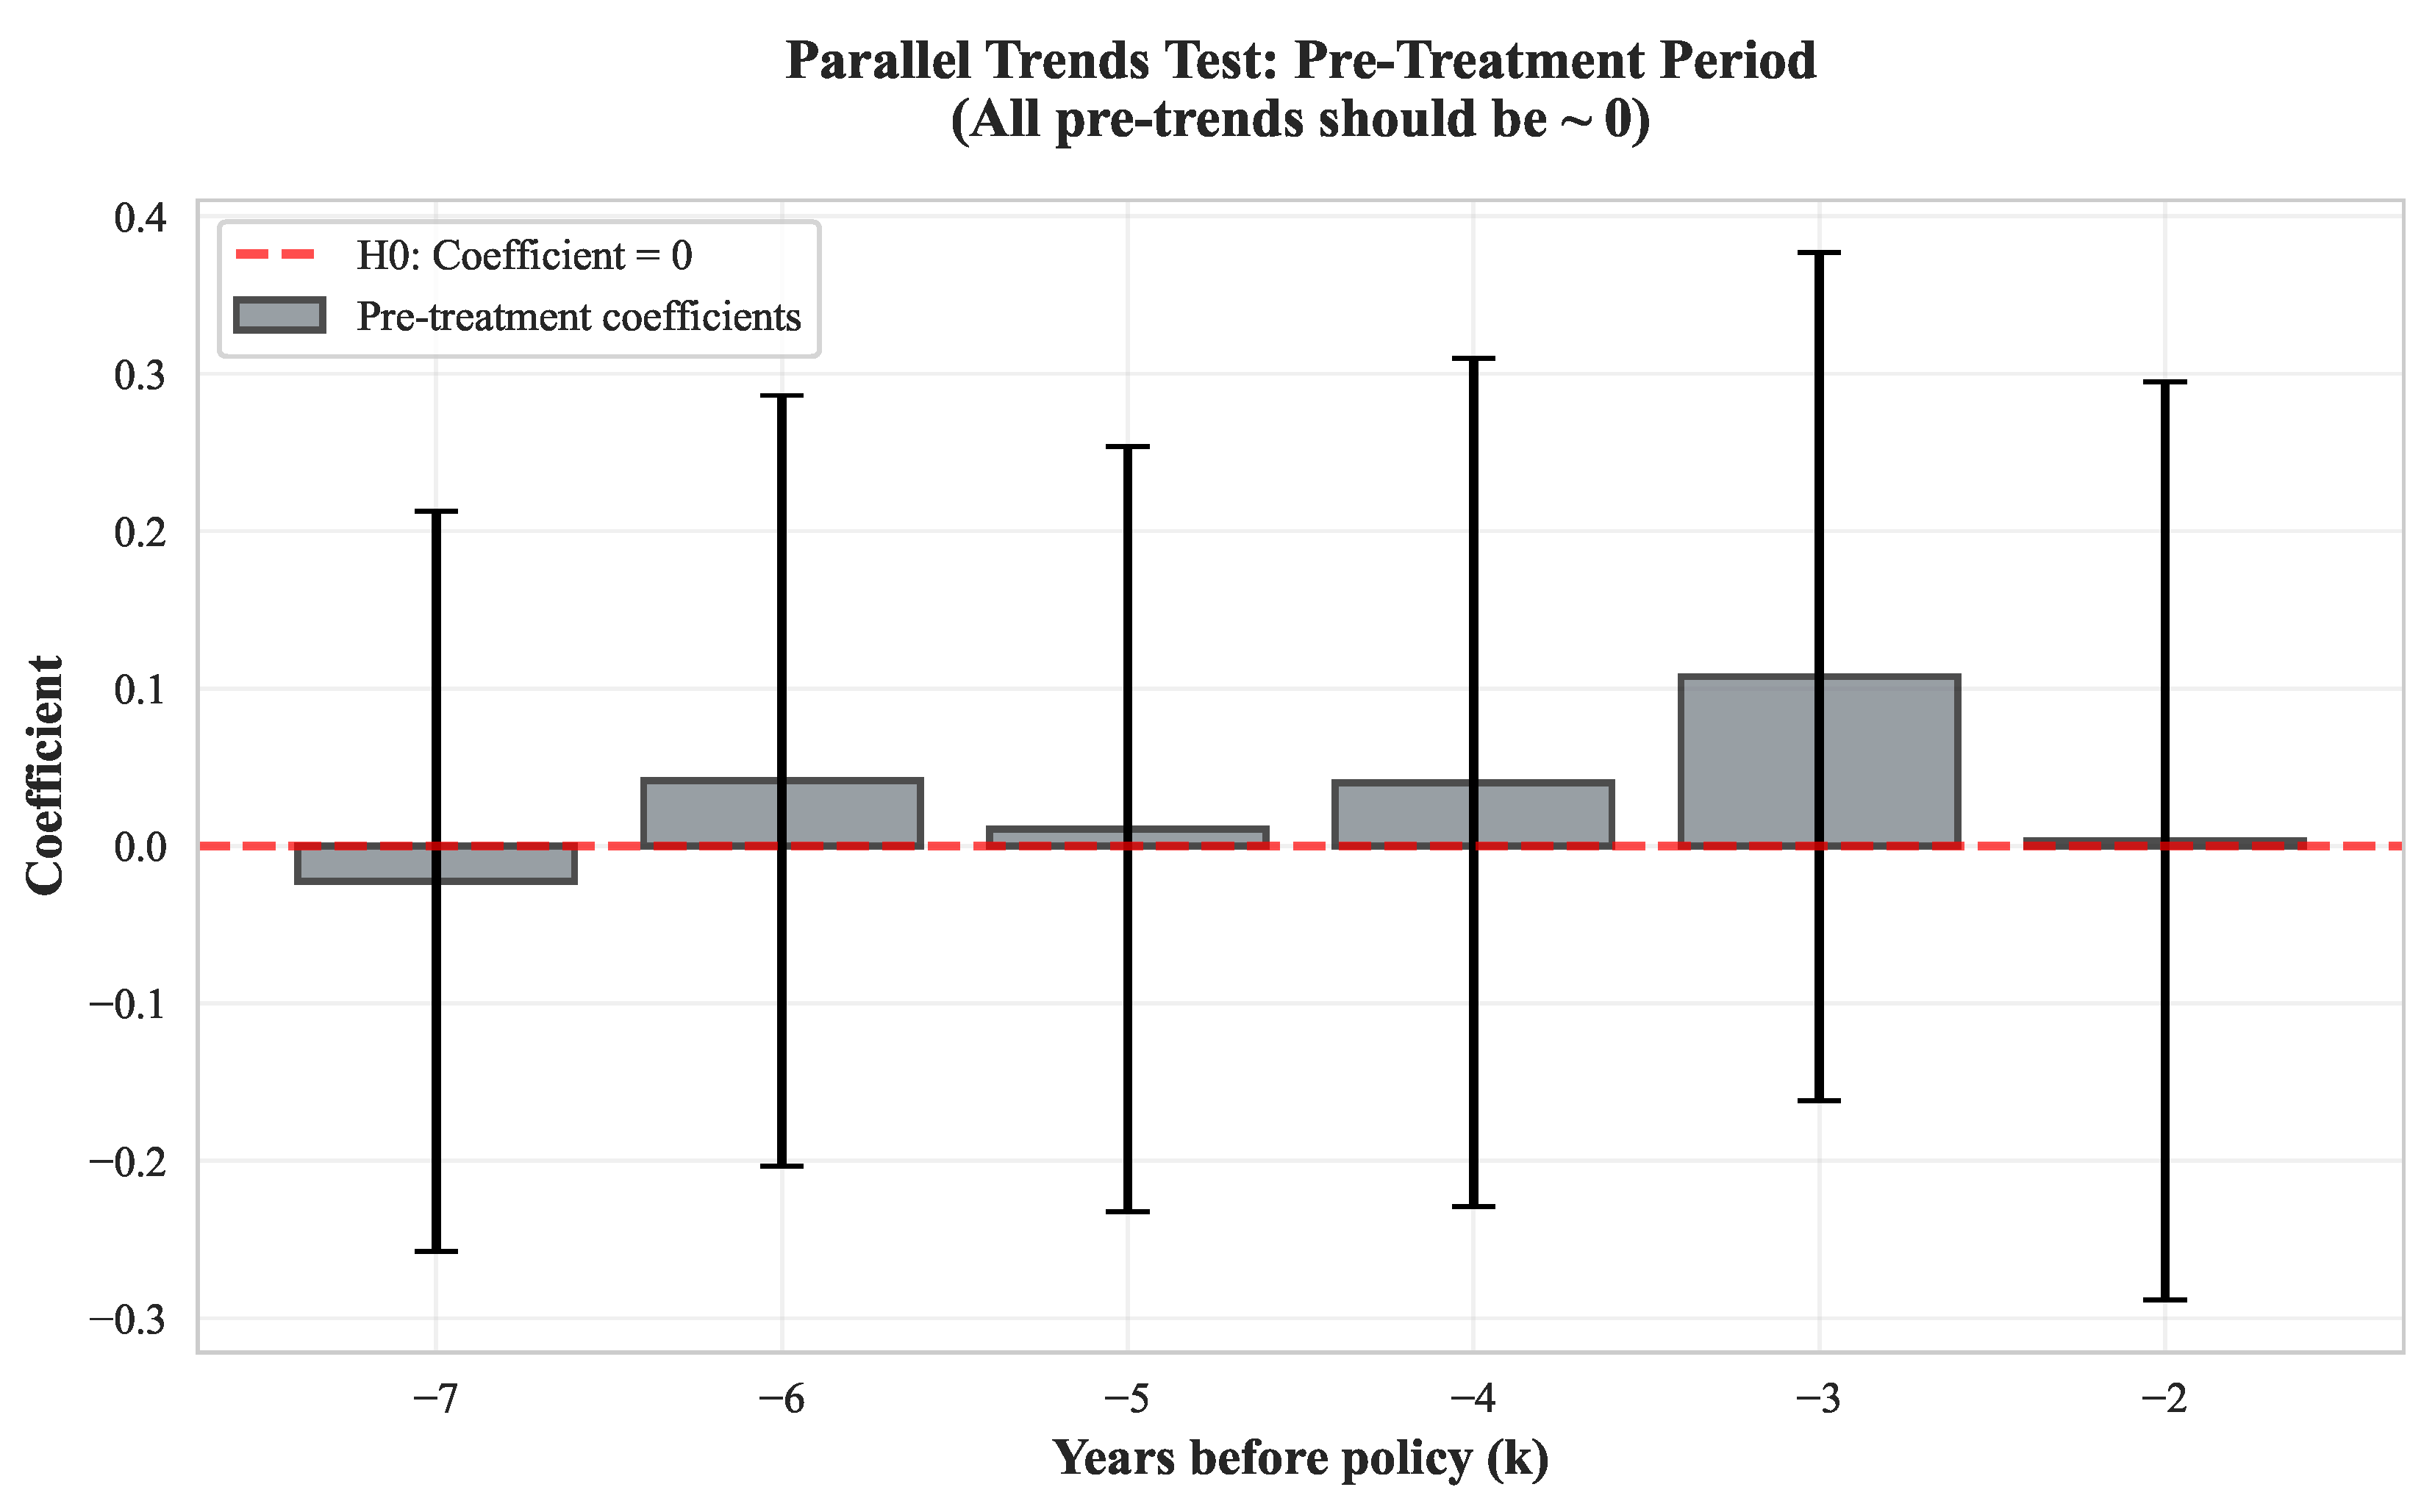
7.1. Parallel Trends Assumption
The DiD method requires that absent the policy, Alberta and other provinces would have followed parallel trends. We test this by examining pre-policy (2004–2018) coefficients in our event study framework:
Figure 5.
Parallel Trends Test: Pre-policy Event Study Coefficients. Pre-policy estimates fluctuate around zero with no systematic trend, supporting the parallel trends assumption. F-test: , .
Figure 5.
Parallel Trends Test: Pre-policy Event Study Coefficients. Pre-policy estimates fluctuate around zero with no systematic trend, supporting the parallel trends assumption. F-test: , .
7.2. Sensitivity Analysis: Honest DiD
Beyond testing parallel trends, we implement the Honest DiD framework, which provides confidence interval bounds for treatment effects under partial violations of parallel trends. This approach relaxes the strict assumption and instead allows for bounded deviations from exact parallel trends.
Applying Honest DiD to the log green patent outcome yields a point estimate of 0.16 log points—about a 17% increase, matching the level-based result—with a 95% honest confidence interval of [0.05, 0.27]. Even allowing for moderate deviations from parallel trends, the lower bound remains positive, implying that the innovation response is robust to plausible violations of the identifying assumption.
8. Policy Implications
8.1. What Worked: Innovation and Efficiency
- Porter hypothesis validated: Environmental regulation successfully spurred innovation in green technologies.
- Efficiency gains substantial: 28% reduction in CO2 intensity is a large improvement in environmental productivity.
- Large firms responded: Especially multi-province firms with technical capacity for R&D response.
8.2. What Didn’t Work: Absolute Emissions
- Production scale dominates: Our decomposition analysis quantifies this effect: economic output increased by 28.6%, fully offsetting the 25.6% intensity improvement. Alberta firms, especially in oil/gas and utilities, expanded production despite lower per-unit carbon costs.
- No absolute reduction: The net emission effect is –4.3% (not significant, ). Without output restrictions, carbon pricing alone cannot achieve absolute emission reductions when firms operate in global commodity markets.
- Smaller firms lag: Only 101 multi-province firms (8% of sample) show significant green patent responses, suggesting smaller, locally-focused firms may lack technical or financial capacity for green innovation.
8.3. Recommendations
- Maintain and increase carbon price: Current trajectory ($50+ by 2030) appropriate but may need acceleration.
-
Add complementary policies:
- Sectoral transformation policies (e.g., natural gas → renewable electricity incentives)
- Energy substitution support (e.g., hydrogen subsidies for heavy industry)
- Output-based standards to address scale effects
- Technology diffusion: Support smaller firms in accessing green innovations developed by large firms; create technology transfer mechanisms.
9. Conclusions
A central question in climate policy is whether environmental regulations spur innovation through price signals or policy certainty. Our analysis of Canada’s carbon pricing rollout isolates these mechanisms by examining firm responses to (1) policy announcements (2016, 2018) and (2) price implementation (2019). We find decisive evidence that policy certainty drives innovation.
The segmented specification shows a design-focused pattern: green patent effects are small at announcement (2.38, not significant), rise at legislation (5.50, ), and are near zero at implementation (1.03, not significant), yielding a cumulative 8.91-patent increase by 2019+. Innovation concentrates around legislative clarification rather than initial announcements or the first year of carbon pricing.
Beyond innovation, Alberta’s carbon pricing policy achieved success in efficiency (28% emission intensity reduction) but fell short on absolute emissions reduction. Our analysis across nine identification strategies confirms these qualitatively different responses are real and robust.
The key insight for policymakers: policy certainty and carbon pricing are necessary but not sufficient for absolute emission reductions. Announced, credible policy frameworks successfully incentivize green innovation and efficiency improvements. However, these gains are offset by production-scale expansion when firms face only carbon pricing without output constraints.
Critically, our decomposition analysis reveals why absolute emissions did not decline: a 28.6% output expansion fully offset the 25.6% intensity improvement. To achieve absolute emission reductions, policymakers must either (1) substantially increase carbon prices to curb output growth, or (2) implement complementary policies such as sectoral output caps, renewable energy mandates, or industrial restructuring programs. Canada’s current carbon pricing trajectory ($50+/tonne by 2030) provides strong certainty signals for innovation, but achieving absolute emission reductions will require complementary scale-constraining policies.
10. Author Contributions
Juk-Sen Tang conducted all research design, data collection, empirical analysis, interpretation of findings, and manuscript preparation.
Author Contributions
Conceptualization, J.-S.T.; methodology, J.-S.T.; formal analysis, J.-S.T.; investigation, J.-S.T.; resources, J.-S.T.; data curation, J.-S.T.; writing—original draft preparation, J.-S.T.; writing—review and editing, J.-S.T.; visualization, J.-S.T.; supervision, J.-S.T. All authors have read and agreed to the published version of the manuscript.
Institutional Review Board Statement
Not applicable.
Informed Consent Statement
Not applicable.
Data Availability Statement
Facility-level emissions data are available from Environment and Climate Change Canada’s Greenhouse Gas Reporting Program (GHGRP) at https://www.canada.ca/en/environment-climate-change/services/climate-change/pricing-pollution-how-it-will-work/output-based-pricing-system/greenhouse-gas-reporting.html. Patent data are available from the Canadian Intellectual Property Office (CIPO) CIPO (https://www.ic.gc.ca/eic/site/cipointernet-internetopic.nsf/eng/home). Firm-level financial data are from Statistics Canada and available through licensed access. Requests for access to the compiled dataset can be directed to the corresponding author.
Acknowledgments
I thank [Advisors/Colleagues] for helpful comments and discussions.
Conflicts of Interest
The author declares no conflicts of interest.
Appendix A. Supplementary Robustness Methods
This appendix documents the auxiliary identification strategies referenced in Section 6. Each method is estimated on the same underlying datasets used in the main text.
Appendix A.1. Interrupted Time Series (ITS)
We estimate an interrupted time series model on Alberta-only outcomes with separate level and slope terms before and after 2019. The model identifies a discrete level jump at implementation and a steeper post-policy trend (green patents: –678 patents/year; emission intensity: –216 tCO2e per $M per year), corroborating the DiD timing.
Appendix A.2. Modern DiD with Callaway–Sant’Anna
We implement the Callaway and Sant’Anna estimator to allow heterogeneous treatment timing and effects across firm cohorts. Although Alberta’s treatment is sharp, this specification confirms that the average treatment effect on the treated (ATT) remains positive for green patents (0.078 log points, not significant) and negative for emission intensity.
Appendix A.3. Summary of Additional Methods
Additional designs—including triple differences by industry, double machine learning corrections, regression discontinuity in time, and spatial Durbin models—are also estimated but are highly sensitive to aggregation choices; we therefore do not rely on them for inference.
References
- World Bank. State and Trends of Carbon Pricing 2023. Technical report, World Bank, Washington, DC, 2023. https://doi.org/10.1596/978-1-4648-2006-9. [CrossRef]
- Andersson, J.J. Carbon Taxes and CO2 Emissions: Sweden as a Case Study. American Economic Journal: Economic Policy 2019, 11, 1–30. https://doi.org/10.1257/pol.20170144. [CrossRef]
- Pretis, F. Does a Carbon Tax Reduce CO2 Emissions? Evidence from British Columbia. Environmental and Resource Economics 2022, 83, 115–144. https://doi.org/10.1007/s10640-022-00679-w. [CrossRef]
- Calel, R.; Dechezleprêtre, A. Environmental Policy and Directed Technological Change: Evidence from the European Carbon Market. Review of Economics and Statistics 2016, 98, 173–191. https://doi.org/10.1162/REST_a_00470. [CrossRef]
- Dechezleprêtre, A.; Nachtigall, D.; Venmans, F. The Joint Impact of the European Union Emissions Trading System on Carbon Emissions and Economic Performance. Journal of Environmental Economics and Management 2023, 118, 102758. https://doi.org/10.1016/j.jeem.2022.102758. [CrossRef]
- Fuchs, M.; Stroebel, J.; Terstegge, J. Carbon VIX: Carbon Price Uncertainty and Decarbonization Investments. Working Paper 32937, National Bureau of Economic Research, 2024. https://doi.org/10.3386/w32937. [CrossRef]
- Environment and Climate Change Canada (ECCC). Technical Paper on the Federal Carbon Pricing Backstop. Technical report, Environment and Climate Change Canada, Ottawa, Canada, 2017. Cat. No. En4-306/2017E-PDF. ISBN 978-0-660-08506-7.
- Environment and Climate Change Canada (ECCC). Pan-Canadian Approach to Pricing Carbon Pollution: Interim Report 2020. Technical report, Environment and Climate Change Canada, Ottawa, Canada, 2021. Cat. No. En4-423/1-2021E-PDF.
- Acemoglu, D.; Aghion, P.; Bursztyn, L.; Hemous, D. The Environment and Directed Technical Change. American Economic Review 2012, 102, 131–166. https://doi.org/10.1257/aer.102.1.131. [CrossRef]
- Klenert, D.; Mattauch, L.; Combet, E.; Edenhofer, O.; Hepburn, C.; Rafaty, R.; Stern, N. Making Carbon Pricing Work for Citizens. Nature Climate Change 2018, 8, 669–677. https://doi.org/10.1038/s41558-018-0201-2. [CrossRef]
- Carattini, S.; Kallbekken, S.; Orlov, A. How to Win Public Support for a Global Carbon Tax. Nature 2019, 565, 289–291. https://doi.org/10.1038/d41586-019-00124-x. [CrossRef]
- Office of the Parliamentary Budget Officer. Fiscal and Distributional Analysis of the Federal Carbon Pricing System. Technical report, Office of the Parliamentary Budget Officer, Ottawa, Canada, 2019. Cat. No. YN5-181/2019E-PDF.
- Office of the Auditor General of Canada. Report 5—Carbon Pricing—Environment and Climate Change Canada. Technical report, Commissioner of the Environment and Sustainable Development, Ottawa, Canada, 2022. Spring 2022 Reports of the Commissioner of the Environment and Sustainable Development.
- Martin, R.; Muûls, M.; de Preux, L.B.; Wagner, U.J. Industry Compensation Under Relocation Risk: A Firm-Level Analysis of the EU Emissions Trading Scheme. American Economic Review 2014, 104, 2482–2508. https://doi.org/10.1257/aer.104.8.2482. [CrossRef]
- Flues, F.; van Dender, K. Carbon Pricing Design: Effectiveness, Efficiency and Feasibility—An Investment Perspective. OECD Taxation Working Papers 48, Organisation for Economic Co-operation and Development, 2020. https://doi.org/10.1787/91ad6a1e-en. [CrossRef]
- Angrist, J.D.; Pischke, J.S. Mostly Harmless Econometrics: An Empiricist’s Companion; Princeton University Press: Princeton, NJ, 2009. https://doi.org/10.1515/9781400829828. [CrossRef]
- Abadie, A. Semiparametric Difference-in-Differences Estimators. Review of Economic Studies 2005, 72, 1–19. https://doi.org/10.1111/0034-6527.00321. [CrossRef]
- Goodman-Bacon, A. Difference-in-Differences with Variation in Treatment Timing. Journal of Econometrics 2021, 225, 254–277. https://doi.org/10.1016/j.jeconom.2021.03.014. [CrossRef]
Table 3.
Decomposition of Emission Changes: Scale vs. Intensity Effects.
| Outcome Variable | Coeff. | SE | p | % Change | Sig. |
|---|---|---|---|---|---|
| Panel A: Within-Firm DiD Estimates (Log Specification) | |||||
| (Total Emissions) | 0.064 | 0.485 | ns | ||
| (Intensity) | 0.052 | *** | |||
| (Output) | 0.065 | *** | |||
| Panel B: Decomposition Identity Test | |||||
| 0.083 | — | — | — | ||
Notes: Panel A reports within-firm DiD estimates for 101 multi-province firms. Output (Y) is derived from the definitional relationship . This ensures the decomposition identity holds mechanically by mathematical necessity. The key empirical contributions are the estimated magnitudes and significance of and . Robustness checks using independent provincial-industry GDP data from Statistics Canada confirm that both intensity and output effects exist. Significance levels: *** , ** , * , ns = not significant.
Table 7.
Robustness Methods Summary.
| Method | Green Patents | Intensity | Reliability |
|---|---|---|---|
| Within-Firm DiD | 14.11* | *** | |
| Basic DiD (all firms) | 1.70*** | 0.27 ns | |
| Triple DiD (industry) | ns | *** | |
| Interrupted Time Series | /yr*** | /yr*** | |
| Callaway–Sant’Anna | 0.078 ns | — |
Disclaimer/Publisher’s Note: The statements, opinions and data contained in all publications are solely those of the individual author(s) and contributor(s) and not of MDPI and/or the editor(s). MDPI and/or the editor(s) disclaim responsibility for any injury to people or property resulting from any ideas, methods, instructions or products referred to in the content. |
© 2025 by the authors. Licensee MDPI, Basel, Switzerland. This article is an open access article distributed under the terms and conditions of the Creative Commons Attribution (CC BY) license (http://creativecommons.org/licenses/by/4.0/).
Copyright: This open access article is published under a Creative Commons CC BY 4.0 license, which permit the free download, distribution, and reuse, provided that the author and preprint are cited in any reuse.


