Submitted:
07 June 2024
Posted:
10 June 2024
You are already at the latest version
Abstract
This study examines if enterprises’ digital transformation enhances their sustainable development capabilities and reduces carbon emissions, thus enhancing carbon neutrality performance and implementing the "dual-carbon" strategy. It specifically explores the impact of Chinese firms’ digital transformation on carbon neutrality performance in 30 provinces and municipalities in China from 2011 to 2021. Based on the Difference-in-Difference method and spatial econometric modeling, this study finds a U-shaped relationship between enterprise digital transformation and carbon performance, with spatial spillover effects. It also finds that converting environmental charges into taxes can significantly improve carbon performance. In terms of the mechanism of action, digital transformation affects carbon performance by influencing energy use efficiency and adjusting the level of industrial structure advancement and rationalization. In terms of heterogeneity, this U-shaped relationship exists only in the eastern and central regions, and the significance is more substantial in the east; in addition, the impact of enterprise digital transformation on carbon performance is more evident in regions with higher R&D intensity and higher economic development levels. These findings imply that the government should further encourage and guide enterprise digital transformation, monitor the effects of environmental protection policies and select and implement carbon emission reduction strategies according to local conditions to improve carbon performance.
Keywords:
Enterprise digital transformation
; Carbon neutrality performance
; environmental protection policies
; emission reduction strategies
Introduction
China’s proposal of a “dual-carbon” target reflects the commitment of a major country and its determination to transform its economy into a low-carbon one based on corporate digital transformation. It is an ethical action taken by a large developing country when the world is facing severe environmental problems (Cuilli, Kolk, & BoeLillegrave, 2020; Dhanda & Hartman, 2011). It also demonstrates China’s stance on environmental protection and its commitment to actively promote building a community of shared human destiny and sustainable earth, and gaining environmental and ethical legitimacy (D’Cruz et al., 2022; Depoers, Jeanjean, & Jerome, 2016; Li et al., 2018; Xu, Chen, & Dai, 2023). Meanwhile, China’s “14th Five-Year Plan” explicitly proposes accelerating digital development and building a digital China, making clear arrangements to expedite the construction of a digital economy, society, and government and creating an excellent digital ecosystem. According to the Accenture 2023 China Enterprise Digital Transformation Index, 46% of Chinese enterprises surveyed said they would increase investment in artificial intelligence and automation. As a key driver of economic growth, digital transformation is an important fulcrum for industrial transformation and upgrading, helping shape a new low-carbon development model (She, Wu, & Zheng, 2022). So, while achieving transformation and upgrading at the micro level, can the digital transformation of enterprises also reduce carbon and expand green, improve local carbon neutrality performance, and support the national ‘dual-carbon’ strategy at the macro level? This paper answers this question.
In recent years, scholars have paid more attention to enterprise digital transformation and examined its economic effects. Enterprise digital transformation can improve the efficiency of enterprise resource utilization, promote innovation, and reduce carbon dioxide and pollutant emissions (Li, Wang, & Wu, 2024; Usai et al., 2021; Yang, Zheng, & Liu, 2022). It can also promote upgrading industrial and improve the marketization level (Li & He, 2022), and help promote high-quality development and realize carbon neutrality goals. On the other hand, digital transformation has not much improved carbon neutrality performance as expected. It requires substantial capital and energy investment, which may lead to more carbon dioxide emissions. Many firms struggle to successfully assimilate artificial intelligence capabilities into their business models and operations at scale (David et al., 2021). This means that digital transformation may have contrasting effects, being positive and negative to carbon neutrality performance at its different development stages: In other words, digital transformation may have a non-linear relationship to carbon performance. Thus, more research is needed to support the role and mechanism of digital transformation in terms of its effect on carbon neutrality performance.
While the existing literature primarily explores the impact of enterprise digital transformation on economic performance as a whole, few studies explore in depth the effect of enterprise digital transformation on carbon neutrality performance at the regional level. This study is intended to address this limitation with a particular focus on 30 provinces and municipalities in China. The contribution of this paper is three-fold. First, some scholars test the impact of digital transformation on carbon performance based on single linear thinking. Meanwhile, this study starts from the macro level, takes 30 provinces and municipalities in China as the research object, and deepens and supplements the relationship between the two based on non-linear thinking, which can not only enrich the research content on enterprise digital transformation but also provide a path reference for effectively improving carbon neutrality performance. Second, few studies explored macro-level factors explaining the relationships between enterprise digital transformation and carbon neutrality performance. This paper examines the moderating roles of energy use efficiency and industrial structure transformation. Third, this paper uses the Difference-in-Difference method to test the interactive impact of enterprise digital transformation and environmental protection policies on carbon neutrality performance. This examination is expected to help confirm policy effects and then provide implications on governmental policies relating to tax systems for green and low-carbon development to effectively promote the development of the digital economy and facilitate the realization of the goal of carbon neutrality.
Theoretical Background
Literature Review on the Impact of Digital Transformation on Carbon Performance
In recent years, with the development of digital technology, represented by the internet, artificial intelligence, and big data, more and more enterprises have joined the digital wave. Digital transformation is a profound change in enterprises and organizations’ business processes, organizational capabilities, and business models, using digital technologies to address current and future opportunities and challenges (ElMassah, 2020). The study by Li et al. (2018) emphasizes that digital transformation is not only about acquiring digital technologies suitable for the enterprise and redesigning business processes. It is about building a new business operating model through digital technologies to improve the core competitiveness of the enterprise. In summary, digital transformation is a means to enhance market competitiveness by improving data mobility and production factors’ distribution structure and business models. Most existing research on enterprise digital transformation focuses on the micro level and explores its impacts on internal innovation (Li, 2021; Zhang & Dong, 2023), enterprise risk-taking (Zhao, 2024), corporate governance (Zhang & Yang, 2022), and production and investment efficiency (Zhao et al.,2021; Ren & Zhao, 2022). Scholars have found that enterprise digital transformation can promote green innovation and its efficiency (Xu, Sun, & Kong, 2024). The relationship between enterprise digital transformation and green technological innovation has been explored and analyzed, which makes a theoretical foundation for implementing energy conservation and emission reduction by enterprises through technological innovation.
Meanwhile, carbon performance-related research is still relatively lacking because its development is relatively short, theoretical research on carbon performance is still being explored, and the definition of carbon performance has not been fully unified. In previous studies, carbon emission-related information is mainly included in environmental information, and from the perspective of environmental performance, carbon performance is the carbon management and carbon emission reduction strategy adopted according to the strategic goal of carbon emission reduction and evaluates the effect of achieving the goal. Research on carbon performance mainly focuses on the measurement of carbon performance level. Some scholars have constructed an evaluation system from the dual dimensions of inputs and outputs (Zhang & Liu, 2020) to measure carbon performance, while others use the four steps of process-orientation (relevant policies, processes, disclosure, and strategic actions) (Haque & Ntim, 2020), the actual total greenhouse gas emissions (Ashraf & Meschi, 2014; Haque & Ntim, 2020) to reflect corporate carbon performance. Some other scholars use the ratio of main business cost to total sales (Luo & Tang, 2014) as an indicator to measure corporate carbon performance, and gradually add cost elements and so on (Xie & Liu, 2020) to improve the indicator.
Although there is still no unified definition of carbon performance, carbon performance is agreed to closely related to greenhouse gas emissions, energy input and output efficiency, and is an important indicator to evaluate the low-carbon production and operation of enterprises or regions. Other studies have primarily focused on the drivers of corporate carbon performance. From the internal perspective of firms, traditional energy use as an input link to corporate production is inextricably linked to carbon performance and internal factors such as energy use efficiency (Wu & Wen, 2013) and board characteristics (Haque, 2017), green finance reform and innovation policies (Li et al.,2024) also affect carbon performance. In addition, studies have shown that corporate carbon performance is also influenced by external factors such as government policies (Jia et al., 2023; Zhou, Li, & Zeng, 2020), external environmental pressures (Zhou & Liu, 2022), and public pressures (Cheng, Xu, & Li, 2018; Zhou & Wang, 2018).
Still, less attention has been paid to the relationship between enterprise digital transformation and carbon performance; some scholars argue from a micro perspective that enterprise digital transformation improves enterprise environmental performance by strengthening enterprise environmental monitoring and optimizing enterprise environmental performance (Yu & Wang, 2023). Others have shown that digitalization reduces enterprise carbon intensity by promoting enterprise technological advancement and green innovation (Hu & Guo, 2023; Xue et al., 2022). Other related studies are mostly on the impact of digitalization level, digital finance, and digital economy on carbon emissions, and few scholars believe that the development of the digital economy field will increase electricity and energy consumption and cause excessive growth of carbon emissions (Salahuddin & Alam, 2015; Jones, 2018). The majority of scholars believe that the development of digital technology will improve carbon performance: Enterprise digitalization level affects enterprise carbon performance through green technology innovation (Xiao et al., 2023; Xue et al., 2022) and exerts energy saving and emission reduction effects through supply chain optimization; the digital infrastructure can promote carbon emission efficiency(Yu & Hu ,2024); the development of digital inclusive finance can achieve the improvement of carbon emission efficiency by promoting the improvement of regional innovation and entrepreneurship level (Xu, Zhou, & Liu, 2022; Shi & Li, 2021); the digital economy’s green development promotion, and explore its industry heterogeneity and spatial spillover effects, etc. Some scholars suggest that the development of digital technology may be the best solution for China to achieve the dual-carbon goal, using information technology and intelligent transformation to strengthen the carbon emission reduction effect (Xu, Ren, & Chang, 2019) and using big data to promote the optimization of demand structure and the transformation and upgrading of traditional industries, which will help green development.
Our review has identified two research limitations in the existing literature. First, there are still few studies on the relationship between digital transformation and enterprise carbon performance, and furthermore, the existing literature considers the relationship from a linear perspective while arguing that developing the digital economy and using digital technology can effectively promote green development and bring new theoretical perspectives on energy saving and emission reduction. Rather, the effect of enterprise digital transformation may vary, being positive or negative at its levels. Thus, an non-linear relationship can exist; second, the mechanism in which key macro-level factors such as energy use efficiency and industrial structure transformation is less clear in the existing literature. This paper is intended to analyze the impact of enterprise digital transformation on carbon neutrality performance and provide a theoretical and practical basis for the achievement of carbon neutrality.
Hypothesis Development
Carbon neutrality performance as a measure of the outcome relating to efforts to reduce carbon emissions is of great significance today in China. The wide application of digital technology has promoted emerging technologies and the rise of new industries, which play a critical role in China’s economic development and transformation and is an important way to achieve the carbon reduction goal. In the early stages of the digital transformation of enterprises, new technologies such as smart manufacturing, the Internet of Things, and AI require certain capital and energy inputs, which may lead to a short-term increase in carbon emissions in one aspect.
In another aspect, however, these technologies have higher innovation and environmental protection potentials, inject new momentum into the economy, upgrade industrial structure, and thus reduce carbon emissions. Enterprise digital transformation can enhance carbon neutrality performance in the following three aspects: first, with digital technology and greening strategy, enterprises gradually reduce traditional energy consumption (Shao et al., 2022; Zhang & Wei, 2019), optimize the production process, monitor and manage energy consumption more accurately, achieve the improvement of production efficiency, and eventually control carbon emissions effectively. Second, digital transformation can improve the efficiency of enterprises to process information on a regional scale to a certain extent (Jiang, Liu, & Duan, 2023), allowing enterprises to make timely adjustments to market demand, reduce the waste of resources based on cost reduction, and use regional resources efficiently. Finally, digital transformation can effectively promote the coordination of the energy supply and consumption at the macro level by using digital technologies such as the Internet of Things, big data, and cloud computing to improve the efficiency of regional energy collection and use.
On this basis, this paper proposes the following hypothesis:
Hypothesis 1:
Enterprise digital transformation has a U-shaped relationship with carbon neutrality performance, initially negative but then positive later.
From the energy use perspective, improving energy efficiency is one of the keys to achieving carbon neutrality. Energy is the foundation of economic development, but excessive energy consumption may lead to resource shortages and environmental problem. Improving energy efficiency can help meet growing demand with limited resources, maintain the balance between energy supply and demand, and thus reduce regional carbon emissions, slowing resource depletion and environmental pollution in parallel with economic growth. However, the early stages of enterprise digital transformation may involve large-scale system integration and collaborative work and face adjustments in production modes and technical standards, leading to incoherence and reduced efficiency in some energy systems. Enterprise digital transformation may also involve updating and replacing equipment. New digital systems may need to be adapted and integrated into the existing energy infrastructure. It will take some time for these changes to take full effect, which may affect the overall efficiency of energy use.
However, stepping into the mid-to-late stage, on the one hand, as the digital transformation of enterprises drives the integration of digital technologies into the production side, the deep integration of the energy system with emerging information technologies accelerates the renewal and replacement of production equipment, significantly improving the efficiency of energy use, thus achieving the goal of emission reduction and efficiency. On the other hand, the digital transformation of enterprises also lays the technical foundation for the production and promotion of clean energy (Chen, Hu, & Cao, 2021), compresses the proportion of traditional fossil energy, optimizes the energy structure, and drives enterprise production activities to reduce dependence on non-clean energy. In addition, relevant departments can use data analysis to understand energy use better and optimize it. By monitoring and analyzing data in real-time, potential efficiency problems are identified, and timely measures are taken to optimize them, providing a more powerful tool to achieve subsequent improvements in energy use efficiency.
In summary, we propose the following hypothesis.
Hypothesis 2:
Enterprise digital transformation improves carbon neutrality performance by increasing energy use efficiency.
Based on the core features of digital transformation, digital transformation is a meaningful way to optimize the allocation of industrial resources and improve economic efficiency (Chen & Chen, 2021). First, some traditional industries may be impacted. Digital industries may take some time to replace some traditional industries. This development may lead to an initially unstable industrial structure and a tendency to lower the level of industrial structure optimization. Second, enterprises may need to establish new partnerships, ecosystems, and value chains to adapt to the development of the digital economy, and there may be some uncertainties and adjustments in this process, affecting the overall level of industrial structure optimization.
However, as the digital transformation of enterprises continues to advance, it is an important means to develop technology from low to mid-range to high-end, which helps to raise the level of industrial structure advancement and shift the industrial economic development model to a more effective direction. Improving the level of industrial structure advancement helps to build a greener and more sustainable industrial system, reduce the proportion of carbon-intensive industries, strengthen the application of clean technology and renewable energy, and promote the transformation of enterprises and industries to a more sustainable development path. It can also promote sustainable economic development, enhance a country’s or region’s global competitiveness, and make a major contribution to achieving the goals of carbon neutrality and sustainable development goals.
On the other hand, digital transformation is usually accompanied by establishing an innovation ecosystem, involving cooperation and integration between different industries. Also, it provides digital means that help improve the efficiency of information transfer and synergy between industries, which is conducive to enhancing the degree of coordination between industries and rationalizing industrial structure. At the same time, it has been found that the rationalization of industrial structure has a positive impact on the ecological environment, which promotes innovation and cooperation between industries by improving the method of resource allocation, and adjusting the proportion of industries (Zhou & Jiang, 2020), and ultimately reduces the intensity of carbon emissions.
In summary, this paper proposes the following hypotheses:
Hypothesis 3a:
Enterprise digital transformation enhances carbon neutrality performance by improving industrial structure advancement.
Hypothesis 3b:
Enterprise digital transformation enhances carbon neutrality performance by rationalizing industrial structure.
Implementing environmental protection fee as a tax reflects the government’s determination to protect the environment and brings external policy pressure on enterprises, especially heavy polluters. Although the environmental protection tax policy does not include carbon dioxide in the scope of taxation, carbon dioxide and sulfur dioxide have the same root characteristics (Zhu & Yu, 2023); that is, enterprises with high pollution emissions tend to have high carbon emissions as well, and enterprises with high carbon emissions also produce higher levels of other pollutants. Enterprises are affected by environmental policies(Dechezleprêtre, A., & Sato, M. 2017), and institutional pressure can also influence enterprise decisions to engage in carbon reduction (Wang, Sun, & Liu, 2019). The environmental protection tax policy achieves a synergistic effect of emission reduction by increasing tax pressure and forcing enterprises to save energy, reduce emissions, and optimize their economic structure while reducing pollution emissions simultaneously.
Therefore, in the long run, to obtain profits and reduce the cost burden, enterprises will consider integrating digital technology, improving the efficiency of energy factor use with the help of digital transformation, promoting the development of renewable energy, transitioning from traditional production to high-tech industry and green production technology, reducing carbon emissions at the source, and the level of regional carbon performance will be increased subsequently. Therefore, this paper proposes the 4th hypothesis as follows:
Hypothesis 4:
Enterprise digital transformation performs as a positive influencer in modulating the effect of environmental fee-to-tax policy on improving carbon neutrality performance.
Research Methodology
Samples & Data
In this paper, we select the panel data of 30 provinces and municipalities in China, excluding the Tibet region, from 2011-2021. The data are sourced from the Statistical Yearbooks of each province and municipality, the China Energy Statistical Yearbook, the China Statistical Yearbook, the Cathay Pacific Database, and the CEIC China Economic Database.
Table 1 shows the descriptive statistics of the main variables.
Definitions & Measurements
Dependent variable: Carbon Neutrality Performance (CNP). Because the main way to achieve the goal of carbon neutrality is to reduce carbon dioxide emissions, this paper, from the perspective of input and output, uses the ratio of the regional gross domestic product of each province and urban area to carbon emissions to measure, that is, the unit of carbon emissions caused by the output value, the larger the value, the better the energy saving and emission reduction effect, the higher the value, the better the energy saving and emission reduction effect and the higher the level of carbon performance. Considering the availability of data, the carbon emissions of each province are estimated according to the actual consumption of energy, energy conversion standard coal coefficient and carbon emission coefficient, and nine kinds of energy sources are selected, such as coal, coke, crude oil, fuel oil, paraffin, diesel, etc. Some subdivisions of energy sources are not published in China, such as fuel oil, which is chosen to be replaced by crude oil conversion standard coal coefficient, and the data are obtained from “China Energy Statistical Yearbook”. The formula is as follows.
where, Cit denotes the carbon emission of province i in year t, Eij is the actual consumption of energy type j in province i, Wj is the carbon emission factor of energy type j, and βj is the coefficient of th standard coal discount for energy type j.
Independent variable: Degree of digital transformation (Dig). Based on the definition of digital transformation of enterprises, this paper relies on (Wu et al., 2021) to use text analysis to represent the intensity of digital transformation of individual enterprises. After excluding ST and suspended samples, the annual reports of A-share listed enterprises in Shanghai and Shenzhen from 2011 to 2021 are searched for digitally related feature words using Python, matched, and summed by word frequency. As this type of data usually has the characteristic of being “right-skewed”, this paper performs logarithmic processing to obtain the overall indices representing each enterprise’s digital transformation. The degree of digital transformation of enterprises in each province and municipality in the year is aggregated and divided by the number of listed enterprises, which is used as an overall index to measure the degree of digital transformation of enterprises in each province and municipality. Specifically, the digital transformation thesaurus includes multiple technologies, such as artificial intelligence, blockchain, cloud computing, and big data technology. Adopting the above methodology is reliable because the words and expressions in enterprises’ annual reports reflect their development orientation and can effectively reflect their strategic characteristics and prospects. At the same time, enterprises are affected by local policies, market environment, and the degree of digital transformation of all listed enterprises in each province and municipality can be summed and averaged to reflect the overall level of digital transformation in the region.
Control variables: (1) Urbanization rate (ur) is measured by the ratio of urban population to total population. (2) Investment intensity (invR) is measured by the ratio of total fixed investment to regional GDP in each provincial and urban area. (3) Number of large and medium-sized enterprises (firm) is the number of large and medium-sized industrial enterprises in each province and urban area. (4) Foreign direct investment (fdi) is measured by the ratio of total foreign direct investment to regional GDP. (5) Financial development level (fdl) is the ratio of deposits and loans of financial institutions to regional GDP. (6) Transport infrastructure level (ti) is the natural logarithm of road kilometers. (7) Government intervention (gov) is expressed as the ratio of local fiscal expenditure to regional GDP.
Mechanism variables: (1) Energy use efficiency (egdp). This paper draws on (Wu et al., 2005) to select the ratio of regional GDP to total energy consumption to measure energy efficiency. This indicator represents the output value brought by the regional energy consumption unit; the larger its value, the higher the energy use efficiency. (2) The level of industrial structure optimization, this paper adopts the practice of (Gan, 2011) to divide the transformation and upgrading of industrial structure into two dimensions: industrial structure advancement (tl) and industrial structure rationalization (ts). In this paper, the ratio of the tertiary industry’s output value to the secondary industry’s output value is adopted to measure industrial structure advancement. The service-oriented economic structure driven by information technology is an essential feature of industrial structure upgrading, and this method can reflect the trend of service-oriented economic structure. In this paper, the Tel index is used to measure the rationalization of industrial structure; the rationalization of industrial structure refers to the quality of inter-industry aggregation, which, on the one hand, reflects the degree of coordination between industries, and, on the other hand, should reflect the degree of effective use of resources, that is, it is a measure of the degree of coupling between the factor input structure and the output structure. If the economy is in equilibrium, tl=0; if it is not 0, it indicates that the industrial structure deviates from equilibrium and the industrial structure is inappropriate. The index considers the relative importance of industries and avoids the calculation of the absolute value, and at the same time, it retains the theoretical basis and economic meaning of the degree of structural deviation, so it is an effective measure of the rationalization of the industrial structure. The formula is as follows:
where tl is the Tyrell index, i.e., the degree of deviation from the industrial structure, Y denotes output value, L denotes employment, i denotes industry, and n denotes the number of industrial sectors. According to the assumption of classical economics, the economy is eventually in equilibrium, and the productivity level of each industrial sector is the same. By definition, Y/L means productivity, so when the economy is in equilibrium, Yi /Li =Y/L,so tl=0.
The definitions and descriptions of all variables are shown in Table 2.
Analytical Procedure & Estimation Technique
Baseline regression model: In this paper, the following multivariate regression model was developed to explore the impact of the degree of digital transformation on carbon neutral performance by Hausman, Prob > chi2=0.000 < 0.05, using a two-way fixed effect model:
where CNPit denotes the carbon performance of province i in year t, Ə0 is a constant term, digit denotes the level of digital transformation of province i in year t, Controls is a set of control variables that may affect the carbon performance of the province, μi is an individual (province) fixed effect, λi is a time (year) fixed effect, and εit is the residual.
Mechanism testing models: Combining the previous paper and existing literature, to further test the impact of corporate digital transformation on carbon neutrality performance, the mechanism test model is constructed as follows, drawing on the three-step mediation test (Baron & Kenny, 1986; Wen et al., 2004):
where egdpit denotes the energy use efficiency of province i in year t, tlit denotes the level of rationalization of the industrial structure of province i in year t, tsit denotes the level of advancement of the industrial structure of province i in year t, and Controls is a series of control variables., tl are constant terms, others, etc. are constant terms, and the other etc. are the coefficients to be estimated, respectively.
Difference-in-Difference Models: In this paper, we use the Difference-in-Difference(DID) method to investigate whether the environmental fee-to-tax policy will further promote the digital transformation of enterprises to improve their carbon performance, based on (Jin et al., 2020), and divide the sample subjects into an experimental group and a control group according to whether the provinces and municipalities change their environmental tax standards before and after the policy, and consider provinces and municipalities where the tax burden is significantly increased (i.e., the tax burden raises the standard) as the experimental group, and those where the tax burden is flattened as the control group. The sample grouping of provinces and municipalities is shown in Table 3.
According to the setting of this paper, the initial model is set as follows
where Treatt denotes i experimental grouping dummy variable, 1 if the province or city belongs to the tax burden lifting area and 0 if it belongs to the tax burden levelling area. periodt is a time grouping dummy variable, 1 for 2018 and later, 0 for before 2018. Cross-multiplier term Treat the coefficient of Period is the policy effect, the coefficient. The coefficient of is the moderating effect of firms’ digital transformation, which is the focus of attention in this paper in the Difference-in-Difference effect.Controls is a series of control variables.
Spatial Measurement Models
Results
Baseline Regression
In this paper, a two-way fixed effects model is chosen to estimate the impact of firms’ digital transformation on carbon neutrality performance. The regression results are shown in Table 4, column (1) shows the univariate regression results, column (2) reports the regression results after adding a series of control variables, and column (3) shows the regression results after controlling for both region and year as well as relevant control variables, which indicate that regardless of whether control variables are added or not, and whether region and year fixed effects are considered or not, the coefficients of the squared term of enterprises’ digital transformation are positive and significant at the 1% significance level. The significance level suggests a possible positive U-shaped relationship between enterprise digital transformation and regional carbon performance. The U-shaped relationship is judged by whether the primary and secondary terms are significant; it may be characterized by monotonically concave and convex curves.
To avoid this problem, Lind and Mehlum (2010) proposed a three-step U-shape test: ① the coefficients of the primary term and the quadratic type of the core explanatory variables are opposite and pass the test of significance; ② it is required that the slopes of the endpoints should be significantly steeper (with the opposite of positivity and negativity), and based on the regression results of column (3) of Table 4, the slopes of the independent variables take the smallest value with a negative slope (k1 = 2×0.318 × 0.116-). 0.464=-0.39), and the slope is positive when the independent variable takes the maximum value (k2=2×0.318×2.332-0.464=1.019); (iii) the curve inflection point should be within the sample interval of the corresponding indicator, and the coefficient of the squared term of the enterprise’s digital transformation is 0.318, which indicates that the inflection point is -(-0.464/(2*0.318))=0.7295. The measured inflection point is within the sample interval. In this paper, the endpoint slopes and inflection points of each model are measured in turn, and the slopes at the endpoints of the intervals are positively and negatively reversed and the above three points prove that the U-shaped hypothesis proposed above is valid and that Hypothesis 1 is valid.
The implication is that when the average level of digital transformation of enterprises in the region is greater than 0.7295, the increase can significantly improve the region’s carbon neutrality performance; when the average level does not reach 0.7295, the digital transformation of enterprises will substantially inhibit the carbon neutral performance.
Mechanism Test Analysis
Based on the previous analysis, this paper mainly chooses energy use efficiency (egdp), industrial structure rationalization (tl) and industrial structure sophistication (ts) as mechanism variables. The relevant regression results are reported in Table 5, where (1) to (2) are the regression results with energy use efficiency as the mediating variable, (3) to (4) are the regression results with industrial structure rationalization as the mediating variable, and (5) to (6) are the regression results with industrial structure sophistication as the mediating variable.
Energy efficiency: The coefficient of the squared term of digital transformation in column (1) of Table 5 is significantly positive, indicating that there is a positive U-shaped relationship between the impact of firms’ digital transformation on energy use efficiency, i.e., as the level of firms’ digital transformation in the region increases, energy use efficiency decreases and then increases; in column (2), the impact of digital transformation on carbon-neutral performance continues to be positively U-shaped, which is consistent with the benchmark regression above. The effect of energy use efficiency on regional carbon neutral performance is positive at the 1% significance level. In summary, the mechanism of energy use efficiency holds, and Hypothesis 2 is valid. In the early stage of digital transformation, energy use efficiency is suppressed at this stage of adaptation, thus reducing carbon neutral performance; however, with the deep application of digital technology, when the level of digital transformation exceeds the critical value, it can reduce the enterprise’s reliance on traditional energy sources, promote the improvement of energy use efficiency, and achieve energy saving, efficiency, and emission reduction.
Industrial structure optimization level: According to columns (3) and (5) in Table 5, the squared terms of enterprises’ digital transformation are both significantly positive, i.e., there is also a positive U-shaped relationship between the impact of digital transformation on industrial structure rationalization and industrial structure advancement. In columns (4) and (6), the impact of enterprise digital transformation on carbon neutral performance still shows a positive U-shaped relationship, while the level of industrial structure advancement and industrial structure rationalization both have significant positive impacts on carbon neutral performance, which is consistent with the results of the benchmark regression. Therefore, this paper concludes that industrial structure sophistication and rationalization mediate enterprises’ digital transformation affecting regional carbon neutral performance, and Hypotheses 3a and 3b are valid. At the initial stage of digital transformation, traditional industries may be impacted, which leads to the instability of the industrial structure; in addition, enterprises may establish new cooperative relationships and form new ecosystems, and the adjustments and uncertainties in this process will reduce the optimization level of the overall industrial structure; after the level of digital transformation reaches a critical value, the use of digital means promotes the transformation and upgrading of carbon-intensive industries, adjusting the proportion of industries, improving the efficiency of information transfer and synergy between industries, promoting the development of enterprises and industries in a more sustainable direction, and ultimately improving the carbon-neutral performance.
Impact of the Policy of Changing Environmental Fees to Taxes
Columns (1) and (2) of Table 6 demonstrate the impact of implementing the environmental fee and tax reform policy on the regional carbon neutrality performance. Column (1) does not consider the control variables, and Column (2) is the result of adding the control variables, in which the coefficient estimate of did (Trea*Period) is 0.0897 and passes the test of significance at the 5% level, which indicates that the environmental fee and tax reform policy significantly improves the carbon performance level of the treatment group of the region’s carbon performance level. Column (3) of Table 6 adds the cross-multiplier term between the policy and the degree of digital transformation of enterprises. Since the degree of digital transformation of all provinces is greater than the inflection point of 0.7295 after the implementation of the policy in 2018, verifying the moderating effect only needs to add the interaction term between the policy variable and the primary term of digital transformation of enterprises. The results show that did*dig is significantly positive at the 5% level, which indicates that the degree of digital transformation of enterprises is significantly higher in the environmental protection fee to tax policy affects carbon performance plays a positive moderating role in the process.
Parallel trend test: The key premise of the Difference-in-Difference modeling is the parallel trend assumption, which means that the trends in carbon neutrality performance of provinces and municipalities in the treatment group and those in the non-treatment group should have been parallel before implementing the policy. Therefore, this paper draws on the work of (Jacobson et al., 1993) to conduct a parallel trend test using the event study method, which can be expressed as:
The point-in-time dummy variable (Period) in model (13) is transformed from a dummy variable into a set, and the other variables have the same meaning as above. The results of the parallel trend test in Figure 1 show that the estimated coefficients of carbon performance are not significant before the policy shock point, indicating that the cities in the treatment group and the cities in the non-treatment group have the same trend in the level of carbon-neutral performance before the implementation of the environmental fee-to-tax policy, which passes the parallel trend test.
Placebo test: To avoid that the difference between treatment provinces and non-treatment provinces is due to time change. In this paper, we advance the implementation of the policy of changing environmental fees to taxes by five years, i.e., we assume that the changed policy will be implemented from 2013, construct a false policy time, and regress equation (10). The results are shown in Table 7, where the control variables are not considered in column (1), and the coefficient estimates of did after the addition of the control variables in column (2) do not pass the significance level test, indicating that there is no systematic difference in the time trend between the treatment group provinces and the control group provinces, and also proving once again that the policy of environmental protection fee change tax effectively promotes the regional carbon performance of the treatment group provinces.
Robustness Check
Replacement of explanatory variables: In this paper, the thesaurus is replaced with (Zhao, 2022) a keyword library containing multiple dimensions such as digital technology applications, internet business models, intelligent manufacturing, and modern information systems to re-measure the intensity of digital transformation of individual enterprises. The ST and suspended samples are still excluded. Based on this, the annual reports of A-share listed enterprises in Shanghai and Shenzhen from 2011 to 2021 are searched and matched by Python, word frequency is summed, the word frequency is logarithmized, and the degree of digital transformation of enterprises within each province is summed up and averaged as a replacement of the core explanatory variable (digt), and regressed. The results in column 1 of Table 8 show that the squared term of digital transformation after replacing the core explanatory variable is still significant at the 1% level with carbon neutral performance, and the squared term has the opposite sign of the single term, i.e., the relationship between digital transformation and carbon neutral performance is in a positive U-shape, which is in line with the original baseline regression results and supports Hypothesis 1, and the findings of the study are robust.
Adding control variables: This paper considers that environmental regulation intensity (er) may affect regional carbon neutral performance, of a higher environmental regulation intensity implies that the local area pays more attention to the environmental situation and requires higher environmental standards, and the external pressure on enterprises to achieve pollution reduction and carbon reduction through digital transformation is also strengthened. Based on this, the control variable of environmental regulation intensity is further added to the baseline regression model, and the specific indicator is borrowed from, which uses the ratio of total investment in industrial pollution source treatment to industrial value added. The regression results are presented in column 2 of Table 8 and are consistent with the benchmark regression results, further supporting the robustness.
Endogeneity test: Instrumental variables test. The selection of instrumental variables is based on the research method of (Wooldridge, 2010), using digital transformation and the first and second-order lag terms of its squared terms as instrumental variables, and testing the validity of the instrumental variables in two-stage least squares (2SLS) regression shows that the F-statistic of the first stage regression is 519.15, which is much higher than 10 and passes the 1 % significance test, indicating that the selected instrumental variables are highly correlated with the endogenous explanatory variables. There is no problem of weak instrumental variables. As the results in column (3) of Table 8 show, once the endogeneity problem is solved, the test results are consistent with the baseline regression, indicating that the results remain robust after controlling for endogeneity.
Additional Tests
Spatial correlation test: From an environmental point of view, carbon dioxide emissions have spatial spillover effects, and so carbon dioxide emissions in this region may negatively impact neighboring regions. Therefore, this paper adopts a spatial weighting matrix of 0-1 for the spatial Durbin model to explore the spatial spillover effects of enterprise digital transformation on carbon performance. In the spatial econometric analysis, it is necessary to test the spatial correlation between digital transformation and carbon performance, which is calculated as follows.
where, ,, n are the 30 provinces. wij is the spatial weight matrix, and y represents the degree of digital transformation (or carbon neutrality performance). Table 9 shows the results of the spatial autocorrelation test using Moran’s I index. The results show that the global Moran’s I index of the degree of enterprise digital transformation and carbon performance level are all greater than 0. Most pass the 10% significance test, indicating that each province’s degree of enterprise digital transformation and carbon performance level in China distribution have positive correlation characteristics and a spatial clustering state.
Spatial model selection test: Before estimating the model parameters, it is necessary to test the spatial econometric model, and in this paper, we refer to the test method of (Elhorst, 2014) to perform the LM test, LR test, and joint significance test, and finally decide to use the Spatial Durbin Model (SDM) with time and area fixed effects. The results are presented in Table 10, which shows that digital transformation is significantly and positively associated with carbon performance at the 5% level in the spatial weight matrix. The estimated coefficient of the indirect effect is positive at the 1% significance level, suggesting a positive spatial spillover effect of the contribution of firms’ digital transformation to the level of carbon performance.
Regional Heterogeneity: Considering the influence of industrial structure, cultural differences, and other factors in each province, this paper divides the provinces into three parts according to the region they belong to: the east, the central, and the west, and then conducts the regression. From the regression results in Table 11, we can see that digital transformation of enterprises has the most significant impact on carbon performance in the eastern region, and the effect on the central region is substantial, still showing a positive U-shaped impact. In contrast, the effect is not significant in the western region. The results in column (1) show that the inflection point in the eastern region is 0.0974, and the results in column (2) show that the inflection point in the central region is 0.1775, both of which are shifted to the left compared to the inflection point of 0.7295 in the baseline regression.The range of promoting digital transformation of enterprises on carbon performance is broader and more pronounced in the eastern region. This may be because, compared with the western region, the eastern region usually has a more developed industrial structure, including manufacturing and service industries, which can more easily adapt to digital technology for production and business management, and the eastern region also tends to attract more high-skilled and high-quality talents. People with such expertise can better motivate enterprises to implement digital transformation. As a result, the contribution of digital transformation to the region’s carbon neutrality and performance is more pronounced in the eastern region.
R&D intensity heterogeneity: As increasing the level of R&D investment promotes the digital transformation of enterprises (Pan & Zhang, 2023), there may be differences in the impact of digital transformation on carbon neutrality performance under different R&D intensities. This paper selects the ratio of research and experimental development expenditure to regional gross domestic product (GDP) as a measure of R&D intensity. Based on each region’s median annual R&D intensity, the study area is divided into low and high R&D intensity regions and tested for heterogeneity. The results presented in Table 12 show that the impact of firms’ digital transformation on carbon performance is more significant in regions with high R&D intensity, still showing a positive U-shaped relationship. In contrast, the impact is not significant in regions with low R&D intensity. This may be because high R&D intensity regions tend to have more strength in R&D and application of digital technologies compared to low R&D intensity regions, and more financial support from the government suggests that firms may be encouraged to undertake digital transformation locally, making it easier for firms in these regions to incorporate advanced digital tools into their business to improve productivity and reduce carbon emissions, and thus improve carbon performance.
Heterogeneity in economic development levels: There are apparent differences in the level of regional economic development in China. Is there heterogeneity in the impact of the degree of digital transformation of enterprises on carbon performance under different levels of economic development? Based on this, this paper uses regional GDP per capita to measure economic development levels (Qin, Guo, & Ge, 2022). It divides the study area into more economically developed and less economically developed regions according to the median of the level of economic development of each provincial and municipal area each year as a boundary to explore in depth the heterogeneous impact of the degree of digital transformation of enterprises on the carbon performance of the region. The results are shown in Table 13. In the more economically developed sample region, the impact of enterprise digital transformation region on carbon performance is significantly positive U-shaped at the 1% statistical level. In the less economically developed regions, the relationship between the effect of digital transformation of enterprises and carbon performance is not significant. The reason may be that more economically developed regions have higher market competition pressure due to high intensity economic development, and enterprises are more inclined to adopt digital technology to improve production and management processes to increase efficiency and reduce costs. Moreover, compared with less economically developed regions, economically developed regions have a more vital awareness of environmental protection and a higher demand for environmental quality, which is more likely to motivate enterprises to carry out transformation and green innovation and thus achieve the improvement of regional carbon performance.
Discussion & Conclusion
From the perspective of inputs and outputs, this paper selects the panel data of 30 provinces and municipalities in China, excluding Tibet, from 2011 to 2021 as the sample, and takes the degree of digital transformation of enterprises in each province and municipality as the main indicator, investigating the non-linear relationship between digital transformation of enterprises and carbon neutral performance, explores the transmission mechanism of energy efficiency and the level of transformation and upgrading of industrial structure, and examines the spatial spillover effect of the impact of digital transformation of enterprises on carbon neutral performance and the impact of environmental fee reform and tax policies on digital transformation of enterprises and carbon performance, and explored the impact of heterogeneity in terms of location, R&D intensity and economic development level.
Three main conclusions are obtained: first, in the overall sample of provinces across the country, the effect of enterprise digital transformation on carbon performance shows a positive U-shape of inhibition followed by promotion, with a positive spatial spillover effect, and the policy of environmental protection fees and taxes contributes to the improvement of carbon performance, and enterprise digital transformation plays a moderating role in this process. Second, enterprise digital transformation affects regional carbon neutrality performance by influencing energy use efficiency, industrial structure transformation, and upgrading level. Third, in terms of regional heterogeneity, the positive U-shaped effect of enterprise digital transformation on carbon neutral performance is most significant in the eastern region, more significant in the central region, and not significant in the western region; in terms of heterogeneity in R&D intensity, the role of enterprise digital transformation in influencing carbon performance is more evident in the regions with higher R&D intensity; in terms of heterogeneity in the level of economic development, the role of enterprise digital transformation in the more economically developed regions is more significant in regional carbon performance.
Based on the above findings, the following policy recommendations are proposed: First, the government should guide the digital transformation of enterprises, focus on the needs of digital transformation, expand the scope of digital transformation through the construction of knowledge platforms and other public services, and encourage enterprises to integrate technologies such as big data, artificial intelligence, and blockchain into various processes of enterprise production. The government can give full play to the role of digital transformation in optimizing the industrial structure, promoting the synergistic transformation of the energy supply and consumption sides, improving the production capacity of clean energy, and helping achieve the “double carbon” target as soon as possible to achieve high-quality development. Second, pay attention to the role of environmental protection policies, play the role of policy constraints and supervision of enterprises, on the one hand, focus on promoting digital technology to enable green transformation to create a sound institutional environment for the development of digital transformation of enterprises; on the other hand, consider adding carbon dioxide to the scope of environmental protection fees and taxes, promote the synergy and integration of fiscal and environmental policies, and coordinate the triple benefits of economy and society, ecological environment and enterprise production. Third, according to the different levels of local economic development and resource conditions, we should select and develop emission reduction strategies according to local conditions, and further promote the achievements and experience of carbon emission pilot regions to the whole country. The central and western regions, where economic development is less developed than in the east, should be supported by policies, and local governments should formulate differentiated strategies to improve the green and low-carbon institutional system and promote the flow of green factors while maintaining consistency with central policies.
References
- Usai, A., Fiano, F., Petuzzelli, A. M., Paoloni, P., Branmonte, M. F., & Orlando, B. (2021). Unveiling the impact of the adoption of digital technologies on firms’ innovation performance. Journal of Business Research, 133, 327-336. [CrossRef]
- Ashraf, N., Meschi, P. X., & Spencer R. (2014). Alliance network position, embeddedness and effects on the carbon performance of firms in emerging economies. Organization & Environment, 1(2), 65-84. [CrossRef]
- Baron, R.M., & Kenny, D.A. (1986). The moderator-mediator variable distinction in social psychological research: conceptual, strategic, and statistical considerations. Journal of Personality and SociaI Psychology, 51, 1173-1182.
- Chen, T., & Chen, G. (2021). Research on the Spatial Effect of Digital Transformation on Industrial Structure Upgrading - An Empirical Analysis Based on Static and Dynamic Spatial Panel Models. Economic and Management Research, 42(8), 30-51.
- Chen, Xi., Hu, D., & Cao, W. (2021). An Exploration of the Path to Achieve Carbon Neutral Targets in China’s Energy Sector with the Help of Digital Technology. Proceedings of the Chinese Academy of Sciences, 36(9), 1019-1029.
- Cheng, B., Xu, Y., & Li, X. (2018). Public Pressure, Corporate Internationalisation and Corporate Environmental Governance. Statistical Research, 35(9), 54-66.
- Ciulli, F., Kolk, A. & Boe-Lillegraven, S. (2020). Circularity Brokers: Digital Platform Organizations and Waste Recovery in Food Supply Chains. Journal of Business Ethics, 167, 299–331.
- David S., Vinit P., Maximilian P., & Joakim, W (2021). How AI capabilities enable business model innovation: Scaling AI through co-evolutionary processes and feedback loops. Journal of Business Research, 134, 574-587.
- D’Cruz, P., Du, S., Noronha, E. et al. (2022). Technology, Megatrends and Work: Thoughts on the Future of Business Ethics. Journal of Business Ethics, 180, 879–902. [CrossRef]
- Depoers, F., Jeanjean, T. & Jérôme, T. (2016). Voluntary Disclosure of Greenhouse Gas Emissions: Contrasting the Carbon Disclosure Project and Corporate Reports. Journal of Business Ethics, 134, 445–461. [CrossRef]
- Dhanda, K. K., Hartman, L. P. (2011). The Ethics of Carbon Neutrality: A Critical Examination of Voluntary Carbon Offset Providers. Journal of Business Ethics, 100(1), 119-149.
- Elhorst, J P. (2014). Matlab Software for Spatial Panels. International Regional Science Review, 37(3), 389-405.
- Elmassah, S., & Clevel, C. J. (2020) Digital Transformation and Localising the Sustainable Development Goals (SDGs). Ecological Economics, 169, 106-490.
- Gan, C., Zheng, R. & Yu, D. (2011). The Impact of Industrial Structure Change on Economic Growth and Volatility in China. Economic Research, 46(5), 416-431.
- Haque, F. (2017). The effects of board characteristics and sustainable compensation policy on carbon performance of UK firms. The British Accounting Review, 3, 347-364.
- Haque, F., & Ntim, C. G. (2022). Executive Compensation, Sustainable Compensation Policy, Carbon Performance and Market Value. British Journal of Management, 31(3), 525-546.
- He, D., & Lin, M. (2021). Digital Economy, Business Environment and Industrial Structure Upgrading. Economic System Reform, 5, 99-105.
- Hu, Y., & Guo, Z. (2023). Research on the Impact of Digitalisation on the Carbon Emission Intensity of Manufacturing Enterprises: Theoretical Modelling and Mechanism Test. Journal of Beijing Institute of Technology (Social Science Edition), 23(05),153-168.
- Jacobson, L. S., LaLonde R. J., & Sulivan D. G. (1993). Earnings Losses of Displaced Workers. The American Economic Review, 83(4), 685-709.
- Jia, X., Liu, Q., Feng, J., Li, Y., & Zhang, L. 2023. The induced effects of carbon emissions for China’s industry digital transformation. Sustainability, 15(16), 12170. [CrossRef]
- Jiang, Q., Liu, Y., & Duan L.(2023). Digital Transformation, Diversification, and Firm Performance. Technological Economy, 5, 117-133.
- Jin Y., Gu, J., & Zeng, Huixiang. Will “Environmental Protection Fees to Taxes” Affect Corporate Performance?. Accounting Research, 5, 117-133.
- Jones, N. (2018). How to stop data centres from gobbling up the world’s electricity. Nature, 561(7722), 163-167.
- Li, D., Huang, M., Ren, S. et al. 2018. Environmental Legitimacy, Green Innovation, and Corporate Carbon Disclosure: Evidence from CDP China 100. Journal of Business Ethics, 150, 1089–1104.
- Li, Z., Wang, X., & Wu Z . (2024). Can green finance reform and innovation policies promote corporate carbon performance?. Finance Research Letters, 62, 105203. [CrossRef]
- Li, L., Su, F., Zhang, W., & Mao, J.Y. (2018). Digital Transformation by SME Entrepreneurs: a Capability Perspective. Information Systems Journal, 28(6), 1129-1157. [CrossRef]
- Li, Q., & He, A. (2022). Research on the Influence Effect and Role Mechanism of Digital Economy on the Coordinated Development of Regional Economy. Economic Issues Exploration, 8, 1-13.
- Li, X. (2021). Digital Economy Development and Enterprise Value Enhancement - A Perspective Based on Life Cycle Theory. Economic Issues, 3, 116-121.
- Lind, J.T., Mehlum, H. (2010). With or without u? the appropriate test for a U-shaped relationship. Oxford bulletin of economics & statistics, 72(1), 109-118.
- Luo, L., & Tang, Q. (2014). Does voluntary carbon disclosure reflect underlying carbon performance? Journal of Contemporary Accounting & Economics, 3, 191-205.
- Pan, Yi., & Zhang, J. (2023). Research on the Impact and Mechanism of Digital Finance on Digital Transformation of Enterprises - Empirical Evidence from Chinese A-share Manufacturing Listed Enterprises. Industrial Technology and Economics, 42(3), 63-72.
- Qin, B., Guo, Y., & Ge L. (2022). How Public Participation Influences Enterprises’ Green Technology Innovation - An Analysis Based on Mediating and Spatial Effects. Technological Economy, 41(2), 50-61.
- Ren, Z. C., & Zhao, Z. H. (2022). The Impact of Digital Transformation on Total Factor Productivity Improvement in Manufacturing Industry - Micro Evidence from Listed Companies. Industrial Technology and Economics, 41(11), 23-30.
- Salahuddin, M., & Alam, K. (2015). Internet Usage, Electricity Consumption and Economic Growth in Australia:ATime Series Evidence. Telematics and Informatics, 32(4), 114-128.
- Shao, S., Fan M., Yang, & Li L. (2022). Green Technology Progress and China’s Low-Carbon Transition Development - An Empirical Examination Based on the Perspective of Overall Technological Frontier and Spatial Spillover Effects. Management World, 38(2), 46-69.
- She, Q. Z., Wu L., & Zheng, J. (2022). The Digital Economy, Economic Agglomeration, and Carbon Emissions. Statistics and Decision Making, 38(21), 5-10.
- Shi, D., & Li, P. (2021). Simulation of Industrial Carbon Emission Structures and Policy Impacts under the “Dual Carbon” Target. Reform, 12, 30-44.
- Usai, A., Fiano, F., Petruzzelli, M., Paoloni, P., Briamonte, M. F., & Orlando, B. (2021). Unveiling the impact of the adoption of digital technologies on firms’ innovation performance. Journal of Business Research, 133, 327. [CrossRef]
- Wang F., Sun J., & Liu S Y . (2019). Institutional pressure, ultimate ownership, and corporate carbon reduction engagement: Evidence from China. Journal of Business Research, 104, 14-26.
- Wen, Z. L., Zhang, L., Hou, J. T., & Liu, H. Y. (2004). Mediation Effect Test Procedure and Its Application. Journal of Psychology, 5, 614-620.
- Wooldridge, J. (2010). Econometric Analysis of Cross Section and Panel Data. Cambridge: The MIT Press.
- Wu, F., Hu, H. Z., Lin, & H. Y., et al. (2021). Corporate Digital Transformation and Capital Market Performance - Empirical Evidence from Equity Liquidity. Management World, 37(07), 130-144.
- Wu, Q. S., Cheng, J. H., & Wang, H. (2005). Changes in Energy Consumption in China’s Industrialisation Process - An Empirical Analysis Based on Econometric Models”. China Industrial Economy, 4, 30-37.
- Wu, Y. Z., & Wen, Y. C. (2013). Research on Green Productivity and Its Impact on Low-Carbon Development of Industry. Management Science, 26(01), 112-120.
- Xiao, R. Q., Wang, R., & Qian, L. (2023). The non-linear impact of digitisation level on corporate carbon performance - the mediating role of green technology innovation. Science and Technology Progress and Countermeasures, 40(05), 96-106.
- Xu P., Chen, L., & Dai, H. (2023). Pathways to Sustainable Development: Corporate Digital Transformation and Environmental Performance in China. Sustainability, 15(1), 256. [CrossRef]
- Xu, C., Sun, G., & Kong. T. (2024). The impact of digital transformation on enterprise green innovation. International Review of Economics & Finance, 90, 1-12. [CrossRef]
- Xu, X. C., Ren, X., & Chang, Z. H. (2019). Big Data and Green Development. China Industrial Economy, 4, 5-22.
- Xu, W.X., Zhou, J. P., & Liu, C. J. (2022). Spatial effects of digital economy development on urban carbon emissions. Geography Research, 40(1), 111-129.
- Xue, L., Zhang, Q., Zhang, X., & Li, C. 2022. Can digital transformation promote green technology innovation?. Sustainability, 14(12), 7497. [CrossRef]
- Yang, J., Zheng, C., & Liu, H. 2022. Digital Transformation and Rule of Law Based on Peak CO2 Emissions and Carbon Neutrality. Sustainability, 14(12), 7487. [CrossRef]
- Yu J., & Hu W. (2024). The impact of digital infrastructure construction on carbon emission efficiency: Considering the role of central cities. Journal of Cleaner Production, 141687.
- Yu, L. C., & Wang, L. (2023). Does Digital Transformation Help Improve Corporate Environmental Performance?. Finance and Trade Research, 34(7),82-96.
- Zhang Y. L., & Liu, Q. (2020). Construction and Measurement of Enterprise Carbon Performance Indicator System. Statistics and Decision Making, 36(12), 166-169.
- Zhang, Q. C. & Yang, M. Z. (2022). Enterprise Digital Transformation and Internal Control Quality - A Quasi-Natural Experiment Based on the “Two-Chemical Integration” Guanbiao Pilot. Auditing Research, 6, 117-128.
- Zhang, S. F., & Wei, X. H. (2019). Whether Information and Communication Technology Reduces Corporate Energy Consumption - Evidence from Survey Data of Chinese Manufacturing Firms. China Industrial Economy, 2, 155-173.
- Zhang, X., & Dong, Z. (2023). Digital Transformation and Corporate Technological Innovation - Mechanism Identification, Safeguard Condition Analysis and Heterogeneity Test. Economic Review, 1, 3-18.
- Zhao, Z. (2024). Digital Transformation and Enterprise Risk-Taking. Finance Research Letters, 62,105139-. [CrossRef]
- Zhao, C. Y., Wang, W. C., & Li, X. S. (2021). How Digital Transformation Affects Total Factor Productivity of Enterprises. Finance and Trade Economics, 42(7), 114-129.
- Zhou, B., & Liu, T. T. (2022). Regional Environmental Governance Pressure, Economic Development Level and Carbon Neutral Performance. Research on Quantitative Economics and Technological Economics, 39(8), 100-118.
- Zhou, H. H. & Wang, S. L. (2018). Community Environmental Pressure, Environmental Information Communication and Environmental Operational Performance Faced by Enterprises. Soft Science, 32(2), 80-83.
- Zhou, Z., Li, J., & Zeng, H. (2020). A Study on the Influence of Political and Economic Stakeholders on Corporate Carbon Performance - An Empirical Analysis Based on Listed Companies in China. Journal of Yunnan University of Finance and Economics, 36(04), 72-88.
- Zhu, S., & Yu, Bi. (2023). Study on the Synergistic Effect of Pollution Reduction and Carbon Reduction of “Emission Right” and “Carbon Emission Right” Trading - Based on the Dual Perspectives of Pollution Control and Policy Management. China Environmental Management, 15(1), 102-109.
Figure 1.
Parallel trend test for carbon performance.
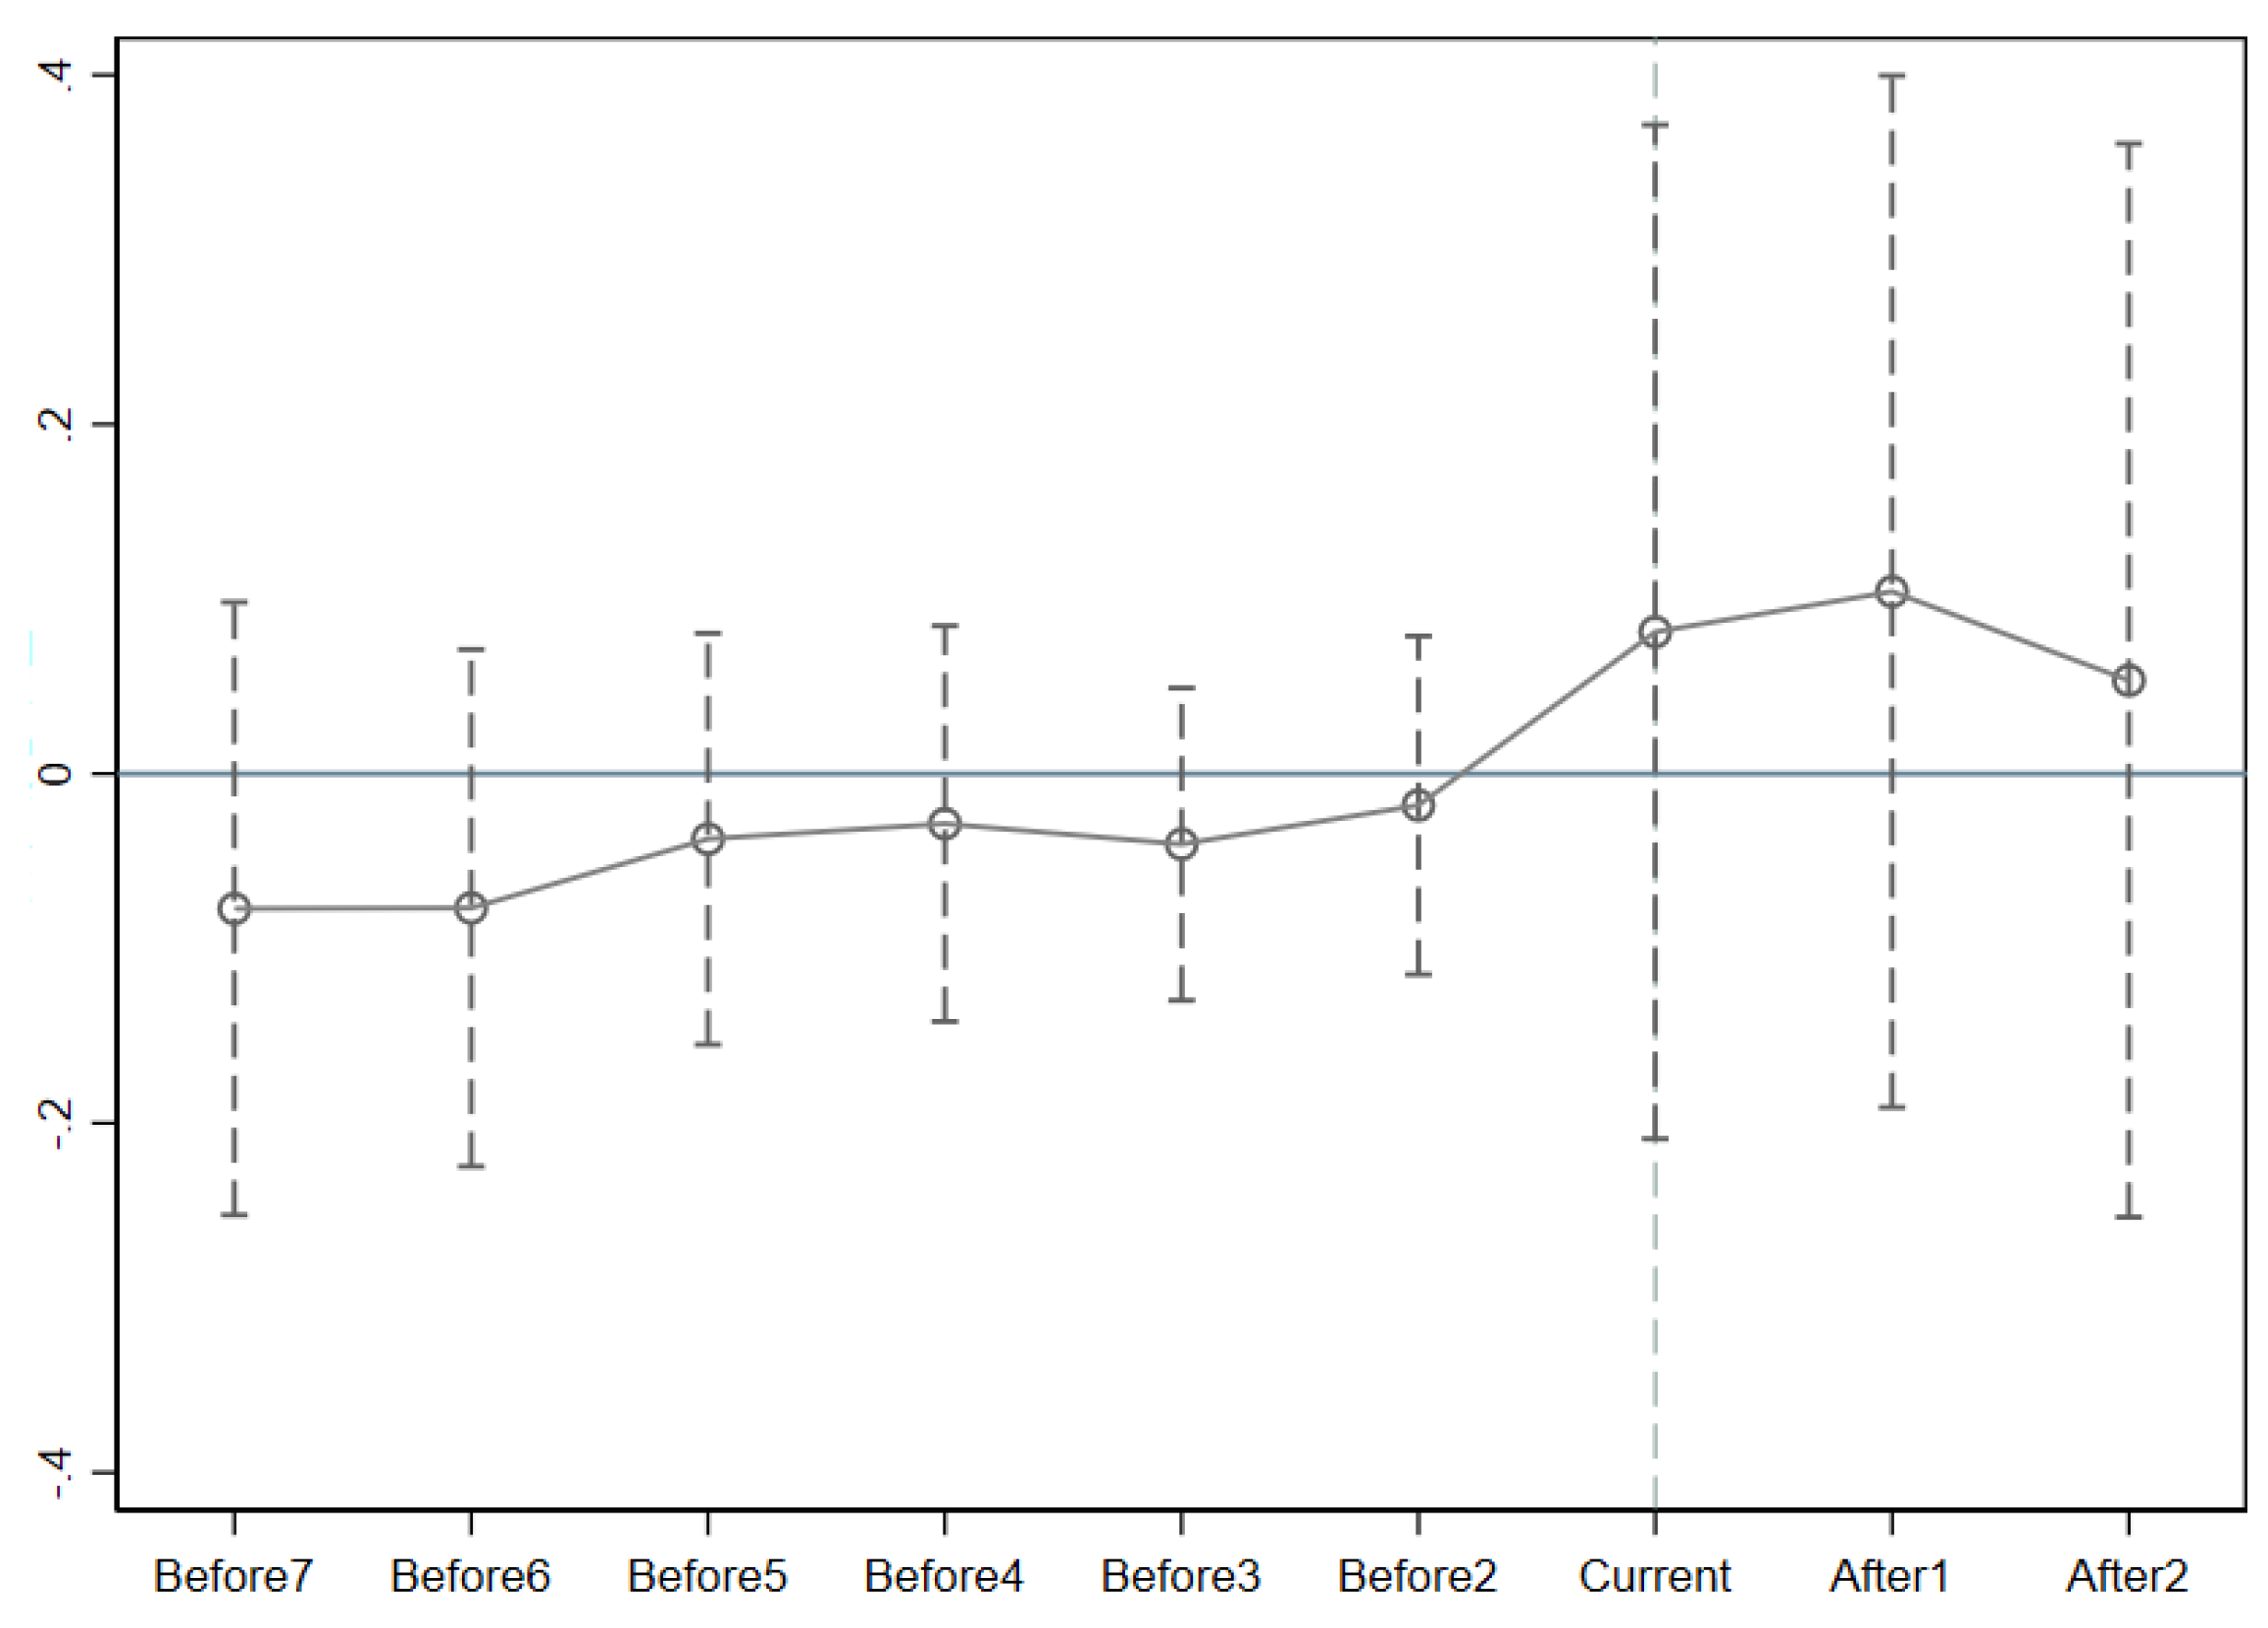

Table 1.
Definition and Description of Variables.
| Variable type | variable name | variable symbol | Description of variables |
| Dependent Variable | Carbon Neutral Performance | cnp | Gross regional product/carbon dioxide emissions (million yuan/tonne) |
| Independent Variable | Degree of digital transformation | dig | Add up artificial intelligence, blockchain, cloud computing, big data and digital technology applications and make them logarithmic |
| Mechanism variables | Energy efficiency | egdp | Gross regional product/total energy consumption (million yuan/tonne of standard coal) |
| Industrial structure rationalization | ts | Tertiary sector output/secondary sector output | |
| Industrial structure advanced | tl | Tyrell’s index | |
| Control Variable | urbanisation level (of a city or town) | ur | Urban population/total regional population |
| government intervention | gov | Government public expenditure/gross regional product (billion yuan) | |
| investment intensity | InvR | Total investment in fixed assets/Gross Regional Product (billion yuan) | |
| overseas foreign direct investment | fdi | Total FDI/Gross Regional Product (billion yuan) | |
| financial development level | fdl | Balance of deposits and loans of financial institutions/Gross Regional Product (billion yuan) | |
| Level of transport infrastructure | ti | Road mileage in natural logarithms (kilometres) | |
| Number of large and medium-sized enterprises | firm | Number of large and medium-sized industrial enterprises (thousands) |
Table 2.
Descriptive statistics of the main variables.
| Variable | Obs | Mean | Std. Dev. | Min | Max | cnp | Dig | ur | gov | InvR | firm | fdl | ti | fdi | tl | ts |
| cnp | 330 | 0.712 | 0.489 | 0.121 | 2.618 | |||||||||||
| dig | 330 | 1.111 | 0.536 | 0.116 | 2.332 | 0.502 | ||||||||||
| ur | 330 | 58.93 | 12.27 | 37.20 | 89.30 | -0.352 | 0.489 | |||||||||
| gov | 330 | 0.249 | 0.102 | 0.119 | 0.612 | -0.322 | -0.118 | -0.330 | ||||||||
| InvR | 330 | 0.806 | 0.272 | 0.240 | 1.480 | 0.330 | -0.098 | -0.615 | 0.522 | |||||||
| firm | 330 | 7.014 | 1.121 | 4.431 | 9.253 | 0.283 | 0.144 | 0.178 | -0.829 | -0.397 | ||||||
| fdl | 330 | 1.178 | 0.288 | 0.604 | 1.970 | -0.145 | 0.392 | 0.634 | 0.305 | -0.311 | -0.351 | |||||
| ti | 330 | 11.69 | 0.848 | 9.466 | 12.71 | 0.276 | -0.049 | -0.610 | -0.170 | 0.351 | 0.411 | -0.660 | ||||
| fdi | 330 | 0.0190 | 0.0150 | 0 | 0.0740 | 0.554 | -0.031 | 0.449 | -0.391 | -0.326 | 0.292 | 0.105 | -0.367 | |||
| tl | 330 | 1.342 | 0.732 | 0.527 | 5.244 | 0.543 | 0.474 | 0.535 | 0.117 | -0.325 | -0.310 | 0.691 | -0.567 | 0.176 | ||
| ts | 330 | 12.21 | 14.98 | 1.312 | 122.6 | 0.879 | 0.440 | 0.730 | -0.238 | -0.487 | 0.177 | 0.545 | -0.490 | 0.328 | 0.499 | |
| egdp | 330 | 1.722 | 0.829 | 0.490 | 4.806 | 0.879 | 0.621 | 0.540 | -0.501 | -0.366 | 0.413 | 0.202 | -0.150 | 0.410 | 0.492 | 0.536 |
Table 3.
Sample grouping.
| Groups | Typology | District |
| Experimental group | Tax burden raised | Beijing, Shanxi, Guangxi, Guizhou, Hainan, Chongqing, Sichuan, Hebei, Henan, Hunan, Jiangsu, Shandong |
| Control subjects | Tax equalization | Anhui, Hubei, Zhejiang, Fujian, Yunnan, Liaoning, Tianjin, Shanghai, Guangdong, Jilin, Jiangxi, Shaanxi, Gansu, Xinjiang, Ningxia, Qinghai, Inner Mongolia, Heilongjiang |
Table 4.
Full sample regression results.
| variant | cnp (1) |
cnp (2) |
cnp (3) |
| dig | -0.518*** (0.132) |
-0.415*** (0.132) |
-0.464*** (0.125) |
| dig2 | 0.494*** (0.0567) |
0.438*** (0.0541) |
0.318*** (0.0364) |
| ur | - - |
-0.00332 (0.00319) |
-0.00412 (0.00371) |
| gov | - - |
-0.450 (0.368) |
-3.144*** (0.425) |
| InvR | - - |
0.0175 (0.101) |
-0.00319 (0.0717) |
| firm | - - |
0.0707** (0.0330) |
-0.112 (0.0902) |
| fdl | - - |
0.159 (0.114) |
0.0818 (0.160) |
| ti | - - |
-0.0399 (0.0404) |
0.231 (0.162) |
| fdi | - - |
6.823*** (1.505) |
3.653*** (1.251) |
| constant term (math.) | 0.535*** (0.0697) |
0.456 (0.539) |
-0.696 (2.085) |
| year | Uncontrolled | Uncontrolled | Included |
| place | Uncontrolled | Uncontrolled | Included |
| N | 330 | 330 | 330 |
| R2 | 0.532 | 0.637 | 0.929 |
*, ** and *** indicate significance at the 10%, 5%, and 1% significance levels, respectively.
Table 5.
Mechanism test results.
| variant | egdp (1) |
cnp (2) |
tl (3) |
cnp (4) |
ts (5) |
cnp (6) |
| dig | -1.080*** (0.249) |
-0.208* (0.114) |
-0.346*** (0.109) |
-0.382*** (0.125) |
-17.57*** (6.073) |
-0.423*** (0.126) |
| dig2 | 0.594*** (0.0723) |
0.178*** (0.0357) |
0.149*** (0.0317) |
0.283*** (0.0370) |
7.609*** (1.766) |
0.301*** (0.0374) |
| Egdp | - - |
0.237*** (0.0265) |
- - |
- - |
- - |
- - |
| Tl | - - |
- - |
- - |
0.236*** (0.0670) |
- - |
- - |
| Ts | - - |
- - |
- - |
- - |
- - |
0.00232* (0.00122) |
| constant term (math.) | -2.678 (4.150) |
-0.0605 (1.843) |
1.171 (1.821) |
-0.972 (2.046) |
142.5 (101.3) |
-1.026 (2.083) |
| Controls | Included | Included | Included | Included | Included | Included |
| Year | Included | Included | Included | Included | Included | Included |
| Place | Included | Included | Included | Included | Included | Included |
| N | 330 | 330 | 330 | 330 | 330 | 330 |
| R2 | 0.902 | 0.945 | 0.976 | 0.932 | 0.821 | 0.930 |
*, ** and *** indicate significance at the 10%, 5%, and 1% significance levels, respectively.
Table 6.
Regression results of the impact of environmental fee to tax policy.
| variant | cnp (1) |
cnp (2) |
dig (3) |
| did | 0.132*** (0.0499) |
0.0897** (0.0424) |
-0.422* (0.2174) |
| did*dig | - | - | 0.320** (0.1399) |
| controls | uncontrolled | Included | uncontrolled |
| year | Included | Included | Included |
| place | Included | Included | Included |
| N | 330 | 330 | 330 |
| R2 | 0.8540 | 0.8880 | 0.8907 |
*, ** and *** indicate significance at the 10%, 5%, and 1% significance levels, respectively.
Table 7.
Placebo test results.
| variant | Cnp (1) |
cnp (2) |
| Did | 0.122** (0.0617) |
0.0836 (0.0557) |
| Controls | uncontrolled | Included |
| Year | Included | Included |
| Place | Included | Included |
| N | 330 | 330 |
| R2 | 0.8519 | 0.8871 |
*, ** and *** indicate significance at the 10%, 5%, and 1% significance levels, respectively.
Table 8.
Robustness test and endogeneity test.
| Variant | Replacement of core explanatory variables (1) |
Adding control variables (2) |
endogeneity test (3) |
| Dig | - - |
-0.428*** (0.126) |
-0.711*** (0.200) |
| dig2 | - - |
0.304*** (0.0370) |
0.551*** (0.0820) |
| Digt | -1.142*** (0.190) |
- - |
- - |
| digt2 | 0.307*** (0.0346) |
- - |
- - |
| Er | - - |
7.150* (3.796) |
- - |
| constant term (math.) | -1.167 (2.127) |
-0.743 (2.076) |
0.230 (0.641) |
| Controls | Included | Included | Included |
| year | Included | Included | Included |
| place | Included | Included | Included |
| N | 330 | 300 | 270 |
| R2 | 0.927 | 0.930 | 0.637 |
*, ** and *** indicate significance at the 10%, 5%, and 1% significance levels, respectively.
Table 9.
Spatial Moran’s I index of firms’ digital transformation and carbon performance.
| vintages | Lncnp | lndig | ||
| Moran’s I | Z-value | Moran’s I | Z-value | |
| 2011 | 0.398*** | 3.533 | 0.253** | 2.337 |
| 2012 | 0.427 *** | 3.758 | 0.230** | 2.158 |
| 2013 | 0.414*** | 3.659 | 0.375*** | 3.450 |
| 2014 | 0.427*** | 3.764 | 0.278*** | 2.569 |
| 2015 | 0.386*** | 3.432 | 0.325*** | 2.903 |
| 2016 | 0.407*** | 3.586 | 0.183* | 1.771 |
| 2017 | 0.427*** | 3.760 | 0.110 | 1.182 |
| 2018 | 0.435*** | 3.832 | 0.187* | 1.809 |
| 2019 | 0.473*** | 4.121 | 0.252** | 2.356 |
| 2020 | 0.499*** | 4.297 | 0.281*** | 2.578 |
| 2021 | 0.507*** | 4.338 | 0.416*** | 3.698 |
*, ** and *** indicate significance at the 10%, 5%, and 1% significance levels, respectively.
Table 10.
Spatial Durbin model regression results.
| variant | main effect (1) |
W-lndig (2) |
direct effect (3) |
indirect effect (4) |
aggregate effect (5) |
| lndig | 0.084** (0.01) |
0.217*** (0.01) |
0.100*** (0.00) |
0.302*** (0.00) |
0.401*** (0.00) |
| lnur | -0.079 (0.65) |
-0.118 (0.74) |
-0.080 (0.65) |
-0.162 (0.72) |
-0.242 (0.61) |
| lngov | 0.840*** (0.00) |
0.738*** (0.00) |
0.887*** (0.00) |
1.167*** (0.00) |
2.054*** (0.00) |
| lnInvR | -0.082* (0.05) |
-0.022 (0.84) |
-0.085** (0.04) |
-0.053 (0.70) |
-0.138 (0.37) |
| lnfirm | 0.991* (0.05) |
1.015 (0.37) |
1.064** (0.04) |
1.666 (0.25) |
2.730* (0.09) |
| lnfdl | -0.319** (0.03) |
-0.062 (0.84) |
-0.313** (0.03) |
-0.193 (0.58) |
-0.506 (0.18) |
| lnti | 0.199 (0.90) |
-8.311* (0.06) |
-0.368 (0.82) |
-10.408* (0.07) |
-10.776 (0.10) |
| lnfdi | -0.040** (0.03) |
-0.018 (0.64) |
-0.042** (0.03) |
-0.034 (0.46) |
-0.076 (0.18) |
| rho | 0.227*** | ||||
| N | 330 | ||||
| R2 | 0.541 | ||||
*, ** and *** indicate significance at the 10%, 5%, and 1% significance levels, respectively.
Table 11.
Results of the regional heterogeneity test.
| variant | eastern part (1) |
central section (2) |
western part (3) |
| dig | -0.0827 (0.250) |
-0.115 (0.204) |
-0.183 (0.304) |
| dig2 | 0.424*** (0.0856) |
0.324** (0.122) |
0.123 (0.132) |
| constant term (math.) | 0.749 (1.235) |
5.347*** (1.450) |
-4.295*** (1.480) |
| Controls | Included | Included | Included |
| year | Included | Included | Included |
| place | Included | Included | Included |
| N | 121 | 88 | 121 |
| R2 | 0.707 | 0.866 | 0.729 |
*, ** and *** indicate significance at the 10%, 5%, and 1% significance levels, respectively.
Table 12.
Results of R&D intensity heterogeneity test.
| variant | Low R&D intensity (1) |
High R&D intensity (2) |
| dig | 0.110 (0.0930) |
-0.700*** (0.166) |
| dig2 | 0.0618 (0.0396) |
0.482*** (0.0530) |
| constant term | 11.77* (6.797) |
18.92*** (6.085) |
| Controls | Included | Included |
| year | Included | Included |
| place | Included | Included |
| N | 197 | 133 |
| R2 | 0.606 | 0.811 |
*, ** and *** indicate significance at the 10%, 5%, and 1% significance levels, respectively.
Table 13.
Results of the test for heterogeneity in levels of economic development.
| variant | economically less developed area (1) |
More economically developed regions (2) |
| dig | 0.129 (0.0993) |
-0.384** (0.181) |
| dig2 | 0.0578 (0.0446) |
0.374*** (0.0575) |
| constant term (math.) | 1.372 (1.957) |
-15.45*** (4.534) |
| Controls | Included | Included |
| year | Included | Included |
| place | Included | Included |
| N | 207 | 123 |
| R2 | 0.619 | 0.817 |
*, ** and *** indicate significance at the 10%, 5%, and 1% significance levels, respectively.
Disclaimer/Publisher’s Note: The statements, opinions and data contained in all publications are solely those of the individual author(s) and contributor(s) and not of MDPI and/or the editor(s). MDPI and/or the editor(s) disclaim responsibility for any injury to people or property resulting from any ideas, methods, instructions or products referred to in the content. |
© 2024 by the authors. Licensee MDPI, Basel, Switzerland. This article is an open access article distributed under the terms and conditions of the Creative Commons Attribution (CC BY) license (http://creativecommons.org/licenses/by/4.0/).
Copyright: This open access article is published under a Creative Commons CC BY 4.0 license, which permit the free download, distribution, and reuse, provided that the author and preprint are cited in any reuse.


