
Submitted:
01 September 2025
Posted:
02 September 2025
You are already at the latest version
Abstract
The time urgency of China's reduction of carbon dioxide emissions and the green transformation of enterprises has entered a crucial stage. Chinese enterprises are counting every second to promote the green energy transformation. This study focuses on the green innovation efficiency and it contributes to the broad literature by adopting a novel method—duration analysis. The analysis is conducted by empirically testing the impact of China's carbon market construction on green innovation efficiency. This study looks at a time dimension perspective, and investigates whether the construction of the carbon market can accelerate the green transformation of enterprises and shorten the time for enterprises' green innovation. The paper studies China’s public traded firms from 2008 to 2022, and it uses the difference-in-differences analysis along with the propensity score matching and cox regressions. This paper finds that the construction of China’s pilot carbon market on 2011 promotes the innovation efficiency significantly, either a breakthrough from zero to the very first one green patent, or shortens the time between two green patents.
Keywords:
green innovation efficiency
; duration analysis
; sustainable development
; carbon market
1. Introduction
Under the severe challenges of global climate change, China is facing unprecedented pressure for carbon dioxide emission reduction and corporate green transformation. With the advancement of China’s carbon abatement goals, 60% of the remaining energy conservation and carbon reduction tasks of the “14th Five-Year Plan” need to be completed by 2025, and high-energy-consuming industries such as steel, petrochemicals, and building materials must complete technological upgrades within five years. Internationally, the pressure is equally urgent: the EU’s Carbon Border Adjustment Mechanism (CBAM) has entered a transition period, and export enterprises failing to achieve low-carbon production will face additional tariff costs. Since China’s national carbon trading market was launched in 2021, it has covered 2,162 power generation enterprises, with a cumulative transaction volume of 24.9 billion yuan, prompting enterprises to internalize emission reduction costs through quota trading. However, the current market turnover rate is only 2%-3%, indicating insufficient liquidity, urgently requiring an expansion of industry coverage and enhanced transparency.
At the corporate level, lagging transformation under policy reforms threatens survival, while supply chain collaborative development has become critical for green enterprise growth. Nevertheless, funding and technology remain bottlenecks: China’s western wind and photovoltaic power bases require trillion-level investments with long payback periods, relying on policy subsidies and market mechanism innovation. Under the triple pressures of policy compulsion, market-driven forces, and international competition, corporate green transformation has shifted from an “optional question” to a “must-answer question.” The next five years will be both a critical period for technological breakthroughs and a reshuffle period for production capacity. Only through technological innovation, capital investment, and industrial chain collaboration can China gain the initiative in global low-carbon competition. Therefore, studying the impact of China’s carbon market construction on green innovation requires attention not only to corporate innovation capabilities but also to innovation efficiency to accelerate green transformation.
This paper examines whether carbon market pilot policies promote corporate green innovation efficiency from two perspectives: 1) whether carbon market construction increases the number of corporate green patent applications within the same timeframe and enhances the likelihood of generating green patents; 2) whether it shortens the time required for green patent production under the same number of patents. Examples include: whether the carbon market shortens the interval between two green patent applications, reduces the time from zero to one green patent, and shortens the time to achieve industry-leading certification. Using DID and Cox models, the study concludes that enterprises affected by carbon market policies have 1/6 more green patent applications on average than unaffected enterprises after policy implementation, a 3.58-percentage-point higher likelihood of producing green patents, an average 18.55-day reduction in the interval between two green patent applications, a 0.375-fold reduction in the time to achieve the first green patent (0-1 breakthrough), and a 0.42-fold reduction in the time to obtain industry-leading certification.
Existing literature mostly focuses on patent quantity within the same timeframe, while this paper adds a new dimension by exploring whether time is shortened under the same patent quantity to study the impact of carbon market pilot policies on green innovation efficiency. Against the backdrop of China’s carbon abatement goals, the construction of a national unified carbon market is accelerating, currently covering the power industry and gradually expanding to sectors like cement and steel. Empirical research reveals that carbon markets effectively address both the “quantity” and “speed” challenges of green innovation through market mechanisms. Compared with existing studies that mainly focus on patent quantity changes, the innovative value of this paper lies in revealing the time-dimensional optimization effect of carbon markets on innovation efficiency. Based on the findings, policy recommendations include: accelerating the expansion of carbon market industries to include high-emission sectors such as petrochemicals, chemicals, and building materials; establishing dynamic incentive mechanisms to reward enterprises with rapid innovative responses through additional quota incentives or tax breaks; providing special green technology transformation support policies for small and medium-sized enterprises’ innovation shortcomings; and promoting the coordination between carbon markets and green finance by incorporating green innovation indicators into corporate financing evaluation systems. With the deepening of national carbon market construction, these measures will better leverage market mechanisms to incentivize green technological innovation and inject new momentum into high-quality economic development.
2. Institutional Background
The construction of China’s carbon market began in 2013, when the National Development and Reform Commission launched carbon emission rights trading pilots in seven provinces and cities: Beijing, Tianjin, Shanghai, Chongqing, Hubei, Guangdong, and Shenzhen. After years of exploration, these pilot markets have achieved remarkable results, forming a relatively complete regulatory system and operational mechanism. In 2017, efforts began to promote the construction of a national unified carbon market, and in 2021, the national carbon emission rights trading market was officially launched, marking a new stage of development for China’s carbon market.
Existing studies show that the construction of China’s carbon market has gradually transitioned from regional pilots to national unification, with the important goals of achieving “carbon peaking” and “carbon neutrality.” Policy factors have a significant impact on market effectiveness during its construction. Pilot carbon markets have made remarkable progress in regulatory systems, operational stability, and market scale, and are moving toward national unification. Meanwhile, policy factors such as quota allocation, penalty mechanisms, and offset mechanisms have significantly influenced market effectiveness during China’s carbon market construction. Studies have found significant differences in the effectiveness of carbon markets across regions, with Hubei’s carbon market performing most effectively, while those in Tianjin and Chongqing showing relatively weaker results. Overall, the construction of China’s carbon market is steadily advancing from carbon emission trading pilots to a national scale. In recent years, China’s carbon market has further improved in key areas such as legal foundations, penalty mechanisms, quota allocation, quota rollover, and CCER (China Certified Emission Reduction) trading rules, laying a solid foundation for expanding industry coverage. In the future, with the continuous optimization of relevant policies and the improvement of market mechanisms, China’s carbon market will play a more important role in achieving China’s carbon abatement goals.
3. Literature Review
3.1. Overview of Exiting Literature on Emission Trading Scheme
Existing studies have shown that the implementation of Emission Trading Scheme (ETS) policies has had significant impacts on carbon emissions, corporate behavior, and economic performance. In the context of China, its ETS pilot policies have effectively reduced carbon emissions. For example, Weijie Zhang et al. (2019) found that ETS policies reduced industrial carbon emissions by an average of 10.1% and carbon intensity by 0.78%, with cross-regional trading demonstrating greater cost-saving effects than intra-regional trading. Yifei Zhang et al. (2020) further indicated that carbon emissions in pilot cities decreased by an average of 16.2%, though effects showed regional heterogeneity, being more pronounced in eastern regions. Czerny, A. (2024) noted that China’s ETS enhances firms’ green total factor productivity by promoting green innovation and optimizing resource allocation. Additionally, ETS policies optimize resource allocation through market mechanisms: Chen et al. (2021) found that ETS reduces national carbon emissions by 13.39% via technological, structural, and allocative effects. However, some studies have revealed policy limitations: Jiangfeng Hu et al. (2020) pointed out that ETS inhibits green innovation in the short term, as firms prefer production reduction over technological innovation to achieve emission reduction.
Research on ETS’s economic effects has reported both positive and negative outcomes. For instance, Feng Dong et al. (2019) found that ETS failed to achieve the “Porter Effect” of simultaneous economic growth and environmental improvement in the short term, but the two could develop synergistically in the long run. Yu et al. (2022) further validated ETS’s positive impact on the financial performance of industrial listed firms, especially non-state-owned enterprises and non-energy industries. Chaobo Zhou et al. (2022) emphasized that ETS enhances green total factor energy efficiency (GTFEE) through technological innovation, with more significant effects in old industrial bases and resource-based cities. Ge et al. (2023) showed that the CETPP effectively promotes corporate green transformation through the commoditization mechanism of carbon emission rights, with marketization degree and corporate social responsibility (CSR) as key pathways. However, empirical studies by Yue-Jun Zhang et al. (2024) and Zhongfei Chen et al. (2023) revealed negative effects, finding that the policy reduced environmental responsibility levels of high-carbon firms by 32.6% and the proportion of green patents by 9.26%, particularly inhibiting small and medium enterprises, manufacturing industries, and non-state-owned enterprises.
Regarding the design elements of carbon market policies, Jotzo and Löschel (2014) identified quota allocation as a key variable through international comparisons. Song Deyong et al. (2021) demonstrated micro-econometrically that benchmark allocation more effectively incentivizes corporate innovation than historical allocation. Studies have further found asymmetric policy impacts: at the micro-level, Zhongfei Chen et al. (2021) used a triple difference model (DDD) to show that pilot policies reduced the proportion of green patents by 9.26% in the short term, with more significant inhibition on small and medium enterprises, manufacturing, and non-state-owned enterprises, echoing the sample selection bias theory proposed by Rosenbaum and Rubin (1985). At the macro-level, Yu Ping and Liu Jixian (2020) proved based on a two-way fixed effects model that expanding market scale can achieve dual improvements in environmental quality and economic growth, while Shuo Chen et al. (2020) revealed through mediating effect analysis that emission reduction effects are achieved via three pathways—technological, structural, and allocative—with the highest reduction of 21.57% in western regions.
3.2. Driving Mechanisms and Heterogeneous Responses of Green Innovation
Existing research shows that green innovation is influenced by multiple factors, including environmental regulations, corporate governance, and external knowledge sources. Environmental regulations are important drivers of green innovation: Tao Feng et al. (2021) found that environmental protection target responsibility systems increase the number of green patents. Wu Libo et al. (2021) indicated that strict environmental regulations significantly promote corporate green innovation, verifying the “Porter Hypothesis.” Corporate governance also plays a key role: Mario Daniele Amore (2016) found that anti-takeover laws increase the proportion of green patents, while Gema Albort-Morant et al. (2016) emphasized the positive effects of dynamic capabilities and relational learning capabilities on green innovation performance. External knowledge sharing and CSR are important drivers of green innovation: Wissal Ben Arfi et al. (2018) showed that external knowledge sharing has a significant positive impact on green innovation in small and medium enterprises. Mohsin Shahzad et al. (2020) found that the four dimensions of CSR all positively affect environmental sustainability, thereby promoting green innovation. Additionally, the “green core competence” theory proposed by Chen (2008) was expanded in B. Orlando et al.’s (2022) cross-cultural study, which showed that government R&D expenditure enhances the promotion effect of eco-innovation by 23.7% in cultures with high indulgence.
Studies also indicate multi-dimensional driving mechanisms for green innovation: for example, the “short-term inhibition-long-term incentive” dynamic characteristics proposed by Zhongfei Chen et al. (2021) and Meiling Wang et al. (2023) show that as market mechanisms improve, the mediating effects of R&D investment and government subsidies gradually emerge.
3.3. Carbon Market Policies and Corporate Green Innovation Efficiency
Numerous studies have shown that ETS policies have positive impacts on green innovation efficiency, though some suggest inhibitory effects in the temporal dimension. Lijun Jia et al. (2024) found that ETS significantly promotes green technological innovation in energy enterprises, especially state-owned and large enterprises. Yi-Xiang Bai et al. (2023) further pointed out that the carbon trading mechanism enhances green innovation efficiency (GIE) by 18.6% through optimizing industrial structure, energy structure, and human capital, with more significant effects in eastern regions. X. Zhao et al. (2024) found that ETS significantly increases the number of green utility model patents in resource-based and energy-intensive industries. Regarding influence mechanisms, research shows that government subsidies and R&D investment constitute core drivers (Meiling Wang et al., 2023), but Wu, S. et al. (2022) found that firm ownership significantly moderates this effect—non-state-owned enterprises are more sensitive to carbon prices, while state-owned enterprises exhibit path dependence. He Yanni (2022) and Fan Qingquan & Guo Wen (2025) further revealed that carbon markets promote breakthrough innovation and resource allocation optimization by increasing demand for high human capital and enhancing liquidity. In terms of time dimension, Dong et al.’s (2019) DEA analysis showed a 3-year lag in the Porter Effect, while Hongbin et al.’s (2025) tracking study of the EU ETS indicated that the promotion effect of environmental performance on financial performance became significant only after 5 years (p<0.05). Zhang et al. (2022) argued that ETS inhibits green technological innovation in the short term through carbon price and R&D crowding-out effects, but local government competition can mitigate this negative impact. Additionally, Mao et al. (2025) emphasized the importance of supply chain collaboration and government supervision in green transformation, suggesting that policies need to closely integrate with corporate behavior and market mechanisms.
Research on carbon market policies and green innovation efficiency, as cited earlier, widely uses DID models and mediating effect analyses but is generally limited to green patent quantity as an indicator, measuring efficiency by the number of green patents within the same timeframe without examining efficiency characterized by shortened R&D time. Methodologically, models are relatively single, mostly adopting DID. Existing studies show that survival analysis, widely used in medical and health economics to assess treatment effects and disease prognosis (e.g., Jongeneel et al., 2020; Kearns et al., 2020), has broad application value in finance and economics for credit risk assessment and firm survival research (Allen, L.N., 2006; Ruohan Sun et al., 2023). Y. Dendramis et al. (2018) and Raffaella Calabrese et al. (2020) analyzed mortgage default risks through dynamic and spatial survival models, respectively, revealing the impacts of economic environment and geographical location on default probability. In the field of technological innovation and patent research, survival analysis has been used to evaluate technology life cycles and patent values. Thus, survival analysis has strong explanatory power for green innovation efficiency. This paper studies the innovation efficiency of carbon market policies in terms of shortened R&D time for the same number of green patents, employing survival analysis.
4. Empirical Design
4.1. Data and Sample
In this study, the sample data covers 2,395 enterprises listed on the Shenzhen Stock Exchange, Shanghai Stock Exchange, and Beijing Stock Exchange, spanning four industries: mining, manufacturing, electric power and heat supply, and construction. Systematic data collection was conducted for these enterprises from 2002 to 2022, including detailed information on patent applications and relevant business status data. After processing missing values, there were 187,498 observations.
4.2. Methodology Design and Variables
4.2.1. Model Construction
In this paper, the treatment group consists of enterprises in the mining, manufacturing, electric power and heat supply, and construction industries in Beijing, Tianjin, Chongqing, Shanghai, Hubei, and Guangdong. Enterprises in the same industries from other regions (excluding Hong Kong, Macao, and Taiwan) are designated as the control group. This study sets the period before 2011 as the non-pilot phase and the period after 2011 (including 2011) as the pilot phase, and constructs the following empirical model:
indicates the cumulative number of green patent applications of the firm in a year; is the dummy variable represents whether the patent is the green patent or not; is the variable of interest which interacting the time dummy and policy dummy; Z is a set of control variables; is the year fixed effect; is the region fixed effect; is the industry fixed effect; is the error term.
represents the instantaneous probability of a firm filing its first green patent application; is the instantaneous probability of a firm achieving an industrial leading level in green patents (which is over 30 green patents); indicates the baseline hazard function; N is a set of control variables.
4.2.2. Variable Selection
(1) Dependent Variable
Green Innovation. This paper measures the level of green innovation by the annual number of green patent applications of enterprises. Models are established in two scenarios:
1. Under the same time frame, green innovation is measured by the cumulative number of annual green patent applications of enterprises and the probability that the patent applied by enterprise i in year t is a green patent;
2. Under the same quantity of green patents, it is measured by the interval days between the t-th green patent of enterprise i and its previous application, the instantaneous probability of the enterprise filing its first green patent, and the instantaneous probability of the enterprise achieving a leading position in green patents (i.e., the probability when the number of green patents reaches 30).
(2) Explanatory Variable
The treatment in this paper is a dummy variable for time multiplied by a dummy variable for region. The time dummy variable takes values 0 and 1, where 0 indicates the period before the carbon emission trading pilot in 2011, and 1 indicates the period from 2011 onwards (including 2011). The location dummy variable also takes values 0 and 1, where 1 indicates the enterprise is located in pilot regions (Beijing, Tianjin, Chongqing, Shanghai, Hubei, and Guangdong), and 0 indicates other non-pilot regions (excluding Hong Kong, Macao, and Taiwan).
(3) Control Variables
The control variables selected for Models (1), (2), and (3) are Roa2, Indep, total operating income, R&D expenses, number of R&D personnel, and R&D expenditure as a proportion of operating income. The control variables for Models (4) and (5) are Size, Age, Roa1, Indep, and Q. The definitions of each variable are shown in Table 1.

Table 2.
Descriptive statistics of main variables.
| Variable | Observation | Mean | Std. dev. | Min | Max |
|---|---|---|---|---|---|
| 187,499 | 328.3553 | 910.57 | 0 | 4179 | |
| treatment | 187,499 | .4769839 | .4994713 | 0 | 1 |
| Roa1 | 178,015 | 3.919795 | 4.963633 | -207.0982 | 48.1941 |
| Roa2 | 185,135 | 5.526285 | 11.57506 | -227.2173 | 948.4422 |
| Size | 178,015 | 24.17692 | 1.727092 | 19.03164 | 28.63649 |
| Age | 177,520 | 275.5879 | 52.03178 | 52.03178 | 410.8654 |
| Q | 185,739 | 1.691283 | 1.018318 | .742945 | 22.15042 |
| Indep | 187,479 | 37.51973 | 5.698938 | 15.38 | 80 |
| Operating revenue | 187,499 | 9.60e+10 | 3.00e+11 | 2.49e+07 | 2.97e+12 |
| R&D expenses | 56,290 | 2.82e+09 | 3.69e+09 | 104002.9 | 3.99e+12 |
| R&D personnel | 129,485 | 8841.273 | 10735.09 | 0 | 42334 |
| R&D expenditure / operating income | 149,939 | 6.806318 | 5.258418 | 0 | 304.15 |
| days | 32,233 | 14.35687 | 119.796 | 0 | 5283 |
| survival_y~r | 139 | 4.733813 | 6.030809 | 0 | 27 |
| survival2_~r | 3,593 | 11.41637 | 7.280896 | 0 | 29 |
5. Results and Discussion
5.1. Difference-in-Differences Model Regression
5.1.1. DID Model with
as the Dependent Variable
Table 3 reports the use of the difference-in-differences method to analyze whether the construction of the carbon market has increased the number of green patent applications by enterprises.
(1) The coefficient of the interaction term “treatment” in Table 3 is positive, indicating that the construction of the carbon market has significantly increased the number of green patent applications by enterprises. Enterprises affected by the carbon market policy have an average of approximately 50.62 more green patent applications after the policy implementation compared to those not affected. Given that the mean value of green patents for enterprises is about 328.3, this suggests that affected enterprises submit roughly 1/6 more green patent applications post-policy. This conclusion is statistically significant, demonstrating that policy implementation has had a positive impact on enterprises’ innovative behavior. Other control variables, such as enterprise size and the number of R&D personnel, also significantly influence the number of green patent applications.
The DID model requires that the treatment and control groups satisfy the parallel trend assumption, meaning the two groups must be comparable before policy implementation and exhibit consistent time effects or trends prior to policy intervention. This paper uses a PSM logistic regression model with nearest neighbor matching allowing up to 2 nearest neighbors and sets the caliper to 0.05 (caliper (0.05)) to ensure the propensity score difference of matched samples does not exceed 0.05. After matching, balance tests and causal effect estimation are conducted.
By matching cities with similar scores as the control group for DID analysis, Table 3 shows that the interaction term “treatment” coefficient is 50.8, close to the original model results, confirming the model’s stability. This indicates that the carbon market construction has significantly increased the number of green patent applications by firms.
5.1.2. Probit-DID Model with
as the Dependent Variable
Table 4 uses the difference-in-differences method to analyze whether the construction of the carbon market has increased the likelihood of enterprises producing green patents.
In Table 4, the dy/dx of the interaction term “treatment” is 0.0358, which significantly indicates that the probability of green patent applications by enterprises affected by the carbon market policy after policy implementation is, on average, 3.58 percentage points higher than that of unaffected enterprises. The model shows high significance, and after excluding regional fixed effects and conducting heterogeneity analysis by industry, the conclusion that the probability of green patent applications by enterprises post-policy is significantly higher remains robust. The model also satisfies the parallel trend assumption. This confirms that the carbon market significantly incentivizes enterprises’ green technological innovation through price signals or regulatory pressure.
5.1.3. DID Model with
as the Dependent Variable
Table 5 reports the use of the difference-in-differences method to analyze whether the carbon market has shortened the interval between two green patent applications by enterprises.
In Table 5, the coefficient of the interaction term “treatment” is -18.55, indicating that the interval between two green patent applications by enterprises affected by the carbon market policy is shortened by an average of approximately 18.55 days compared to unaffected enterprises after policy implementation. Although this is only marginally significant at the 10% level (p=0.083), the coefficient remains negative without controlling for regional fixed effects, and the model’s significance increases, suggesting that the policy accelerates green technological iteration. Both models satisfy the parallel trend assumption. The lower significance may be attributed to insufficient sample observations, causing large fluctuations in some variable coefficients due to inadequate sub-sample sizes, but it still indicates that the policy likely accelerates green technological iteration.
5.2. Cox Proportional Hazards Model Regression
5.2.1. Cox Model with
as the Dependent Variable
Table 6 reports the use of the Cox proportional hazards model regression to analyze whether the carbon market has shortened the time for enterprises to achieve the first green patent (from zero to one).
The coefficient of the interaction term “treatment” in Table 6 is 1.629486, indicating that the time taken by non-affected enterprises to achieve the first green patent after policy implementation is 1.6 times that of carbon market policy-affected enterprises. This suggests that policy-affected enterprises accelerated their breakthrough in green patents after policy implementation. Although the carbon market policy was announced in 2011, its full implementation occurred in 2013. When the analysis was adjusted to change the experimental group’s starting year from 2011 to 2013, the multiple increased to 3, and the statistical significance improved, confirming the model’s robustness. This indicates that the carbon market policy can accelerate enterprises’ first green patent application.
5.2.2. Cox Model with
as the Dependent Variable
Table 7 reports the use of the Cox proportional hazards model regression to analyze whether the carbon market has shortened the time for enterprises to achieve industry-leading certification (number of green patents ≥30).
The coefficient of the interaction term “treatment” in Table 7 is 1.761685, indicating that the time taken by non-affected enterprises to achieve industry-leading certification after policy implementation is 1.7 times that of carbon market policy-affected enterprises. This suggests that policy-affected enterprises accelerated their progress toward industry leadership after policy implementation. When the analysis was adjusted to change the experimental group’s starting year from 2011 to 2013, the multiple increased to 3.3, and the model’s significance improved, indicating high robustness. This further confirms that the carbon market significantly accelerates the large-scale application of enterprises’ green technologies through cost internalization or technological subsidies.
5.3. Robustness Check
5.3.1. Replace Patent Apply Date by Patent Publish Date
After replacing the patent apply date by patent publish date, we find most regressions stay robust.
Table 8.
Robustness check: Replace patent apply date by patent publish date.
| Outcome variable | The number of authorized green patents | The probability of green innovation | Days between two green innovations | Time period from 0 to the first 1 green patent | Time period to pass beyond 30 green patents |
| Method | PSM-DID | Probit (Marginal effect) | PSM-DID | Cox (hazard ratio) | Cox (hazard ratio) |
| Treatment | 28.7*** (3.2) |
3.5%*** | -24.3*** (9.3) |
1.62** (0.36) |
0.58*** (0.07) |
| Year fixed effect | Yes | Yes | Yes | Yes | Yes |
| Industry fixed effect | Yes | Yes | Yes | Yes | Yes |
| Region fixed effect | Yes | Yes | Yes | Yes | Yes |
| Observations | 175,842 | 175,842 | 175,842 | 175,842 | 175,842 |
5.3.2. Replace Treated Year of 2011 to 2013
When replacing treated year from 2011 to 2013, the regression results stay robust too. This indicates that the policy announcement date has the same causal impacts on green innovation efficiency to that of policy enactment date.
Table 9.
Robustness check: Replace treated year of 2011 to 2013.
| Outcome variable | The number of authorized green patents | The probability of green innovation | Days between two green innovations |
| Method | PSM-DID | Probit (Marginal effects) | PSM-DID |
| Treatment | 59.4*** (1.9) |
3.5%*** | -18.6* (10.7) |
| Year fixed effect | Yes | Yes | Yes |
| Industry fixed effect | Yes | Yes | Yes |
| Region fixed effect | Yes | Yes | Yes |
| Observations | 175,842 | 175,842 | 175,842 |
5.4. Heterogeneous Effect
5.4.1. Industrial Heterogeneous Effect
We further analyze the impact of emission trading scheme on green innovation efficiency at the industry level, to test whether the pilot policy has different impacts on heterogeneous industries. We look at industries such as mining, manufacturing, power and heat, and construction industries.
Table 10.
Industrial heterogeneous effect with DID regressions.
| Outcome variable: Number of authorized green patents; Method: PSM-DID | ||||
| Industry | Mining | Manufacturing | Power and heat | Construction |
| Treatment | 20.5*** (7.5) |
60.9*** (1.97) |
0.59* (0.35) |
4.88*** (1.46) |
| Year fixed effect | Yes | Yes | Yes | Yes |
| Region fixed effect | Yes | Yes | Yes | Yes |
We find that the impacts of pilot policy on manufacturing and mining industries are especially larger regarding the green innovation efficiency in terms of quantities. The impacts on power and heat and construction industries are also positive but subtle economic significance.
Table 11.
The probability of green innovation with Probit model.
| Outcome variable: The probability of green innovation; Method: Probit | ||||
| Industry | Mining | Manufacturing | Power and heat | Construction |
| Treatment | 6.35*** (0.36) |
0.26*** (0.02) |
-0.31 (0.35) |
0.40 (0.28) |
| Marginal effect | 25%*** | 3.3%*** | -3.4% | 9.1% |
| Year fixed effect | Yes | Yes | Yes | Yes |
| Region fixed effect | Yes | Yes | Yes | Yes |
We find that the impact of pilot policy on the probability of green innovations are statistically significant in mining and manufacturing industries and insignificant in power and heat and construction industries.
6. Conclusions
The carbon emission trading pilots significantly increase the green innovation efficiency. Specifically, the number of green patents increased for treated cities after the policy announcement year. Meanwhile, enterprises in pilot cities are more likely to have authorized green patents. More importantly, this paper contributes to the literature by using the duration analysis to find that the carbon trading pilots increase the innovation speed, represented by two results: 1. It shortens the breakthrough from 0 to the first green patent; 2. It shortens the time to reach the industry leading certificate level (over 30 green patents). The results are robust when we replace the patent application date by the patent authorization date, and when we replace announcement year of 2011 by the pilots starting sate of 2013. The industry heterogeneous effects showing that enterprises in mining and manufacturing industries are more likely to be positively affected by the carbon emission trading pilot policy.
This paper contributes to the literature of studying impact of carbon trading policy on green innovation efficiency at the time perspective, supporting the Porter hypothesis, proving the positive impact of environmental regulations and providing the experience to expand the current national wide carbon market.
Data Availability Statement
All data of this analysis are available from the corresponding author upon reasonable request.
Conflicts of Interest
We have no conflicts of interest to disclose.
References
- Weijie Zhang, Ning Zhang, Yanni Yu, Carbon mitigation effects and potential cost savings from carbon emissions trading in China’s regional industry, Technological Forecasting and Social Change, Volume 141,2019,Pages 1-11,ISSN 0040-1625.
- Yifei Zhang, Sheng Li, Tianyuan Luo, Jing Gao,The effect of emission trading policy on carbon emission reduction: Evidence from an integrated study of pilot regions in China, Journal of Cleaner Production, Volume 265,2020,121843,ISSN 0959-6526,.
- Czerny, A., & Letmathe, P. (2024). The productivity paradox in carbon-intensive companies: How eco-innovation affects corporate environmental and financial performance. Business Strategy and the Environment, 33(6), 5900–5919.
- Chen, YS. The Driver of Green Innovation and Green Image – Green Core Competence. J Bus Ethics 81, 531–543 (2008).
- Jiangfeng Hu, Xinxin Pan, Qinghua Huang, Quantity or quality? The impacts of environmental regulation on firms’ innovation–Quasi-natural experiment based on China’s carbon emissions trading pilot, Technological Forecasting and Social Change, Volume 158, 2020,120122,ISSN 0040-1625.
- Feng Dong, Yuanju Dai, Shengnan Zhang, Xiaoyun Zhang, Ruyin Long, Can a carbon emission trading scheme generate the Porter effect? Evidence from pilot areas in China, Science of The Total Environment, Volume 653, 2019, Pages 565-577, ISSN 0048-9697.
- Pei Yu, Ruixue Hao, Zhengfang Cai, Yongping Sun, Xinyu Zhang,Does emission trading system achieve the win-win of carbon emission reduction and financial performance improvement? —Evidence from Chinese A-share listed firms in industrial sector, Journal of Cleaner Production, Volume 333, 2022, 130121, ISSN 0959-6526.
- Chaobo Zhou, Shaozhou Qi,Has the pilot carbon trading policy improved China’s green total factor energy efficiency?,Energy Economics, Volume 114,2022,106268,ISSN 0140-9883.
- Ge, W., Xu, Y., Razzaq, A. et al. What drives the green transformation of enterprises? A case of carbon emissions trading pilot policy in China, Environ Sci Pollut Res 30, 56743–56758 (2023).
- Yue-Jun Zhang, Wei Shi, Jing-Yue Liu, International Review of Financial Analysis, Volume 96, Part B,2024,103703,ISSN 1057-5219,.
- Zhong fei Chen, Xiao Zhang, Fang lin Chen, Do carbon emission trading schemes stimulate green innovation in enterprises? Evidence from China, Technological Forecasting and Social Change,Volume 168,2021,120744,ISSN 0040-1625.
- Frank Jotzo, Andreas Löschel, Emissions trading in China: Emerging experiences and international lessons, Energy Policy, Volume 75,2014, Pages 3-8,ISSN 0301-4215,.
- Rosenbaum, P. R., Rubin, D. B.. Constructing a Control Group Using Multivariate Matched Sampling Methods that Incorporate the Propensity Score. The American Statistician, 1985, 39(1): 3338.
- Shuo Chen, Anna Shi, Xin Wang, Carbon emission curbing effects and influencing mechanisms of China’s Emission Trading Scheme: The mediating roles of technique effect, composition effect and allocation effect, Journal of Cleaner Production, Volume 264, 2020, 121700,ISSN 0959-6526.
- Mario Daniele Amore, Morten Bennedsen, Corporate governance and green innovation, Journal of Environmental Economics and Management, Volume 75,2016,Pages 54-72,ISSN 0095-0696,.
- Gema Albort-Morant, Antonio Leal-Millán, Gabriel Cepeda-Carrión,.
- The antecedents of green innovation performance: A model of learning and capabilities,Journal of Business Research, Volume 69, Issue 11,2016,Pages 4912-4917,ISSN 0148-2963. antecedents of green innovation performance.
- Wissal Ben Arfi, Lubica Hikkerova, Jean-Michel Sahut, External knowledge sources, green innovation and performance, Technological Forecasting and Social Change, olume 129,2018 Pages 210-220,ISSN 0040-1625,.
- Mohsin Shahzad, Ying Qu, Saad Ahmed Javed, Abaid Ullah Zafar, Saif Ur Rehman,Relation of environment sustainability to CSR and green innovation: A case of Pakistani manufacturing industry, Journal of Cleaner Production, Volume 253,2020,119938,ISSN 0959-6526.
- B. Orlando, L. V. Ballestra, V. Scuotto, M. Pironti and M. D. Giudice, “The Impact of R&D Investments on Eco-Innovation: A Cross-Cultural Perspective of Green Technology Management,” in IEEE Transactions on Engineering Management, vol. 69, no. 5, pp. 2275-2284, Oct. 2022,.
- Meiling Wang, Xinyu Wang, Zichen Liu, Zhiyuan Han, How can carbon trading promote the green innovation efficiency of manufacturing enterprises? Energy Strategy Reviews, Volume 53,2024,101420,ISSN 2211-467X.
- Lijun Jia, Xin Zhang, Xueni Wang, Xueli Chen, Xiaofeng Xu, Malin Song, Impact of carbon emission trading system on green technology innovation of energy enterprises in China, Journal of Environmental Management, Volume 360, 2024,121229,ISSN 0301-4797,.
- Yi-Xiang Bai, Chan Wang, Min Zeng, You-Hua Chen, Hong-Xing Wen, Pu-Yan Nie,.
- Does carbon trading mechanism improve the efficiency of green innovation? Evidence from China, Energy Strategy Reviews, Volume 49, 2023,101170,ISSN 2211-467X,.
- X. Zhao, Y. Shang, X. Ma, P. Xia and U. Shahzad, Does Carbon Trading Lead to Green Technology Innovation: Recent Evidence From Chinese Companies in Resource-Based Industries,in IEEE Transactions on Engineering Management, vol. 71, pp. 2506-2523, 2024.
- Wu, S., Qu, Y., Huang, H. et al. Carbon emission trading policy and corporate green innovation: internal incentives or external influences,Environ Sci Pollut Res 30, 31501–31523 (2023).
- The Role of Carbon Trading in Enhancing Enterprise Green Productivity and ESG Performance: A Quasi-Natural Evidence From China。--Hongbin, Y., Hongmei, Y., Cifuentes-Faura, J. and Rauf, A. (2025), Bus Strat Env, 34: 1691-1707.
- Wei Zhang, Guoxiang Li, Fanyong Guo, Does carbon emissions trading promote green technology innovation in China?, Applied Energy, Volume 315, 2022, 119012, ISSN 0306-2619,.
- Qinghua Mao, Mingze Zhao, Qilong Sun, How supply chain enterprises achieve coordination between green transition and profitability under the carbon trading framework, Journal of Environmental Management, Volume 377,2025,124588,ISSN 0301-4797,.
- Jongeneel, G., Greuter, M.J.E., van Erning, F.N. et al. Modeling Personalized Adjuvant TreaTment in EaRly stage coloN cancer (PATTERN). Eur J Health Econ 21, 1059–1073 (2020).
- Kearns, B., Stevens, J., Ren, S. et al. How Uncertain is the Survival Extrapolation? A Study of the Impact of Different Parametric Survival Models on Extrapolated Uncertainty About Hazard Functions, Lifetime Mean Survival and Cost Effectiveness. PharmacoEconomics 38, 193–204 (2020).
- Allen, L. N., & Rose, L. C. (2006). Financial survival analysis of defaulted debtors. Journal of the Operational Research Society, 57(6), 630–636.
- Ruohan Sun, Nan Zhou, Bing Zhang, Can bank branch establishment help SMEs survive? Evidence from China,International Review of Financial Analysis, Volume 88,2023,102694,ISSN 1057-5219,.
- Y. Dendramis, E. Tzavalis, G. Adraktas, Credit risk modelling under recessionary and financially distressed conditions,Journal of Banking & Finance, Volume 91,2018,Pages 160-175,ISSN 0378-4266,.
- Raffaella Calabrese, Jonathan Crook, Spatial contagion in mortgage defaults: A spatial dynamic survival model with time and space varying coefficients, European Journal of Operational Research, Volume 287, Issue 2,2020,Pages 749-761,ISSN 0377-2217,.
Figure 1.
Propensity score before matching.
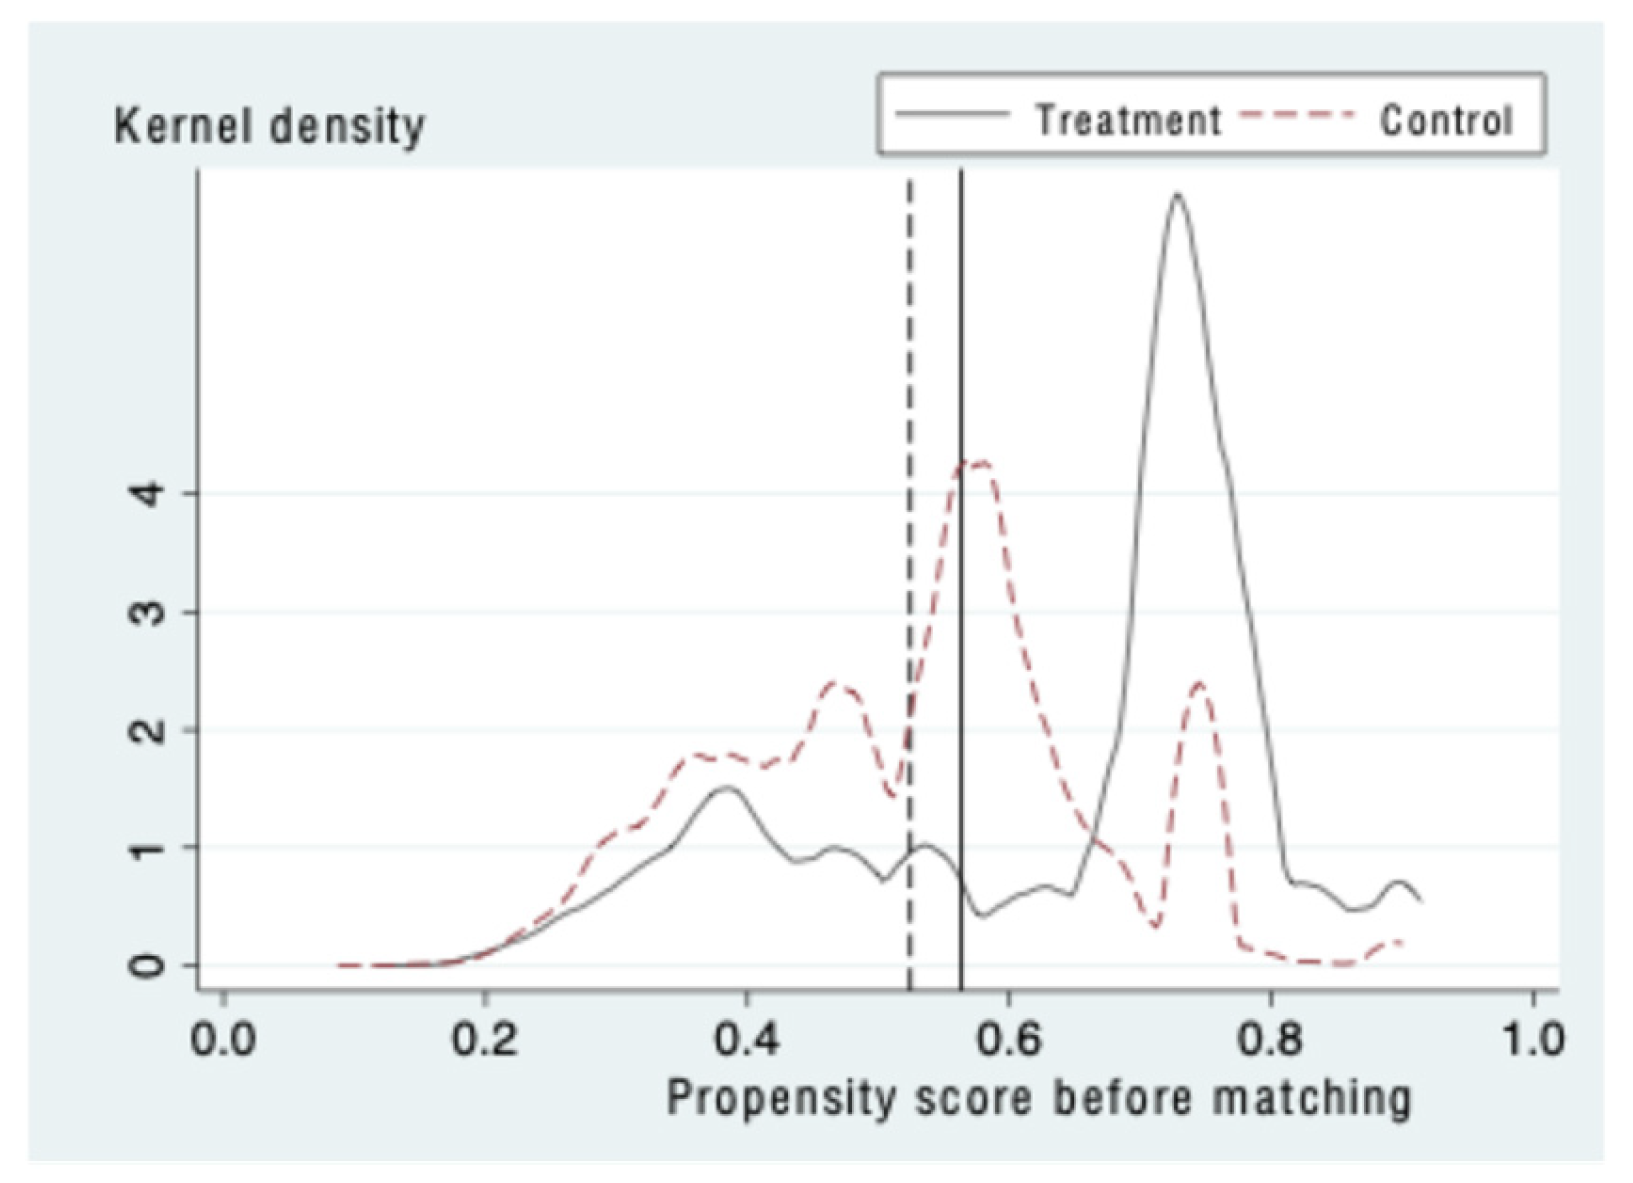
Figure 2.
Propensity score after matching.
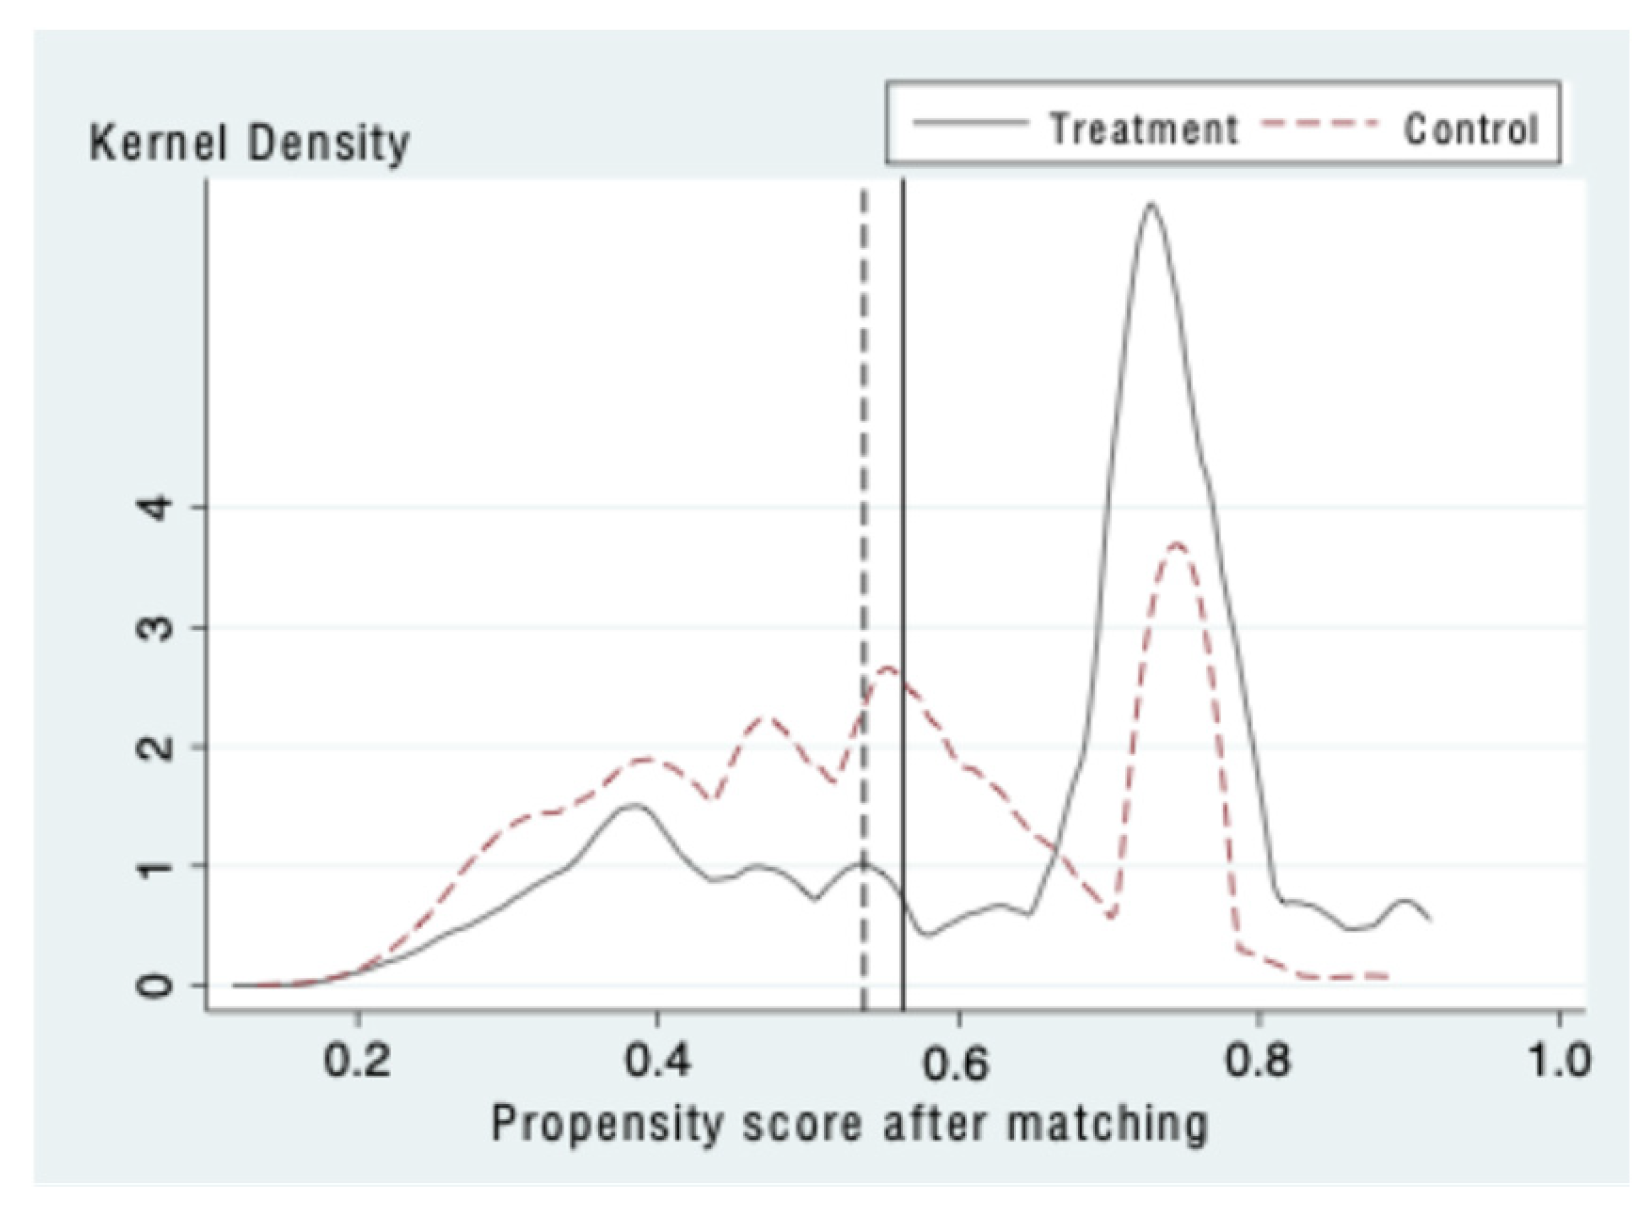
Figure 3.
Survival analysis: K-M estimates.
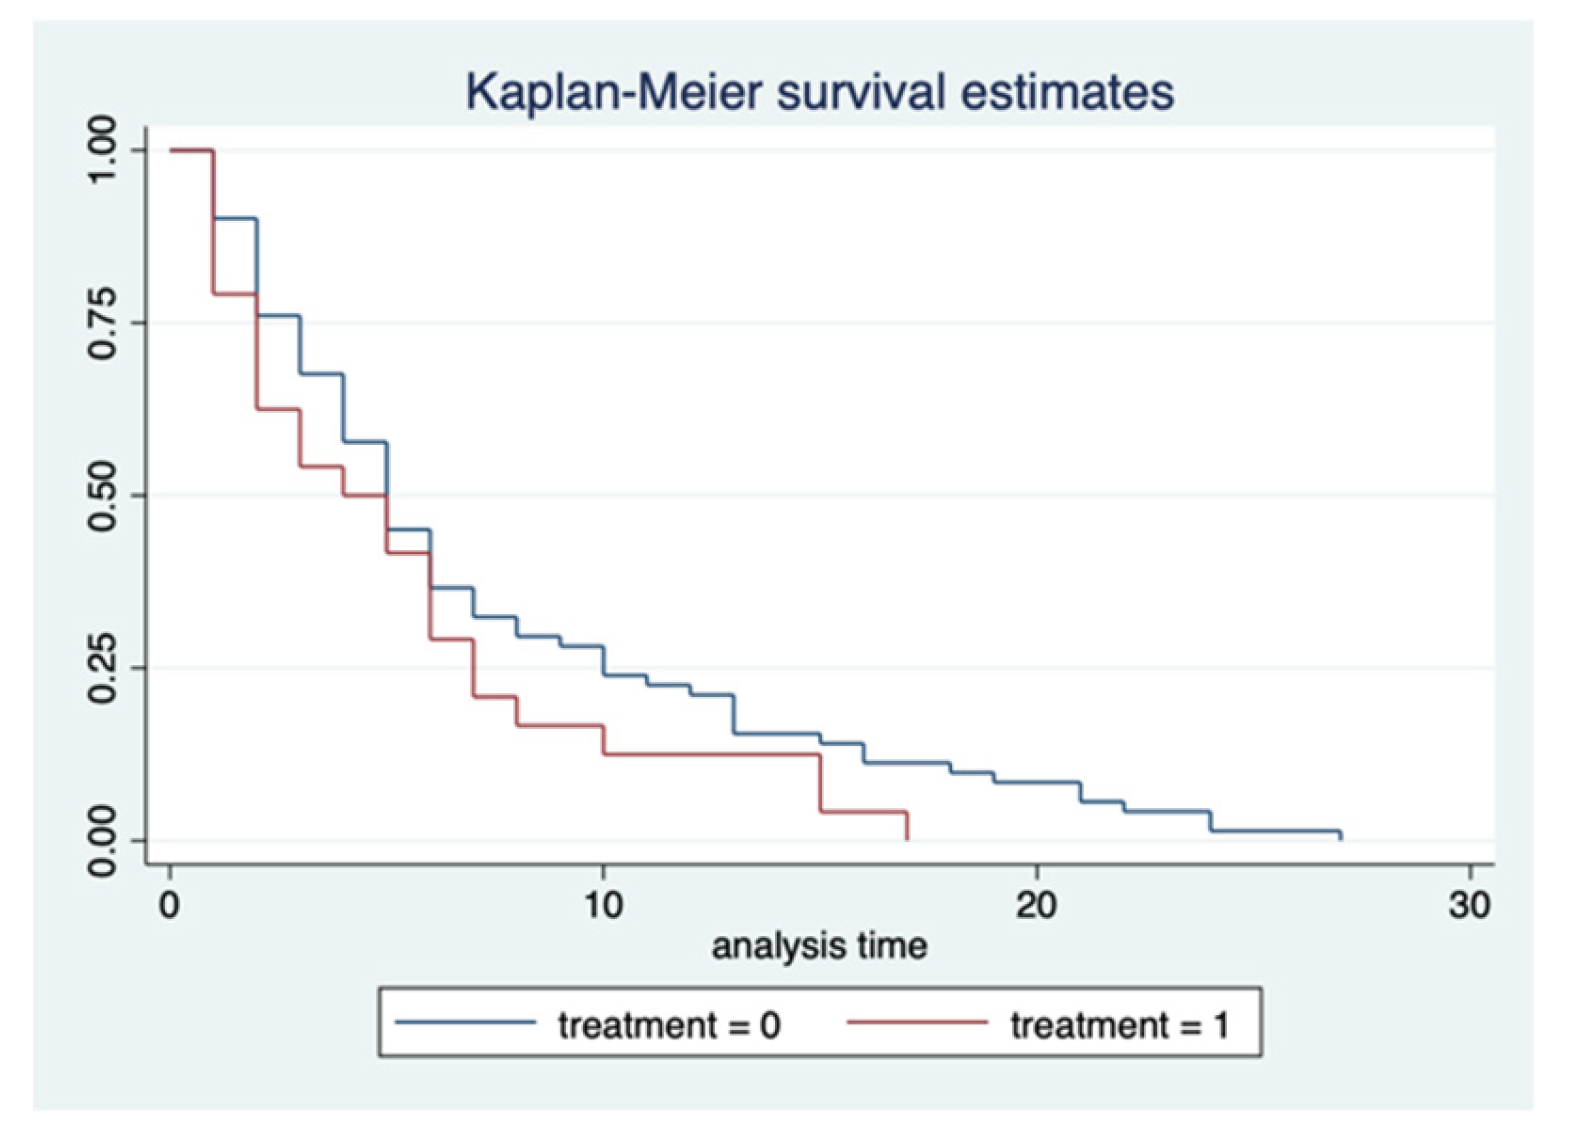
Table 1.
Definitions of main variables.
| Category | Variable | Definition |
|---|---|---|
| Dependent variable | The cumulative number of annual green patent applications of firms | |
| Whether the patent applied by firm i in year t is a green patent | ||
| The interval days between the t-th green patent and its previous application for the firm i | ||
| Explanatory variables | Treatment | Whether the policy implementation time belongs to the pilot period × whether the policy implementation region belongs to the pilot region |
| Control variables | Roa1 | The proportion of net profit to total assets in the current year |
| Roa2 | The proportion of net profit to the total assets at the beginning of the year | |
| Size | The natural logarithm of total assets | |
| Age | Measured by the establishment period of the enterprise | |
| Q | The proportion of a firm’s market value to its total assets | |
| Indep | The proportion of the number of independent directors to the total number of board members | |
| Operating revenue | Total Operating income amount | |
| R&D expenses | Total R&D expenses | |
| R&D personnel | Total Number of R&D personnel | |
| R&D expenditure / operating income | R&D expenditure as a proportion of operating income |
Table 3.
DID model- Whether the construction of the carbon market has increased the number of green patent applications by enterprises.
Table 3.
DID model- Whether the construction of the carbon market has increased the number of green patent applications by enterprises.
| Method | DID | PSM-DID |
| Treatment |
(23.92) |
(20.34) |
| Constant |
(6.46) |
(0.79) |
| Control | Yes | Yes |
| Year | Yes | Yes |
| Area | Yes | Yes |
| Industry | Yes | Yes |
| Observations | 187,499 | 187,499 |
| r-squared | 0.2204 | 0.2203 |
Table 4.
Difference-in-Differences (DID) Method: Whether Carbon Market Construction Has Increased the Likelihood of Enterprises Producing Green Patents.
Table 4.
Difference-in-Differences (DID) Method: Whether Carbon Market Construction Has Increased the Likelihood of Enterprises Producing Green Patents.
| Probit-DID | ||||||
| Treatment |
(12.57) |
(7.33) |
(17.78) |
(12.19) |
(-0.87) |
0.401 (1.44) |
| Marginal effects | -0.033 | 0.0911 | ||||
| Constant |
(6.07) |
(7.38) |
0.5023 (0.35) |
(-6.55) |
(-1.58) |
-6.306 (-1.07) |
| Control | Yes | Yes | Yes | Yes | Yes | Yes |
| Year | Yes | Yes | Yes | Yes | Yes | Yes |
| Area | Yes | No | Yes | Yes | Yes | Yes |
| Industry | Yes | Yes | Industry1 | Industry2 | Industry3 | Industry4 |
| Observations | 187,499 | 187,499 | 187,499 | 187,499 | 187,499 | 187,499 |
| r-squared | 0.2066 | 0.1993 | 0.8900 | 0.1961 | 0.1917 | 0.3939 |
Table 5.
Whether the carbon market has shortened the interval between two green patent applications by enterprises.
Table 5.
Whether the carbon market has shortened the interval between two green patent applications by enterprises.
| Method | PSM-DID | |
| Treatment |
(-1.73) |
(-2.91) |
| Constant |
(3.11) |
(1.56) |
| Control | Yes | Yes |
| Year | Yes | Yes |
| Area | Yes | No |
| Industry | Yes | Yes |
| Observations | 32,233 | 32,233 |
| r-squared | 0.0881 | 0.0745 |
Table 6.
whether the carbon market has shortened the time for enterprises to achieve the first green patent (from zero to one).
Table 6.
whether the carbon market has shortened the time for enterprises to achieve the first green patent (from zero to one).
| Cox regression | Hazard ratios | |
| Treatment |
(1.87) |
(3.82) |
| Treated year | 2011 | 2013 |
| Observations | 187,499 | 187,499 |
Table 7.
whether the carbon market has shortened the time for enterprises to achieve industry-leading certification (number of green patents ≥30).
Table 7.
whether the carbon market has shortened the time for enterprises to achieve industry-leading certification (number of green patents ≥30).
| Cox regression | Hazard ratios | |
| Treatment |
(2.09) |
(4.10) |
| Treated year | 2011 | 2013 |
| Observations | 187,499 | 187,499 |
Disclaimer/Publisher’s Note: The statements, opinions and data contained in all publications are solely those of the individual author(s) and contributor(s) and not of MDPI and/or the editor(s). MDPI and/or the editor(s) disclaim responsibility for any injury to people or property resulting from any ideas, methods, instructions or products referred to in the content. |
© 2025 by the authors. Licensee MDPI, Basel, Switzerland. This article is an open access article distributed under the terms and conditions of the Creative Commons Attribution (CC BY) license (http://creativecommons.org/licenses/by/4.0/).
Copyright: This open access article is published under a Creative Commons CC BY 4.0 license, which permit the free download, distribution, and reuse, provided that the author and preprint are cited in any reuse.


