
Submitted:
23 November 2025
Posted:
24 November 2025
You are already at the latest version
Abstract
Technological flexibility is widely recognised as a driver of product innovation, yet its role in enabling the transition toward sustainable products remains insufficiently understood. This study addresses this gap by examining how technological flexibility shapes product–market strategies through two pathways: (1) Technological Flexibility – Environmental Scanning – Product-Market Strategies (T–E–S) and (2) Technological Flexibility – Environmental Scanning – Circular Economy Principles – Product-Market Strategies (T–E–C–S). Using an abductive design and a survey of 300 medium and large manufacturing firms in Poland, we analyse eight dimensions of environmental scanning, seven circular-design principles, and four Ansoff-based strategic orientations. Non-parametric correlation tests and Kruskal-Wallis analyses and post hoc test show that technological flexibility significantly increases environmental-scanning intensity. Yet only five macro-environmental segments trigger circular-design behaviour, and only two principles – repairability and waste minimisation translate into sustainable product strategies. Results reveal two competing logics: a commercial logic focused on market opportunities and an ecological logic centred on sustainable design. Their integration occurs only under high technological flexibility and scanning engagement. The study contributes new empirical evidence on mechanisms linking flexibility, scanning, circularity, and sustainability-oriented product innovation.
Keywords:
technological flexibility
; environmental scanning
; circular economy principles
; sustainable products
; Industry 4.0
1. Introduction
In recent decades, we have seen an intensification of several phenomena that affect businesses: the digitisation of processes and products, the growing importance of climate change, increasingly stringent environmental regulations, rising consumer expectations regarding sustainability, and social pressure. It is widely accepted that companies cannot ignore these trends and that adapting to them is therefore a prerequisite for survival [1,2]. The European Green Deal, the United Nations Sustainable Development Goals (SDGs), and the Paris Climate Agreement [2,3,4], are of particular importance. All these documents define the strategic directions for economic transformation and impose increasing expectations on businesses.
In particular, Middle and Large size Enterprises (MLE) are at the centre of this transformation due to their scale, impact on the supply chain and resources. Their strategic responses to sustainability challenges are now crucial in shaping national and global progress towards a low-carbon, circular and resource-efficient economy. In this context, the concept of Circular Economics (CE) has emerged as a leading paradigm for combining economic growth with environmental stewardship. The principles of the circular economy emphasise minimising resource consumption and waste by extending the life cycle of products through reuse, repair, regeneration and recycling, as well as designing products that are durable, modular and made from renewable or secondary materials. The implementation of these principles is facilitated by technological flexibility (T), understood as the ability of a company to reconfigure its production system in order to modify its products and expand its range. This is achieved not only through automated and robotised production systems, but also through advanced integration and connectivity technologies and data processing and analysis technologies, including artificial intelligence, Big Data analytics, Virtual Reality, Augmented Reality, Digital Twins and Cyber-Physical systems. Research shows that flexibility reduces time to market, supports mass personalisation and increases resilience to supply chain disruptions [5,6]. However, the relationship between a company's technological flexibility (T) and its offering of sustainable products (S) remains an open question. Therefore, the main purpose of this work is to better understand the mechanism by which technological flexibility influences the adaptation of existing sustainable products and the introduction of new ones. In this regard, we have identified a knowledge gap:
- Many studies treat technological flexibility (T) as an independent factor enabling eco-innovation or circular economy practices (C), assuming a direct positive correlation between T and C [7,8]. Ferasso et al. [9] point out that the moderating role of scanning and analysing changes in the macro environment and industrial environment of a company (E) is often overlooked, and that taking this role into account supports the implementation of measures appropriate for the Circular Economy (C). The T-E-C sequence therefore requires clarification.
- According to classical strategic management theory, scanning changes in the environment (E) for the purposes of shaping product and market strategies (S) is dominated by an economic perspective, focused on seeking competitive advantage, increasing market share and maximising profits [10,11,12]. This is confirmed by more recent studies [13,14,15] and expands on this point of view by indicating that it also supports risk reduction and increases organisational resilience [16,17]. In turn, in the literature on sustainable development and the circular economy, environmental scanning is analysed from a completely different perspective. Its purpose is to identify regulatory requirements, social pressure, pro-environmental innovations and opportunities to reduce the environmental footprint [18]. These two perspectives lead to tension between commercial logic (T-E-S path) and ecological logic (T-E-C-S path) [19]. This phenomenon, identified as “dual business–sustainability tension” [20], requires further study.
- Most contemporary models and studies treat the principles of the Circular Economy (C) as an executive element of product and market decisions [21,22]. However, there are also works, e.g. [23,24,25], which consider the opposite relationship, suggesting that circular design principles can become the starting point for a new product and market strategy. However, the paradigm that circularity is the outcome, not the origin, of strategic choice still prevails.
- In this article, we aim to at least partially narrow this cognitive gap. To this end, we conduct an empirically based analysis of two cause-and-effect chains:
- Technological flexibility – Environmental scanning – Product-market strategies (T-E-S),
- Technological flexibility – Environmental scanning – Circular economy principles – Product-market strategies (T-E-C-S).
Literature studies indicate that the T-E correlation is statistically significant. If the E-C correlation is also significant, it can be assumed that technological flexibility (T) is moderated by environmental scanning (E) in such a way that it activates the application of CE principles (C). Then, if the E-S and C-S correlations are also statistically significant, it can be concluded that the company modifies existing products and introduces new sustainable products to the market, achieving both economic and environmental goals [26]. However, if C-S is not significant, the company is guided solely by economic goals in its product and market strategies.
2. Literature Review
Technological flexibility is most often understood as a company's ability to respond quickly to market changes, achieved through automation and robotisation, reconfigurable production systems and the use of digital technologies [27]. It represents dynamic capabilities that enable a company to adapt to changes in the macro environment and its industrial environment [28] and to recognise and seize opportunities, thereby achieving sustained competitive advantage. Research on the relationship between technological flexibility and product-market strategies can be divided into three groups: (1) primarily considers the direct relationship between flexibility and product-market strategies, with these strategies mainly focused on business objectives; (2) the relationship between technological flexibility and sustainable product-market strategies is examined; (3) an intermediary or moderating element is introduced in the relationship between technological flexibility and product-market strategies.
Authors representing the first group state that technological flexibility directly enhances firms' ability to implement product-market strategies aimed at business performance. This includes faster market entry (speed-to-market), higher customisation and differentiation, cost-efficient production adaptability, and experimentation with new business models. Based on a cross-sectional survey of 236 traditional manufacturing firms, Zhang et al. [29] demonstrate that digital technology usage (IoT, big data, cloud tools) positively affects the firm’s ability to reconfigure assets and make agile market decisions, thereby enabling the introduction of innovative products, services, and pricing models. It is important that digital transformation is supported by the political and legal environment, which strengthens it. Regulatory instability, on the other hand, weakens it. Wang et al. [28] explore how different stages of digital transformation and thus different levels of technological flexibility develop distinct dynamic capabilities (adaptive, absorptive, innovative), which subsequently influence the quantity and quality of innovation. At early stages, technological flexibility, such as digital prototyping tools and rapid testing, enables speed-oriented product–market strategies (rapid market entry and experimentation). At more advanced stages, deeper flexibility, such as digital integration platforms and AI systems, supports strategies focusing on high-quality product differentiation and service-based business models. Todescato et al. [27] focus on reconfigurable and intelligent manufacturing systems and demonstrate that these technologies directly enhance operational flexibility, allowing rapid switching of production modes and configurations. This flexibility supports mass customisation, short new product development cycles, and modular product offerings – the key components of product–market strategies emphasising variety and customer responsiveness. Rajesh [30] found that firms with higher technological flexibility can rapidly adjust production volumes and maintain product availability during disruptions. This supports aggressive market strategies like promotional campaigns and market share expansion.
The second group of publications includes those whose authors present the impact of the following aspects of technological flexibility on sustainable product-market strategies: reconfigurability of production systems, digital technologies, and supply-chain flexibility. Khettabi et al. [31] point out that already at the design stage of reconfigurable manufacturing systems (RMS), the same architectural principles that make manufacturing systems technically flexible can also make them inherently sustainable. They illustrate this through multi-objective evolutionary algorithms that optimise RMS configurations by balancing cost and environmental objectives. Building on this, Milisavljevic-Syed et al. [32] document real industrial cases where system reconfigurability allowed companies to switch materials and production setups quickly, thus lowering the time and cost of developing greener product variants. Andersen et al. (2024) [33] provide a methodological foundation for designing changeable and reconfigurable systems that remain both operationally efficient and environmentally adaptable, emphasising modularity and changeability as design imperatives supporting circular economy principles. Batwara et al. [34] propose a hybrid decision-support approach to help firms identify which product features simultaneously drive customer satisfaction and environmental performance. Their empirical findings show that it is possible to align flexible technological capabilities, for example, rapid material substitution or modular product design, with profitable green innovation strategies. On the other hand, researchers who associate flexibility primarily with digital technologies state that digital tools not only enhance technological flexibility but also provide the informational and analytical capabilities needed to accelerate green product innovation. Sahoo et al. [35] demonstrate, from a resource-based and network perspective, that digital adoption (IoT, big data analytics, and integration platforms) strengthens firms' ability to coordinate eco-innovation activities, enabling faster learning and resource orchestration for sustainable product design. Xu et al. [36] advance this reasoning by showing empirically that digital transformation, coupled with capability reconfiguration, drives digital green innovation – the development of products that simultaneously improve environmental and economic outcomes. Wang et al. [37] adds quantitative evidence that digital transformation directly increases the share of green products in manufacturing portfolios, primarily through life-cycle assessment (LCA) tools and digital prototyping, which accelerate sustainable product design cycles. Han et al. [38] complements this with an analysis of performance impacts, confirming that technology-enabled eco-innovation improves both financial and environmental performance when integrated into flexible production systems. Finally, Mosca et al. [39] broaden the perspective by mapping digital tools that promote behavioural and organisational change in sustainability contexts, suggesting that digitalisation also fosters market acceptance of eco-products. In turn, authors who study the impact of flexible supply chains conclude that technological flexibility within production systems cannot produce large-scale sustainable outcomes unless the supply network itself is equally adaptable and digitally traceable. Andersen et al. [33] demonstrate how changeable manufacturing, when combined with modular product families, enables firms to scale green variants efficiently, namely modularity allows circular product redesign without losing economies of scale. Sanchez-García et al. [40] extend this logic to the circular economy transition, showing that technologies such as blockchain and AI provide traceability and data reliability, critical for verifying the environmental credentials of circular products.
The third group includes studies that introduce mediating or moderating factors into the relationship between technological flexibility and product-market strategies. Such factors include scanning the business environment and activities that constitute a circular economy. Scanning involves monitoring and analysing macro-environmental and industrial environment factors, usually across segments such as: political-legal (regulatory), economic, socio-demographic, ecological (natural environment), technological, buyers, suppliers, competitors [41]. Flexible technologies, especially those used in Industry 4.0, such as IoT sensors, digital twins, big data analytics, and predictive analytics, expand both the observability and actionability of external signals. The data generated by these technologies increases the firm's capacity to detect regulatory pressures (e.g., recycled-content mandates), material scarcity, customer preferences, and competitor moves earlier and at higher resolution than conventional systems permit [42,43]. In addition, flexible production architectures (reconfigurable tooling, modular platforms, digital manufacturing) reduce the marginal cost and lead time of experimenting with alternative materials, modular designs, or product variants, so that scanning signals can be converted into pilots or product changes without prohibitive investment [42,44].
Companies scan their environment primarily for traditional business purposes. This is because scanning is a long-established management practice aimed at analysing competition, identifying market opportunities, recognising technologies and managing risk in order to improve a company's performance and market position. It is rarely aimed at obtaining data on environmental issues. This is confirmed by cross-cultural empirical research on competitive intelligence and revenue management. Demirciftci et al. [14] show that companies systematically scan competitors' prices, product launches and demand patterns to make tactical and strategic revenue decisions. Multi-industry research on new product introduction practices [13] also shows that scanning the environment for customer needs is a dominant factor influencing product development processes and commercialisation decisions. These studies indicate that scanning primarily serves business outcomes such as sales growth, reduced time to market, and defensive responses to competitors' actions [13,14,45]. At the same time, high-level industry reports and corporate surveys show rapidly growing awareness of environmental and climate risks, which has increased the frequency of scanning for regulatory and sustainability signals [46]. Empirical studies that focus specifically on the link between environmental scanning and sustainability action show that scanning activates green strategies primarily when firms perceive a business case (lower risk or higher opportunity). Song et al. [47] demonstrate that firms deploying scanning plus strong cross-functional coordination are more likely to adopt green strategies; Lindgreen et al. [48] find that firms actively engaged in circular economy practices use scanning for multiple purposes (stakeholder engagement, regulatory foresight) but that such scanning often began as a response to regulatory or market pressure rather than a primary ecological mission. Studies on organisational resilience [17] show that scanning aimed at risk management also triggers process innovations that may have environmental co-benefits, again underscoring the primacy of business risk/continuity motives. Song et al. [47], Lindgreen et al. [48], YahiaMarzouk & Jin [17], Del Vecchio, et al. [49] in their study on technological flexibility and innovation emphasise that technological and market scanning serves “opportunity recognition” – identifying market niches and cost advantages, rather than directly serving environmental goals.
In turn, literature on sustainable development and the circular economy emphasizes that environmental scanning aims to identify regulatory requirements, social pressures, pro-environmental innovations and opportunities to reduce the environmental footprint. Siekmann et al. [18] emphasize that Industry 4.0 technologies support the environmental monitoring process and contribute to the implementation of circular economy practices, but the logic behind this process is mainly motivated by environmental standards, not market standards. Ortega-Gras et al. [6] argue that companies introducing I4.0 technologies are driven by regulatory and reputational pressure rather than direct profit, which distinguishes environmental scanning in the context of sustainable development from traditional market scanning. This phenomenon, known as ‘dual business–sustainability tension’, has been highlighted by a number of researchers [50,51,52].
The above review of the literature confirms the existence of the knowledge gap we have identified. The mechanism of transition from technological flexibility to sustainable product and market strategies is not explained, because even if the mediating factor of environmental scanning is taken into account, there is a divergence of views on the objectives of scanning (market vs. environmental). We believe that in order to avoid the tension that exists between market and ecological objectives, another moderating factor needs to be included in this mechanism. This factor is the modification of existing products and the design of new products in accordance with the principles of the circular economy, including extending the life cycle of products through reuse, repair, regeneration and recycling, as well as designing durable, modular products made from renewable or secondary materials. On the one hand, the implementation of these principles is initiated by scanning the environment, and on the other hand, they translate into the implementation of sustainable product and market strategies.
3. Materials and Methods
3.1. Research Design
An analysis of the literature has shown that there is a correlation between technological flexibility and product-market strategies. We analyse strategic choices through the lens of Ansoff's matrix, which distinguishes four growth strategies: market penetration, product development, market development and diversification. These strategies define how companies combine existing and new products with existing and new markets. The market penetration strategy involves increasing market share in the current market through intensified promotion, loyalty programmes and the expansion of distribution channels [53]. The market development strategy leads to an increase in sales of existing products through geographical expansion and the acquisition of new customers [12]. The product development strategy is implemented by offering buyers in existing markets improved, modified or new products [13]. The essence of the diversification strategy, on the other hand, is to introduce new products to new markets through product innovation, acquisitions, strategic alliances and new business models [10].
The Ansoff Matrix [10] is a useful analytical structure for identifying whether the signals obtained by scanning the macro environment and the competitive environment result in the selection of product and market strategies that are primarily focused on business objectives or, in parallel with business objectives, intentionally take into account environmental objectives. Since previous research indicates a contradiction between the objectives of these strategies (economic vs. environmental), we have used an abductive approach to explain the mechanism of this relationship. First, we introduce an intermediary factor, which is the scanning of the macro environment and the industrial environment of the enterprise. As a result, we consider the following chain of dependencies: Technological flexibility – Scanning of the environment – Product and market strategies. Secondly, we introduce a moderating factor for scanning, in the form of applying circular economy principles. As a result, we also consider a second path of relationships: Technological flexibility – Scanning the environment – Product design in accordance with CE principles – Product and market strategies (Figure 1).
According to the prevailing views in the literature, it can be expected that the first path (T-E-S) leads to product-market strategies focused on business objectives. The second (T-E-C-S), on the other hand, should naturally lead to sustainable product-market strategies. If this is the case, it can be concluded that technological flexibility is used not only for economic purposes but also to modify existing products and introduce new sustainable products to the market. However, if at least one of the links between Environmental Scanning-CE Principles (E-C) or CE Principles-Product and Market Strategies (C-S) is ‘broken’, these strategies do not involve offering sustainable products to buyers.
Our research is predominantly quantitative. Empirical research was conducted in January 2025 among medium and large-sized enterprises operating in Poland, spanning 19 industrial sectors. A total of 300 companies participated in the study, including 174 medium-sized and 126 large firms, with a representative sample size of 137 and 133 firms, respectively. 109 of them (17%) represented activities considered to have the most overall harmful impact on the natural environment (food production, automotive vehicle assembly, tyre production, pharmaceuticals manufacturing, furniture production, and beverage production). The data was collected using a questionnaire with closed-ended questions. The computer-assisted telephone interview (CATI) technique was used. The respondents were CEOs, Directors of Engineering, or Financial/Economic Directors. Responses were given on a 5-point Likert scale.
3.2. Instruments and Data Analysis
The research questionnaire consisted of 5 groups of questions. Questions in groups 2-5 are shown in Figure 1.
- Background information (about firm and respondent).
- Does the technological flexibility (T) of your resources enable you to expand the range of products/services you offer? Possible answers: 1- do not enable at all; 2- enable to a very small extent; 3- enable to a moderate extent; 4- enable to a large extent; 5- enable to a very large extent. Cronbach’s alpha = 0.42. This is a low value, which indicates that each of the two questions T1 and T2 refers to a different construct: T1 – adaptability of technology within a single industry; T2 – transformability of technology to different sectors. For this reason, we treated T1 and T2 as separate constructs in the study.
- We scan and analyse changes taking place in segments of the environment (E). Possible answers: 1 – we do not undertake such actions at all; 2 – we undertake such actions to a very small extent; 3 – we undertake such actions to a moderate extent; 4 – we undertake such actions to a large extent; 5 – we undertake such actions to a very large extent. Cronbach's alpha = 0.82 indicates a very high reliability of the measurement scale.
- We design products in accordance with the principles of circular economy (C). Possible answers – the same as for scanning changes in the environment. Cronbach's alpha = 0.78 indicates a very high reliability of the measurement scale.
- We adapt existing products and introduce new ones to the market (S). Possible answers – the same as for scanning changes in the environment. Cronbach’s alpha = 0.83 indicates very high reliability of the measurement scale.
The variables of a given group shown in Figure 1 were treated as independent (grouping) and dependent, respectively, according to the direction of the arrow. Since the responses were given on a rank scale, Spearman's non-parametric rank correlation test was used to determine the relationship between the grouping and dependent variables. For pairs of variables between which there is a statistically significant correlation, the non-parametric Kruskal–Wallis test of variance was used. This test makes it possible to determine whether there are statistically significant differences between the medians of at least two groups of the dependent variable, corresponding to the ranks of the grouping variable. If this is the case, the rank of the grouping variable influences the rank, i.e. the value of the dependent variable. To identify these groups, a post hoc test (multiple comparisons) was performed. Then, the medians for individual groups of a given dependent variable were calculated. Cases in which the Kruskal–Wallis test indicated overall significance but post hoc tests showed no significant pairwise differences (p > 0.05) were excluded from analysis. Despite apparent median differences, the absence of statistical confirmation and the presence of non-monotonic or logically inconsistent trends (e.g., U-shaped, inverted U-shaped, fluctuating, stepwise, or flat patterns) were deemed inconsistent with the theoretically expected direction of the relationship. It was assumed that both the rank and median of the dependent variable should systematically increase with the rank of the grouping variable; cases not meeting this condition were not further interpreted.
All tests were performed using Statistica v.13 software. The entire series of tests led to the identification of the rank of the independent (grouping) variable at which the highest median of the dependent variable is obtained. This creates the basis for a change in technological flexibility so that the company's involvement in modifying existing products and introducing new ones to the market is maximised. In the case of the T-E-C-S path, these strategies apply to sustainable products.
4. Results
In accordance with the adopted research model (Figure 1), we verified whether technological flexibility is statistically significantly correlated with product and market strategies (Table 1). Spearman's rank correlation test gives a positive result, with construct T1 (intra-sectoral technology adaptability) being more strongly correlated than construct T2 (inter-sectoral technology transformability). The T1 variable is correlated at a similar level with all product and market strategy variables: S1 - market penetration, S2 - market development; S3 - product development, S4 - diversification. A post hoc test confirmed that there are statistically significant differences between the medians of the groups for each variable S, corresponding to the ranks of variable T1. In the case of cross-sectoral technological flexibility T2, differences between groups occur only within variables S2 and S3.
The existence of a statistically significant correlation between technological flexibility (T) and product-market strategies (S) justifies conducting in-depth analyses aimed at explaining the mechanism and nature of this relationship. Table 2 shows the correlation between flexibility T and environment scanning E. Intra-sectoral technological flexibility T1 is statistically significantly correlated with all variables related to scanning changes occurring in environmental segments: E1-regulators, E2-economic, E3-socio-demographic, E4-natural environment, E5-technological, E-6 buyers, E7-suppliers, E8-competitors. With the exception of E6, intersectoral flexibility T2 is also statistically significantly correlated with them, but less so than T1.
The Kruskal-Wallis and post hoc tests showed that only with higher technological flexibility (higher T ranks) do companies begin to engage significantly in scanning their environment (Table 3). The expected relationship is an upward trend in the median in statistically significantly different (p<0.05) groups of E values, corresponding to increasing T ranks (values). This is the nature of the relationship between T1 and the environment scanning variables, with the exception of E1 (regulatory segment) and E3 (socio-demographic segment). In the case of the grouping variable T2, the upward trend in the median occurs only for the variables E3 (socio-demographic segment scanning) and E7 (suppliers segment scanning).
The increase shows the following patterns:
- Single-step increase – which means that the median increases once and only by one level, most often from 3.0 to 4.0 when the T rank reaches a value of 4 or 5,
- Saturation curve – when the median increases slowly for ranks 1 to 3 and stabilises at 4.0 for ranks 4 and 5,
- Stepwise increase – when the median increases with the increase in the T rank, but there are cases where the median is the same for two consecutive ranks (e.g. for ranks 2 and 3 it is 3.0) and then increases again to 4.0 or 5.0, as is the case with E6 – scanning the buyers segment.
The general pattern between technological flexibility (T) and environment scanning (E) is that when flexibility allows for at least a moderate or large expansion of the range of products offered (rank is 3 or 4, respectively), the company engages in scanning segments of the environment to a large or very large extent (the median is 4.0 or 5.0, respectively).
As evidenced by literature studies, environmental scanning can be aimed at identifying business opportunities or designing and launching sustainable products. Table 4 presents the results of the Kruskal-Wallis and post hoc tests, as well as the median trend and the highest median for the relationship: Environmental scanning (E) – We design products in accordance with the principles of circular economy (C).
This table shows that an increase in a company's commitment to designing products to be more sustainable is achieved through an increase in its commitment to scanning the macro environment (grouping variables E1-E5). The tests carried out did not show an upward trend in the commitment to applying CE principles depending on scanning and deepening the analysis of the industrial environment (variables E6, E7, E8 in Figure 1). Furthermore, not all variables E1-E5 cause an increase in the intensity of application of each principle. Scanning is most focused on designing products in a way that facilitates their repair (C3), followed equally by the use of recoverable and recyclable materials (C1), environmentally friendly materials (C2), biodegradable materials (C4), and the replacement of hazardous technologies with environmentally safe technologies (C7). It is used to the least extent to reduce waste (C5) and sell it to other companies (C6). The medians in these variable groups most often increase according to a ‘single-step increase’ pattern from 3.0 to 4.0 when the ranking of the grouping variable reaches a value of 4 or 5, less often their trends follow a ‘stepwise’ pattern and at rank 5 the medians reach a value of 5.0 or 4.0, and in a single case (E3-C3) in the range of ranks from 1-3, the medians in individual groups are 3.0 and increase to 4.0 and 5.0 as the rank of E3 increases (flat-then-rising).
Table 5 presents the results of the Kruskal-Wallis and post hoc tests, as well as the median trend and the highest median for the relationship: Environment scanning (E) – we modify existing products and introduce new ones to the market (S).
The medians in the groups of each dependent variable S1-S4 show an upward trend with an increase in the rank (value) of each variable grouping scanning and analysis of the macro environment (E1-E5) and the industrial environment (E6-E7). The exception is variable S3 concerning the introduction of new products to markets currently served by the company, whose groups do not increase with the company's increasing involvement in scanning the socio-demographic segment. In the case of grouping variables E1-E5, growth trends according to the ‘single-step increase’ model dominate, while the medians of groups corresponding to variables E6-E7 most often increase according to the ‘stepwise increase’ model. In all cases, the highest medians reach a value of 4.0 when the company is involved in scanning the environment to a large or very large extent (the ranking of the grouping variable is 4 or 5); less frequently when the involvement is very large (ranking = 5), and least frequently when it is at least moderate (ranking = 3).
As shown in Table 5, a company's involvement in scanning its environment and analysing changes taking place in it remains statistically significant and positively correlated with the adaptation of existing products and the launch of new products on the market. However, this correlation does not explain whether these adaptations and new products are more sustainable. To obtain such an explanation, Kruskal-Wallis and post hoc tests were performed, as well as an analysis of median change trends for the relationship: We design products in accordance with CE principles (C) – we modify existing products and launch new products (S) (Table 6). The results show that:
- modifications to existing products offered by the company in existing markets (variable S1) consist in minimising material waste (grouping variable C5),
- new products that are introduced to existing markets (S3) and new markets (S4) are designed to be more easily repairable (grouping variable C3).
None of the five remaining variables of product design in accordance with the principles of circular economy have any impact on improving the sustainability of existing or new products. The medians of the variables of company involvement in the modification and introduction of new, more sustainable products increase only according to the ‘single-step increase’ trend. This commitment is high (median = 4.0) when the company's commitment to designing products aimed at sustainability is high or very high (the ranking of the grouping variable is 4 or 5, respectively).
The summary results of the analyses of cause-and-effect relationships occurring in both T-E-S and T-E-C-S paths are shown in Figure 2. The nodes of the graph represent variables: T – intra-sectoral and inter-sectoral technological flexibility, E – scanning and analysis of changes taking place in surrounding sectors, C – product design in accordance with the principles of circular economy, S – modification of existing products and introduction of new products to the market. Arrows marked with a solid line indicate a relationship whereby an increase in the value (rank) of the predecessor (grouping variable) causes an increase in the rank and median of the successor (dependent variable). The links between the shaded nodes with bold symbols indicate two paths of dependency: T-E-S and T-E-C-S. Modifications to existing products (S1) and new products introduced to the market (S3, S4) are balanced only to the extent determined by two CE principles – C3 and C5.
The bidirectional arrows marked between the C nodes with a dotted line indicate that there is a statistically significant positive correlation between these variables. Variables C1, C2, C4, C6, and C7 do not have a direct impact on S variables, but the CE principles of product design that they represent can be partially taken into account when implementing principles C3 and C5.
5. Discussion
Our research confirmed that companies with high technological flexibility use it to pursue growth strategies by adapting existing products and introducing new ones to existing and new markets. They do so, however, primarily within the industry in which they operate. Opportunities for growth across other industries, although present, are significantly more limited (Table 1). The Kruskal–Wallis tests and post hoc analyses showed that intra-sector technological flexibility (T1) enables the implementation of all four strategies distinguished in Ansoff’s matrix (existing or new product – existing or new market). In the case of cross-sector technological flexibility (T2), these possibilities apply only to the market development and product development strategies. The lower level of cross-sector flexibility can be explained by the fact that technologies used in different industries are highly specialised and require distinct sets of competences. This is consistent with findings by Hose et al. [5], who emphasise that Industry 4.0 technologies typically enhance flexibility within existing technological domains rather than across unrelated sectors. Similarly, Ortega-Gras et al. [6] and Kannan et al. [7] note that cross-sector technological adaptation is hindered by process incompatibilities, limited engineering knowledge transfer, and elevated investment risks. A comparable view is presented by Zhang et al. [29] and Masi et al. [15]. Our results also align with classical strategy perspectives presented by Ansoff [10], Porter [11], and Johnson et al. [12], who argue that diversification into new sectors requires substantially greater resources and capabilities and is therefore less effective than growth within the firm's established industry.
In pursuing growth, companies identify opportunities that can be exploited with their existing technological flexibility. To this end, they scan the environment and analyse the changes occurring in its segments. They do so more intensely the greater their flexibility (Table 2). The threshold level is moderate flexibility (rank 3), represented by modular production systems that enable limited but effective reconfiguration for related product variants. The next level is high flexibility (rank 4), associated with advanced, highly automated, and digitally integrated technologies that enable rapid adaptation to new product categories. Very high flexibility (rank 5) is characteristic of multi-axis industrial robots, 3D printing systems, and automated machining cells equipped with 5-axis CNC centres and robotic loading/unloading systems.
Intra-industry-flexible firms (T1) focus primarily on the economic (E2), natural environment (E4), technological (E5), buyers (E6), suppliers (E7) and competitors (E8) segments, because they enable rapid and direct adjustments to market, technological, and competitive changes within the same industry, which aligns with their scope of technological adaptation [5,7]. By contrast, high cross-sector technological flexibility (T2) encourages the search for opportunities in the socio-demographic segment (E3) because it enables the identification of trends necessary for product diversification and entry into new industries, which is consistent with the logic of searching for new markets and business models [10,12]. High engagement in environmental scanning (median 4.0) means conducting systematic and broad analysis of environmental segments by dedicated teams. Very high engagement (median 5.0) includes, among other things, analysis of trends and future scenarios and their potential impact on the company, supported by advanced analytical systems, as well as early detection of threats and opportunities and rapid adaptive and innovative decision-making. This gradation can be explained by three interactive mechanisms identified in the literature: (1) a one-off, abrupt and concentrated engagement of organisational resources (human, informational, digital, etc.) for scanning purposes (single-step increase), when companies aim to rapidly acquire promising information on changes occurring in environmental segments [5,29,42]; (2) iterative, gradual scanning (stepwise increase), when firms perceive benefits from increasing the engagement of their organisational resources and therefore escalate such engagement in stages [13,14,47]; (3) the stabilisation of organisational resource engagement (saturation curve), when additional investment no longer yields proportional gains from the acquired information [15,31,32,33,35]. However, the literature does not empirically test the curves illustrating companies' engagement in scanning individual environmental segments; therefore, the patterns observed in our study constitute a new empirical contribution that justifies further longitudinal and causal research.
The original aspect of our study was to examine whether firms also scan their environment in order to identify which product-design principles aligned with the circular economy they could apply (Table 4). By scanning the regulatory segment (E1), they learn about requirements concerning materials, repairability, process safety and environmental restrictions arising from the European Green Deal and international sustainability policies, which the literature identifies as important triggers for eco-design and circular design adoption [2,15,46,47]. By scanning the economic segment (E2), they obtain information on raw material costs, the availability of recycled materials and the profitability of waste reduction solutions. The literature indicates that economic signals often determine the adoption of waste minimisation practices [15,21]. From the socio-demographic segment (E3), they obtain knowledge about users' expectations concerning product repairability and about whether users attach importance to how companies handle their waste. This is highlighted in studies on product innovation and sustainability perception [2,13]. By scanning the natural-environment segment (E4), firms identify ecological pressures, environmental risks and issues related to biodegradability, recyclability and opportunities for waste commercialisation, as confirmed in studies addressing circular-economy practices and eco-design constraints [15,42]. In the technological segment (E5), enterprises identify technologies and processes enabling modularity, ease of repair and sustainable life-cycle thinking. Research on technological flexibility and Industry 4.0 emphasises the role of reconfigurable systems, automation and digital solutions in supporting such design approaches [29,32].
Our findings indicate, somewhat surprisingly, that companies do not engage significantly in analysing buyer, supplier and competitor segments in relation to the application of circular economy principles in product design. They do analyse these segments, but for other purposes, namely to obtain signals related to demand, prices, technologies and competitiveness [1,10,11,12]. The literature on strategic management and competitive analysis shows that information from these segments is used primarily to assess growth potential, competitive advantage, and technological or market changes, rather than directly to identify eco-design principles [14,47].
The general trend we observed indicates that engagement in analysis must be at least high (rank 4) for the application of circular economy principles in product design to be high (median 4.0) or very high (median 5.0). A high level of commitment means that the principles are incorporated into a large proportion of designs, but not into all product types or all relevant design features. Designers often use solutions such as environmentally friendly materials, ease of repair or waste-reducing choices, although these practices are still partial or selective. Proven circular economy-oriented methods are used in the design process, but not all potentially relevant circular economy options are consistently explored. This selective but significant application is consistent with the literature showing barriers to full circular economy implementation (technical complexity, costs, and supply chain constraints), so companies prioritise a subset of circular economy measures that provide clear economic or operational benefits [15,21,24,25]. In cases of very high engagement, circular economy principles are applied very broadly and consistently across most design projects, covering many aspects such as material selection, product structure, and anticipated end-of-life treatment. Designers systematically consider a wide range of CE options, such as material efficiency, use of recycled raw materials, biodegradability or improved repairability, already at the conceptual stage. In practice, this means that almost every project is carefully assessed for CE opportunities and the application of these principles is highly deliberate and comprehensive. Empirical and review studies indicate that when companies achieve this level, it is typically supported by strong organisational capabilities, regulatory incentives, and digital technologies that enable comprehensive CE implementation [1,21,32,42].
Our research has shown that there are two different logics for exploiting technological flexibility (T1 and T2), scanning environmental segments (E1–E8) and translating them into product-market strategies (S1-S4), i.e. modifying existing products and introducing new products to existing and new markets.
The first is a logic focused on business results (path: technological flexibility (T) – scanning of environment segments (E) – product and market strategies (S)). According to this logic, companies use technological flexibility, both moderate (modular production systems), high (advanced, automated and digitally integrated technologies) and very high (multi-axis robots, 3D printing systems, robotic machining centres supported by R&D facilities), primarily in order to increase their competitiveness and respond more quickly to market opportunities. Therefore, when scanning their environment, they focus on those segments that translate into the ability to act quickly:
- economic segment (E2) – information on costs, inflation, purchasing power;
- technology segment (E5) – technologies that increase efficiency or shorten time to market;
- supplier segment (E7) – availability of materials, reliability of supplies;
- competitor segment (E8) – competitors' activities, new players, technological advantages.
In this business logic, companies engage in scanning the environmental segment (E6) to a limited extent, as the signals it provides, such as environmental pressures, changes in the availability of natural resources or growing demands for ecosystem protection, are obtained through passive scanning and, moreover, do not translate directly into the rapid exploitation of market opportunities. Only when environmental pressures begin to affect operating costs, supply risks or regulatory links does the E6 segment become significant, but scanning for changes in this segment still only has a supporting role. Our research shows (Table 5) that, in most cases, scanning must be at least extensive (systematic analyses conducted by dedicated teams) for the results to be useful for modifications, including, for example, functionality, design, materials used, ergonomics, production technology, etc. and giving new products features that adapt them to the specific requirements of current and new markets.
The second logic is focused on environmental goals (path: technological flexibility (T) - scanning of environmental segments (E) - application of CE principles (C) - product and market strategies (S)). Companies scan their environment not only to obtain the data needed to achieve their business objectives, but also to identify which CE-compliant design principles they can apply in order to use their technological flexibility to make modified and new products introduced to the market more sustainable. Therefore, they engage in scanning those segments of the environment that provide the information needed to design products in accordance with the principles of the circular economy (Table 4):
- economic segment (E2) – changes in the costs of primary and secondary raw materials, predicted prices of materials with low environmental impact and the economic effects of designing products with a longer life cycle,
- socio-demographic segment (E3) – user expectations regarding durability and environmental responsibility [13],
- environmental segment (E4) – environmental pressures, critical materials, ecological risks [15],
However, the company's involvement in scanning must be high (rank 4), i.e. carried out relatively regularly by dedicated teams, so that product designers have data on environmentally friendly materials and solutions that facilitate product repairability and waste reduction, which can only be used in certain projects (median 4.0). Only with a very high level of commitment to scanning and analysing changes in the environment, carried out using advanced analytical and predictive systems (rank 5), can the principles of circular economy be applied very broadly and consistently in most projects, covering various aspects of design, material selection and the future life cycle of the product (median 5). However, this mainly applies to the two most commonly used and least demanding principles in terms of interference with product design and the need to acquire new knowledge: C3 – designing products that are easy to repair, and C5 – designing to minimise waste.
The application of these two logics can be, and is, a source of tension between business-oriented scanning and offering more sustainable products. The former is aimed at identifying quick-to-exploit and profitable opportunities, while the latter is aimed at identifying possible actions, often involving profound design changes that require time, resources and carry greater uncertainty. We thus confirm the results of studies presented by other authors [19,20,22,50,51]. However, our research shows that, to a certain extent, it is possible to integrate both paths. This is possible when technological flexibility is high or very high, i.e. represented by highly automated and digitally integrated technologies enabling rapid adaptation to new product categories, production technologies with broad application potential, such as multi-axis industrial robots, 3D printing systems capable of producing diverse types of components, versatile machining systems such as automated machining cells equipped with a 5-axis CNC machining centre and a robotic loading/unloading system. In our research, out of 138 out of 300 companies that were characterised by high or very high technological flexibility (46%), this convergence was demonstrated by 12 out of 138 companies, i.e. 8.7%. However, when considering only companies with high or very high technological flexibility but conducting activities considered to have the most overall harmful impact on the natural environment (51/300, i.e. 17%), 5 out of 51 companies, i.e. 9.8%, showed convergence of both paths. In both populations of companies, the results are therefore similar and show the percentage of companies that, by modifying existing products or introducing new ones, simultaneously increase their sustainability (C3 – easily repairable and C5 – waste minimisation) while achieving their business objectives. In the case of these two CE principles (C3 and C5), they are associated with fewer complaints, easier servicing and lower waste management costs [15,21,24,25]. The integration of both logics therefore occurs when product sustainability can be achieved without losing business benefits, and only those CE principles are implemented that do not cause the loss of these benefits.
6. Conclusions
The study empirically explains how technological flexibility translates into the adaptation of existing and the introduction of new sustainable products, revealing the specific sequences of mediating and moderating factors that shape this process. Rather than merely confirming the existence of a relationship between technological flexibility (T) and product–market strategies (S), the research uncovers the mechanisms and threshold conditions that determine whether technological flexibility activates sustainability-oriented outcomes (T–E–C–S) or results only in business-oriented growth (T–E–S). In doing so, the study not only ‘closes’ the cognitive gap identified in the introduction but also reformulates the current understanding of the T-E-C-S sequence, proposing its empirical verification and clarification. Thus, the main purpose and aim of our research have been fully achieved.
First, no prior research has empirically examined two distinct and competing logics of environmental scanning, a commercial logic focused on opportunity recognition and an ecological logic focused on sustainability requirements, nor their simultaneous impact on product–market decision-making. Second, while most scholarly work assumes that circularity emerges as an outcome of strategic choices, this article demonstrates that circular economy principles can act as a moderating mechanism shaping the strategic pathway itself. Third, the study introduces threshold-based modelling of scanning intensity (single-step increases, stepwise increases, saturation curves), providing a novel conceptualisation of how organisational engagement levels condition the activation of sustainability-oriented behaviours. These patterns have not previously been empirically described in the literature on dynamic capabilities, environmental scanning, or circular design.
The article makes the following theoretical contribution:
- A clear operationalisation of the dual scanning logic and empirical evidence showing which segments of the environment drive the business-oriented T–E–S pathway and which activate the ecological T–E–C–S pathway.
- Identification of only two circular economy principles—C3 (design for repairability) and C5 (waste minimisation)—that meaningfully translate into sustainable product–market strategies. This demonstrates that the transition from T to sustainable products is selective rather than comprehensive.
- Empirical clarification of the conditions under which firms can integrate business and ecological objectives, challenging the dominant assumption that these logics are inherently incompatible.
- Introduction of the concept of engagement thresholds in environmental scanning, explaining why technological flexibility leads to sustainability gains only when scanning intensity reaches specific levels.
The practical usefulness of the findings is equally significant. Companies receive clear guidance on how to structure scanning activities so that technological flexibility can be leveraged for both business growth and sustainability outcomes. The study shows that firms, including those in environmentally harmful industries, can integrate their technological capabilities with circular design principles, provided that environmental scanning is sufficiently advanced. Moreover, the results highlight which investments in technology and which environmental segments yield the greatest strategic leverage in designing sustainable product portfolios.
Author Contributions
Conceptualization, J.T. and S.T.; Methodology, J.T. and S.T.; Validation, J.T.; Formal Analysis, S.T.; Investigation, S.T.; Resources, S.T.; Data Curation, J.T.; Writing – Original Draft Preparation, S.T.; Writing – Review and Editing, J.T. and S.T.; Supervision, S.T.; Funding Acquisition, J.T. and S.T.
Funding
Research grant – FEM, PUT – 0813/SBAD/2988
Institutional Review Board Statement
N/A
Informed Consent Statement
N/A
Data Availability Statement
Data are available on reasonable request through correspondent author.
Conflicts of Interest
The authors declare no conflict of interest.
References
- Klemke-Pitek, M.; Majchrzak, M. Pro-Ecological Activities and Shaping the Competitive Advantage of Small and Medium-Sized Enterprises in the Aspect of Sustainable Energy Management. Energies 2022, 15(6), 2192. [Google Scholar] [CrossRef]
- 2. European Commission. Communication from the Commission: The European Green Deal, COM(2019) 640 final; Brussels, Belgium, 11 December 2019. 11 December.
- United Nations. Transforming Our World: The 2030 Agenda for Sustainable Development; United Nations: New York, NY, USA, 2015. [Google Scholar]
- UNFCCC. Paris Agreement; United Nations Framework Convention on Climate Change: Bonn, Germany, 2015. [Google Scholar]
- Hose, K.; Amaral, A.; Peças, P. Manufacturing Flexibility through Industry 4.0 Technological Concepts – Impact and Assessment. Global Journal of Flexible Systems Management 2023, 24 (2), 271–289. [CrossRef]
- Ortega-Gras, J. J.; Bueno-Delgado, M. V.; Puche-Forte, J. F.; Garrido-Lova, J.; Martínez-Fernández, R. Exploring Industry 4. 0 Technologies Implementation to Enhance Circularity in Spanish Manufacturing Enterprises. Sustainability 2025, 17(17), 7648. [Google Scholar] [CrossRef]
- Kannan, D.; Gholipour, P.; Bai, C. Smart Manufacturing as a Strategic Tool to Mitigate Sustainable Manufacturing Challenges: a Case Approach. Annals of Operations Research 2023, 331. [Google Scholar] [CrossRef]
- Alraja, M. N.; Imran, R.; Khashab, B. M.; Shah, M. Technological Innovation, Sustainable Green Practices and SMEs Sustainable Performance in Times of Crisis (COVID-19 pandemic). Information Systems Frontiers 2022, 24, 1081–1105. [Google Scholar] [CrossRef]
- Ferasso, M; Beliaeva, T. ; Kraus, S.; Clauss, T., Ed.; Ribeiro-Soriano, D. Circular economy business models: The state of research and avenues ahead. Business Strategy and the Environment 2020, 29 (8), 3006-3024. [Google Scholar] [CrossRef]
- Ansoff, H. I. Strategies for Diversification. Harvard Business Review 1957, 35(5), 113–124. [Google Scholar]
- Porter, M. Towards a Dynamic Theory of Strategy. Strategic Management Journal 1991, 12, 95–117. [Google Scholar] [CrossRef]
- Johnson, G.; Scholes, K.; Whittington, R. Exploring Corporate Strategy: Text & Cases, 8th ed.; Pearson Education: Harlow, UK, 2008. [Google Scholar]
- Knudsen, M. P.; von Zedtwitz, M.; Griffin, A.; Barczak, G. Best Practices in New Product Development and Innovation: Results from PDMA’s 2021 Global Survey. Journal of Product Innovation Management 2023, 40(3), 257–275. [Google Scholar] [CrossRef]
- Demirciftci, T.; Belarmino, A. A Cross-Cultural Study of Competitive Intelligence in Revenue Management. Journal of Revenue and Pricing Management 2022, 21(6), 691–699. [Google Scholar] [CrossRef]
- Masi, D.; Kumar, V.; Garza-Reyes, J. A.; Godsell, J. Towards a More Circular Economy: Exploring the Awareness, Practices, and Barriers from a Focal Firm Perspective. Production Planning & Control 2018, 29 (6), 539–550. [CrossRef]
- Maluleka, M.; Chummun, B. Z. A Review of Existing Literature on Competitive Intelligence and Insurance Markets. Corporate Governance and Organizational Behavior Review 2023, 7(4), 1–17. [Google Scholar] [CrossRef]
- YahiaMarzouk, Y.; Jin, J. The Relationship Between Environmental Scanning and Organizational Resilience: Roles of Process Innovation and Environmental Uncertainty. Frontiers in Environmental Science 2022, 10, 966474. [Google Scholar] [CrossRef]
- Siekmann, F.; Schlör, H.; Venghaus, S. Linking Sustainability and the Fourth Industrial Revolution: A Monitoring Framework Accounting for Technological Development. Energy, Sustainability and Society 2023, 13 (1), 26. [CrossRef]
- Do Vale, G.; Collin-Lachaud, I.; Lecocq, X. Resolving Paradoxical Tensions during Business Model Innovation for Sustainability in Retailing: The Role of the Ecosystem. Journal of Retailing 2025, In Press. [CrossRef]
- van Bommel, K. Managing Tensions in Sustainable Business Models: Exploring Instrumental and Integrative Strategies. Journal of Cleaner Production 2018, 196, 829–841. [Google Scholar] [CrossRef]
- Pieroni, M. P.; McAloone, T.; Pigosso, D. A. C. Business Model Innovation for Circular Economy and Sustainability: A Review of Approaches. Journal of Cleaner Production 2019, 215, 198–216. [Google Scholar] [CrossRef]
- Parida, V.; Frishammar, J. Circular Business Models: Where Does Swedish Industry Stand? Swedish Entrepreneurship Forum: Örebro, Sweden, 2024.
- Jagnow, J.; Stoehr, B.; Bernijazov, R.; Koldewey, C.; Dumitrescu, R. Circular Product Design: A Literature-Based Identification of Challenges from the Perspective of Product Designers. In Proceedings of the Design Society (ICED25); 2025. [Google Scholar]
- Aguiar, M. F.; Mesa, J. A.; Jugend, D.; Pinheiro, M. A. P.; Fiorini, P. Circular Product Design: Strategies, Challenges and Relationships with New Product Development. Management of Environmental Quality: An International Journal 2022, 33 (2), 300–329. [CrossRef]
- Jugend, D.; Santos, H. H.; Garrido, S.; Mesa, J. A. Circular Product Design Challenges: An Exploratory Study on Critical Barriers. Business Strategy and the Environment 2024, 33(5), 4825–4842. [Google Scholar] [CrossRef]
- Trzcielinska, J.; Kaps, R. Impact of Business Environment Perception on Pro-Ecological Activities in Polish Firms. European Research Studies Journal 2024, 27 (S2), 510–530. [Google Scholar] [CrossRef]
- Todescato, M.; Braholli, O.; Chaltsev, D.; Di Blasio, I.; Don, D.; Egger, G.; … Matt, D. Sustainable Manufacturing through Application of Reconfigurable and Intelligent Systems in Production Processes: A System Perspective. Scientific Reports 2023, 13, 22374. [Google Scholar] [CrossRef] [PubMed]
- Wang, C.; Liu, X.; Li, Y. Exploring Dynamic Capability Drivers of Green Innovation at Different Digital Transformation Stages: Evidence from Listed Companies in China. Sustainability 2024, 16(13), 5666. [Google Scholar] [CrossRef]
- Zhang, F.; Yang, B.; Zhu, L. Digital Technology Usage, Strategic Flexibility, and Business Model Innovation. Technological Forecasting & Social Change 2023, (article). [CrossRef]
- Rajesh, R. Flexible Business Strategies to Enhance Resilience in Supply Chains. Journal of Manufacturing Systems 2021, 60, 903–919. [Google Scholar] [CrossRef]
- Khettabi, I.; Benyoucef, L.; Boutiche, M. A. Sustainable Reconfigurable Manufacturing System Design Using Adapted Multi-Objective Evolutionary-Based Approaches. International Journal of Advanced Manufacturing Technology 2021, 115, 3741–3759. [Google Scholar] [CrossRef]
- Milisavljevic-Syed, J.; Li, J.; Xia, H. Realisation of Responsive and Sustainable Reconfigurable Manufacturing Systems. International Journal of Production Research 2024, 62(8), 2725–2746. [Google Scholar] [CrossRef]
- Andersen, R.; Napoleone, A.; Andersen, A. L.; Brunoe, T. D.; Nielsen, K. A Systematic Methodology for Changeable and Reconfigurable Manufacturing Systems. Journal of Manufacturing Systems 2024, 74, 449–462. [Google Scholar] [CrossRef]
- Batwara, A.; Sharma, V.; Makkar, M.; Giallanza, A. An Empirical Investigation of Green Product Design and Development Strategies for Eco Industries Using Kano Model and Fuzzy AHP. Sustainability 2022, 14(14), 8735. [Google Scholar] [CrossRef]
- Sahoo, S.; Kumar, A.; Mangla, S. K.; Tiwari, A. Industry 4. 0 Adoption and Eco-Product Innovation Capability: Understanding the Role of Supply Chain Integration. Business Strategy and the Environment 2024, 33, 8798–8814. [Google Scholar] [CrossRef]
- Xu, G.; Zhang, J.; Wang, S. How Digitalization and Sustainability Promote Digital Green Innovation for Industry 5.0 through Capability Reconfiguration: Strategically Oriented Insights. Systems 2024, 12 (9), 341. [CrossRef]
- Wang, X.; Shi, X. Impact of Digital Transformation on Green Production: Evidence from China. Heliyon 2024, 10(15), e35526. [Google Scholar] [CrossRef]
- Han, M. S.; Ma, S.; Wang, Y.; Tian, Q. Impact of Technology-Enabled Product Eco-Innovation: Empirical Evidence from the Chinese Manufacturing Industry. Technovation 2023, 128, 102853. [Google Scholar] [CrossRef]
- Mosca, O.; Manunza, A.; Manca, S.; Vivanet, G.; Fornara, F. Digital Technologies for Behavioral Change in Sustainability Domains: A Systematic Mapping Review. Frontiers in Psychology 2024, 14, 1–30. [Google Scholar] [CrossRef] [PubMed]
- Sánchez-García, E.; Martínez-Falco, J.; Marco-Lajara, B.; Manresa-Marhuenda, E. Revolutionizing the Circular Economy through New Technologies: A New Era of Sustainable Progress. Environmental Technology & Innovation 2024, 33, 103509. [Google Scholar] [CrossRef]
- Trzcielinski, S.; Kruszynski, M.; Trzcielinska, J. Shaping the Enterprise’s Strategy; Publishing House of Poznan University of Technology: Poznań, Poland, 2023. [Google Scholar]
- Vacchi, M.; Siligardi, C.; Cedillo-González, E. I.; Ferrari, A. M.; Settembre-Blundo, D. Industry 4. 0 and Smart Data as Enablers of the Circular Economy in Manufacturing: Product Re-Engineering with Circular Eco-Design. Sustainability 2021, 13, 10366. [Google Scholar] [CrossRef]
- Akkad, M. Z.; Šebo, J.; Bányai, T. Investigation of the Industry 4. 0 Technologies Adoption Effect on Circular Economy. Sustainability 2022, 14(19), 12815. [Google Scholar] [CrossRef]
- Sony, M.; Antony, J.; McDermott, O. How Do the Technological Capability and Strategic Flexibility of an Organization Impact Its Successful Implementation of Industry 4.0? A Qualitative Viewpoint. Benchmarking: An International Journal 2022.
- Schulze, A.; Townsend, J. D.; Talay, M. B. Completing the Market Orientation Matrix: The Impact of Responsive and Proactive Competitor Orientation on Innovation and Firm Performance. Industrial Marketing Management 2022, 103, 198–214. [Google Scholar] [CrossRef]
- ERM International Group. 2023 Sustainability Trends Report; ERM: London, UK, 2023. [Google Scholar]
- Song, Y.; Ali, A.; Wang, G.; Wang, W. Environmental Scanning, Cross-Functional Coordination, and the Adoption of Green Strategies: An Information Processing Perspective. Creativity and Innovation Management 2024, 33(1), 39–60. [Google Scholar] [CrossRef]
- Lindgreen, E. R.; Opferkuch, K.; Walker, A. M.; Salomone, R.; Reyes, T.; Raggi, A.; Simboli, A.; Vermeulen, W.; Caeiro, S. Exploring Assessment Practices of Companies Actively Engaged with Circular Economy. Business Strategy and the Environment 2022, 31(4), 1414–1438. [Google Scholar] [CrossRef]
- Del Vecchio, P.; Mele, G.; Ndou, V.; Secundo, G. Open Innovation and Social Big Data for Sustainability: Evidence from the Tourism Industry. Sustainability 2018, 10(9), 3215. [Google Scholar] [CrossRef]
- Hahn, T.; Pinkse, J. A Paradox Approach to Sustainable Product–Service Systems. Industrial Marketing Management 2022, 105, 182–189. [Google Scholar] [CrossRef]
- Alosi, A.; Annunziata, E.; Rizzi, F.; Frey, M. Conceptualising Active Management of Paradoxical Tensions in Corporate Sustainability: A Systematic Literature Review. Business Strategy and the Environment 2023, 32(6), 3529–3549. [Google Scholar] [CrossRef]
- Luo, B. N.; Tang, Y.; Chen, E. W.; Li, S.; Luo, D. Corporate Sustainability Paradox Management: A Systematic Review and Future Agenda. Frontiers in Psychology 2020, 11, 579272. [Google Scholar] [CrossRef] [PubMed]
- Kotler, P.; Keller, K. L. Marketing Management, 15th ed.; Pearson Education: Harlow, UK, 2016. [Google Scholar]
Figure 1.
The research model.
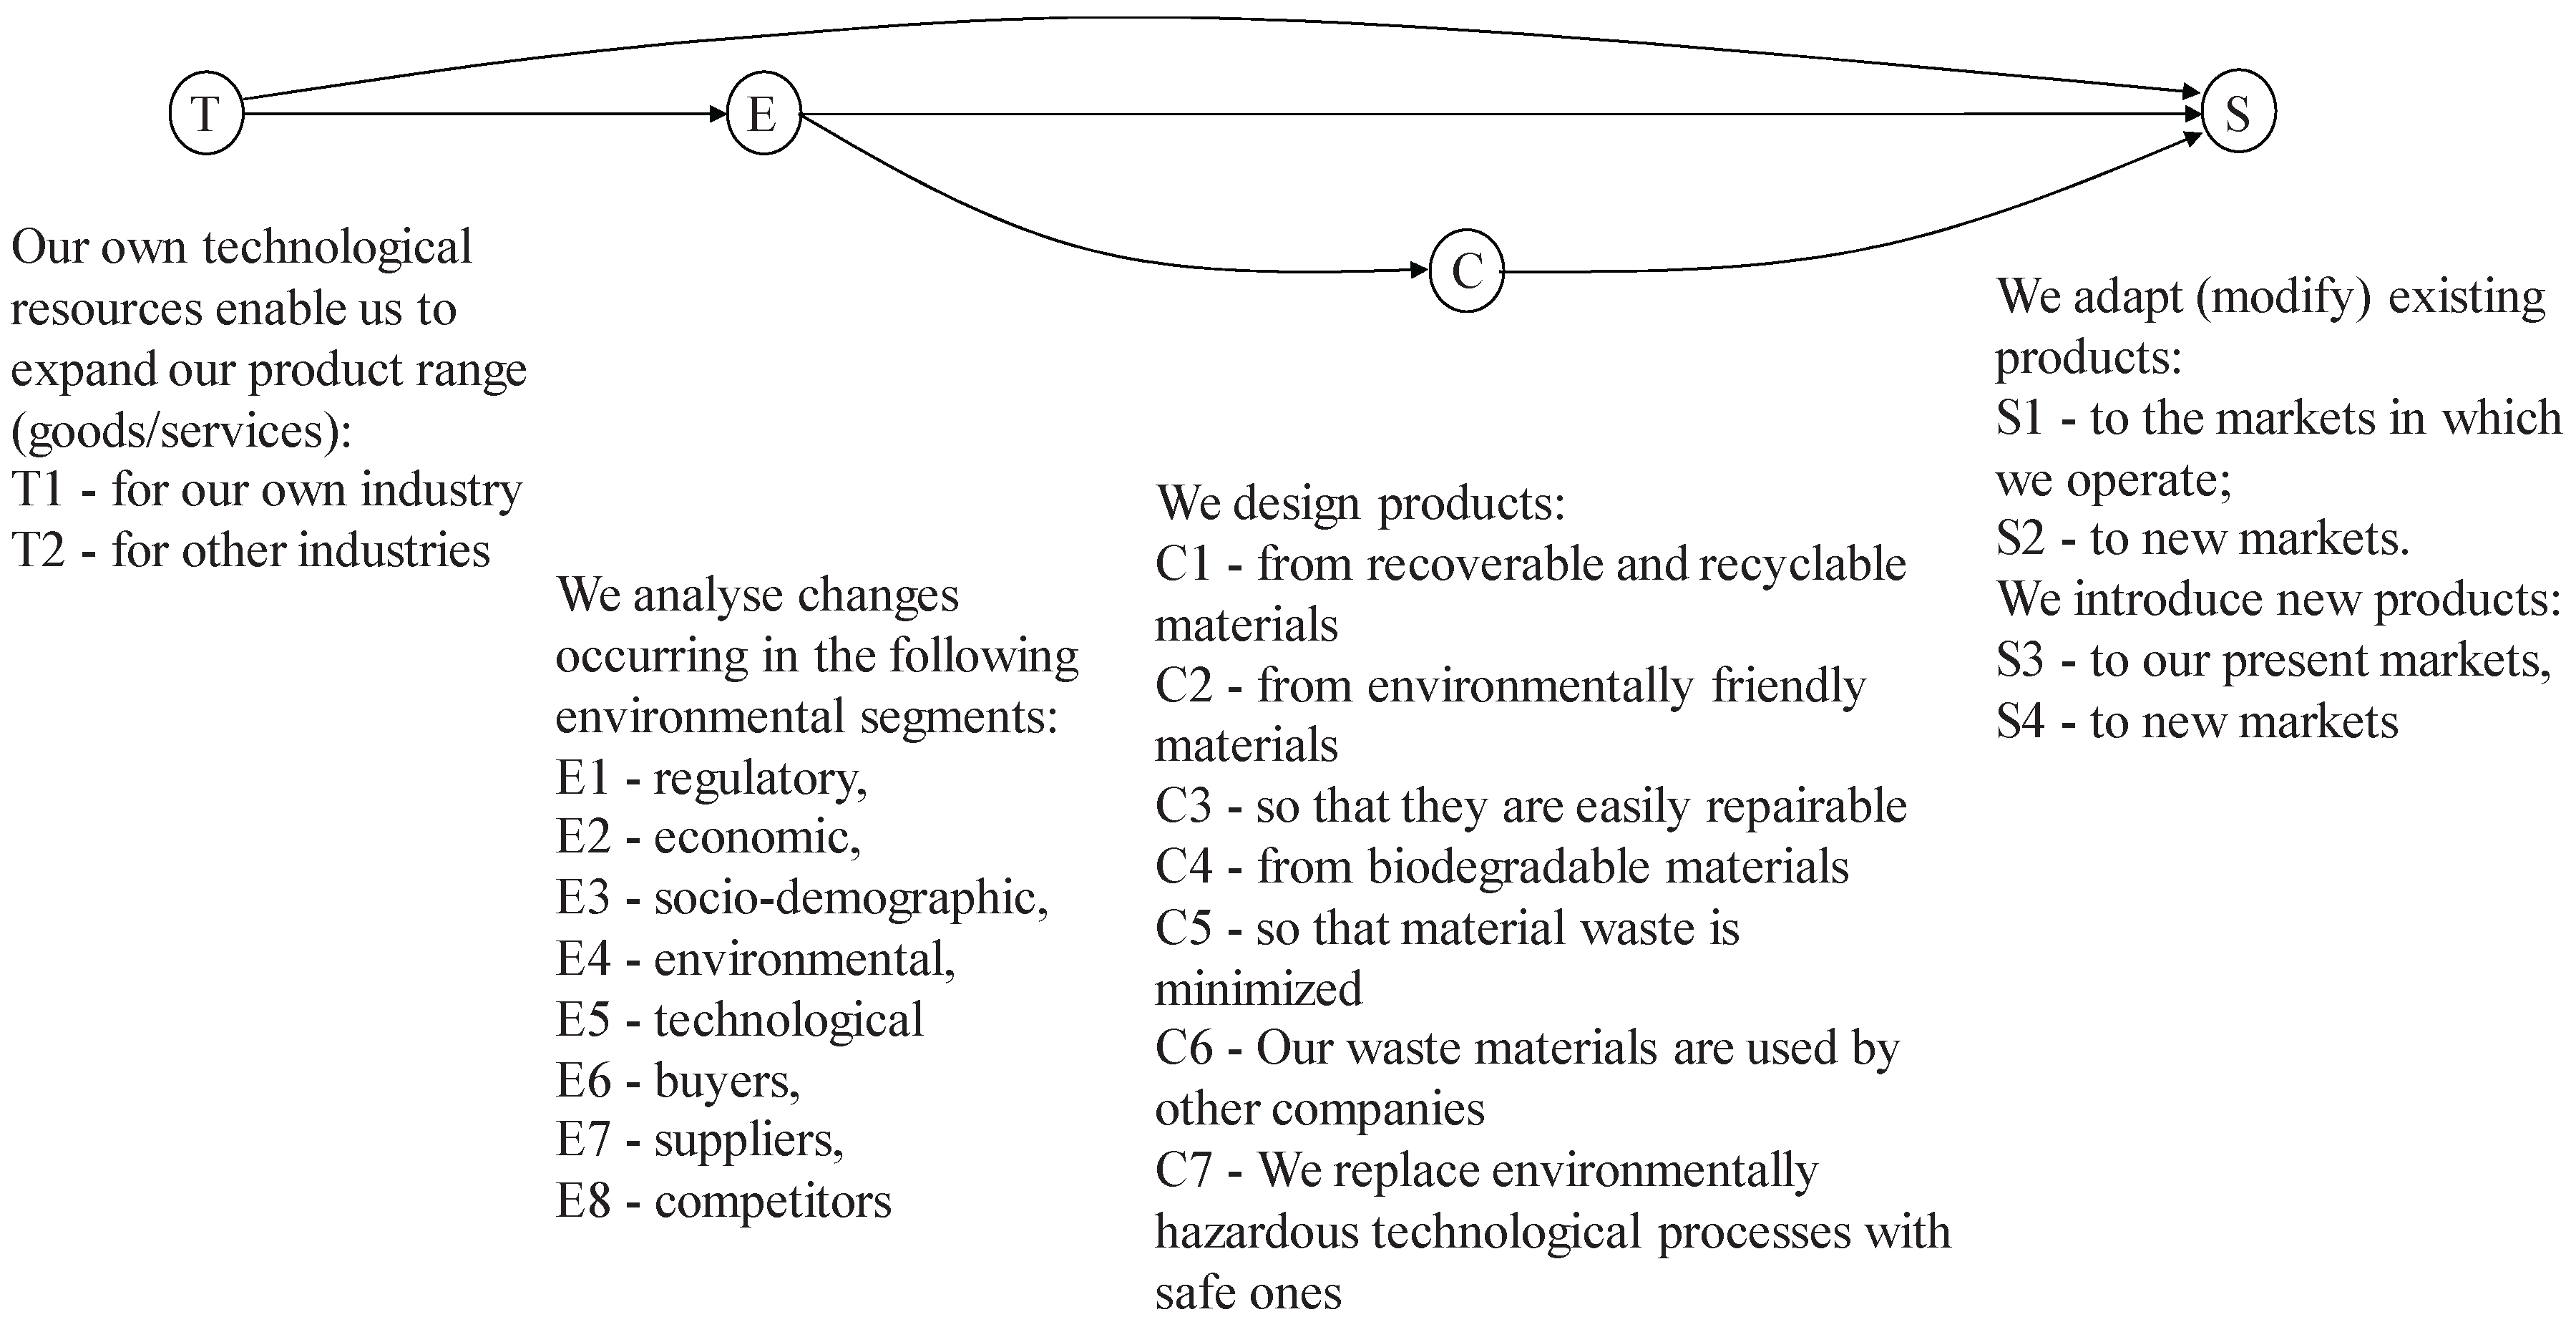
Figure 2.
Chain of cause-and-effect relationships: technological flexibility – product-market strategies.
Figure 2.
Chain of cause-and-effect relationships: technological flexibility – product-market strategies.
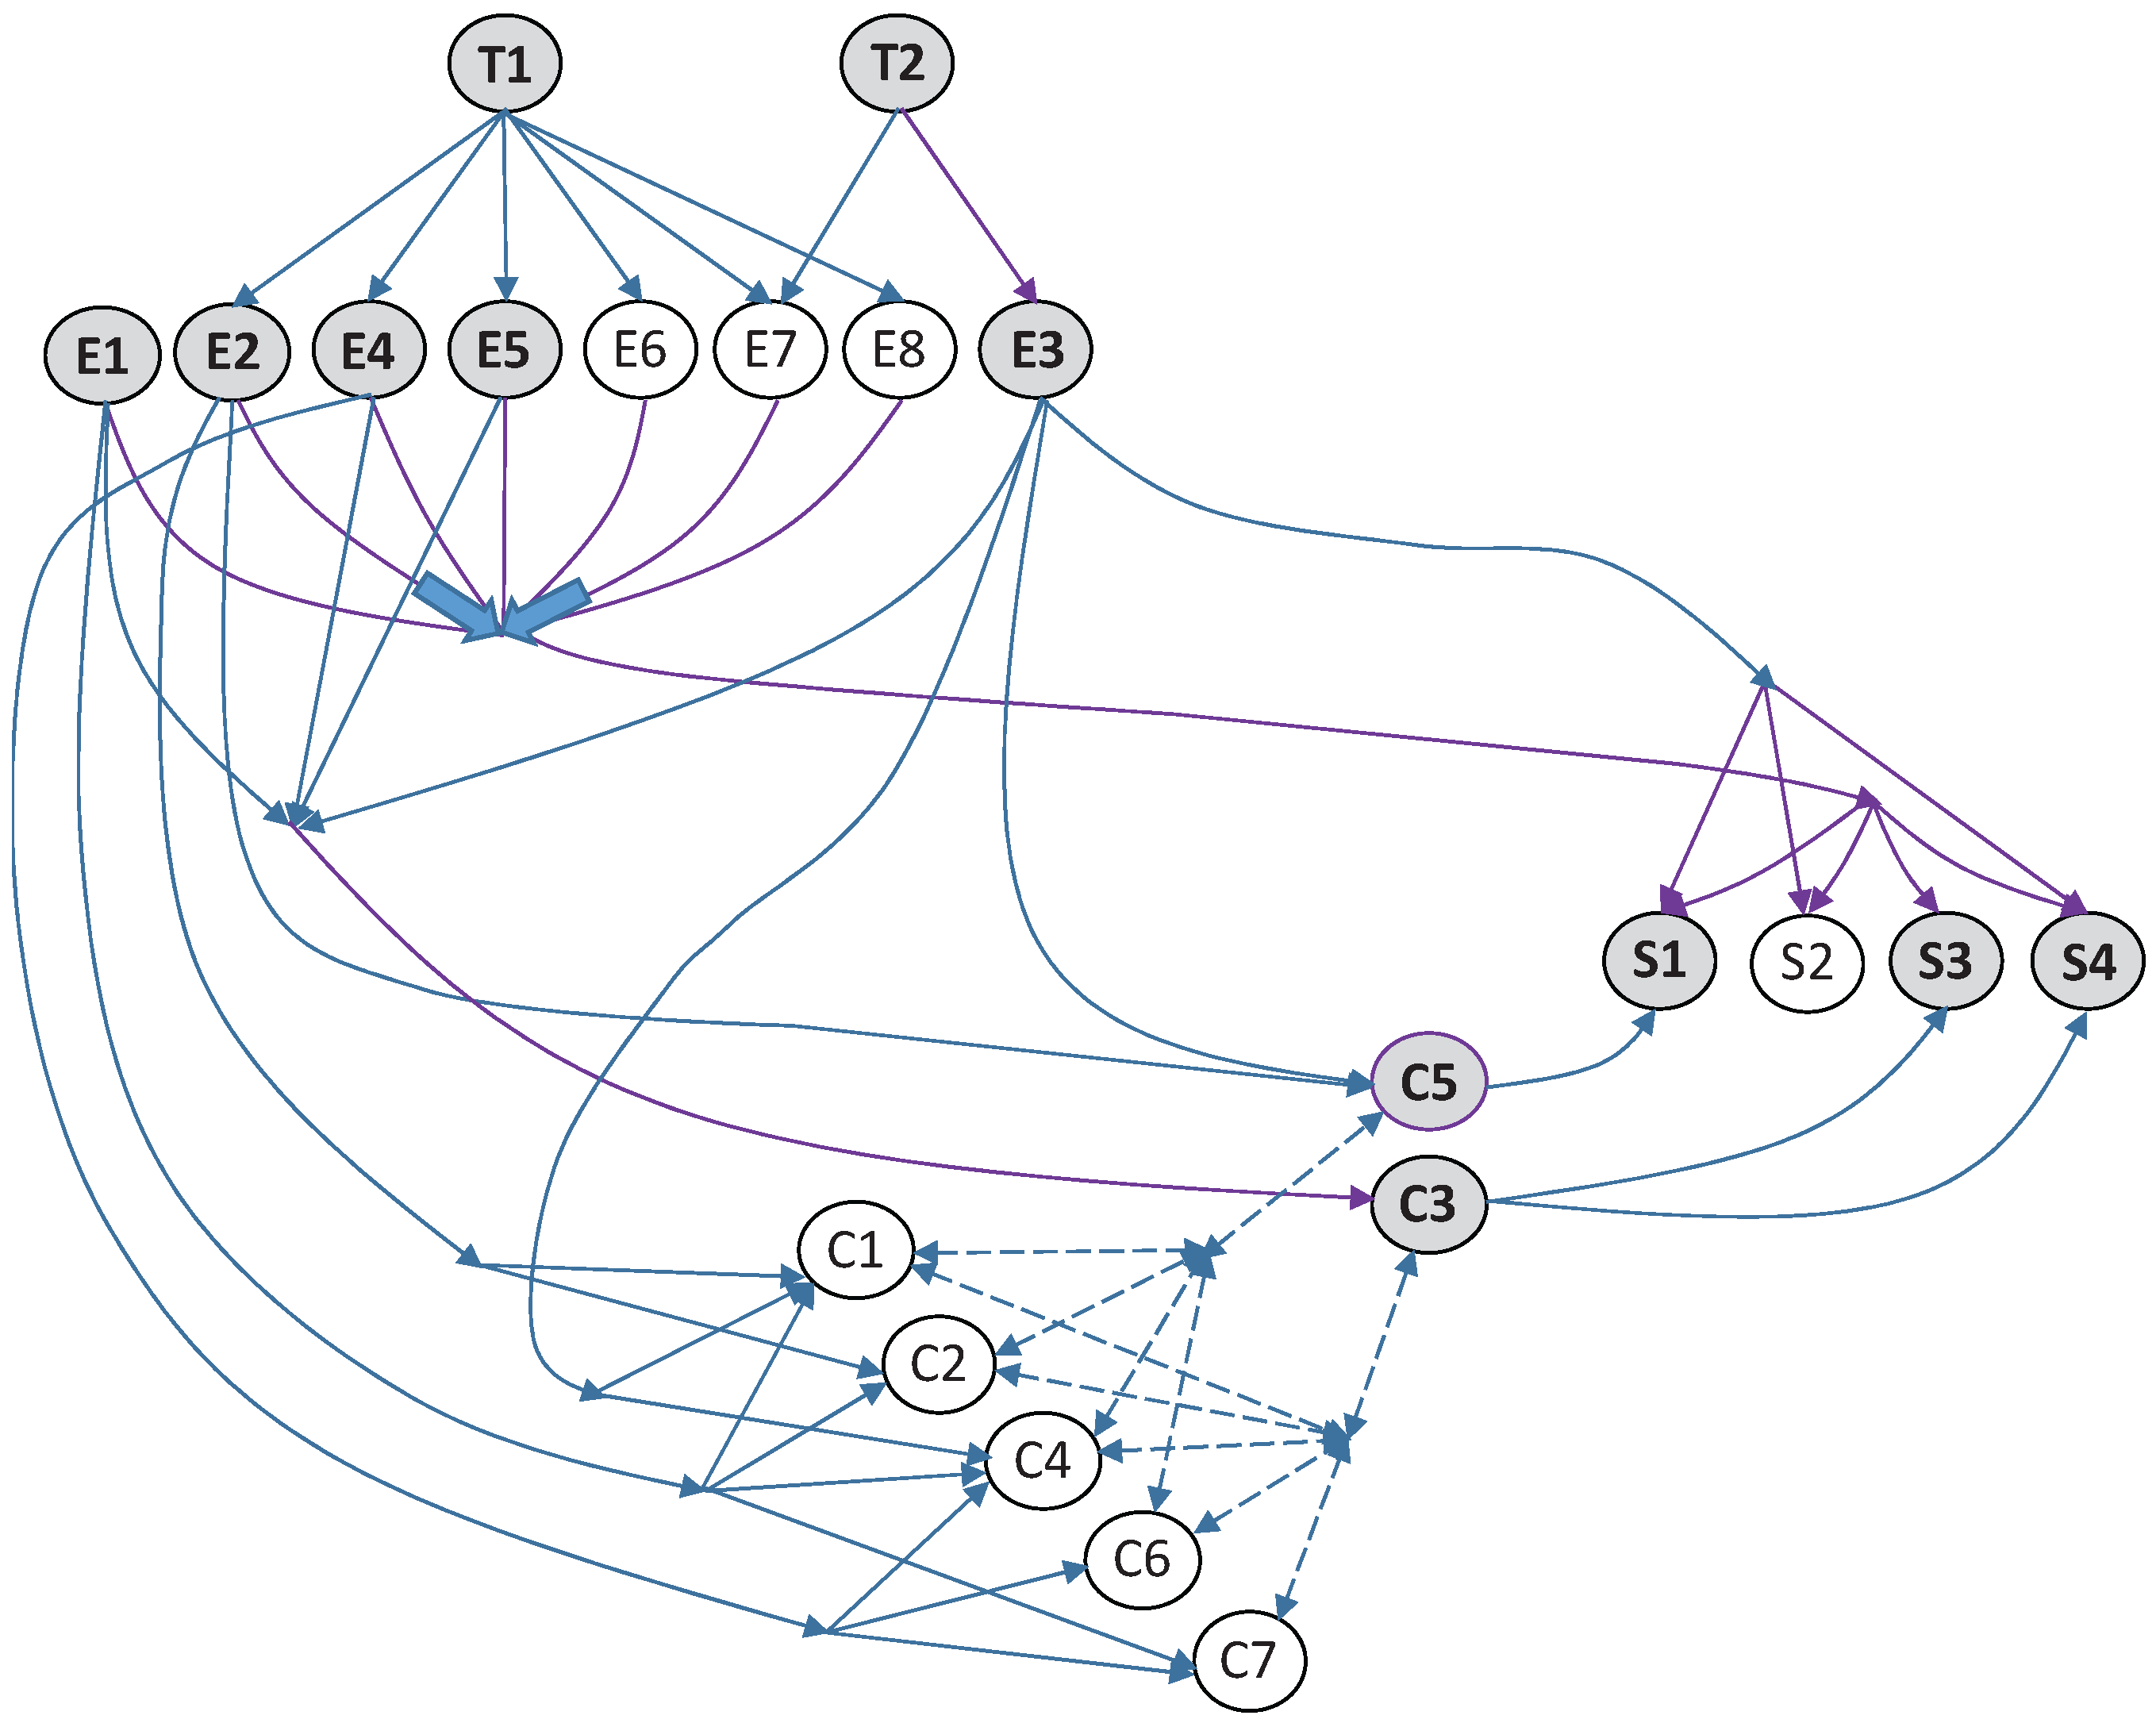

Table 1.
Correlation between technological flexibility and product-market strategies.
| Variable | S1 | S2 | S3 | S4 |
|---|---|---|---|---|
| T1 | 0,31 | 0,34 | 0,31 | 0,30 |
| T2 | 0,17 | 0,27 | 0,17 | 0,18 |
Table 2.
Correlation between technological flexibility and environmental scanning.
| Variable | S1 | S2 | S3 | S4 | E5 | E6 | E7 | E8 |
|---|---|---|---|---|---|---|---|---|
| T1 | 0,31 | 0,34 | 0,31 | 0,30 | 0,29 | 0,30 | 0,35 | 0,29 |
| T2 | 0,17 | 0,27 | 0,17 | 0,18 | 0,18 | 0,09 | 0,22 | 0,15 |
Table 3.
Relationship: technological flexibility – environmental scanning.
| Grouping variable | Dependent variable | Significantly different groups | Median trend by groups | Rank giving the largest median | Largest median |
|---|---|---|---|---|---|
| T1 | E2 | 1-4; 1-5 | Single-step increase | 4; 5 | 4,0 |
| E4 | 1-3;1-4;1-5; 2-4; 2-5 | Saturation curve | 4; 5 | 4,0 | |
| E5 | 1-4; 1-5; 2-4; 2-5 | Single-step increase | 3; 4; 5 | 4,0 | |
| E6 | 1-3; 1-4; 1-5; 2-5; 3-5 | Stepwise increase | 5 | 5,0 | |
| E7 | 1-3; 1-4; 1-5; 2-4; 2-5; 3-5 | Saturation curve | 3; 4; 5 | 4,0 | |
| E8 | 1-4; 1-5; 2-4; 2-5 | Stepwise increase | 4; 5 | 4,0 | |
| T2 | E3 | 1-4; 1-5; 3-4 | Stepwise increase | 5 | 4,0 |
| E7 | 2-5;3-5 | Single-step increase | 3; 4; 5 | 4,0 |
Table 4.
Relationship: environmental scanning – implementing CE principles.
| Grouping variable | Dependent variable | Significantly different groups | Median trend by groups | Rank giving the largest median | Largest median |
|---|---|---|---|---|---|
| E1 | C1 | 2-5 | Single-step increase | 4; 5 | 4,0 |
| C2 | 2-5 | Single-step increase | 4; 5 | 4,0 | |
| C3 | 2-5; 3-5 | Single-step increase | 4; 5 | 4,0 | |
| C4 | 3-5 | Single-step increase | 5 | 4,0 | |
| C7 | 2-5 | Single-step increase | 5 | 3,0 | |
| E2 | C1 | 3-4 | Single-step increase | 4; 5 | 4,0 |
| C2 | 3-4; 3-5 | Single-step increase | 4; 5 | 4,0 | |
| C5 | 2-5; 3-5 | Single-step increase | 4; 5 | 4,0 | |
| E3 | C1 | 1-5; 2-5; 3-5 | Stepwise | 5 | 5,0 |
| C3 | 1-5; 2-5; 3-5 | Flat-then-rising | 5 | 5,0 | |
| C4 | 1-4; 1-5; 2-5; 3-4; 3-5 | Stepwise | 5 | 5,0 | |
| C5 | 2-5; 3-5 | Single-step increase | 4; 5 | 4,0 | |
| C7 | 1-4; 1-5 | Stepwise | 5 | 4,0 | |
| E4 | C2 | 1-4; 1-5; 3-5 | Single-step increase | 4; 5 | 4,0 |
| C3 | 3-5 | Single-step increase | 4; 5 | 4,0 | |
| C4 | 1-5; 2-5; 3-5; 4-5 | Stepwise increase | 5 | 4,0 | |
| C6 | 1-5; 3-5; 4-5 | Single-step increase | 5 | 4,0 | |
| C7 | 1-5 | Stepwise increase | 4; 5 | 3,0 | |
| E5 | C3 | 2-5; 3-5 | Single-step increase | 4; 5 | 4,0 |
Table 5.
Relationship: environmental scanning – product-market strategies.
| Grouping variable | Dependent variable | Significantly different groups | Median trend by groups | Rank giving the largest median | Largest median |
|---|---|---|---|---|---|
| E1 | S1 | 1-3; 1-4; 1-5; 2-4; 2-5; 3-4; 3-5 | Single-step increase | 4; 5 | 4,0 |
| S2 | 1-4; 1-5; 2-4; 2-5; 3-4; 3-5 | Single-step increase | 4; 5 | 4,0 | |
| S3 | 1-4; 1-5; 2-4; 2-5 | Single-step increase | 4; 5 | 4,0 | |
| S4 | 1-3; 1-4; 1-5; 2-4; 2-5; 3-5 | Stepwise increase | 4; 5 | 4,0 | |
| E2 | S1 | 1-4; 1-5; 2-4; 2-5; 3-4; 3-5 | Single-step increase | 4; 5 | 4,0 |
| S2 | 1-4; 1-5; 2-4; 2-5; 3-5 | Single-step increase | 4; 5 | 4,0 | |
| S3 | 2-4; 2-5; 3-4; 3-5 | Single-step increase | 4; 5 | 4,0 | |
| S4 | 1-4; 1-5; 2-4; 2-5; 3-4; 3-5 | Stepwise increase | 4; 5 | 4,0 | |
| E3 | S1 | 1-4 | Single-step increase | 3; 4; 5 | 4,0 |
| S2 | 1-3; 1-4; 1-5; 2-4; 2-5 | Single-step increase | 3; 4;5 | 4,0 | |
| S4 | 1-4; 1-5; 2-4; 2-5; 3-4 | Single-step increase | 4; 5 | 4,0 | |
| E4 | S1 | 1-3; 1-4; 1-5; 2-5; 3-5 | Single-step increase | 4; 5 | 4,0 |
| S2 | 1-2; 1-3; 1-4; 1-5; 3-5 | Single-step increase | 4; 5 | 4,0 | |
| S3 | 1-4; 1-5; 2-5; 3-5 | Single-step increase | 4; 5 | 4,0 | |
| S4 | 1-4; 1-5; 3-5 | Stepwise increase | 5 | 4,0 | |
| E5 | S1 | 1-5; 2-4; 2-5; 3-4; 3-5; 4-5 | Single-step increase | 4; 5 | 4,0 |
| S2 | 1-4; 1-5; 2-4; 2-5;3-4; 3-5 | Single-step increase | 4;5 | 4,0 | |
| S3 | 1-4; 1-5; 2-4; 2-5; 3-5; 4-5 | Single-step increase | 4; 5 | 4,0 | |
| S4 | 1-4; 1-5; 2-4; 2-5; 3-5 | Stepwise increase | 5 | 4,0 | |
| E6 | S1 | 1-4; 1-5; 2-4; 2-5; 3-4; 3-5; 4-5 | Stepwise increase | 4; 5 | 4,0 |
| S2 | 1-4; 1-5; 2-4; 2-5; 3-4; 3-5; 4-5 | Stepwise increase | 4; 5 | 4,0 | |
| S3 | 1-3; 1-4; 1-5; 3-5 | Stepwise increase | 4; 5 | 4,0 | |
| S4 | 1-4; 1-5; 2-5; 3-5 | Stepwise increase | 5 | 4,0 | |
| E7 | S1 | 1-4; 1-5; 2-4; 2-5; 3-4; 3-5 | Single-step increase | 4; 5 | 4,0 |
| S2 | 1-4; 1-5; 2-4; 2-5; 3-4; 3-5 | Stepwise increase | 4; 5 | 4,0 | |
| S3 | 1-4; 1-5; 2-5; 3-4; 3-5; 4-5 | Single-step increase | 4; 5 | 4,0 | |
| S4 | 1-4; 1-5; 2-4; 2-5; 3-4; 3-5 | Stepwise increase | 4; 5 | 4,0 | |
| E8 | S1 | 1-4; 1-5; 2-4; 2-5; 3-5 | Single-step increase | 4; 5 | 4,0 |
| S2 | 1-3; 1-4;1-5; 2-5; 3-5 | Stepwise increase | 4; 5 | 4,0 | |
| S3 | 1-4; 1-5; 2-4; 2-5; 3-5 | Stepwise increase | 4; 5 | 4,0 | |
| S4 | 1-4; 1-5; 2-5; 3-4; 3-5 | Stepwise increase | 4; 5 | 4,0 |
Table 6.
Relationship: CE principles – product-market strategies.
| Grouping variable | Dependent variable | Significantly different groups | Median trend by groups | Rank giving the largest median | Largest median |
|---|---|---|---|---|---|
| C3 | S3 | 3-5 | Single-step increase | 4; 5 | 4,0 |
| S4 | 3-4; 3-5 | Single-step increase | 4; 5 | 4,0 | |
| C5 | S1 | 3-4 | Single-step increase | 4; 5 | 4,0 |
Disclaimer/Publisher’s Note: The statements, opinions and data contained in all publications are solely those of the individual author(s) and contributor(s) and not of MDPI and/or the editor(s). MDPI and/or the editor(s) disclaim responsibility for any injury to people or property resulting from any ideas, methods, instructions or products referred to in the content. |
© 2025 by the authors. Licensee MDPI, Basel, Switzerland. This article is an open access article distributed under the terms and conditions of the Creative Commons Attribution (CC BY) license (http://creativecommons.org/licenses/by/4.0/).
Copyright: This open access article is published under a Creative Commons CC BY 4.0 license, which permit the free download, distribution, and reuse, provided that the author and preprint are cited in any reuse.


