Submitted:
21 November 2025
Posted:
24 November 2025
You are already at the latest version
Abstract
Sluice box washing continues to face operational limitations arising from inconsistent water velocity and the need to tailor slope designs to varying particle sizes. These interrelated factors significantly diminish recovery efficiency, thereby underscoring the necessity of this study.
The samples were collected each sample were homogenized into uniformly. Varied sieve size and sluice box angles were utilized. Fractional sieve analysis of a 100g sample was carried out from each site using sieves. Based on this analysis the resulted particle size distribution from the site Wolansa (30, 50, 20), Qori (25, 60, 25) and Bore (35, 47, 18) in percent is coarse, medium and fine respectively. For optimum angle 100kg of alluvial material washed at constant water pressure and mesh size. This was done for 3 different angles of inclinations (5o, 10o, and 15o).
From the result, the optimum angle for artisanal gold recovery for 3 sites were 10 o since it yielded the highest amount of recovery from site Wolansa 0.43, Qori 0.46 While Bore is 0.45. Therefore, this study advice to change the sluice boxes angle from 5o to 10o for Wolansa and 15o to 10o for Bore site to increase the recovery by 85%. and 51% respectively.
Keywords:
recovery
; grain size
; optimum angle
; sluice box
; artisanal mining
1. Introduction
Ethiopia has a huge potential of various minerals including , tantalum, gem stone (Mencho, 2022; Nyssen & Kiros, 2022). Such resources are found in SNNP, Benishangul-Gumuz (BGR), Oromia, Tigray, and Amhara. But not yet well explored and exploited, and hence its contribution to the overall economy or GDP is low. This artisanal mining directly employs around 1.5 million people as a source of livelihood and supports a further 7.5 million people in all regions, with the highest in Tigary, Gambella, Oromia, Benishangul Gumuz, Amahar, and South Ethiopian Peoples (Getaneh & Shikur, 2022; Meseret et al., 2022).
Placer mining, which involves the extraction of valuable minerals particularly from alluvial deposits relies heavily on the efficiency of equipment such as sluice boxes to separate particles from concentrate. The angle of inclination, commonly known as the pitch or grade of the sluice box, plays a critical role in the separation process (Alabi & Gbadamosi, 2021). It affects the flow dynamics of water and sediment within the sluice box, influencing the retention and recovery of particles (Styles et al., 2002). However, the optimal angle of inclination for maximum recovery remains uncertain and subject to variation based on factors such as particle size distribution, water flow rate, and sediment characteristics. The lack of a standardized approach to determine the ideal angle of inclination poses significant challenges for placer miners.
However, in Arero woreda there are a lot of mineral resources that are not still extracted properly by ASMs, since almost all ASMs are mine by traditional mining equipment and processing. Although several studies have examined the deposit, none has focused on improving recovery efficiency through size identification and optimum angle of sluice boxes. Therefore, there is a critical need to conduct a comprehensive assessment to identify the particle size and optimal angle of inclination for sluice boxes in placer mining operations in Arero, southern Ethiopia. According to different assessment, artisanal miners have utilized weather it excessively steep or shallow angles that lead to incomplete separation and loss of valuable particles. Such phenomenon occurs due to the lack of best mining practice and processing technology, limited financial access to acquire technology, limited training to increase productivity, weak systems to reduce environmental impact, and limited access to marketing.
Background of the Study Area
In Arero woreda, there are 14 artisanal small-scale associations that mine, copper, gemstones, and other types of industrial minerals and rocks like quartz and sand. From those associations, six ASM associations are mining. Most of the associations mine primary deposits, with some of the placer deposits. And the rest of the ASM associations are mining gemstones, copper malachite, sand, and quartz. But most of the ASM associations are currently focused on primary and placer mining activities due to the relative linkage of market chains.
1.2. Location and Accessibility of the Study Area
Arero is one of the woreda in Oromia region of Ethiopia, part of the Borena Zone (as illustrated in Figure 1) with a geographic coordinate location of Latitude: 4° 00' 00"- 5° 00' 00" N and Longitude: 39° 00' 0.00" E. It is bordered on the southwest by Dire, on the west by Yabelo, on the north by Bule Hora, on the northeast by the Guji Zone, on the east by the Somali Region, and on the south by Moyale. The Dawa River is the only river in this woreda, separates Arero from Odo Shakisso and Liben.
1.3. Geology of the Study Area
In Ethiopia, the Precambrian basement was divided into three categories according to (Kazmin et al., 1978) lower complex (Archean age), middle complex (lower Proterozoic), and upper complex (upper Proterozoic and younger). The upper complex also classified as Adola, Mormora, and Kajimitti group. Wadera group is included in the middle complex. The Arero group, Konso gneiss, and Burjii gneiss are found in the gneissic terrain of the lower complex. The Arero group is further subdivided into the Alghe, Awata, and Yavello gneisses. The Southern greenstone belt includes the separate Adola Kenticha, Agere Mariam, Arero and Moyale areas, which are associated with mineralization. Arero greenstone region: This region hosts pyrite-bearing in meta-basic and meta ultra basic rocks as well as -bearing quartz veins in intermediate to acid alkaline intrusive rocks.
2. Materials and Methods
In this study two practical experiment were conducted in the field: Those experiments are grain size determination and the angle of sluice box optimization. In order to evaluated such experiment different sieve size and different angles were assigned. Because these parameters are inseparable to each other while to increase the recovery of during processing. According to the assessment of the six- site, the size of gold in the study area was not uniform. Using this inspection and observation as well as sieve analysis techniques size ranges from fine to coarser size as well as the sluice box angle in these six- site is different one to the other (5o, 8o,10o, 13o, 15o, 21.
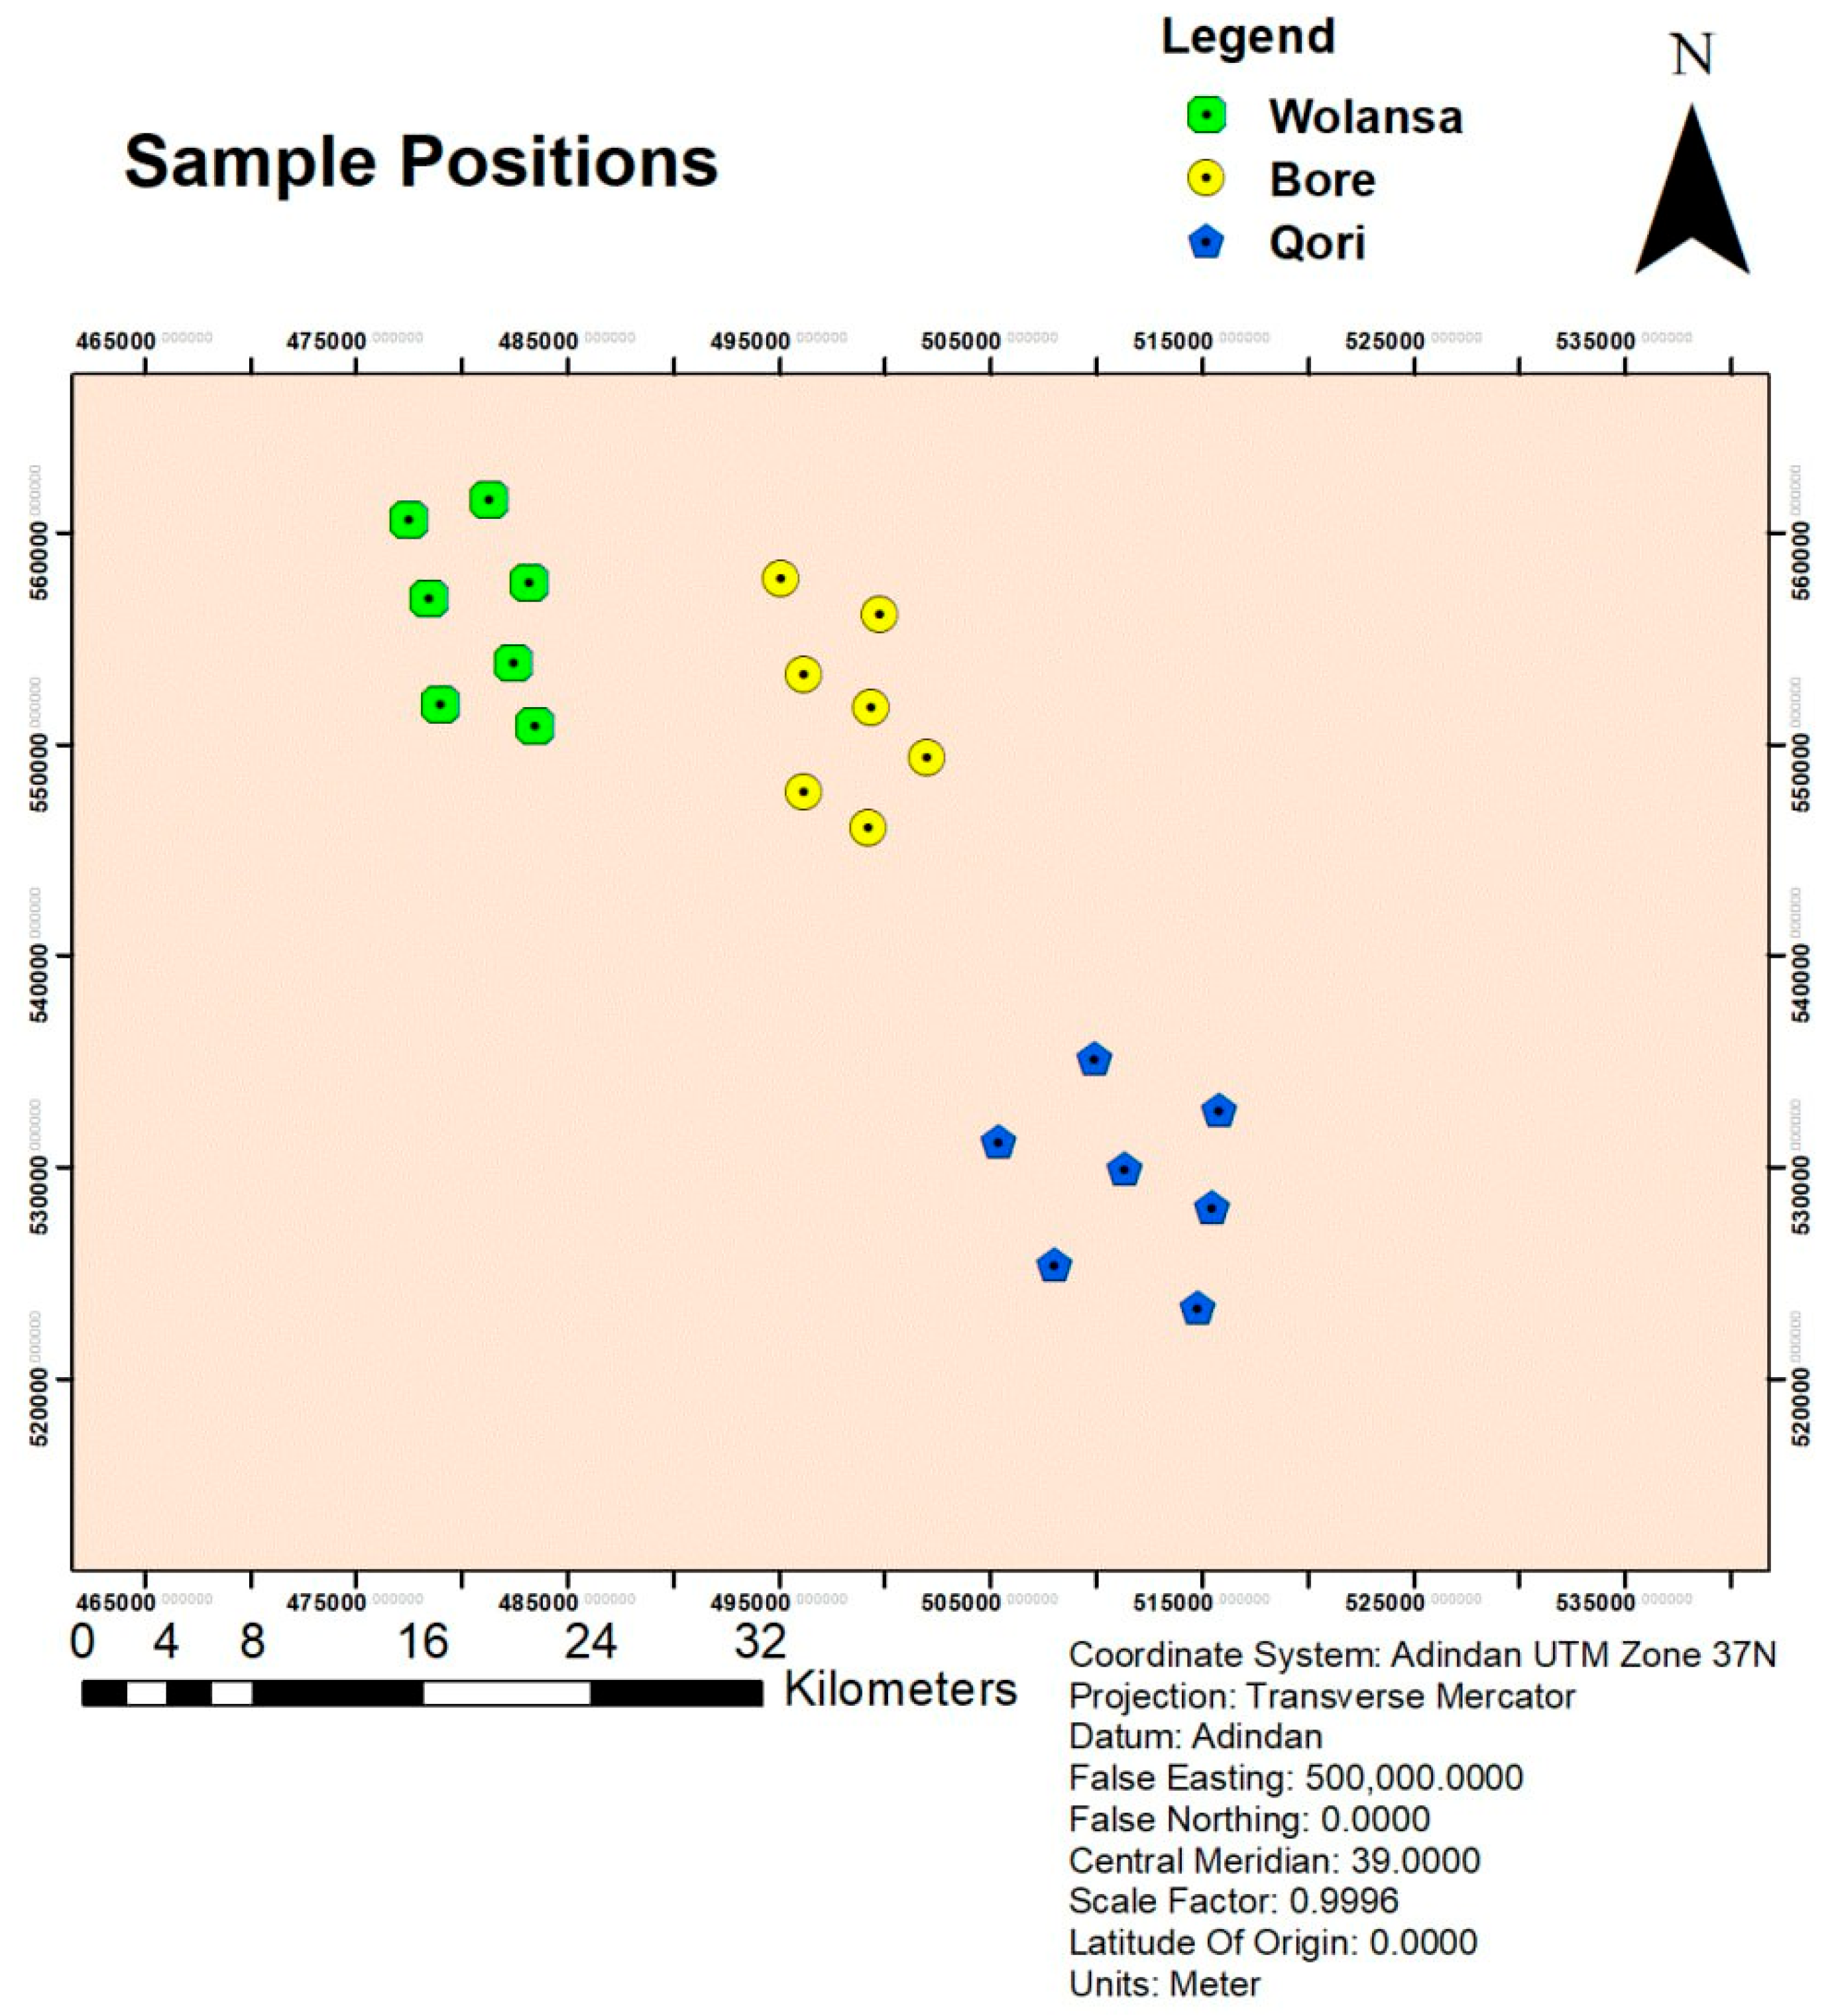
Figure 2.
Map of sampling area in Arero woreda.
2.1. Grain Size Analysis
The most accurate way to determine the content of these gold-rich concentrates would be to carry out assay analysis but reasonable estimates can be made by using a small set of sieves to separate the gold into specific size ranges and then counting the grains in each sieve. The grain size analysis test was performed on each selected three site to determined its percentage of grain size in Table 2 and the sample was analyzed accordance with ASTM D 422 (1997). The best practice involves using a stack of sieves with decreasing mesh sizes to separate grains into specific size fractions. Fractional sieve analysis of a 100 g sample of the was carried out in each site using sieves for the size range of (1 mm, 500 μm, 250 μm, 125 μm, 100 μm and 75 μm).
The sample was charged into the upper sieve and the sieve sets were agitated for 30 minutes. Consequently, the undersize particles fall through successive sieves until they are retained on a sieve having apertures slightly smaller than the diameter of the particles (Mitchell et al., 1997). The set of sieves were separated and the weight retained on each was recorded. Totally 100g of sample was prepared for sieve analysis from each site (Wolansa, Qori and Bore) in ordered to classify the grain size distribution which processed the sluice box. As it stated by (Styles et al., 2002) the range of grain size Coarse >1 mm, medium 1 to 0.1 mm, and fine <-0.1mm was cited.
2.2. Sluice Box Angle Optimization
The majority of sluice boxes have a slope of between 10 and 15 degrees (Styles et al., 2002) while others 5 to 15 degree angle (Veiga et al., 2006; Veiga & Gunson, 2020). According to (Styles et al., 2002) the angle between 12° to 15° and 7° to 12° for coarser and fine respectively grain size in sluice box processing. Based on these references and field observation three existing sluice box angles 5o, 10o and 15o were selected from Wolansa, Qori and Bore respectively for optimization. For Qori, Bore, and Wolansa 7 pits were prepared from each site for data collection. Generally, 21 pits were available for data collection from three mine sites. The collected samples were homogenized into a uniform mix, out of which 100 kg sample was weighed out for the experiments. After properly mixed together using shovel until it would be uniform mixture, then the test with angles (5o, 10o, 15o) were conducted for each. Weighing balance was utilized to measure the amount of the representative sample for each experiment. For all experiments, the water pressure, mesh size and samples were kept uniform whereas the sluice box angle was varied with 5o intervals from 5o to 15o. With this angles 100kg ore samples were washed in ordered to separate concentrated from gangue/waste material using sluice box. After sluicing the samples, the mats were removed properly from the sluice box and washed in a wide bowl and then panning. The sample was panned to obtain a concentrate made of mostly heavy metals and gold. Borax was added on the concentration when pure separated from such heavy waste minerals. The amount of obtained was weighed on an electronic balance and the value recorded. For each angle, sluicing was done six times on different sites, totally 18 and average recovery calculated for each site to determine at which angle was maximum recovery obtained. Finally, to calculated the average recovery for 3 sites at the same angle.
2.3. ANOVA Analysis
To determine whether sluice box slope significantly affects recovery, a one-way Analysis of Variance (ANOVA) was conducted. Three slope angles (5°, 10°, and 15°) were tested, with recovery measured in grams for three replicates per angle. The assumptions of ANOVA normality and homogeneity of variance were verified. Mean recovery and standard deviation for each slope angle were calculated and compared using ANOVA to determine if differences between groups were statistically significant at p<0.05.
2.4. Sluice Box Field Setup
A field-installed sluice box was deployed at an artisanal placer mining site. Natural stream-flow was diverted into the sluice, and -bearing gravels were introduced manually at controlled rates. The sluice box was rectangular with an effective width b=0.30m and flow depth h=0.05m, measured at three points (inlet, midpoint, outlet) and averaged. Three slope angles were tested: 5°, 10°, and 15°, adjusted by raising or lowering the downstream end.
Flow discharge was measured using a bucket-and-stopwatch method. Recovered concentrates were collected from sluice mats dried, and weighed.
2.3.1. Sluice Box Hydraulic Analysis
Field-measured sluice geometry and flow conditions were used to compute hydraulic parameters: Channel width(w), flow depth(d) 0.05m, wetted perimeter (P) (with rectangular channel) 0.40m, flow area (A) 0.015m2, hydraulic radius (R) 0.0375m, and Manning roughness coefficient(n) 0.022 (typical for wooden/metal sluices(Perry, 1960). Settling velocity according to (Stone & Duprat, 2015) values of Pr >2.5P indicate deposition-dominant, 0.8 < Pr <2.5 intermediate, Pr <0.8 suspension dominant (Stokes approximation for small particles; coarse particle values treated as order of magnitude) (Mecherbet, 2018).
3. Results and Discussions
3.1. Results
The result which obtained from the experiment of grain size and optimal angle as showing on the following Table 2 and Table 4 respectively from each 3 site. Different experiments were carried out, for grain size analysis of each site and for each angle of sluice box.
- A.
- Particle size of
Grain size analysis classifies particles based on their diameter. According to (ASTM, 1987), 100g of sample was tested from each site on Table 2 listed. The size was varied at each site as shown on table two bellow.
- B.
- Optimum angle
From each site (Wolansa, Qori and Bore) the obtained recovery was described with its angle and different sites where experiments were conducted on Table 4. The average of 1 site result is varied at the same angle 5o for different site Wolansa is 0.26g, Qori is 0.28g and Bore 0.23g. At an angle 10o 0.47g, 0.50g and 0.46g of recovery. In the last experiment at angle 15o, the Wolansa, Qori and Bore yielded 0.31g, 0.34g, and 0.31g of respectively. And also, the average recovery of 3 site at an angle 5°, 10° and 15° is 0.253, 0.472 and 0.32 respectively as showing in Table 4. Based on this result maximum recovery obtained at an angle 10o as it described in Figure 5.
- C.
- Statistical Analysis
The ANOVA results showed that sluice box angle had a highly significant effect on recovery efficiency (F = 146, p = 8.17 × 10⁻⁶). This indicates that variations in slope angle contributed substantially to differences in recovery, rejecting the null hypothesis at a 95% confidence level.

Table 1.
ANOVA of Recovery at Different Sluice Box Angles.
| Angle (°) | Wolansa | Qori | Bore | Mean Recovery (Xi) | SD | Source of Variation | SS | df | MS | F | p-value |
| 5 | 0.255 | 0.235 | 0.27 | 0.253 | 0.018 | Between Groups (Angle) | 0.076 | 2 | 0.038 | 146 | 8.17 × 10⁻⁶ |
| 10 | 0.475 | 0.49 | 0.45 | 0.472 | 0.02 | Within Groups (Error) | 0.001567 | 6 | 0.000261 | – | – |
| 15 | 0.32 | 0.33 | 0.31 | 0.318 | 0.008 | Total | 0.077567 | 8 | – | – | – |
- D.
- Hydrodynamic Observations
Qualitative flow observations supported the quantitative findings. At 5°, reduced velocity led to stagnant zones and fine material accumulation, restricting exposure to riffles. At 15°, turbulence increased, reducing the residence time of particles and carrying fine beyond the sluice. At 10°, laminar-to-transition flow conditions provided a balance: sufficient turbulence to mobilize lighter gangue while retaining within the riffles.
Table 2.
Field-derived hydraulic parameters for sluice box slopes.
| Angle (°) | S = tan(θ) | V (m/s) | Q (m³/s) | τ₀ (Veiga et al.) | u* (m/s) | w₀.₀₅ mm (m/s) | P_r (0.05 mm) | w₀.₅ mm (m/s) | P_r (0.5 mm) |
| 5 | 0.08749 | 1.506 | 0.02259 | 32.185 | 0.1794 | 0.02488 | 0.347 | 2.488 | 34.68 |
| 10 | 0.17633 | 2.138 | 0.03208 | 64.866 | 0.2547 | 0.02488 | 0.244 | 2.488 | 24.43 |
| 15 | 0.26795 | 2.636 | 0.03954 | 98.572 | 0.314 | 0.02488 | 0.198 | 2.488 | 19.81 |
3.2. Discussions
Table 4 is showing the particle size distribution of in 3 sites. The maximum weight percentage yield for all site is +1mm while the minimum yield was varied, for site Wolansa -250+125 µm, Qori -500+250 µm and Bore is -125+100 µm. Figure 4 showing the percentage passing against the sieve size for 3 sites. This figure indicated that most of the particle size is falling between 0.425 to 0.625 mm in each study area.
The average recovery of each 3 sites was varied with 3 different angles as shown in Figure 3 and Table 4. As shown the Figure 6 all site at angle 5° is 0.253, which is poor recovery. This indicated that the 5° angle did not wash properly. Here, averagely poor recovery shown slow movement of material suggesting the angle was too shallow, and the material was not properly transported along the box, reducing recovery efficiency by clogging the mat. When at an angle 10o it gave an average recovery of 0.472g. This angle optimum for material to flow more smoothly and efficiently, permitting grains to settle on the mesh while enhancing the recovery to discharging away the gangue materials.
The recovery of at angle 15o angle was 0.32g. At this angle, material flow was good but did not yield as much recovery as the 10° angle. This indicated that while the 15° angle was effective in transporting the material along the sluice box, it may not have provided the optimal conditions for maximum recovery. The investigation showed that using a 15° angle resulted in a greater recovery compared to the 4o. Additionally, the concentrate obtained after sluicing was lesser at 15o. This implied that the sluice box performed relatively well, allowing for recovery while minimizing the amount of concentrate produced. It is possible that this angle caused some of the smaller particles to be washed away during sluicing. As a result, some particles may have been carried away with the excess material, leading to a lower overall recovery compared to the other angles. Based on these findings, one can say among the angles investigated, 10o yielded optimal recovery. Ideally coarser recovered on steeper sluicing using high feed and wash rates, whereas fine should be recovered on shallow sluicing using low feed and wash rate.
The ANOVA results reveal a significant difference in recovery across the tested slope angles (p<0.05). The 10° angle yielded the highest recovery, consistent with optimal hydraulic conditions for particle settling in the sluice box. The 5° slope produced lower recovery due to reduced flow velocity, which may have caused particle settling in upstream sections. The 15° slope, while steeper, likely increased flow turbulence, reducing retention. These results demonstrate that careful optimization of sluice box angle can maximize recovery, providing a clear guideline for field operations.
The field-derived hydraulic parameters and measured sluice performance confirm open-channel theory (Singer, 2011)
- At 5°, low velocity (V=1.51 m/s, u∗ =0.179 m/s) led to fine-particle deposition (Pr =0.347), causing clogging and reduced recovery (~50%).
- At 10°, moderate velocity (V=2.14 m/s, u∗ =0.255 m/s) balanced flushing of gangue and retention of fine/coarse (Pr =0.244), yielding peak recovery (~94%).
- At 15°, high velocity (V=2.64 m/s, u∗=0.314 m/s) maintained fines in suspension (Pr =0.198), increasing loss and reducing recovery (~64%).
These results validate the use of Rouse-style analysis for assessing particle transport and support slope optimization for artisanal sluice efficiency. Natural variability in field flow introduces noise, but observed trends are consistent with hydraulic theory and previous sluice studies (Balen, 1990).
4. Conclusion
The study on assessment the particle size of optimum sluice box angle in Arero deposit was reported in two ways: analyzing size and at varying sluice box.
As shown on Table 4, 18 different experiments were carried out for sieve an analysis and optimal angle, 1 for sieve analysis and 2 for each angle for each 3 sites. For the first angle (5o), the recovery the first and second for site Wolansa 0.26g, 0.25g, for Qori 0.23, 0.24 and for Bore 0.28 0.26 respectively. At angle 10o, the recovery the first and second for site Wolansa 0.47g, 0.48g, for Qori 0.50, 0.48 and for Bore 0.46, 0.44 respectively. For the last at an angle 15o, the recovery the first and second for site Wolansa 0.31g, 0.33g, for Qori 0.34, 0.31 and for Bore 0.30, 0.32 respectively. Based on these findings, the angle 10° appears to be the most effective and efficiency angle for the sluice box, yielding the highest average amount (0.475, 49, 45 g) of recovery at a constant water pressure of 5108 Pascal and constant mesh size (16 strands of height 300mm).
- ➢
- The optimal angle for artisanal recovery in Arero was 10o since it yielded the highest amount of recovery.
- ➢
- Based on the Figure 4 the range of higher recovery is at an angle between 8o and 12o.
- ➢
- According to sieve analysis the particle size of is almost the same but sluice box angle is varied with 5o interval and the percentage of particle size is falling between 0.425 to 0.625 mm in each study area
- ➢
- If it uses 10o sluice box angle for site Wolansa and Bore to increase their recovery from 0.255 to 0.475 and 0.31 to 0.47 respectively.
- ➢
- Therefore, the other 2 site should be use optimum angle 10o to improve their recovery.
Funding
This study did not receive funding from external agencies.
Data Availability Statement
The corresponding author provides data supporting the findings of this study upon reasonable request.
Acknowledgments
The authors thank Arero woreda administration for providing access to site and field sample collection to support this research.
Conflicts of Interest
The authors declare that there is no conflict of interest regarding the publication of this paper.
Abbreviations
| ASM | Artisanal and Small-Scale Mining |
| ASMs | Artisanal and Small-Scale Miners |
| ANOVA | Analysis of Variance |
| GPS | Global Positioning System |
| ASTM | American Society for Testing and Materials |
| SD | Standard Deviation |
| SS | Sum of Squares |
| df | Degrees of Freedom |
| MS | Mean Square |
| Q | Qori (sampling site) |
| B | Bore (sampling site) |
| W | Wolansa (sampling site) |
| R | Retained (in sieve analysis) |
| P | Passing (in sieve analysis) |
| μm | Micrometer |
| mm | Millimeter |
| m/s | Meter per second |
| m³/s | Cubic meter per second |
References
- Alabi, O. O., & Gbadamosi, Y. E. (2021). Investigating the potentials of sluice box angle of tilt on the beneficiation of Birnin-Gwari deposit. FUOYE Journal of Engineering and Technology, 6(2), 88-91.
- Balen, M. D. (1990). Geochemical Sampling Results from Bureau of Mines Investigations in the Valdez Creek Mining District, Alaska.
- Getaneh, W.; Shikur, M. Artisanal opal mining and associated environmental and socio-economic issues in opal mine sites of Wollo province, Ethiopia. GeoJournal 2022, 87(4), 3323–3339. [Google Scholar] [CrossRef]
- Kazmin, V.; Shifferaw, A.; Balcha, T. The Ethiopian basement: stratigraphy and possible manner of evolution. Geologische Rundschau 1978, 67(2), 531–546. [Google Scholar] [CrossRef]
- Mecherbet, A. (2018). Sedimentation of particles in Stokes flow. arXiv preprint arXiv:1806.07795.
- Mencho, B. B. Assessing the effects of mining on environment: A case study of Shekiso district, Guji zone, Ethiopia. Heliyon 2022, 8(12). [Google Scholar] [CrossRef] [PubMed]
- Meseret, M.; Ehetie, T.; Hailye, G.; Regasa, Z.; Biruk, K. Occupational injury and associated factors among construction workers in Ethiopia: a systematic and meta-analysis. Archives of Environmental & Occupational Health 2022, 77(4), 328–337. [Google Scholar]
- Mitchell, C.; Evans, E.; Styles, M. A review of particle-size and recovery methods. 1997. [Google Scholar]
- Nyssen, J., & Kiros, H. (2022). Map of Tigray’s mineral resources (north Ethiopia)-Canadian and other international mining licenses. In: Zenodo.
- Perry, B. (1960). Open-Channel Hydraulics. Ven Te Chow. McGraw-Hill, New York, 1959. xviii+ 680 pp. Illus. $17. Science, 131(3408), 1215-1215.
- Singer, M. B. PY Julien 2010. Erosion and Sedimentation, xviii+ 371 pp. Cambridge University Press. Price£ 80.00, US 60.00 (PB). ISBN 978 0 521 83038 (HB); 978 0 521 53737 7 (PB). Geological Magazine 2011, 148(4), 683–684. [Google Scholar] [CrossRef]
- Stone, H. A., & Duprat, C. (2015). Low-Reynolds-number flows.
- Styles, M., Simpson, J., & Steadman, E. (2002). Good practice in the design and use of large sluice boxes.
- Veiga, M. M.; Gunson, A. J. Gravity concentration in artisanal mining. Minerals 2020, 10(11), 1026. [Google Scholar] [CrossRef]
- Veiga, M. M., Metcalf, S., Baker, R. F., Klein, B., Davis, G., Bamber, A., Siegel, S., Singo, P., & Investments, G. L. (2006). Manual for training artisanal and small-scale miners. Global Mercury Project. UNIDO, Vienna, Austria.
Figure 1.
Location of the study area.
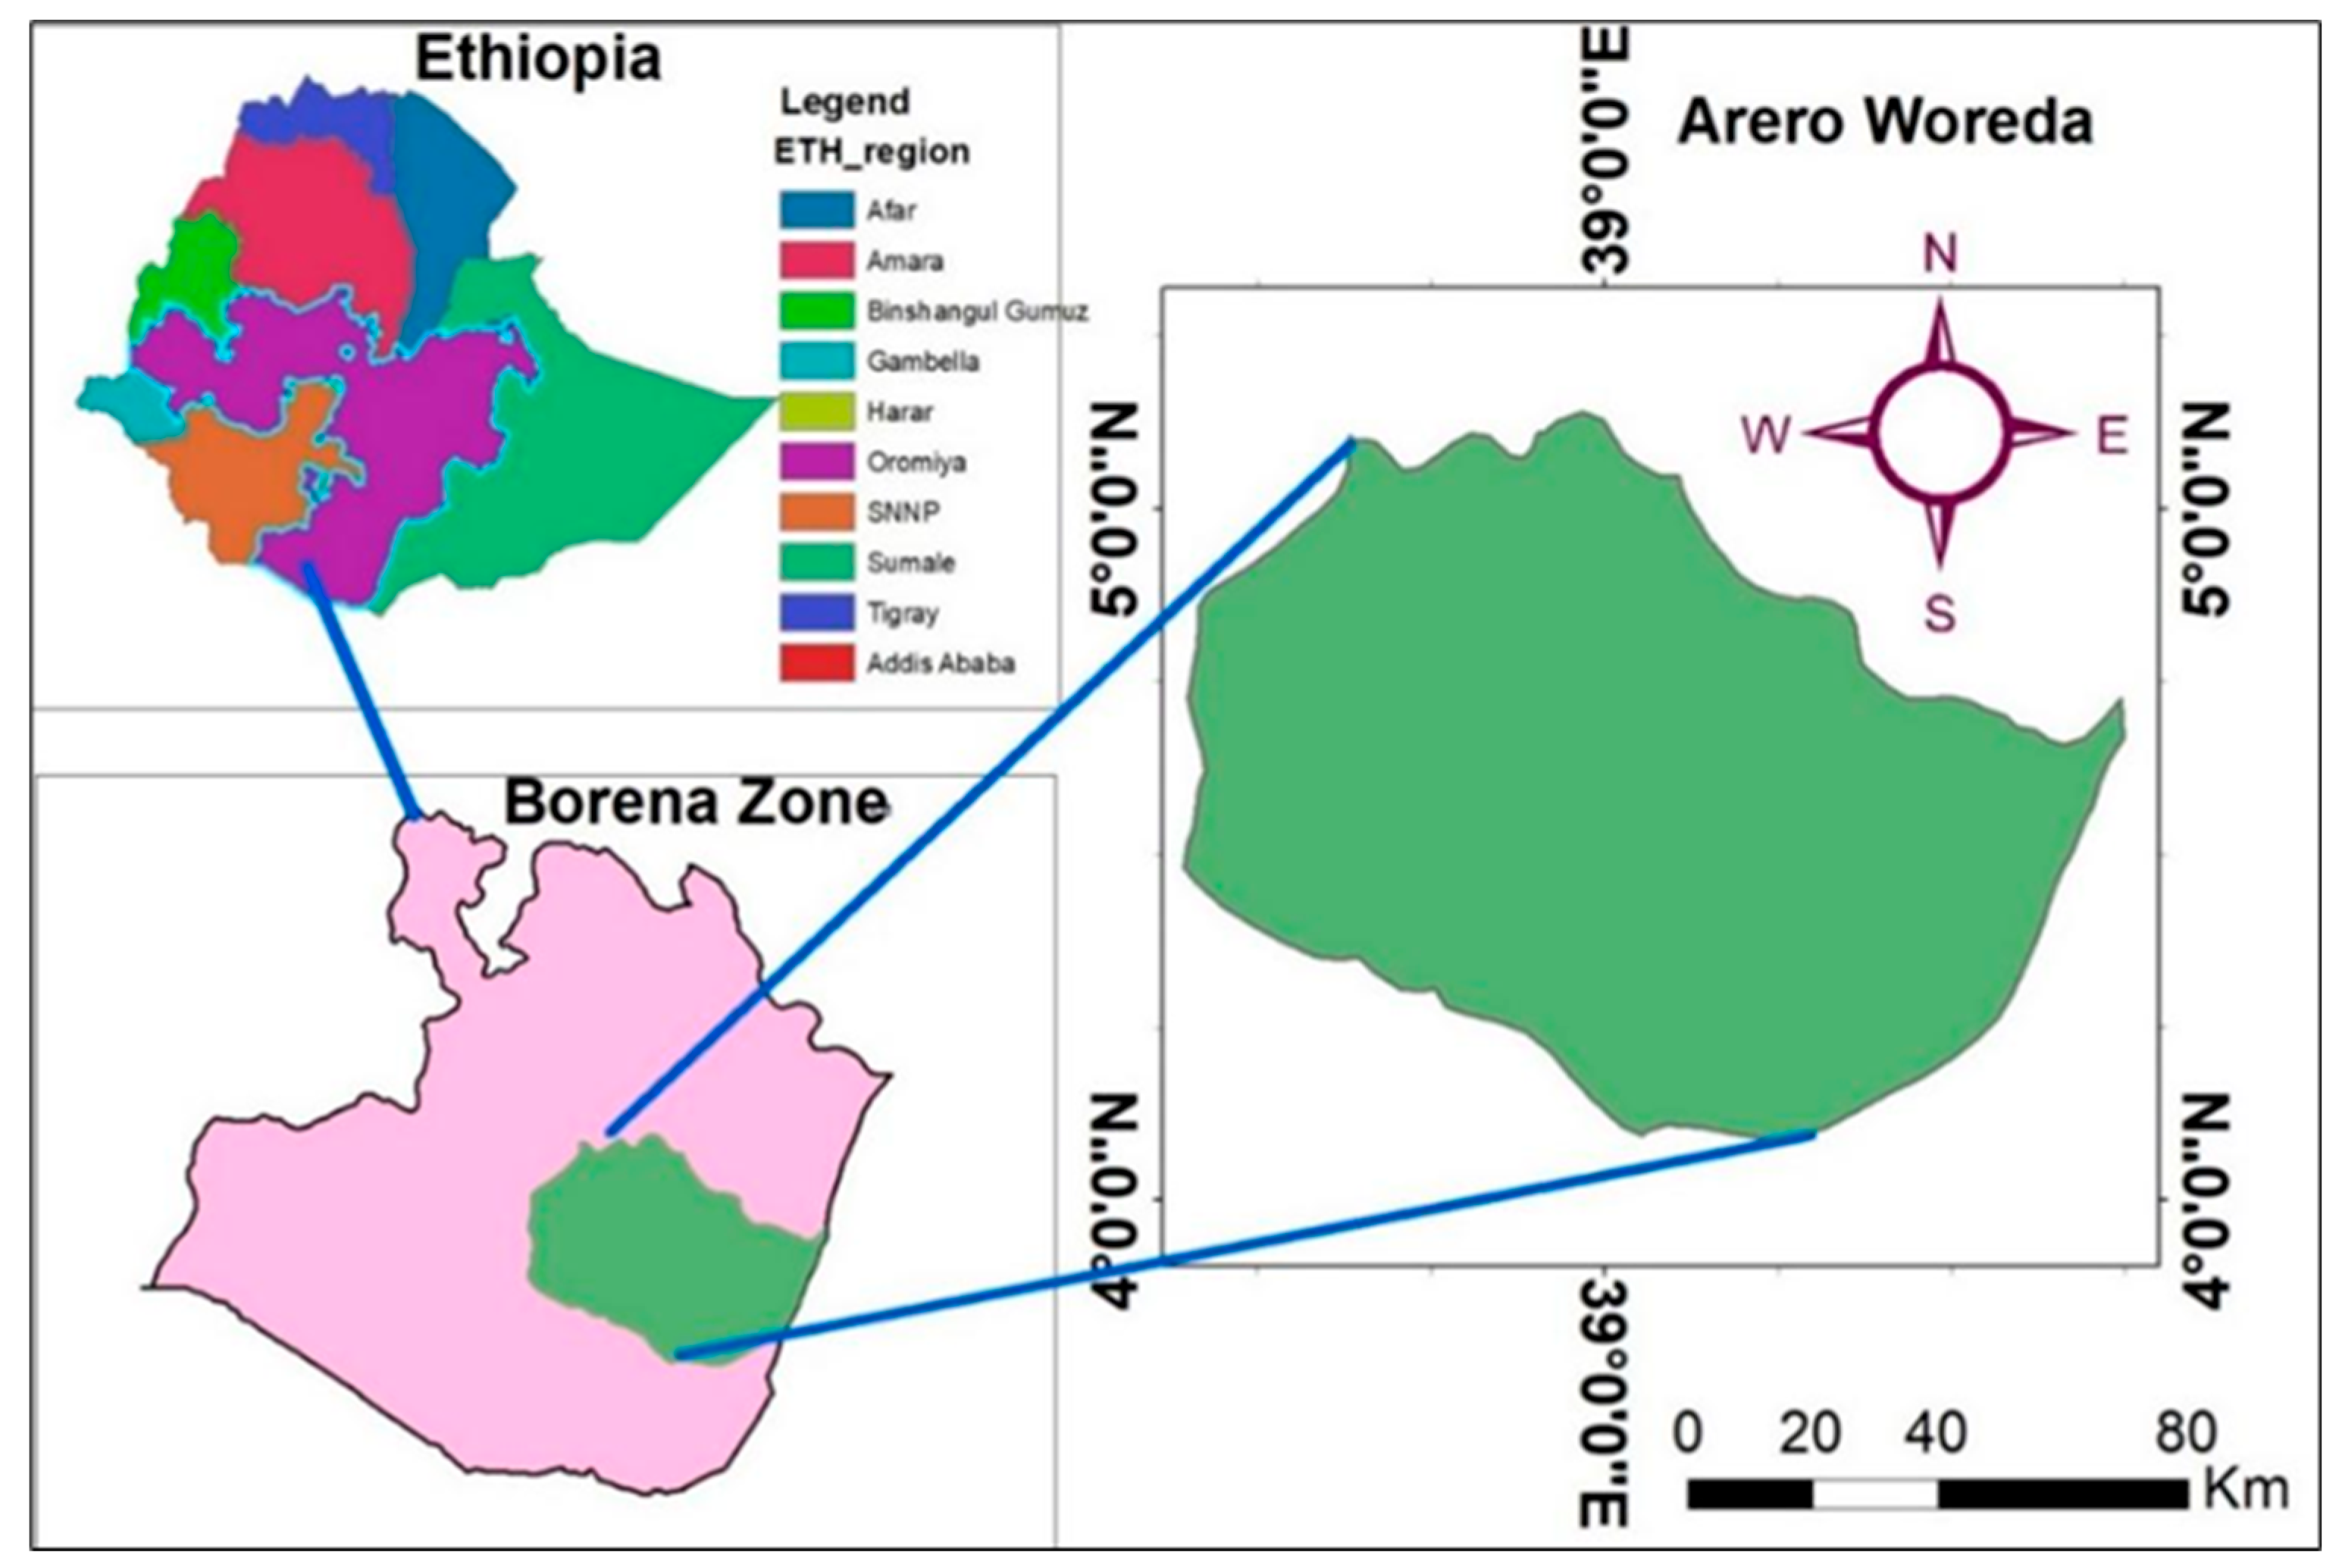
Figure 3.
percent of retained vs sieve size in mm.
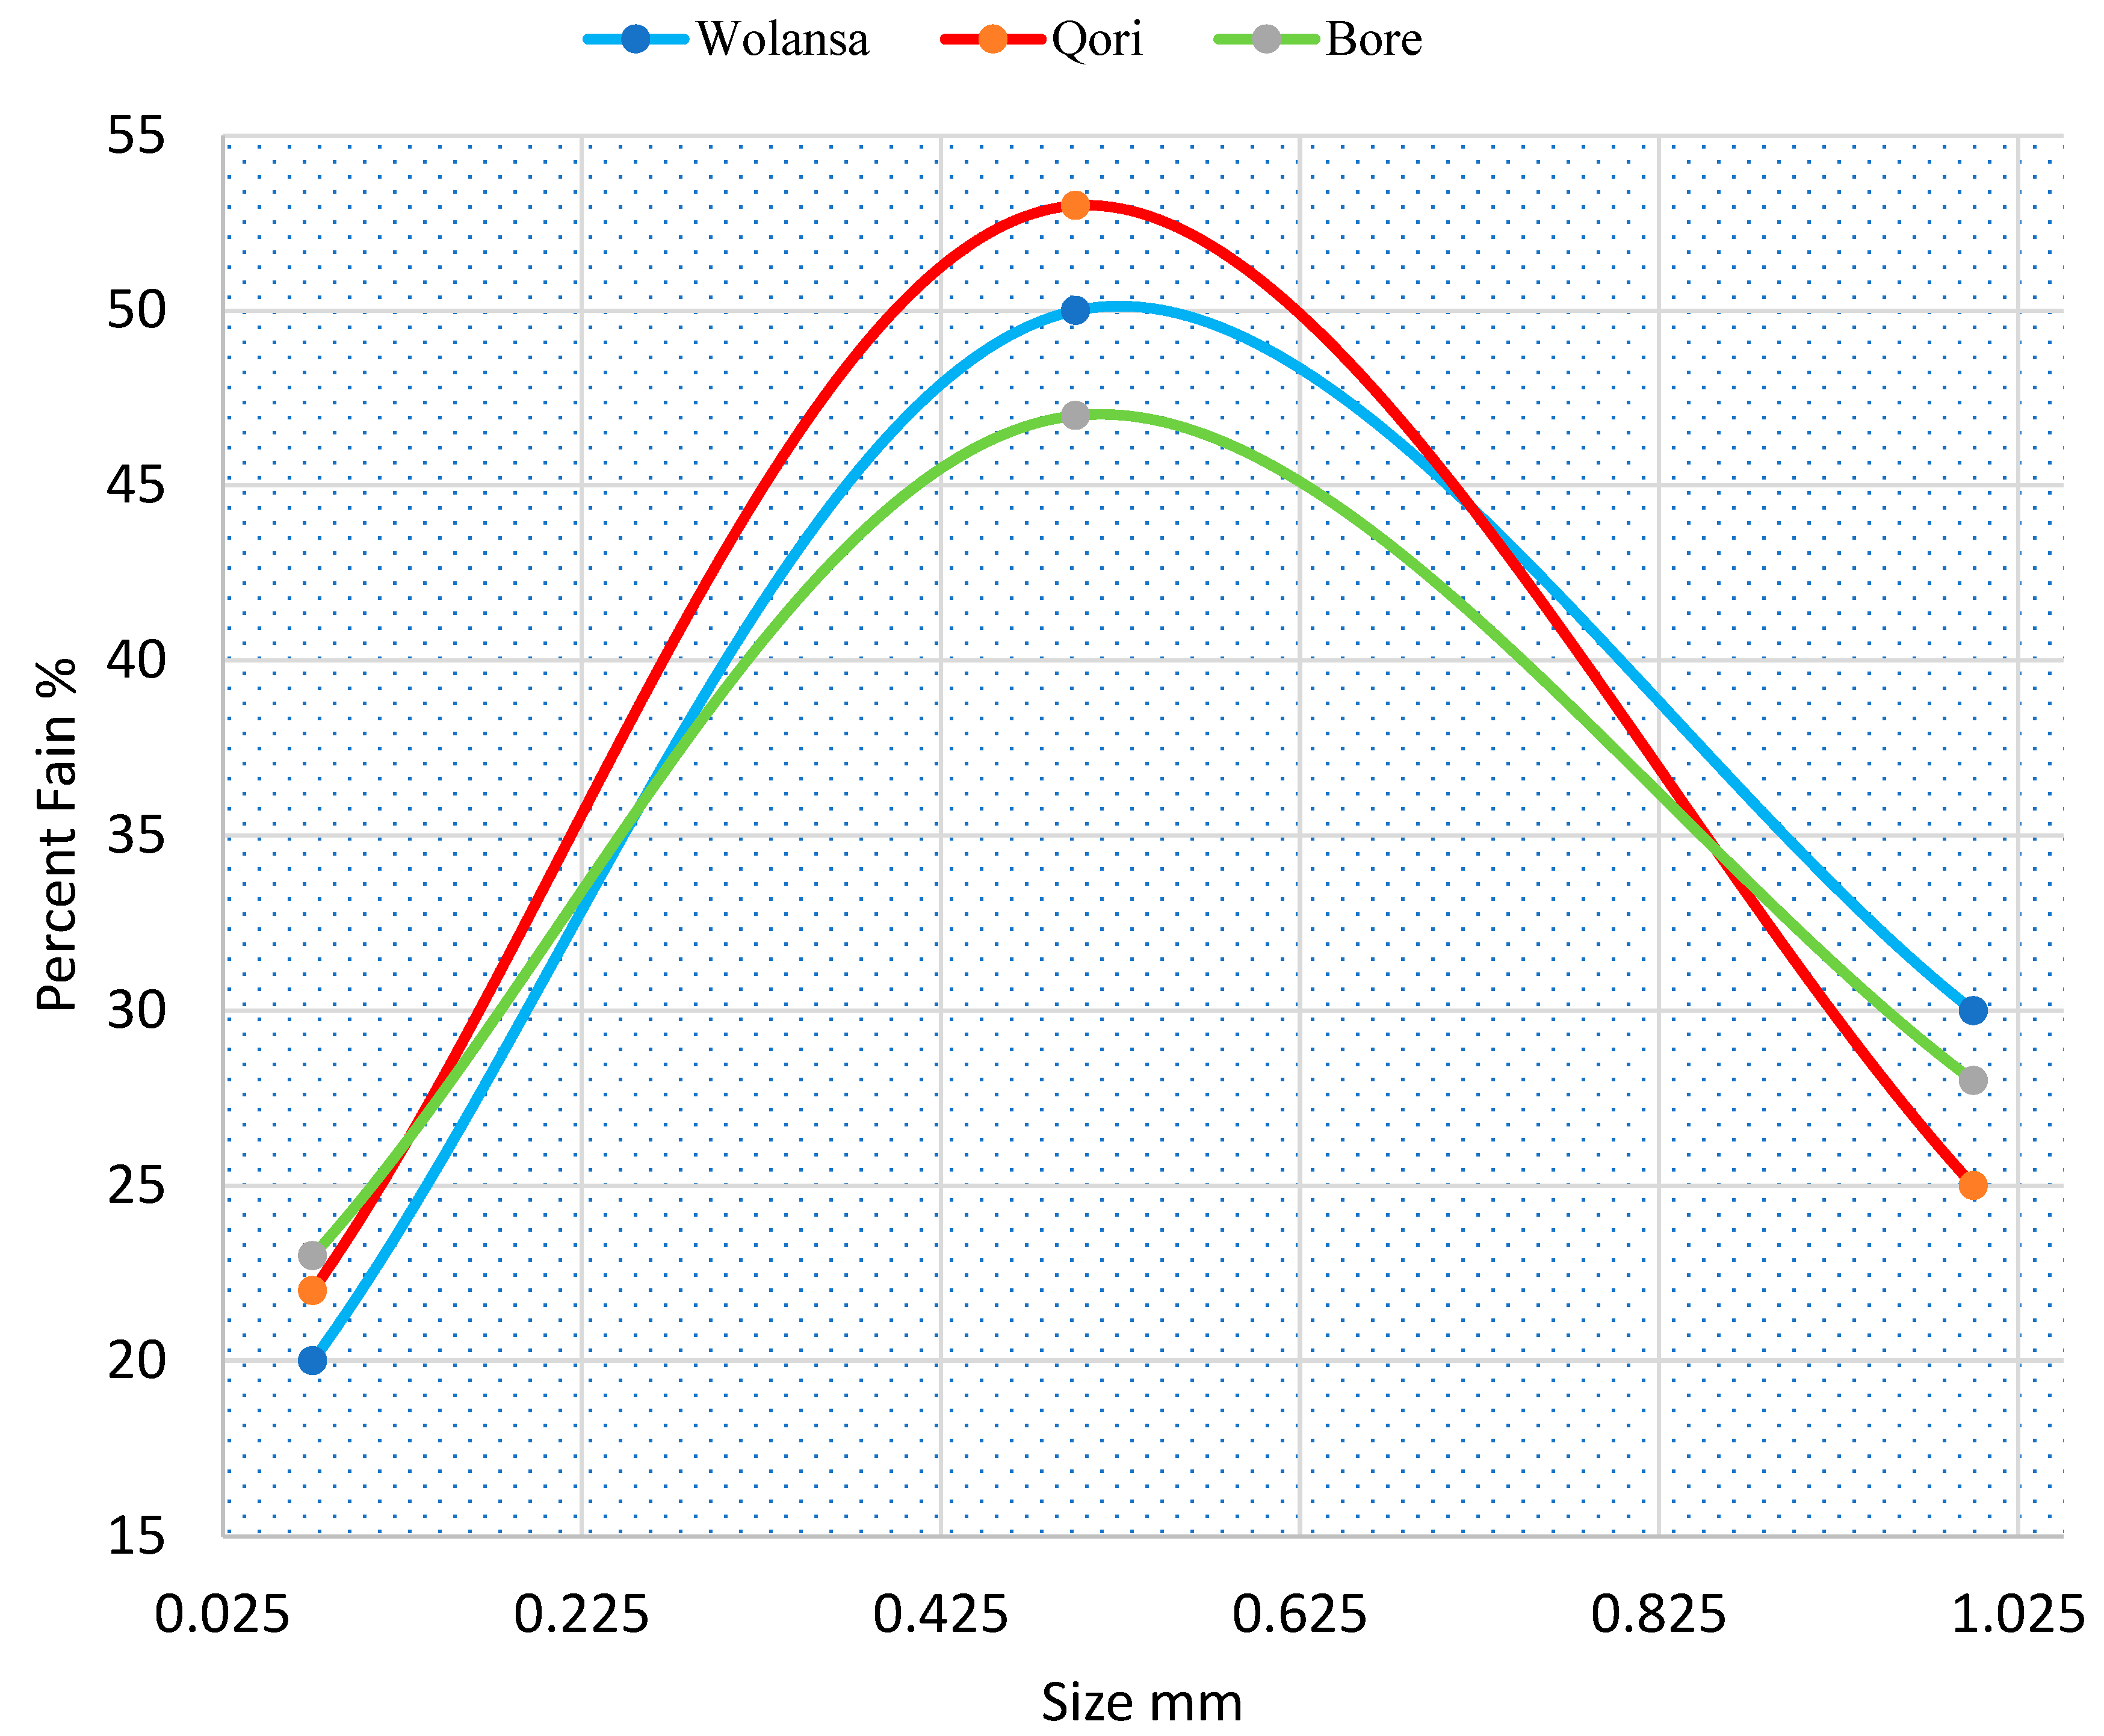
Figure 5.
Average recovery of for each three sites at different angles.
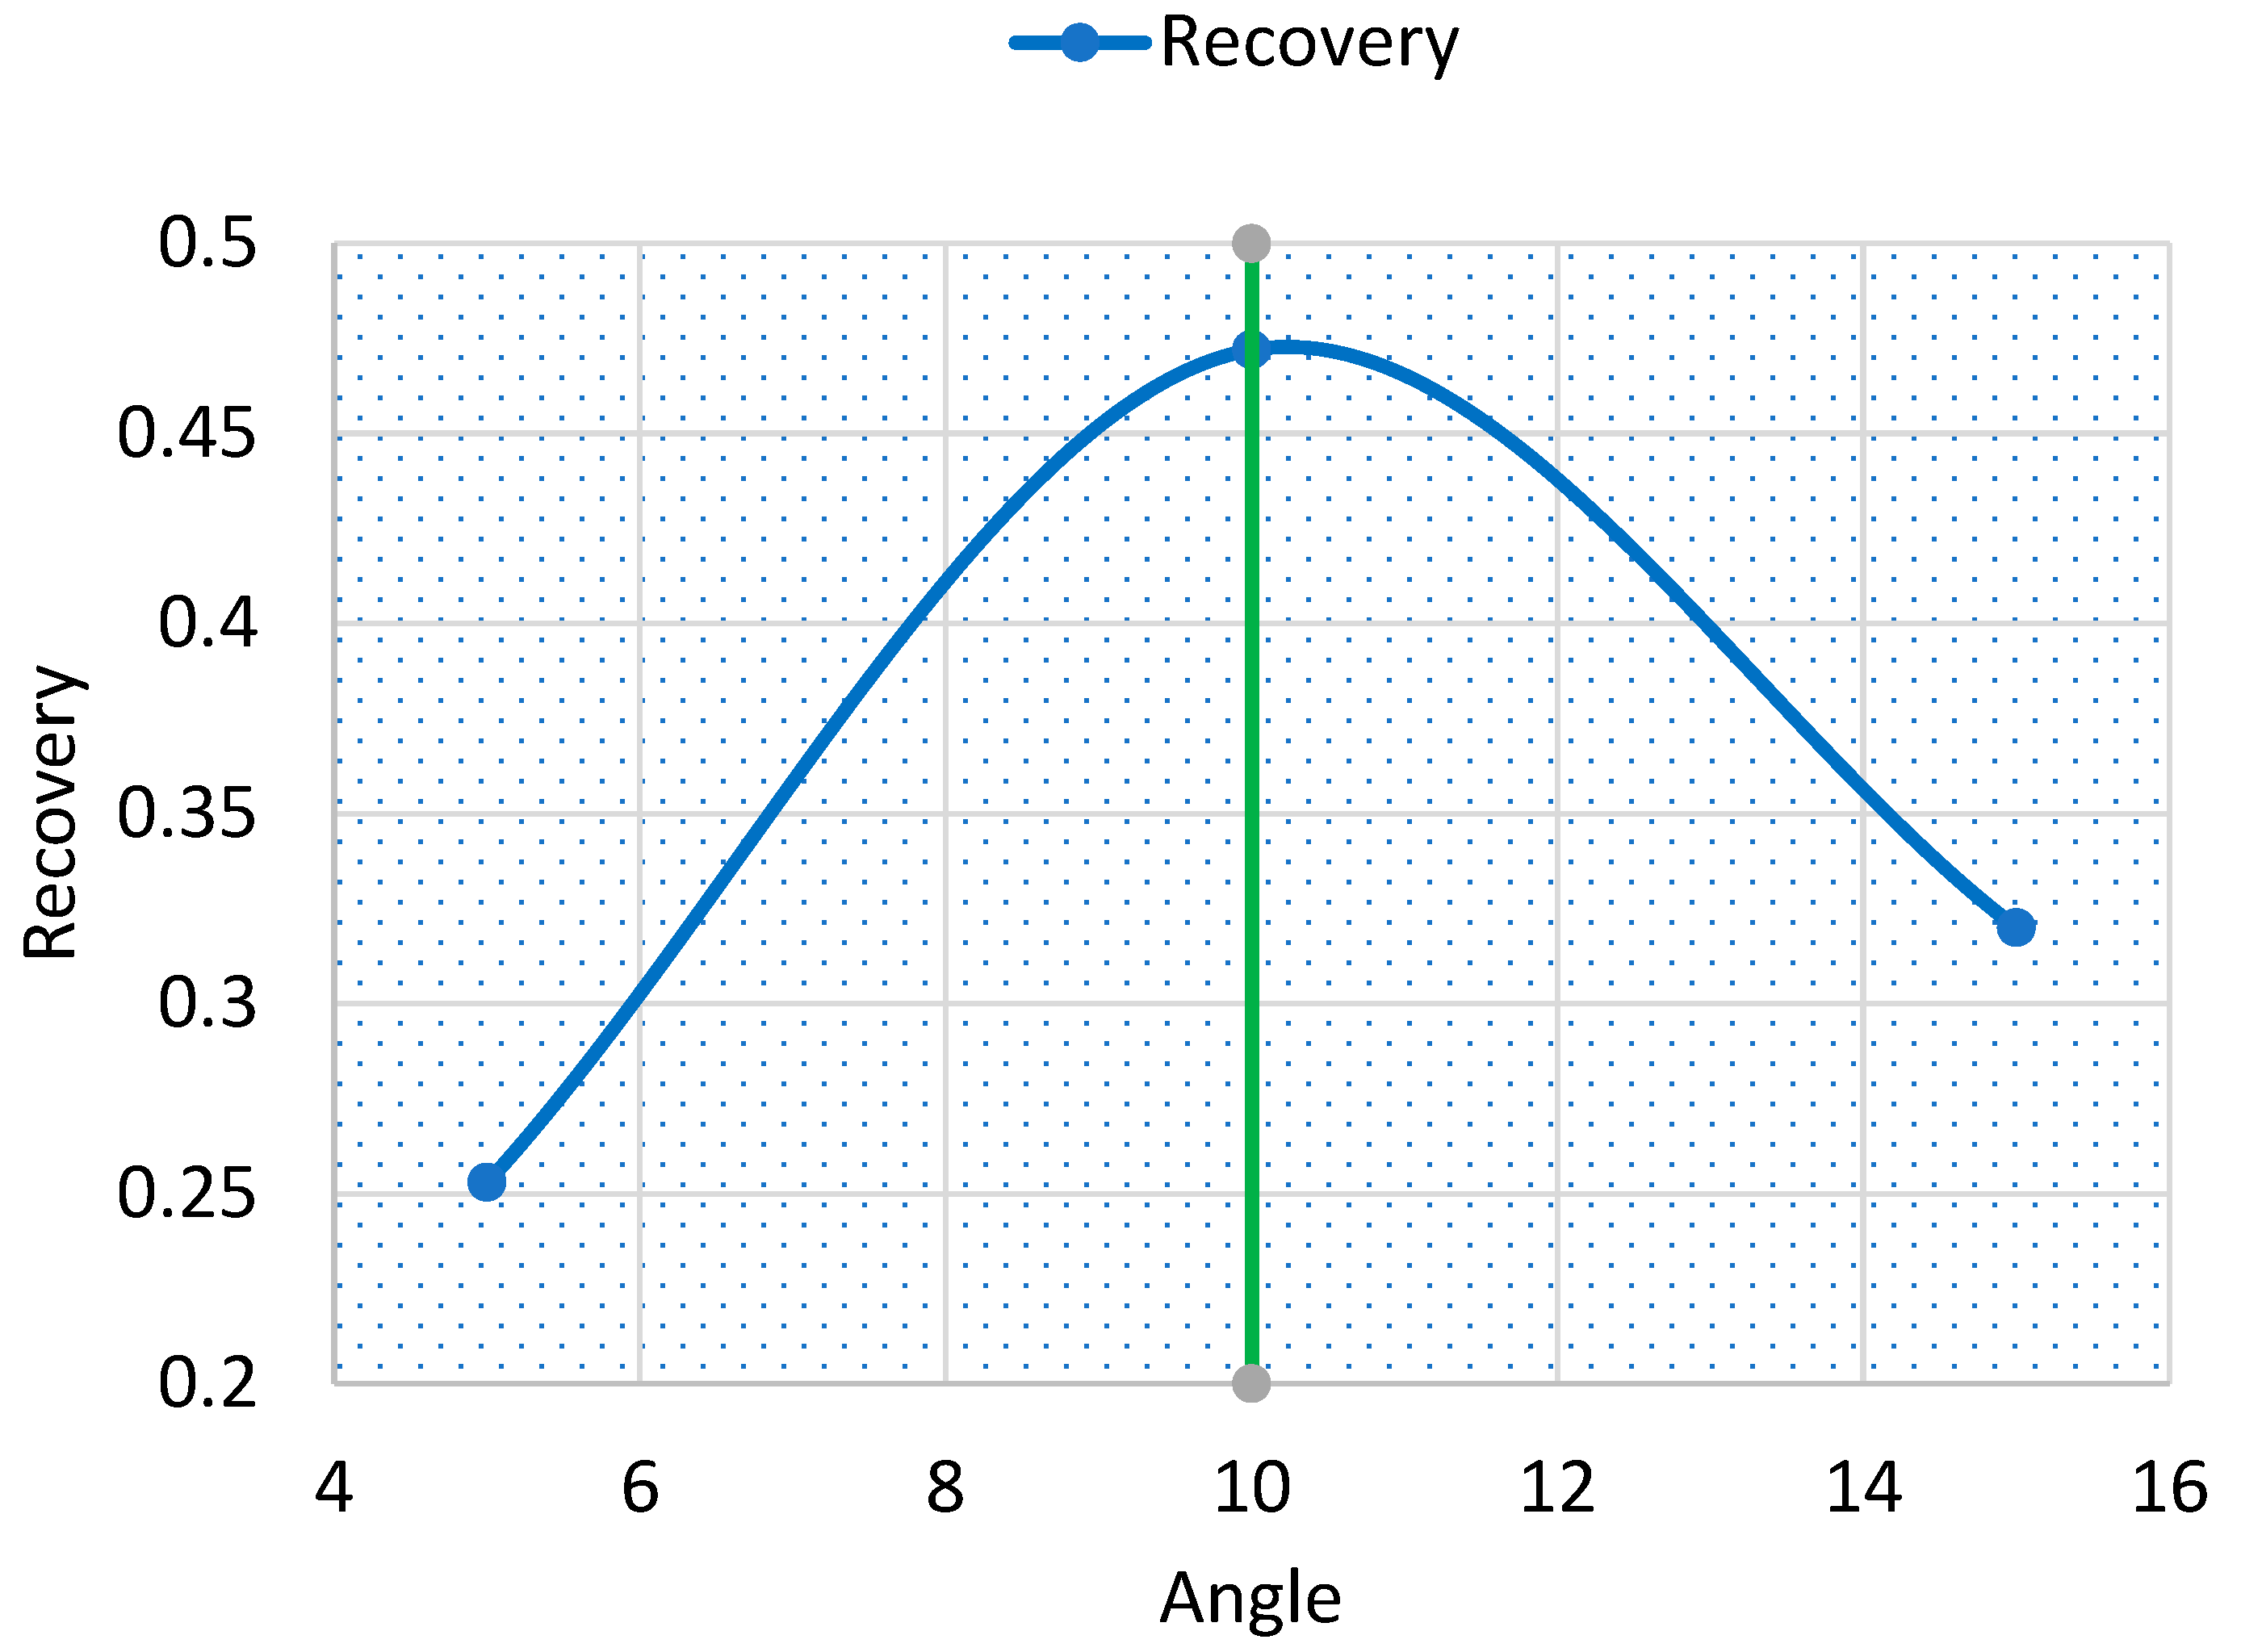
Figure 6.
Average recovery of for each three sites at different angles.
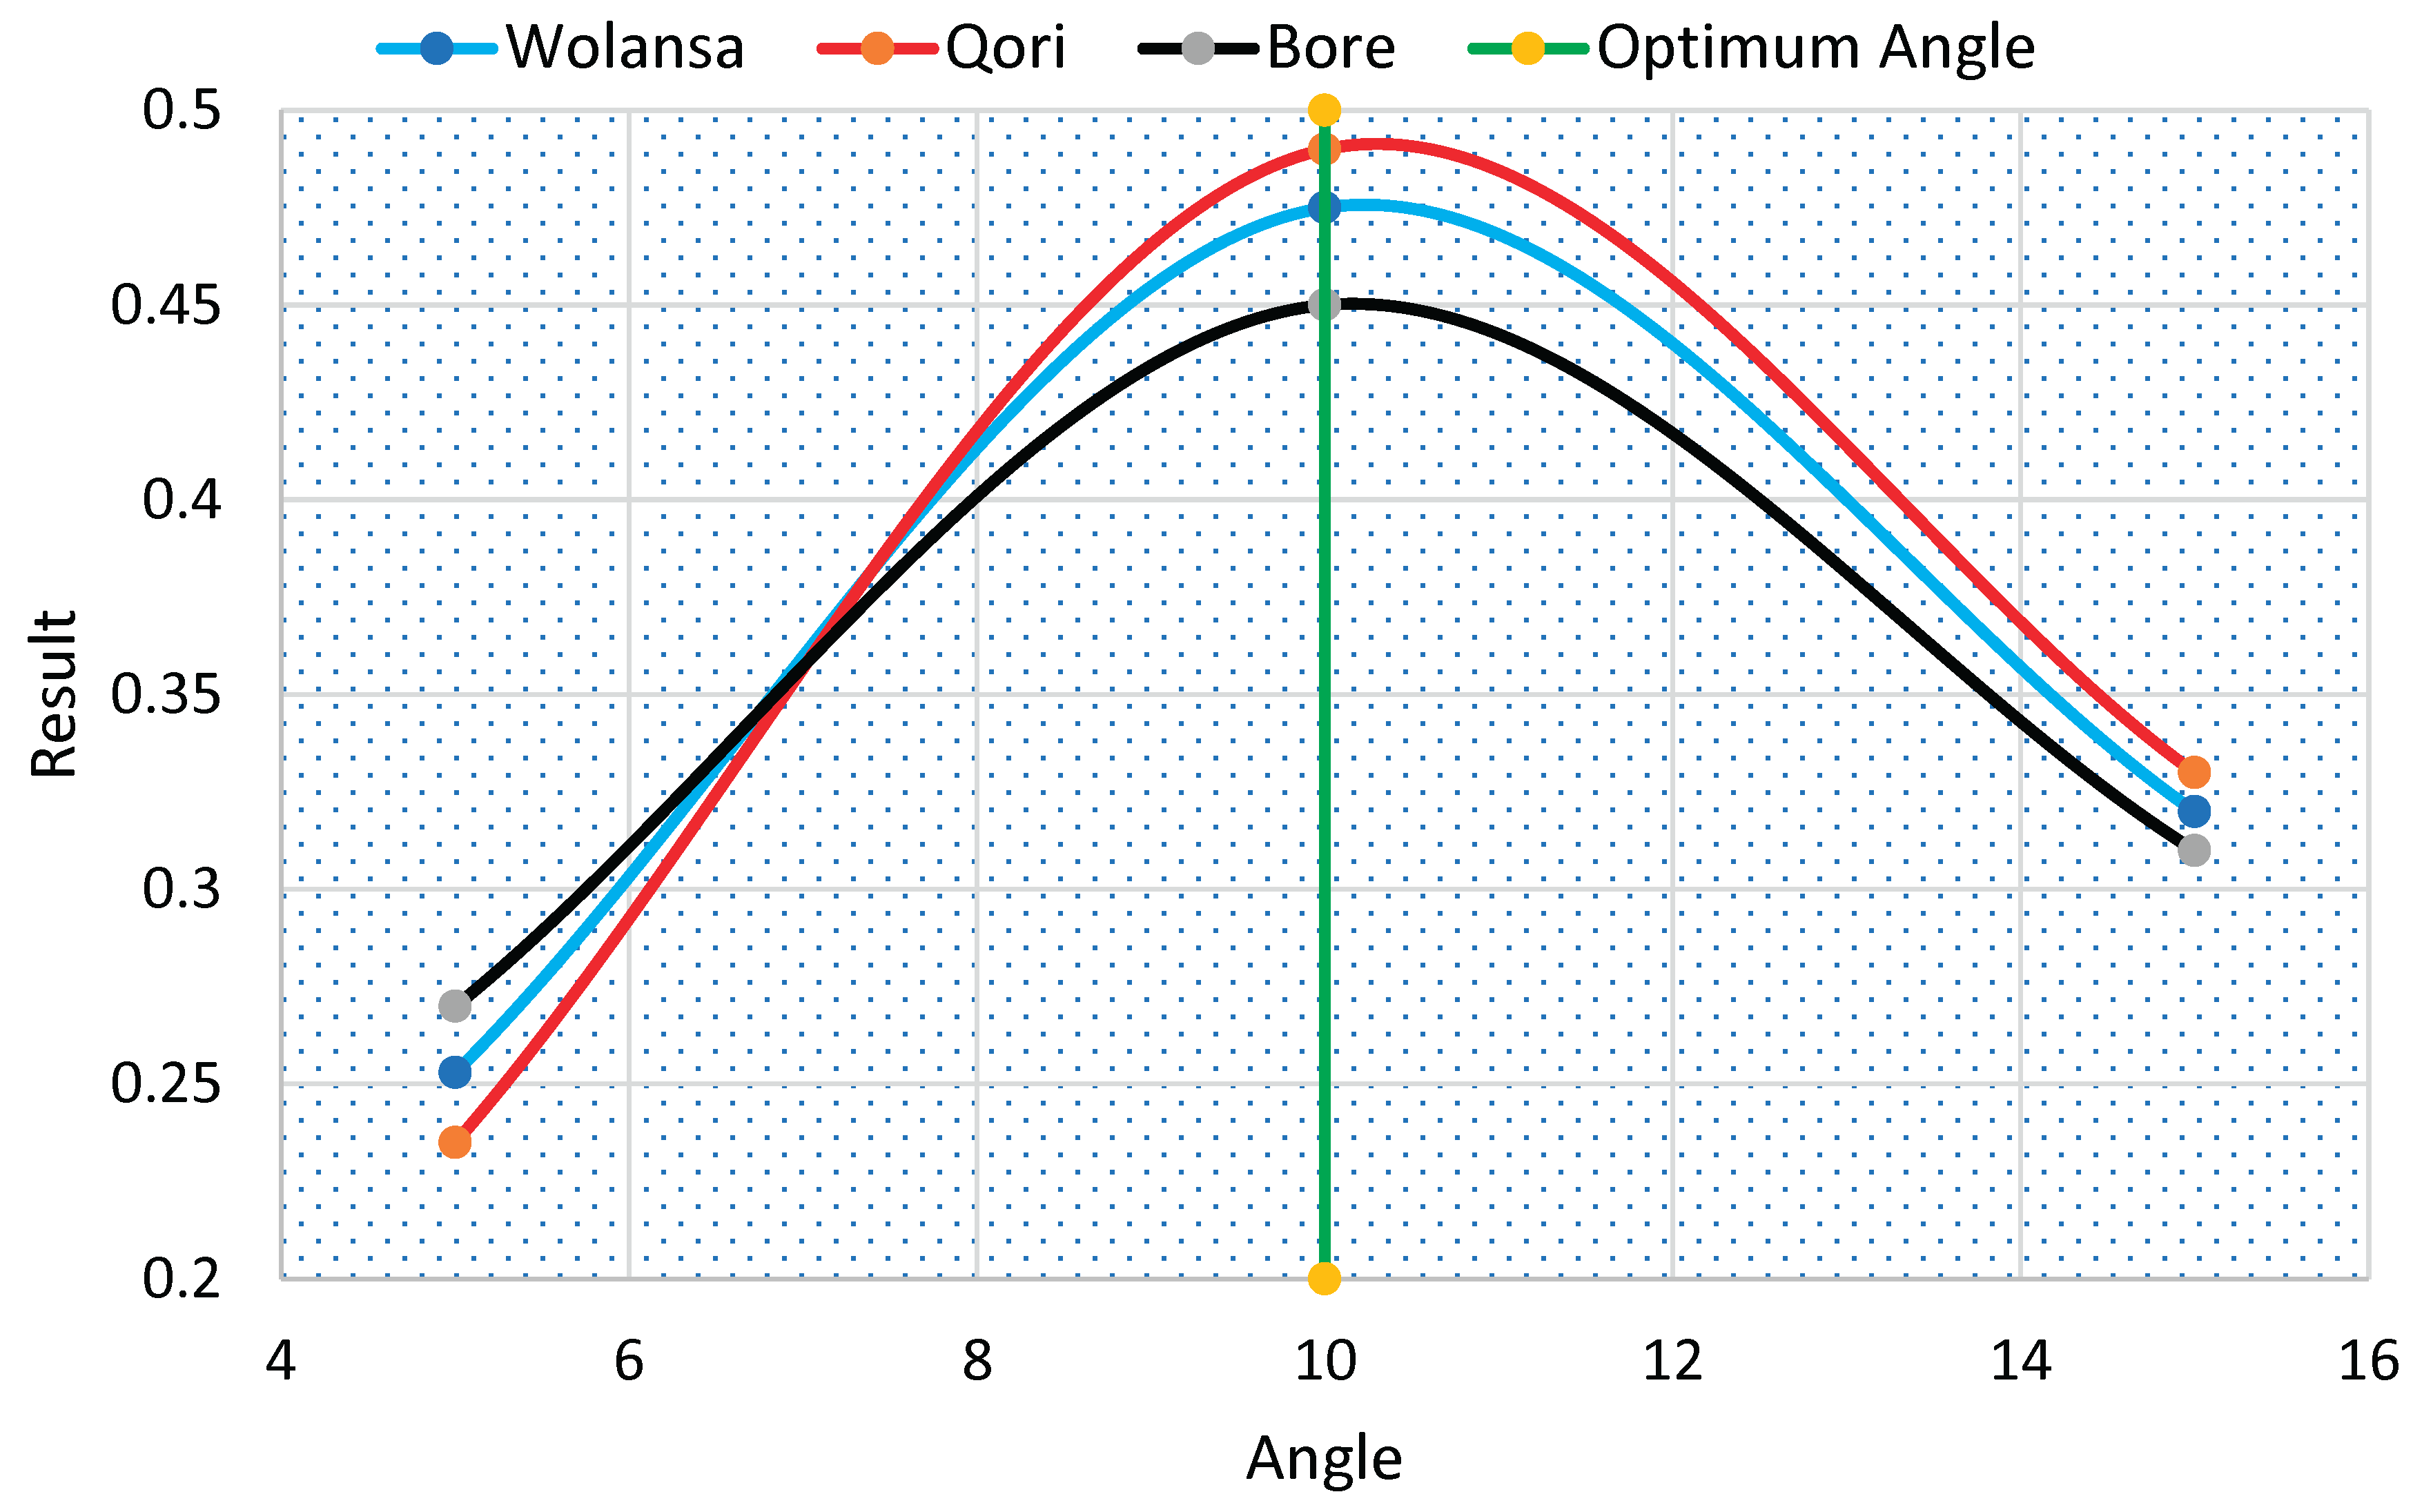
Table 2.
Fractional sieve size analysis for each three sites.
| Particle Size Range | Mass | Percentage | Cumulative Percent | |||||||||
| R (g) | R (%) | R (%) | P (%) | |||||||||
| (µm) | Q | B | W | Q | B | W | Q | B | W | Q | B | W |
| +1000 | 23.2 | 28.1 | 20.4 | 23.2 | 28.1 | 20.4 | 23.2 | 28.1 | 20.4 | 76.8 | 71.9 | 79.6 |
| -1000+500 | 7.8 | 10.5 | 12.1 | 7.8 | 10.5 | 12.1 | 31.0 | 38.6 | 32.5 | 69.0 | 61.4 | 67.5 |
| -500+250 | 15.2 | 11.3 | 6.1 | 15.2 | 11.3 | 6.1 | 46.2 | 49.9 | 38.6 | 53.8 | 50.1 | 61.4 |
| -250+125 | 11.4 | 10.2 | 17.3 | 11.4 | 10.2 | 17.3 | 57.6 | 60.1 | 55.9 | 42.4 | 39.9 | 44.1 |
| -125+100 | 22.5 | 15.4 | 21.6 | 22.5 | 15.4 | 18.6 | 80.1 | 75.5 | 77.5 | 19.9 | 24.5 | 22.5 |
| -100+75 | 13.7 | 16.1 | 12.5 | 13.7 | 16.1 | 14.6 | 93.8 | 91.6 | 90.0 | 6.2 | 8.4 | 10.0 |
| -75 | 16.2 | 8.4 | 10.2 | 6.2 | 8.4 | 10.9 | 100 | 100 | 100 | 0 | 0 | 0 |
Where: R= Retained, P= passing, Q= Qori, B= Bore, W= Wolansa
Table 4.
Recovery of for each three sites at different angles.
| Angles (o) | Experiments | Quantity (kg) |
Recovery (g) |
Average Recovery one Site |
Average Recovery three Site |
|
| Trials | Site | |||||
| 5 | 1 | Wolansa | 100 | 0.26 | 0.255 | 0.253 |
| 2 | 100 | 0.25 | ||||
| 5 | 1 | Qori | 100 | 0.23 | 0.235 | |
| 2 | 100 | 0.24 | ||||
| 5 | 1 | Bore | 100 | 0.28 | 0.27 | |
| 2 | 100 | 0.26 | ||||
| 10 | 1 | Wolansa | 100 | 0.47 | 0.475 | 0.472 |
| 2 | 100 | 0.48 | ||||
| 10 | 1 | Qori | 100 | 0.50 | 0.49 | |
| 2 | 100 | 0.48 | ||||
| 10 | 1 | Bore | 100 | 0.46 | 0.45 | |
| 2 | 100 | 0.44 | ||||
| 15 | 1 | Wolansa | 100 | 0.31 | 0.32 | 0.32 |
| 2 | 100 | 0.33 | ||||
| 15 | 1 | Qori | 100 | 0.34 | 0.33 | |
| 2 | 100 | 0.31 | ||||
| 15 | 1 | Bore | 100 | 0.30 | 0.31 | |
| 2 | 100 | 0.32 | ||||
Disclaimer/Publisher’s Note: The statements, opinions and data contained in all publications are solely those of the individual author(s) and contributor(s) and not of MDPI and/or the editor(s). MDPI and/or the editor(s) disclaim responsibility for any injury to people or property resulting from any ideas, methods, instructions or products referred to in the content. |
© 2025 by the authors. Licensee MDPI, Basel, Switzerland. This article is an open access article distributed under the terms and conditions of the Creative Commons Attribution (CC BY) license (http://creativecommons.org/licenses/by/4.0/).
Copyright: This open access article is published under a Creative Commons CC BY 4.0 license, which permit the free download, distribution, and reuse, provided that the author and preprint are cited in any reuse.


