
Submitted:
20 November 2025
Posted:
24 November 2025
You are already at the latest version
Abstract
To address the energy-saving requirements of ultra-low energy consumption buildings in hot summer and cold winter regions, high-performance foam concrete(FC)was developed using fly ash(FA) as the sole silico-aluminous raw material using alkali-activation technology. A mix proportion calculation model was established based on the volume method to accomplish the preliminary design of the material system, and orthogonal tests were employed to achieve the synergistic enhancement of thermal, mechanical, and other relevant properties. Innovatively, the introduction of the 2.5 wt% SiO2 aerogel reduced the thermal conductivity to 0.1107 W/(m·K). To mitigate the high water absorption of FC, internal mixing with a sodium methyl silicate solution (at a concentration of 8%) controlled the mass water absorption by 3.87%. Test results confirmed that the optimized FC exhibited a dry density of 576.34 kg/m3, compressive and flexural strengths of 5.83 MPa and 1.41 MPa respectively, a dry shrinkage rate of only 0.614 mm/m, and strength and mass loss rates below 10.5% and 1.8% after freeze-thaw cycling. This material integrates ultralow thermal conductivity, excellent hydrophobicity, and structural stability, thereby providing a novel solution for the envelope structures of low-energy consumption buildings.
Keywords:
ultra-low energy consumption buildings
; FA
; high-performance AAFC
; SiO₂ aerogel
; waterproofing
1. Introduction
The global environmental crisis is intensifying, and projections indicate that the building sector in China will account for over 40% of total societal energy consumption by 2050[1]. The development of energy-efficient materials, such as FC, is therefore crucial for the sustainable development of the construction industry. FC offer advantages such as thermal insulation, fire resistance, and low cost. However, a significant paradox exists: conventional FC relies on Ordinary Portland Cement (OPC), a binder with a highly energy-intensive production process that contributes to approximately 8% of the global carbon emissions [2]. In contrast, Alkali-Activated Materials (AAMs), which can reduce associated carbon emissions by over 80% [3], present a sustainable alternative and are widely recognized as "green cement."
The properties of AAFC are significantly influenced by the raw material composition, activator parameters, and production methods. Waste utilization strategies significantly enhance specific properties: FA with clinoptilolite improves thermal and frost resistance [4,5], pinecone powder increases the 91-day strength by 256.6% [6], recycled brick powder with Na2O reduces thermal conductivity to 0.1067–0.1121 W/(m·K) [7,8], and waste glass enhances mechanical and corrosion resistance[9]. Process optimization through red mud addition and mechanical activation improves the pore structure and strength [10,11], while advanced composites containing hollow glass beads, rice husk, silica fume, and FA demonstrate synergistic thermal-mechanical performance enhancement [12,13,14,15].
Lightweight design strategies are implemented through the incorporation of Expanded Polystyrene (EPS) beads[16], waste polyurethane (PUR) [17], and lightweight aggregates [18], with densities of ≤800 kg/m3 and thermal conductivity as low as 0.07 W/(m·K) being achieved. Foaming techniques, including chemical (H2O2 and zinc/aluminum metal powders) and physical methods (Sodium Dodecyl Sulfate(SDS)), allow tailored pore structures. The H2O2/SDS combination enables the production of materials with either ultra-low thermal conductivity (0.072W/(m·K)) or high compressive strength (19.6MPa)[19,20,21], demonstrating flexibility in property design through processing optimization.
The pore characteristics critically govern the thermal and mechanical properties of AAFC. Jaya et al.[22]identified that the activator composition primarily controls the compressive strength (0.4–6MPa), whereas the precursor/activator ratio dictates the thermal conductivity (0.11–0.30 W/(m·K)). The synergistic use of H2O2 and Tween 80 enabled porosity control within 36–86%. A more than two-fold increase in the 28-day strength was achieved by Su et al.[23] by optimizing the activator modulus (SiO₂/Na₂O=1.2–1.8) under high-humidity curing conditions (RH≥90%). A key research challenge is to balance low thermal conductivity with high strength. Huan et al.[24]developed a hierarchically porous material with 93.8% porosity and 0.040 W/(m·K) thermal conductivity, albeit at low strength (0.27 MPa). In contrast, Berkouche et al.[25]balanced both properties (0.13 W/(m·K), 4.26 MPa) using rice husk ash (RHA) and glass powder (GP). RHA enhanced the strength through geopolymerization, whereas GP refined the pore structure as an inert filler. The microstructural analysis confirmed that the performance stems from the synergy between the gel phases (C-A-S-H/N-A-S-H) and pore distribution.
Nanomaterials provide a superior approach for tailoring material properties. Rong et al.[26]demonstrated that combining 12% aerogel with 75% foam reduces thermal conductivity to 0.18 W/(m·K), while adding 1% polypropylene fibers increases compressive strength to 23.7 MPa. Similarly, Pan et al.[27]found that silica aerogel decreases the thermal conductivity by 24% (to 0.0886 W/(m·K)) through multi-scale porosity, and Ji et al.[28] reported that 0.4% CMC enhances the pore structure, improving the strength by 44.7% and pore sphericity.
While existing research often prioritizes the extreme optimization of one or a few properties, such as achieving ultralow thermal conductivity, a more holistic approach was adopted in this study. Using FA-based AAFC as the matrix, this work is designed around the multi-performance requirements of envelope materials for ultra-low energy consumption buildings. A comprehensive set of seven key indicators was established, including thermal conductivity, mechanical strength, fire resistance, and freeze-thaw durability. Notably, a critical focus is placed on enhancing waterproofing performance, effectively addressing the long-standing issue of high water absorption in FC. Specifically, SiO₂ aerogel, a super thermal insulation material, was incorporated to enhance the thermal performance of AAFC. Resolve the conflict between the mechanical and thermal properties of conventional FC. Ultimately, all parameters met the requirements of the performance index system. A synergistic enhancement in the range of key material properties was achieved.
2. Construction of Target Performance Index System for AAFC
2.1. Determination of Target Performance Indicators and Parameters
To address the energy efficiency requirements of ultra-low energy consumption buildings in hot-summer and cold-winter regions, a high-performance AAFC has been developed with the objective of achieving self-insulation through 300 mm-thick exterior walls, satisfying mechanical standards for non-load-bearing walls, demonstrating excellent water resistance, and conforming to specifications for dry density, fire resistance, and frost resistance.
- (1)
- Dry Density and Mechanical Properties
The dry density was optimized by balancing the sound insulation and the mechanical requirements. For non-load-bearing exterior walls, mechanical targets–compressive strength, flexural strength, and drying shrinkage–were defined according to relevant standards[29,30,31].
- (2)
- Thermal Performance
The thermal performance was characterized by two key parameters: wall thermal transmittance and thermal conductivity of the AAFC. To fulfill the self-insulation criteria for ultra-low energy buildings in hot-summer and cold-winter regions, the thermal transmittance was limited to ≤0.4 W/(m2·K) [32,33,34]. The exterior wall thickness is set to 300 mm. The thermal conductivity of the AAFC was then calculated in compliance with the relevant design codes, as follows[35]:
In the equation, K(0.4 W/(m²·K)) is the wall thermal transmittance; h1 and h2 are the interior and exterior surface heat transfer coefficients, taken as 8.7 and 23 W/(m2·K) respectively, with the latter representing the most severe condition; δ is the wall thickness (0.3 m); λ is the thermal conductivity of the AAFC(W/(m·K)); and a thermal conductivity correction factor (α) of 1.05 was incorporated. Thus, the corresponding thermal conductivity of AAFC should not exceed 0.1216 W/(m·K).
- (3)
- Fire Resistance and Water Resistance
The AAFC material exhibits Class A fire resistance as an inorganic noncombustible material,thus meeting these requirements.
To address the inherent drawback of high water absorption in FC, mass water absorption was adopted as a key performance indicator. The influence of moisture content (varied from 0% to 55% at 5% intervals) on thermal conductivity was investigated using the weight method. A well-fitted correlation (R2=0.97669) was established between the thermal conductivity and water absorption, demonstrating a significant dependence of thermal performance on moisture content.
where λ is the thermal conductivity of the AAFC(W/(m·K)), x is the mass water absorption (%); the results are shown in the figure below:
The thermal conductivity exhibited a significant dependence on mass water absorption, increasing by 105.31% from 0.1975 W/(m·K) in the dry state to 0.4055 W/(m·K) at 55% moisture content (Figure 1). A near-linear rapid rise occurred within 0–10% absorption, where the conductivity exceeded the target value by 37.35%. Given that the existing standards are inadequate for practical requirements [29], the mass water absorption is targeted at ≤5% based on a comprehensive analysis.
- (5)
- Frost Resistance
According to national standards, the frost resistance for the hot summer and cold winter ( non-central-heating) region is set as F25 [36], with the strength and mass loss rates serving as the secondary indicators.
2.2. Target Performance Indexes of AAFC
According to the requirements in Section 2.1, the target performance indices established in this study and the corresponding values are presented in the Table 1 below.
3. Mix Proportion Design Method for AAFC
3.1. Basic Principles
A mix proportion design method for AAFC was developed based on the volume method, which operates on the principle that the volume of the fresh slurry equals the sum of the volumes of all solid components and the entrapped air. In this approach, the target performance values are first established, followed by theoretical calculations of raw material dosages and experimental refinement. The dry density was selected as the primary design target because of its ease of control.
3.2. Design Steps and Calculation Methods for Mix Proportion
Based on the above principles, the mix proportion design steps for the AAFC are as follows:
- (1)
- The mass of each precursor component and other curable materials was determined according to the target dry density of the AAFC.
- (2)
- Determine the water-to-binder ratio, activator dosage, and additional water amount, based on the precursor dosage.
- (3)
- The volume of each constituent material in the slurry was calculated to determine the foam volume.
- (4)
- The foam mass was determined using the calculated foam volume and foam density.
- (5)
- The required foaming agent mass was calculated based on its dilution ratio and foam mass.
The mix proportion design relationship for the precursor (including silico-aluminate raw materials)–activator–physical foaming system is:
where ρd denotes the design dry density of AAFC (kg/m3); mpre represents the mass of precursor materials in 1 m3 of AAFC (kg); mact is the mass of the curable portion of the alkali activator in 1 m3 of AAFC (kg); mi denotes the mass of each additional curable raw material in 1 m3 of AAFC (kg); Sa is the mass coefficient determined by the total dry material mass of each component and the total non-evaporable matter in the finished product after curing of AAFC, with a range of 1.0 to 1.3, determined experimentally.
In the preparation of 1 m3 AAFC slurry, the sum of the volumes of silico-aluminate-containing precursor materials, activator, water required except for diluting the foaming agent, and other curable raw materials is denoted as V1, which is calculated using Eq.4; The portion where the slurry volume is less than 1 m3 is considered to be filled by foam, and the foam volume V2 can be calculated using Eq.5.
where V1 denotes the sum of the volumes of precursor materials, activator, water required except for diluting the foaming agent, and other curable raw materials (m3); mw represents the mass of water required except for diluting the foaming agent (kg); ρpre is the density of the precursor materials (kg/m3); ρact is the density of the prepared activator (kg/m3); ρw is the density of water (kg/m³), with a value of 1000 kg/m3; ρi denotes the respective densities of other curable raw materials in the AAFC (kg/m3).
where V2 denotes the foam content in 1 m3 of AAFC (m3/m3); k is the surplus coefficient, which should be determined according to the type and quality of the foaming agent, foam preparation time, etc., for foaming agents with good stability; the value range is 1.1 to 1.4; and the specific value is determined through experimental and theoretical analysis.
The dosage of the foaming agent mf in 1 m3 of AAFC can be calculated using Eq.6 and 7:
where mp denotes the mass of foam in 1 m3 of AAFC (kg) and ρfoam denotes the mass of foam in 1 m3 of FC (kg).
where mf denotes the dosage of foaming agent in 1 m3 of AAFC (kg) and β represents the dilution multiple of the foaming agent, which can be determined through experiments.
3.3. Test Raw Materials and
- (1)
- FA and activators
FA from Xuzhou China Resources Power Co., Ltd., was used as the primary raw material. A binary composite activator was prepared by mixing water glass (modulus=3.3, Baume degree =38.5°Be′) from Yourui Refractory Materials Co., Ltd. with sodium hydroxide (NaOH, ≥99% purity, IS-I grade) supplied by Shandong Binzhou Chemical Group Co., Ltd.
- (2)
- Foaming Agents
The HTQ-1 composite polymer foaming agent was supplied by Henan Huatai New Material Technology Co. Ltd. Its performance was tested in accordance with the national standards [37] under a foaming pressure of 0.5 MPa. The foaming performance parameters are listed in Table 2.
- (3)
- Lightweight Aggregate—Vitrified Microspheres
Lightweight aggregates can reduce density while enhancing mechanical properties. Vitrified microspheres (Figure 2(a)) from Hebei Yixin Energy Conservation and Thermal Insulation Building Materials Co., Ltd., were used, and their properties are listed in Table 3.
- (4)
- Basalt Fiber
The fibers enhanced the tensile strength of FC. Basalt fibers (Figure 2(b)) from Changsha Ningxiang Building Materials Co., Ltd. were used, and their properties are listed in Table 4.
- (5)
- Foam stabilizers.
Hydroxypropyl methylcellulose ether (HPMC) was used as the foam stabilizer. A white powder (Figure 2(c)) with a molecular weight of 86,000 and a viscosity of 200,000 effectively thickens the foam film and reduces defoaming or bubble merging.
- (6)
- Calcium Hydroxide
Low-calcium ash was used as the FA. Calcium hydroxide was added to enhance the mechanical properties of the AAFC. Calcium hydroxide powder (Figure 2(d)) was supplied by Nanjing Baore Chemical Co. Ltd.
- (7)
- Waterproofing agents.
The internally admixed waterproofing agent sodium methyl silicate solution, as shown in Figure 2(e), was produced by Shanxi Jing Chen Building Materials Co., Ltd.
- (8)
- SiO₂ Aerogel
The SiO₂ aerogel was supplied by Shenzhen Zhongning Technology Co., Ltd., and its performance parameters are summarized in Table 5 below.
The SiO2 aerogel appears as a white powder (Figure 3a) with an irregular particle morphology and a broad size distribution ranging from 3.78 to 37.1 μm (D90=37.1 μm), as shown in Figure 3(b–c). Its high specific surface area (707.8 m2/kg) and nanoscale surface roughness (amplitude ≈ 80 nm, Figure 3d) contribute to its effective thermal insulation, which stems from its nanoporous structure that markedly suppresses both solid conduction and gas convection [26,27].
3.4. Experimental Verification of Mix Proportion Design Method and Preliminary Mix Design
A preliminary mix design was conducted using the proposed method based on the upper dry density limit (650kg/m3). For 1 m3 AAFC, raw material dosages were calculated: foam from 40 times diluted foaming agent, alkali equivalent 0.1, empirical water-to-binder ratio 0.4, activator modulus 1.5, and curing at 55°C for seven days. The calculation results are listed in Table 6 below.
3.5. Testing and Results Analysis
The specimens were prepared according to the mix proportion and preparation process, and their relevant properties were tested. The test results are listed in Table 7.
Figure 4.
Test results of mechanical properties of preliminary mix ratio samples and deviation rates from the target values.
Figure 4.
Test results of mechanical properties of preliminary mix ratio samples and deviation rates from the target values.
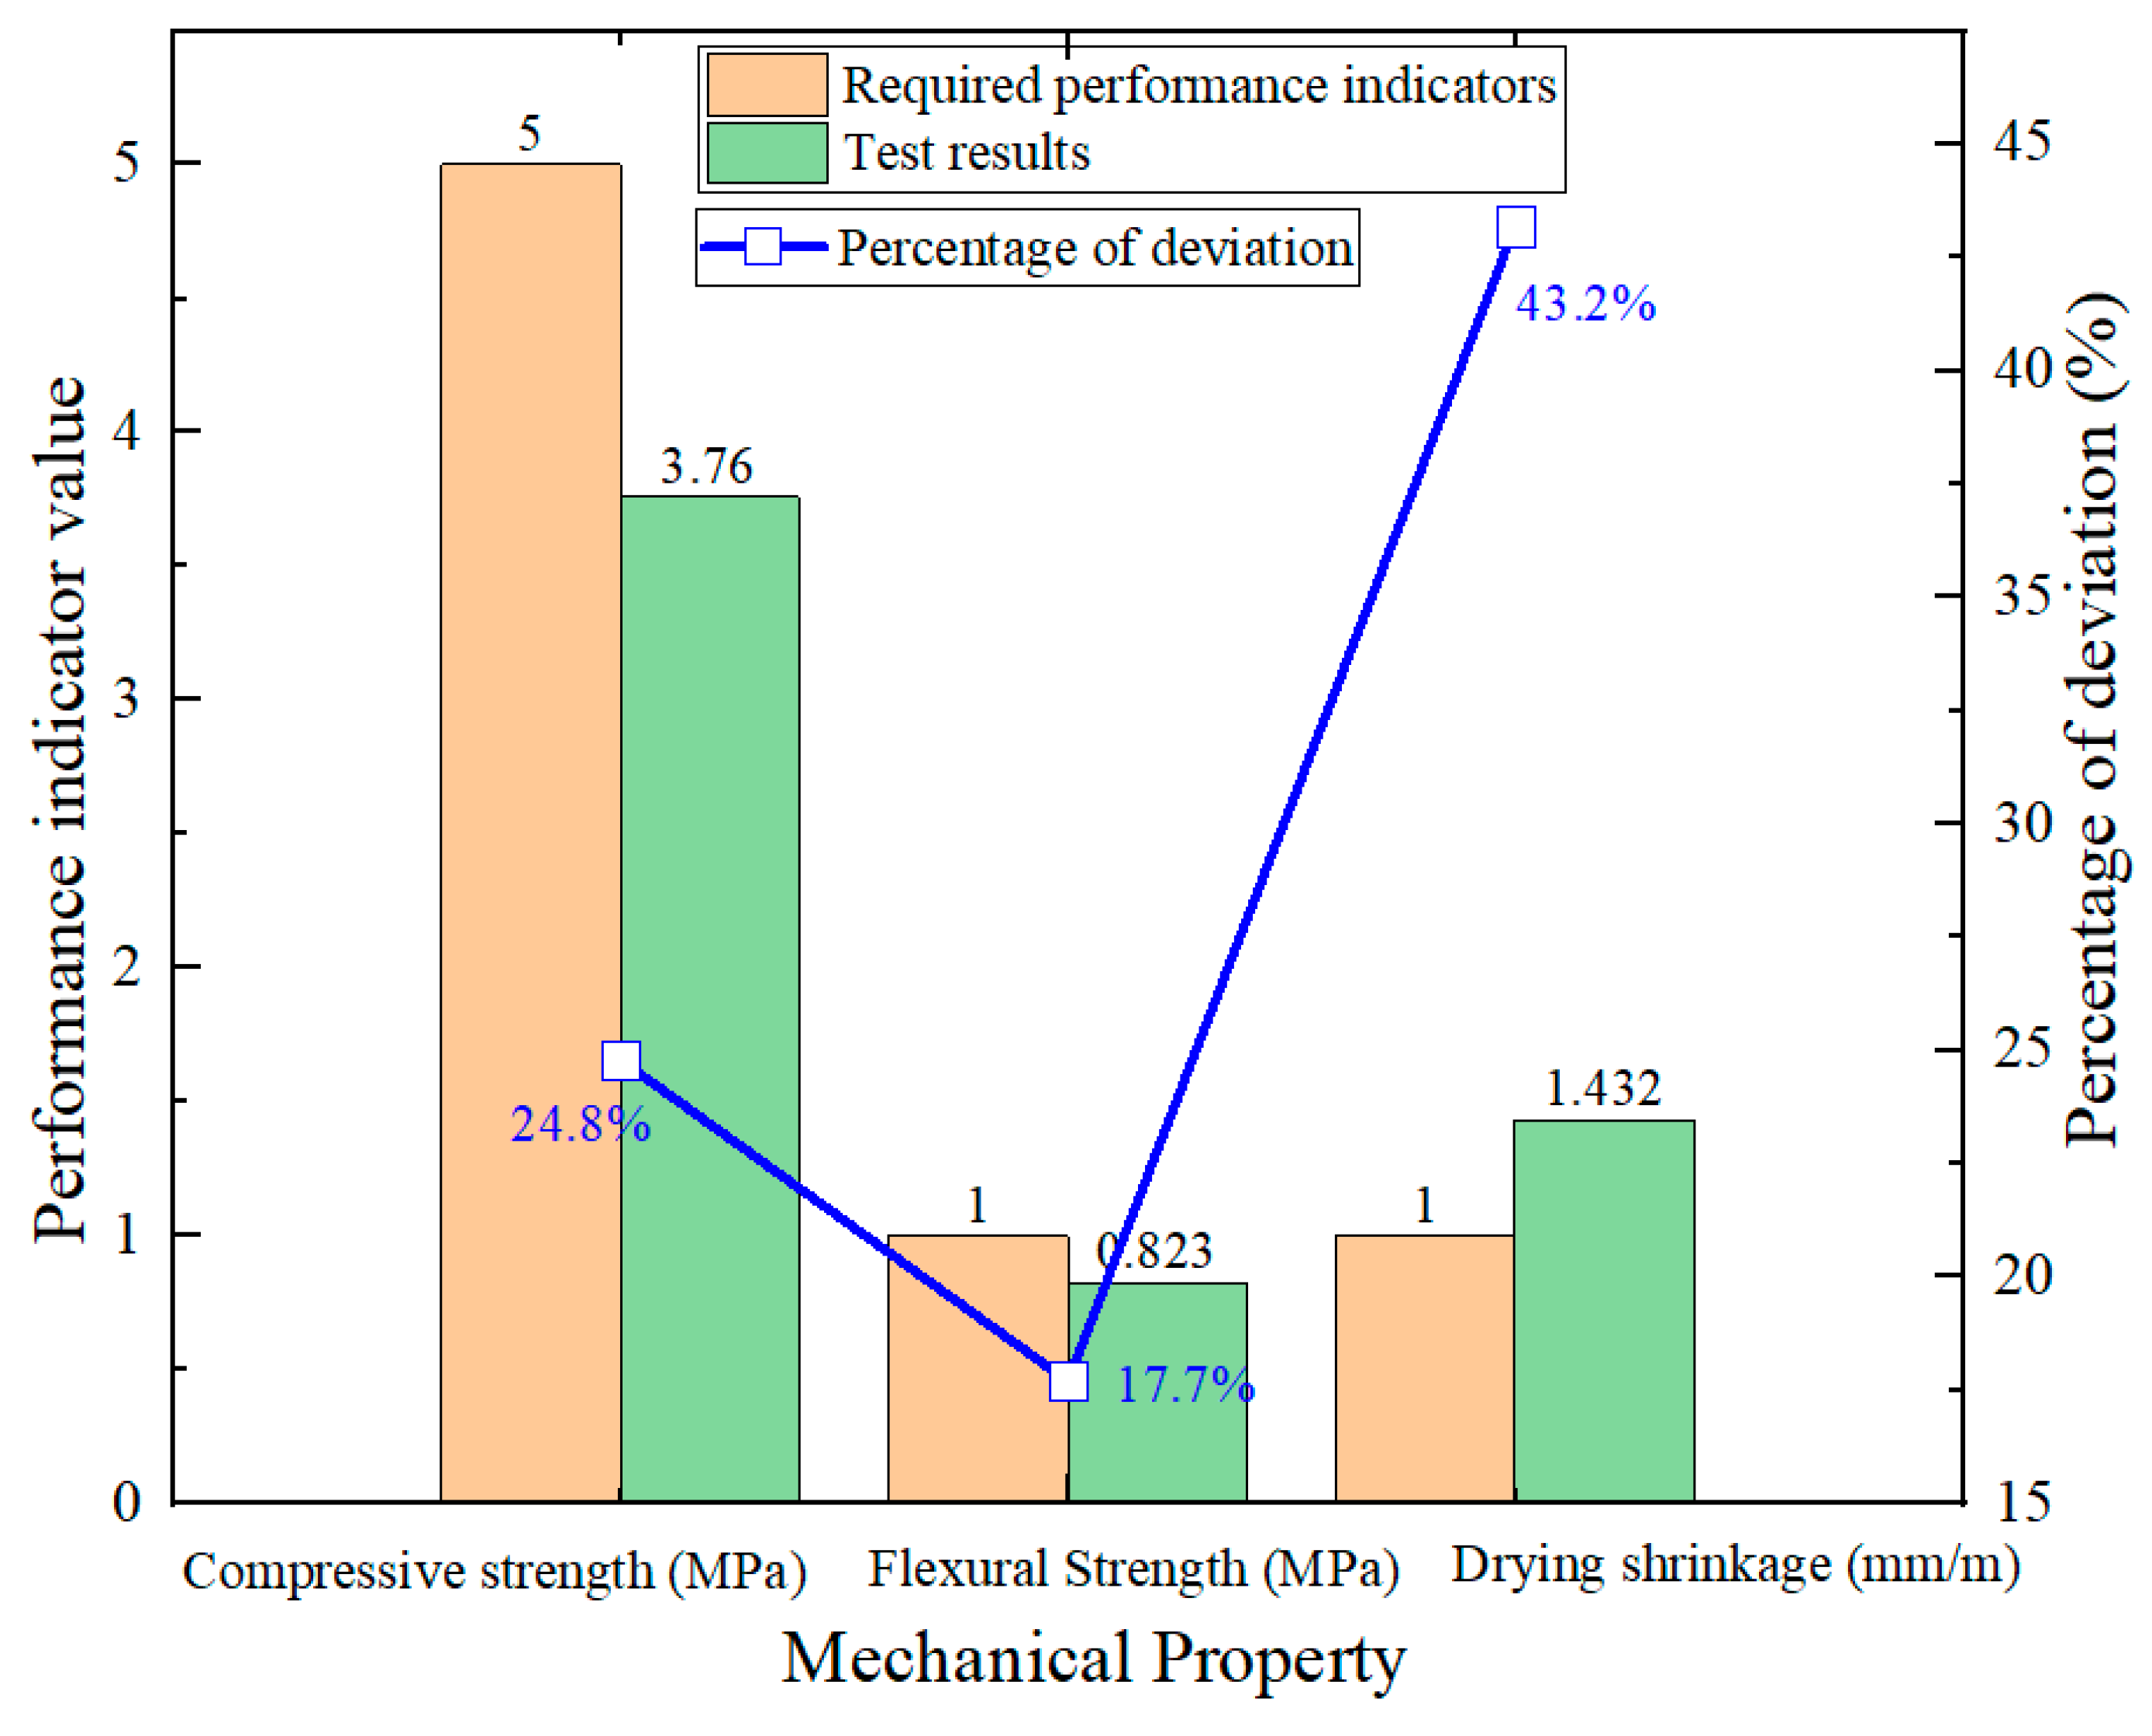
Figure 5.
Test results of frost resistance and thermal conductivity of the preliminary mix ratio samples and deviation rates from the target values.
Figure 5.
Test results of frost resistance and thermal conductivity of the preliminary mix ratio samples and deviation rates from the target values.
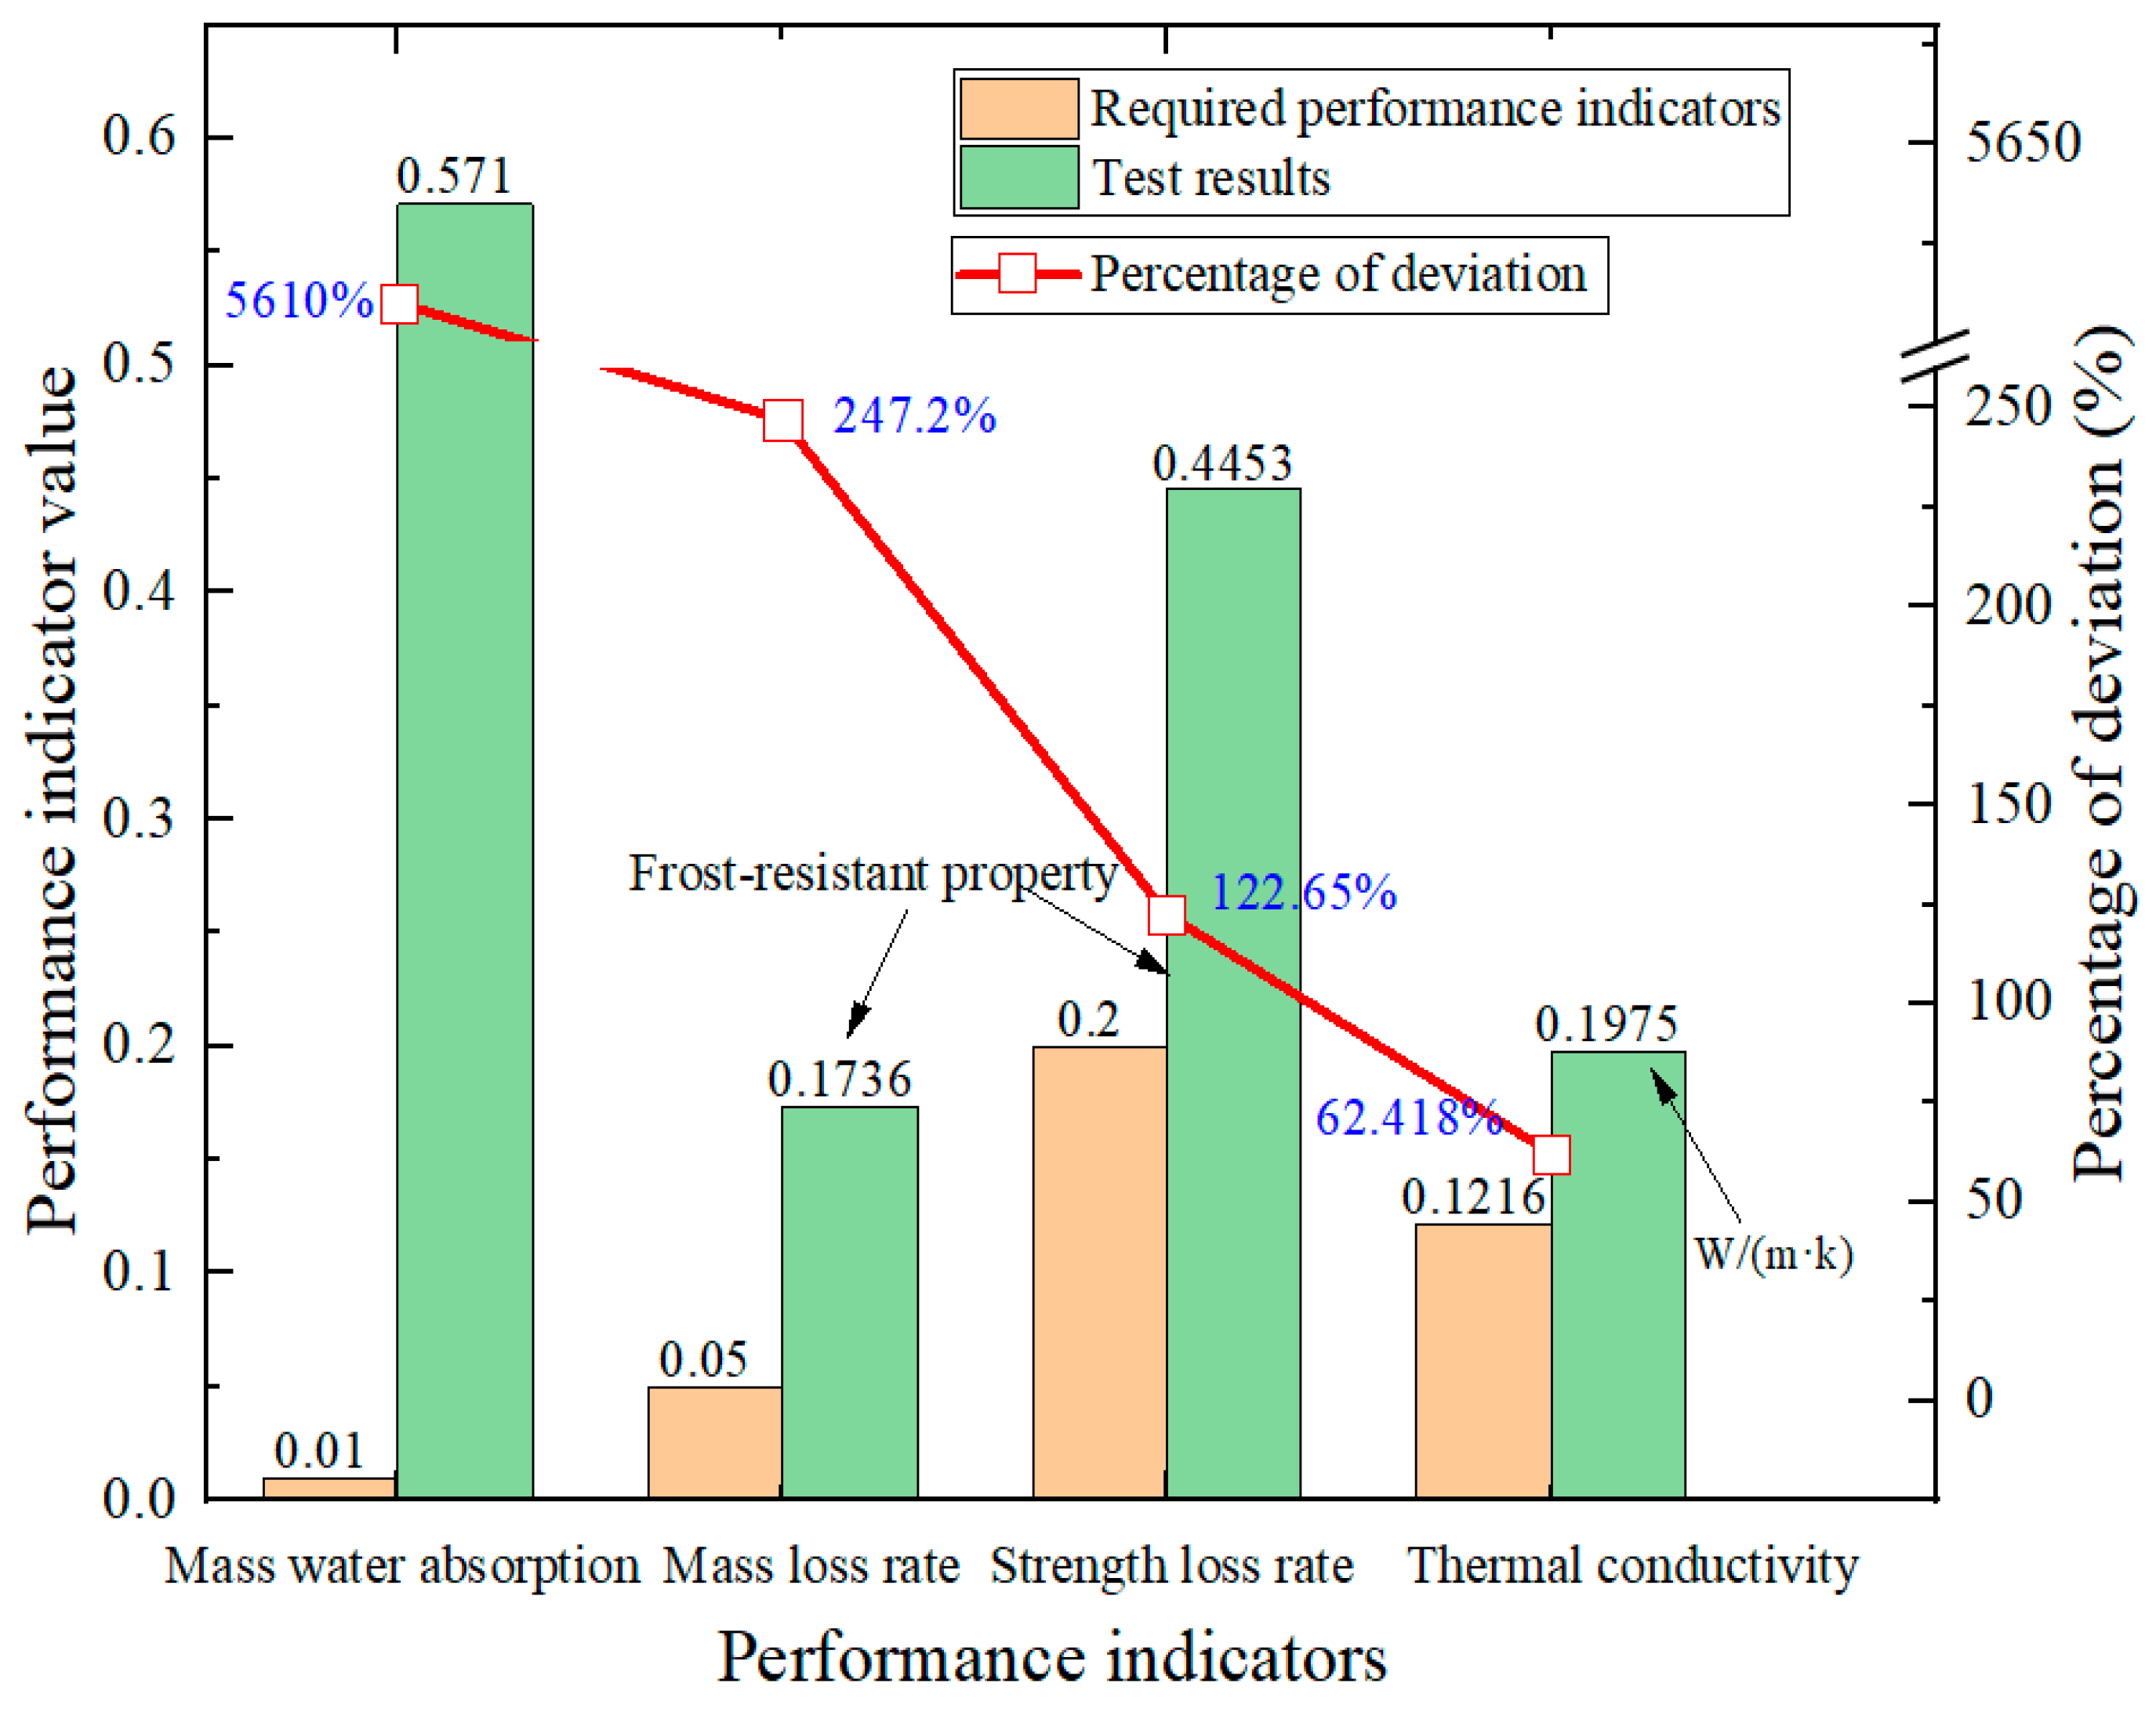
The preliminary mix specimens exhibited deficiencies in several key properties. The compressive strength (3.86 MPa), flexural strength (0.83 MPa), and drying shrinkage (1.432 mm/m) fell short of their target values by 24.8% and 17.7%, respectively, and exceeded their target values by 43.2%. The thermal conductivity reached 0.1975 W/(m·K), exceeding the limit by 62.4%, while the mass water absorption (57.1%) was 11.42 times the target value. Poor water resistance also led to excessive frost-induced damage, with the strength and mass loss rates surpassing their thresholds by 122.7% and 247.2%, respectively. Consequently, among all the properties evaluated, the feasibility of the design method was validated, but only the dry density met the target requirements, indicating the necessity for comprehensive formulation optimization.
4. Performance Optimization of AAFC Based on Orthogonal Experimental Design
4.1. Performance Optimization Methods and Schemes
Based on the Preliminary Mix, an L32 (48) orthogonal experiment was designed for comprehensive performance optimization. Eight variables were set at four levels. Considering foam loss, the foam volume dosage was 3.0–4.5times the theoretical value. A foam stabilizer was added at 1–3.5% of the foaming-agent mass. The SiO₂ aerogel was specifically used to enhance the thermal properties and as an internal waterproofing agent to optimize the water resistance. The aerogel dosage was in the range of 2–8 kg/m3. The calcium hydroxide and waterproofing agent dosages were based on the mass of FA. The vitrified microspheres, basalt fiber, and curing process used fixed parameters of 5% and 1% of FA mass for vitrified microspheres and basalt fiber, respectively.

Table 8.
Levels of factors.
| Level | Factors | |||||||
| Alkali Equivalent (A) | Activator Modulus (B) | Water-to-Binder Ratio (C) | Foam Dosage (D) | Foam Stabilizer Dosage (E) | Aerogel Dosage (F) | Calcium Hydroxide Dosage (G) | Waterproofing Agent Dosage (H) | |
| 1 | 0.08 | 0.9 | 0.40 | 3.0 | 1% | 2 | 5% | 1.5% |
| 2 | 0.09 | 1.1 | 0.45 | 3.5 | 1.5% | 4 | 10% | 3% |
| 3 | 0.10 | 1.3 | 0.55 | 4.0 | 2.5% | 6 | 15% | 4.5% |
| 4 | 0.11 | 1.5 | 0.60 | 4.5 | 3.5% | 8 | 20% | 5.5% |
4.2. Orthogonal Experimental Design
An orthogonal experimental design was constructed using the eight variables mentioned above, each at four levels. The factor-level table and orthogonal array are provided below:
Table 9.
Orthogonal experimental design table for L32 (48).
| NO. | Factors | ||||||||
| Alkali Equivalent (A) | Activator Modulus (B) | Water-to-Binder Ratio (C) | Foam Dosage (D) | Foam Stabilizer Dosage (E) | Aerogel Dosage (F) | Calcium Hydroxide Dosage (G) | Waterproofing Agent Dosage (H) | Empty Column (J) | |
| 1 | 1 (0.08) | 1 (0.9) | 1 (0.40) | 1 (3.0) | 1 (1%) | 1 (2) | 1 (5%) | 1 (1.5%) | 1 |
| 2 | 1 | 1 | 2 (0.45) | 2 (3.5) | 4 (3.5%) | 4 (8) | 3 (15%) | 3 (4.5%) | 2 |
| 3 | 1 | 2 (1.1) | 3 (0.55) | 4 (4.5) | 1 | 2 (4) | 3 | 4 (5.5%) | 3 |
| 4 | 1 | 2 | 4 (0.60) | 3 (4.0) | 4 | 3 (6) | 1 | 2 (3%) | 4 |
| 5 | 1 | 3 (1.3) | 1 | 3 | 2 (1.5%) | 4 | 2 (10%) | 4 | 4 |
| 6 | 1 | 3 | 2 | 4 | 3 (2.5%) | 1 | 4 (20%) | 2 | 3 |
| 7 | 1 | 4 (1.5) | 3 | 2 | 2 | 3 | 4 | 1 | 2 |
| 8 | 1 | 4 | 4 | 1 | 3 | 2 | 2 | 3 | 1 |
| 9 | 2 (0.09) | 1 | 3 | 4 | 3 | 4 | 2 | 1 | 4 |
| 10 | 2 | 1 | 4 | 3 | 2 | 1 | 4 | 3 | 3 |
| 11 | 2 | 2 | 1 | 1 | 3 | 3 | 4 | 4 | 2 |
| 12 | 2 | 2 | 2 | 2 | 2 | 2 | 2 | 2 | 1 |
| 13 | 2 | 3 | 3 | 2 | 4 | 1 | 1 | 4 | 1 |
| 14 | 2 | 3 | 4 | 1 | 1 | 4 | 3 | 2 | 2 |
| 15 | 2 | 4 | 1 | 3 | 4 | 2 | 3 | 1 | 3 |
| 16 | 2 | 4 | 2 | 4 | 1 | 3 | 1 | 3 | 4 |
| 17 | 3 (0.10) | 1 | 3 | 1 | 4 | 2 | 4 | 2 | 3 |
| 18 | 3 | 1 | 4 | 2 | 1 | 3 | 2 | 4 | 4 |
| 19 | 3 | 2 | 1 | 4 | 4 | 1 | 2 | 3 | 1 |
| 20 | 3 | 2 | 2 | 3 | 1 | 4 | 4 | 1 | 2 |
| 21 | 3 | 3 | 3 | 3 | 3 | 3 | 3 | 3 | 2 |
| 22 | 3 | 3 | 4 | 4 | 2 | 2 | 1 | 1 | 1 |
| 23 | 3 | 4 | 1 | 2 | 3 | 4 | 1 | 2 | 4 |
| 24 | 3 | 4 | 2 | 1 | 2 | 1 | 3 | 4 | 3 |
| 25 | 4 (0.11) | 1 | 1 | 4 | 2 | 3 | 3 | 2 | 2 |
| 26 | 4 | 1 | 2 | 3 | 3 | 2 | 1 | 4 | 1 |
| 27 | 4 | 2 | 3 | 1 | 2 | 4 | 1 | 3 | 4 |
| 28 | 4 | 2 | 4 | 2 | 3 | 1 | 3 | 1 | 3 |
| 29 | 4 | 3 | 1 | 2 | 1 | 2 | 4 | 3 | 3 |
| 30 | 4 | 3 | 2 | 1 | 4 | 3 | 2 | 1 | 4 |
| 31 | 4 | 4 | 3 | 3 | 1 | 1 | 2 | 2 | 1 |
| 32 | 4 | 4 | 4 | 4 | 4 | 4 | 4 | 4 | 2 |
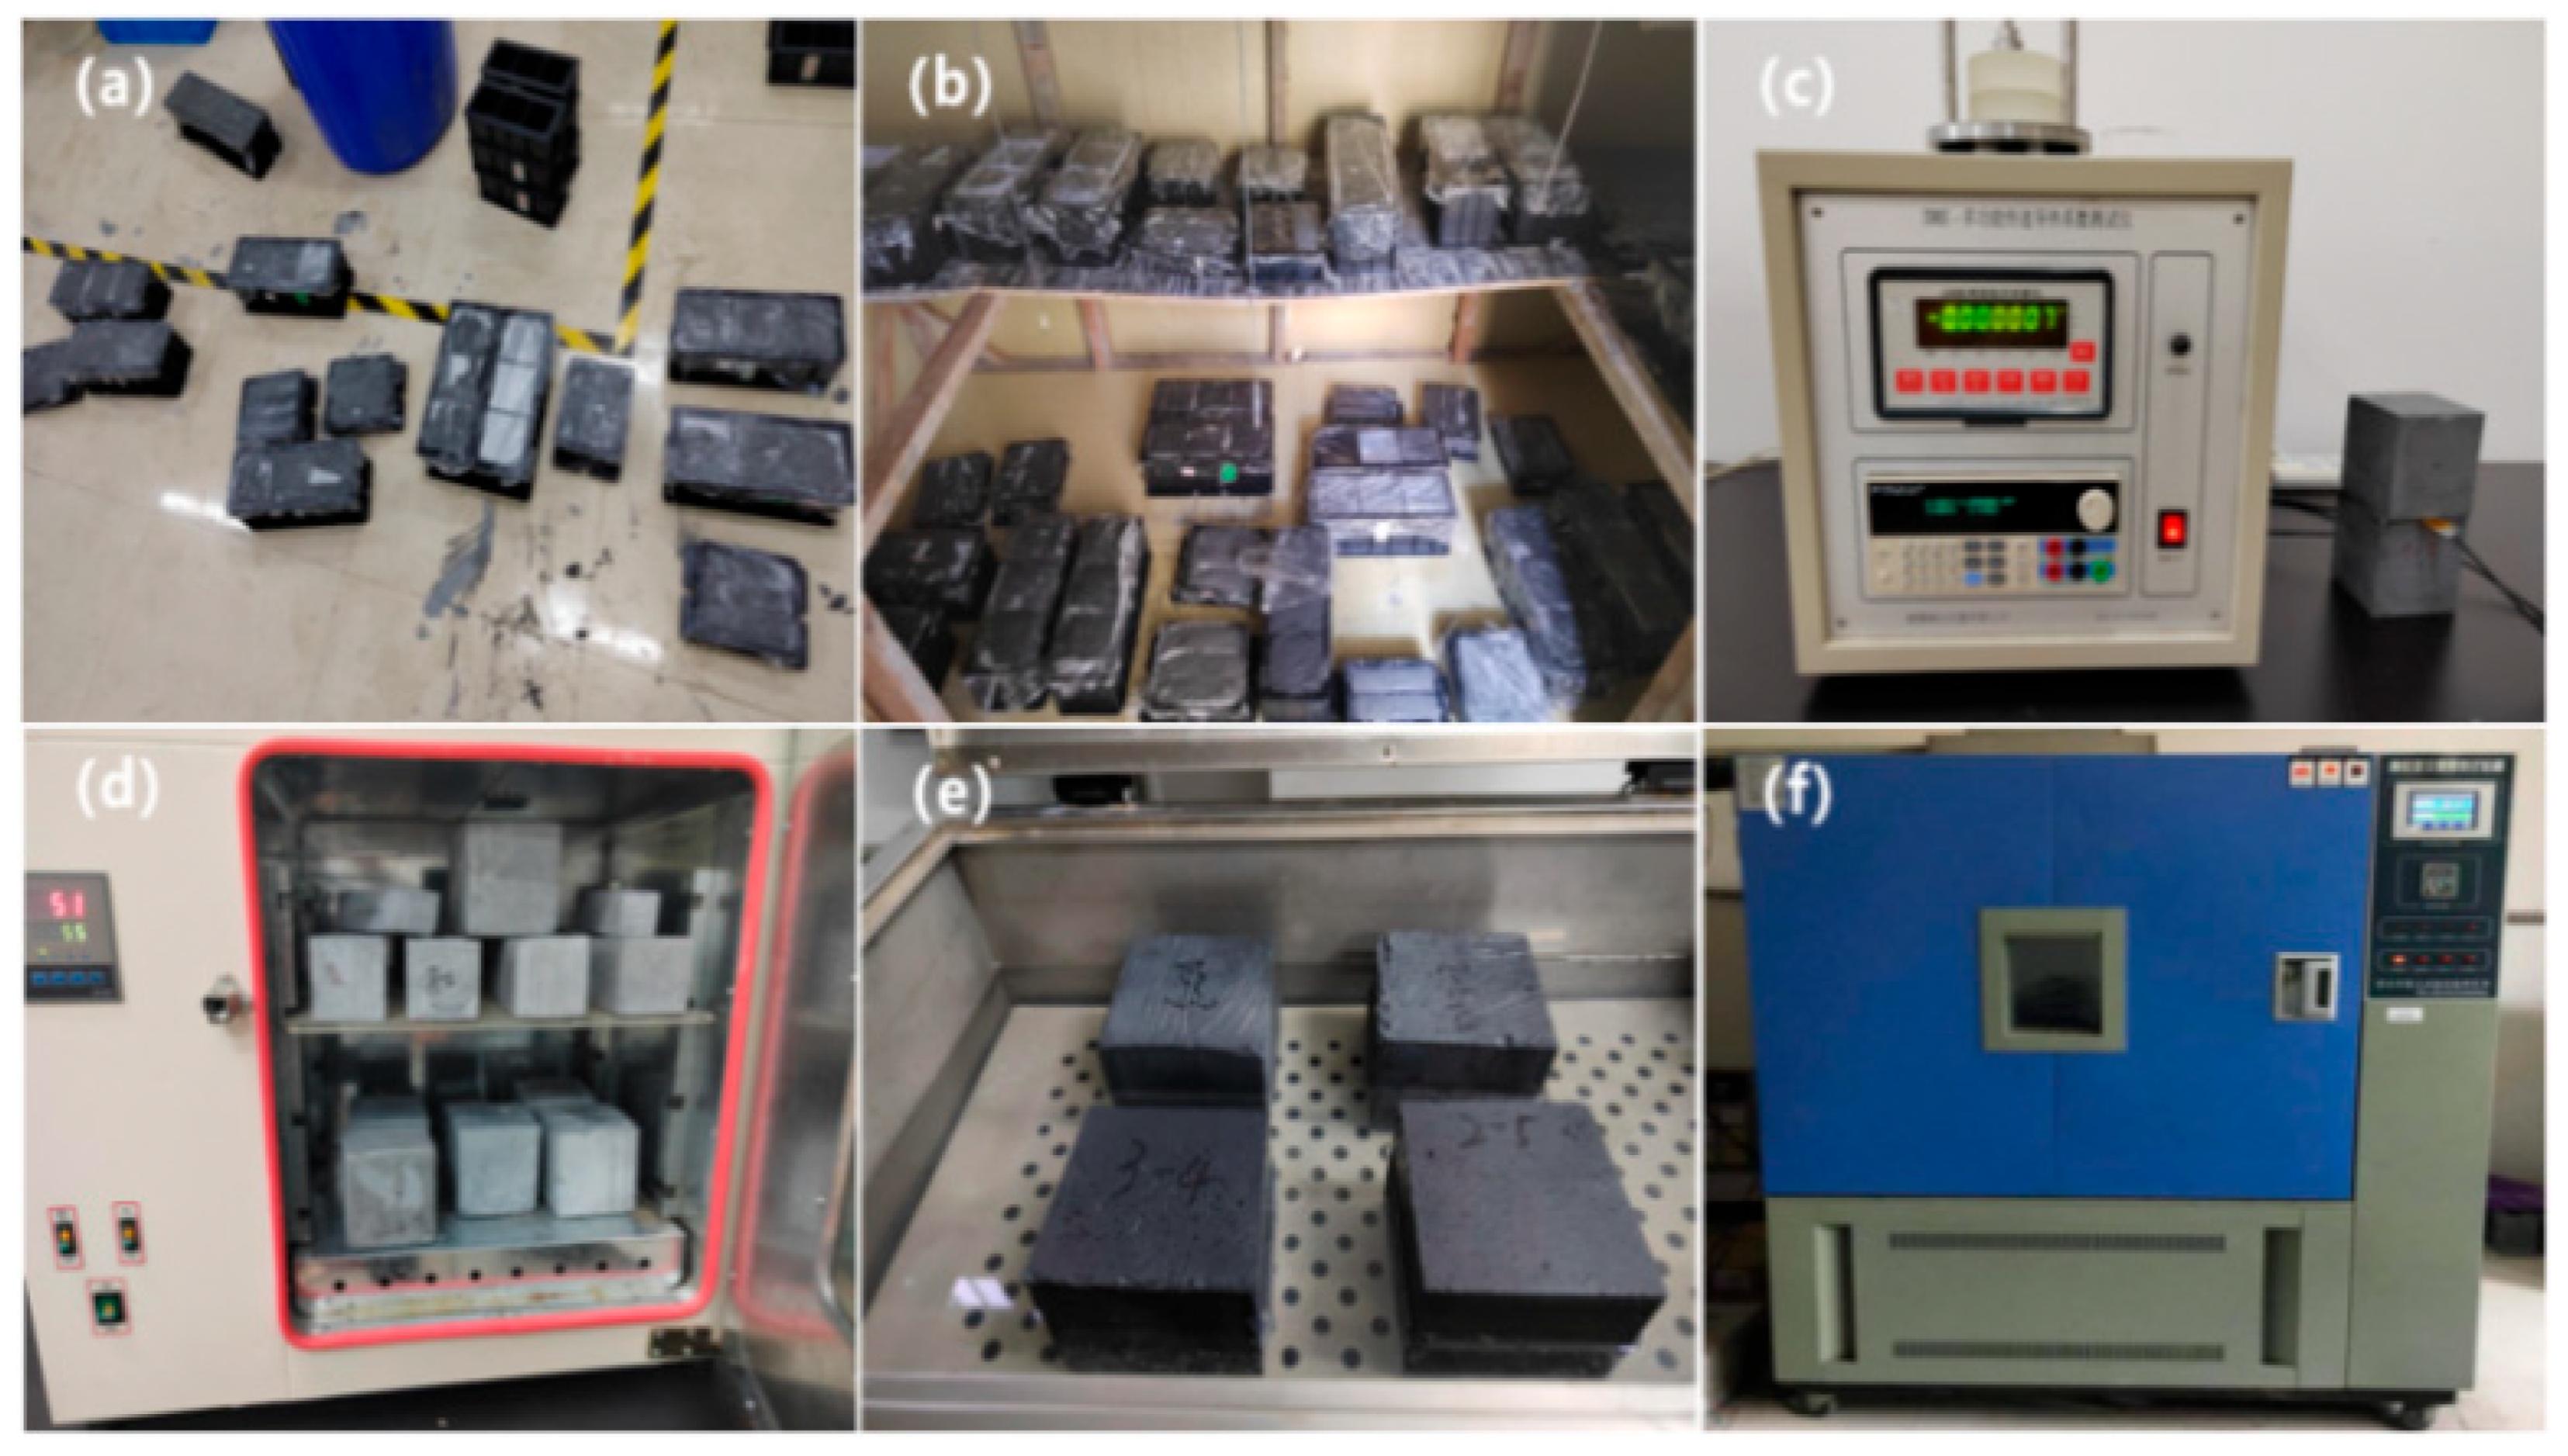
Specimens were prepared according to the mix proportions listed in Table 9. The preparation and testing processes are shown in the figure below, and the performance test results for the specimens are listed in Table 10.
Figure 6.
Samples preparation and testing, (a) samples preparation,(b) curing,(c) thermal conductivity measurement,(d) samples drying,(e) water absorption test, (f) frost resistance test.
Figure 6.
Samples preparation and testing, (a) samples preparation,(b) curing,(c) thermal conductivity measurement,(d) samples drying,(e) water absorption test, (f) frost resistance test.
As shown in the table, the 32 mix proportion samples exhibited dry densities of 556.83–655.77 kg/m³, with only two slightly exceeding the target. The thermal conductivity ranged from a minimum of 0.0929 W/(m·K) (sample 32) to a maximum of 0.1377 W/(m·K) (sample 1); only samples 1, 13, and 31 marginally exceeded the target. The mechanical properties and freeze-thaw resistance (F25) met these requirements. The lowest mass of water absorption was 4.12% (below the target), although 13 samples exceeded the target. Further analysis is required to identify the optimal mix for achieving the best comprehensive performance.
4.3. Analysis of Influences of Different Factors on Performance
4.3.1. Range Analysis of Test Results
- (1)
- Range Analysis of Dry Density
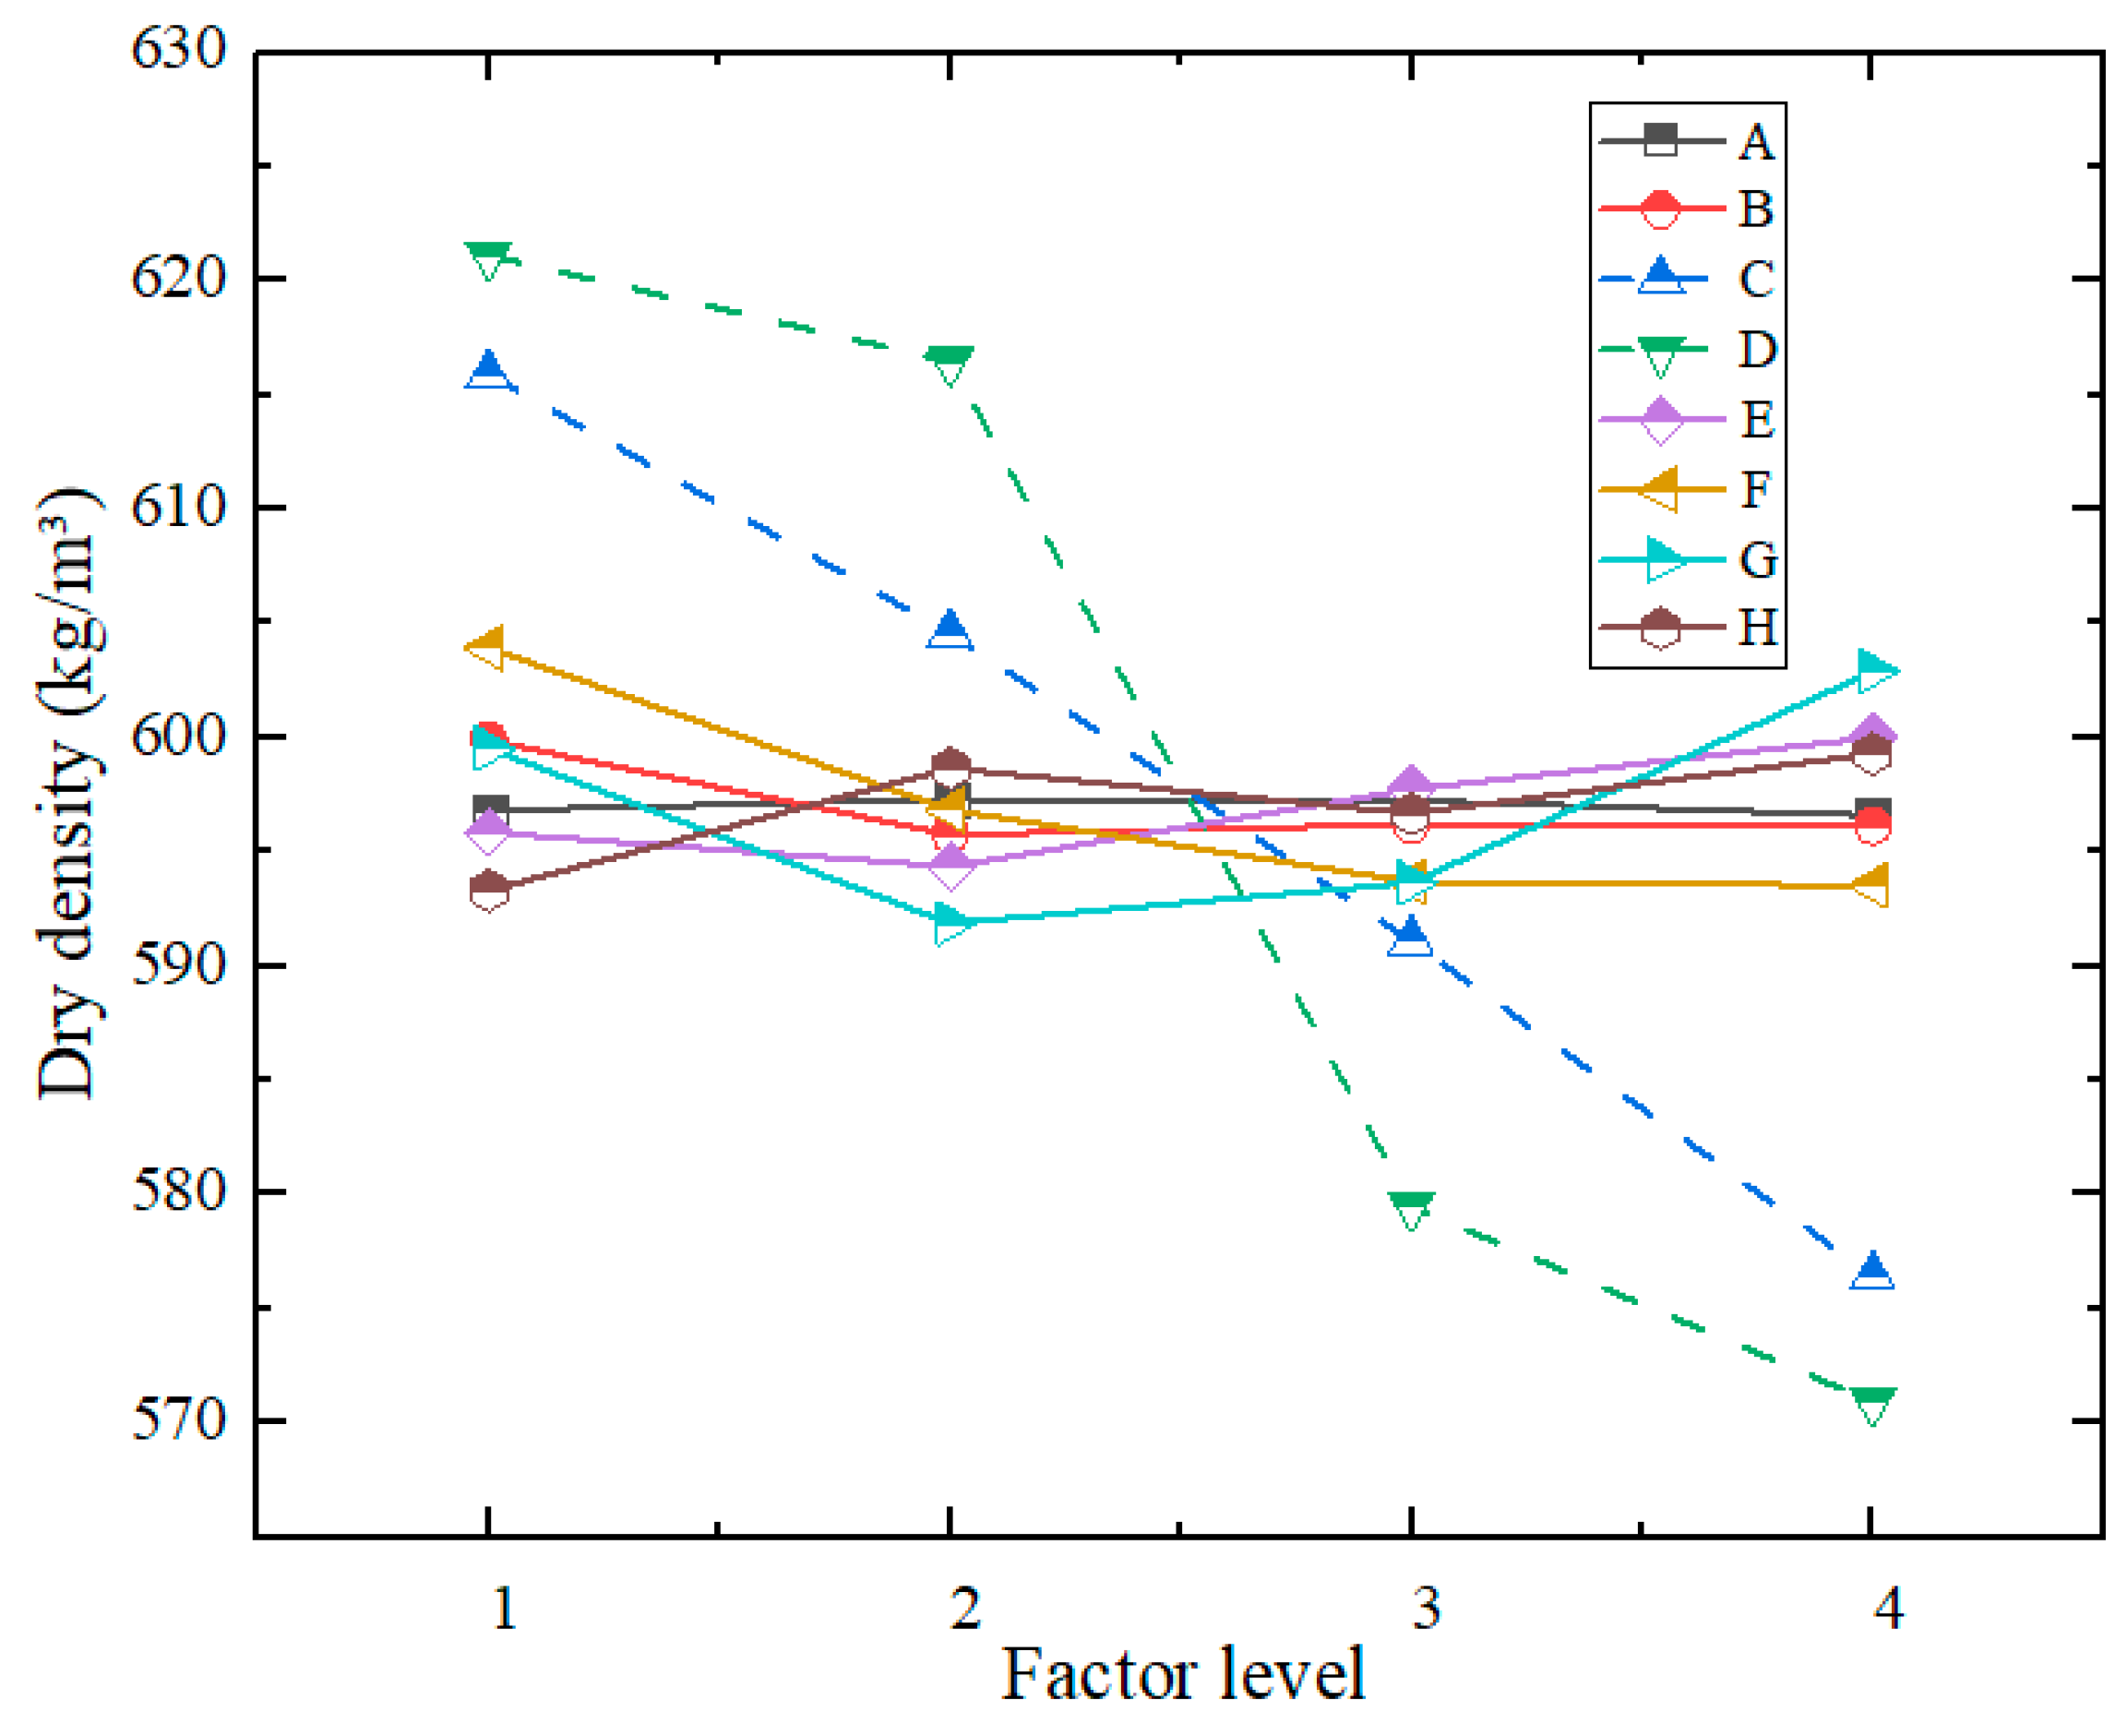
The range (R) values reveal that the foam content and water-binder ratio are the primary factors influencing dry density, with curves showing the steepest slopes. In contrast, the aerogel content and calcium hydroxide content are secondary factors, while the remaining factors have minimal impacts.
Table 11.
Results of dry density range analysis.
| Index | Factors | |||||||||
| A | B | C | D | E | F | G | H | Empty Column | ||
| Dry Density (kg/m³) | K11 | 4774.53 | 4798.98 | 4927.13 | 4968.90 | 4766.83 | 4831.29 | 4796.23 | 4746.49 | 4790.03 |
| K12 | 4778.42 | 4766.03 | 4836.45 | 4931.66 | 4754.90 | 4774.60 | 4735.01 | 4789.31 | 4789.73 | |
| K13 | 4777.99 | 4769.53 | 4728.79 | 4635.85 | 4781.93 | 4749.58 | 4749.11 | 4773.36 | 4795.16 | |
| K14 | 4772.68 | 4769.08 | 4611.25 | 4567.21 | 4799.96 | 4748.15 | 4823.27 | 4794.46 | 4789.77 | |
| k11 | 596.82 | 599.87 | 615.89 | 621.11 | 595.85 | 603.91 | 599.53 | 593.31 | 598.75 | |
| k12 | 597.30 | 595.75 | 604.56 | 616.46 | 594.36 | 596.83 | 591.88 | 598.66 | 598.72 | |
| k13 | 597.25 | 596.19 | 591.10 | 579.48 | 597.74 | 593.70 | 593.64 | 596.67 | 599.40 | |
| k14 | 596.59 | 596.14 | 576.41 | 570.90 | 600.00 | 593.52 | 602.91 | 599.31 | 598.72 | |
| R | 0.72 | 4.12 | 39.49 | 50.21 | 5.63 | 10.39 | 11.03 | 6.00 | 0.68 | |
| Optimal Level |
2 | 1 | 1 | 1 | 4 | 1 | 4 | 4 | ||
Note: Kij represents the sum of test results corresponding to level j in any factor column under the performance index i. kij denotes the average value of test results for level number j in any factor column.
Figure 7.
Dry density of AAFC varies with the levels of various factors.
- (2)
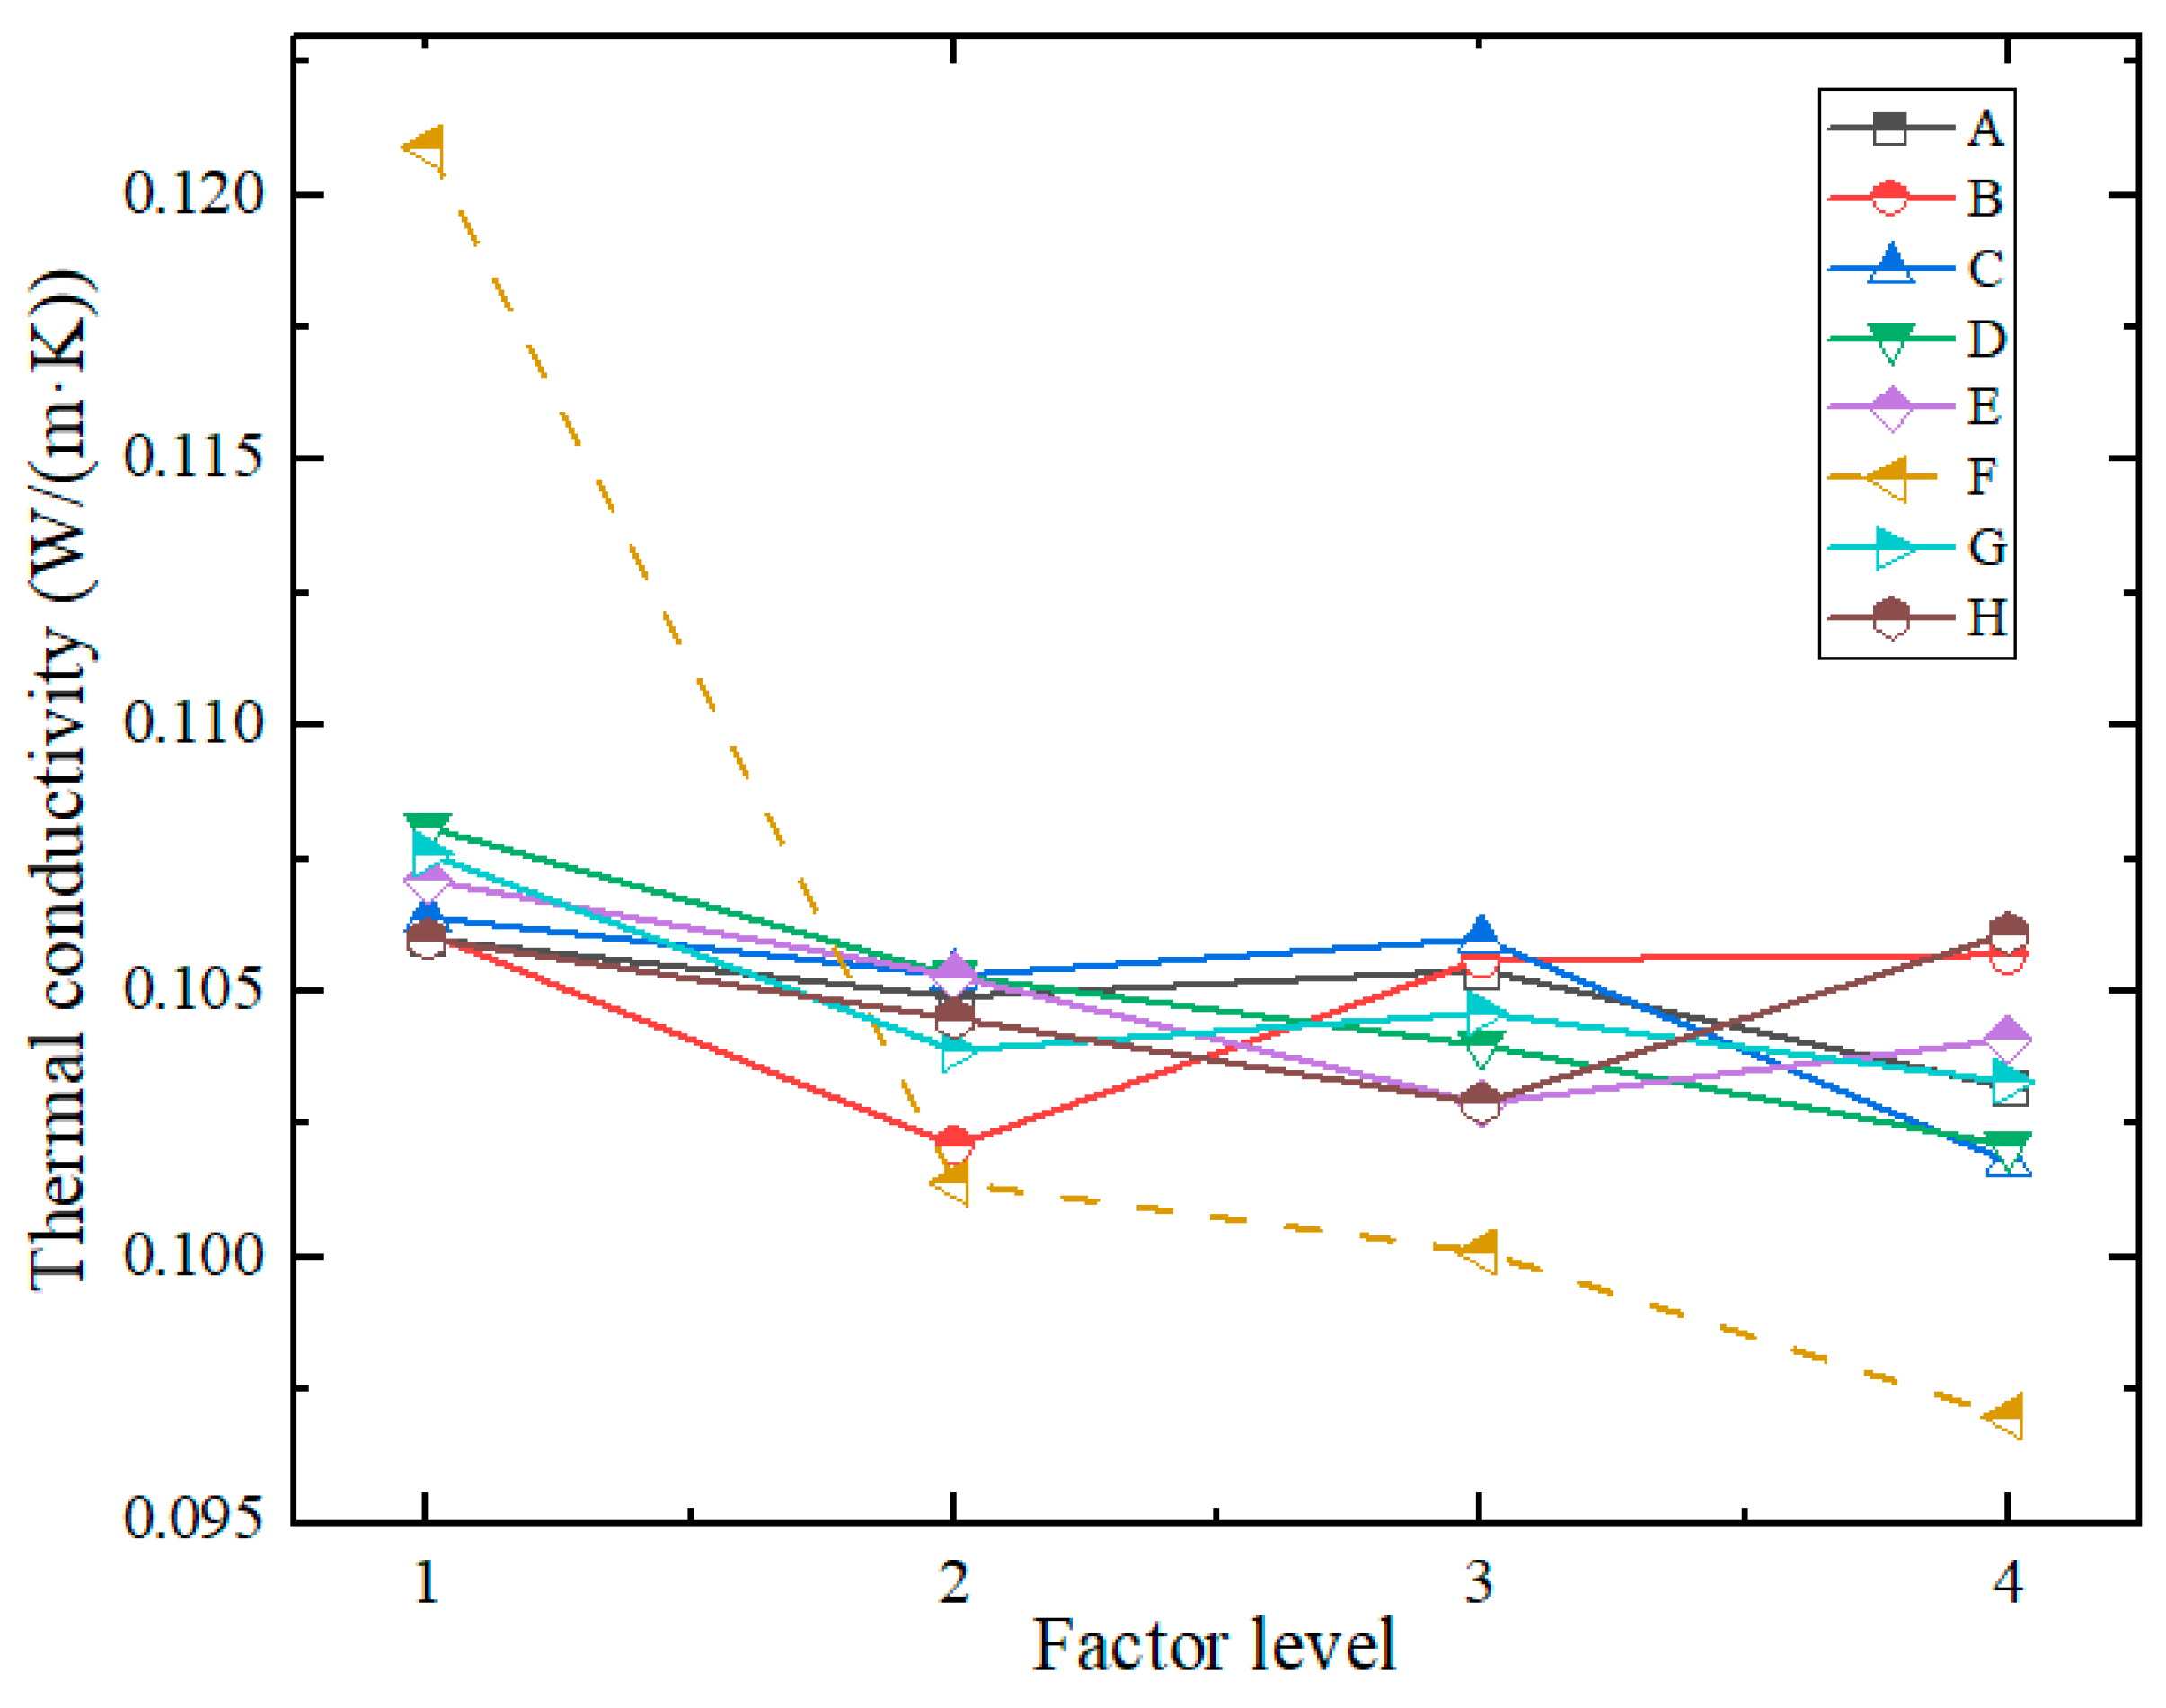
- Range Analysis of Thermal Conductivity
The thermal conductivity decreased with increasing foam and aerogel content. The curve slope for aerogel content was the steepest, indicating the greatest influence magnitude, significantly exceeding the other factors. This demonstrates that aerogel, as a super-insulating material, can remarkably reduce the thermal conductivity of FC. Foam content is the next most influential factor, and is well documented[38,39,40]. Other factors exerted minimal effects.
Table 12.
Results of thermal conductivity range analysis.
| Index | Factors | |||||||||
| A | B | C | D | E | F | G | H | Empty Column | ||
| Thermal Conductivity (W/(m·K)) | K21 | 0.8484 | 0.8486 | 0.8510 | 0.8645 | 0.8564 | 0.9671 | 0.8610 | 0.8478 | 0.8035 |
| K22 | 0.8388 | 0.8169 | 0.8421 | 0.8422 | 0.8426 | 0.8113 | 0.8310 | 0.8358 | 0.7887 | |
| K23 | 0.8430 | 0.8447 | 0.8484 | 0.8319 | 0.8236 | 0.8010 | 0.8371 | 0.8233 | 0.8049 | |
| K24 | 0.8254 | 0.8454 | 0.8141 | 0.8170 | 0.8330 | 0.7761 | 0.8265 | 0.8486 | 0.7885 | |
| k21 | 0.1060 | 0.1061 | 0.1064 | 0.1081 | 0.1071 | 0.1209 | 0.1076 | 0.1060 | 0.1004 | |
| k22 | 0.1049 | 0.1021 | 0.1053 | 0.1053 | 0.1053 | 0.1014 | 0.1039 | 0.1045 | 0.0986 | |
| k23 | 0.1054 | 0.1056 | 0.1060 | 0.1040 | 0.1029 | 0.1001 | 0.1046 | 0.1029 | 0.1006 | |
| k24 | 0.1032 | 0.1057 | 0.1018 | 0.1021 | 0.1041 | 0.0970 | 0.1033 | 0.1061 | 0.0986 | |
| R | 0.0029 | 0.0040 | 0.0046 | 0.0059 | 0.0041 | 0.0239 | 0.0043 | 0.0032 | 0.0021 0.0021 |
|
| Optimal Level |
4 | 2 | 4 | 4 | 3 | 4 | 4 | 3 | ||
Figure 8.
Thermal conductivity of AAFC varies with the levels of various factors.
- (3)
- Mass Water Absorption Rate
Analysis of the range values (R) and curves in Figure 9 shows that the waterproofing agent dosage was the most significant factor affecting the mass water absorption rate, which decreased significantly with increasing dosage. Compared with previous studies, the waterproofing performance has been effectively improved[9]. Foam content was the next most influential factor, although the range value (R) of the former was approximately 2.7 times that of the latter. Factors such as activator modulus, water-binder ratio, and calcium hydroxide content showed negligible effects.
Table 13.
Results of mass water absorption rate range analysis.
| Index | Factors | |||||||||
| A | B | C | D | E | F | G | H | Empty Column | ||
| Mass Water Absorption Rate(%) | K31 | 107.210 | 107.416 | 106.121 | 98.576 | 102.751 | 107.851 | 106.806 | 127.835 | 108.301 |
| K32 | 109.207 | 101.146 | 96.030 | 105.642 | 109.775 | 106.910 | 103.246 | 109.090 | 103.271 | |
| K33 | 102.181 | 103.661 | 109.311 | 102.950 | 106.476 | 103.552 | 107.170 | 92.385 | 106.46 | |
| K34 | 101.185 | 107.560 | 108.321 | 112.615 | 100.781 | 101.470 | 102.561 | 90.473 | 101.751 | |
| k31 | 13.401 | 13.427 | 13.265 | 12.322 | 12.844 | 13.481 | 13.351 | 15.979 | 13.538 | |
| k32 | 13.651 | 12.643 | 12.004 | 13.205 | 13.722 | 13.364 | 12.906 | 13.636 | 12.909 | |
| k33 | 12.773 | 12.958 | 13.664 | 12.869 | 13.310 | 12.944 | 13.396 | 11.548 | 13.308 | |
| k34 | 12.648 | 13.445 | 13.540 | 14.077 | 12.598 | 12.684 | 12.820 | 11.309 | 12.719 | |
| R | 1.003 | 0.802 | 1.660 | 1.755 | 1.124 | 0.798 | 0.576 | 4.670 | 0.819 | |
| Optimal Level |
4 | 2 | 2 | 1 | 4 | 4 | 4 | 4 | ||
- (4)
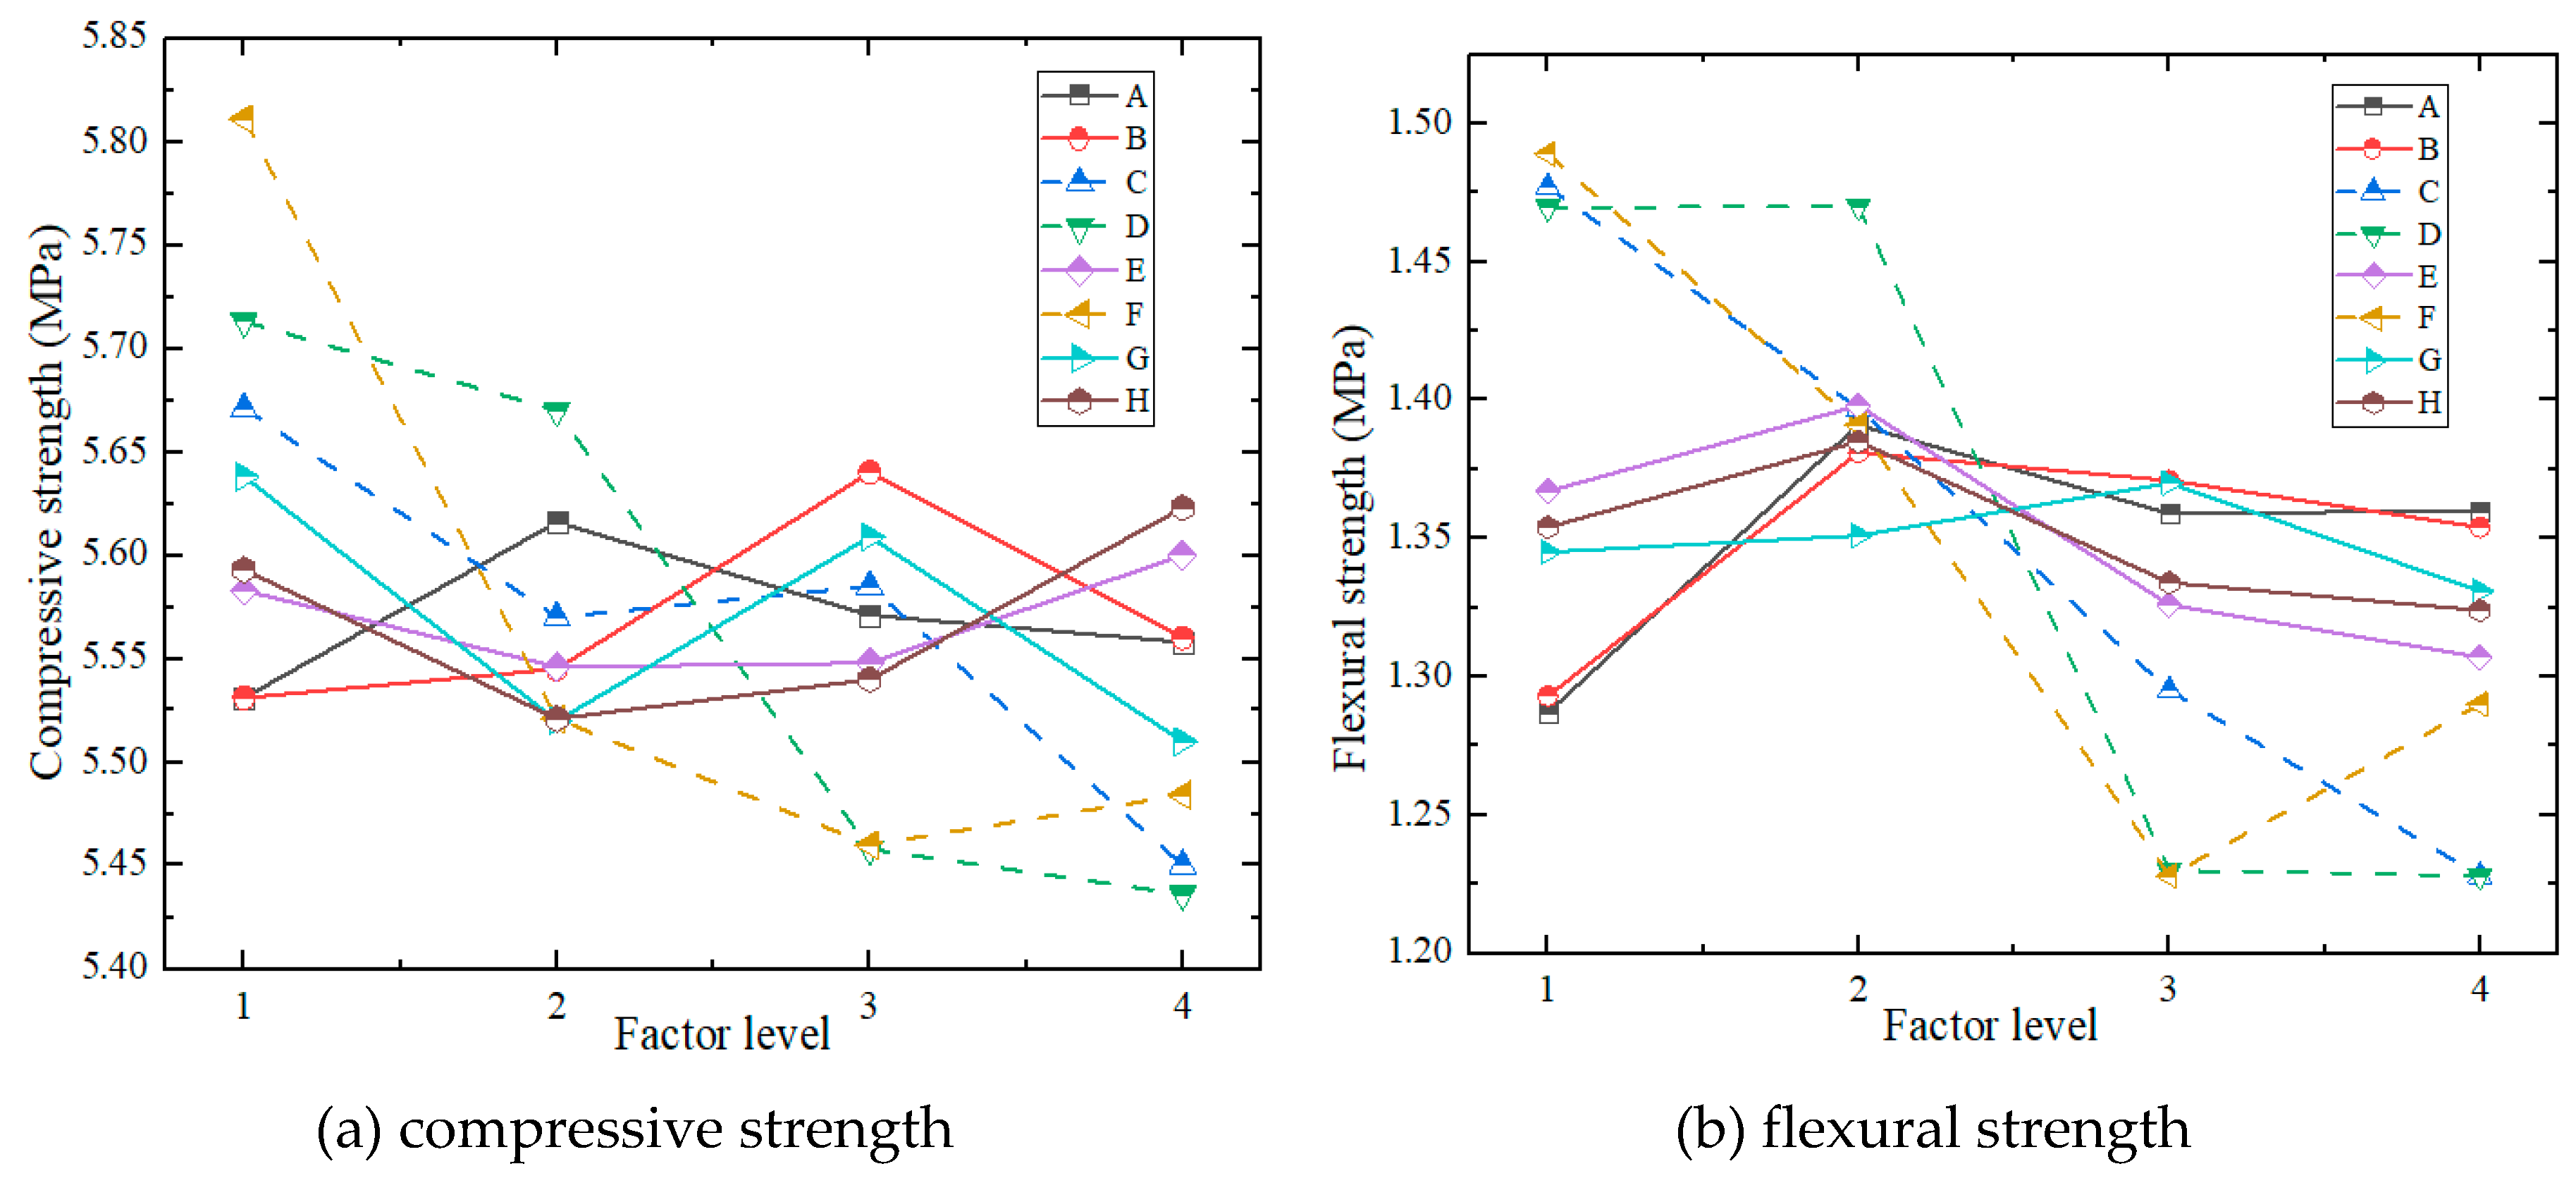
- Mechanical Properties
Analysis of the range values (R) for compressive and flexural strengths (Table 14, Table 15 and Table 16) reveals that aerogel content, foam content, and water-binder ratio are the three most influential factors. The foam stabilizer dosage had the least significant effect on the compressive strength, while calcium hydroxide content had a relatively minor influence on the flexural strength. As shown in the curves in Figure 9, both the compressive and flexural strengths decrease significantly with increasing foam content, aerogel content, and water-binder ratio. A higher foam content introduces more air bubbles into the solid matrix, which increases the porosity and degrades the mechanical properties. The hydration products (C(N)-A-S-H) are critical for the strength development of AAFC[41,42]. Appropriate addition of calcium hydroxide can increase the proportion of C-A-S-H in the hydration products[43], thereby improving the mechanical properties. The effect of foam stabilizer dosage on the mechanical properties follows a pattern of first decreased and then increased. As a surfactant, an appropriate amount of stabilizer improves the stability of bubble membranes, prolongs their rupture half-life, and controls the bubble uniformity, size, and quantity in the slurry to enhance the mechanical properties[44].
Figure 10.
Mechanical properties of AAFC varies with the levels of various factors.
Range analysis indicated that foam content was the most dominant factor influencing drying shrinkage, followed by the water–binder ratio, with other factors having negligible effects. As shown in Figure 11, the drying shrinkage decreases nearly linearly with increasing foam content, which is attributable to the increased porosity, which reduces the solid phase fraction and thus the autogenous shrinkage of the AA matrix. In contrast, drying shrinkage increases with the water–binder ratio; higher ratios improve workability but also increase macroporosity and connectivity, accelerating moisture loss and capillary evaporation. The resulting capillary pressure difference further intensifies the shrinkage stress.
- (5)
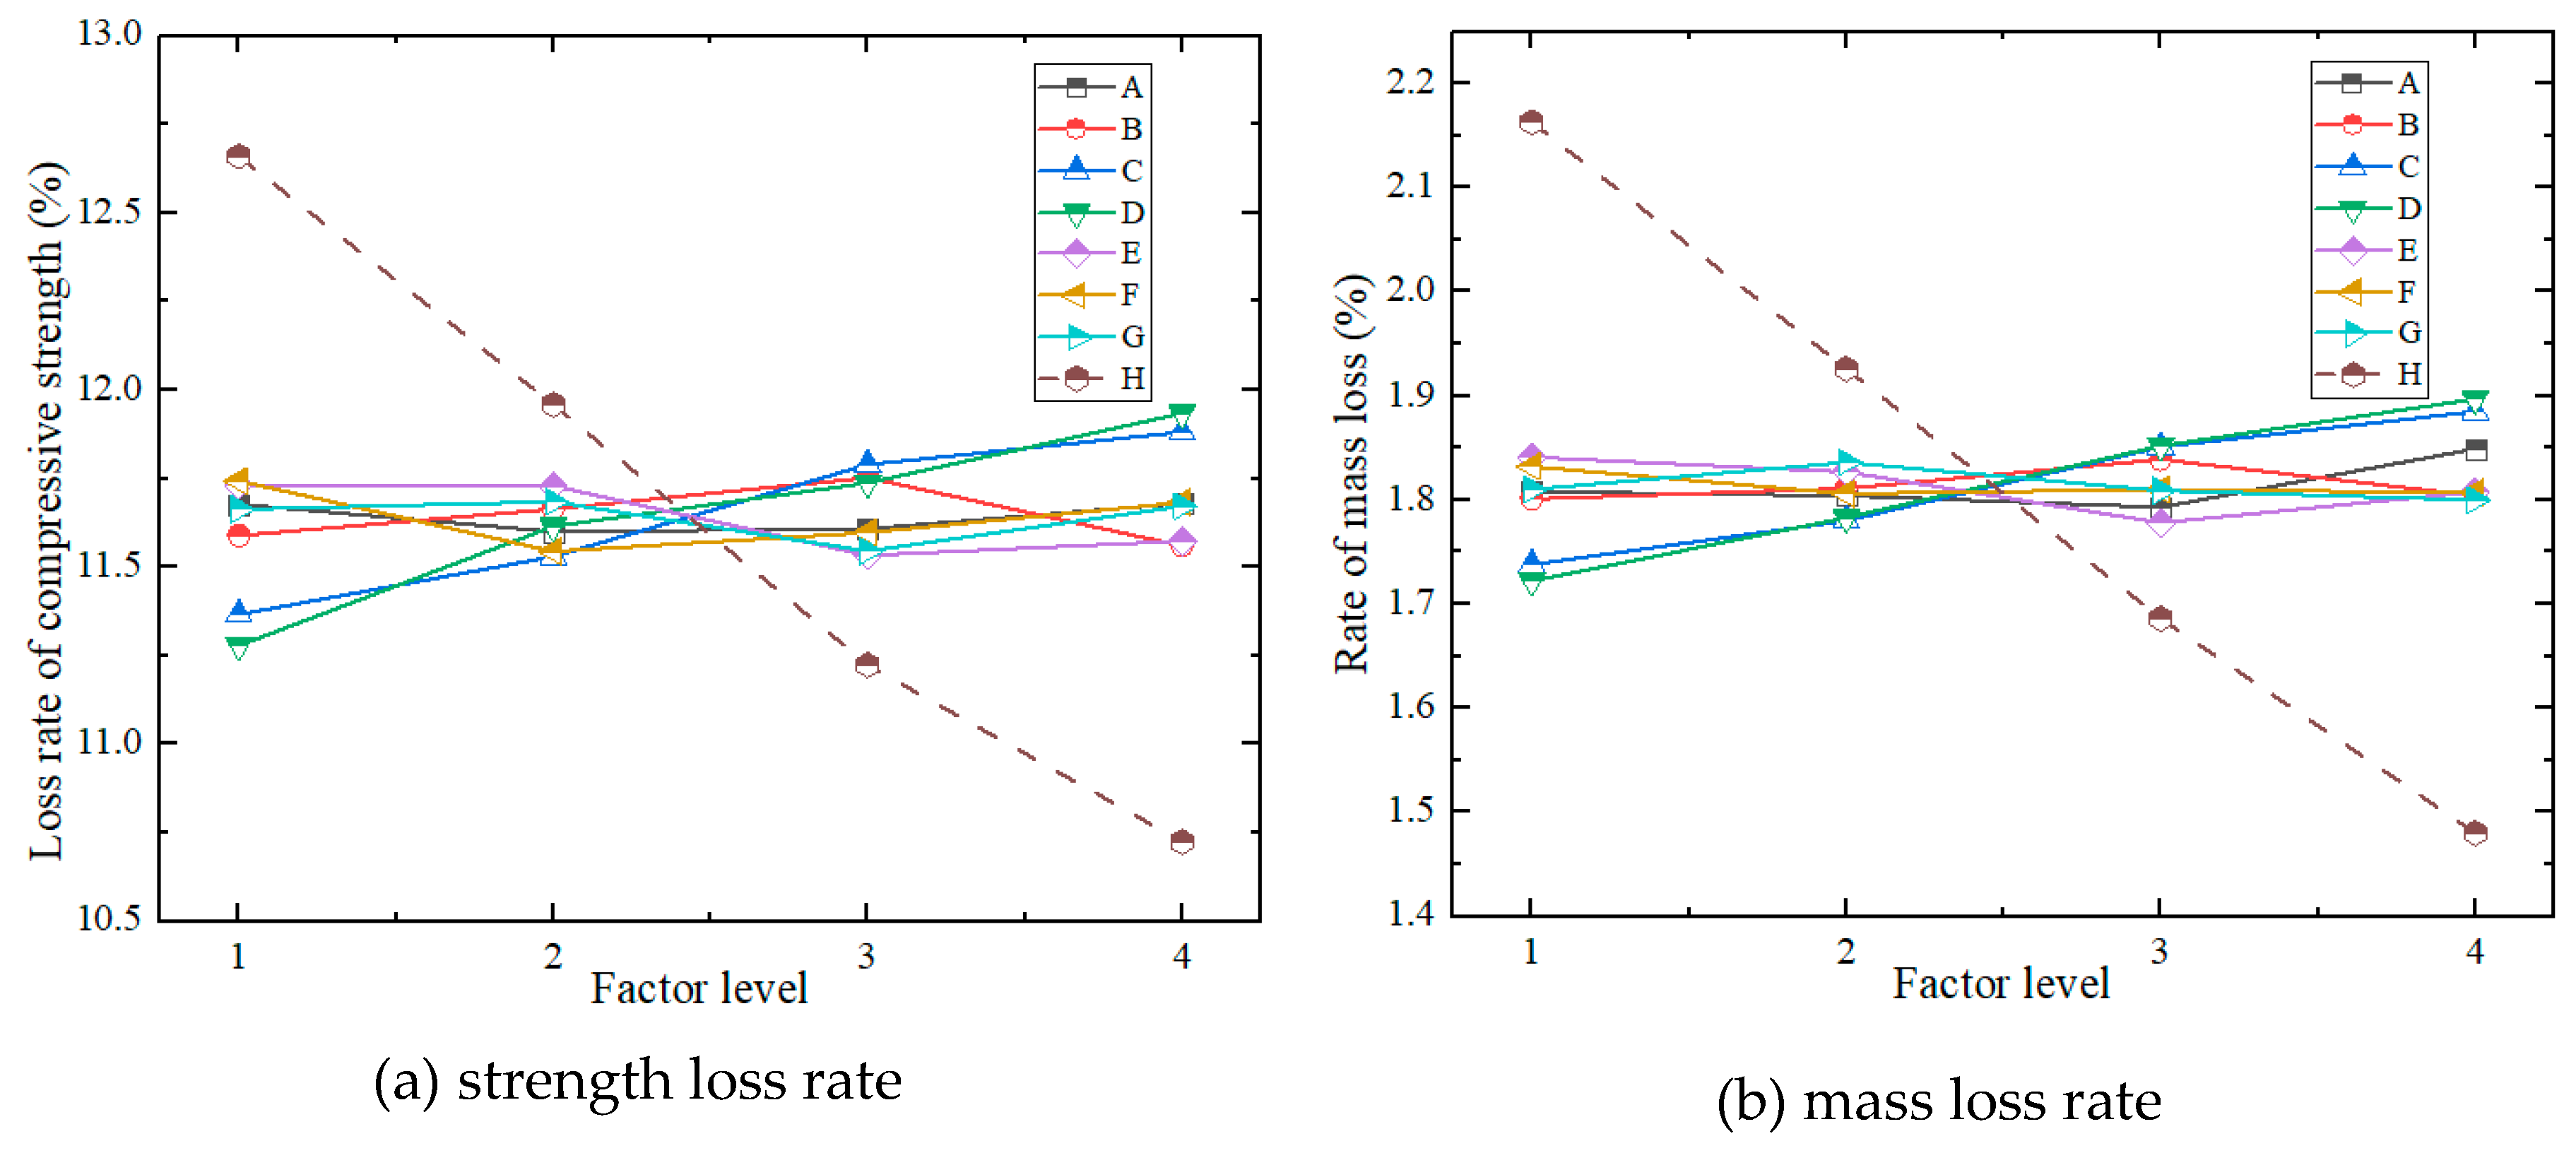
- Frost Resistance
The range calculation and analysis results of the strength loss rate and mass loss rate are listed in Table 17 and Table 18:
By comparing the range values (R), it can be seen that the three most influential factors on the freezing resistance of the AAFC are, in order: waterproofing agent dosage, foam content, and water-binder ratio. The other factors had relatively minor effects.
The dosage of the waterproofing agent demonstrated the most significant effect on frost resistance, with both the strength and mass loss rates decreasing approximately linearly as its content increased. This improvement was attributed to the reduction in water absorption, which mitigated the 9% volumetric expansion of water upon freezing and the resultant frost-heave pressure within the pores. In contrast, increased foam content reduces frost resistance by increasing porosity, coarsening pore structures, and thinning pore walls, thereby elevating water absorption and exacerbating frost-induced damage. Similarly, a higher water–binder ratio diminishes frost resistance by promoting slurry fluidity and altering pore characteristics, leading to internal stress differences between saturated and unsaturated zones during freeze–thaw cycles.
Figure 12.
Frost resistance of AAFC varies with the levels of various factors.
4.3.2. Analysis of Variance (ANOVA) of Test Results
Range analysis of orthogonal test results can effectively determine the primary and secondary orders of influencing factors, but it cannot distinguish data fluctuations caused by changes in test conditions and errors, nor evaluate the significance level of the influencing factors. Therefore, ANOVA was conducted. The significance of the influence of each factor can be determined by constructing an F-statistic for the F-test.
The range and variance analysis results in Table 19 show good consistency. A comprehensive analysis of both methods led to the following conclusions.
(1) Foam content significantly affects all properties, reducing density and thermal conductivity, but increasing water absorption and shrinkage while compromising mechanical and frost resistance, requiring careful optimization.
(2) The aerogel content exhibited an extremely significant effect on thermal performance. Combining the increased aerogel content with moderately reduced foam content simultaneously enhanced the thermal and mechanical properties.
(3) The water-binder ratio significantly influences the mechanical properties and density, with significant effects on water absorption and frost resistance. Its complex effects necessitate careful optimization.
(4) Calcium hydroxide moderately improved the mechanical properties through an initial-decrease-then-increase pattern, while showing negligible effects on other parameters.
(5) The waterproofing agent significantly enhances the water resistance and frost durability, slightly improves the mechanical properties, and minimally affects the thermal and density characteristics.
4.3.3. Microscopic Analysis
- (1)
- SEM
The variations in the mix proportions resulted in significant changes in the micro-morphologies of the specimens (Figure 13). Among the six groups of specimens, both pore size and porosity generally showed an increasing trend: Specimen S3 had the largest pore size, along with the smallest thermal conductivity and dry density, whereas the opposite was true for Specimen S1.This trend shows a strong correlation with the pore size and characteristics[45,46]. This indicated that the foam content and water-to-binder ratio exerted a significant influence on the pore structure. Although Specimens S5 and S11 differ in water-to-binder ratio and foam content, their low thermal conductivity, attributed to the high aerogel content, confirms that the aerogel is a key influencing factor. SEM images reveal that Specimen S3 features high porosity and thin pore walls, whereas Specimen S11, with a higher dosage of foam stabilizer, exhibited fewer interconnected pores and more uniform pore sizes[47]. The random dispersion of basalt fibers is conducive to enhancing the mechanical properties, and the absence of independent FA particles is consistent with the reaction mechanism of alkali-activated FA.
- (2)
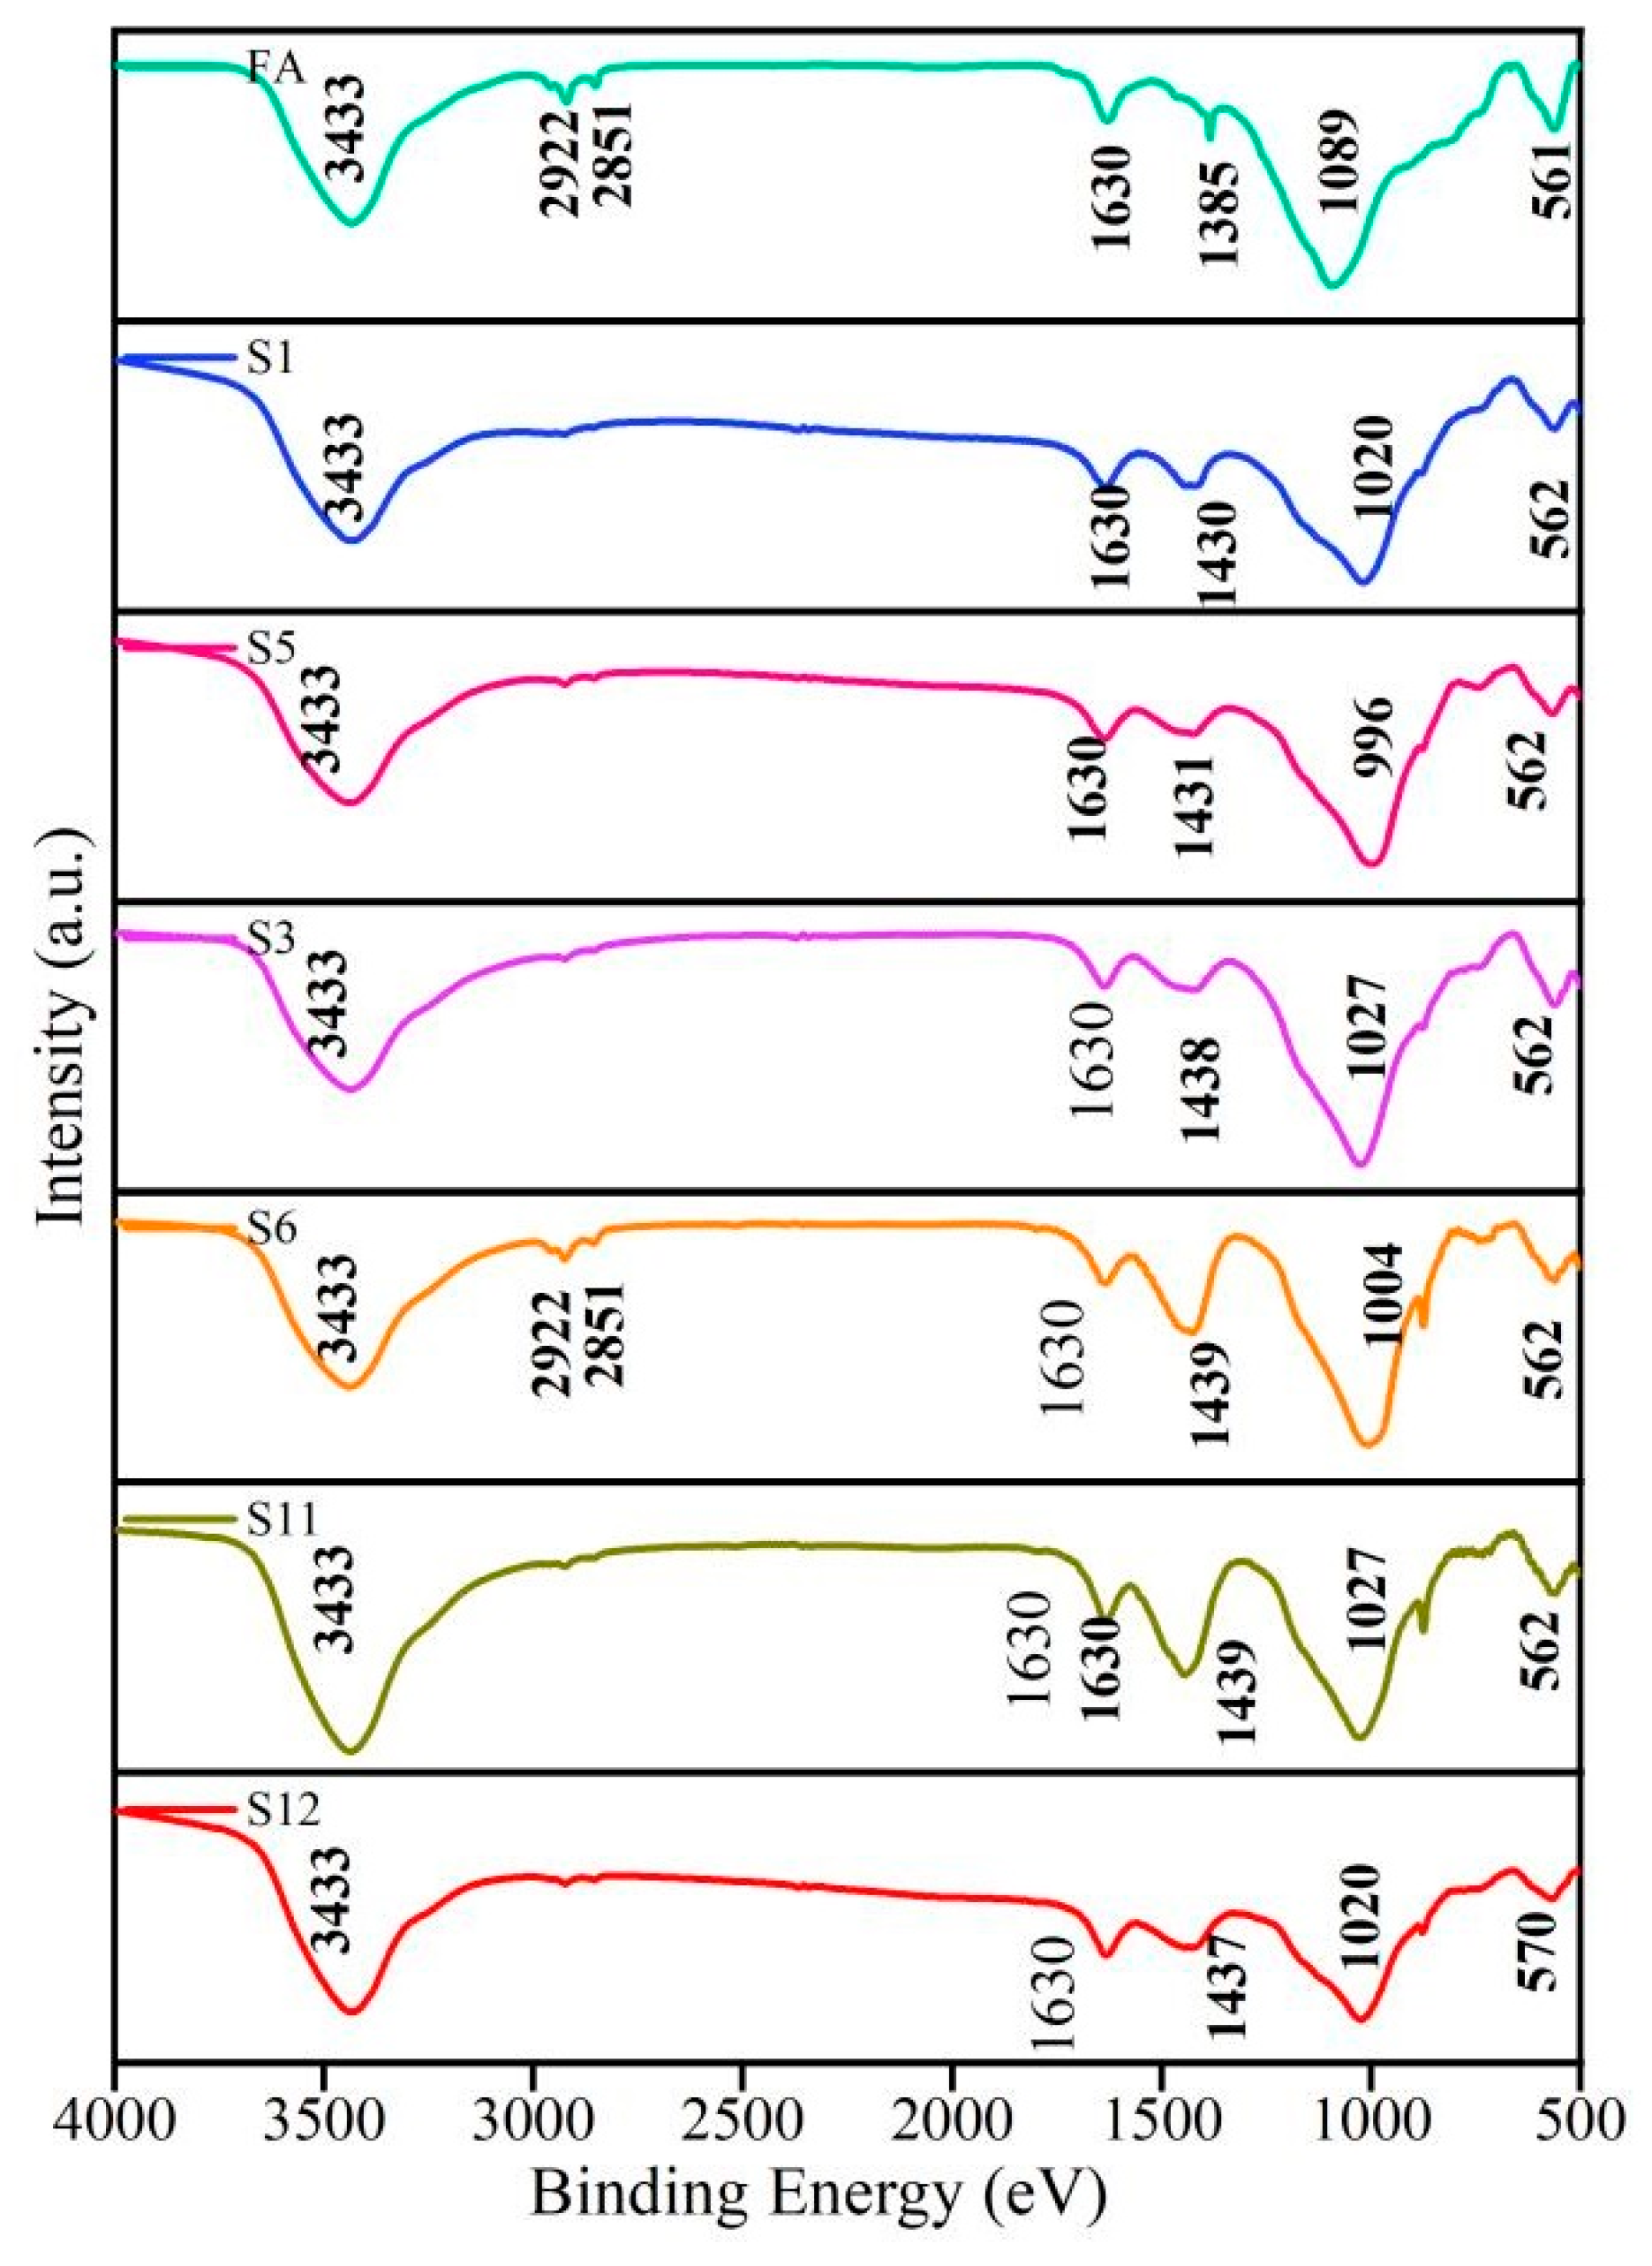
- FTIR
The analysis indicates that the wavenumber range of 1000–1040 cm < B-> ¹ corresponds to the asymmetric stretching vibration peak of Si-O-X (Na/Al), which is the most prominent characteristic absorption peak of alkali-activated FA cementitious materials[48]. The absorption peak intensities vary among the six groups of specimens: a stronger and sharper peak suggests a higher content of hydrated sodium (calcium) aluminosilicate (C,N-A-S-H) in the reaction products, which is beneficial for enhancing the mechanical properties of FC[49,50]. Additionally, compared with the infrared spectrum of FA, the characteristic peak of Si-O-X (Na/Al) in the products shifted to a lower wavenumber, a feature that reflects the gradual increase in C,N-A-S-H gel products[29,31]. Moreover, due to differences in alkali concentration among systems with various mix proportions, there are certain variations in the extent of the peak shift. The peak at 1430 cm < st > ¹ corresponds to the asymmetric stretching vibration of carbonate, with the peak of S11 being the strongest. Because S11 had the highest alkali equivalent among the six mix proportions, the system of this mix proportion exhibited strong alkalinity, indicating the maximum formation of carbonate. Furthermore, there are two characteristic peaks at 3433 cm⁻¹ and 1630 cm⁻¹, which correspond to the bending vibration peak of H-O-H bonds, among which the peak at 1630 cm⁻¹ is the characteristic peak of bound water in cementitious materials[51].
Figure 14.
FTIR diagram of samples with different mix ratios.
4.4. Determination of Optimal Mix Proportion for AAFC
4.4.1. Mix Proportion Optimization Method
Both range and variance analyses are single-factor analysis methods that cannot determine the optimal mix proportion under multi-factor conditions in orthogonal experiments. The matrix analysis method can objectively conduct a comprehensive analysis of multifactor and multiindex systems and calculate the weights of each factor level. Therefore, matrix analysis was used to determine the optimal mix proportion for the AAFC.
Based on the orthogonal experimental scheme and the performance index system of the AAFC, a three-layer hierarchical structure model was constructed, including the index, factor, and level layers. The model consists of eight factors with four levels each, and eight performance indicators were investigated. The constructed structural model is presented in the following table:
Table 20.
Orthogonal test of AAFC data structure model.
| Index Layer | Performance Indicators | ||||||||||||
| Factor Layer | Factor A | Factor B | ⋅⋅⋅ | Factor H | |||||||||
| Level Layer | A1 | A2 | ⋅⋅⋅ | A4 | B1 | B2 | ⋅⋅⋅ | B4 | ⋅⋅⋅ | H1 | H2 | ⋅⋅⋅ | H4 |
Index Layer Matrix: The average value of the test index for factor Xi at the j level is defined as mij. For indicators in which larger values indicate better performance, Mij=mij; for indicators in which smaller values are preferable, Mij=1/mij. The established index matrix is expressed by Eq.8:
Factor Layer Matrix: Let , the factor matrix is established as shown in Eq.9:
Level Layer Matrix: Calculate the range Si of factor Ai, Let , the factor matrix is established as shown in Eq.10:
Weight Matrix: For the weight matrix of the factors influencing the test indices , can be expressed as follows:
The total weight matrix was obtained by averaging the sum of the weight matrices for each factor ωi, as shown in Eq.12:
4.4.2. Analysis and Determination of Optimal Mix Proportion
The weight matrix for eight performance indicators, including dry density, was calculated based on the established three-layer hierarchical structure model. For five indicators (thermal conductivity, mass water absorption rate, drying shrinkage, strength loss rate, and mass loss rate), smaller values were preferable; therefore, Mij=1/mij was adopted. For dry density, compressive strength, and flexural strength (where larger values are preferable), Mij=1/mij was used. The calculation results based on this method are listed in the following table:
Table 21.
Results of matrix analysis.
| Factors | ρ | λ | Wr | f | Rf | ε | Fc | Mm | Total Weight Weight |
| A1 | 0.001406 | 0.001355 | 0.019789 | 0.015929 | 0.021806 | 0.007451 | 0.005086 | 0.011342 | 0.010521 |
| A2 | 0.001405 | 0.001371 | 0.019427 | 0.016174 | 0.023565 | 0.007413 | 0.005119 | 0.011370 | 0.010731 |
| A3 | 0.001405 | 0.001364 | 0.020763 | 0.016044 | 0.023033 | 0.007567 | 0.005116 | 0.011436 | 0.010841 |
| A4 | 0.001407 | 0.001393 | 0.020967 | 0.016004 | 0.023050 | 0.007459 | 0.005084 | 0.011093 | 0.010807 |
| B1 | 0.008032 | 0.001869 | 0.015798 | 0.020380 | 0.018552 | 0.015159 | 0.012301 | 0.007790 | 0.012485 |
| B2 | 0.008087 | 0.001941 | 0.016777 | 0.020430 | 0.019814 | 0.015119 | 0.012222 | 0.007748 | 0.012767 |
| B3 | 0.008081 | 0.001878 | 0.016370 | 0.020780 | 0.019673 | 0.014684 | 0.012131 | 0.007629 | 0.012653 |
| B4 | 0.008082 | 0.001876 | 0.015777 | 0.020485 | 0.019428 | 0.015297 | 0.012332 | 0.007776 | 0.012632 |
| C1 | 0.074948 | 0.002170 | 0.033044 | 0.042511 | 0.059972 | 0.058656 | 0.033702 | 0.031382 | 0.042048 |
| C2 | 0.076354 | 0.002193 | 0.036516 | 0.041752 | 0.056736 | 0.053662 | 0.033227 | 0.030637 | 0.041385 |
| C3 | 0.078092 | 0.002177 | 0.032080 | 0.041865 | 0.052582 | 0.052590 | 0.032492 | 0.029458 | 0.040167 |
| C4 | 0.080083 | 0.002269 | 0.032373 | 0.040853 | 0.049872 | 0.050538 | 0.032240 | 0.028928 | 0.039645 |
| D1 | 0.094436 | 0.002759 | 0.037616 | 0.053465 | 0.058186 | 0.114342 | 0.043226 | 0.037643 | 0.055209 |
| D2 | 0.095149 | 0.002832 | 0.035100 | 0.053067 | 0.058202 | 0.128440 | 0.041975 | 0.036368 | 0.056392 |
| D3 | 0.101221 | 0.002867 | 0.036018 | 0.051078 | 0.048713 | 0.150061 | 0.041536 | 0.035001 | 0.058312 |
| D4 | 0.102742 | 0.002919 | 0.032927 | 0.050880 | 0.048599 | 0.167893 | 0.040850 | 0.034166 | 0.060122 |
| E1 | 0.011058 | 0.001923 | 0.023148 | 0.010166 | 0.020177 | 0.012008 | 0.012556 | 0.012551 | 0.012948 |
| E2 | 0.011085 | 0.001954 | 0.021667 | 0.010100 | 0.020630 | 0.012173 | 0.012558 | 0.012643 | 0.012851 |
| E3 | 0.011023 | 0.001999 | 0.022339 | 0.010102 | 0.019567 | 0.012415 | 0.012772 | 0.012991 | 0.012901 |
| E4 | 0.010981 | 0.001977 | 0.023601 | 0.010198 | 0.019295 | 0.012184 | 0.012728 | 0.012774 | 0.012967 |
| F1 | 0.001905 | 0.011869 | 0.016304 | 0.064976 | 0.052377 | 0.008781 | 0.012750 | 0.005270 | 0.021779 |
| F2 | 0.001895 | 0.011718 | 0.015792 | 0.065705 | 0.059349 | 0.008681 | 0.012808 | 0.005282 | 0.022654 |
| F3 | 0.001873 | 0.009831 | 0.015654 | 0.069156 | 0.063528 | 0.008829 | 0.012591 | 0.005207 | 0.023334 |
| F4 | 0.001906 | 0.012250 | 0.016638 | 0.065258 | 0.055032 | 0.008621 | 0.012657 | 0.005279 | 0.022205 |
| G1 | 0.001637 | 0.002063 | 0.011381 | 0.024228 | 0.008808 | 0.008058 | 0.008951 | 0.007552 | 0.009085 |
| G2 | 0.001642 | 0.002078 | 0.011814 | 0.023845 | 0.008684 | 0.008135 | 0.008845 | 0.007438 | 0.009060 |
| G3 | 0.001621 | 0.002006 | 0.011420 | 0.024352 | 0.008646 | 0.008129 | 0.008861 | 0.007547 | 0.009073 |
| G4 | 0.001612 | 0.002090 | 0.011893 | 0.023801 | 0.008555 | 0.007959 | 0.008854 | 0.007590 | 0.009044 |
| H1 | 0.001672 | 0.001500 | 0.075879 | 0.019184 | 0.013437 | 0.004420 | 0.113216 | 0.114664 | 0.042996 |
| H2 | 0.001657 | 0.001521 | 0.088917 | 0.018940 | 0.013747 | 0.004415 | 0.119851 | 0.128726 | 0.047222 |
| H3 | 0.001662 | 0.001545 | 0.104995 | 0.019004 | 0.013241 | 0.004457 | 0.127713 | 0.147112 | 0.052466 |
| H4 | 0.001655 | 0.001498 | 0.107214 | 0.019287 | 0.013144 | 0.004403 | 0.133648 | 0.167607 | 0.056057 |
Based on the above results, the optimal mix proportion of AAFC was determined to be A3B2C1D4E4F3G1H4, with the following factor levels: alkali equivalent of 0.1, activator modulus of 1.1, water-to-binder ratio of 0.4, foam dosage of 4.5 (multiple of theoretical value), foam stabilizer dosage of 3.5% (by mass of foaming agent), aerogel dosage of 6 kg/m3, calcium hydroxide dosage of 5% (by mass of FA), and waterproofing agent dosage of 5.5% (by mass of FA). The specimens were prepared and cured again according to the above mix proportion, and the performance parameters of the optimal mix AAFC were measured as follows: dry density of 576.34 kg/m3, thermal conductivity of 0.1107 W/(m·K), mass water absorption rate of 3.87%, compressive strength of 5.83 MPa, flexural strength of 1.41 MPa, drying shrinkage of 0.614 mm/m, strength loss rate of 10.433%, and mass loss rate of 1.764%. This indicates that all the indicators of the AAFC with the optimal mix proportion meet the target requirements.
5. Conclusions
(1) A target performance system was established for ultralow energy buildings in hot-summer and cold-winter regions, comprising six primary and ten secondary indicators, with particular emphasis on water resistance.
(2) A volume-based mix design method was proposed for the AAFC. Preliminary mixes only met dry density targets, with mass water absorption reaching 57.1% (11.42 times the target), indicating the need for comprehensive optimization.
(3) An 8-factor, 4-level orthogonal experiment was designed. The SiO₂ aerogel (6 kg/m³) effectively reduced the thermal conductivity without compromising its mechanical properties. The waterproofing agent (5.5% FA mass) achieved optimal water resistance and frost durability.
(4) The optimal mix proportion of AAFC was determined to be A3B2C1D4E4F3G1H4 by matrix analysis. The performance indicators were as follows: dry density 576.34 kg/m³; thermal conductivity, 0.1107 W/(m·K); water absorption, 3.87%; compressive strength 5.83 MPa, flexural strength 1.41 MPa, drying shrinkage, 0.614 mm/m; frost resistance (10.433% strength loss and 1.764% mass loss). All parameters satisfied the target requirements.
Acknowledgments
This research was supported by the Natural Science Foundation of the Jiangsu Higher Education Institutions of China(Grant No.22KJB560014), Jiangsu Collaborative Innovation Center for Building Energy Saving and Construct Technology Youth Doctoral Foundation (Grant No. SJXTBS2107).
Conflicts of Interest
The authors declare that they have no conflict of interest.
References
- China Association of Building Energy Efficiency, Chongqing University. Research Report on Carbon Emissions in China's Urban and Rural Construction Sector (2024 Edition) [R]. Beijing: China Association of Building Energy Efficiency, 2025.
- Gencel, O., Yavuz Bayraktar, O., Kaplan, G., et al. Lightweight foam concrete containing expanded perlite and glass sand: Physico-mechanical, durability, and insulation properties. Construction and Building Materials, 320, 126187. [CrossRef]
- Zhang W, Yu H, Yin B, et al. Effects of recycled carbon fibers on mechanical and piezoresistive properties and environmental impact in alkali-activated cementitious materials[J].Journal of Cleaner Production,2024,450141902-. [CrossRef]
- Hore S, Shiuly A. Study of thermal conductivity of different types of alkali-activated concrete:a comprehensive review[J] Environment Development and Sustainability,2023,27(3):1-48. [CrossRef]
- Yılmazoğlu U M, Kara O H, Benli A, et al. Sustainable alkali-activated foam concrete with pumice aggregate: Effects of clinoptilolite zeolite and fly ash on strength, durability, and thermal performance[J].Construction and Building Materials, 2025,464140160-140160. [CrossRef]
- Bayraktar Y O, Özel B H, Benli A, et al. Sustainable foam concrete development: Enhancing durability and performance through pine cone powder and fly ash incorporation in alkali-activated geopolymers[J].Construction and Building Materials,2024,457139422-139422. [CrossRef]
- Juntao D, Xiaosong T, Jianzhuang X, et al. Influence of alkaline activator and precursor on the foam characterization and alkali-activated foamed concrete properties[J]. Cement and Concrete Composites, 2024,145. [CrossRef]
- Dang J, Tang X, Xiao J, et al. Role of recycled brick powder and alkaline solution on the properties of eco-friendly alkali-activated foam concrete[J].Journal of Cleaner Production,2024,436140381-. [CrossRef]
- Benli A. Sustainable use of waste glass sand and waste glass powder in alkali-activated slag foam concretes: Physico-mechanical, thermal insulation and durability characteristics[J].Construction and Building Materials,2024, 438137128-137128. [CrossRef]
- Xiong Y, Zhang Z, Huo B, et al. Uncovering the influence of red mud on foam stability and pore features in hybrid alkali-activated foamed concrete[J].Construction and Building Materials,2024,416135309-. [CrossRef]
- Liu X, Jiang T, Li C, et al. Effect of Precursor Blending Ratio and Rotation Speed of Mechanically Activated Fly Ash on Properties of Geopolymer Foam Concrete[J].Buildings,2024,14(3):. [CrossRef]
- Chen L, Wang Z, Wang Y, et al. Preparation and properties of alkali activated metakaolin-based geopolymer[J].Materials,2016,9(9):767-767. [CrossRef]
- Wang S, Li H, Zou S, et al. Experimental research on a feasible rice husk/geopolymer foam building insulation material[J].Energy and Buildings, 2020,226(7):110358. [CrossRef]
- Shakouri S, Bayer Z, Erdoan T S. Development of silica fume-based geopolymer foams[J].Construction and Building Materials,2020,260:120442. [CrossRef]
- N. A B, M. E S, A. S S, et al. Improved Fly Ash Based Structural Foam Concrete with Polypropylene Fiber[J].Journal of Composites Science,2023,7(2):76-76. [CrossRef]
- Cui B L, Liu J, Li S, et al. Study on preparation and properties of cement-based/ geopolymer-polystyrene composite building exterior wall insulation materials[J]. Science of advanced materials, 2018, 10(11):1636-1645. [CrossRef]
- Horvat B, Knez N, Hribar U, et al. Thermal insulation and flammability of composite waste polyurethane foam encapsulated in geopolymer for sustainable building envelope[J].Journal of Cleaner Production,2024,446141387-. [CrossRef]
- Huiskes D, Keulen A, Yu Q, et al. Design and performance evaluation of ultra-lightweight geopolymer concrete[J].Materials Design,2016,89:516-526. [CrossRef]
- Yifei H, Guangzhao Y, Kaikang L. Development of fly ash and slag based high-strength alkali-activated foam concrete[J].Cement and Concrete Composites,2022,104447-. [CrossRef]
- Masi G, Tugnoli A, Bignozzi C M. Lightweight alkali activated composites by direct foaming based on ceramic tile waste and fly ash[J].Ceramics International,2024,50(24PC):55410-55420. [CrossRef]
- Siti A F, Liew M Y, Mohd A B A M, et al. Mechanical Properties and Thermal Conductivity of Lightweight Foamed Geopolymer Concretes[J].IOP Conference Series: Materials Science and Engineering,2019,551:012089-. [CrossRef]
- Jaya A N, Yun-Ming L, Cheng-Yong H, et al. Correlation between pore structure, compressive strength and thermal conductivity of porous metakaolin geopolymer[J].Construction and Building Materials,2020,247:118641-. [CrossRef]
- SU L.J., FU G.S., LI F.Y., et al. Preparation and mechanical properties of coal gangue-based foamed geopolymer[J].Bulletin of the Chinese Ceramic Society, 2020, 39(11): 3549-3556. [CrossRef]
- Gao H, Liu H, Liao L, et al. A bifunctional hierarchical porous kaolinite geopolymer with good performance in thermal and sound insulation[J]. Construction and Building Materials, 2020, 251(9):118888-.. [CrossRef]
- BERKOUCHE A, BELKADI A A, NOUI A, et al. Modeling and optimization of eco-friendly cellular foam geopolymer with recycled concrete and glass wastes using Box-Behnken design[J].Structures,2025,76109054-109054. [CrossRef]
- Xian R, Xiang Z, Jianxin Z, et al. Study on mechanical and thermal properties of alkali-excited fly ash aerogel foam concrete[J].Construction and Building Materials,2023,408. [CrossRef]
- Pan P, Yang W, Guo Z. Improvement of thermal properties of foam concrete by incorporating silica aerogel particles[J].Construction and Building Materials,2025,478141450-141450.. [CrossRef]
- Yong cheng J, Qijun S. The Stabilizing Effect of Carboxymethyl Cellulose on Foamed Concrete[J].International Journal of Molecular Sciences,2022,23(24):15473-15473. [CrossRef]
- Ministry of Housing and Urban-Rural Development of the People's Republic of China. JGJ/T 341-2014 Technical specification for application of foamed concrete[S]. Beijing: China Architecture and Building Press, 2014.
- Ministry of Housing and Urban-Rural Development of the People's Republic of China. JGJ/T 323-2014 Technical specification for application of self-insulation concrete compound block walls[S]. Beijing: China Architecture and Building Press, 2014.
- Ministry of Housing and Urban-Rural Development of the People's Republic of China. GB 50574-2010 Technical specification for unified application of wall materials[S]. Beijing: China Architecture & Building Press, 2011.
- Jiangsu Provincial Department of Housing and Urban-Rural Development. Technical guidelines for ultra-low energy residential buildings (trial implementation)[S]. Nanjing: Jiangsu Provincial Department of Housing and Urban-Rural Development, 2020.
- Shanghai Municipal Housing and Urban-Rural Development Administration. Technical guidelines for ultra-low energy buildings (trial implementation)[S]. Shanghai: Shanghai Municipal Housing and Urban-Rural Development Administration, 2019.
- Ministry of Housing and Urban-Rural Development of the People's Republic of China. GB/T 51350-2019 Technical standard for nearly zero energy buildings[S]. Beijing: China Architecture and Building Press, 2019.
- Ministry of Housing and Urban-Rural Development of the People's Republic of China. GB 50176-2016 Code for thermal design of civil buildings[S]. Beijing: China Architecture and Building Press, 2017.
- Ministry of Housing and Urban-Rural Development of the People's Republic of China. GB 50574-2010 Uniform technical code for wall materials used in buildings[S]. Beijing: China Architecture and Building Press, 2010.
- China Building Materials Federation. JC/T 2199-2013 Foaming agent for foamed concrete[S]. Beijing: China Building Materials Industry Press, 2013.
- Taohua Y, Jianzhuang X, Zhenhua D, et al. Geopolymers made of recycled brick and concrete powder-A critical review[J].Construction and Building Materials,2022,330. [CrossRef]
- Mahmoud A A, Johnson U A, Sumiani Y, et al. Engineering performance of sustainable geopolymer foamed and non-foamed concretes[J].Construction and Building Materials,2022,316. [CrossRef]
- Gu G, Xu F, Huang X, et al. Foamed geopolymer: The relationship between rheological properties of geopolymer paste and pore-formation mechanism[J].Journal of Cleaner Production,2020,277. [CrossRef]
- Ryu S G, Lee B Y, Koh T K, et al. The mechanical properties of fly ash-based geopolymer concrete with alkaline activators[J].Construction and Building Materials, 2013,47409-418. [CrossRef]
- Burak B, Yavuz O B, Ahmet B, et al. Effect of using wastewater from the ready-mixed concrete plant on the performance of one-part alkali-activated GBFS/FA composites: Fresh, mechanical and durability properties[J].Journal of Building Engineering,2023,76.. [CrossRef]
- K. S J, Yashida N, K. G. Effect of source materials, additives on the mechanical properties and durability of fly ash and fly ash-slag geopolymer mortar: A review[J].Construction and Building Materials,2021,280. [CrossRef]
- D. C W, Ranjani S I G. Investigations on the performance of xanthan gum as a foam stabilizer and assessment of economic and environmental impacts of foam concrete production[J].Journal of Building Engineering,2024,82108286-. [CrossRef]
- Oguzhan B Y, Gokhan K, Osman G, et al. Physico-mechanical, durability and thermal properties of basalt fiber reinforced foamed concrete containing waste marble powder and slag[J].Construction and Building Materials,2021,288. [CrossRef]
- Chao-Lung H, Damtie M Y, Duy-Hai V, et al. Performance evaluation of alkali activated mortar containing high volume of waste brick powder blended with ground granulated blast furnace slag cured at ambient temperature[J].Construction and Building Materials,2019,223657-667. [CrossRef]
- Youjie S, Yunchuan P ,Shanwen Z, et al. Thermal stability of foams stabilized by fluorocarbon and hydrocarbon surfactants in presence of nanoparticles with different specific surface areas[J].Journal of Molecular Liquids,2022,365. [CrossRef]
- Liu X, Wu Y, Li M, et al. Effects of graphene oxide on microstructure and mechanical properties of graphene oxide-geopolymer composites[J]. Construction and Building Materials,2020,247118544-118544. [CrossRef]
- Lijuan S, Guosheng F, Bing L, et al. Working performance and microscopic mechanistic analyses of municipal solid waste incineration (MSWI) fly ash-based self-foaming filling materials[J]. Construction and Building Materials,2022,361. [CrossRef]
- Pasupathy K, Ramakrishnan S, Sanjayan J. Enhancing the mechanical and thermal properties of aerated geopolymer concrete using porous lightweight aggregates[J].Construction and Building Materials,2020,264. [CrossRef]
- Yu P, Kirkpatrick R J, Poe B, et al. Structure of calcium silicate hydrate (C-S-H): Near-, Mid-, and far-infrared spectroscopy[J].Journal of the American Ceramic Society, 2010, 82(3):742-748. [CrossRef]
Figure 1.
Fitting curve of thermal conductivity with mass water absorption rate.
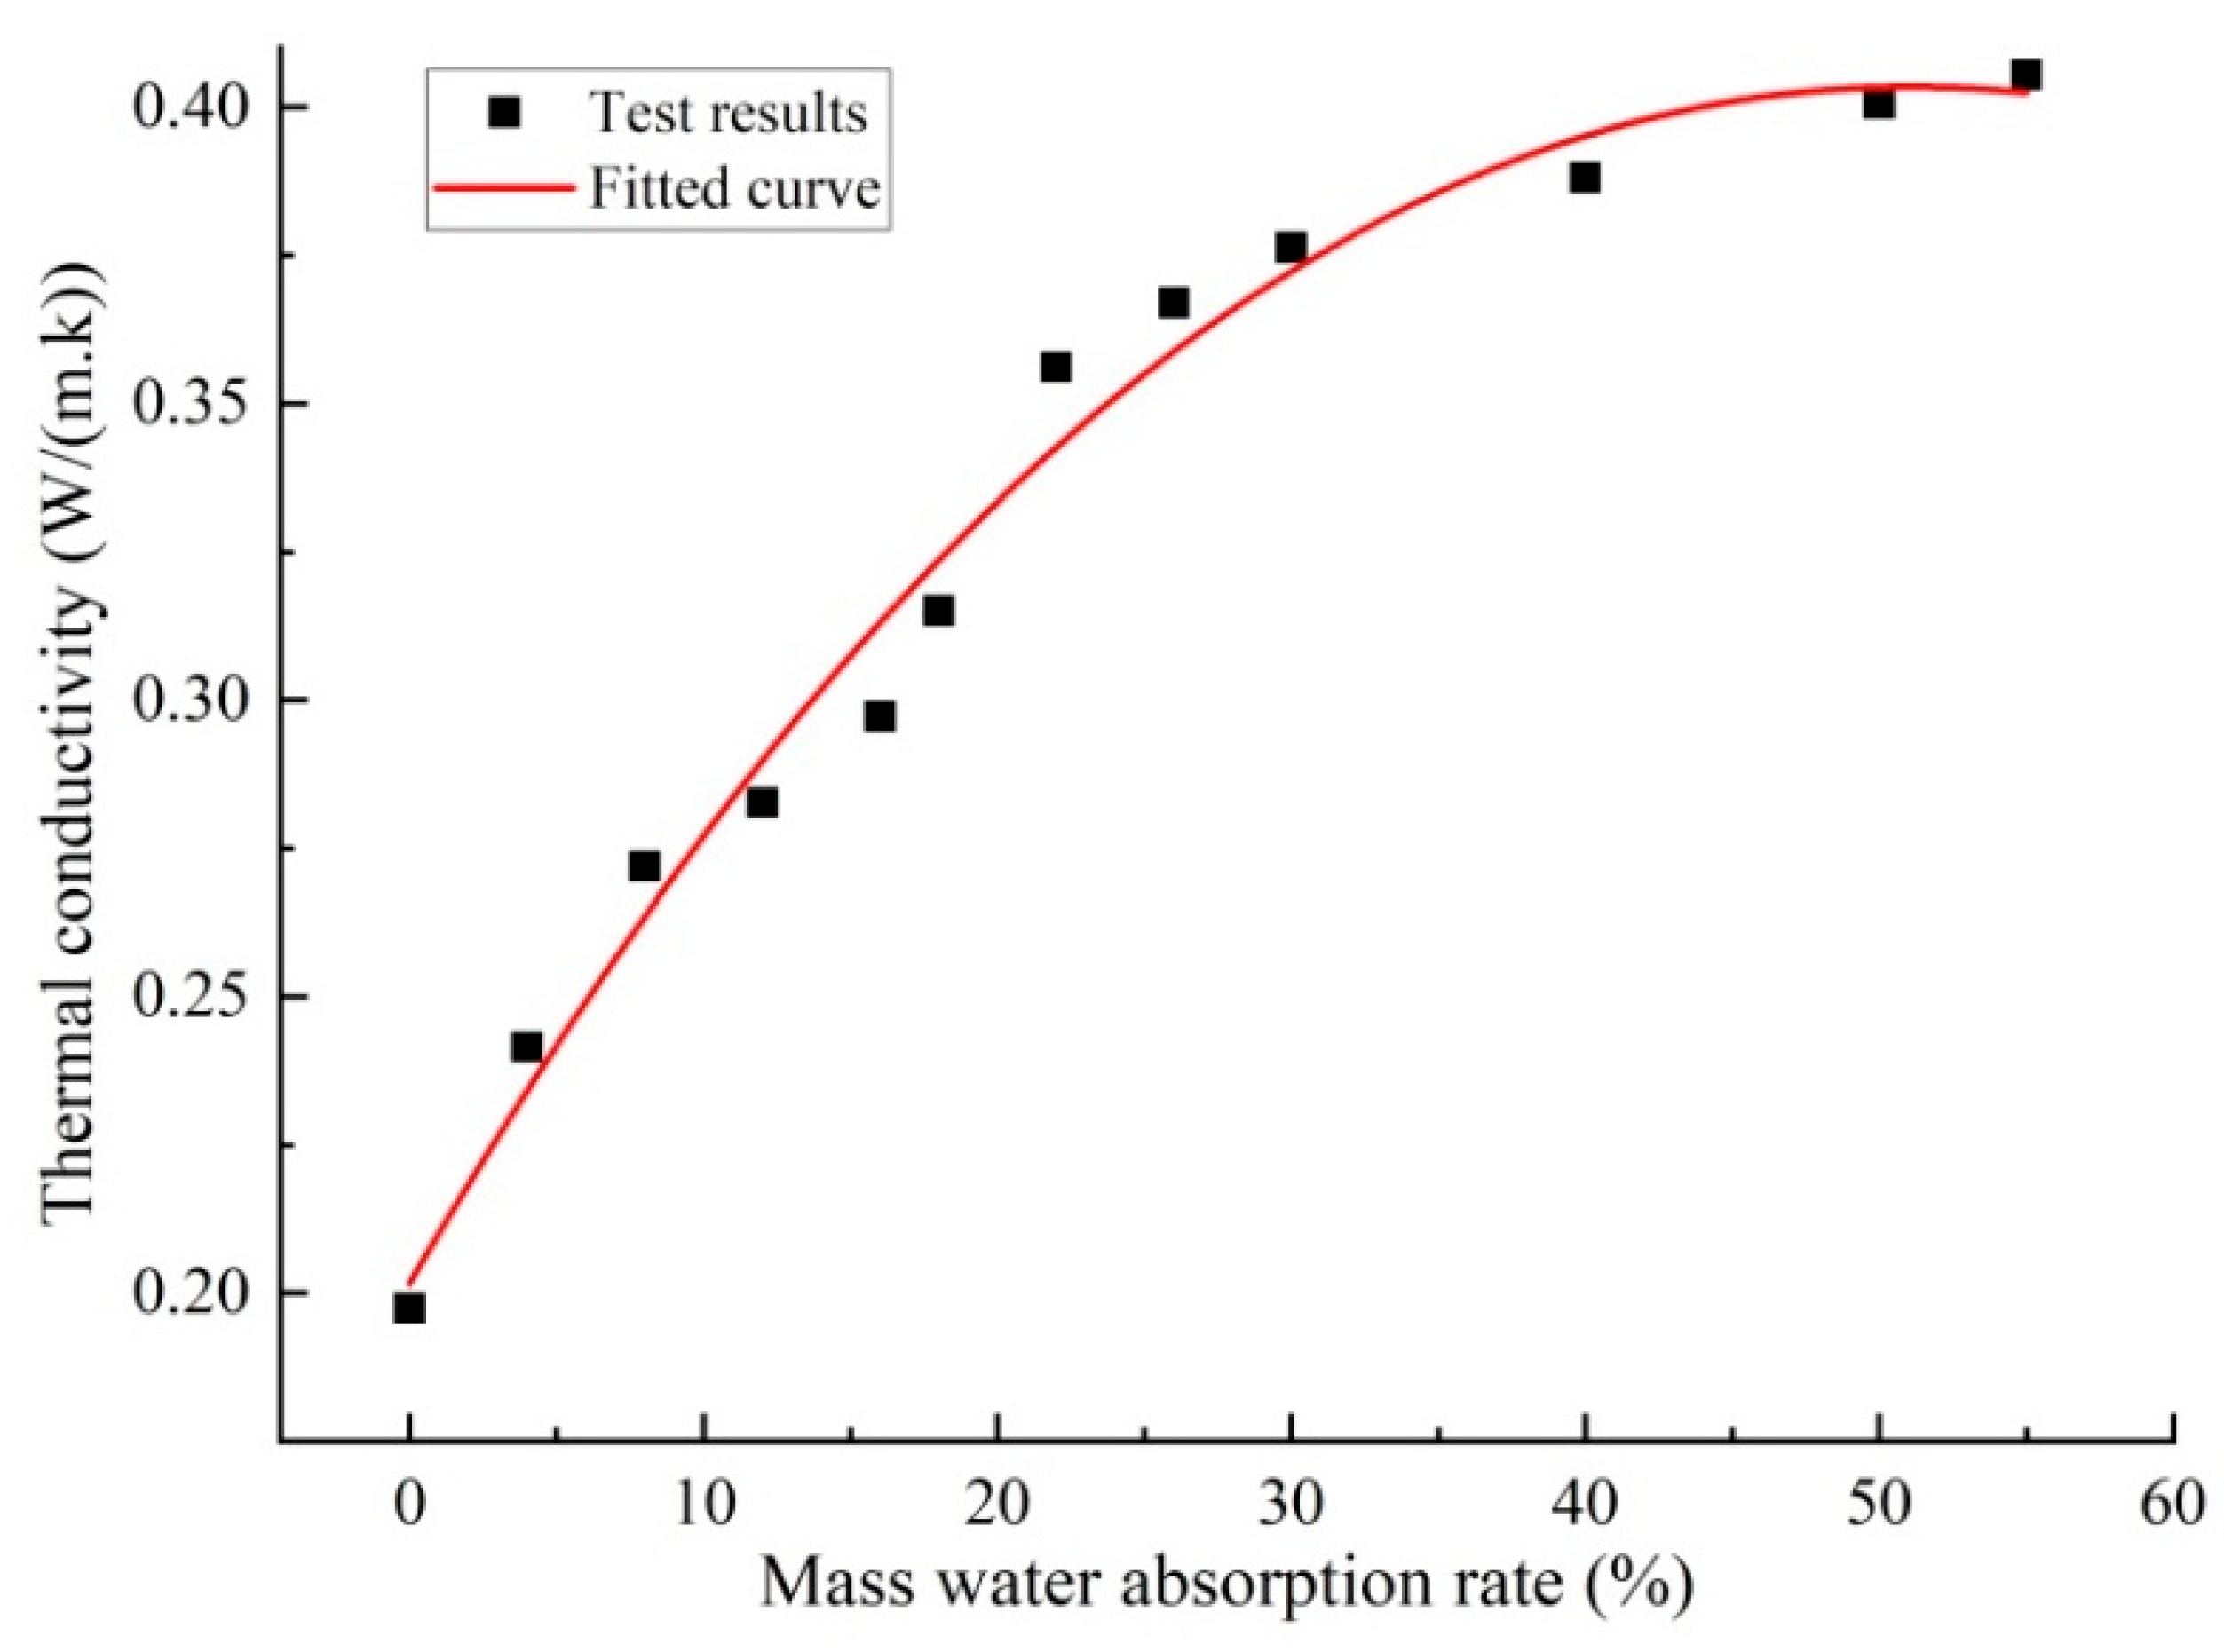
Figure 2.
Raw materials, (a) vitrified microbeads, (b) basalt fiber, (c) HPMC, (d) calcium hydroxide, (e) sodium methylsilicate solution.
Figure 2.
Raw materials, (a) vitrified microbeads, (b) basalt fiber, (c) HPMC, (d) calcium hydroxide, (e) sodium methylsilicate solution.
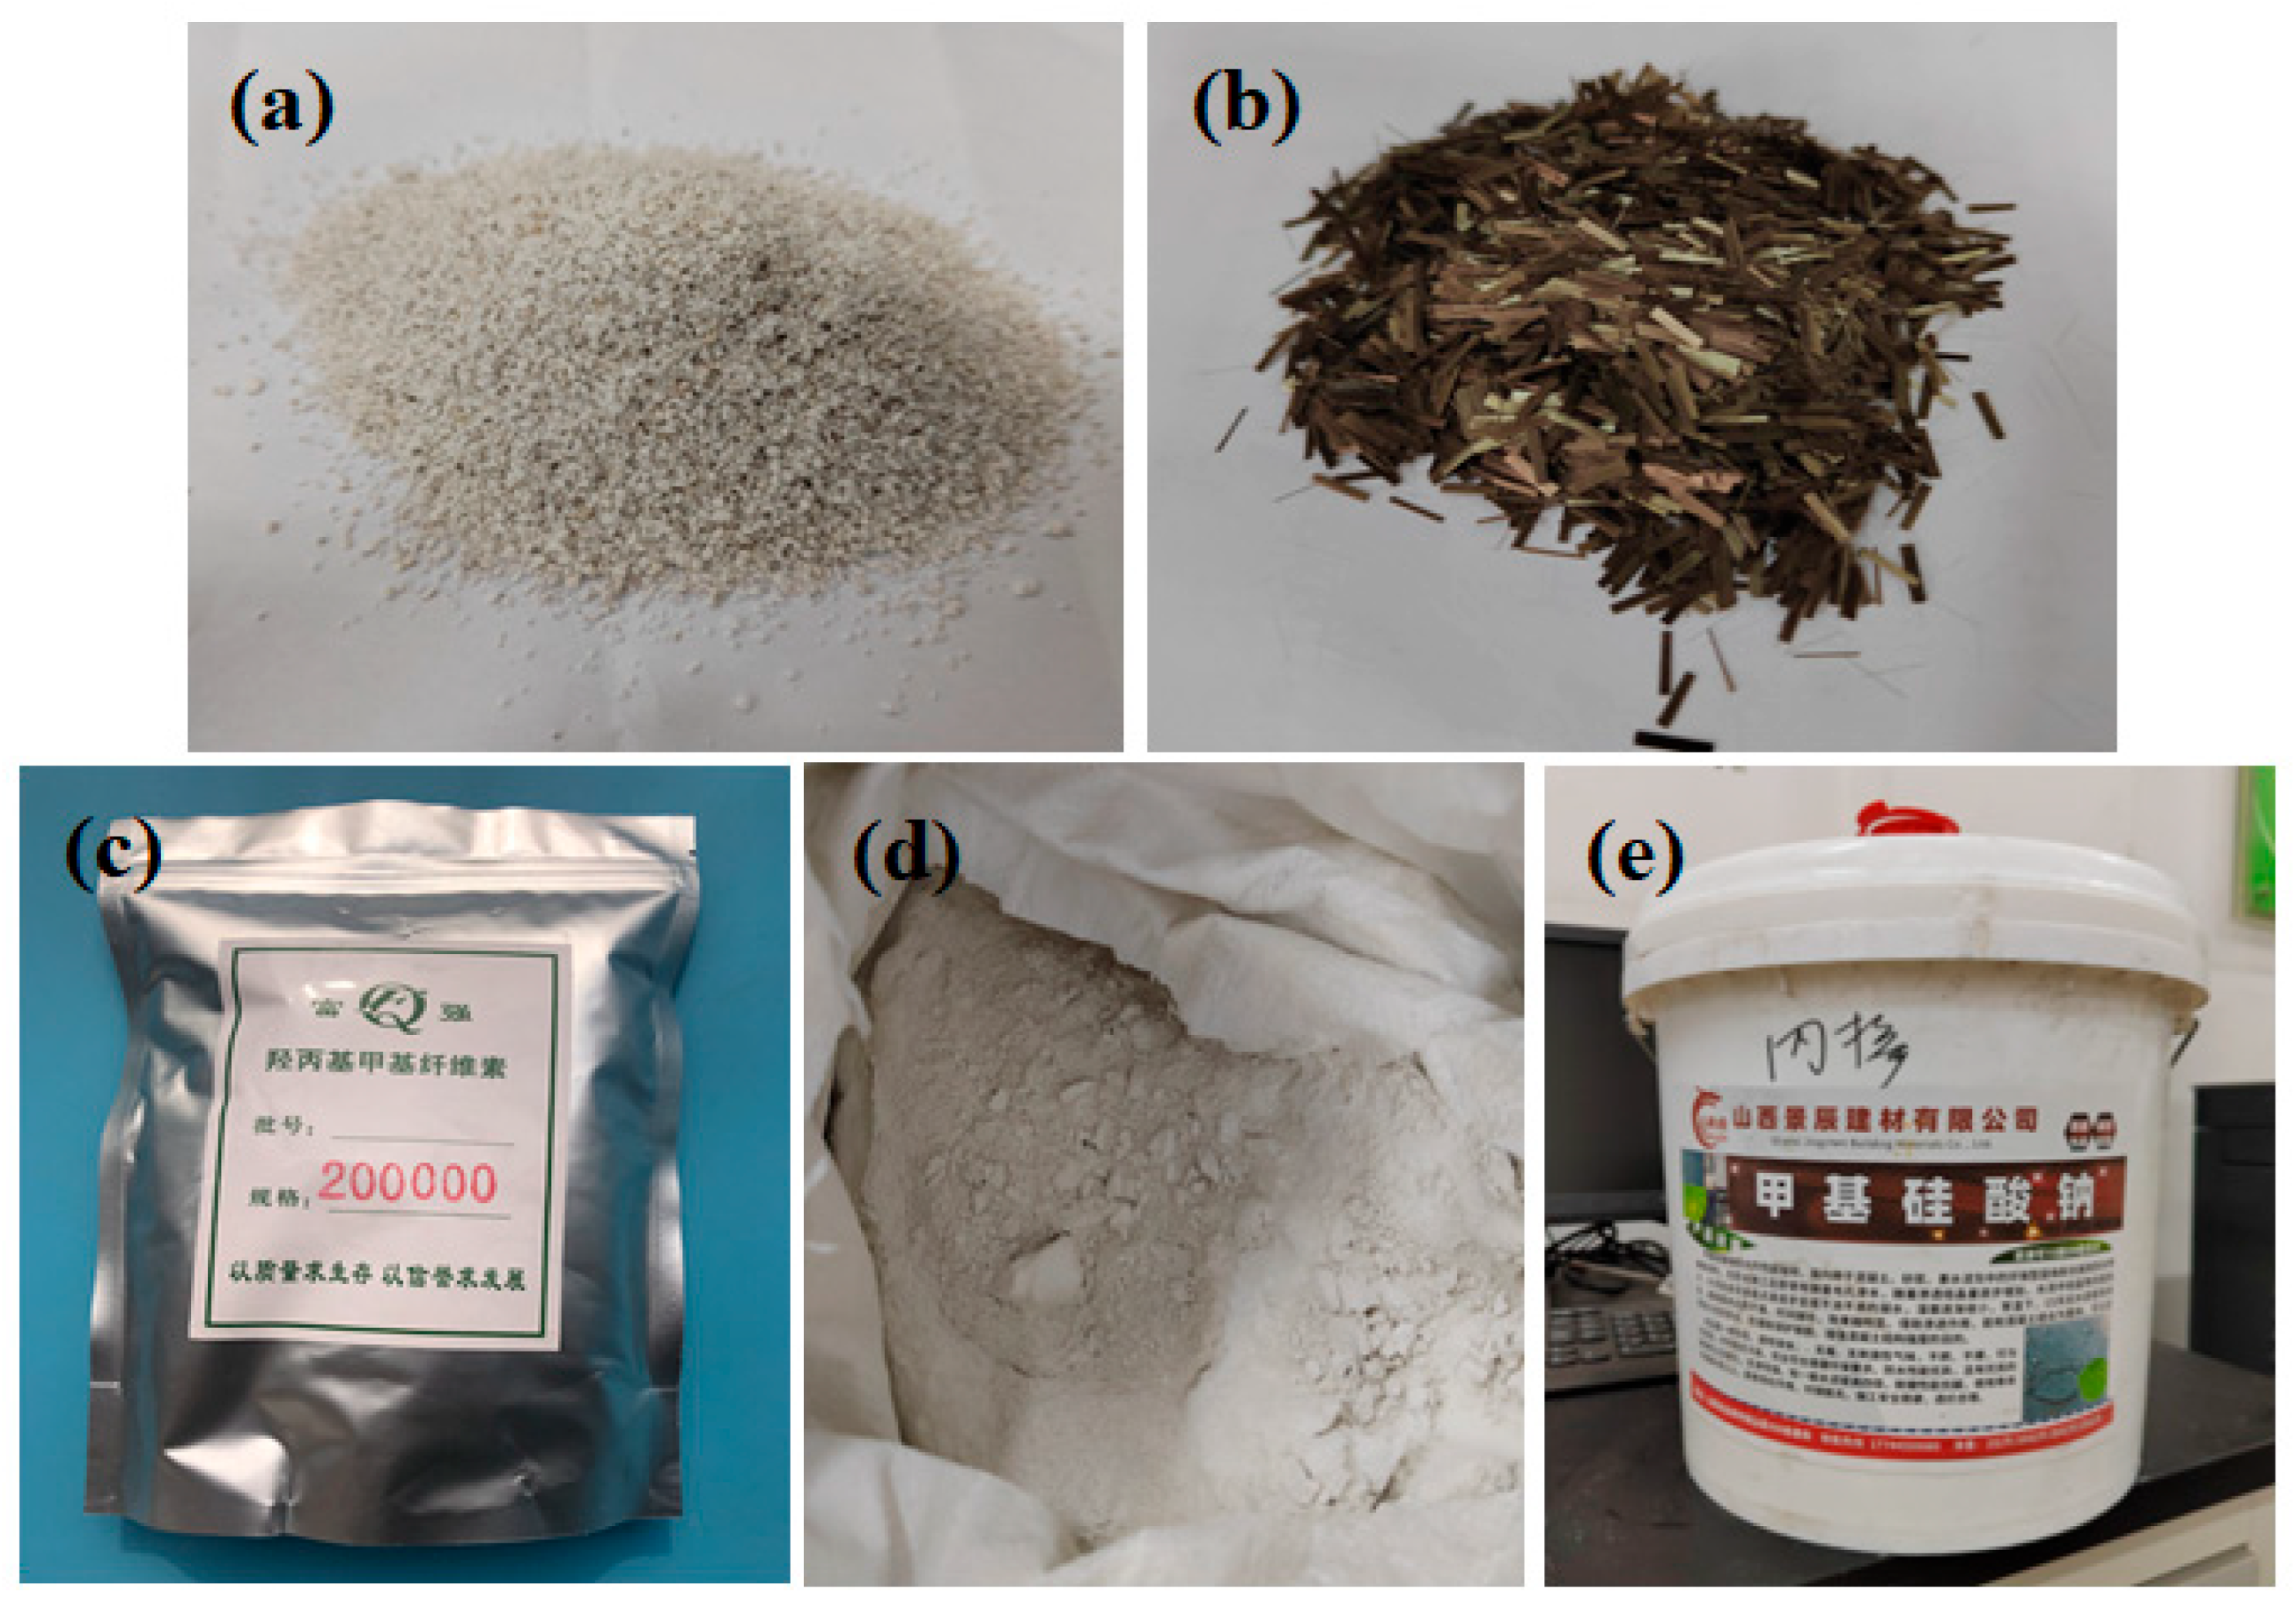
Figure 3.
Silica aerogel powder and its microscopic characteristics.
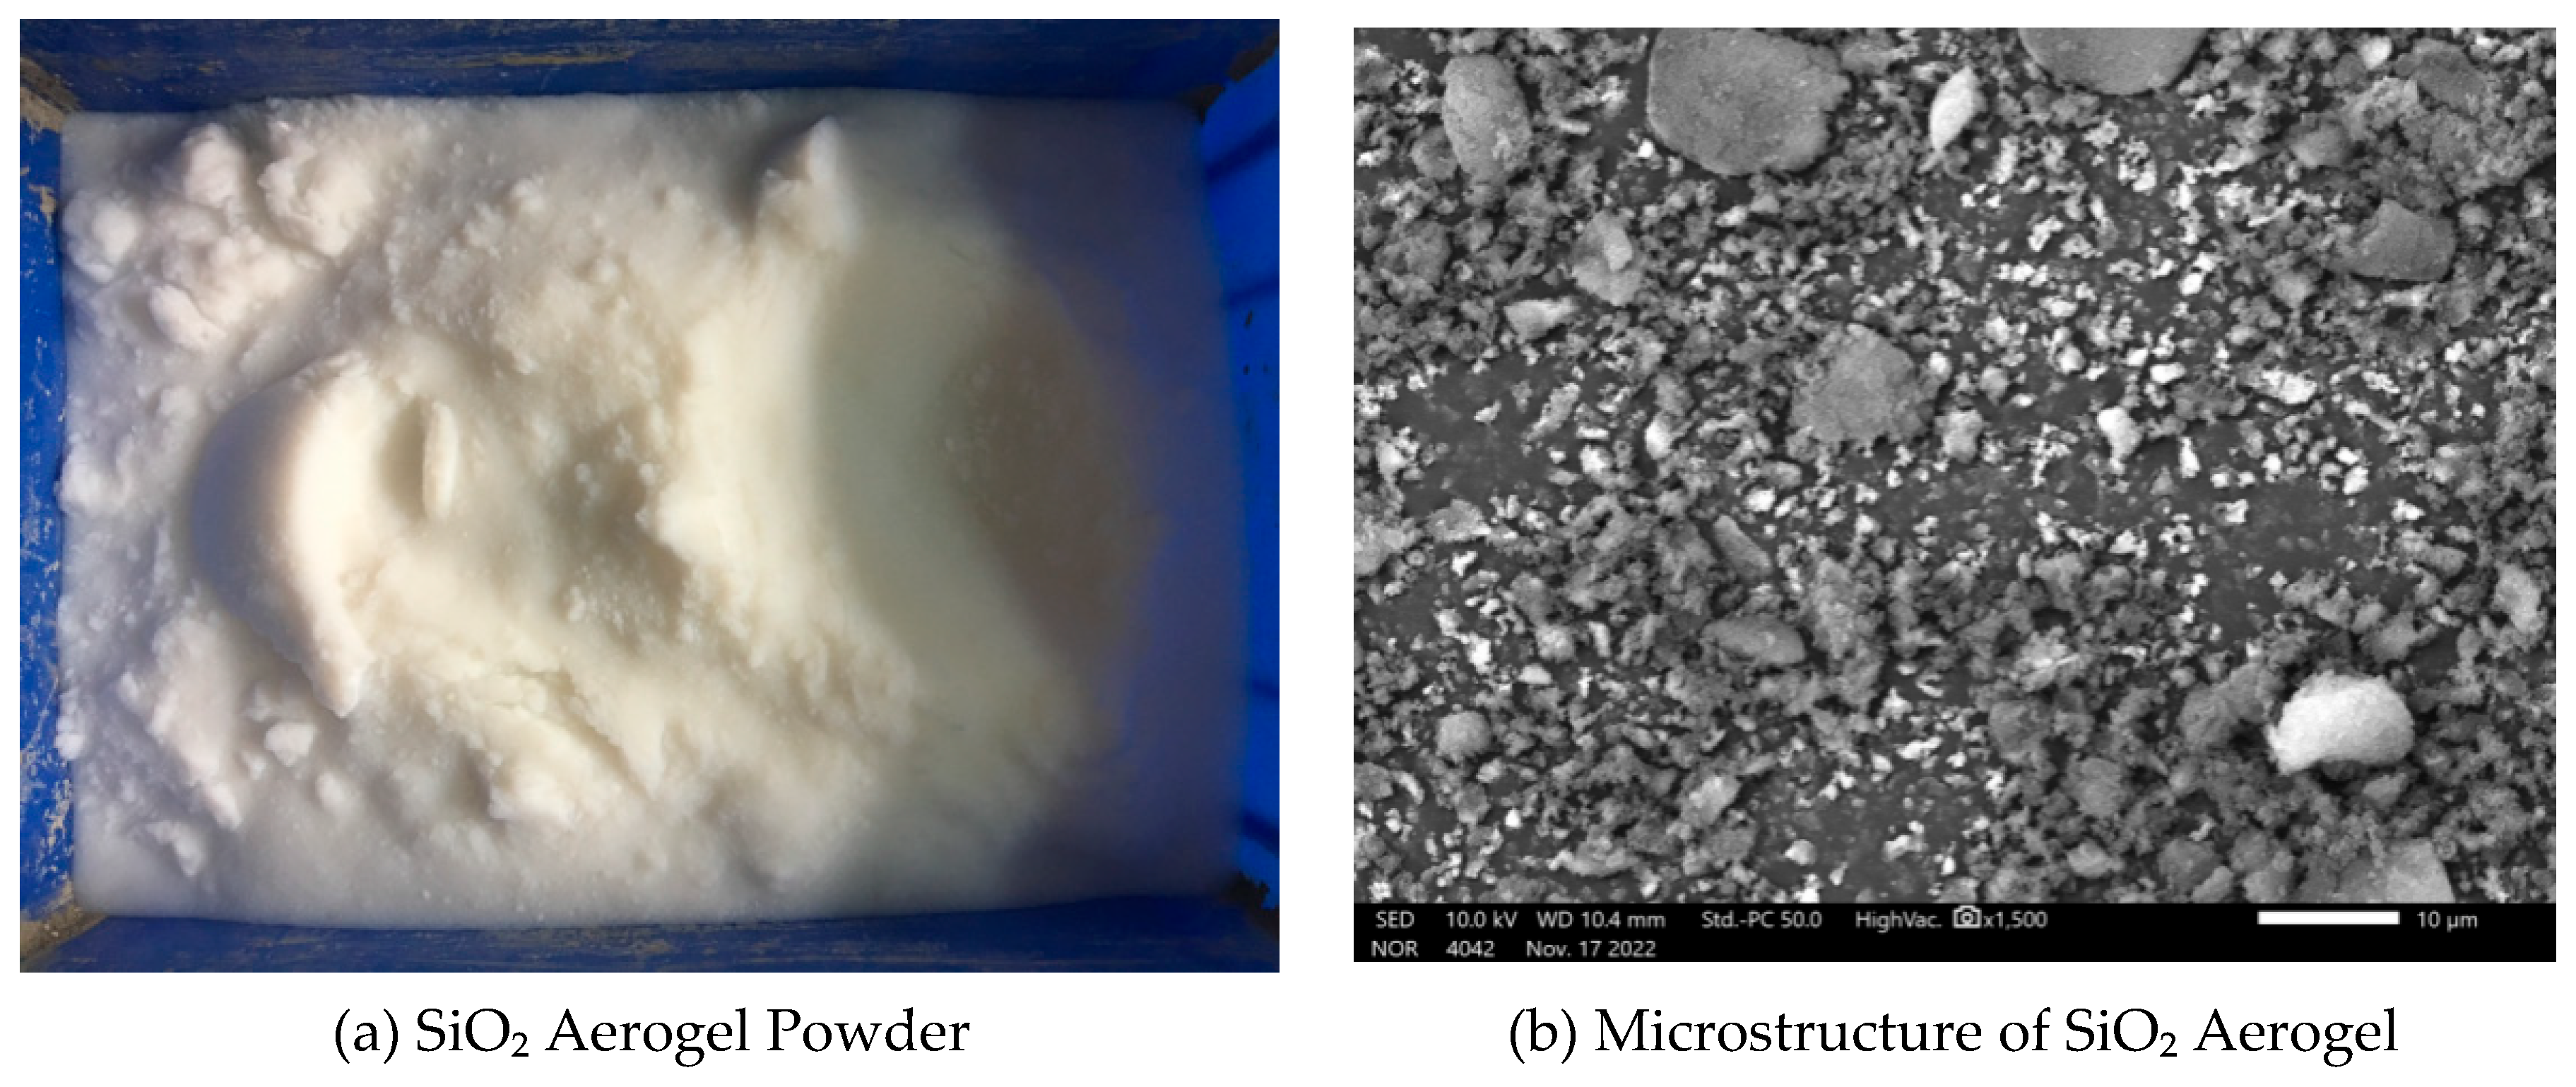
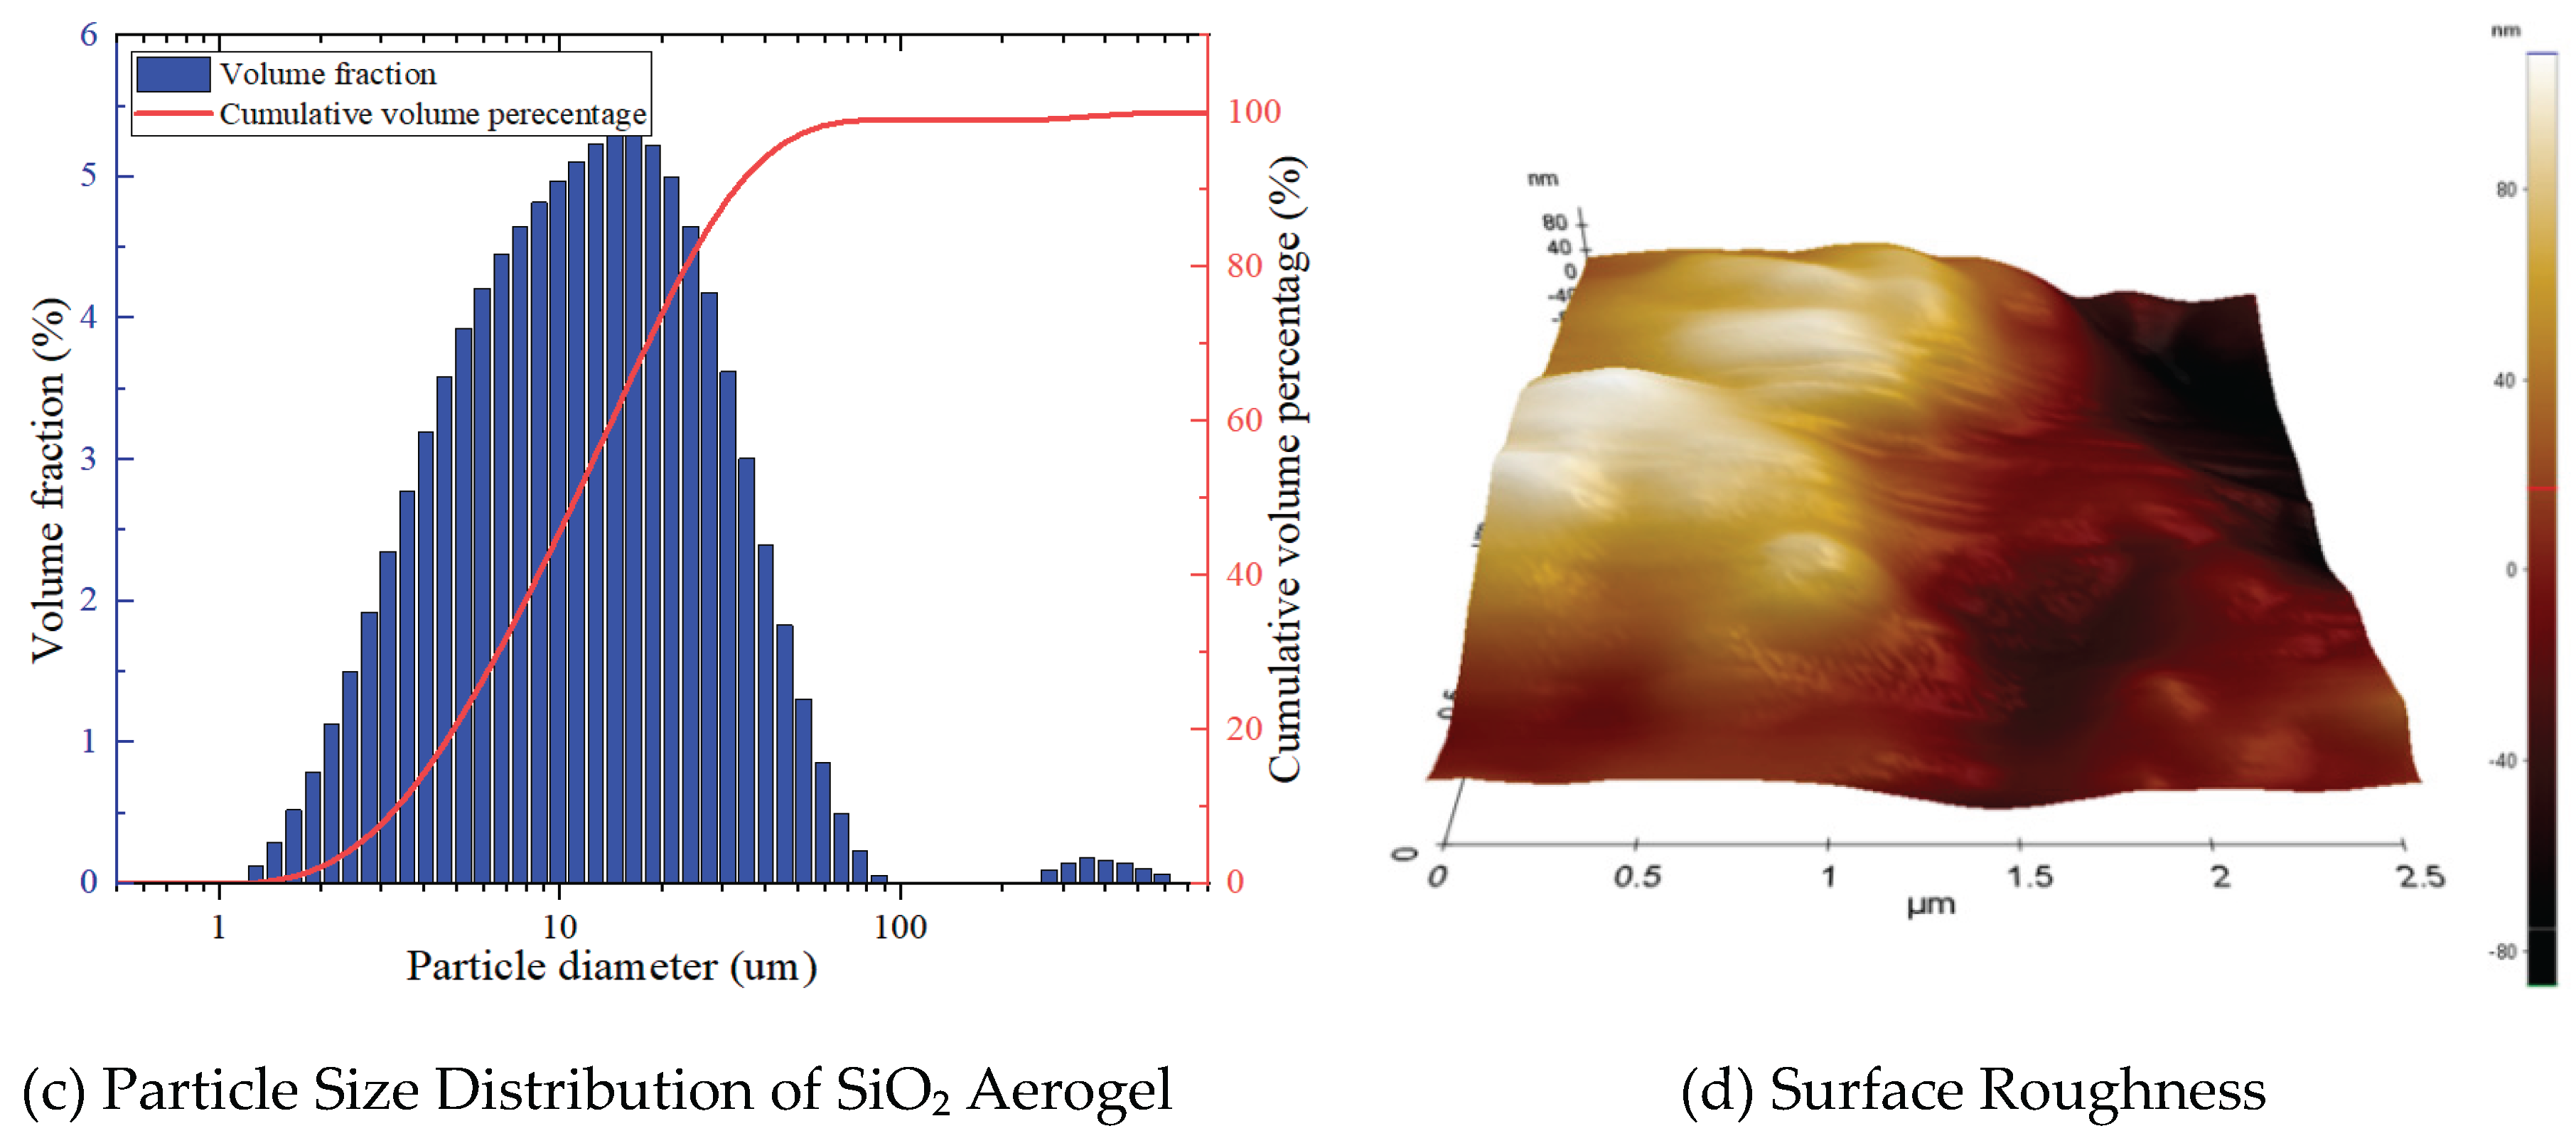
Figure 9.
Water absorption of AAFC varies with the levels of various factors.
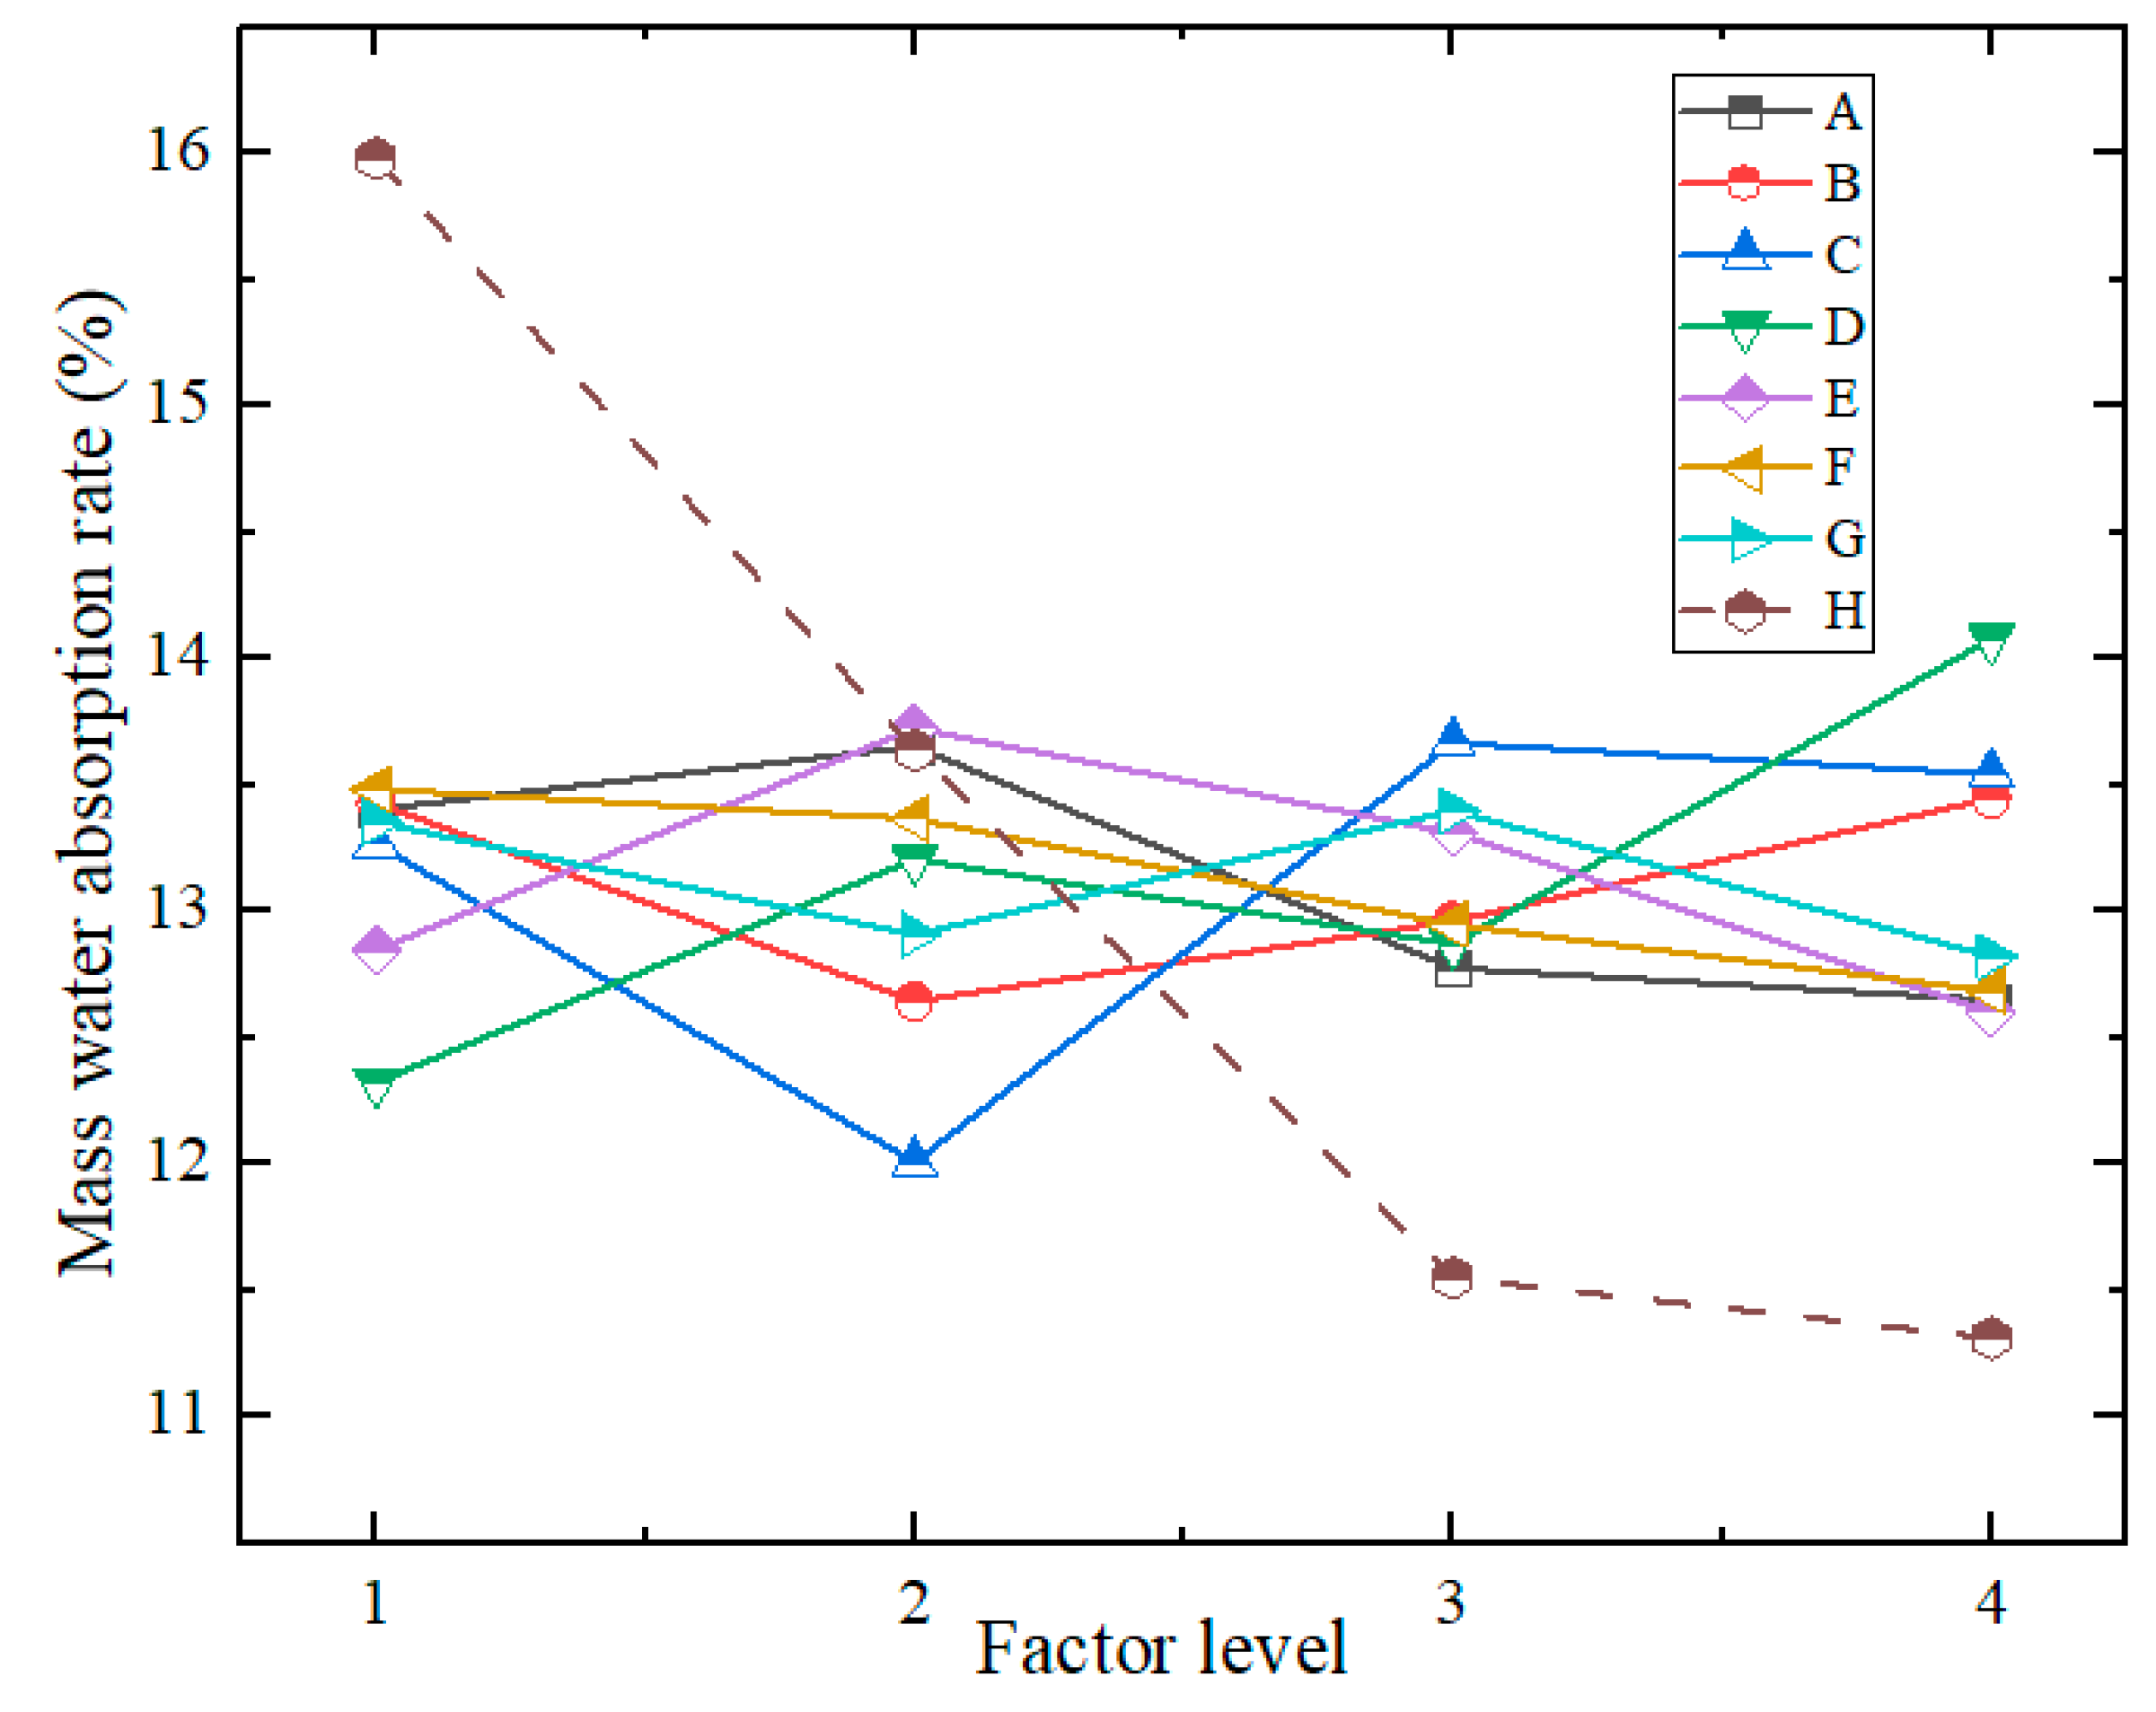
Figure 11.
Drying shrinkage of AAFC varies with the level of various factors.
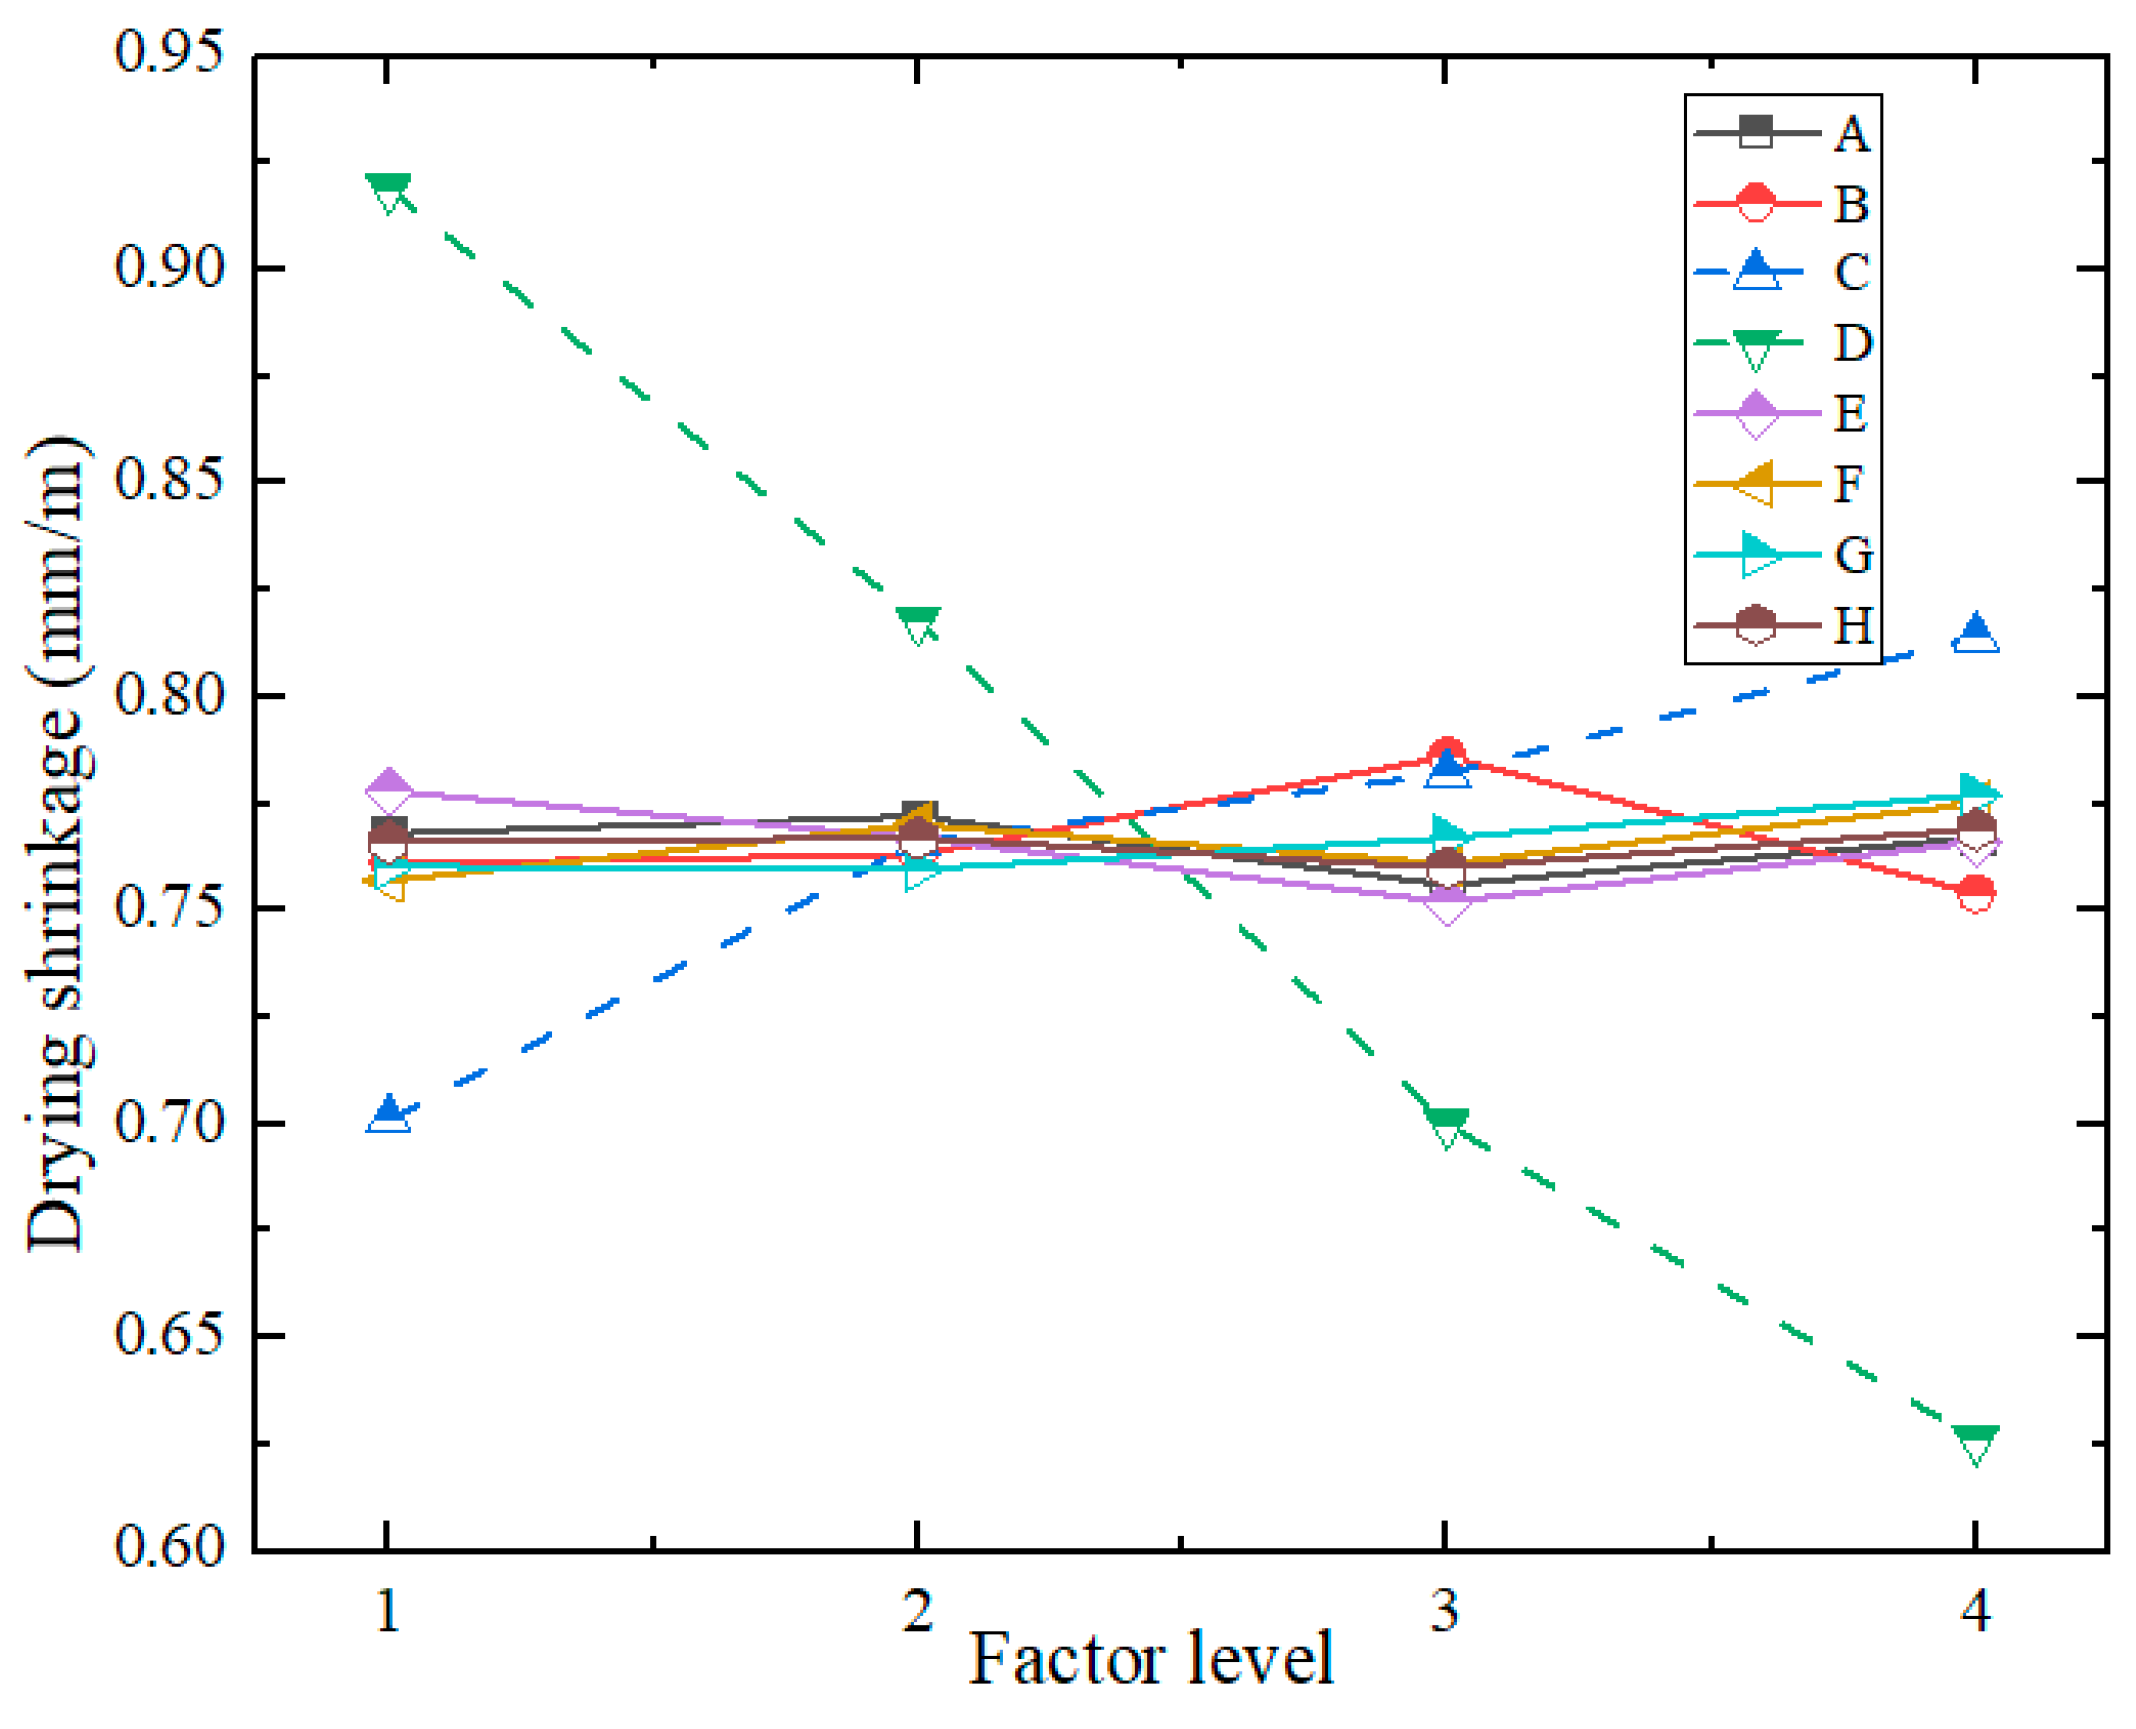
Figure 13.
Morphologies of samples with different mix ratios.
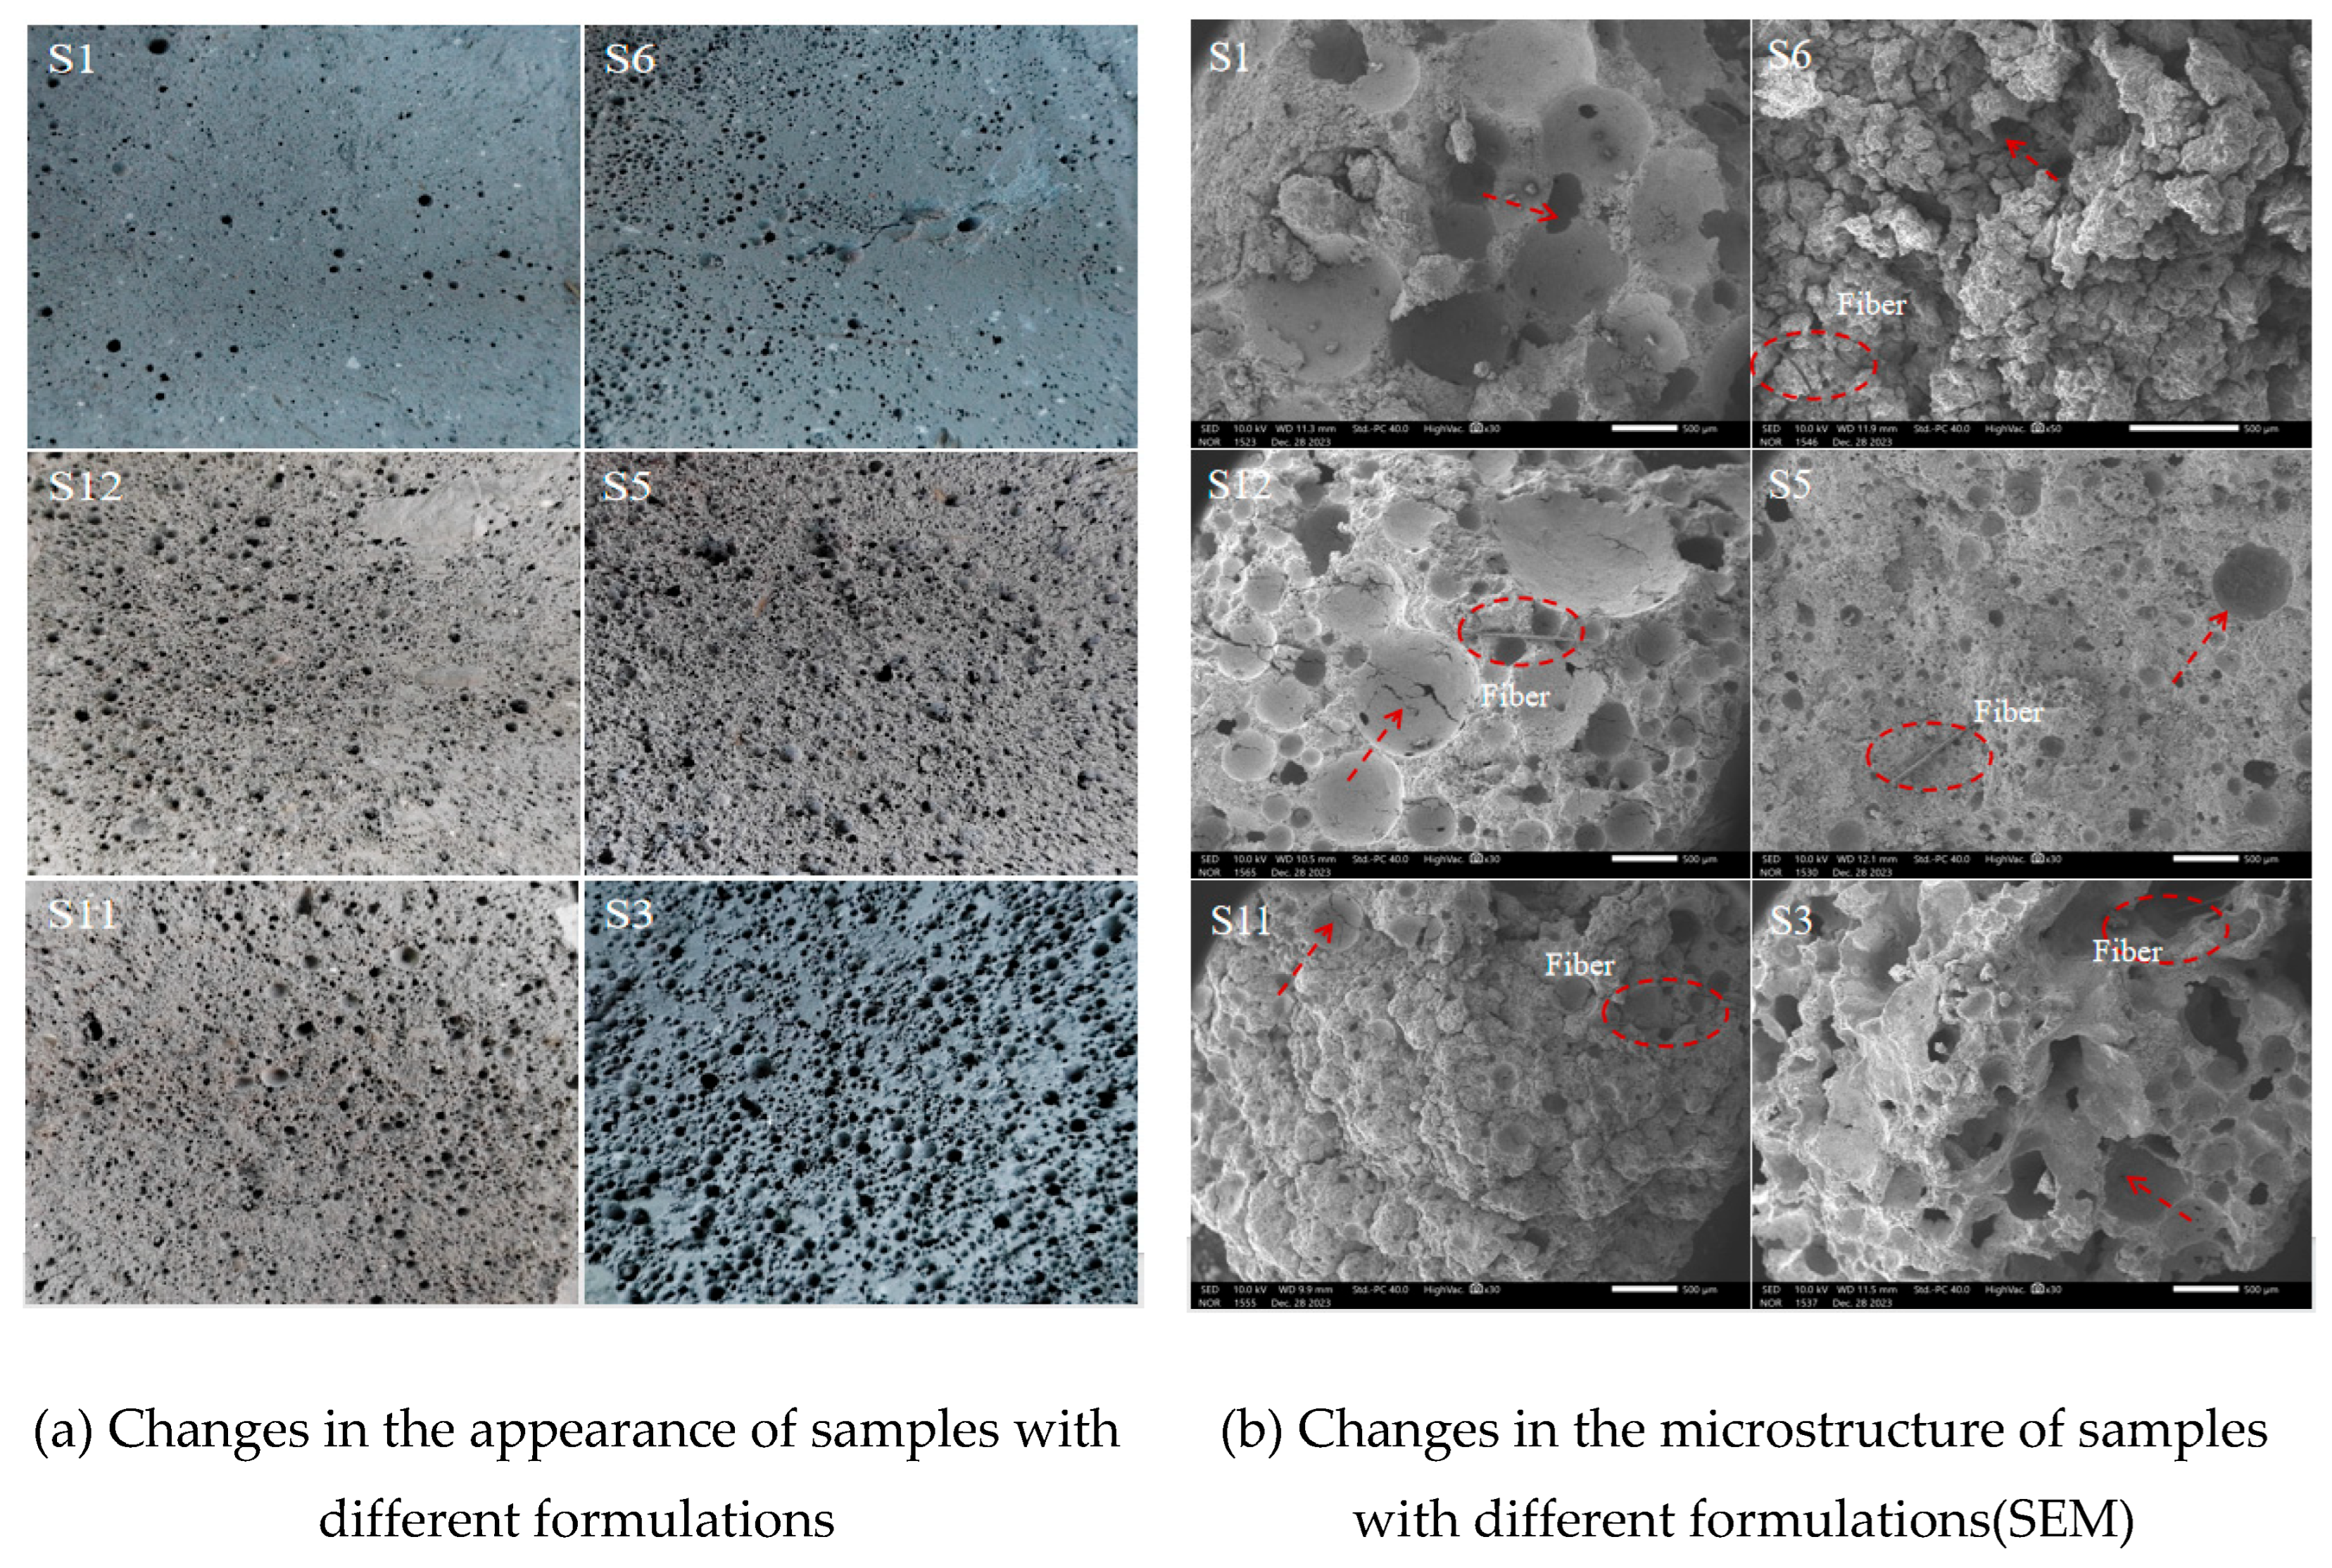
Table 1.
Target performance indexes.
| First-level Indicator Type | Second-level Indicator Name | Target Value |
| Bulk Density | Dry Density ρ | A06 (≤650 kg/m3) |
| Thermal Performance | Thermal Transmittance K | Wall Thickness 300mm,≤0.4 W/m2·K |
| Thermal Conductivity λ | ≤0.1216W/(m·K) | |
| Fire Resistance | Combustion Performance Rating FRL | Class A (Non-Combustible Material) |
| Water Resistance | Mass Water Absorption Wr | ≤5% |
| Mechanical Properties | Compressive Strength f | ≥5 MPa |
| Flexural Strength Rf | ≥1.0 MPa | |
| Drying Shrinkage ε | ≤1 mm/m | |
| Frost Resistance(F25) | Strength Loss Rate Fc | ≤25% |
| Mass Loss Rate Mm | ≤5% |
Table 2.
Performance parameters of foaming agent.
| Project | Foaming Agent Multiple n | 1-hour sedimentation distance (mm) |
Sedimentation distance (cm/h) | ||
| First-class product | Qualified Product | First-class product | Qualified Product | ||
| Indicator | 15~30 | ≤50 | ≤70 | ≤70 | ≤80 |
| Test Results | 28 | 41.1 | 59.6 | ||
Table 3.
Performance parameters of vitrified microbeads.
| Particle size(mm) | Bulk density (kg/m3) | Cylinder pressure strength (MPa) | Thermal conductivity (W/(m⋅K)) | Water absorption rate(%) | Floating rate(%) | Surface vitrification closed-cell rate (%) | Linear shrinkage rate (%) |
| 1~3 | 116 | 0.52 | 0.049 | 30 | ≥80 | ≥80 | 0.29 |
Table 4.
Performance parameters of basalt fibers.
| Fiber length mm | Relative density g/cm3 | Diameter μm | Elastic modulus GPa | Tensile strength MPa | Ultimate elongation % |
| 6 | 2.65 | 17 | 7.6 | 1050 | 3 |
Table 5.
Performance parameters of silica aerogel powder.
| Particle size μm | Bulk density kg/m3 |
Pore diamete rnm | Porosity % |
Specific surface area m2/g | Thermal conductivity W/(m·K) | Surface properties |
| 15~50 | 40~60 | 20~50 | >90 | 500~800 | <0.013 | Hydrophobic |
Table 6.
Raw material consumption for the initial mix.
| FA (kg/m3) | Sodium silicate (kg/m3) | Sodium hydroxide (kg/m3) | Foam dosage (m3/m3) | Water-to-binder Ratio | Additional water dosage (kg/m3) |
| 396.73 | 213.45 | 27.689 | 0.646 | 0.4 | 21.04 |
Table 7.
Test results of sample performance.
| Dry density | Thermal conductivity | Mass water absorption rate | Mechanical properties | Frost resistance (F25) | |||
|
ρ (kg/m3) |
λ (W/(m·K)) |
Wr (%) |
f (MPa) |
Rf (MPa) |
ε (mm/m) |
Fc (%) |
Mm (%) |
| 632.5 | 0.1975 | 57.1% | 3.76 | 0.823 | 1.432 | 44.53% | 17.36% |
Table 10.
Performance test results of mix ratio samples in orthogonal test.
| Index | Bulk Density | Thermal Performance | Water Resistance | Mechanical Properties | Frost Resistance(F25) | |||
| NO. |
ρ kg/m3 |
λ W/(m·K) |
Wr % |
f MPa |
Rf MPa |
ε mm/m |
Fc % |
Mm % |
| 1 | 654.82 | 0.1377 | 6.50 | 6.12 | 1.77 | 0.849 | 12.136 | 2.028 |
| 2 | 633.58 | 0.0990 | 4.41 | 5.47 | 1.21 | 0.841 | 11.124 | 1.623 |
| 3 | 568.23 | 0.1001 | 4.55 | 5.55 | 1.32 | 0.653 | 11.087 | 1.597 |
| 4 | 568.34 | 0.0994 | 5.50 | 5.23 | 1.01 | 0.747 | 12.391 | 2.016 |
| 5 | 581.37 | 0.0977 | 4.51 | 5.47 | 1.24 | 0.657 | 10.553 | 1.403 |
| 6 | 587.38 | 0.1138 | 5.74 | 5.62 | 1.38 | 0.623 | 12.245 | 1.981 |
| 7 | 592.23 | 0.1011 | 7.21 | 5.48 | 1.26 | 0.841 | 12.743 | 2.117 |
| 8 | 588.58 | 0.0996 | 4.46 | 5.31 | 1.11 | 0.933 | 11.135 | 1.701 |
| 9 | 563.62 | 0.0980 | 7.39 | 5.34 | 1.15 | 0.641 | 13.112 | 2.243 |
| 10 | 578.95 | 0.1137 | 4.69 | 5.58 | 1.37 | 0.738 | 11.653 | 1.781 |
| 11 | 655.77 | 0.1015 | 4.41 | 5.62 | 1.39 | 0.873 | 10.127 | 1.283 |
| 12 | 624.32 | 0.1022 | 5.33 | 6.11 | 1.85 | 0.822 | 11.753 | 1.887 |
| 13 | 618.79 | 0.1274 | 4.61 | 5.56 | 1.36 | 0.847 | 11.213 | 1.581 |
| 14 | 580.13 | 0.0968 | 5.55 | 5.64 | 1.42 | 1.025 | 11.873 | 1.904 |
| 15 | 588.27 | 0.1002 | 6.89 | 5.68 | 1.44 | 0.621 | 12.032 | 2.104 |
| 16 | 568.57 | 0.0990 | 4.81 | 5.4 | 1.15 | 0.608 | 11.038 | 1.647 |
| 17 | 621.65 | 0.1023 | 5.11 | 5.55 | 1.34 | 0.929 | 11.214 | 1.724 |
| 18 | 586.41 | 0.0988 | 4.64 | 5.46 | 1.18 | 0.841 | 10.876 | 1.549 |
| 19 | 579.69 | 0.1111 | 4.86 | 5.72 | 1.47 | 0.537 | 11.239 | 1.673 |
| 20 | 577.63 | 0.0970 | 4.77 | 5.24 | 1.08 | 0.718 | 13.037 | 2.221 |
| 21 | 574.29 | 0.1012 | 4.66 | 5.46 | 1.20 | 0.703 | 11.214 | 1.732 |
| 22 | 556.83 | 0.1028 | 7.41 | 5.33 | 1.14 | 0.704 | 13.463 | 2.362 |
| 23 | 643.22 | 0.0994 | 4.94 | 5.78 | 1.68 | 0.715 | 11.463 | 1.734 |
| 24 | 638.27 | 0.1304 | 4.49 | 6.03 | 1.78 | 0.903 | 10.357 | 1.352 |
| 25 | 578.61 | 0.0992 | 5.77 | 5.26 | 1.11 | 0.554 | 12.154 | 2.032 |
| 26 | 581.34 | 0.0999 | 4.45 | 5.47 | 1.21 | 0.694 | 10.443 | 1.427 |
| 27 | 604.32 | 0.0954 | 4.50 | 5.66 | 1.44 | 0.918 | 11.154 | 1.683 |
| 28 | 587.73 | 0.1102 | 6.55 | 5.78 | 1.49 | 0.835 | 12.522 | 2.124 |
| 29 | 645.38 | 0.1042 | 4.57 | 5.72 | 1.72 | 0.803 | 11.223 | 1.645 |
| 30 | 625.36 | 0.1008 | 4.41 | 5.77 | 1.52 | 0.922 | 12.231 | 2.102 |
| 31 | 585.66 | 0.1228 | 5.70 | 5.53 | 1.29 | 0.724 | 12.576 | 2.133 |
| 32 | 564.28 | 0.0929 | 4.52 | 5.27 | 1.11 | 0.687 | 11.137 | 1.644 |
Table 14.
Results of compressive strength range analysis.
| Index | Factors | |||||||||
| A | B | C | D | E | F | G | H | Empty Column | ||
| Compressive Strength (MPa) | K41 | 44.25 | 44.25 | 45.37 | 45.7 | 44.66 | 46.49 | 45.1 | 44.74 | 45.15 |
| K42 | 44.93 | 44.36 | 44.56 | 45.36 | 44.37 | 44.17 | 44.16 | 44.17 | 45.44 | |
| K43 | 44.57 | 45.12 | 44.68 | 43.66 | 44.38 | 43.68 | 44.87 | 44.32 | 45.51 | |
| K44 | 44.46 | 44.48 | 43.6 | 43.49 | 44.8 | 43.87 | 44.08 | 44.98 | 45.12 | |
| k41 | 5.531 | 5.531 | 5.671 | 5.713 | 5.583 | 5.811 | 5.638 | 5.593 | 5.644 | |
| k42 | 5.616 | 5.545 | 5.570 | 5.670 | 5.546 | 5.521 | 5.520 | 5.521 | 5.680 | |
| k43 | 5.571 | 5.640 | 5.585 | 5.458 | 5.548 | 5.460 | 5.609 | 5.540 | 5.689 | |
| k44 | 5.558 | 5.560 | 5.450 | 5.436 | 5.600 | 5.484 | 5.510 | 5.623 | 5.640 | |
| R | 0.085 | 0.109 | 0.221 | 0.276 | 0.054 | 0.351 | 0.128 | 0.101 | 0.049 | |
| Optimal Level |
2 | 3 | 1 | 1 | 4 | 1 | 1 | 4 | ||
Table 15.
Results of flexural strength range analysis.
| Index | Factors | |||||||||
| A | B | C | D | E | F | G | H | Empty Column | ||
| Flexural Strength (MPa) | K51 | 10.30 | 10.34 | 11.82 | 11.76 | 10.94 | 11.91 | 10.76 | 10.83 | 11.21 |
| K52 | 11.13 | 11.04 | 11.18 | 11.76 | 11.18 | 11.13 | 10.81 | 11.08 | 11.31 | |
| K53 | 10.88 | 10.97 | 10.36 | 9.84 | 10.61 | 9.82 | 10.96 | 10.67 | 11.33 | |
| K54 | 10.88 | 10.83 | 9.83 | 9.82 | 10.46 | 10.32 | 10.65 | 10.60 | 10.99 | |
| k51 | 1.287 | 1.293 | 1.477 | 1.469 | 1.367 | 1.489 | 1.345 | 1.354 | 1.401 | |
| k52 | 1.391 | 1.381 | 1.397 | 1.4701 | 1.398 | 1.391 | 1.351 | 1.385 | 1.414 | |
| k53 | 1.359 | 1.371 | 1.295 | 1.230 | 1.326 | 1.228 | 1.370 | 1.334 | 1.416 | |
| k54 | 1.360 | 1.354 | 1.228 | 1.228 | 1.307 | 1.290 | 1.331 | 1.324 | 1.373 | |
| R | 0.104 | 0.088 | 0.249 | 0.243 | 0.090 | 0.261 | 0.039 | 0.061 | 0.043 | |
| Optimal Level |
2 | 2 | 1 | 2 | 2 | 1 | 3 | 2 | ||
Table 16.
Results of drying shrinkage range analysis.
| Index | Factors | |||||||||
| A | B | C | D | E | F | G | H | Empty Column | ||
| Drying Shrinkage (mm/m) | K61 | 6.144 | 6.087 | 5.609 | 7.352 | 6.221 | 6.056 | 6.082 | 6.131 | 6.11 |
| K62 | 6.175 | 6.103 | 6.131 | 6.545 | 6.137 | 6.159 | 6.077 | 6.139 | 6.103 | |
| K63 | 6.05 | 6.284 | 6.256 | 5.602 | 6.017 | 6.089 | 6.135 | 6.081 | 6.105 | |
| K64 | 6.137 | 6.032 | 6.51 | 5.007 | 6.131 | 6.202 | 6.212 | 6.155 | 6.049 | |
| k61 | 0.768 | 0.761 | 0.701 | 0.919 | 0.778 | 0.757 | 0.7603 | 0.766 | 0.764 | |
| k62 | 0.772 | 0.763 | 0.766 | 0.818 | 0.767 | 0.770 | 0.7596 | 0.767 | 0.763 | |
| k63 | 0.756 | 0.786 | 0.782 | 0.700 | 0.752 | 0.761 | 0.767 | 0.760 | 0.763 | |
| k64 | 0.767 | 0.754 | 0.814 | 0.626 | 0.766 | 0.775 | 0.777 | 0.769 | 0.756 | |
| R | 0.016 | 0.031 | 0.113 | 0.293 | 0.026 | 0.018 | 0.017 | 0.009 | 0.008 | |
| Optimal Level |
3 | 4 | 1 | 4 | 3 | 1 | 2 | 3 | ||
Table 17.
Results of strength loss rate range analysis.
| Index | Factors | |||||||||
| A | B | C | D | E | F | G | H | Empty Column | ||
| Strength Loss Rate (%) | K71 | 93.414 | 92.712 | 90.927 | 90.227 | 93.846 | 93.941 | 93.301 | 101.276 | 93.958 |
| K72 | 92.801 | 93.310 | 92.228 | 92.917 | 93.830 | 92.350 | 93.475 | 95.669 | 93.409 | |
| K73 | 92.863 | 94.015 | 94.313 | 93.899 | 92.261 | 92.774 | 92.363 | 89.780 | 93.333 | |
| K74 | 93.440 | 92.481 | 95.050 | 95.475 | 92.581 | 93.453 | 93.379 | 85.793 | 93.818 | |
| k71 | 11.677 | 11.589 | 11.366 | 11.278 | 11.731 | 11.743 | 11.663 | 12.660 | 11.745 | |
| k72 | 11.600 | 11.664 | 11.529 | 11.615 | 11.729 | 11.544 | 11.684 | 11.959 | 11.676 | |
| k73 | 11.608 | 11.752 | 11.789 | 11.737 | 11.533 | 11.597 | 11.545 | 11.223 | 11.667 | |
| k74 | 11.680 | 11.560 | 11.881 | 11.934 | 11.573 | 11.682 | 11.672 | 10.724 | 11.727 | |
| R | 0.080 | 0.192 | 0.515 | 0.656 | 0.198 | 0.199 | 0.139 | 1.935 | 0.078 | |
| Optimal Level |
2 | 4 | 1 | 1 | 3 | 2 | 3 | 4 | ||
Table 18.
Results of mass loss rate range analysis.
| Index | Factors | |||||||||
| A | B | C | D | E | F | G | H | Empty Column | ||
| Mass Loss Rate (%) | K81 | 14.466 | 14.407 | 13.902 | 13.777 | 14.724 | 14.653 | 14.478 | 17.301 | 14.523 |
| K82 | 14.43 | 14.484 | 14.24 | 14.26 | 14.617 | 14.447 | 14.691 | 15.411 | 14.556 | |
| K83 | 14.347 | 14.71 | 14.81 | 14.817 | 14.225 | 14.478 | 14.468 | 13.485 | 14.308 | |
| K84 | 14.79 | 14.432 | 15.081 | 15.179 | 14.467 | 14.455 | 14.396 | 11.836 | 14.377 | |
| k81 | 1.808 | 1.801 | 1.738 | 1.722 | 1.841 | 1.832 | 1.810 | 2.163 | 1.815 | |
| k82 | 1.804 | 1.811 | 1.780 | 1.783 | 1.827 | 1.806 | 1.836 | 1.926 | 1.820 | |
| k83 | 1.793 | 1.839 | 1.851 | 1.852 | 1.778 | 1.810 | 1.809 | 1.686 | 1.789 | |
| k84 | 1.849 | 1.804 | 1.885 | 1.897 | 1.808 | 1.807 | 1.800 | 1.480 | 1.797 | |
| R | 0.055 | 0.038 | 0.147 | 0.175 | 0.062 | 0.026 | 0.037 | 0.683 | 0.031 | |
| Optimal Level |
3 | 1 | 1 | 1 | 3 | 2 | 4 | 4 | ||
Table 19.
Results of variance analysis of orthogonal test.
| Index | Source of variance | Sum of squared deviations | Degree of freedom | Mean square Ms | F Value | Significance | |
| Dry Density (kg/m³) | A | SSA | 2.870 | 3 | 0.957 | 0.044 | |
| B | SSB | 89.649 | 3 | 29.883 | 1.365 | ||
| C | SSC | 6983.224 | 3 | 2327.741 | 106.320 | ** | |
| D | SSD | 15584.462 | 3 | 5194.821 | 237.275 | ** | |
| E | SSE | 142.314 | 3 | 47.438 | 2.167 | ||
| F | SSF | 566.568 | 3 | 188.856 | 8.626 | (*) | |
| G | SSG | 630.865 | 3 | 210.288 | 9.605 | * | |
| H | SSH | 174.463 | 3 | 58.154 | 2.656 | ||
| Error E | SSE | 65.681 | 3 | 21.894 | |||
| Sum | SST | 24240.096 | 31 | ||||
| Thermal Conductivity (W/(m·K)) | A | SSA | 3.59384E-05 | 3 | 1.198E-05 | 2.7289 | |
| B | SSB | 8.13828E-05 | 3 | 2.713E-05 | 6.1796 | (*) | |
| C | SSC | 0.000107308 | 3 | 3.577E-05 | 8.1481 | (*) | |
| D | SSD | 0.000149903 | 3 | 4.997E-05 | 11.3825 | * | |
| E | SSE | 7.37212E-05 | 3 | 2.457E-05 | 5.5978 | (*) | |
| F | SSF | 0.002821489 | 3 | 0.0009405 | 214.2426 | ** | |
| G | SSG | 8.81847E-05 | 3 | 2.939E-05 | 6.6961 | (*) | |
| H | SSH | 5.35474E-05 | 3 | 1.785E-05 | 4.0660 | ||
| Error E | SSE | 1.32E-05 | 3 | 4.39E-06 | |||
| Sum | SST | 0.003425 | 31 | ||||
| Mass Water Absorption Rate (%) | A | SSA | 18.2856 | 3 | 6.0952 | 8.5416 | (*) |
| B | SSB | 16.3877 | 3 | 5.4626 | 7.6550 | (*) | |
| C | SSC | 45.2873 | 3 | 15.0958 | 21.1547 | * | |
| D | SSD | 57.3406 | 3 | 19.1135 | 26.7850 | * | |
| E | SSE | 31.0806 | 3 | 10.3602 | 14.5184 | * | |
| F | SSF | 12.6851 | 3 | 4.2284 | 5.9255 | (*) | |
| G | SSG | 9.5971 | 3 | 3.1990 | 4.4830 | ||
| H | SSH | 80.2010 | 3 | 26.7337 | 37.4636 | ** | |
| Error E | SSE | 2.141 | 3 | 0.714 | |||
| Sum | SST | 273.0056 | 31 | ||||
| Compressive Strength (MPa) | A | SSA | 0.0335 | 3 | 0.0112 | 9.8946 | * |
| B | SSB | 0.0436 | 3 | 0.0145 | 12.8866 | * | |
| C | SSC | 0.2581 | 3 | 0.0860 | 76.2713 | ** | |
| D | SSD | 0.3975 | 3 | 0.1325 | 117.4714 | ** | |
| E | SSE | 0.0165 | 3 | 0.0055 | 4.8859 | ||
| F | SSF | 0.4868 | 3 | 0.1623 | 143.8448 | ** | |
| G | SSG | 0.0281 | 3 | 0.0094 | 8.3063 | (*) | |
| H | SSH | 0.0304 | 3 | 0.0101 | 8.9712 | (*) | |
| Error E | SSE | 0.0034 | 3 | 0.0011 | |||
| Sum | SST | 1.2979 | 31 | ||||
| Flexural Strength (MPa) | A | SSA | 0.2966 | 3 | 0.0989 | 29.0104 | * |
| B | SSB | 0.1443 | 3 | 0.0481 | 14.1092 | * | |
| C | SSC | 0.3822 | 3 | 0.1274 | 37.3773 | ** | |
| D | SSD | 0.3745 | 3 | 0.1248 | 36.6244 | ** | |
| E | SSE | 0.2225 | 3 | 0.0742 | 21.7644 | * | |
| F | SSF | 0.4065 | 3 | 0.1355 | 39.7534 | ** | |
| G | SSG | 0.0900 | 3 | 0.0300 | 8.7988 | (*) | |
| H | SSH | 0.0943 | 3 | 0.0314 | 9.2191 | (*) | |
| Error E | SSE | 0.0102 | 3 | 3.41E-03 | |||
| Sum | SST | 2.0210 | 31 | ||||
| Drying Shrinkage (mm/m) | A | SSA | 0.0349 | 3 | 0.0116 | 2.0999 | |
| B | SSB | 0.1196 | 3 | 0.0399 | 7.2035 | (*) | |
| C | SSC | 0.1311 | 3 | 0.0437 | 7.8952 | (*) | |
| D | SSD | 0.4267 | 3 | 0.1422 | 25.6941 | * | |
| E | SSE | 0.0486 | 3 | 0.0162 | 2.9261 | ||
| F | SSF | 0.0413 | 3 | 0.0138 | 2.4885 | ||
| G | SSG | 0.0382 | 3 | 0.0127 | 2.3019 | ||
| H | SSH | 0.0295 | 3 | 0.0098 | 1.7760 | ||
| Error E | SSE | 0.0166 | 3 | 0.0055 | |||
| Sum | SST | 0.8866 | 31 | ||||
| Strength Loss Rate (%) | A | SSA | 7.2638 | 3 | 2.4213 | 5.0263 | |
| B | SSB | 11.8639 | 3 | 3.9546 | 8.2094 | (*) | |
| C | SSC | 20.5288 | 3 | 6.8429 | 14.2052 | * | |
| D | SSD | 21.6072 | 3 | 7.2024 | 14.9514 | * | |
| E | SSE | 14.2014 | 3 | 4.7338 | 9.8269 | * | |
| F | SSF | 12.1380 | 3 | 4.0460 | 8.3990 | (*) | |
| G | SSG | 9.3936 | 3 | 3.1312 | 6.5000 | (*) | |
| H | SSH | 45.0139 | 3 | 15.0046 | 31.1481 | ** | |
| Error E | SSE | 1.4452 | 3 | 0.4817 | |||
| Sum | SST | 143.4557 | 31 | ||||
| Mass Loss Rate (%) | A | SSA | 0.2816 | 3 | 0.0939 | 8.4316 | (*) |
| B | SSB | 0.2977 | 3 | 0.0992 | 8.9154 | (*) | |
| C | SSC | 0.9241 | 3 | 0.3080 | 27.6718 | * | |
| D | SSD | 1.0934 | 3 | 0.3645 | 32.7423 | ** | |
| E | SSE | 0.3931 | 3 | 0.1310 | 11.7724 | * | |
| F | SSF | 0.1694 | 3 | 0.0565 | 5.0716 | ||
| G | SSG | 0.2258 | 3 | 0.0753 | 6.7621 | (*) | |
| H | SSH | 1.9874 | 3 | 0.6625 | 59.5113 | ** | |
| Error E | SSE | 0.3339 | 3 | 0.1113 | |||
| Sum | SST | 5.7064 | 31 | ||||
Disclaimer/Publisher’s Note: The statements, opinions and data contained in all publications are solely those of the individual author(s) and contributor(s) and not of MDPI and/or the editor(s). MDPI and/or the editor(s) disclaim responsibility for any injury to people or property resulting from any ideas, methods, instructions or products referred to in the content. |
© 2025 by the authors. Licensee MDPI, Basel, Switzerland. This article is an open access article distributed under the terms and conditions of the Creative Commons Attribution (CC BY) license (http://creativecommons.org/licenses/by/4.0/).
Copyright: This open access article is published under a Creative Commons CC BY 4.0 license, which permit the free download, distribution, and reuse, provided that the author and preprint are cited in any reuse.


