Submitted:
21 November 2025
Posted:
24 November 2025
You are already at the latest version
Abstract
Due to a number of advantages, such as the high power-to-weight ratio of the system, the possibility of easy control and the freedom of arrangement of the system components on the machine, hydrostatic drive is one of the most popular methods of machine drive. The actuators in such a system are hydraulic cylinders that convert fluid pressure energy into mechanical energy for reciprocating motion. One disadvantage of conventional actuators is their weight, so research is being conducted to make them as light as possible. Directions for this research include the use of modern engineering materials such as composites and plastics. This paper presents the possibility of using new lightweight yet strong materials for the design of a hydraulic cylinder. The base of the hydraulic cylinder were designed and subjected to FEM numerical analyses. The base was made of PET. In addition, a composite cylinder made of wound carbon fibre was subjected to numerical analyses and experimental validation. The numerical calculations were verified in experimental studies. To improve the reliability of the numerical calculations, the material parameters of the composite materials were determined experimentally instead of being taken from the manufacturer's data sheets.
Keywords:
hydraulic drive
; actuator
; hydraulic cylinder
; composite material
; carbon fibre
1. Introduction
A composite material is formed by combining two or more distinct base materials that typically possess contrasting properties. The combination yields a material with enhanced or unique characteristics that surpass those of the individual components or their simple sum [1,2]. Generally, one constituent serves as the matrix — a continuous medium that binds the structure — while the other acts as the reinforcement or filler. In the category of fibre-reinforced composites, two principal types are identified: short (chopped) fibre-reinforced and continuous fibre-reinforced composites [3,4]. The reinforcing fibres, commonly made of glass, carbon, or aramid, exhibit high tensile strength and a high modulus of elasticity along their length. When stored and processed under suitable conditions, these fibres maintain their mechanical properties, with only minimal variation in diameter and performance among fibres of the same type.
Composite materials are widely used across various engineering disciplines, including transport engineering [5], marine engineering [6], and aerospace applications [7]. They are also increasingly utilized in mechanical power transmission systems and actuators, such as hydraulic drives [8,9] (see Figure 1). Their broad applicability arises from several advantageous characteristics [10,11,12], including low weight, high stiffness and strength, excellent vibration damping capability, and strong resistance to corrosion.
Back to machines design, one of the most popular types of drives is the hydrostatic drive, how was mention above, it consists of a pump that converts kinetic energy (usually the rotational movement of a shaft) into the pressure energy of a fluid, a set of valves whose task is to control the flow parameters (rate, direction, pressure), receivers (motors and cylinder/actuators) that convert the pressure energy of the fluid into mechanical energy, and other elements such as pipes and accumulators [13,14]. In hydraulic actuator, the fluid acts on a movable element of the actuator (called a piston), generating a force directly proportional to the pressure and surface area of the element [15,16]. In recent years, several trends have emerged in the development of composite hydraulic components and systems. The key directions for the development of this type elements of hydraulics are the introduction of electronic components (microcontrollers, sensors, etc.), miniaturization (reduction of dimensions), and the introduction of new materials that reduce weight while offering good strength properties and resistance to the working environment, including hydraulic oil [17,18]. At the same moment composite materials are increasingly used in the design of hydraulic actuator components [19]. The resulting material has better and/or new properties compared to the components used separately or resulting from their combination [20].
Among fibrous composites (in which reinforcement is realized by fibers), we can distinguish two main types: those reinforced with chopped (short) fibers and those reinforced with continuous fibers [21]. The fibers (usually glass, carbon or aramid) have a high modulus of elasticity along their axis and high tensile strength. In the paper, continuous carbon fibers were used as reinforcement. Such fibers are mostly produced by pyrolytic carbonization of polyacrylonitrile (PAN) fibers [20]. Depending on the precursor used and the parameters of the technological process, the density of the finished fibers ranges from 1.6 to 2.0 g/cm3, with the density of most precursors ranging from 1.14 to 1.19 g/cm3 [22]. Two main areas of application for composite materials in hydraulic components can be distinguished. The first is the design of accumulators [23,24], in which many analogies can be found with high-pressure, fourth-generation storage vessels. The second, more widely described in the literature, is the manufacture of cylinders or other parts of hydraulic actuators.
Mantovani et al. [25,26], proposed a method for determining the strength of a composite cylinder with a steel liner, considering both the ultimate strength and the possibility of buckling. In their calculations, they used a modified version of the classic Lame solution, adapted to the properties of anisotropic materials. The design assumptions were made to ensure adequate ultimate strength of the cylinder and to limit deformations, both circumferential in the cylinder wall and axial in the liner. Since the cylinder had to be capable of transferring loads along the axis, the authors designed layers with axially aligned fibers in its structure. However, this arrangement is difficult to achieve technologically and requires the use of special manufacturing techniques. Finally, a modal analysis was performed, which showed that the natural frequencies of the composite cylinder are similar to those observed in the steel counterpart.
Ritchie et al. [27] and Li et al. [28] performed a Finite Element Method (FEM) analysis and manufactured and tested a piston and gland made of carbon fiber reinforced composite. Commercially available tubes were used for their production, which were then subjected to machining, which is not recommended for composite materials. The authors assess the machinability of the material as average, while the quality of the surface obtained and the dimensional accuracy as low. Corrosion tests and mass analysis showed the superiority of the composite over steel in these aspects. However, the paper does not present the results of tests on a complete actuator. The usefulness of using continuous fiber composites for the production of such components as pistons may be questionable. The machining used leads to discontinuity of the reinforcing fibers, which negatively affects strength. In addition, known fiber composite forming techniques are not suitable for the manufacturing of parts with such a compact geometry.
However, despite numerous studies devoted to composite pressure vessels and liners, there remains a lack of comprehensive research that integrates both numerical and experimental verification of composite hydraulic cylinder elements under realistic working conditions. Addressing this research gap is of high practical relevance, as it enables the development of design methodologies ensuring the safe and efficient use of composite materials in fluid-power systems. Therefore, the present study focuses on the numerical modelling and experimental validation of composite hydraulic cylinder components, aiming to assess their strength, stiffness, and applicability in engineering practice.
As part of the work, it was decided to carry out numerical calculations and experimental tests of a double-acting hydraulic actuator with a single piston rod. An actuator design with tie rods was chosen (Figure 2) and preliminary design parameters of the actuator shown in Table 1.
This was dictated by the simplicity of the design. Drilling or threading composite elements is not recommended due to the drastic reduction in the mechanical properties of the resulting connection. The selected design does not require additional machining of the cylinder or the use of adhesive joints. This is one of the most common types of actuators in engineering, and therefore the results obtained could have a broad impact on engineering practice.
2. Numerical and Experimental Testing of the Actuator Base
The weight of the actuator can be reduced by replacing its steel components with lighter ones, e.g., made of plastics. In this study, a plastic actuator base was designed. When selecting a material for the base, it is necessary to take into account its properties such as strength, glass transition temperature, availability, price, and machinability. In this work, the material was selected, the base was made from the selected material, its strength was calculated using the Finite Element Method (FEM), and the obtained results were validated experimentally. Table 2 presents selected structural properties of plastics that were taken into account at the stage of selecting the material for the base. Polyethylene terephthalate (PET) was selected for the base.
This choice was dictated by the fact that it has high mechanical strength and good machinability. This choice was dictated by its high mechanical strength and good machinability. A glass transition temperature above 80˚C ensures that the mechanical properties remain unchanged at elevated temperatures, which are often found in hydrostatic systems. Compared to other engineering plastics (such as POM or PEEK), its price is several times lower.
2.1. Material Testing (Base)
The accuracy of numerical results is highly dependent on the values of parameters and material constants entered during the calculations. Therefore, to verify the material properties of the plastic (PET) specified by the manufacturer and to obtain the actual σ-ε curve, a static tensile test was performed in accordance with ISO 527-2 [29], using a Tinus Olsen H25KT tensile testing machine. Six type 1B samples were tested at a speed of 1 mm/min. An exemplary plot of the stress-strain relationship is shown in Figure 3. As can be seen, this relationship is non-linear.
The results of the static tensile test showed that the tensile strength is slightly lower than that declared by the manufacturer (73.3 ± 3.2 MPa), while the Young’s modulus is slightly higher (3652 ± 240 MPa).
The values of the parameters characterizing the material from which the base and gland were made, determined in preliminary experimental tests, were then used in numerical FEM calculations.
2.2. Numerical Calculations of the Base
The strength calculations for the gland were performed using the Finite Element Method (FEM) in ANSYS® Mechanical™ 2021/R2 software. Figure 4(a) shows a geometric model of the base with a cylinder, rod, connector and washer. Due to the presence of two planes of symmetry, only ¼ of the entire system was modelled. The model was divided into finite elements with a predominance of Hex20 elements with a size of 1 mm. The final mesh had 766882 nodes and 191521 elements. The model, divided into finite elements, is shown in Figure 4(b).
The base was assigned non-linear material properties, which were previously determined experimentally in a static tensile test (Figure 3). The cylinder, tie rod, washer and connector were assigned the material properties of Structural steel from the ANSYS library (E = 200 GPa, ν = 0.3). Bonded contacts were assigned between the washer and the base, between the connector and the base, and between the washer and the bolt. A frictional contact with a friction coefficient of 0.2 was assigned between the base and the cylinder (Figure 5). This reflects the actual conditions of interaction between the parts.
The model was supported in two places – on the end surface of the tie rod and on the end surface of the cylinder (Figure 6a). The simulation was divided into two steps. In the first step, the tie rod was pre-tensioned with a force of 4900 N (Figure 6b), and in the second step, the system was loaded with an internal pressure of 20 MPa (Figure 6b).
Figure 7 show the deformations of the model at the locations where the strain gauges were attached in the experimental test. In order to obtain correct results, two areas of appropriate dimensions (corresponding to ½ of the strain gauge grid area) were selected on the test surface, and the deformation results in specific directions were averaged over this area. The results are shown in Table 3
The maximum stress reduced according to the Huber-Mises hypothesis in the first step of the simulation was 27 MPa, while in the second step was 67.2 MPa. However, these values occur at the edge where the cross-section changes, and their high value results from numerical singularities occurring in these areas. The stress distribution on the surface of the element is shown in Figure 8.
2.3. Experimental Testing of the Actuator Base
A physical prototype of the base was made by machining solid Tecapet White material. A photo of the finished element, whose weight (including the connector) was 386.7 g, is shown in Figure 9(a). The base deformation measurements were performed using TENMEX TF-5 strain gauges with a strain gauge constant of 2.19 ± 2% and a resistance of 350 Ω ± 2%. The HBM QuantumX MX440B interface and a PC with Catman AP software were used to acquire measurement data. The arrangement of the strain gauges on the base is shown in Figure 9(b). The sensors were attached to the element using ThreeBond 1731 cyanoacrylate adhesive.
The element was mounted in the actuator, and then the loading procedure was carried out. This procedure consisted of two steps: the first (Step 1) was to preload the tie rods with a torque of 10 Nm on each rod (which generated a tensile force of 4900 N on each rod), the second (Step 2) was to load the piston chamber of the actuator with an internal pressure of 20 MPa. The results of the deformation measurements are presented in Figure 10 and Figure 11.
Table 4 summarizes the results of the base deformation measurements and compares them with the results of the FEM analysis.
In the X direction, the differences are 67.5% for step 1 and 26.8% for step 2. In the Y direction, the differences are smaller, at 7.2% in the first step and 17.2% in the second step.
3. Numerical and Experimental Testing of the Actuator Cylinder
Due to the significant influence of individual components and manufacturing technology on the mechanical properties of composite materials, a full characterization of the material was performed. The material was selected, the cylinder was made from the selected material, its strength was calculated and the obtained results were validated experimentally.
3.1. Material Testing (Cylinder)
The samples were made by winding Toho Tenax HTS40 F13 12K 800tex carbon fiber and Araldite LY 1564 epoxy resin with Aradur 3486 hardener. Flat plates with four layers, unidirectional fiber orientation, dimensions of 250x250 mm, and a thickness of 1.2 mm were wound, from which appropriate samples were cut for testing Young’s moduli E1t and E2t and ultimate strength (σ1T)ult and (σ2T)ult in tension were determined in accordance with ASTM D3039 [30] in a static tensile test. Five samples of each type were tested. Figure 12 (a) shows a sample mounted in the grip of an MTS 810 testing machine with an extensometer installed.
Young’s moduli E1c and E2c and ultimate strength (σ1C)ult and (σ2C)ult in compression were determined in accordance with ASTM D6641 [31]. It involves compressing a sample mounted in a specially designed holder that prevents the element from buckling during the test (Figure 12b). Deformations were recorded using strain gauges placed on the measuring part of the sample. Two strain gauges were affixed to each sample, one on each surface, to eliminate the influence of bending due to possible buckling. Five samples of each type were tested.
Kirchhoff modulus G12 and shear strength (τ12)ult were determined in accordance with ASTM D7078 [32]. In this test, a rectangular sample with notches was placed in a fixture as shown in Figure 12(c). The grip was then loaded in tension, causing shear in the area of the sample between the notches. Strain gauges affixed to the test area at an angle of ±45° to the test direction allow the deformation γ to be recorded. Five samples were tested.
3.2. Strength Calculations of the Composite Cylinder
In the strength calculations for the composite cylinder, an orthotropic material model was used, whose properties were determined experimentally and summarized in Table 5.
The most general relationship between deformation and stress for an anisotropic material is given by Equation (1):
where respectively (for i, j = 1, 2, 3, ... n): σi - normal stresses; τij - tangential stresses; εi - normal strain; γij - shear strain; [C] - material stiffness matrix.
The relationship between stress and strain can also be written as:
where, σ4=τ23, σ5=τ31, σ6=τ12, ε4=γ23, ε5=γ31, ε6=γ12.
The strain energy accumulated in a unit volume of the body is expressed by the formula:
Substituting Equation (2) and Hooke’s law into the above equation, one can obtain:
Therefore:
The stiffness matrix for an orthotropic material (i.e., one with two mutually perpendicular planes of symmetry) can be written as follows:
When considering a composite layer, a plain stress is assumed. Therefore:
These assumptions allow to reduce the three-dimensional relationships between stress and strain to two dimensions:
where Qij are elements of the reduced stiffness matrix.
The above equations link deformation and stress in the composite layer through the reduced stiffness matrix [Q]. However, it would be convenient to refer the elements of these matrices to basic material constants such as: E1 - Young’s modulus measured along the fibers (in direction 1); E2 - Young’s modulus measured across the fibers (in direction 2); νij - Poisson ratio; G12 - Kirchhoff’s modulus (in the 1-2 plane).
This relationship is presented by the equation:
The number of layers and the angles of the fibers in each layer of the cylinder were determined using a genetic algorithm. Genetic algorithms (GA) are a group of optimization algorithms whose operation is based on Darwin’s principle of “survival of the fittest” [33,34]. Their operation can be divided into several steps:
Step 1 (GA): Determination the global parameters of the algorithm.
Step 2 (GA): Generation (mostly random) initial population.
Step 3 (GA): Evaluation of individuals for adaptation to a specific problem, according to the criteria adopted for the problem.
Step 4 (GA): Evaluation of the convergence of the algorithm.
Step 5 (GA): Selection of the best adapted individuals for further reproduction.
Step 6 (GA): Reproduction, consisting of:
- Crossover;
- b. Mutation.
Step 7 (GA). Return to Step 3 and continue the process until the desired convergence criteria are achieved.
In the case of laminate optimization, a single individual reflects the arrangement of successive layers, which are treated as separate genes. Such genes, in the course of evolution, may undergo mutation, crossover and/or deletion. For the wound element, one of the constraints is that the layers are grouped in twos [+α/−α], which forces an even number of layers. Thus, two corresponding layers [+α/−α] are treated by the algorithm as a single gene. An example of an individual with 6 genes is shown in Table 6.
The initial population is generated randomly, which means that individuals have a random number of layers (limited to a certain maximum) and random fiber angles (from a certain available range). The population size (number of individuals) is set as a global parameter. In the case of composite cylindrical elements, individuals are evaluated using classical laminate theory adapted to cylindrical wound elements. The detailed application of the genetic algorithm to the optimization of the composite structure of a cylinder is presented in [35]. As a result of the application of the genetic algorithm, a cylinder with a fiber orientation of [90/90/±20]2 was determined, with a fitness function value of 4.302.
3.3. Composite Cylinder Manufacturing
The composite cylinder was manufactured using a Mikrosam MAW 20 LS4/1 four-axis filament winding machine. The winding was performed on steel, chrome-plated mandrels with a diameter of 40 mm, a length of 500 mm and a roughness of Ramax = 0.2 μm. In the winding process, two layers ±θ are produced simultaneously. The cylinder was made of Toho Tenax-E HTS40 F13 12K 800tex fiber and Araldite LY 1564 epoxy resin with Aradur 3486 hardener. After winding, the cylinder, together with the mandrel, was cured in an oven for 12 hours at 60°C. After this time, the core was removed and the cylinder was cut to a length of 305 mm using a diamond blade saw and liquid coolant. A comparison of the weight of the manufactured cylinder with a reference steel cylinder with a wall thickness of 5 mm, made from a commercially available tube intended for hydraulic actuator cylinders, shows that its weight was reduced by approximately 94.4% (the weight of the steel cylinder was 1704 g, and the weight of the composite cylinder is 95.5 g). It should be noted that the cylinder does not have a liner (internal metallic layer), which may be necessary and will increase the weight of the composite cylinder.
3.4. Experimental Verification
In order to verify the calculations a test stand was designed and built to test the deformation of a composite cylinder, which was part of a complete hydraulic actuator. Figure 13 shows the hydraulic diagram of the actuator test stand. The stand allows the tested actuator to be cyclically extended and retracted at specified speeds and under a specified load. The direction of the actuator’s movement is changed by switching the directional control valve (4), while the speed of movement can be set independently for both directions using flow control valve (5) and (6). In addition, the flow control valves make the actuator speed independent of the changing external load. The load is applied by a loading actuator (15) connected to a relief valve (18), which allows the load pressure to be maintained independently of the flow rate (actuator speed). The system allows the recording of pressure values in the chambers of the tested actuator, flow rates, piston rod position, and load force.
Cylinder deformation measurements were made using strain gauges affixed to the outer surface of the cylinder in the middle of its length, recording axial εX and circumferential εθ deformations. The measurements were made in two steps: the first (Step 1) involved pre-tensioning the actuator tie rods with a torque of 10 Nm on each rod, and the second (Step 2) involved loading the pretensioned cylinder with internal pressure in the range from 0 to 20 MPa.
Figure 14 shows an actuator with a steel cylinder mounted on a test stand. The first series of measurements was performed on an actuator with a steel cylinder to verify the calculations.
Figure 15 shows the axial and circumferential deformations of the cylinder during the pre-tensioning of the rods (Step 1). The theoretical deformation values obtained from finite element calculations are also marked with dashed lines.
Figure 16 shows the axial and circumferential deformations of the cylinder during loading of the pre-tensioned cylinder with internal pressure (solid lines). The theoretical deformation values resulting from finite element method calculations are also marked with dashed lines. The measurement and calculation results are summarized in Table 7.
As can be seen, the difference between the calculations and the experimental results for circumferential deformations is less than 5%. For axial deformations, this difference is greater (15.5% in Step 1 and 10.4% in Step 2, respectively). This may be due to uneven rod tension during pre-tensioning.
Measurements of composite cylinder deformation were performed using a similar procedure. Figure 17 shows the axial and circumferential deformation of a composite cylinder with a [90/90/±20/]2 structure without a liner recorded during measurements (solid lines) and calculated theoretically (dashed lines) during the pre-tensioning of the actuator. Theoretical calculations for the composite material were performed using Wolfram Mathematica.
Figure 18 shows the deformation of the cylinder during internal pressure loading up to 20 MPa. It compares the experimentally measured deformations with those calculated.
The results of measurements and calculations are summarized in Table 8. As can be seen, the agreement between experimental and theoretical results for three of the four cases is very good. A large difference (31.2%) occurred only for circumferential deformation in Step 2. The reason may be the low stiffness of the bonded connection between the strain gauge and the cylinder surface, as the experimental values were smaller than the theoretical ones.
From the deformation measurements, it can be seen that in most cases the results obtained experimentally coincided with those calculated theoretically using classical laminate theory as to the values and nature of the changes. For a composite cylinder with a fiber orientation structure of [90/90/±20/]2, the differences in axial deformation in both steps were slightly over 1%, while for circumferential deformation in the first step, they were less than 5%. A greater discrepancy was recorded for εθ in the second step, amounting to 31.2%. This is a large difference, but as before, the experimentally obtained values were lower than the theoretical ones.
4. Conclusions
This paper presents the results of numerical considerations on the values of deformations and stresses at the base of a composite actuator. The base was made of PET plastic and was part of a hydraulic actuator that was subjected to a uniform load in the form of internal pressure of 20 MPa. In order to obtain more reliable numerical calculation results, the material properties of the plastic used to make the base were verified. The Young’s modulus and tensile strength were determined experimentally.
Numerical considerations regarding deformations were verified by experimental tests on a specially designed and constructed test stand. The numerical and experimental tests were carried out in two steps: initial tensioning of the actuator tie rods and internal pressure loading. In the case of the base, the experimentally recorded deformations in the X direction were smaller than those resulting from the FEM calculations, while in the Y direction they were larger (Table 4). These differences may result from uneven tension of the rod in the actuator. Although each of them was tensioned with the same torque of 10 Nm, differences in friction forces in individual systems could result in inequalities in axial forces. Deformation measurements show that in most cases, the experimental results coincided with those calculated theoretically using the classical laminate theory in terms of the value and nature of the changes.
A comparison of the deformations of the steel and composite cylinders shows that during the loading of both cylinders, significantly greater deformations occur in the composite cylinder. It can be seen that in the first step of loading, the cylinder deformation values are significantly greater in the axial direction. This is due to the compressive forces caused by the tie rods, which were tightened to a torque of 10 Nm in this step. In the second step, however, greater deformation values are observed in the circumferential direction and increase with the internal pressure in the cylinder. The results presented confirm the positive validation of the computational models of the composite base and cylinder. The cylinder presented in this work had a weight that was over 94% lower than that of a steel cylinder of the same length and internal diameter.
Author Contributions
Conceptualization, M.S. and M.L.; methodology, M.S. and M.L.; software, M.S. and M.K.; validation, M.S. and M.L.; formal analysis, M.S. and M.K.; investigation, M.S. and M.L.; resources, M.S. and M.K.; data curation, M.S. and M.L.; writing—original draft preparation, M.S., M.L. and M.K.; writing—review and editing, M.S. and M.L.; visualisation, M.S. and M.L.; supervision, M.S.; project administration, M.S. and M.K.; funding acquisition, M.S. All authors have read and agreed to the published version of the manuscript.
Funding
This research received no external funding.
Data Availability Statement
All data included in this research are available upon request from the corresponding author.
Conflicts of Interest
The authors declare no conflicts of interest. Author Marek Lubecki was a PhD student at Wrocław University of Science and Technology - during research preparing. The research work/article was created at Wrocław University of Science and Technology. Author Marek Lubecki currently employed by the company Komes Group Ltd. The remaining authors declare that the research was conducted in the absence of any commercial or financial relationships that could be construed as a potential conflict of interest.
References
- Bajpai, P.; Singh, I. Reinforced Polymer Composites: Processing, Characterization and Post Life Cycle Assessment; John Wiley & Sons: Hoboken, NJ, USA, 2019; 288p. https://. [CrossRef]
- Nielsen, L. Composite Materials: Properties as Influenced by Phase Geometry. Springer, 2005, 259p. https://link.springer.com/book/10.1007/978-3-540-27680-7.
- Hwu, C. Mechanics of Laminated Composite Structures; CRC Press: Boca Raton, FL, USA, 2024; 414p, ISBN 9781032746944.
- Bafekrpour, E.; Advanced Composite Materials: Properties and Applications. Warsaw, Poland: De Gruyter Open Poland, 2017, 594p. https://. [CrossRef]
- Lin, Y.; Qian, W.; Lei, L. et al. Structural integrity issues of composite materials and structures in future transportation equipment. Composite Structures, 2025, 358, 118943. https://. [CrossRef]
- Stebbings, E.; Hooper, T.; Austen, M.; Papathanasopoulou, E.; Yan, X. Accounting for benefits from natural capital: applying a novel composite indicator framework to the marine environment. Ecosystem Services. 2021, 50, 1-15. https://. [CrossRef]
- Criollo, L.; Mena-Arciniega, C.; Brazalez, J.; Medina, F.; Zurita, M. Modal and random vibration analysis for structural design of aircraft external stores. Aviation. 2025, 29(3), 137–149. https://. [CrossRef]
- Solazzi, L.; Buffoli, A. Telescopic Hydraulic Cylinder Made of Composite Material. Appl Compos Mater, 2019, 26, 1189–1206. https://. [CrossRef]
- Lubecki, M.; Stosiak, M.; Karpenko, M.; Urbanowicz, K.; Deptula, A.; Cieslicki, R.. Design and FEM analysis of plastic parts of a tie-rod composite hydraulic cylinder. Mechanika. Kaunas: KTU. 2023, 29(5), 358-362. https://. [CrossRef]
- George, J.; Vasudevan, A.; Mohanavel, V. Vibration analysis of interply hybrid composite for an aircraft wing structure. Materials Today: Proceedings, 2021, 37(2), 2368-2374. https://. [CrossRef]
- Altenbach, H.; Altenbach, J.; Kissing, W. Mechanics of Composite Structural Elements. Springer Nature, 2018, 503 p. https://. [CrossRef]
- Karpenko, M.; Stosiak, M.; Deptuła, A. et al. Performance evaluation of extruded polystyrene foam for aerospace engineering applications using frequency analyses. The International Journal of Advanced Manufacturing Technology, 2023, 126, 5515–5526. https://. [CrossRef]
- Fan, Q.; Zhang, J.; Li, R.; Fan, T. Review of Research on Hydrostatic Transmission Systems and Control Strategies. Processes 2025, 13, 317. https://. [CrossRef]
- Stosiak, M.; Bury, P.; Karpenko, M. The influence of hydraulic hose length on dynamic pressure waveforms including wave phenomena. Scientific Reports. Berlin: Nature Portfolio, 2025, 15(1), 1-13. https://. [CrossRef]
- Stryczek, S. Napęd hydrostatyczny t.1. Wrocław: Wydawnictwo WNT, 2013, 448 p. ISSN:978-83-7926-145-1 [In Polish].
- Mantovani, S. Feasibility Analysis of a Double-Acting Composite Cylinder in High-Pressure Loading Conditions for Fluid Power Applications. Appl. Sci. 2020, 10, 826. https://. [CrossRef]
- Phiri, R.; Rangappa, S.; Siengchin, S.; Oladijo, O.; Ozbakkaloglu, T. Advances in lightweight composite structures and manufacturing technologies: A comprehensive review. Heliyon, 2024, 10(21), e39661. https://. [CrossRef]
- Lubecki, M.; Stosiak, M.; Skačkauskas, P.; Karpenko, M.; Deptuła, A.; Urbanowicz, K. Development of Composite Hydraulic Actuators: A Review. Actuators 2022, 11, 365. https://. [CrossRef]
- Guo, H.; Zhou, M.; Li, P.; Lv, M.; Zhang Y. Prospects of carbon fiber composites applications in hydraulic supports. Frontiers in Materials. 2022, 9, 1-5. https://. [CrossRef]
- Królikowski, W. Polimerowe kompozyty konstrukcyjne. Warszawa: Wydawnictwo Naukowe PWN, 2018, 332 p. ISBN: 978-83-01-16881-0 [In Polish].
- Datoo, M. Mechanics of Fibrous Composites. Springer: Dordrecht, The Netherlands, 1991, 636p.
- Chawla, K.; Composite Materials. New York, NY: Springer, 2012, 542 p. https://. [CrossRef]
- HYDAC. Hydraulic Accumulators; HYDAC: Sulzbach/Saar, Germany, 2025; Available online: https://www.hydac.com/de-en/products/hydraulic-accumulators/special-accumulators.html (accessed on 20 November 2025).
- Steelhead Composites. Combined Propellant/Pressurant Vessel (CPPV) Concept. Available online: https://steelheadcomposites.com/news/combined-propellantpressurant-vessel-cppv-concept (accessed on 20 November 2025).
- Mantovani, S.; Costi, D.; Strozzi, A.; Bertocchi, E.; Dolcini, E. Double Acting Composite Tube Cylinder for Fluid Power Applications: A Design Procedure. In Proceedings of the International Conference on Mechanical, Automotive and Aerospace Engineering, Kuala Lumpur, Malaysia, 17–19 May 2011.
- Mantovani, S. Feasibility Analysis of a Double-Acting Composite Cylinder in High-Pressure Loading Conditions for Fluid Power Applications. Appl. Sci. 2020, 10, 826. https://. [CrossRef]
- Ritchie, J.; Mumtahina, U.; Rasul, M.; Sayem, A. Alternative materials in hydraulic cylinder design: application of carbon fibre components. International Conference on Mechanical Engineering and Renewable Energy, 2014, 1-6. https://hdl.handle.net/10018/1038593.
- Li, Y.; Shang, Y.; Wan, X.; Jiao, Z.; Yu, T. Design and experiment on light weight hydraulic cylinder made of carbon fiber reinforced polymer. Composite Structures, 2022, 291, 1-13. https://. [CrossRef]
- International Organization for Standardization, Plastics — Determination of tensile properties — Part 2: Test conditions for moulding and extrusion plastics (ISO Standard 527-2:2012). 2011.
- ASTM, Standard Test Method for Tensile Properties of Polymer Matrix Composite Materials (ASTM Standard D3039). 2017.
- ASTM, Standard Test Method for Compressive Properties of Polymer Matrix Composite Materials Using a Combined Loading Compression (CLC) Test Fixture (ASTM Standard D6641). 2016.
- ASTM, Standard Test Method for Shear Properties of Composite Materials by V-Notched Rail Shear Method (ASTM Standard D7078). 2007.
- Sivanandam, S.; Deepa, S. Introduction to genetic algorithms. Springer, Berlin Heidelberg, 2008, 442 p. https://. [CrossRef]
- Kramer, O. Genetic Algorithm Essentials; Springer International Publishing: Cham, Switzerland, 2017; 92p.
- Stosiak, M.; Lubecki, M.; Karpenko, M. Designing a Composite Hydraulic Cylinder Using Genetic Algorithms. Actuators, 2025, 14, 77. https://. [CrossRef]
Figure 1.
Composite material in engineering’s (Authors photos on some research objects): (a) Transport vehicles components examples; (b) Hydraulic drive components examples.
Figure 1.
Composite material in engineering’s (Authors photos on some research objects): (a) Transport vehicles components examples; (b) Hydraulic drive components examples.
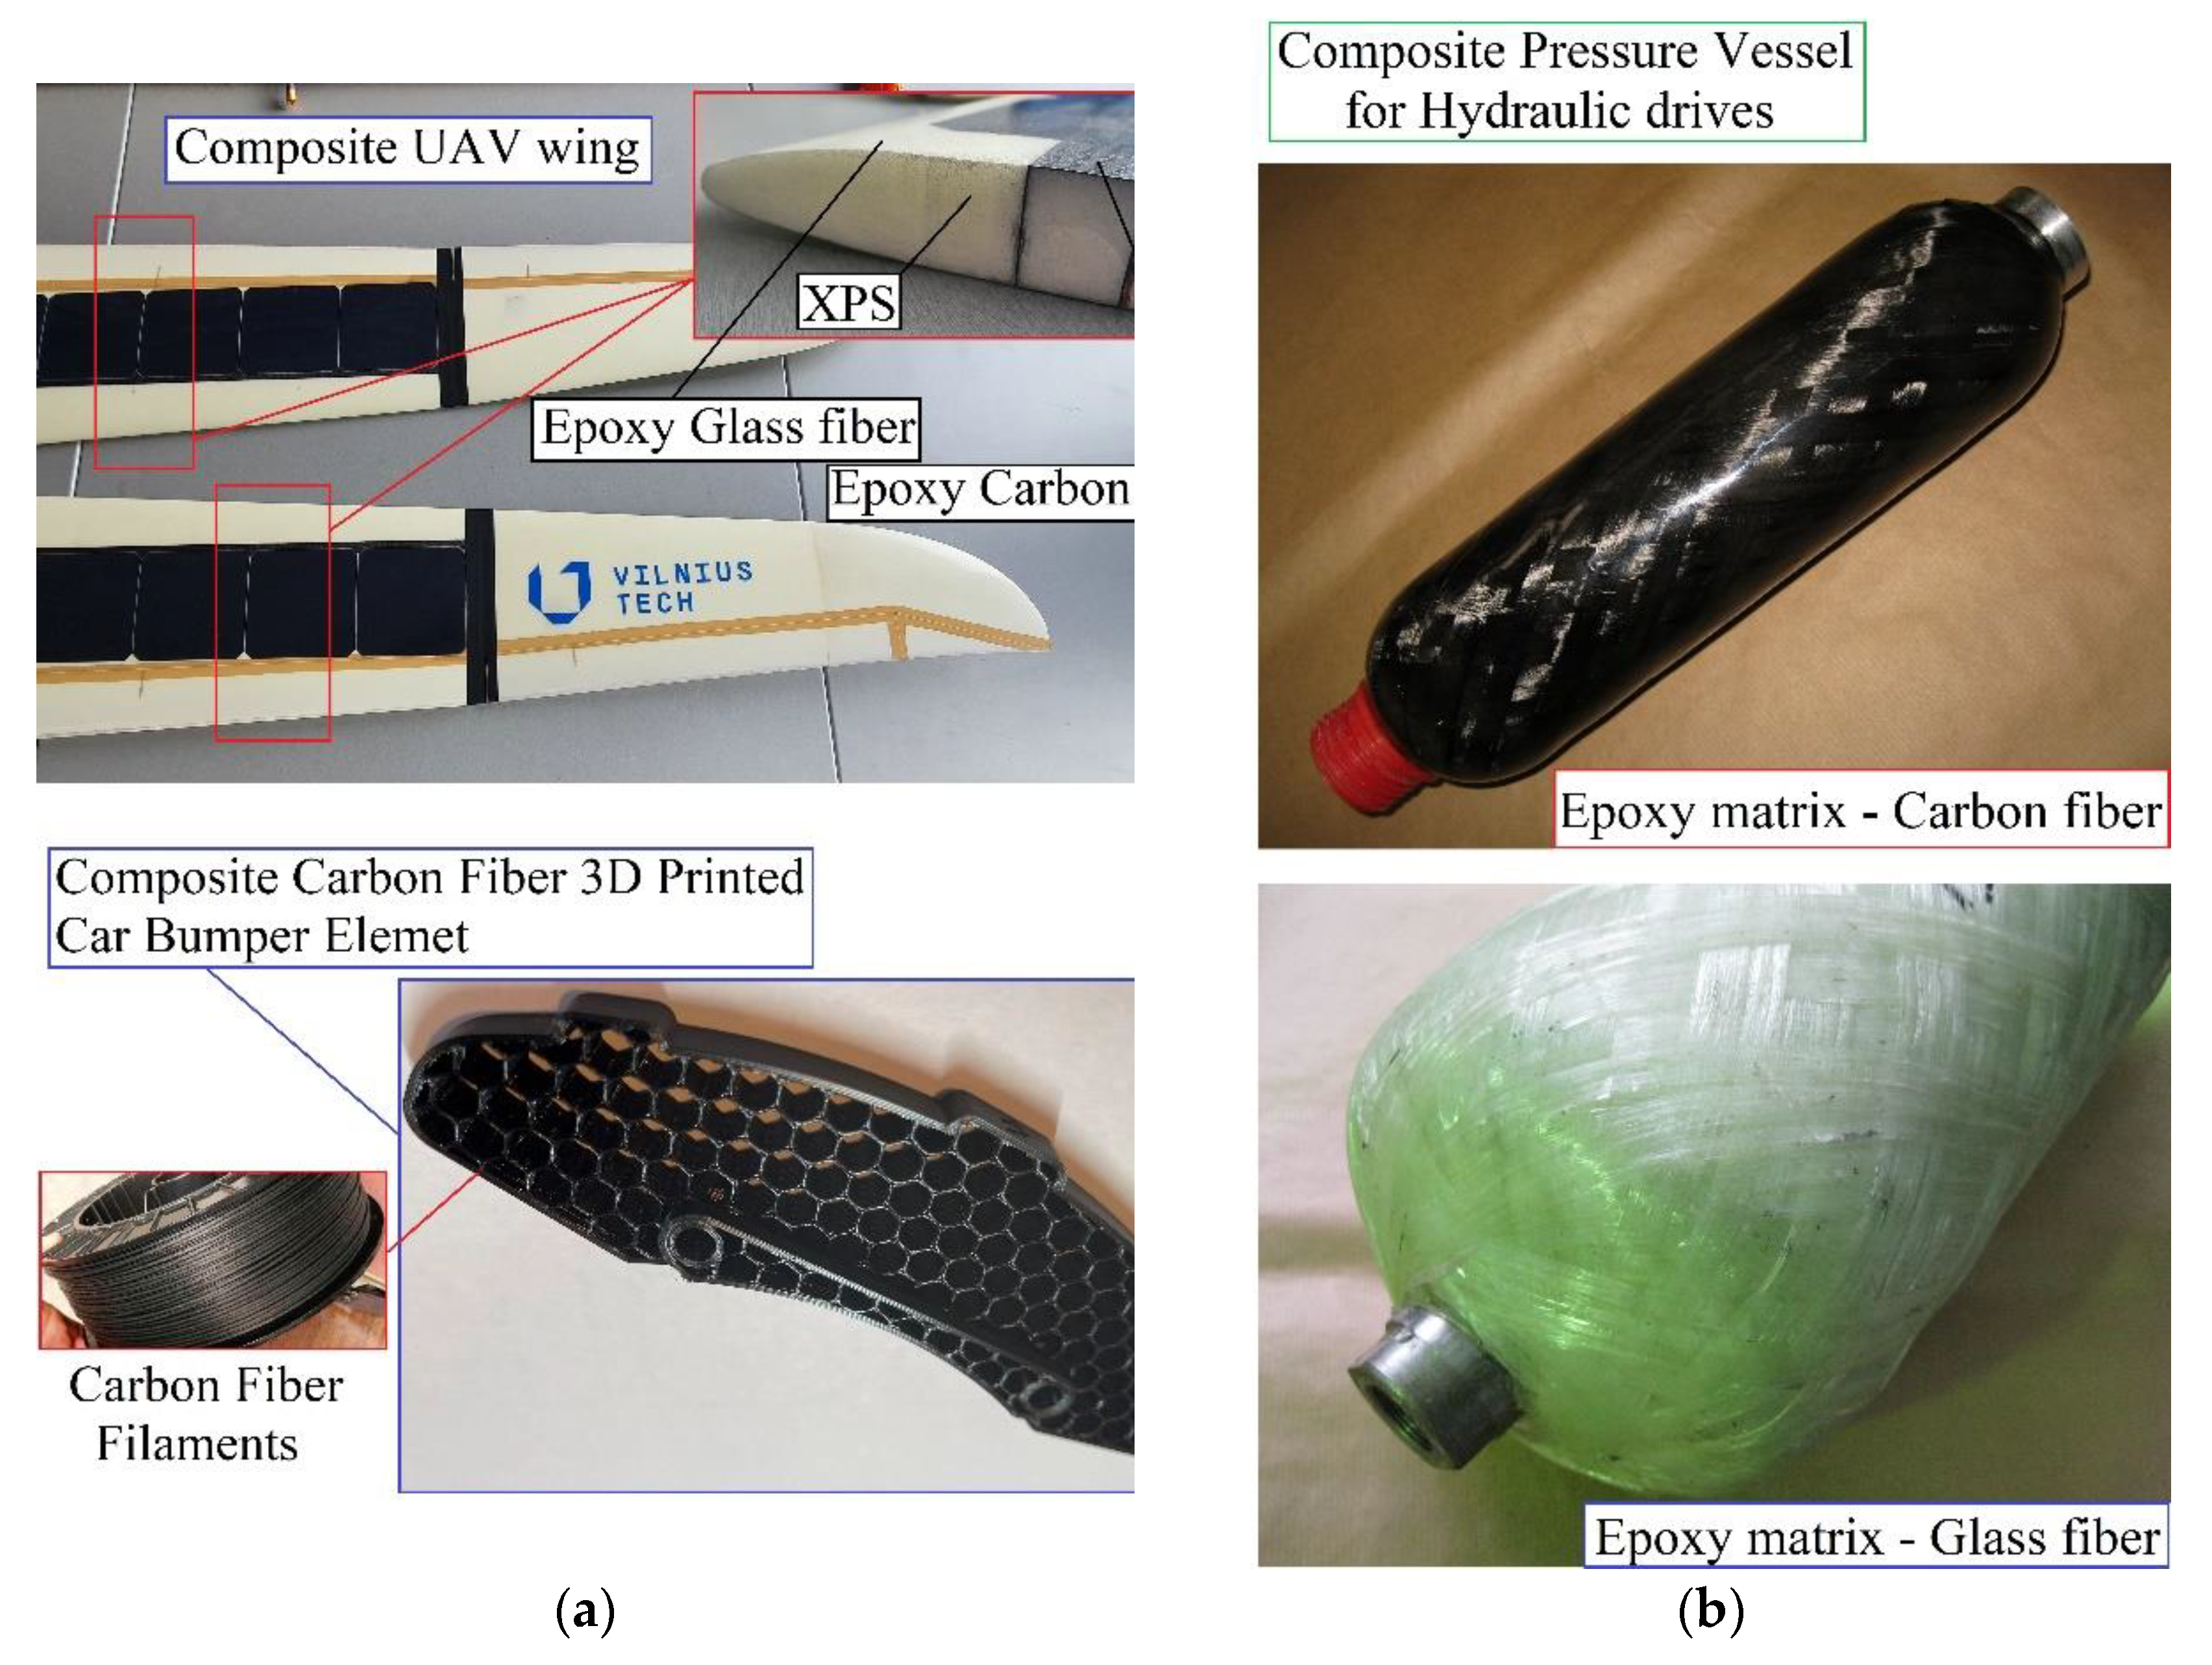
Figure 2.
The design of the cylinder adopted for testing: 1 – cylinder; 2 – gland; 3 – base; 4 – piston; 5 – rod; 6 – M10 threaded rod; 7 – M10 nut; 8 – M10 washer; 9 – gland connector; 10 – base connector; 11 – o-ring 36x2; 12 – o-ring 15.5x1.5; 13 – guide ring; 14 – GHK 307 seal; 15 – seal; 16 – o-ring 12x1.5; 17 – slip-ring; 18 and 19 – TTE 1025 seal.
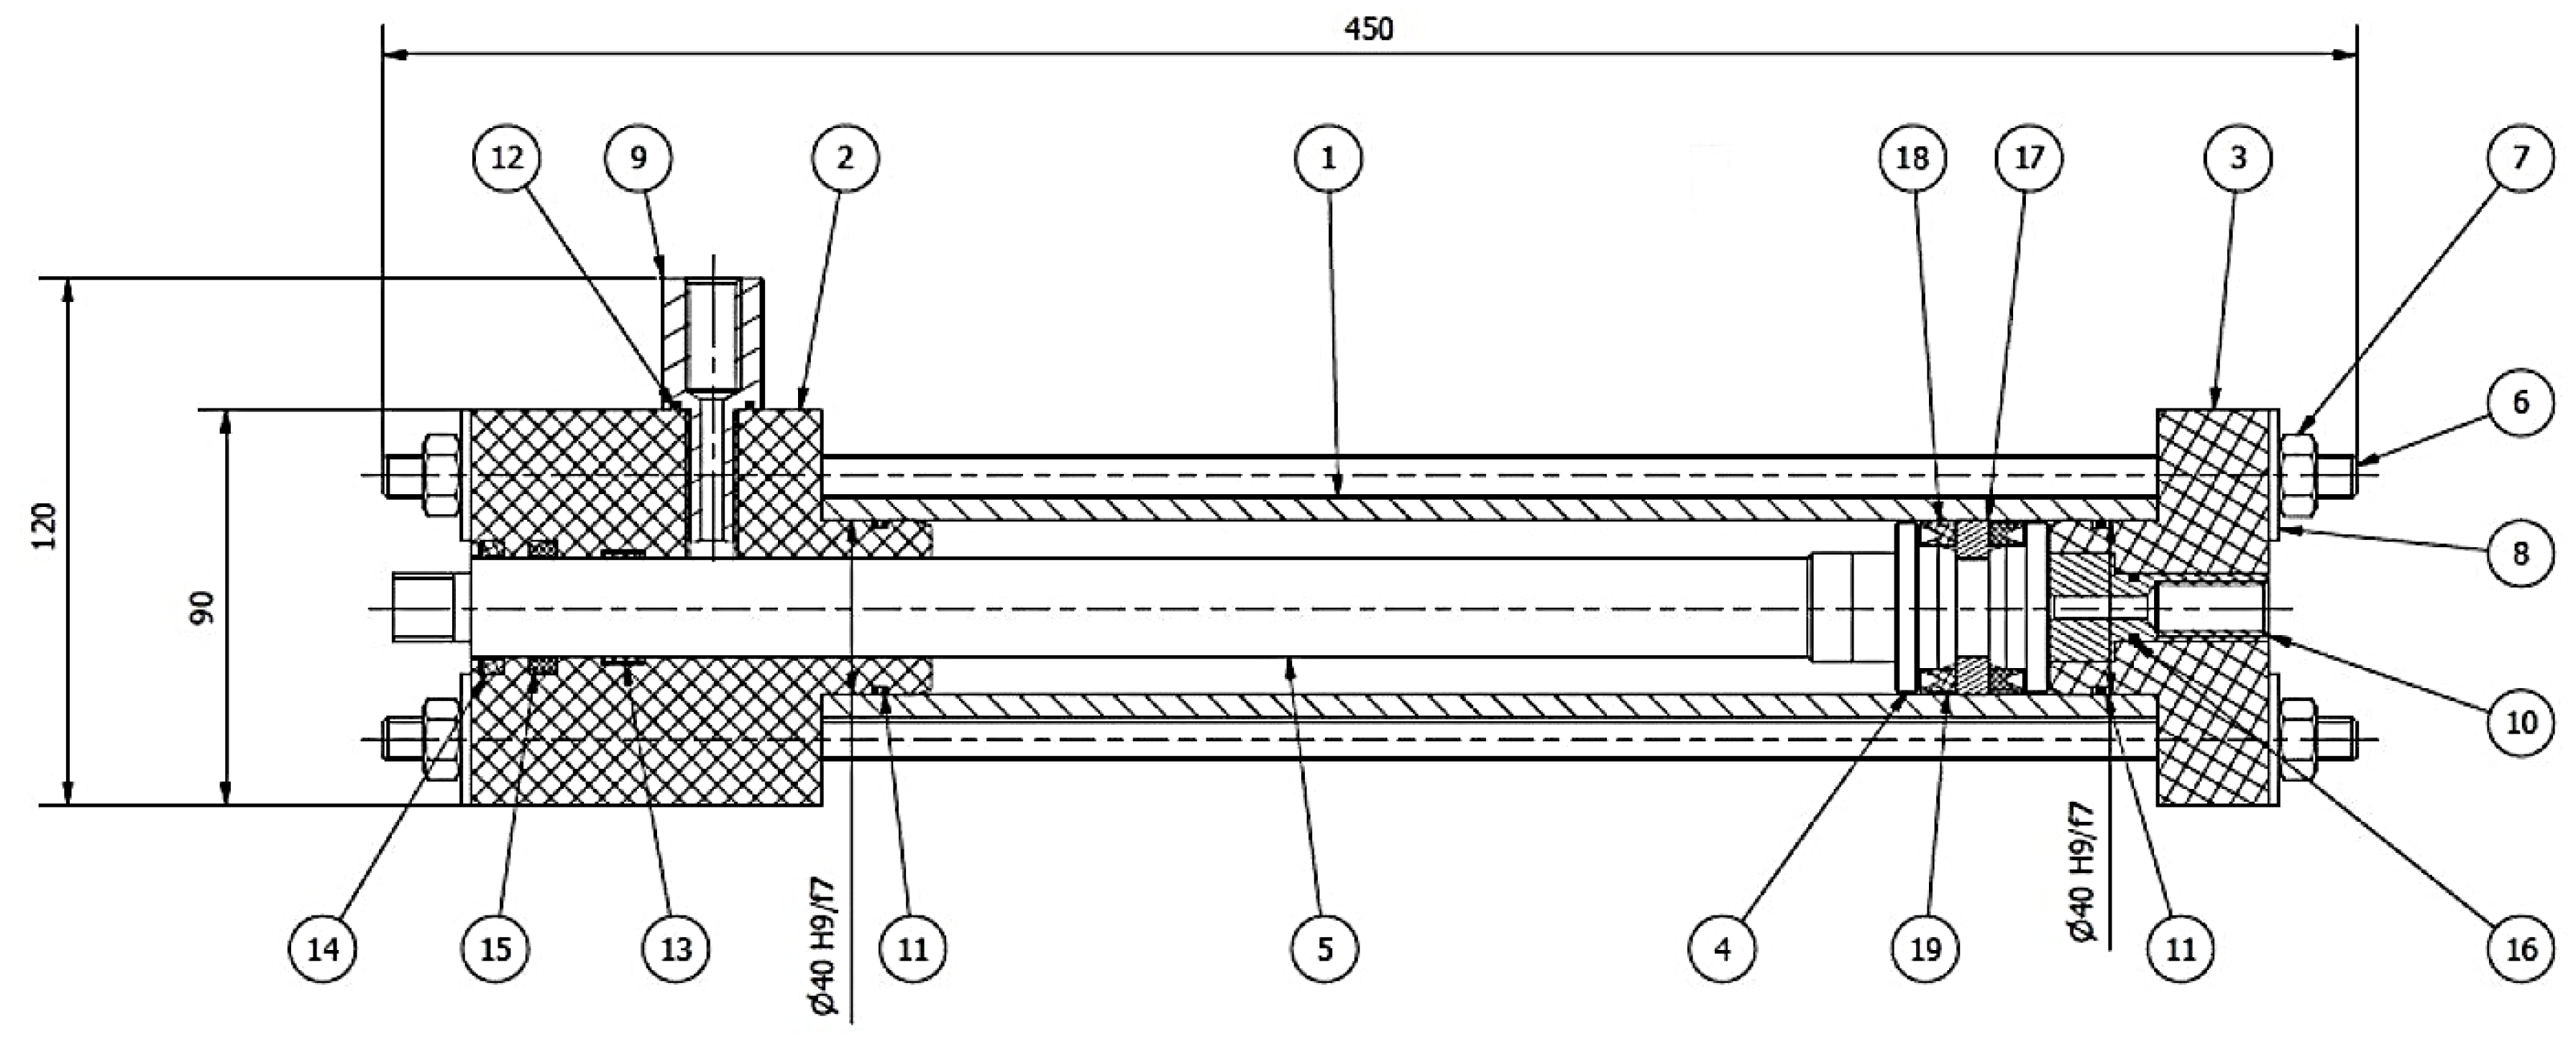
Figure 3.
An exemplary plot of the stress-strain relationship for the tested PET material.
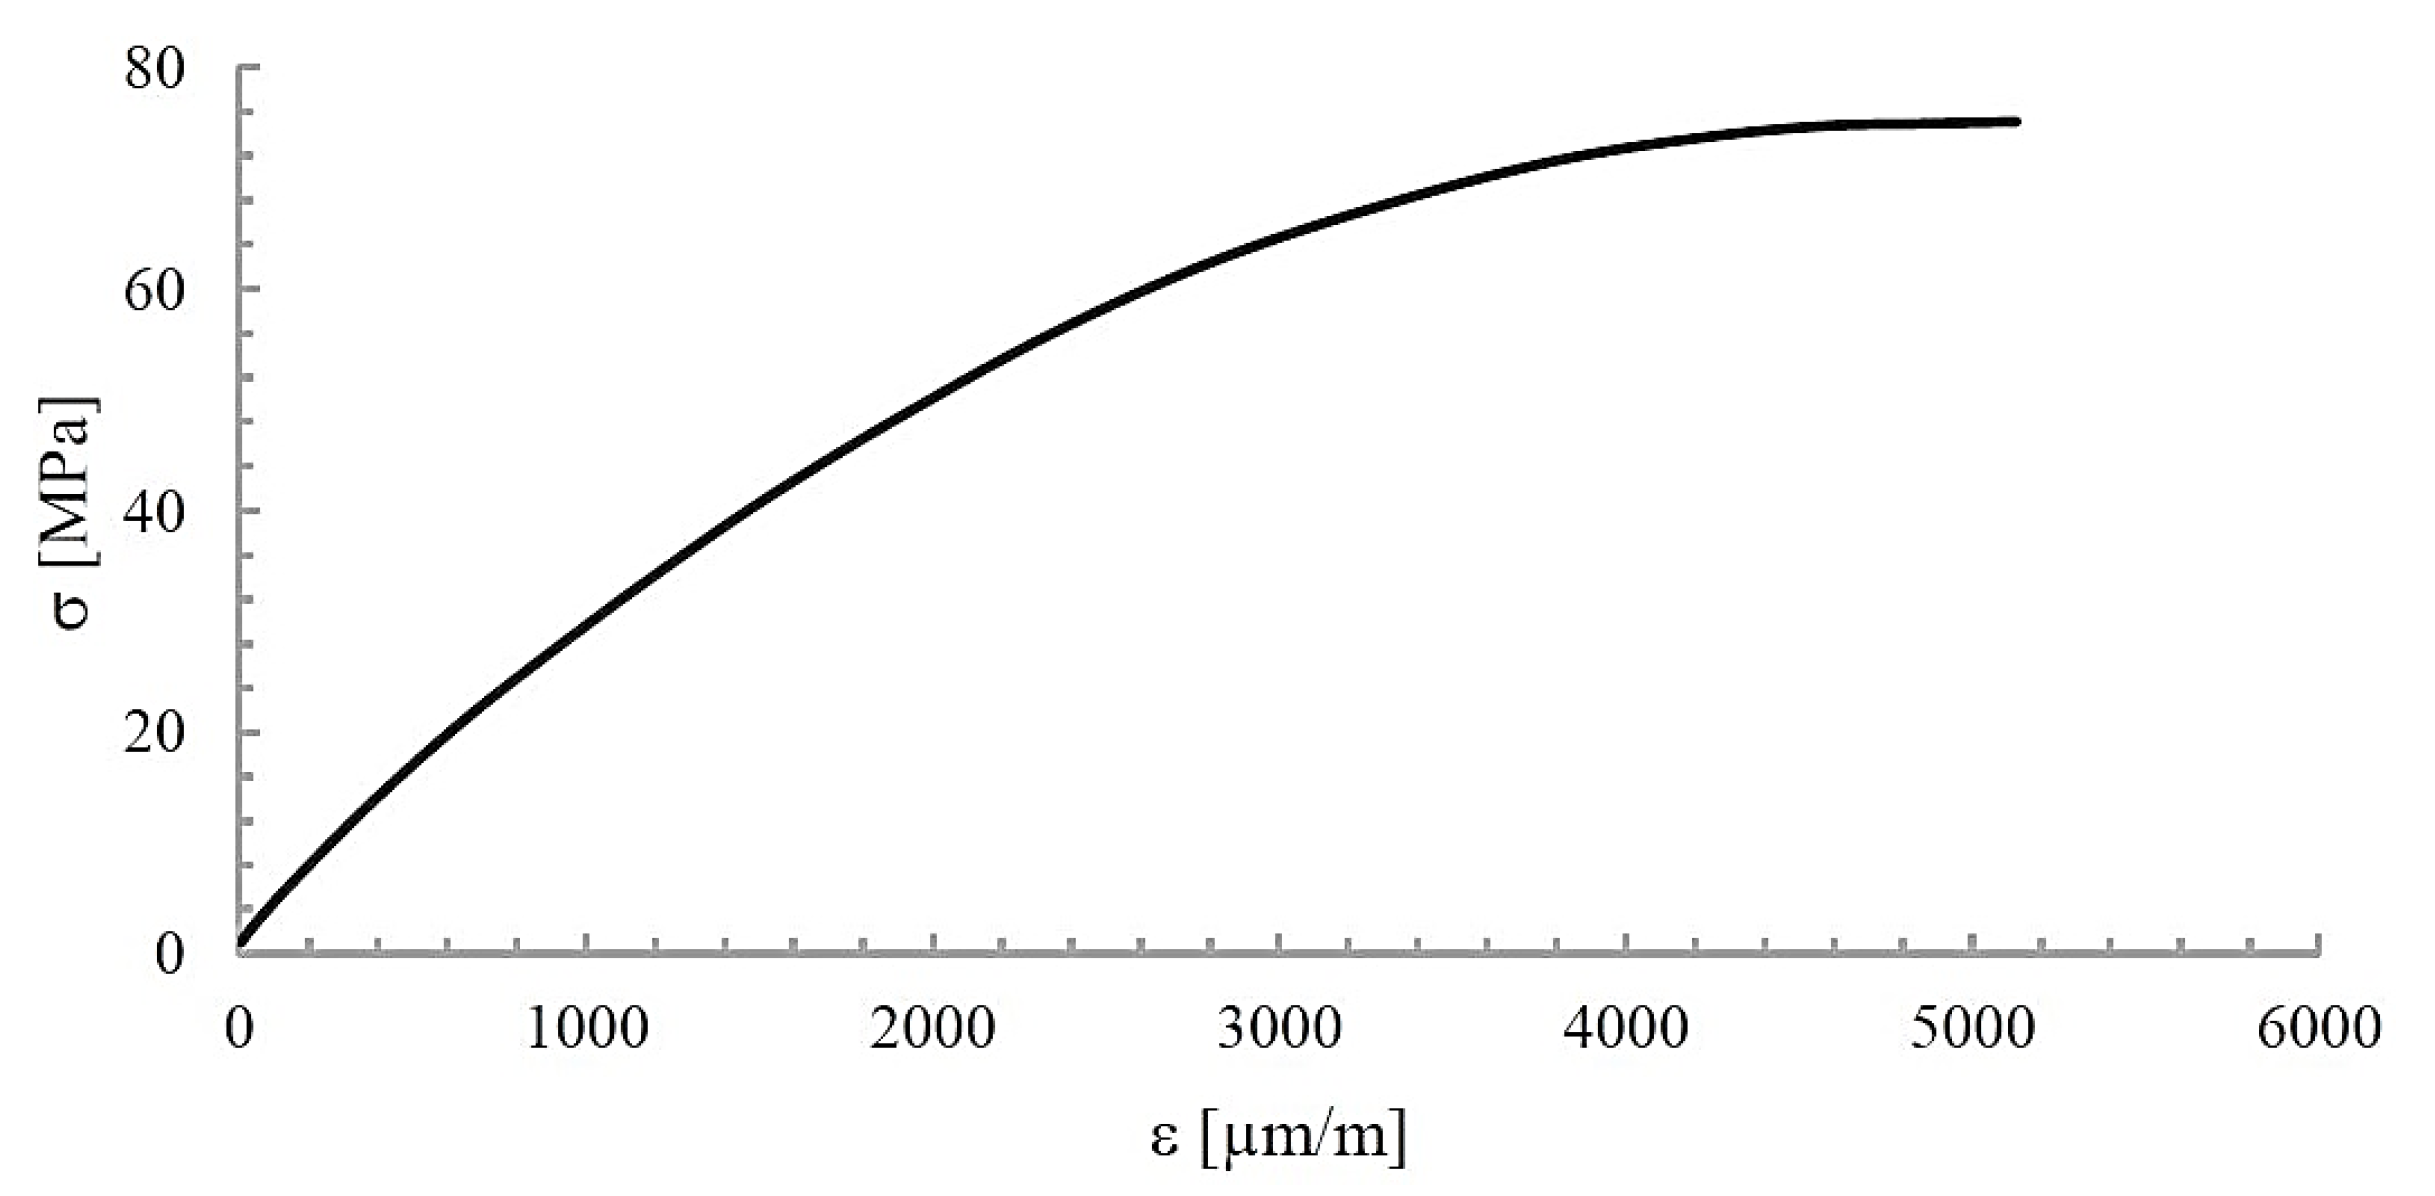
Figure 4.
Model view in ANSYS® Mechanical™ 2021/R2: (a) Geometric model of 1/4 of the base with a cylinder (1), base (2), washer (3), connector (4) and tie rod (5); (b) Geometric model of the base with a cylinder (1), base (2), washer (3), connector (4) and tie rod (5) divided into finite elements.
Figure 4.
Model view in ANSYS® Mechanical™ 2021/R2: (a) Geometric model of 1/4 of the base with a cylinder (1), base (2), washer (3), connector (4) and tie rod (5); (b) Geometric model of the base with a cylinder (1), base (2), washer (3), connector (4) and tie rod (5) divided into finite elements.
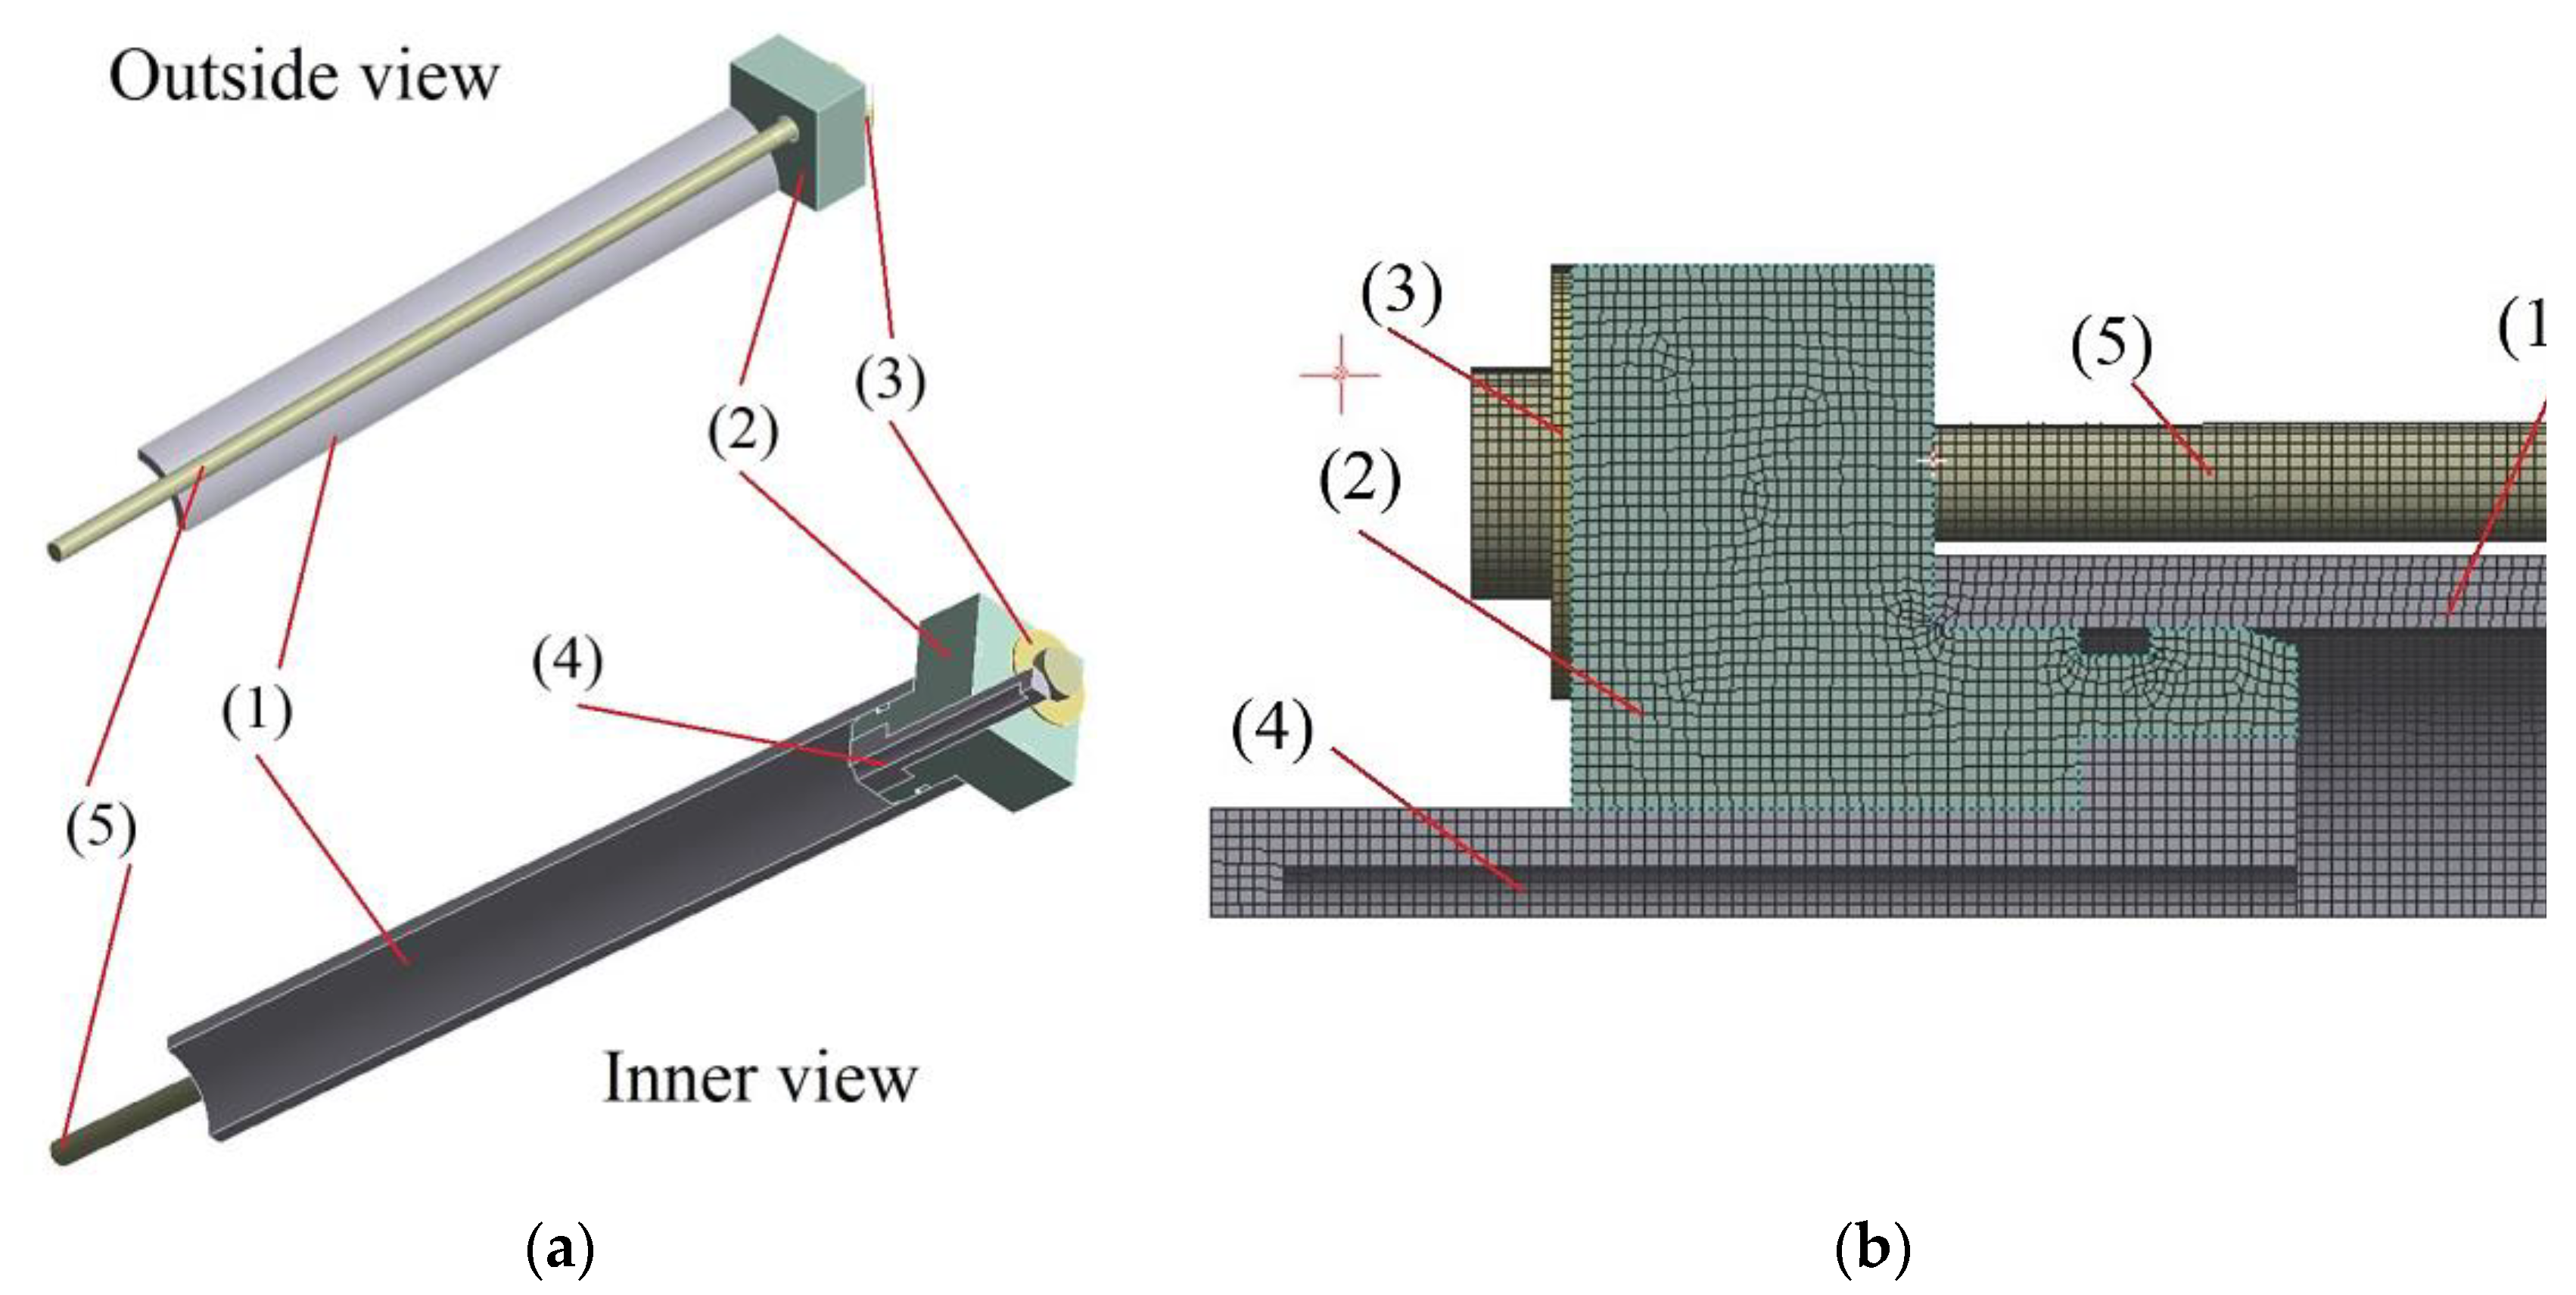
Figure 5.
Model contacts between parts: (a) Washer & Base; (b) Connector & Base; (c) Washer & Tie rod; (d) Cylinder & Base.
Figure 5.
Model contacts between parts: (a) Washer & Base; (b) Connector & Base; (c) Washer & Tie rod; (d) Cylinder & Base.
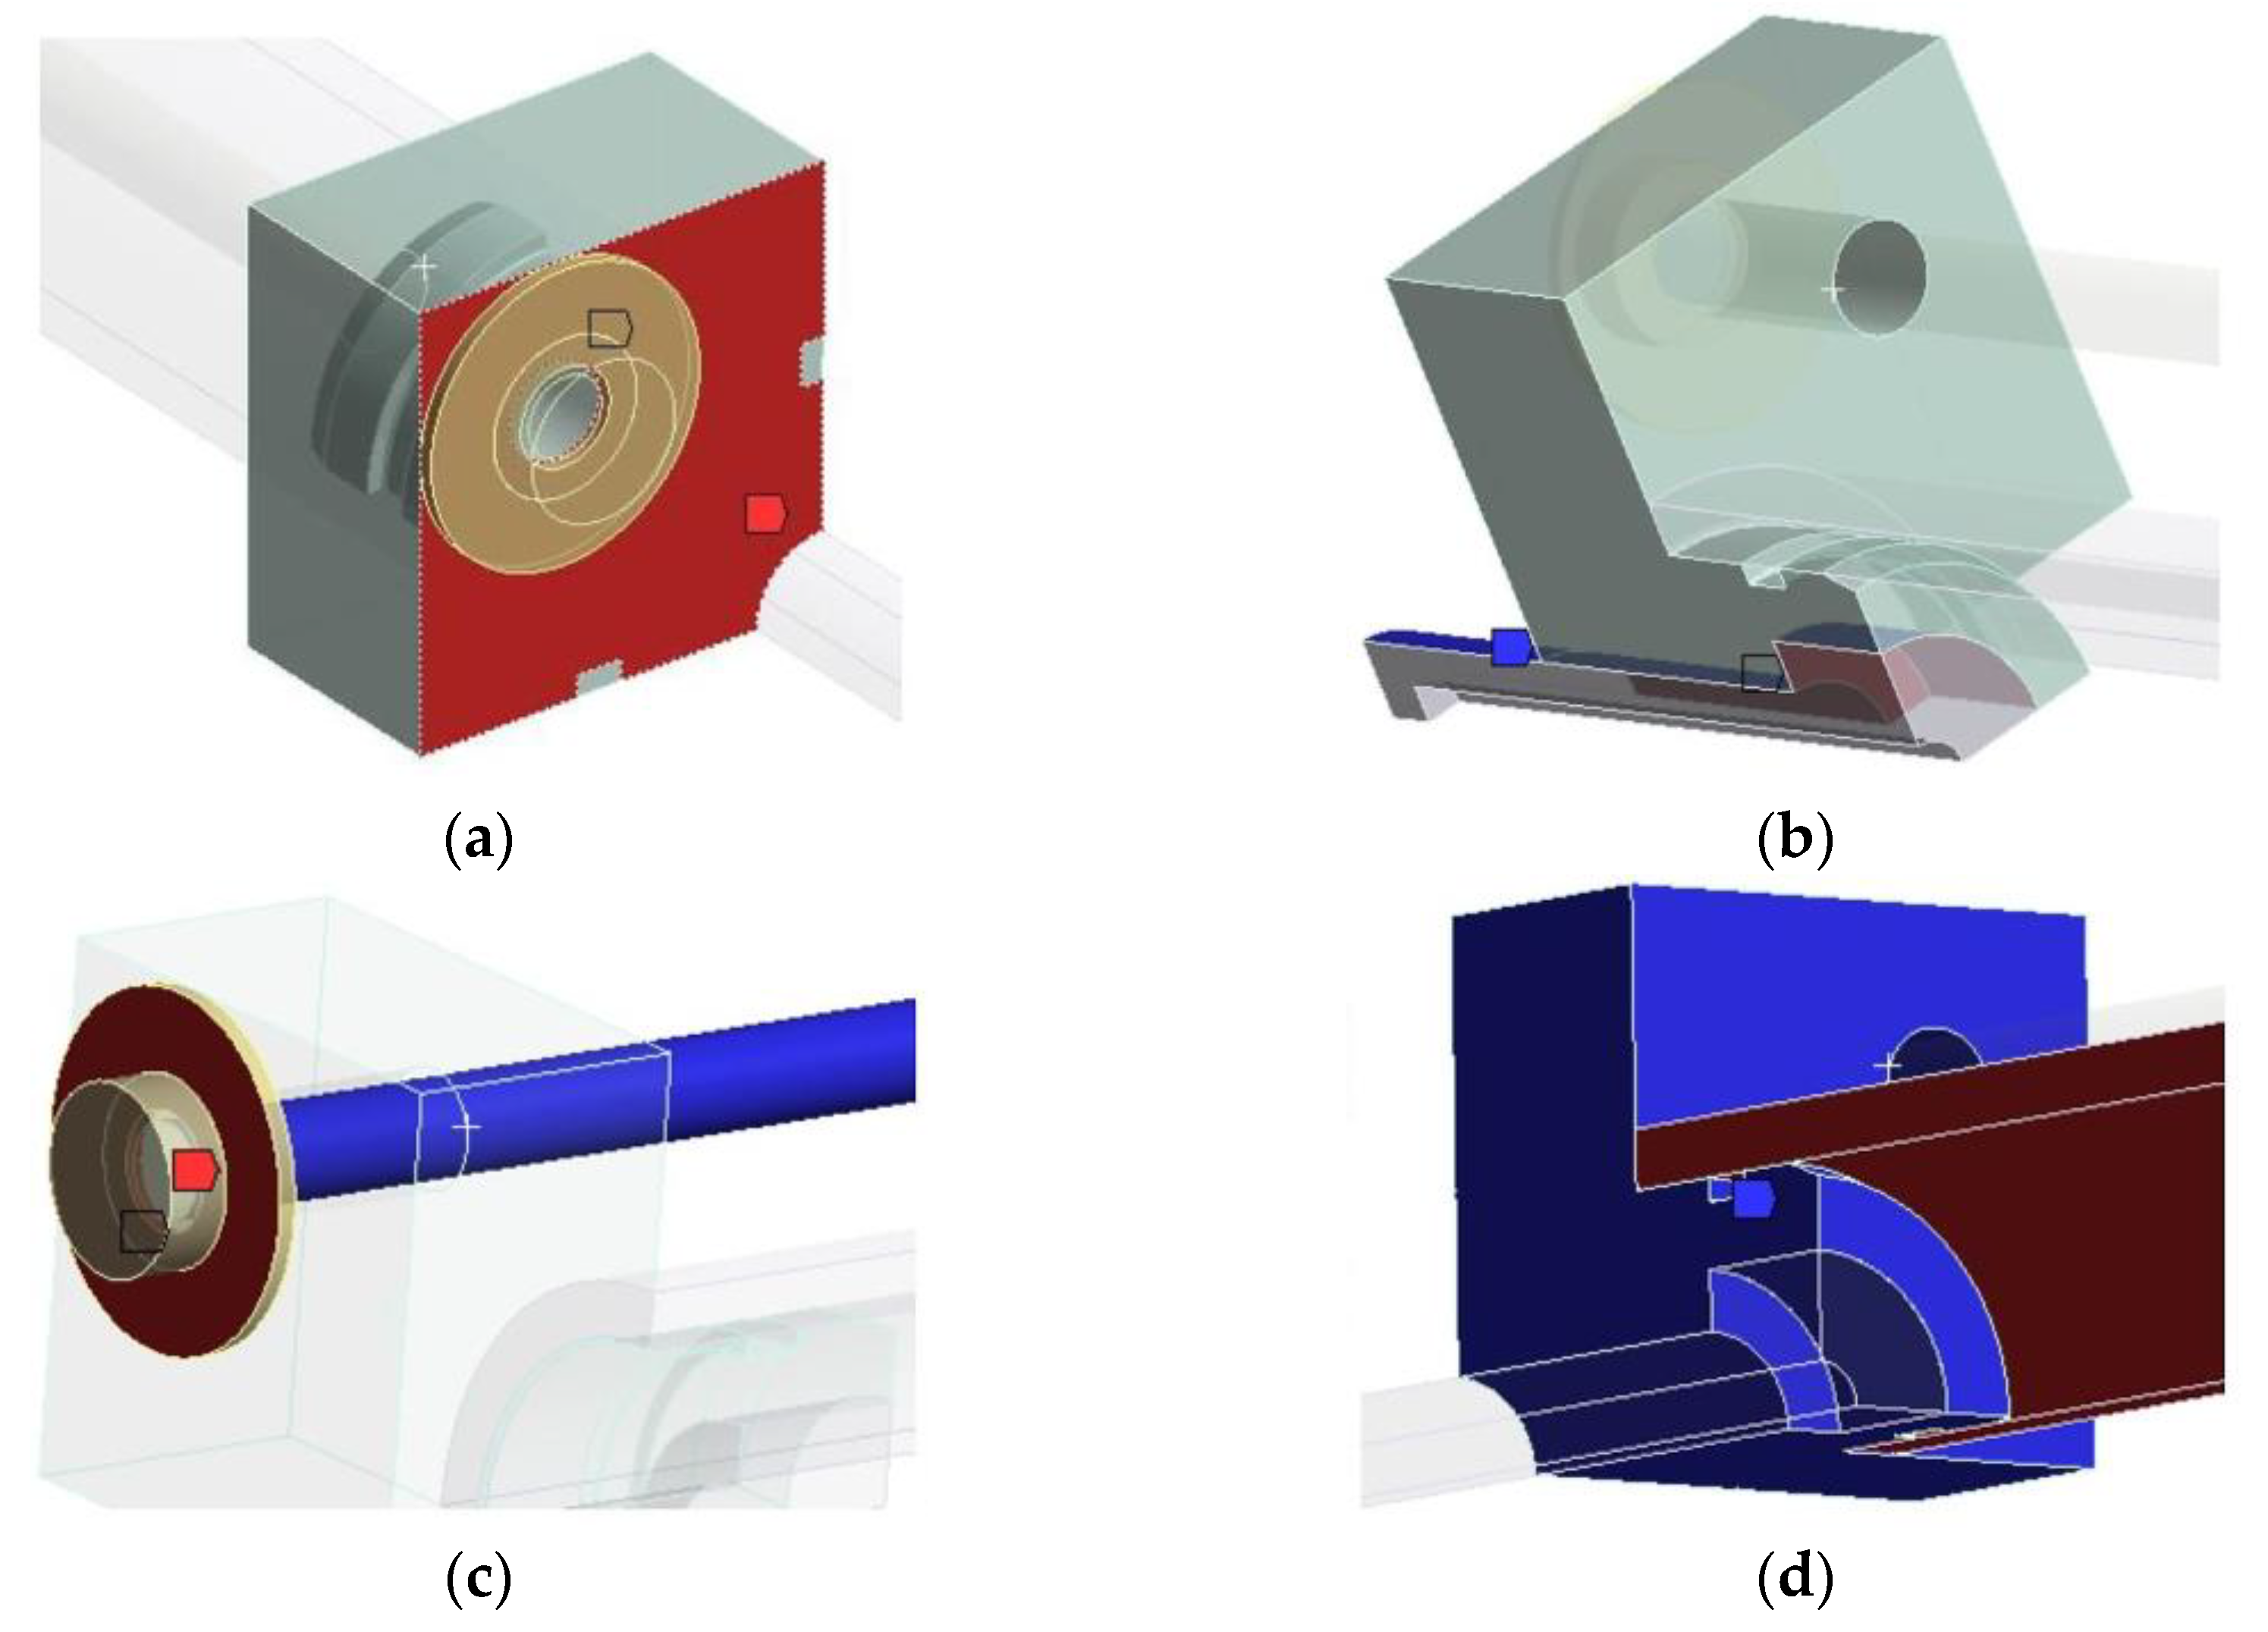
Figure 6.
Model setup in ANSYS® Mechanical™ 2021/R2: (a) Model support places; (b) Pre-tensioning of the tie rod on the first step of the simulation and loading internal pressure on the second step of the simulation.
Figure 6.
Model setup in ANSYS® Mechanical™ 2021/R2: (a) Model support places; (b) Pre-tensioning of the tie rod on the first step of the simulation and loading internal pressure on the second step of the simulation.
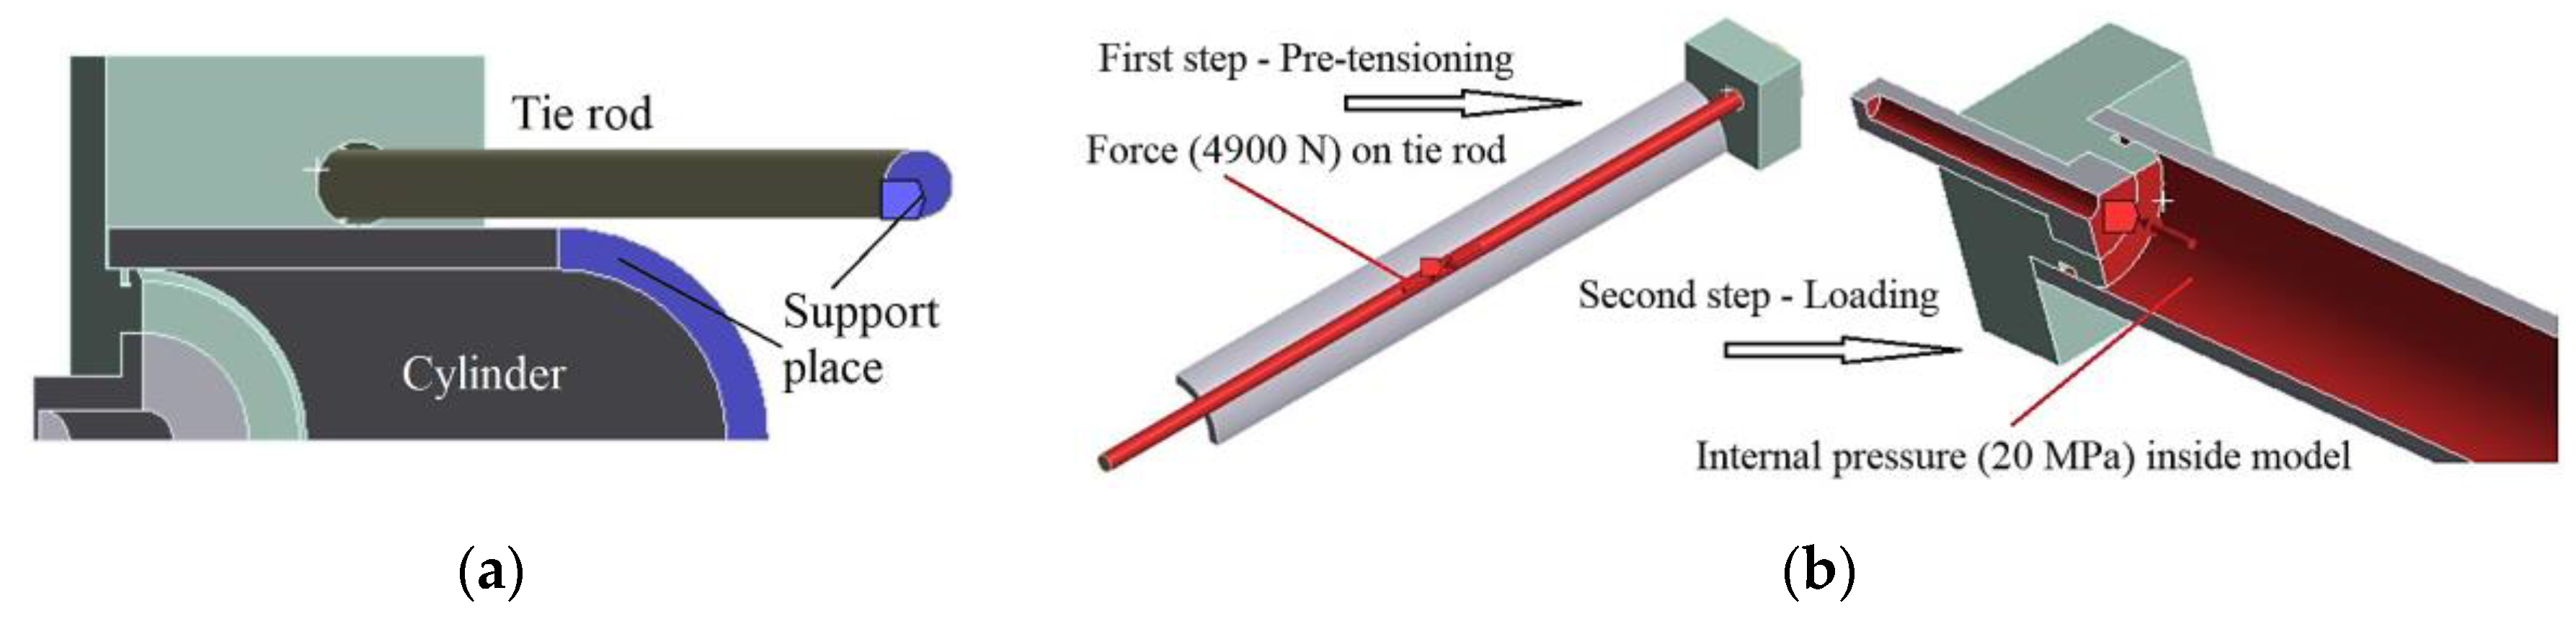
Figure 7.
FEM simulation results for the base deformations at the strain gauge location in the [in m/m]: (a) X-axis in the first step of the simulation; (b) X-axis in the second step of the simulation; (c) Y axis in the first step of the simulation; (d) Y axis in the second simulation step.
Figure 7.
FEM simulation results for the base deformations at the strain gauge location in the [in m/m]: (a) X-axis in the first step of the simulation; (b) X-axis in the second step of the simulation; (c) Y axis in the first step of the simulation; (d) Y axis in the second simulation step.
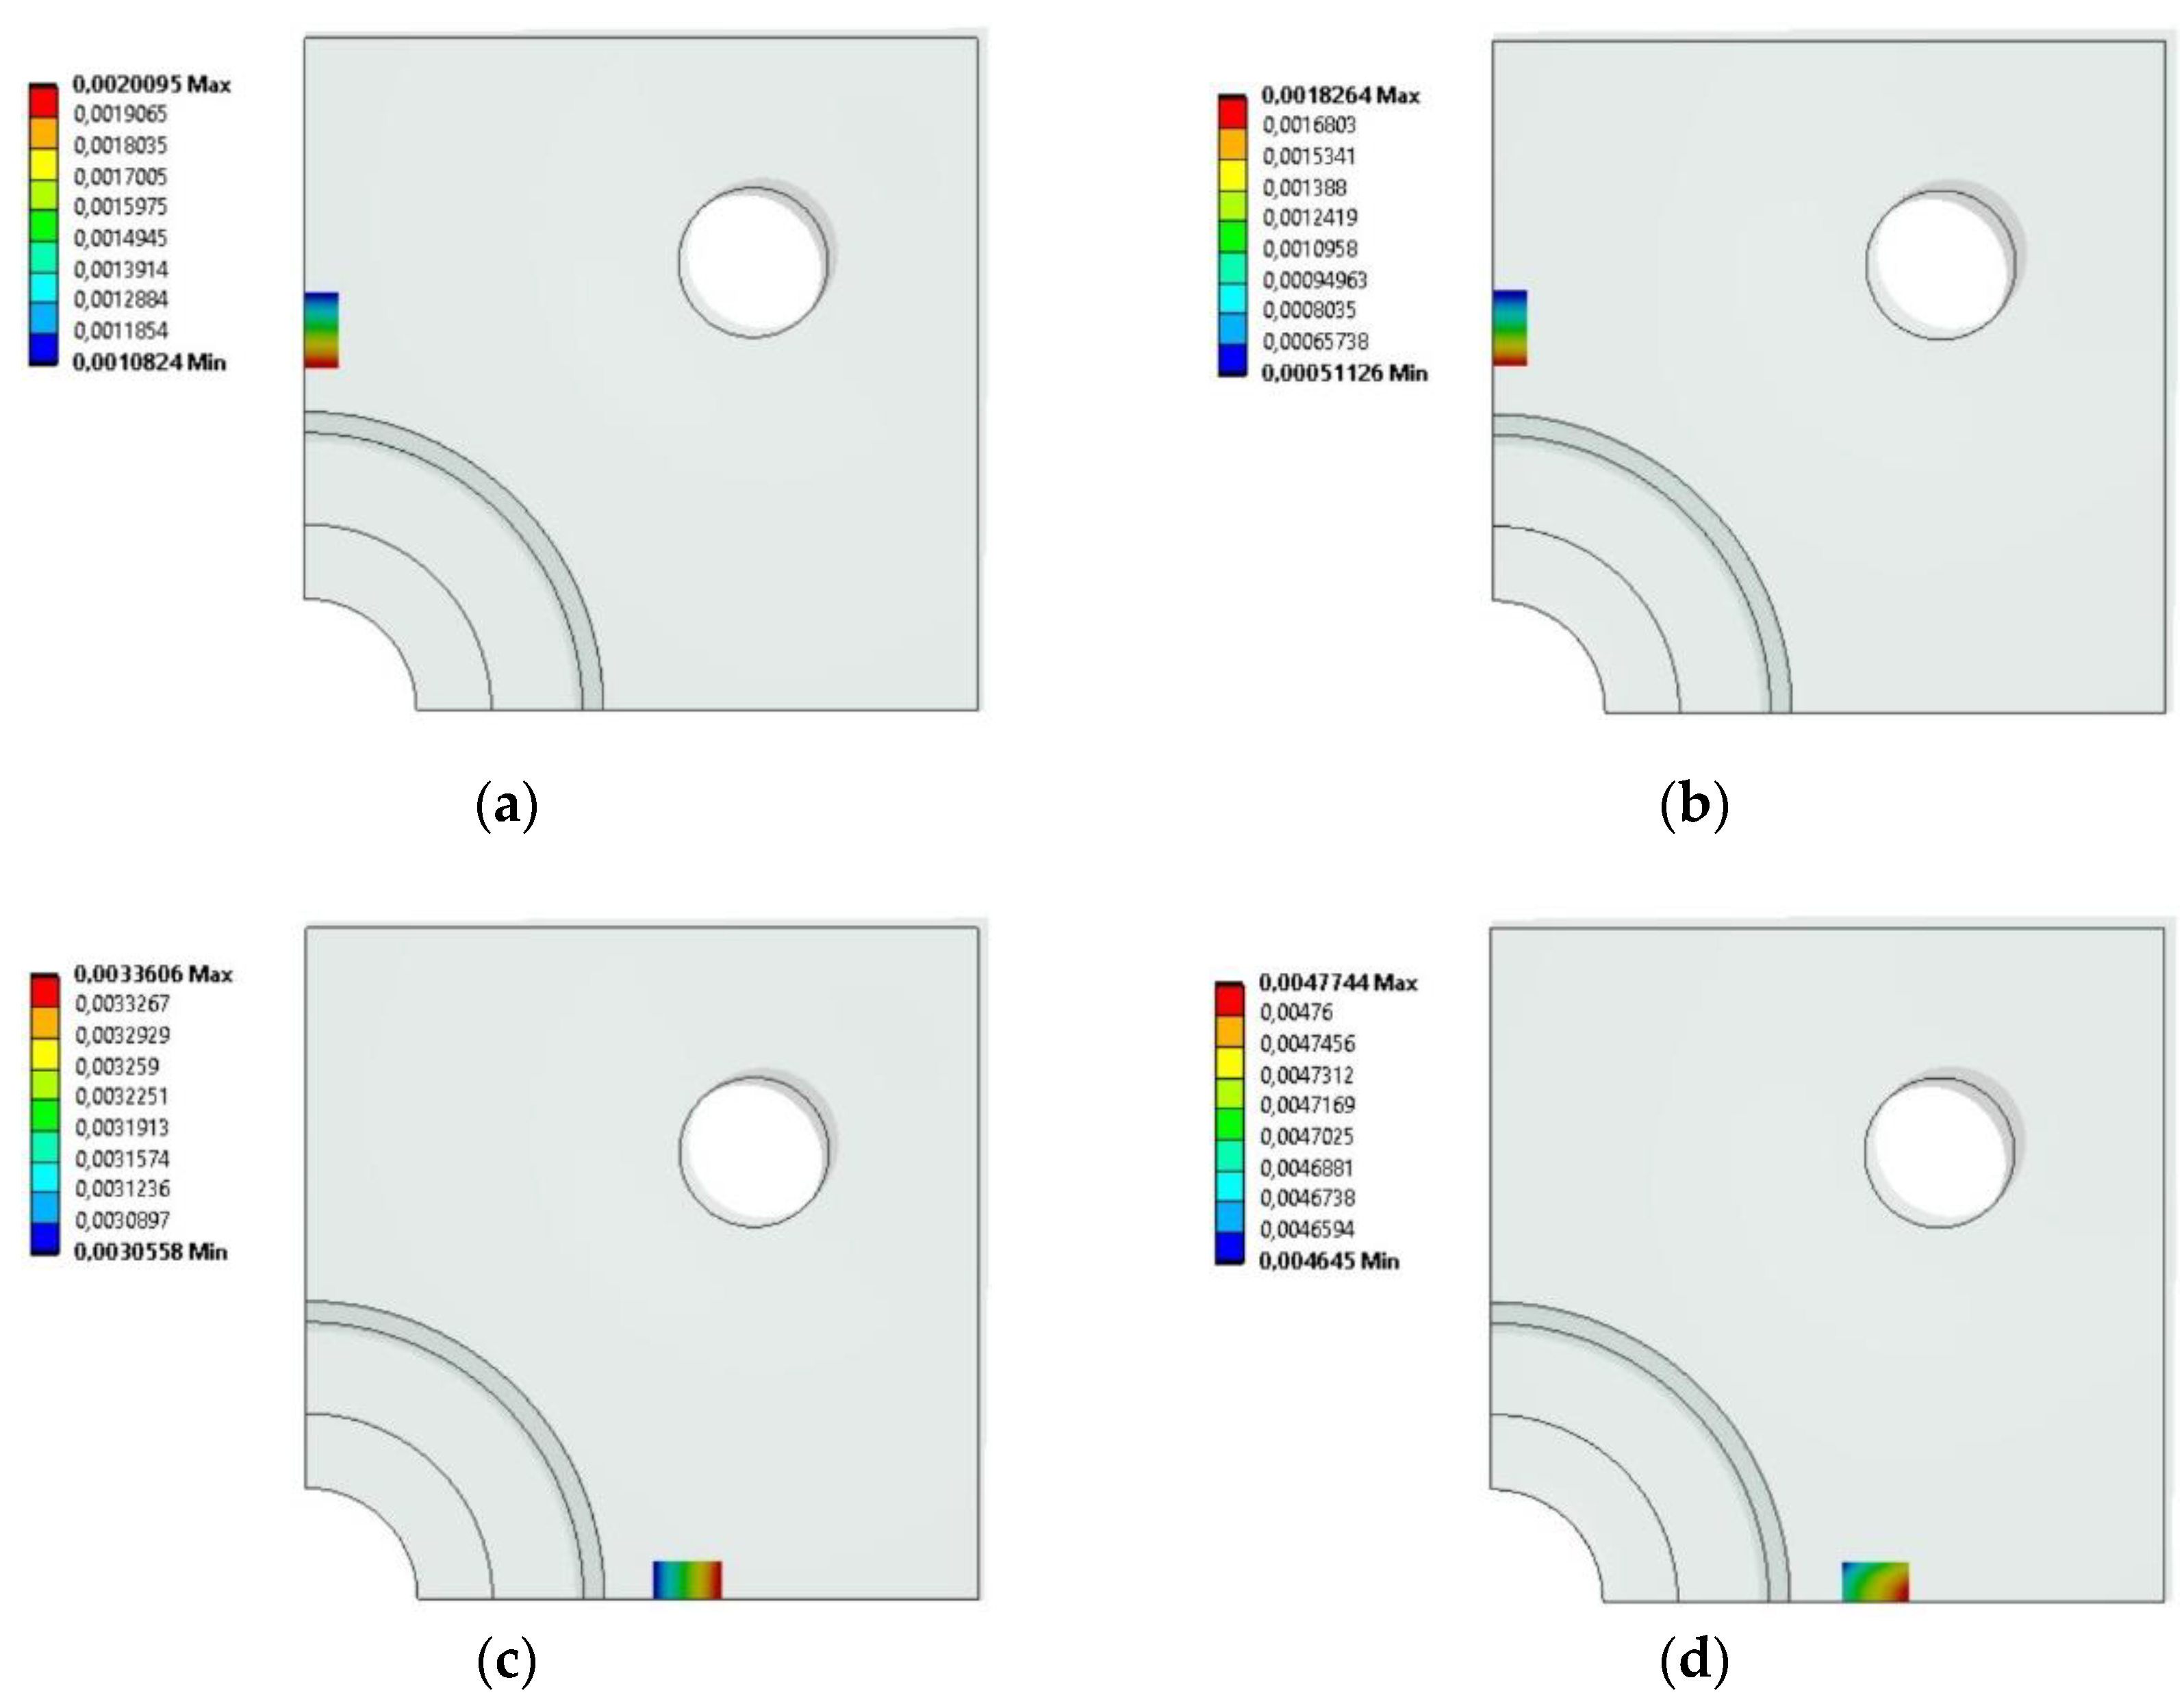
Figure 8.
FEM simulation results for the base stresses reduced according to the Huber-Mises hypothesis: (a) After the first simulation step; (b) After the second simulation step.
Figure 8.
FEM simulation results for the base stresses reduced according to the Huber-Mises hypothesis: (a) After the first simulation step; (b) After the second simulation step.
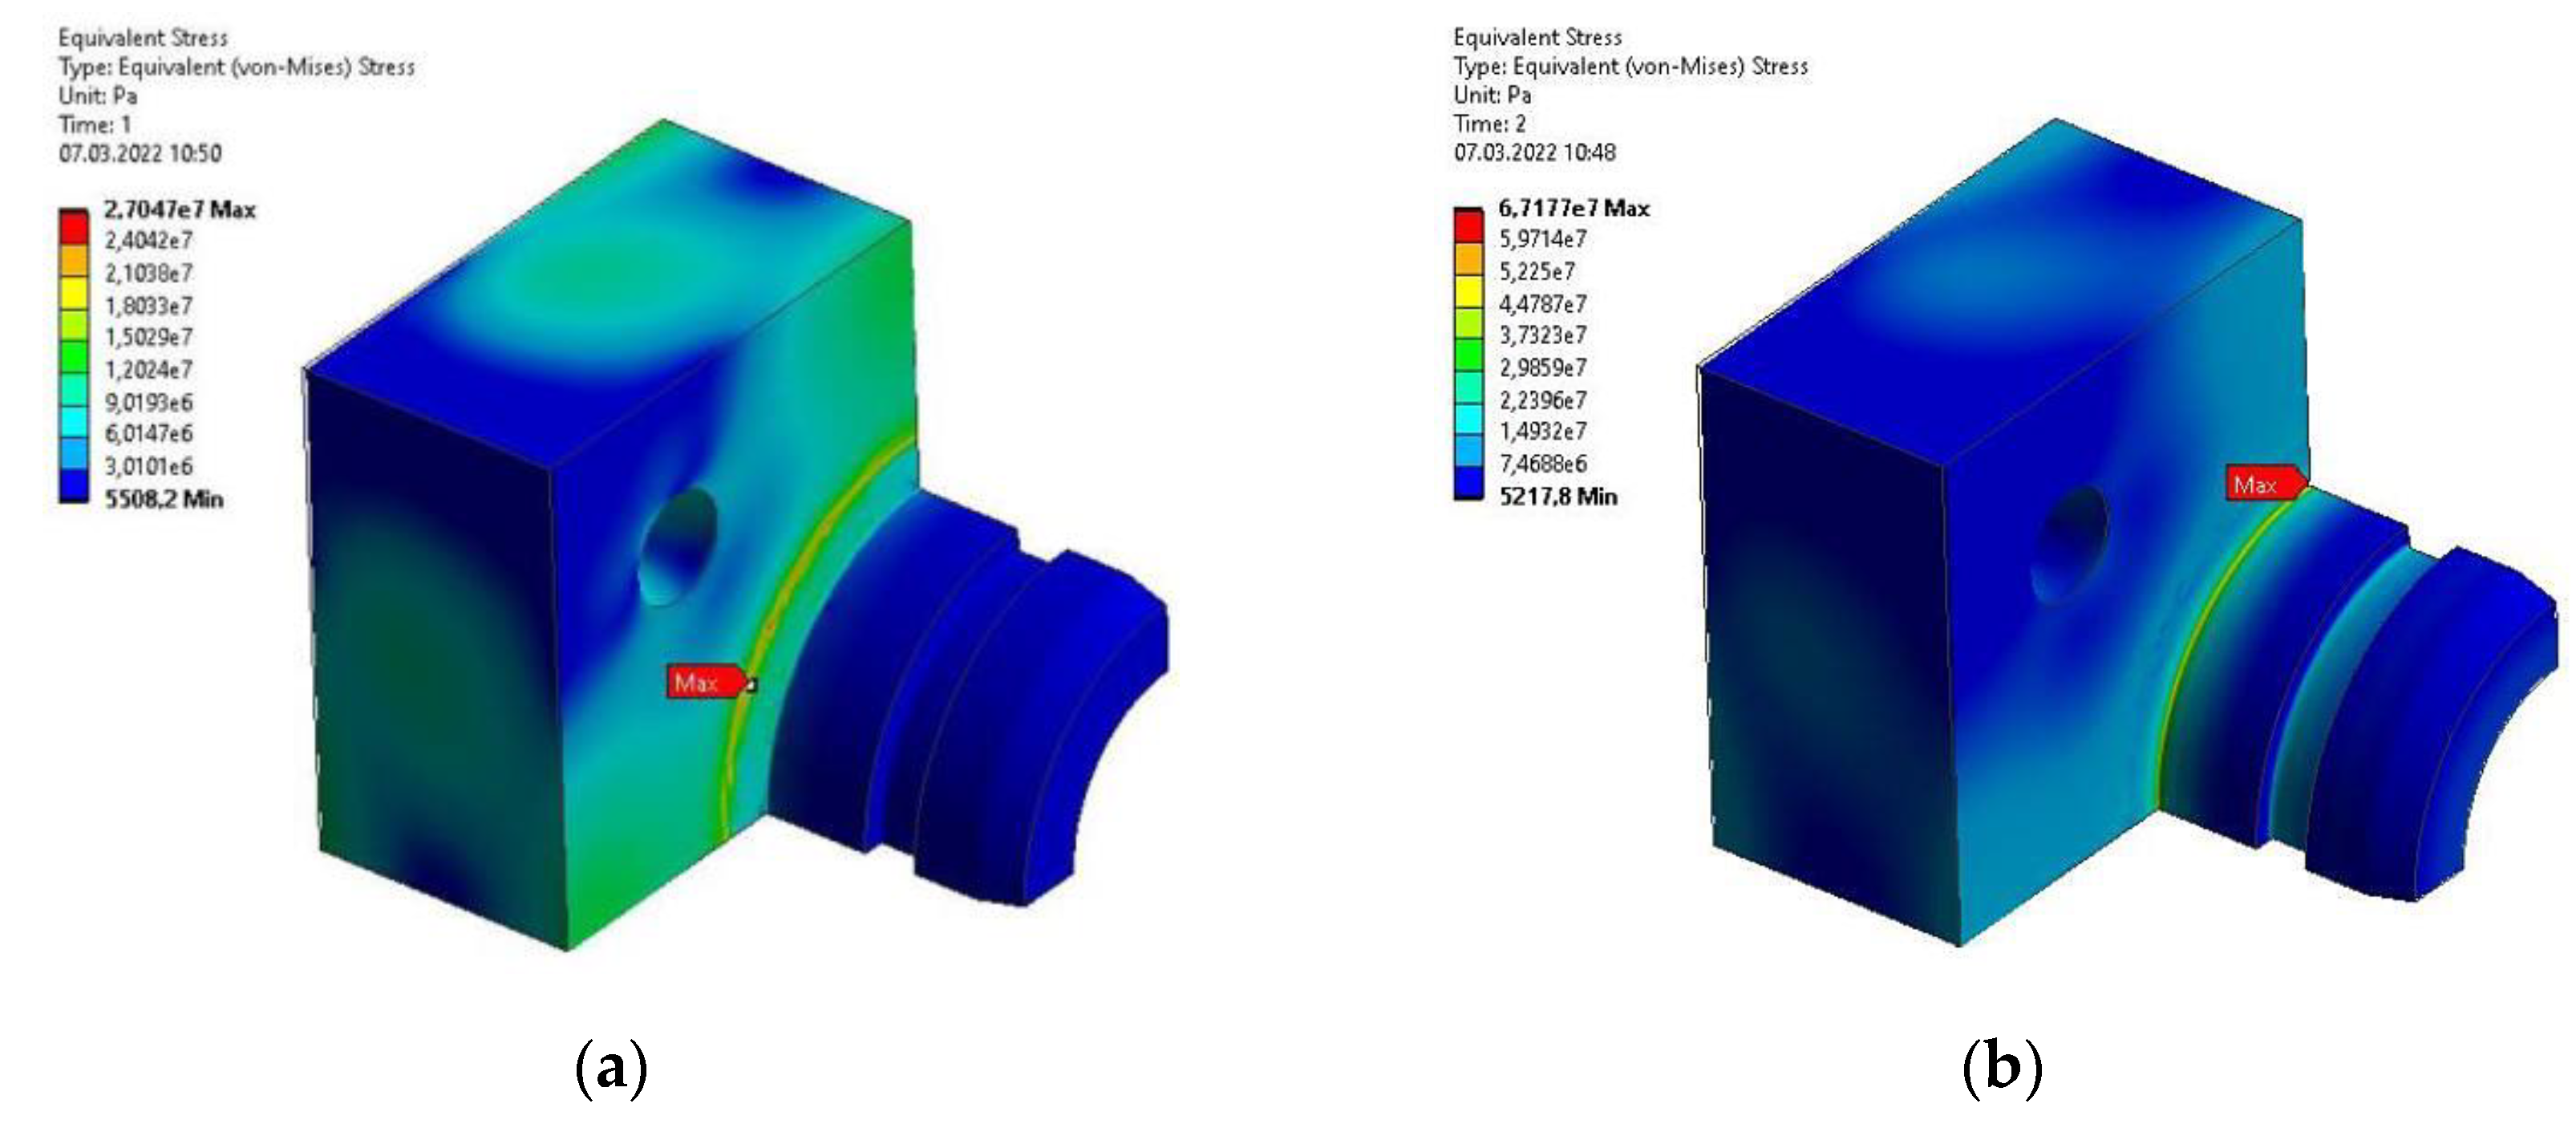
Figure 9.
Experimental testing explanation: (a) Photos of the base made of PET material; (b) Arrangement of strain gauges on the base during experimental tests.
Figure 9.
Experimental testing explanation: (a) Photos of the base made of PET material; (b) Arrangement of strain gauges on the base during experimental tests.
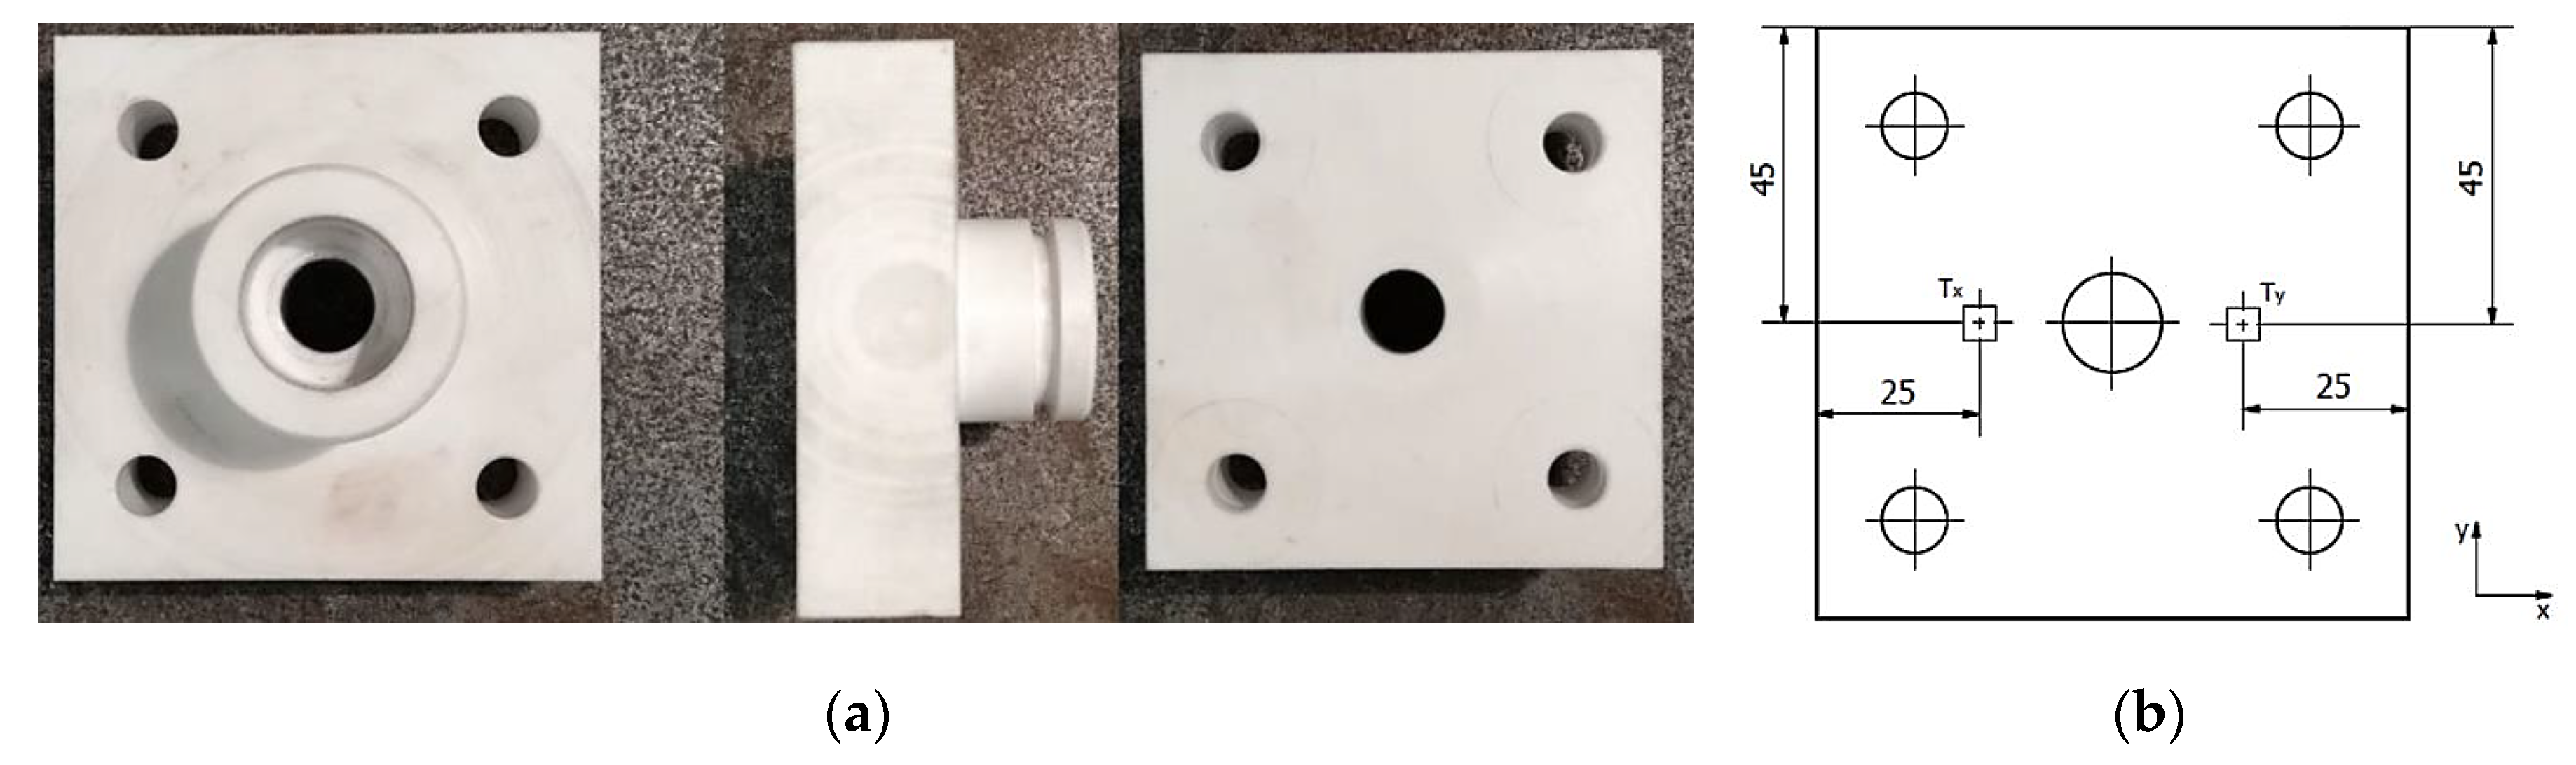
Figure 10.
Deformations of the base in the X and Y directions recorded during experimental tests during the initial tensioning of the tie rods (Step 1).
Figure 10.
Deformations of the base in the X and Y directions recorded during experimental tests during the initial tensioning of the tie rods (Step 1).
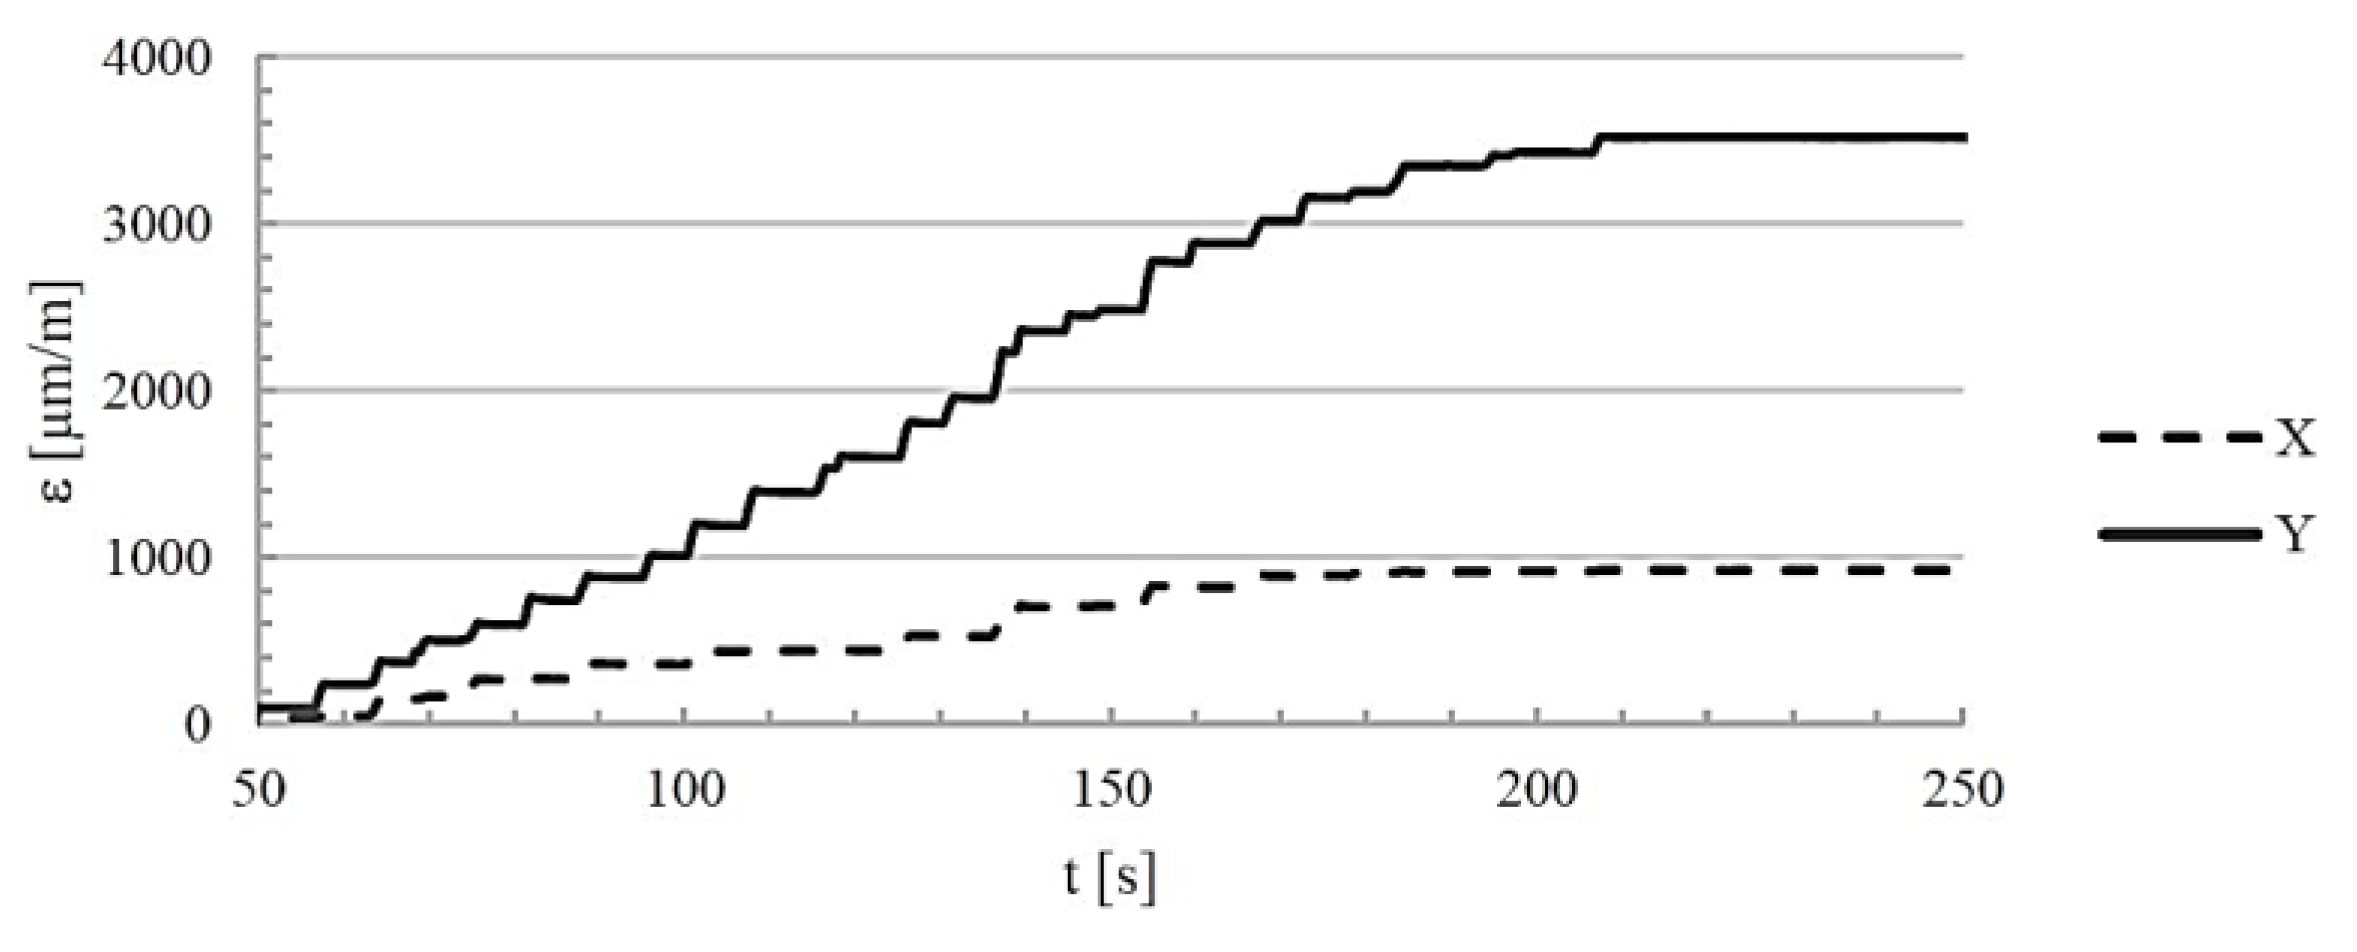
Figure 11.
Deformations of the base in the X and Y directions recorded during experimental tests during internal pressure loading (Step 2).
Figure 11.
Deformations of the base in the X and Y directions recorded during experimental tests during internal pressure loading (Step 2).
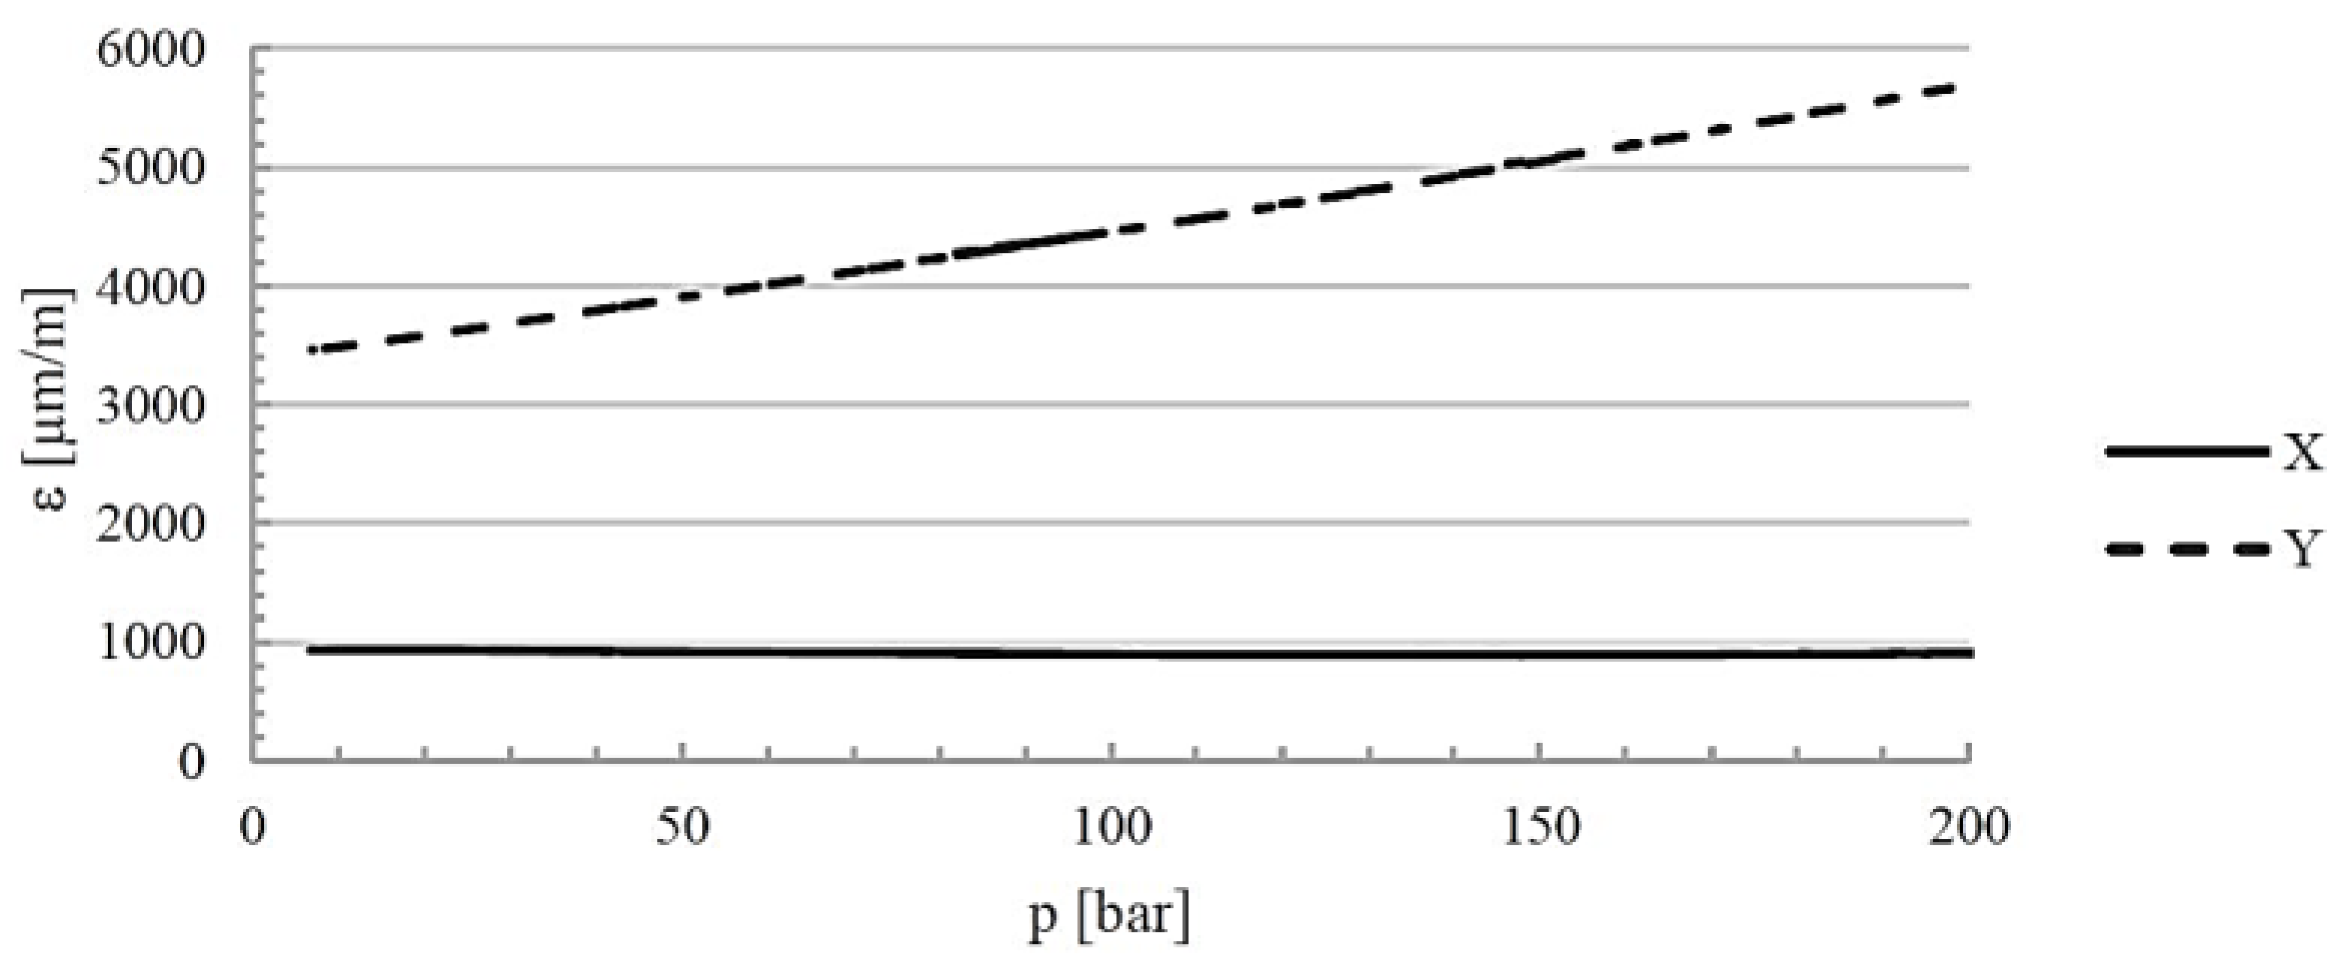
Figure 12.
Sample mounted in the: (a) Grip of a testing machine with an extensometer installed; (b) Compression test grip; (c) Shear test fixture.
Figure 12.
Sample mounted in the: (a) Grip of a testing machine with an extensometer installed; (b) Compression test grip; (c) Shear test fixture.
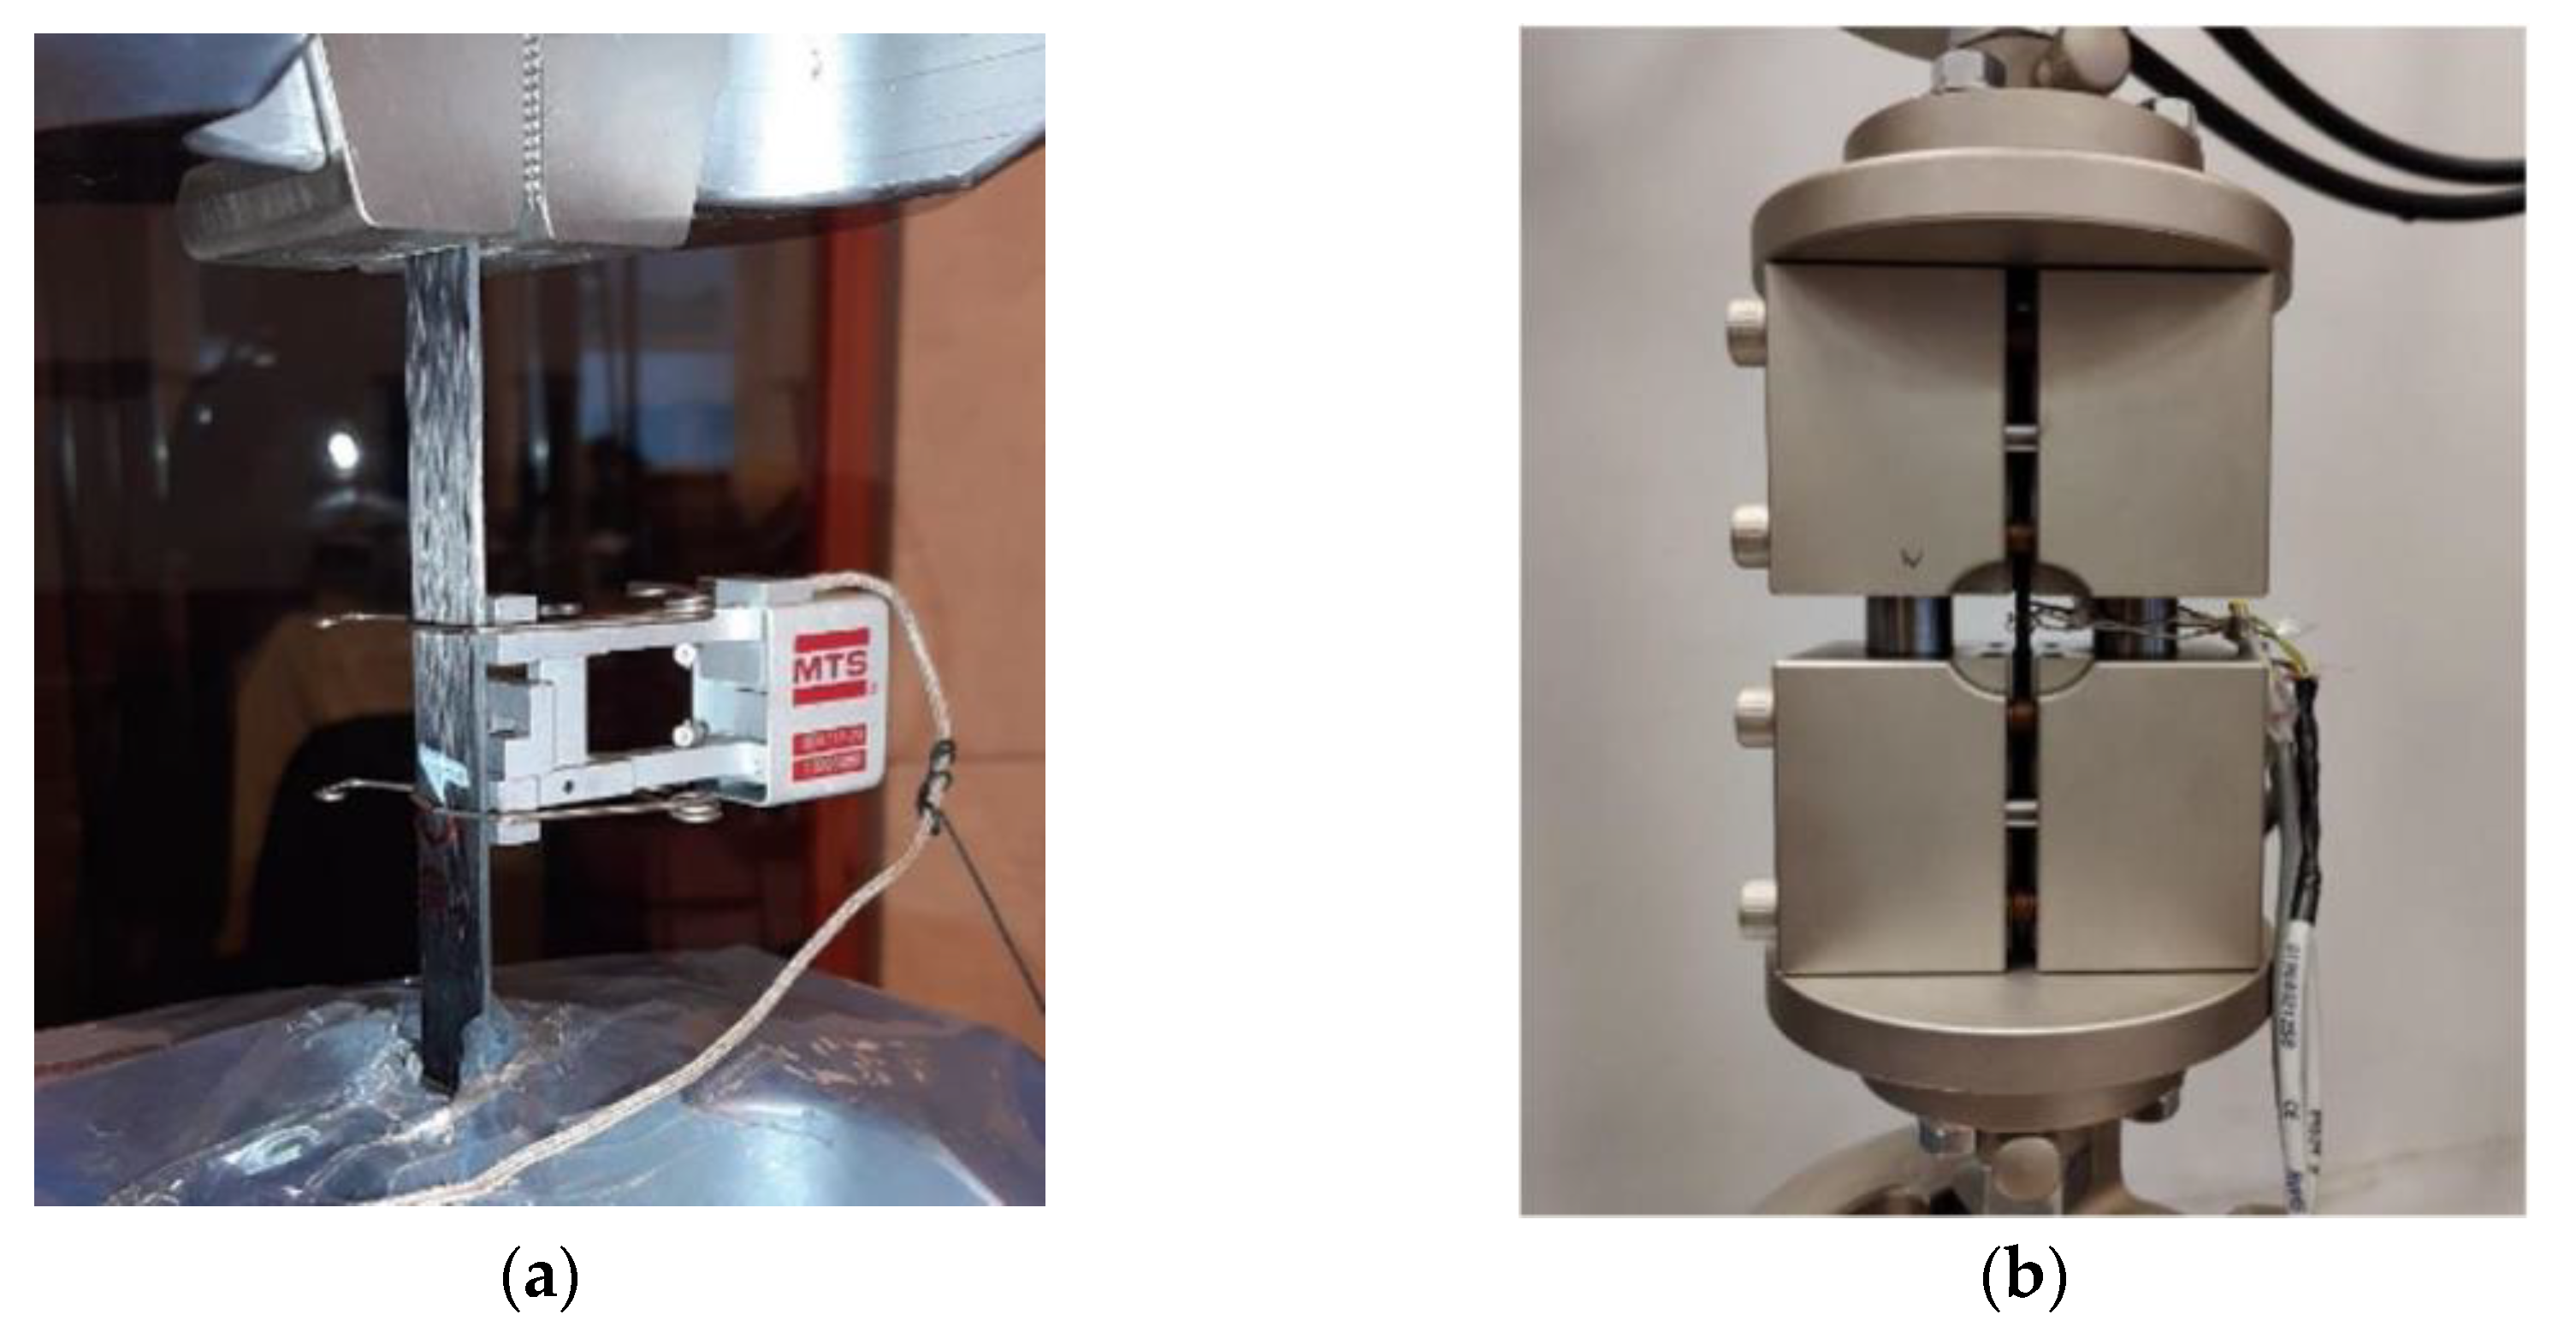
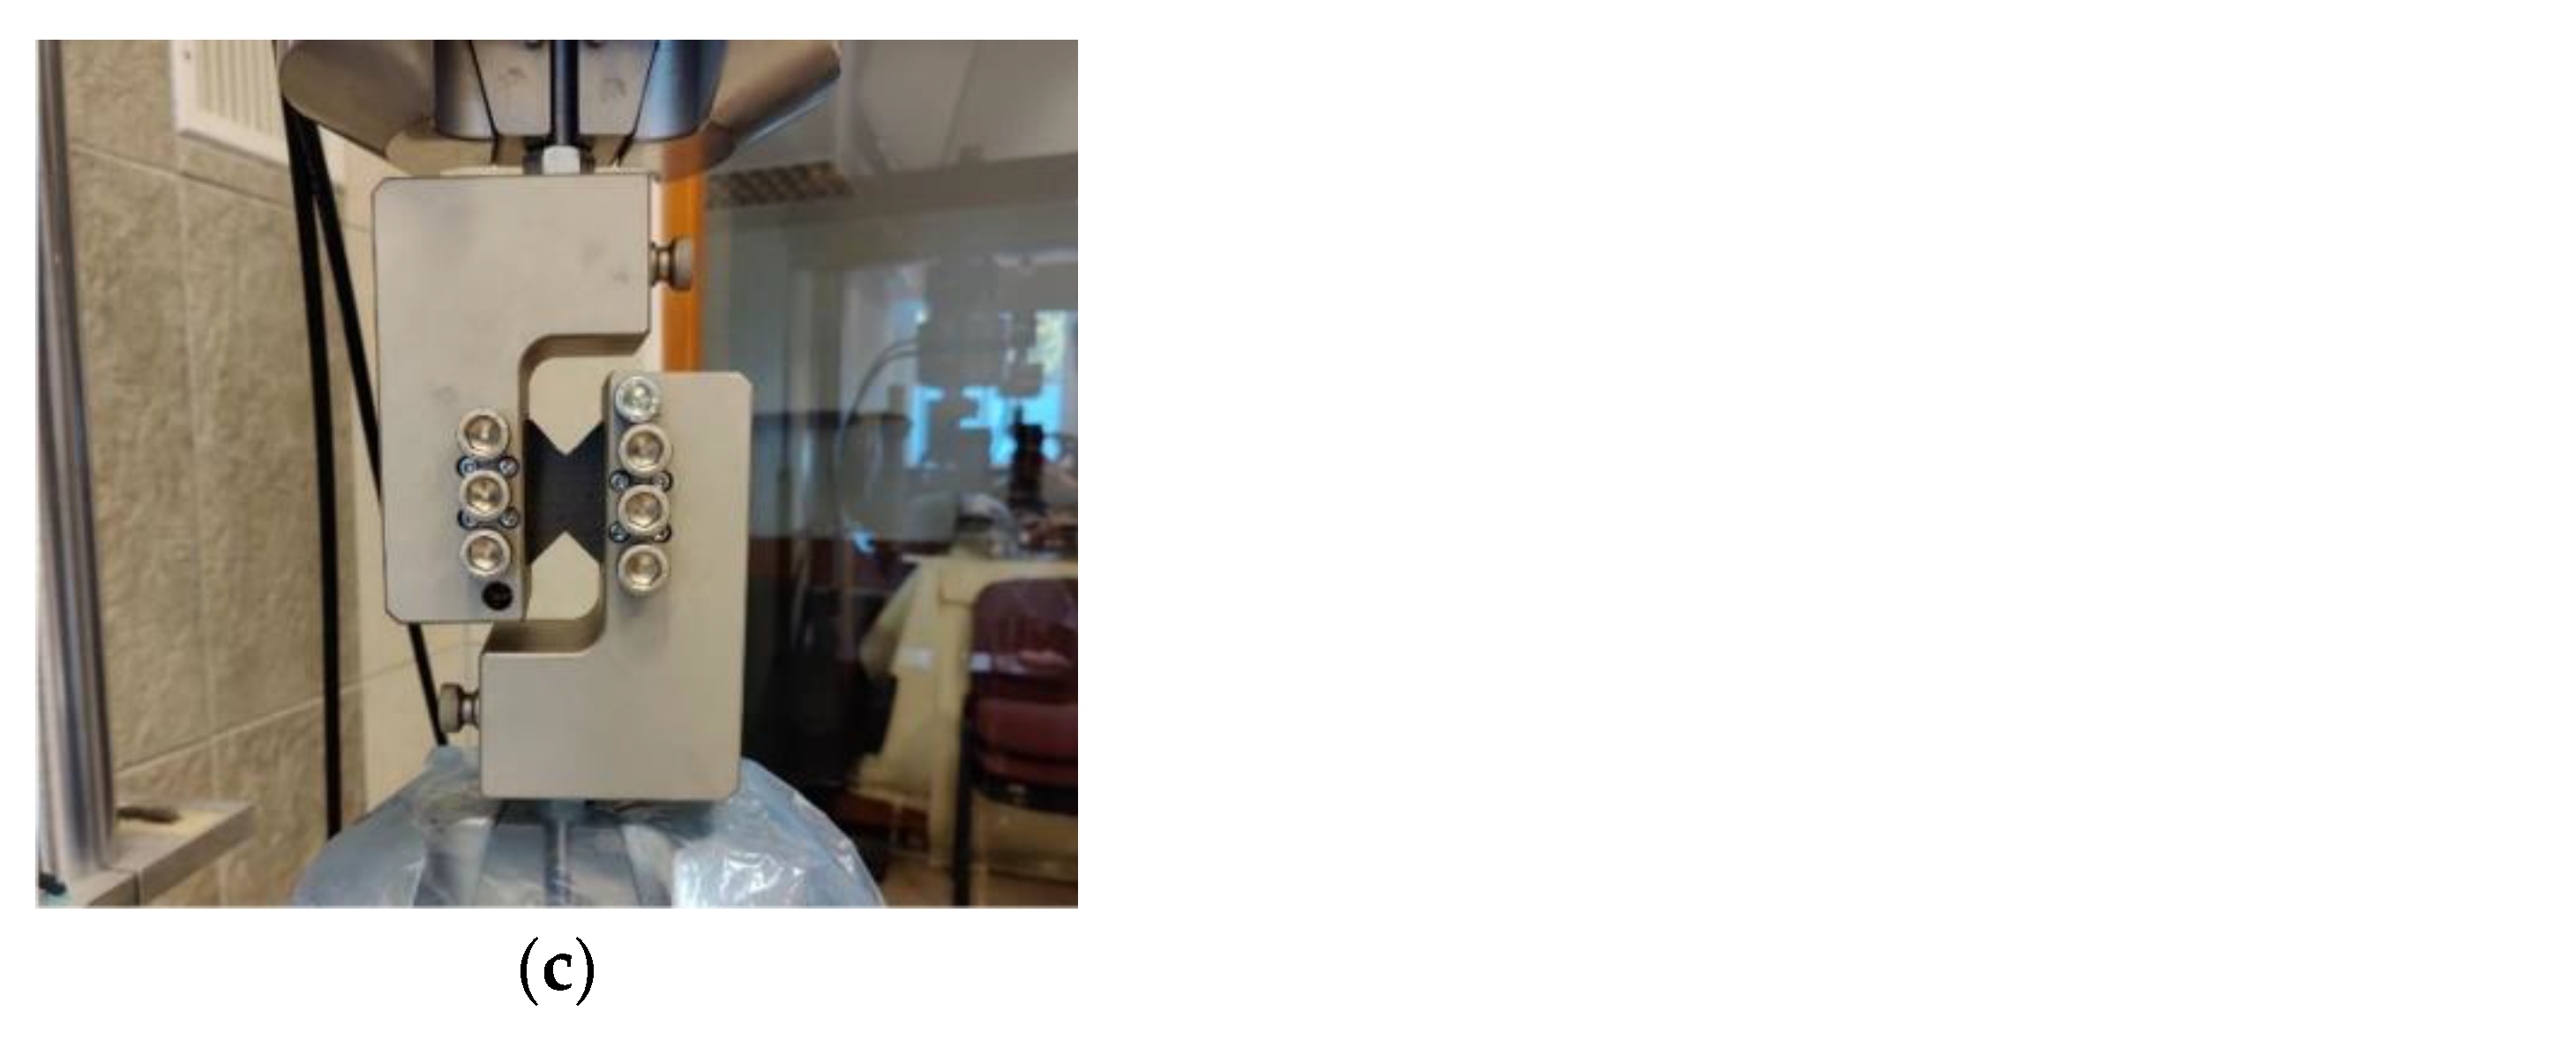
Figure 13.
Hydraulic diagram of the actuator test stand: 1 – pump; 2 – safety valve; 3 – pressure gauge; 4 – 4/3 directional control valve; 5 – 2-way flow control valve; 6 – 3-way flow control valve; 7 – check valve; 8 and 9 – flow meter; 10 and 11 – pressure sensor; 12 – tested actuator; 13 – position sensor; 14 – force sensor; 15 – loading actuator; 16 – 4/3 directional control valve; 17 – pressure sensor; 18 – relief valve; 19 – safety valve; 20 – adjustable throttle valve; 21 – pump; 22 and 23 – hydraulic tank.
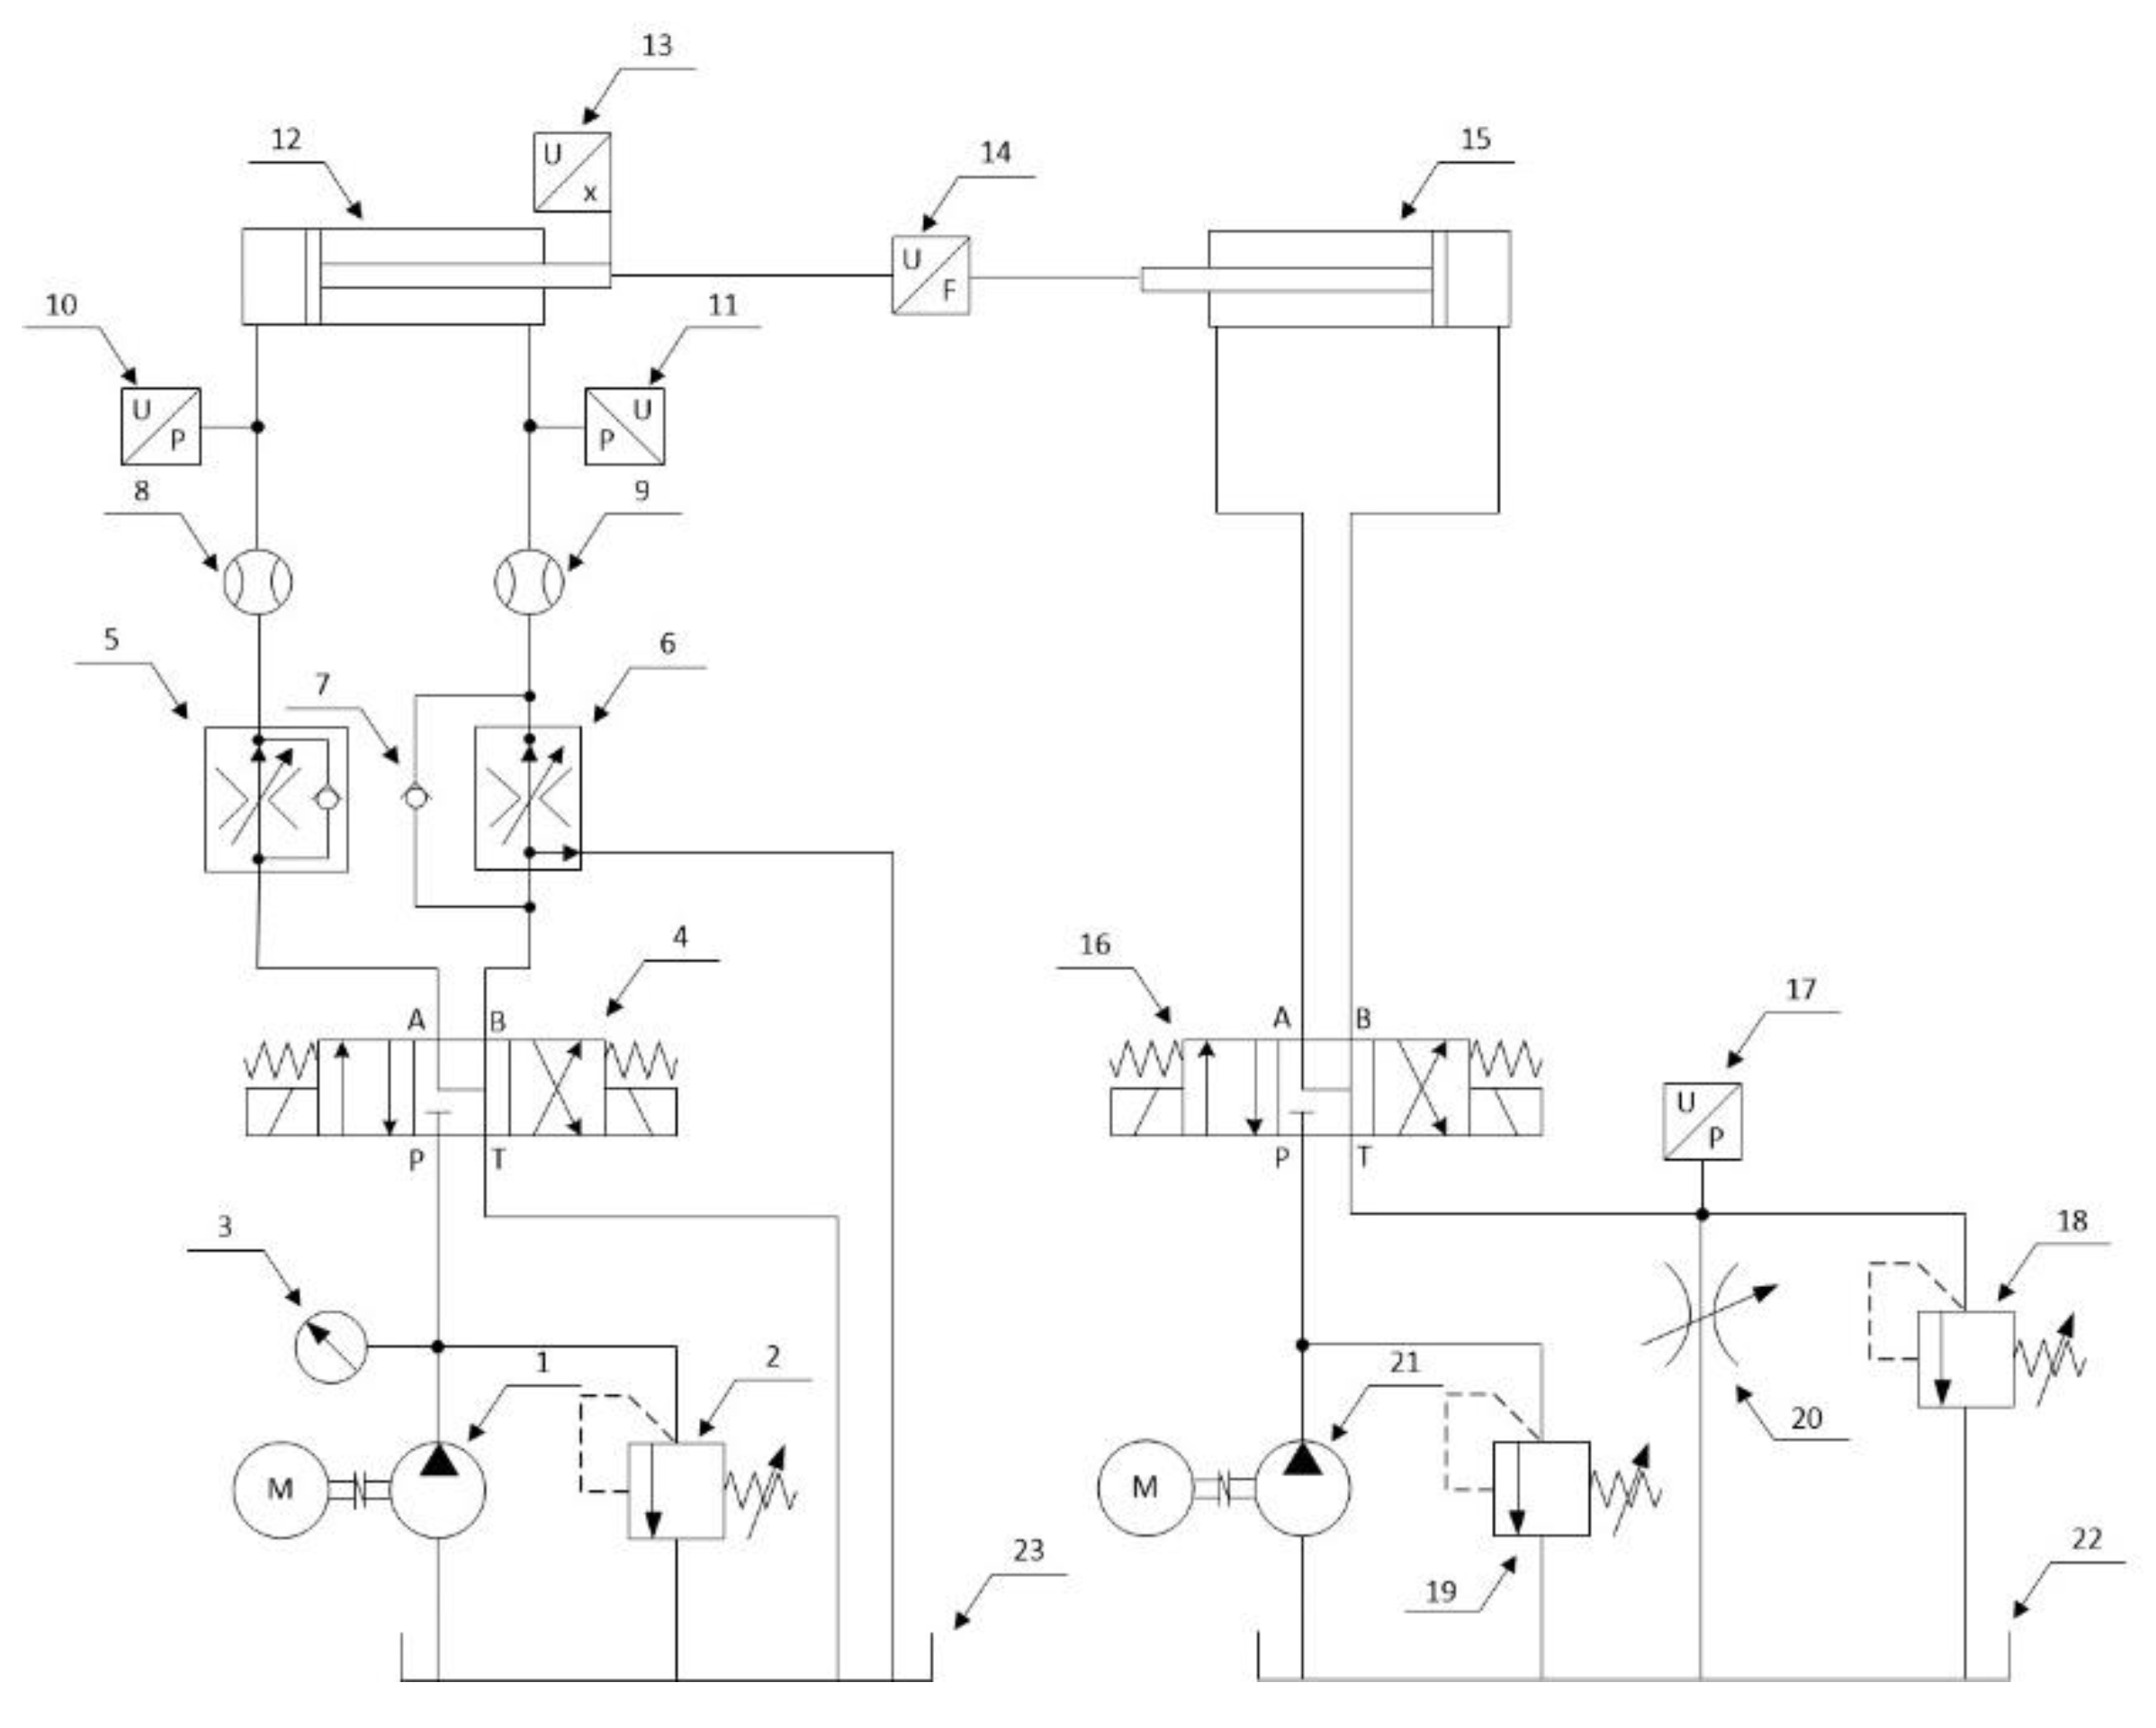
Figure 14.
Actuator with a steel cylinder mounted on a test stand.
Figure 15.
Axial εX and circumferential εθ deformations of the steel cylinder during pre-tensioning.
Figure 15.
Axial εX and circumferential εθ deformations of the steel cylinder during pre-tensioning.
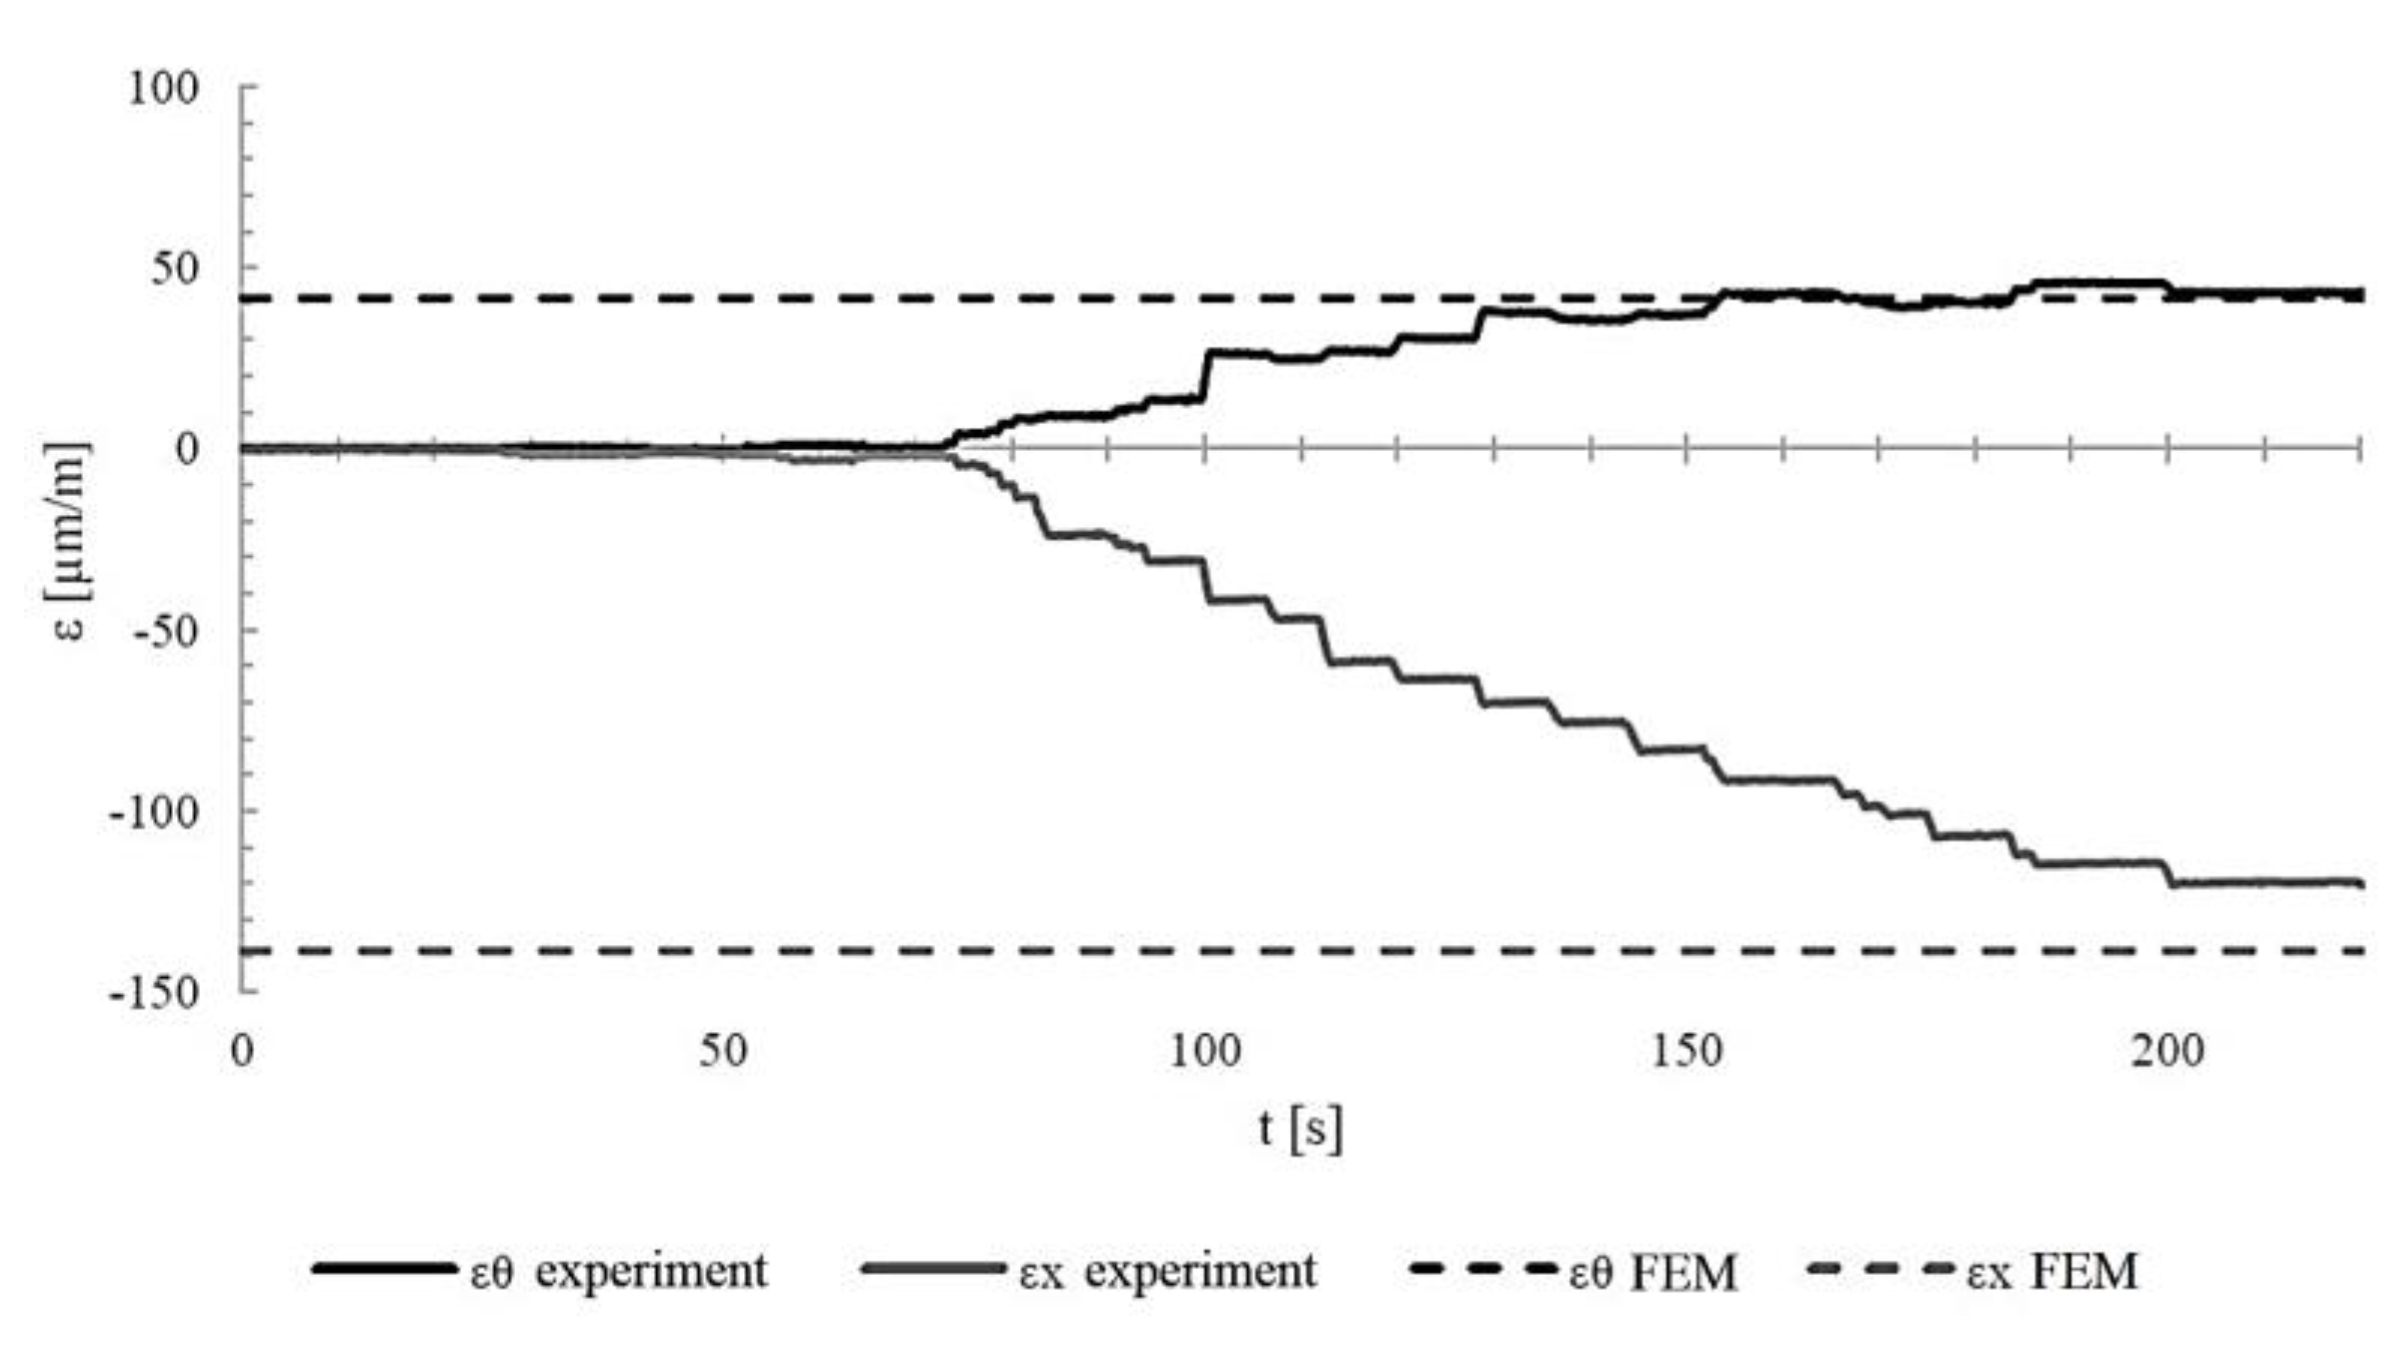
Figure 16.
Axial εX and circumferential εθ deformations of the steel cylinder under internal pressure with the piston rod retracted.
Figure 16.
Axial εX and circumferential εθ deformations of the steel cylinder under internal pressure with the piston rod retracted.
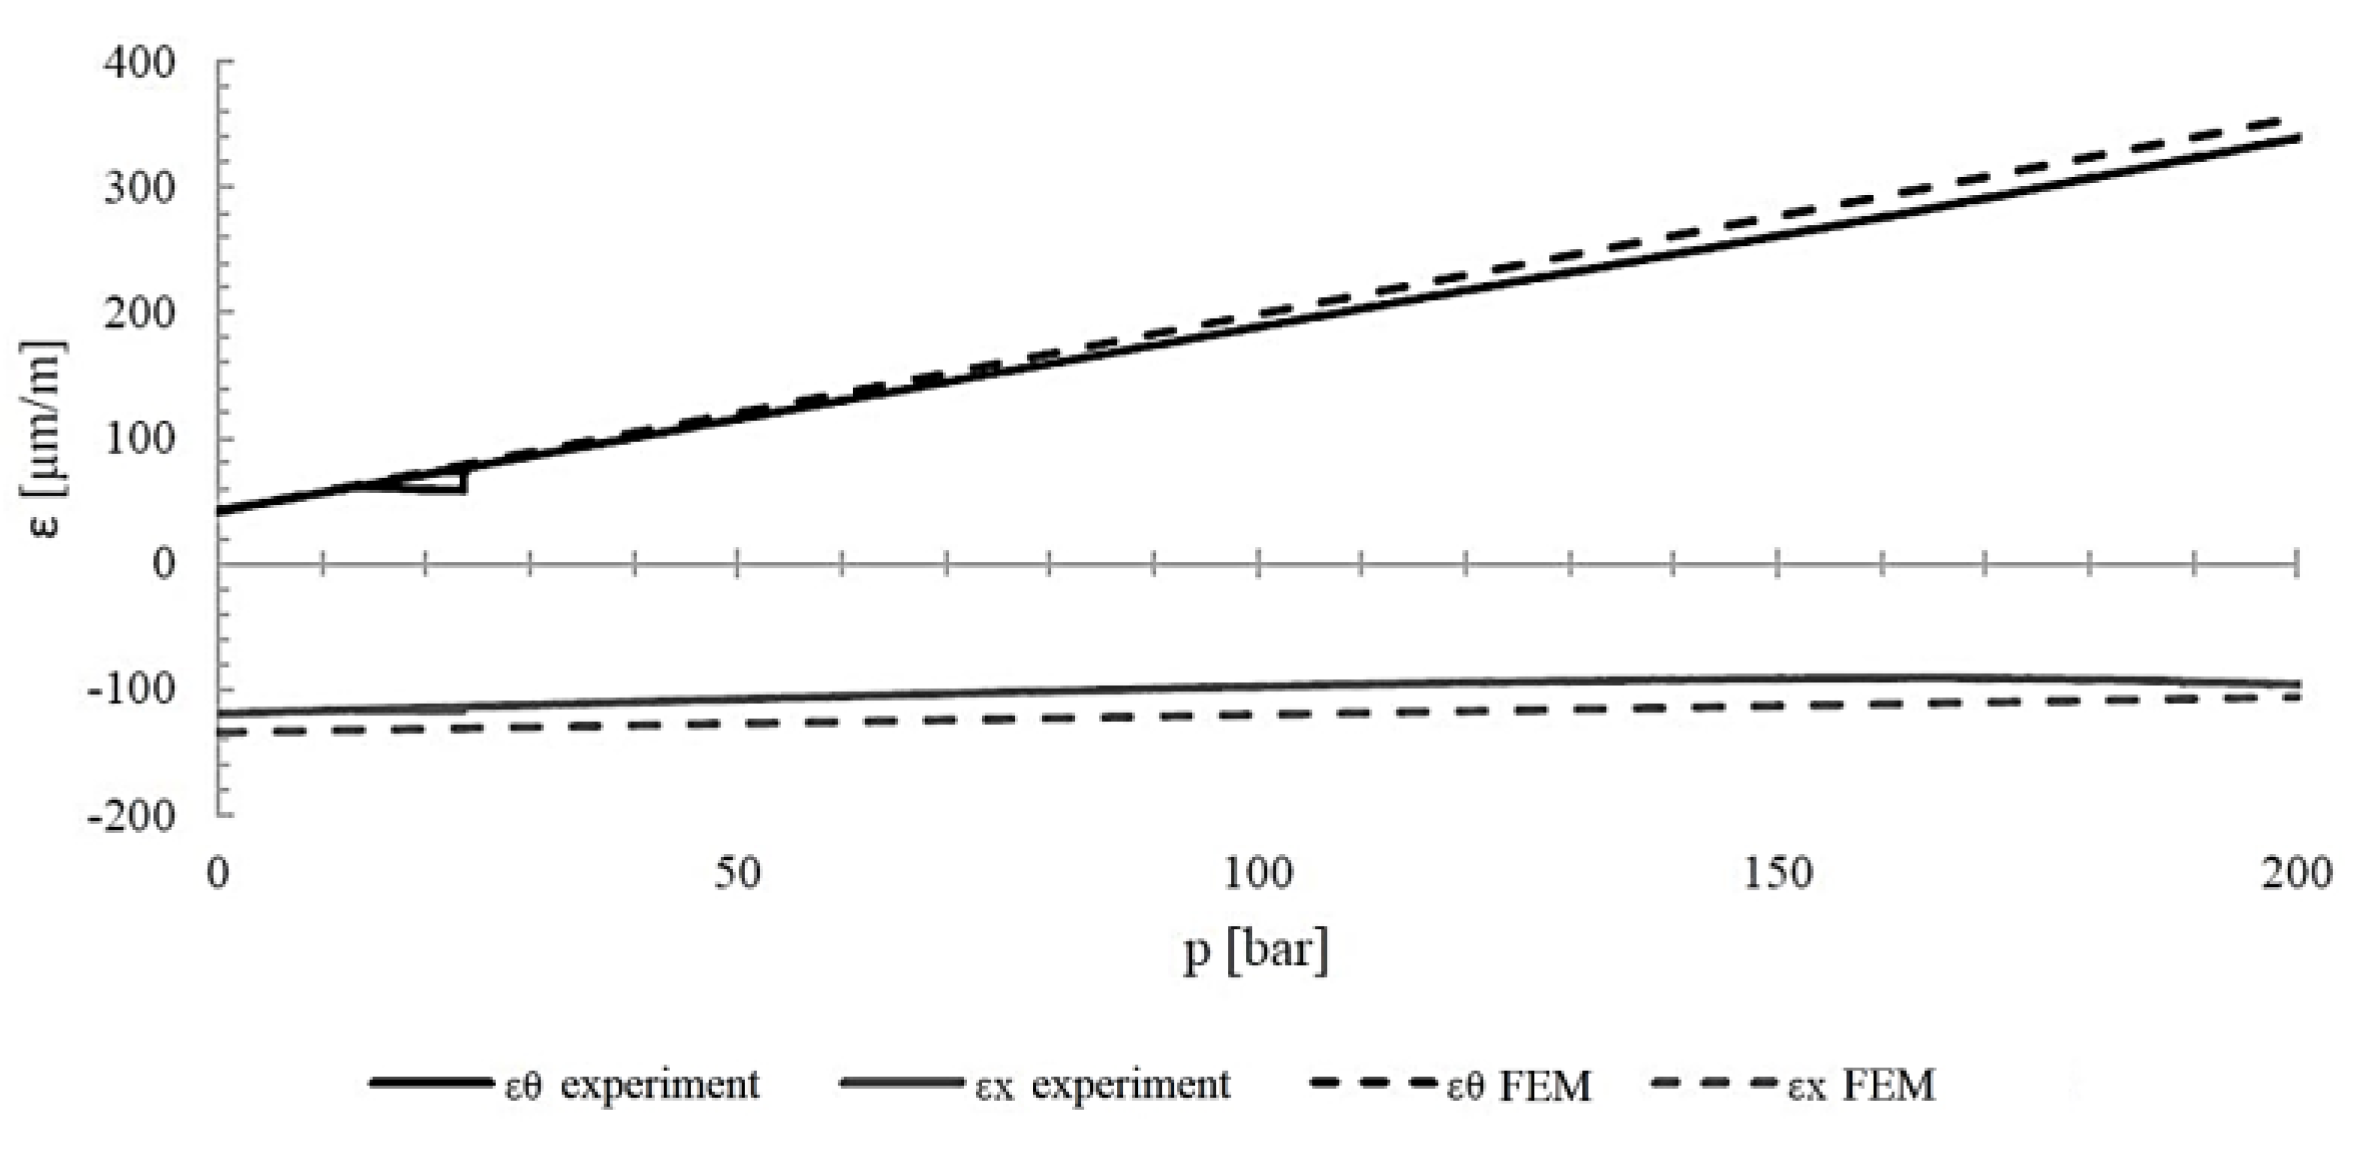
Figure 17.
Deformation of the composite cylinder [90/90/±20/]2 during pre-tensioning (Step 1).
Figure 18.
Deformation of the composite cylinder [90/90/±20/]2 during inner pressure loading (Step 2).
Figure 18.
Deformation of the composite cylinder [90/90/±20/]2 during inner pressure loading (Step 2).
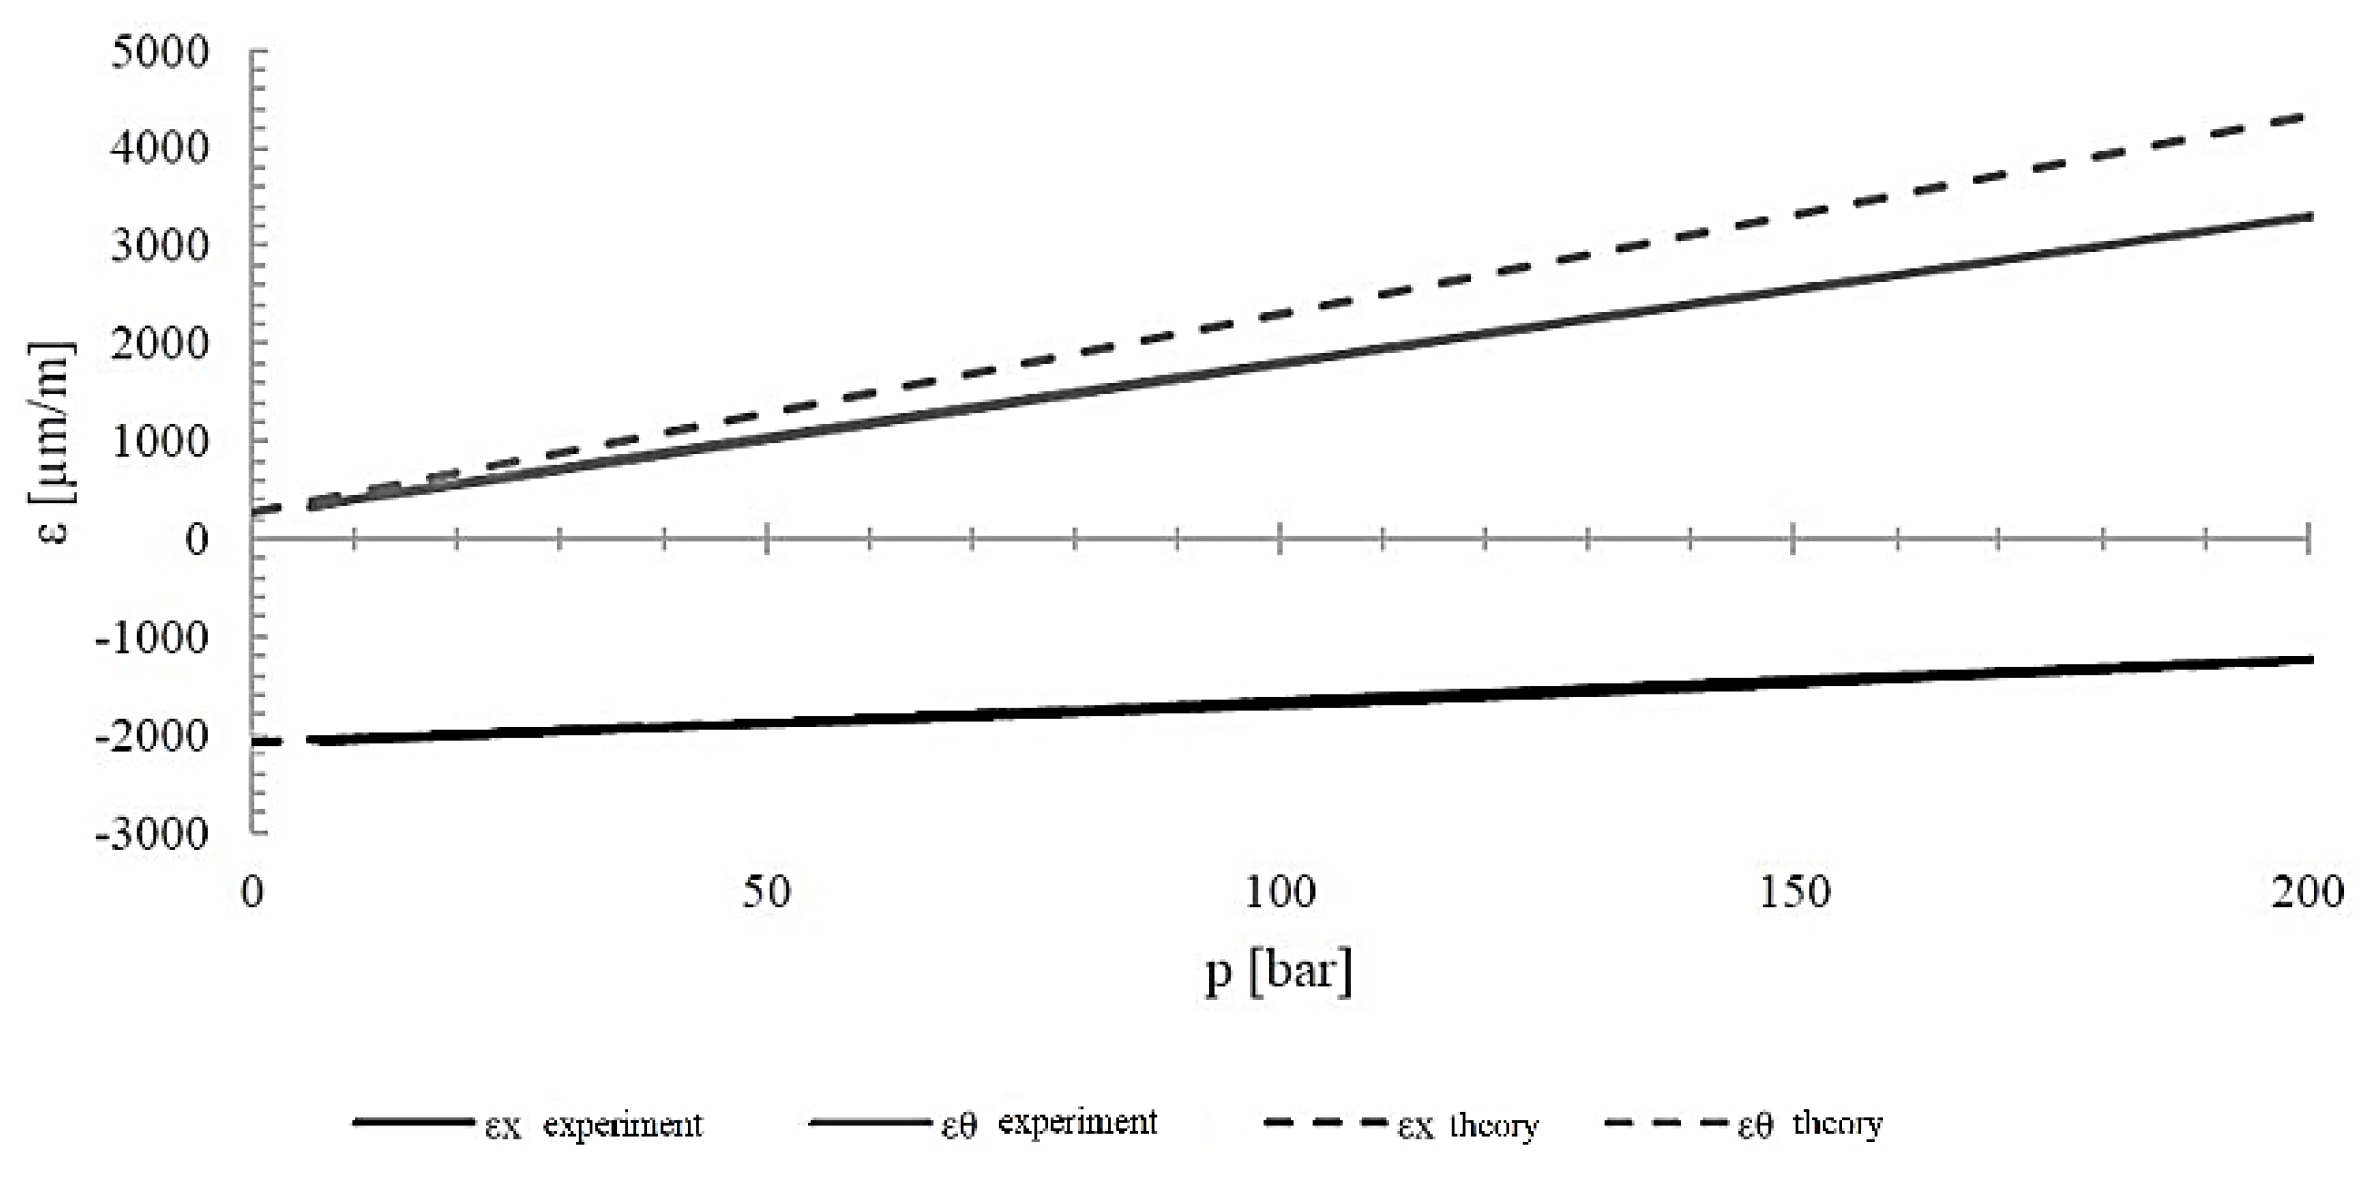

Table 1.
Preliminary design parameters of the actuator.
| Parameter | Value |
| Operating pressure [MPa] Piston velocity [m/s] Stroke [mm] Inner cylinder diameter [mm] |
15 0.3 150 40 |
Table 2.
Selected mechanical and thermal properties of engineering plastics.
| Material | Young’s Modulus | Tensile strength | Glass transition temperature |
| Polyamide 6 (PA) | 3300 [MPa] | 79 [MPa] | 45 [°C] |
| Polypropylene (PP) | 2000 [MPa] | 34 [MPa] | -10 [°C] |
| Polyethylene terephthalate) (PET) | 3100 [MPa] | 79 [MPa] | 81 [°C] |
| Polyoxymethylene (POM) | 2600 [MPa] | 67 [MPa] | -60 [°C] |
Table 3.
Average results of base deformations at the strain gauge locations.
| - | εx [μm/m] | εy [μm/m] |
| Step 1 (Pre-tension) | 1559 | 3214 |
| Step 2 (Pressure load) | 1153 | 4720 |
Table 4.
Comparison of FEM analysis and experimental measurements of base deformation.
| - | εx [μm/m] | εy [μm/m] | ||
| FEM | Experiment | FEM | Experiment | |
| Step 1 (Pre-tension) | 1559 | 931 | 3214 | 3462 |
| Step 2 (Pressure load) | 1153 | 909 | 4720 | 5700 |
Table 5.
Material properties of the used epoxy-carbon composite.
| Parameter | Value |
| E1T = E1c | 103.31 [GPa] |
| E2T = E2c | 8.39 [GPa] |
| G12 | 4.64 [GPa] |
| (σ1T)ult | 1070.96 [MPa] |
| (σ2T)ult | 40.39 [MPa] |
| (σ1C)ult | 703.01 [MPa] |
| (σ2C)ult | 113.64 [MPa] |
| (τ12)ult | 63.88 [MPa] |
| ν12 = ν12 | 0.34 [-] |
Table 6.
Example of an individual representing the layering of a winding element.
| 1st Gen | 2nd Gen | 3rd Gen | 4th Gen | 5th Gen | 6th Gen | ||||||
| +12° | -12° | +25° | -25° | +83° | -83° | +45° | -45° | +10° | -10° | +70° | -70° |
Table 7.
Comparison of FEM calculation and experimental measurements on cylinder.
| - | εx [μm/m] | εΘ [μm/m] | ||
| FEM | Experiment | FEM | Experiment | |
| Step 1 (Pre-tension) | -138.6 | -120.02 | 41.56 | 43.13 |
| Step 2 (Pressure load) | -106.44 | -96.39 | 355.4 | 339.6 |
Table 8.
Comparison of deformations of composite cylinder [90/90/±20/]2 measured experimentally and determined theoretically using classical laminate theory.
Table 8.
Comparison of deformations of composite cylinder [90/90/±20/]2 measured experimentally and determined theoretically using classical laminate theory.
| - | εx [μm/m] | εΘ [μm/m] | ||
| Experiment | Theory | Experiment | Theory | |
| Step 1 (Pre-tension) | -2107.8 | 2083 | 258.35 | 269.64 |
| Step 2 (Pressure load) | -1237.12 | 1252.9 | 4329.13 | 4329.13 |
Disclaimer/Publisher’s Note: The statements, opinions and data contained in all publications are solely those of the individual author(s) and contributor(s) and not of MDPI and/or the editor(s). MDPI and/or the editor(s) disclaim responsibility for any injury to people or property resulting from any ideas, methods, instructions or products referred to in the content. |
© 2025 by the authors. Licensee MDPI, Basel, Switzerland. This article is an open access article distributed under the terms and conditions of the Creative Commons Attribution (CC BY) license (http://creativecommons.org/licenses/by/4.0/).
Copyright: This open access article is published under a Creative Commons CC BY 4.0 license, which permit the free download, distribution, and reuse, provided that the author and preprint are cited in any reuse.


