
Submitted:
18 January 2025
Posted:
20 January 2025
You are already at the latest version
Abstract
The paper points out the growing interest in the use of composite materials for responsible components, including hydraulic components. The non-negligible benefits of using composite materials in mechanical engineering were pointed out. However, applications of new materials sometimes give rise to new challenges. The strength parameters of a new structure, such as a composite cylinder for a hydraulic cylinder, depend on its structure, including the number of fiber layers and the angle of their arrangement. This paper presents the application of a genetic algorithm to optimize the process of selecting the structure of a composite cylinder of a hydraulic cylinder. A block diagram of the algorithm for optimizing the structure election process is presented, and the designed structure is verified.
Keywords:
Genetic algorithm
; Composite material
; Hydraulic drive
; Actuators
; Optimization
1. Introduction
A composite is a material obtained by combining two or more base materials with (usually) diametrically opposed properties. The resulting material has superior and/or novel properties compared to components used separately or resulting from their summation [1]. In most cases, one of the materials takes on the role of the matrix (continuous, bonding medium), while the rest become the filler (reinforcement). Among fibrous composites (in which reinforcement is realized by fibers), we can distinguish two main types: those reinforced with chopped (short) fibers and those reinforced with continuous fibers [2]. The fibers (usually glass, carbon or aramid) have a high modulus of elasticity along their axis and high tensile strength. Properly stored and processed, they do not show a decrease in properties during the technological process, and differences in diameter and properties between individual fibers of the same type are negligibly small.
On the market you can find many types of such fibers that differ in parameters and, consequently, also in price. Figure 1 and Figure 2 show charts made available by leading carbon fiber manufacturers presenting their offerings. They show that fibers are divided into three main groups according to their Young's modulus, with medium-modulus fibers achieving the highest strengths (even over 6,000 MPa). The strength range of carbon fibers extends from about 2,800 MPa to the more than 6,000 MPa already mentioned, while the modulus range is from about 220 GPa to more than 500 GPa [3,4].
The second component of the composite material is the matrix, the purpose of which is to bind the reinforcement material together and allow load transfer between the fibers. It can also stop or slow the propagation of cracks initiated in the reinforcement and protect the fibers from adverse environmental conditions. The most commonly used matrix materials include polyester, vinylester, epoxy resins and thermoplastics (PE, PP, PA) [1,5,6].
Interest in the use of fiber-reinforced composite materials is growing every year. This is due to their high strength, low weight and corrosion resistance [1,6]. There are many ways to manufacture fiber-reinforced polymer composite materials, such as lamination (hand, spray, vacuum bag), infusion molding, winding, weaving or pultrusion [1]. In the manufacture of high-pressure cylinders and tanks, winding and weaving methods have mainly been used [7]. There are two main areas of application for composite materials in hydraulic components. The first is the production of accumulators [8,9], in which many analogies can be found with high-pressure, fourth-generation tanks. The second, more widely described in the literature, is the manufacture of cylinders or other parts of hydraulic cylinders. Researches [10,11] presented a method for calculating the strength of a composite cylinder with a steel liner due to ad hoc strength and buckling. For this, they used the solution of the Lame problem modified for anisotropic materials. Design constraints were adopted to ensure that the ad hoc strength of the cylinder as well as the circumferential deformation of the cylinder and the axial deformation of the liner are sufficiently low.
Since the cylinder under consideration would also transmit axial forces, the authors designed layers in it in which fibers would be arranged along the axis of the element. Research [12] conducted a static and modal finite element analysis of a composite cylinder. However, the authors do not consider issues specific to composite materials such as layering, the effect of manufacturing method on properties, or the existence of strength hypotheses different from those for conventional isotropic materials. Nowak and Schmidt [13,14,15] conducted an in-depth theoretical analysis of composite tubes with steel liner, deriving analytical formulas to calculate the stress distribution, taking into account internal pressure, axial force and temperature loads. They also conducted experimental verification using strain gauges and acoustic emission. They showed that as long as the liner operates in the elastic deformation range, the composite braid does not carry significant loads. However, once the liner is in the range of plastic deformation, the composite provides the necessary strength to the structure. In the research [16] considered removing the steel liner from inside the cylinder and replacing it with a nanocomposite coating with properties that provide suitable tribological conditions at the cylinder-piston interface. They presented methods for calculating stresses in the various layers of the composite, as well as a method for manufacturing nanocomposite coatings. However, the process of selecting and optimizing the laminate structure is not presented in more detail. The fabricated cylinders were subjected to bench tests, the deformation as a function of internal pressure and the abrasive wear of the nanocomposite layer were determined. The authors confirmed the suitability of such a coating as a sliding material in a cylinder. Another paper [17] shows the design process of a telescopic actuator made of composite material. Material selection, basic strength calculations for isotropic material and partially also for anisotropic material as well as finite element analysis are presented. Special emphasis was placed on preventing buckling of the designed component. Once again, the Huber-Mises hypothesis, commonly used for metallic materials, was used to evaluate the strength of the composite material. The authors took into account the difficulties in connecting the actuator parts due to their being made of different materials, proposing a bonded connection as the best. The authors do not mention the selected fiber angles in the paper.
In the literature, there are works addressing the issue of the design of hydraulic cylinders using composite materials, while signaling a number of design problems.
One of them is the change of the isotropic metallic material of the cylinder to an anisotropic material, which entails changing the methods of strength calculations [11,13,14,15,16,18,19,20,21,22]. However, there are no attempts in the literature to optimize the structure of such a component, which can result in an unreasonable increase in weight and manufacturing costs.
2. Genetic Algorithms. Selection of Parameters
The selection of a composite cylinder structure requires an optimization procedure. The paper decided to use a genetic algorithm for this purpose. Genetic algorithms are a group of optimization algorithms based on the Darwinian principle of “survival of the fittest” [23,24]. Their operation can be divided into several steps (Figure 3):
1. Determine the global parameters of the algorithm;
2. Generation (mostly random) initial population;
3. Evaluation of individuals for adaptation to a specific problem, according to the criteria adopted for the problem;
4. Evaluation of the convergence of the algorithm;
5. Selection of the best adapted individuals for further reproduction;
6. Reproduction consisting of: a) crossbreeding and b) mutations;
7. Return to step 3 until and continue the process until the desired convergence criteria are achieved.
In the case of lamina optimization, a single individual reflects the arrangement of successive layers, which are treated as separate genes. Such genes, in the course of evolution, may undergo mutation, crossover and/or deletion. For the winding element, one of the constraints is that the layers are grouped in twos [+α/−α] which forces an even number of layers. Thus, two corresponding layers [+α/−α] are treated by the algorithm as a single gene. An example of an individual with 6 genes is shown in Figure 4.
The goal of the algorithm is to minimize the Ff (fitness function). After preliminary analyses of the algorithm, the adjustment function for the issue under consideration was selected as follows:
where: RT-H — the maximum strength factor presents in the laminate calculated according to the Tsai-Hill hypothesis; Nw — the number of layers.
The adjustment function chosen in this way means that individuals with fewer layers will have a lower Ff value than those with a higher number of layers, and within a group with the same number of layers, those individuals with a lower value of RT−H will be “better”. To prevent an individual with fewer layers but with RT−H > 1 (suggesting destruction) will obtain a lower value of the adjustment function, a penalty function (penalty function) Fp was introduced [23,24]. Its application multiplies times 4 the Ff value of those individuals whose RT−H > 1.
The calculation of the adaptation function is followed by a check to see if convergence of the calculation has been achieved. In the presented algorithm, the invariability of the best solution (with the smallest value of Ff for six consecutive generations was chosen as the convergence criterion. The invariant nature of the solution is a criterion commonly described in the literature [23,24,25,26]. If convergence is achieved, the operation of the algorithm stops, if not, a replication procedure follows.
Individuals in the population are sorted according to the increasing value of the adjustment function and a certain part of them that has the highest Ff values is removed and new individuals are created in its place by means of reproduction and mutation. The selection of parents is done by the so-called roulette method. It involves constructing a virtual roulette wheel on which all other individuals are placed. What part of the circle a variant occupies is inversely proportional to the value of its adaptation function (the lower the value, the higher the probability of becoming a “parent”). Once the two “parents” are drawn, the replication procedure involving gene crossover begins. If the numbers of layers of the two “parents” are not equal, the offspring always inherits the smaller number of layers, and then the angles of fiber alignment are inherited alternately from both “parents.” A randomly selected (with a certain predetermined probability) portion of the progeny is then subjected to mutation, which can act in two ways: to remove two layers at a time from the laminate, or to change the angle of fiber alignment (at once in two corresponding layers). After the whole procedure, the evaluation of individuals is again carried out. In this paper, an algorithm was developed to optimize the structure (number and angle of layers) of a composite cylinder, in which the strength evaluation was based on the classical theory of laminates. Adjustment Ff and penalty Fp functions were selected, convergence criteria and selection, reproduction and mutation methods were established.
Global parameters of the developed genetic algorithm, such as the number of individuals in the population, the probability and size of mutations, or the number of surviving individuals in each generation, can also be subject to optimization. This is done to get the algorithm to converge at the lowest possible C computational cost and to improve the algorithm's ability to find global optima [24].
To select the best parameters for the algorithm, simulations were performed for the following their values:
- Mutation probability pmut∈{0,5;0,2;0,1};
- The portion of the population that passes to the next generation Nn∈{0,5;0,1;0,05};
- Population size P∈{20,100,1000};
- Maximum layer mutation angle αmax∈{5°;15°;30°}.
These values were chosen based on the literature analysis performed, as well as preliminary attempts by the authors to achieve convergence of the algorithm. This gives a total of 81 combinations of variables. For each combination, 50 simulations were performed to eliminate the influence of outlier results.
In the Figure 5 shows the simulation-derived average numbers of generations to convergence for each maximum mutation angle. Each graph shows results for three population sizes P, different percentages of best solutions passing to the next generation Nn, and different values of mutation probability pmut. However, not all simulations achieved satisfactory convergence. Some stopped at local optima, which was characterized by significantly higher values of the adaptation function compared to other simulations. These cases are eliminated in the charts below.
It can be noted that an increase in population size in almost every case translated into a decrease in the average number of generations in the simulation. This was due to the larger gene pool undergoing optimization in each successive generation. Reducing Nn also had a positive effect on the speed of reaching convergence in most cases. The smaller the number of “old” individuals in a generation, the greater the proportion of the population that can be filled with new, potentially better solutions.
Comparing the graphs among themselves, it can be observed that increasing the probability of mutation also leads to earlier convergence of the algorithm. A higher probability of mutation, means a greater diversity of individuals in the next generation, thus increasing the chances of finding a better solution. Increasing pmut can also lead to easier lowering of local optima and finding global optima.
Moreover, as the number increases, so does the computational cost and thus the time and resource consumption. Figure 6 shows the average computational cost of achieving convergence for different algorithm parameters. It can be seen that an increase in population size spikes the cost.
In the Figure 7, Figure 8 and Figure 9 shows the values of the lowest Ff achieved for each run. The red line shows the Ff value corresponding to the global minimum (Ff=8,62) The following graphs show that increasing the population size avoids the algorithm getting stuck in the local minimum. This is because a wider initial gene pool increases the probability of finding a solution close enough to the global minimum, and in later generations, the probability of a mutation allowing the global minimum to be approached is increased. For the same reason, increasing the probability of mutation also leads to the algorithm finding global optima more easily.
After analyzing the presented simulation results, the following algorithm parameters were selected:
- The probability of mutation pmut = 0.5;
- The portion of the population that passes to the next generation Nn = 0.1;
- Population size P = 100;
- The maximum mutation angle of the layer αmax = 15°.
At these parameter values, the genetic algorithm showed 100 percent convergence, with acceptable values for the computational cost.
3. Determination of the Structure of Composite Cylinders
The number of layers and fiber angles in each layer were determined using the genetic algorithm described earlier. The calculations used the orthotropic material model presented earlier, whose properties were determined experimentally and are summarized in Table 1.
Two solutions proposed by the algorithm that are among the top five presented in Table 2 and are structurally significantly different from each other were selected for implementation. Both had eight layers. In the first solution, the fiber arrangement is [90/90/±20]2 while in the second it is [±83/±84/±85/±83].
Using specialized equipment (winder MAW 20 LS4/1 manufactured by Mikrosam with software on-board), the designed composite cylinders 1 and 5 in Table 2 were made.
In the Table 3 shows the weights of the various cylinders and compares them with a reference steel cylinder with a wall thickness of 5 mm, made from commercially available pipe intended for hydraulic cylinder cylinders. As can be seen, the weight reduction with composite reinforcement is very large, ranging from 67.6% for a [±83/±84/±85/±83] cylinder with a steel liner to as much as 94.4% for a [90/90/±20/]2 cylinder.
4. Bench Testing of a Composite Cylinder of a Hydraulic Cylinder
To verify the validity of the composite cylinder design method using a genetic algorithm, a hydraulic test rig was designed and built. Figure 10 shows a hydraulic diagram of the actuator test stand. The stand allows cyclic extension and retraction of the tested actuator at preset speeds and under a preset load. The change in the direction of movement of the actuator is forced by overdriving the distributor (4), while the speed of movement can be set independently for both directions using flow regulators (5) and (6). The load is realized by a load actuator (15) connected to a maximum valve (18), which allows the load pressure to be maintained regardless of the flow rate (speed of actuator movement). The system allows recording the values of pressures in the chambers of the test actuator, flow rates, piston rod position and loading force.
On the presented bench, tests were performed by loading the actuator in the structure of which the composite cylinder was designed and manufactured, with a pressure of 200 bar. The measurements consisted of the pressure inside the cylinder and the deformation of the cylinder.
4.1. Composite Cylinder Strain Measurements [±83/±84/±85/±83] Without Liner
In the Figure 11 shows an actuator with a composite cylinder [±83/±84/±85/±83] mounted on a test stand. Strain gauges were taped in the middle of the cylinder's length, allowing measurement of the cylinder's circumferential and axial deformations.
In the Figure 12 shows a graph of the cylinder's deformation when it is loaded with internal pressure up to 200 bar. Deformations recorded experimentally, as well as values obtained computationally using classical laminate theory, are presented. The calculations were carried out in the Wolfram Mathematica package. Figure 13 and Figure 14 show the stresses in the cylinder layers and the values of the R-factor, respectively. The strength factor R is defined as:
The strength factor defined in this way can be applied to any strain hypothesis. If R > 1 then the layer remains undamaged, and the load can be increased by a factor R. If, on the other hand, R < 1 then the layer will be damaged, in which case the load must be reduced by a factor R. In the case of the method of loading adopted during the tests, the maximum value of the R factor is about 0.2, which may indicate some oversizing of the structure and the existence of further room for optimization.
In a Table 4 summarizes the results of the strain measurements and compares them with theoretical values. There are some discrepancies between theoretical and actual values, usually the greater the smaller the absolute value of the measured quantity. The calculations carried out show agreement with experimental results as to the value and nature of changes in the determined parameters.
4.2. Deformation Measurements of Composite Cylinder [90/90/±20/]2 Without Liner
In the Figure 15 shows the deformation of the cylinder when loaded with internal pressure up to 200 bar. The deformations measured experimentally and those determined computationally were compared on it. Figure 16 and Figure 17 show, respectively, the values of stress in the composite layers and the value of the strength coefficient R. As can be seen, the value of the R coefficient during a pressure load of 200 bar reaches a value of almost 0.8 in the layers ±20°, which may indicate that the strength of the component is well utilized.
The results of measurements and calculations are summarized in Table 5. As can be seen, the agreement between experimental and theoretical results for three of the four cases is very good. The large difference (31.2%) occurred only for circumferential deformation when the cylinder's internal pressure was loaded to a value of 200 bar. The reason may be the low stiffness of the bonded connection between the sensor and the cylinder surface as the experimental values were smaller than the theoretical ones.
5. Discussion
Using the experience gained in the course of the work, a method for designing a composite cylinder of a hydraulic cylinder was proposed. The method consists of seven steps and is shown schematically in Figure 18.
In the first stage, it is necessary to make preliminary assumptions about the designed cylinder. Among these assumptions are: diameter, stroke and type of actuator (with or without screws), operating pressure and maximum allowable pressure, type of medium, operating temperature, cost. In stage two, the criteria for evaluating the solution are adopted. In this case, they mainly refer to the correspondence of the results of strength tests of prototypes with the results of theoretical analyses. In the third stage, the selection of cylinder material is carried out. Since we are considering a cylinder made of composite material, it is necessary to make decisions on both the type of fiber and matrix (resin). Depending on the initial assumptions made, such as the cost of the solution or the temperature and operating environment, the designer has a choice of a range of fiber types (from glass to basalt to carbon and aramid) and resins (polyester, vinylester, epoxy and others). Once the material has been selected, it is necessary to determine the structure of the cylinder (number of layers and fiber angles). In stage six, it is proposed to make prototype cylinders. Prototypes are made by available methods (in the case of cylindrical parts, this is usually the wet-winding or prepreg method) from pre-selected materials according to designated specifications. The sixth stage is bench testing of the completed prototypes. In this step, measurements are taken of the deformation of prototypes when they are loaded according to previously identified loading patterns. After bench testing comes the time to evaluate the solution. The results of strain measurements are compared with those obtained by computational methods. Their discrepancies may be due to factors such as incorrect inputs to the theoretical model (material data or load pattern), technological errors in prototyping, and mistakes made in the installation of strain sensors. If these discrepancies are large, it is necessary to return to the previous steps of the method and correct them.
6. Conclusions
This paper presents a method for designing a composite hydraulic cylinder using genetic algorithms. A genetic algorithm was developed using classical laminate theory and Tsai-Hill's strength hypothesis to optimize the material structure of a composite cylinder by minimizing the number of layers while maintaining the required strength of the component. Optimization can be carried out taking into account multiple load patterns. A meta-optimization of the algorithm was carried out to determine its global parameters such as mutation probability, population size, maximum mutation angle of the layer. Using the determined material properties, two cylinders reinforcement structures were selected. Cylinder prototypes were then fabricated and subjected to bench tests to measure deformation. The results of the strain measurements were compared with those calculated theoretically. Finally, using the accumulated experience, an eight-step method for designing a composite hydraulic cylinder was proposed.
From the deformation measurements, it can be seen that in most cases the results obtained experimentally coincided with those calculated theoretically using classical laminate theory as to the values and nature of the changes. After pressure loading, the differences were 10.3% for εx and 18.4% for εθ. It can be noted that in both cases the actual deformations were smaller than the theoretical ones, which may indicate, for example, a higher proportion of reinforcing fibers in the cylinder material than in the flat specimens used to determine material properties.
For the [90/90/±20/]2 cylinder, the differences in axial strain at both steps were slightly more than 1%, while for circumferential strain εθ when the cylinder was loaded with internal pressure, the differences were 31.2%. This is a sizable difference, but the experimentally obtained values were smaller than the theoretical ones, which means that the designed composite cylinder structure is less stressed than the numerical calculations suggest and can be safely operated in the pressure range up to 200 bar.
In addition, based on theoretical and experimental considerations, it can be concluded that:
- The use of composite material in the construction of the hydraulic cylinder with pins makes it possible to reduce the weight of the cylinder by 94.4% compared to a steel cylinder;
- The speed of reaching convergence and the computational cost of the genetic algorithm created to optimize the structure of a composite cylinder depend on its global parameters. Increasing the probability of mutation and population size leads to faster convergence. Increasing the size and percentage of the population surviving to the next generation, however, leads to an increase in computational cost.
Author Contributions
Conceptualization, M.S. and M.L.; methodology, M.S., M.L.; software, M.S., M.K.; validation, M.S., M.L.; formal analysis, M.S. and M.K.; investigation, M.S. and M.L.; resources, M.S., M.K.; data curation, M.S., M.L.; writing—original draft preparation, M.S., M.L., and M.K.; writing—review and editing, M.S., M.L.; visualization, M.S. and M.L.; supervision, M.S.; project administration, M.S., M.K.; funding acquisition, M.S. All authors have read and agreed to the published version of the manuscript.
Funding
This research received no external funding.
Data Availability Statement
All data included in this research are available upon request from the corresponding author.
Conflicts of Interest
The authors declare no conflict of interest.
References
- Bajpai, P.; Singh, I. Reinforced Polymer Composites: Processing, Characterization and Post Life Cycle Assessment. John Wiley & Sons. 2019, 288 p., ISBN 978-3-527-34599-1.
- Hwu, C. Mechanics of Laminated Composite Structures. CRC Press. 2024, 414 p., ISBN 9781032746944.
- Toray Composite Material America Inc. Torayca® carbon fiber selector guide. Toray Composite Materials America, 2021, 6 p. https://www.toraycma.com/wp-content/uploads/Carbon-Fiber-Selector-Guide.pdf.
- Teijin Carbon Fiber Business. Tenax™ Filament Yarn property. Web page of Teijin Carbon Fiber Business, 2021. https://www.teijincarbon.com/products/filament-yarn.
- Sachdeva, A.; Singh, P.; Rhee, H. Composite Materials. CRC Press, 2024, 278 p., ISBN 9780367531379.
- Altenbach, H.; Altenbach, J.; Kissing, W. Mechanics of Composite Structural Elements. Springer Nature Singapore, 2018, 503 p. [CrossRef]
- Błażejewski, W.; Barcikowski, M.; Stosiak, M.; Warycha, J.; Stabla, P.; Smolnicki, M.; Bury, P.; Towarnicki, K.; Lubecki, M.; Paczkowska, K. A novel design of a low-pressure composite vessel with inspection opening – design, manufacturing and testing. Alexandria Engineering Journal 2024, 91, 442–456. [Google Scholar] [CrossRef]
- HYDAC. Hydraulic accumulators. Web page of HYDAC company, 2025. https://www.hydac.com/de-en/products/hydraulic-accumulators/special-accumulators.html.
- Steelhead Composites. Combined Propellant/Pressurant Vessel (CPPV) Concept [Online]. Available: https://steelheadcomposites.com/news/combined-propellantpressurant-vessel-cppv-concept.
- Mantovani, S.; Costi, D.; Strozzi, A.; Bertocchi, E.; Dolcini, E. Double Acting Composite Tube Cylinder for Fluid Power Applications: A Design Procedure. In Proceedings of the International Conference on Mechanical, Automotive and Aerospace Engineering, Kuala Lumpur, Malaysia, 17–19 May 2011. [Google Scholar]
- Mantovani, S. Feasibility Analysis of a Double-Acting Composite Cylinder in High-Pressure Loading Conditions for Fluid Power Applications. Appl. Sci. 2020, 10, 826. [Google Scholar] [CrossRef]
- Upendra, N.; Moulali, P.; Reddy, K.V. Static and Modal Analysis of Laminated Composite Hydraulic Cylinder. International Journal of Engineering Research 2014, 3, 140–143. [Google Scholar]
- Nowak, T.; Schmidt, J. Non-linear Mechanical Analysis of the Composite Overwrapped Cylinder for Hydraulic Applications. Adv. Manuf. Sci. Technol. 2014, 37, 31–48. [Google Scholar] [CrossRef]
- Nowak, T.; Schmidt, J. Prediction of Elasto-Plastic Behavior of Pressurized Composite Reinforced Metal Tube by Means of Acoustic Emission Measurements and Theoretical Investigation. Compos. Struct. 2014, 118, 49–56. [Google Scholar] [CrossRef]
- Nowak, T.; Schmidt, J. Theoretical, Numerical and Experimental Analysis of Thick Walled Fiber Metal Laminate Tube under Axisymmetric Loads. Compos. Struct. 2015, 131, 637–644. [Google Scholar] [CrossRef]
- Scholz, S.; Kroll, L. Nanocomposite Glide Surfaces for FRP Hydraulic Cylinders – Evaluation and Test. Compos. Part B Eng. 2014, 61, 207–213. [Google Scholar] [CrossRef]
- Solazzi, L.; Buffoli, A. Telescopic Hydraulic Cylinder Made of Composite Material. Appl. Compos. Mater. 2019, 26, 1189–1206. [Google Scholar] [CrossRef]
- Solazzi, L. Feasibility Study of Hydraulic Cylinder Subject to High Pressure Made of Aluminum Alloy and Composite Material. Compos. Struct. 2019, 209, 739–746. [Google Scholar] [CrossRef]
- Solazzi, L. Design and Experimental Tests on Hydraulic Actuator Made of Composite Material. Compos. Struct. 2020, 232, 111544. [Google Scholar] [CrossRef]
- Solazzi, L. Stress Variability in Multilayer Composite Hydraulic Cylinder. Compos. Struct. 2021, 259, 113249. [Google Scholar] [CrossRef]
- Solazzi, L.; Buffoli, A. Fatigue Design of Hydraulic Cylinder Made of Composite Material. Compos. Struct. 2021, 277, 114647. [Google Scholar] [CrossRef]
- Solazzi, L.; Buffoli, A.; Formicola, R. The Multi-Parametric Weight Optimization of a Hydraulic Actuator. Actuators 2020, 9, 60. [Google Scholar] [CrossRef]
- Ventura, S.; Luna, J.; Moyano, J. Genetic Algorithms. IntechOpen, 2022, 174 p. ISBN 9781803551777.
- Kramer, O. Genetic Algorithm Essentials. Cham: Springer International Publishing. [CrossRef]
- Wei, R.; Pan, G.; Jiang, J.; Shen, K.; Lyu, D. An Efficient Approach for Stacking Sequence Optimization of Symmetrical Laminated Composite Cylindrical Shells based on a Genetic Algorithm. Thin-Walled Struct. 2019, 142, 160–170. [Google Scholar] [CrossRef]
- Almeida, F.; Awruch, A. Design Optimization of Composite Laminated Structures using Genetic Algorithms and Finite Element Analysis. Compos. Struct. 2009, 88, 443–454. [Google Scholar] [CrossRef]
- Soremekun, G.; Gürdal, Z.; Haftka, R.; Watson, L. Composite Laminate Design Optimization by Genetic Algorithm with Generalized Elitist Selection. Comput. Struct. 2001, 79, 131–143. [Google Scholar] [CrossRef]
Figure 1.
Diagram showing the Young's modulus and strengths of the different types of Torayca carbon fibers offered by TORAY (Authors elaboration based on [3]).
Figure 1.
Diagram showing the Young's modulus and strengths of the different types of Torayca carbon fibers offered by TORAY (Authors elaboration based on [3]).
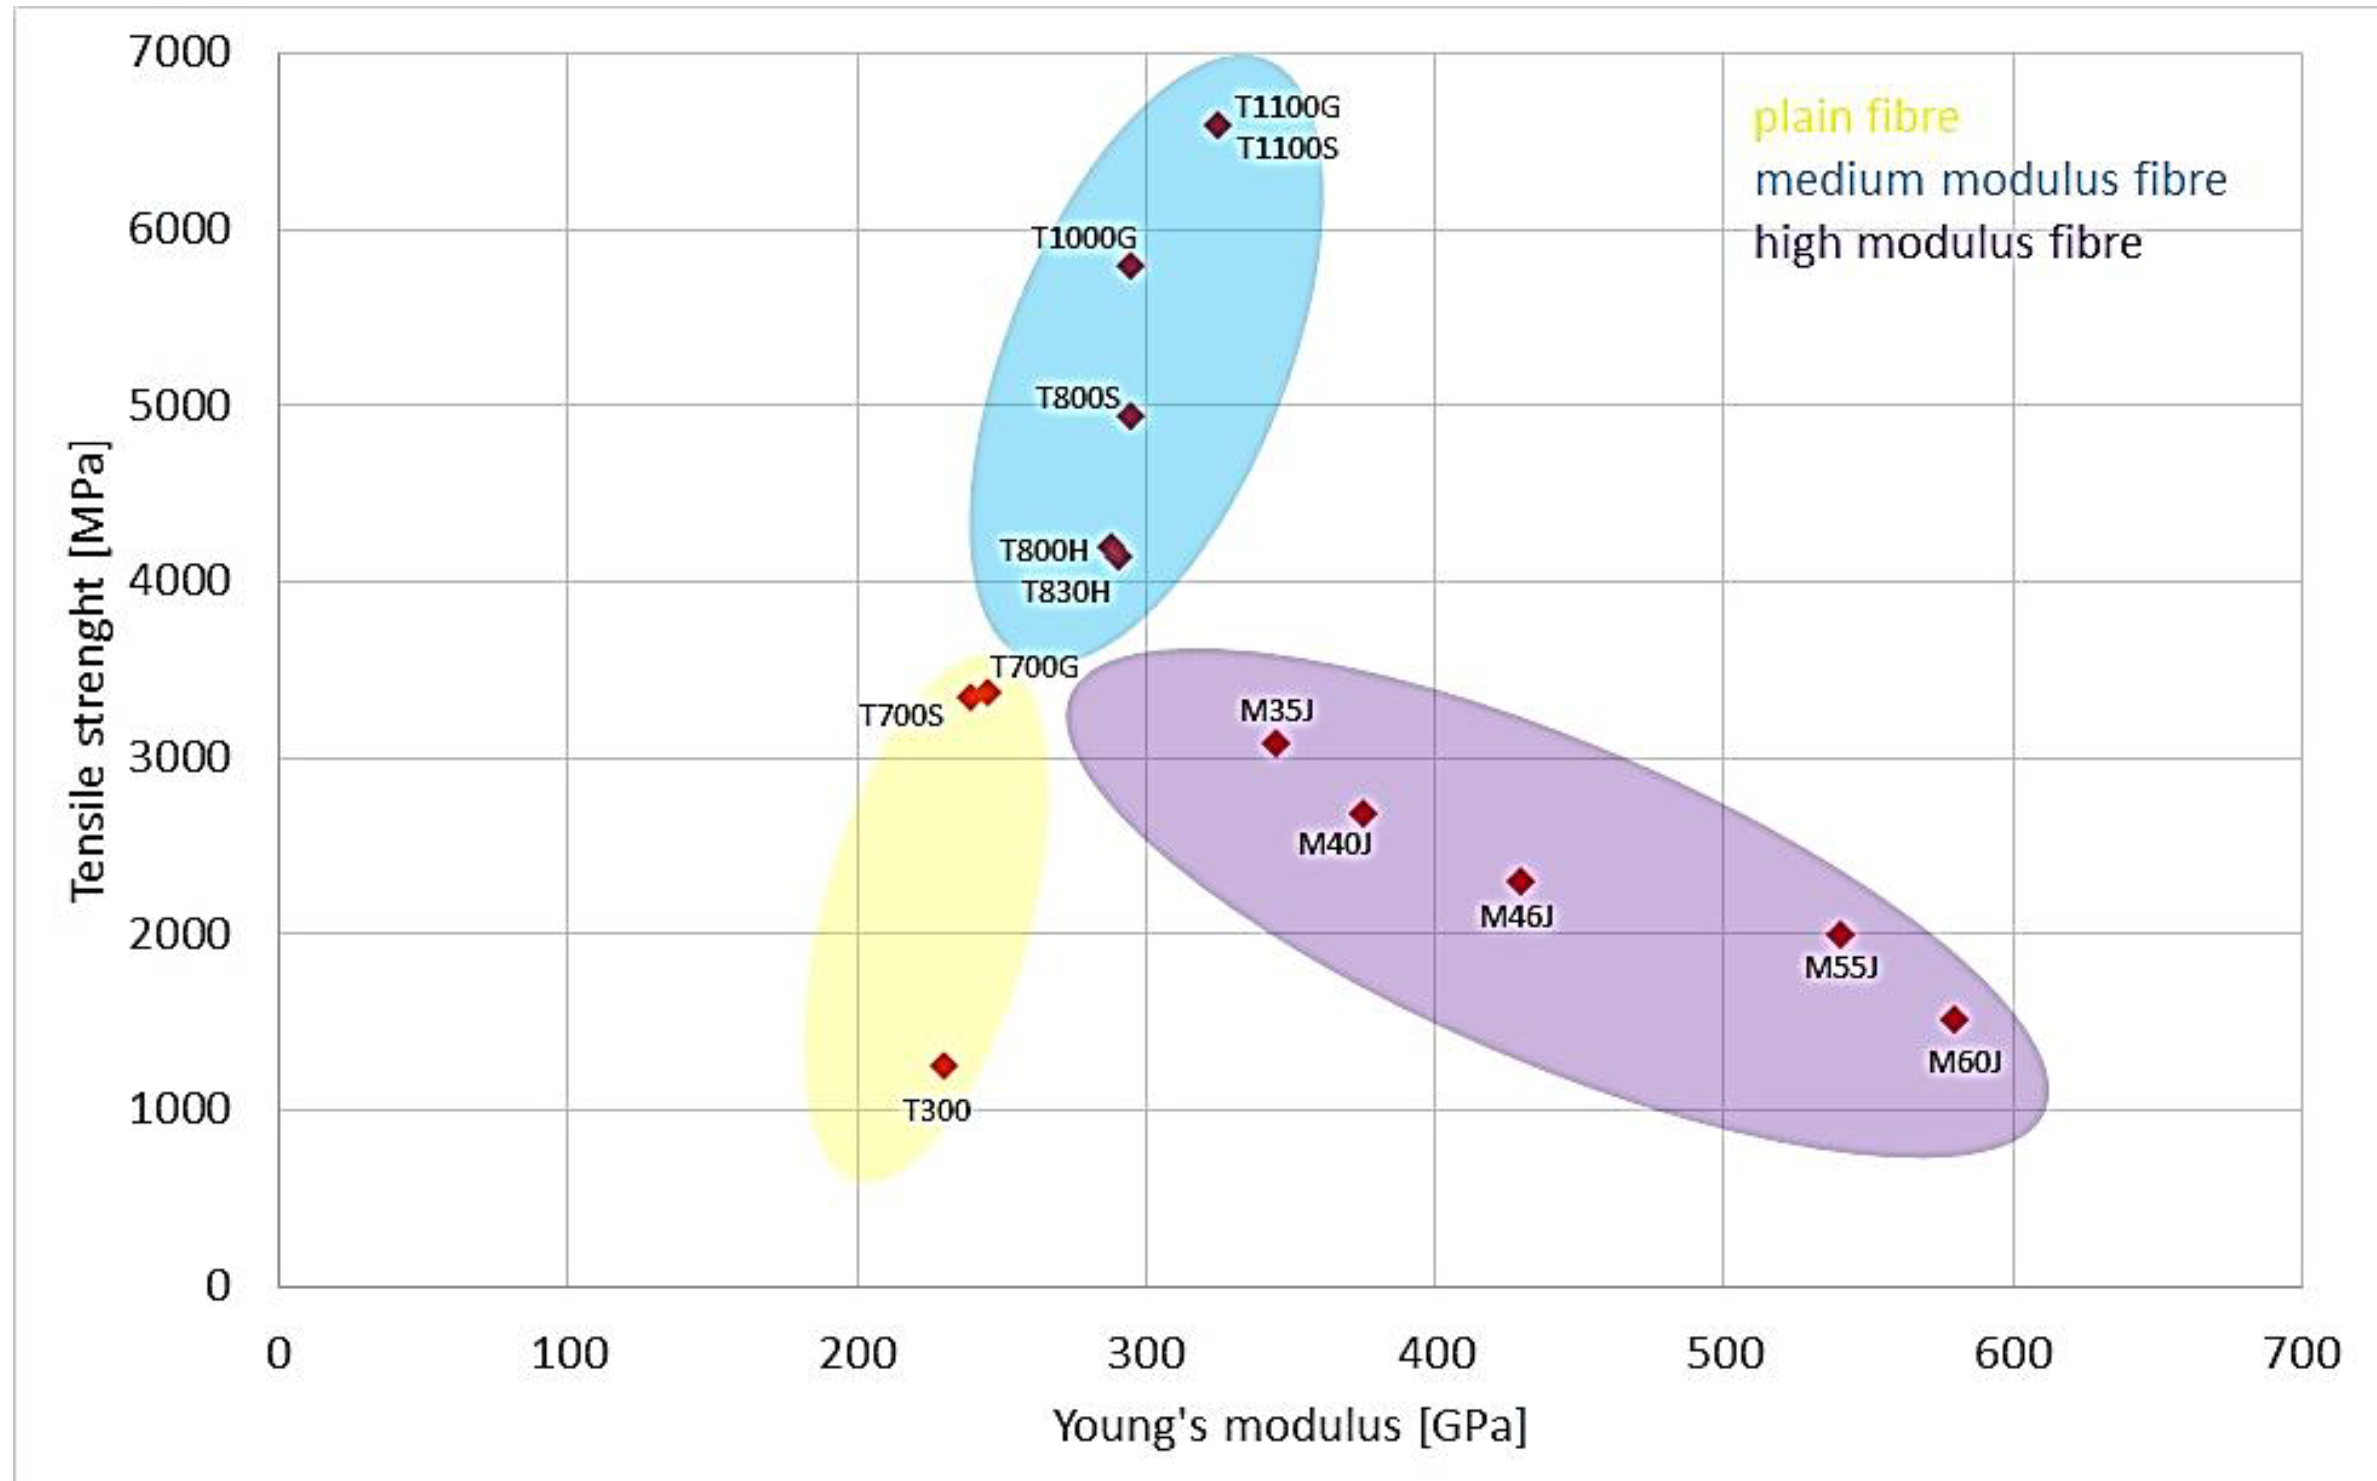
Figure 2.
Diagram showing the Young's moduli and strengths of the different types of TENAX carbon fiber offered by Taijin (Authors elaboration based on [4]).
Figure 2.
Diagram showing the Young's moduli and strengths of the different types of TENAX carbon fiber offered by Taijin (Authors elaboration based on [4]).
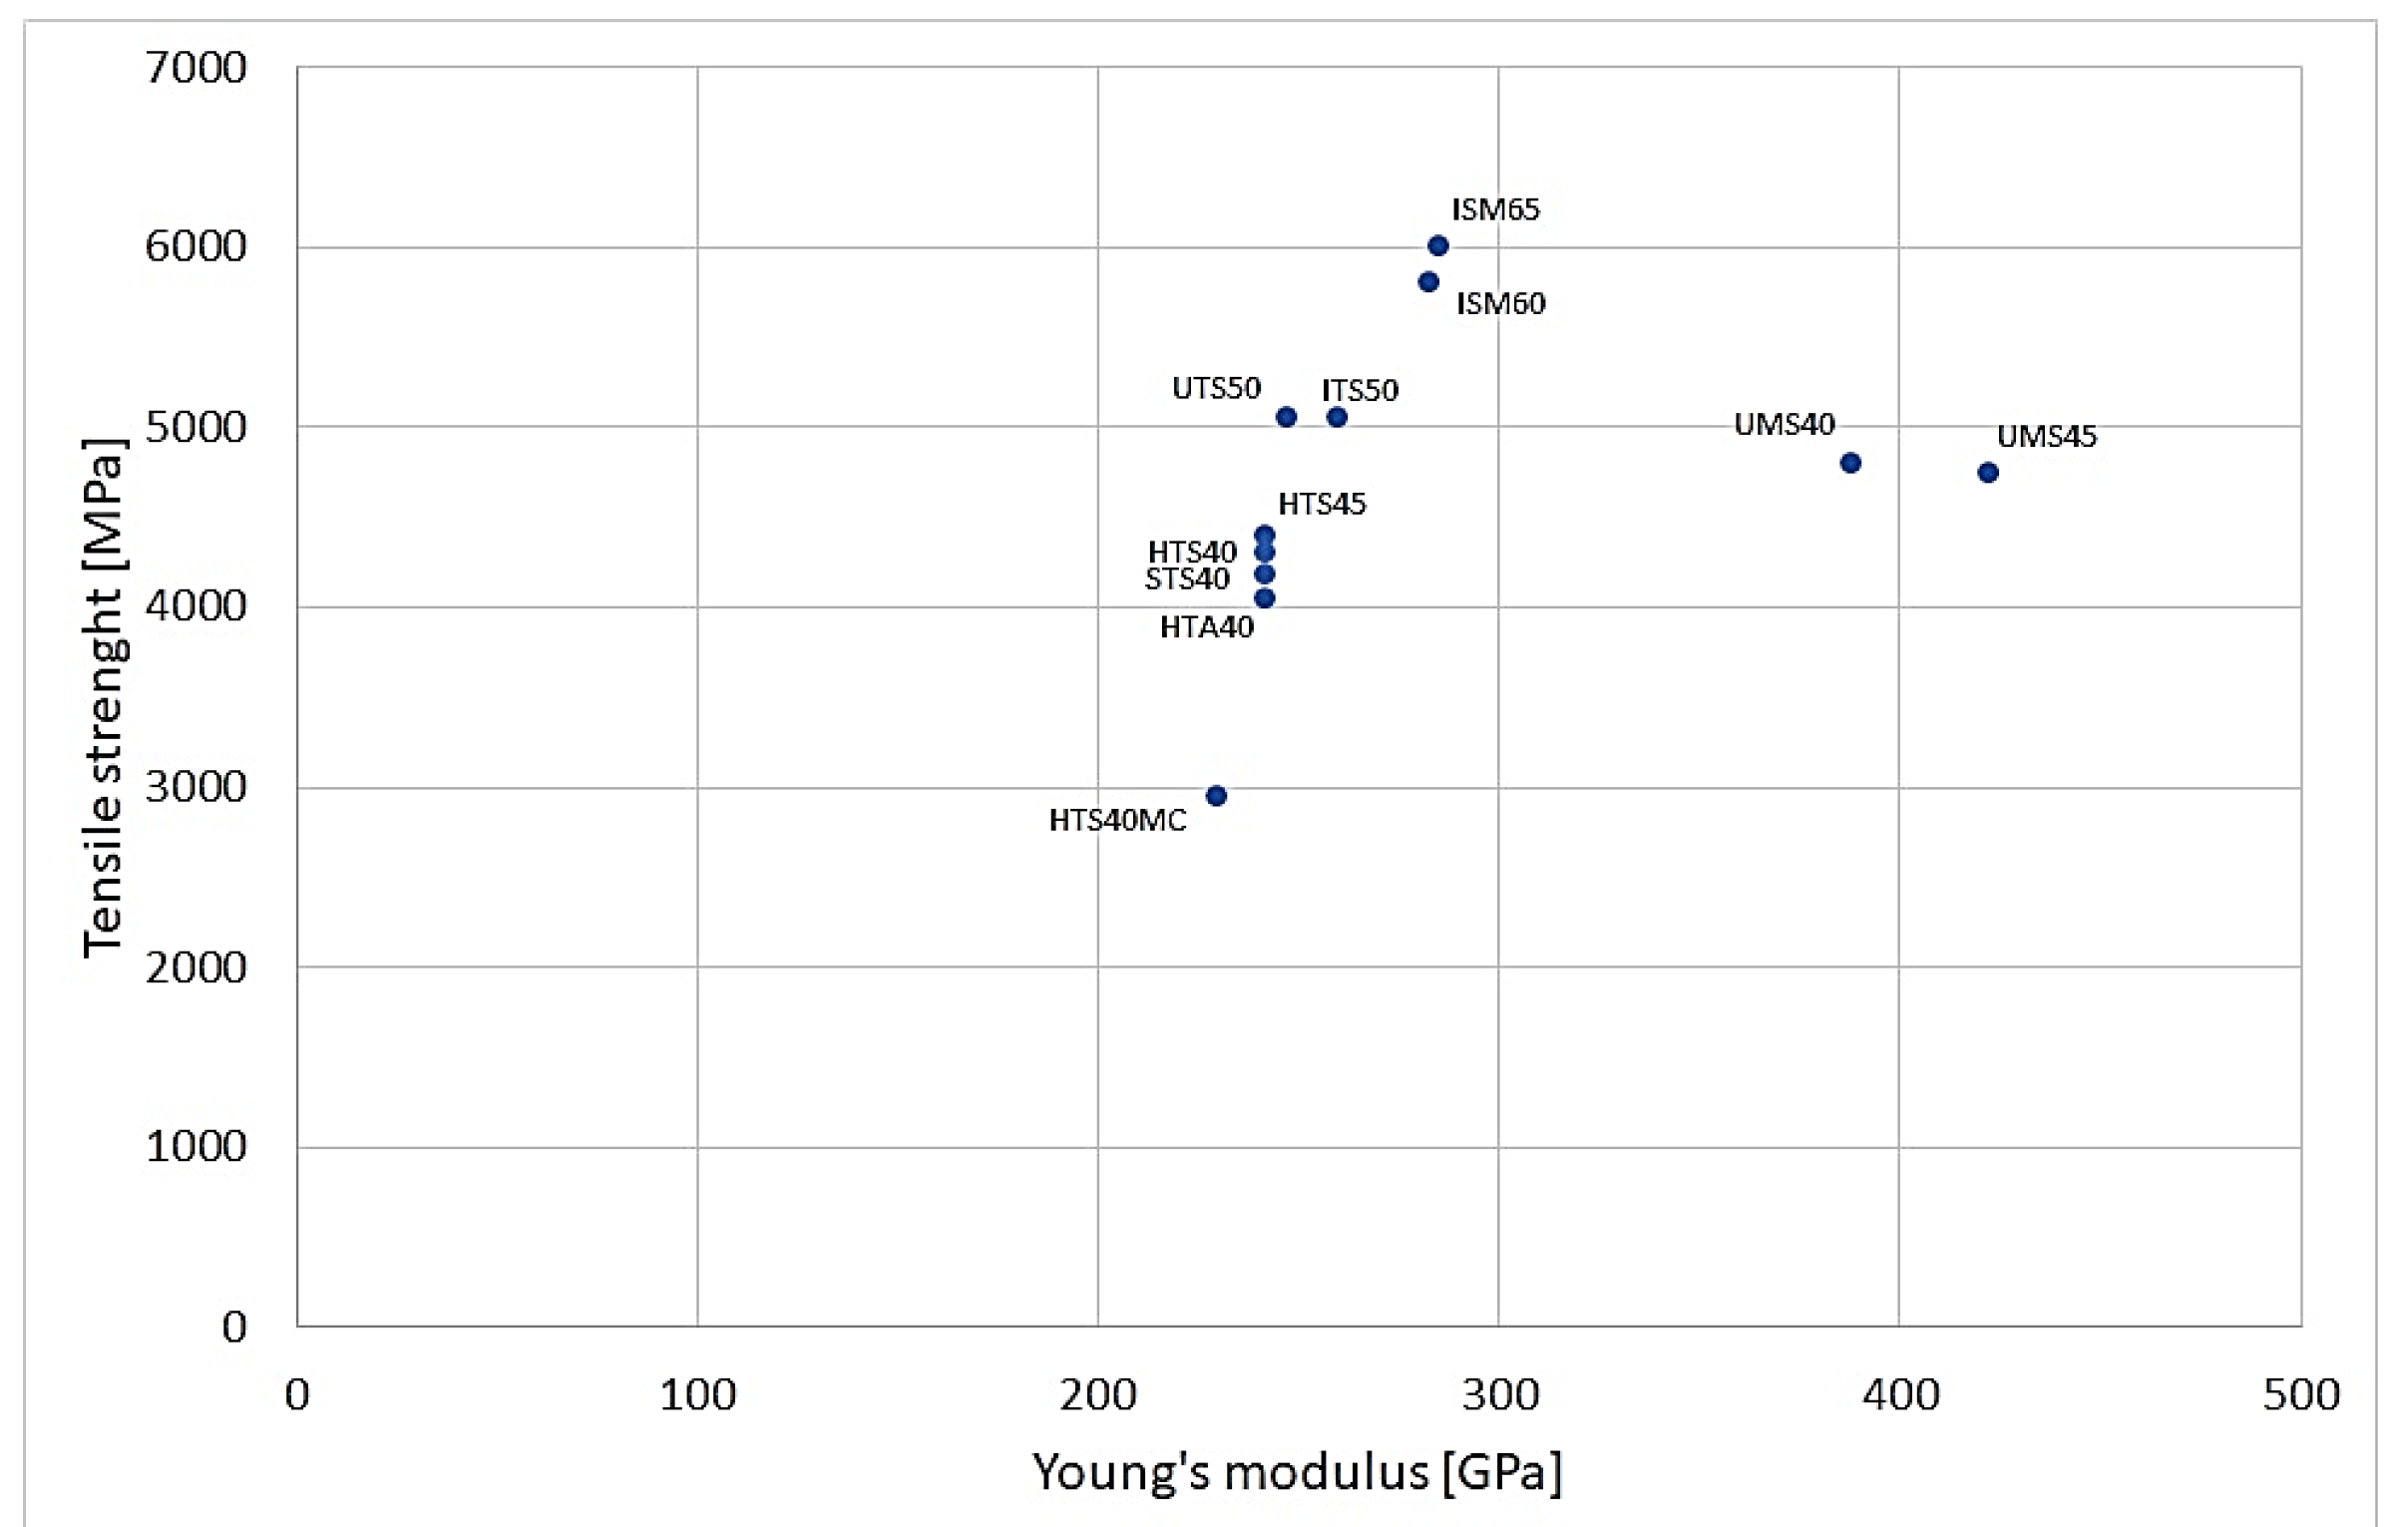
Figure 3.
Block diagram of the genetic algorithm.
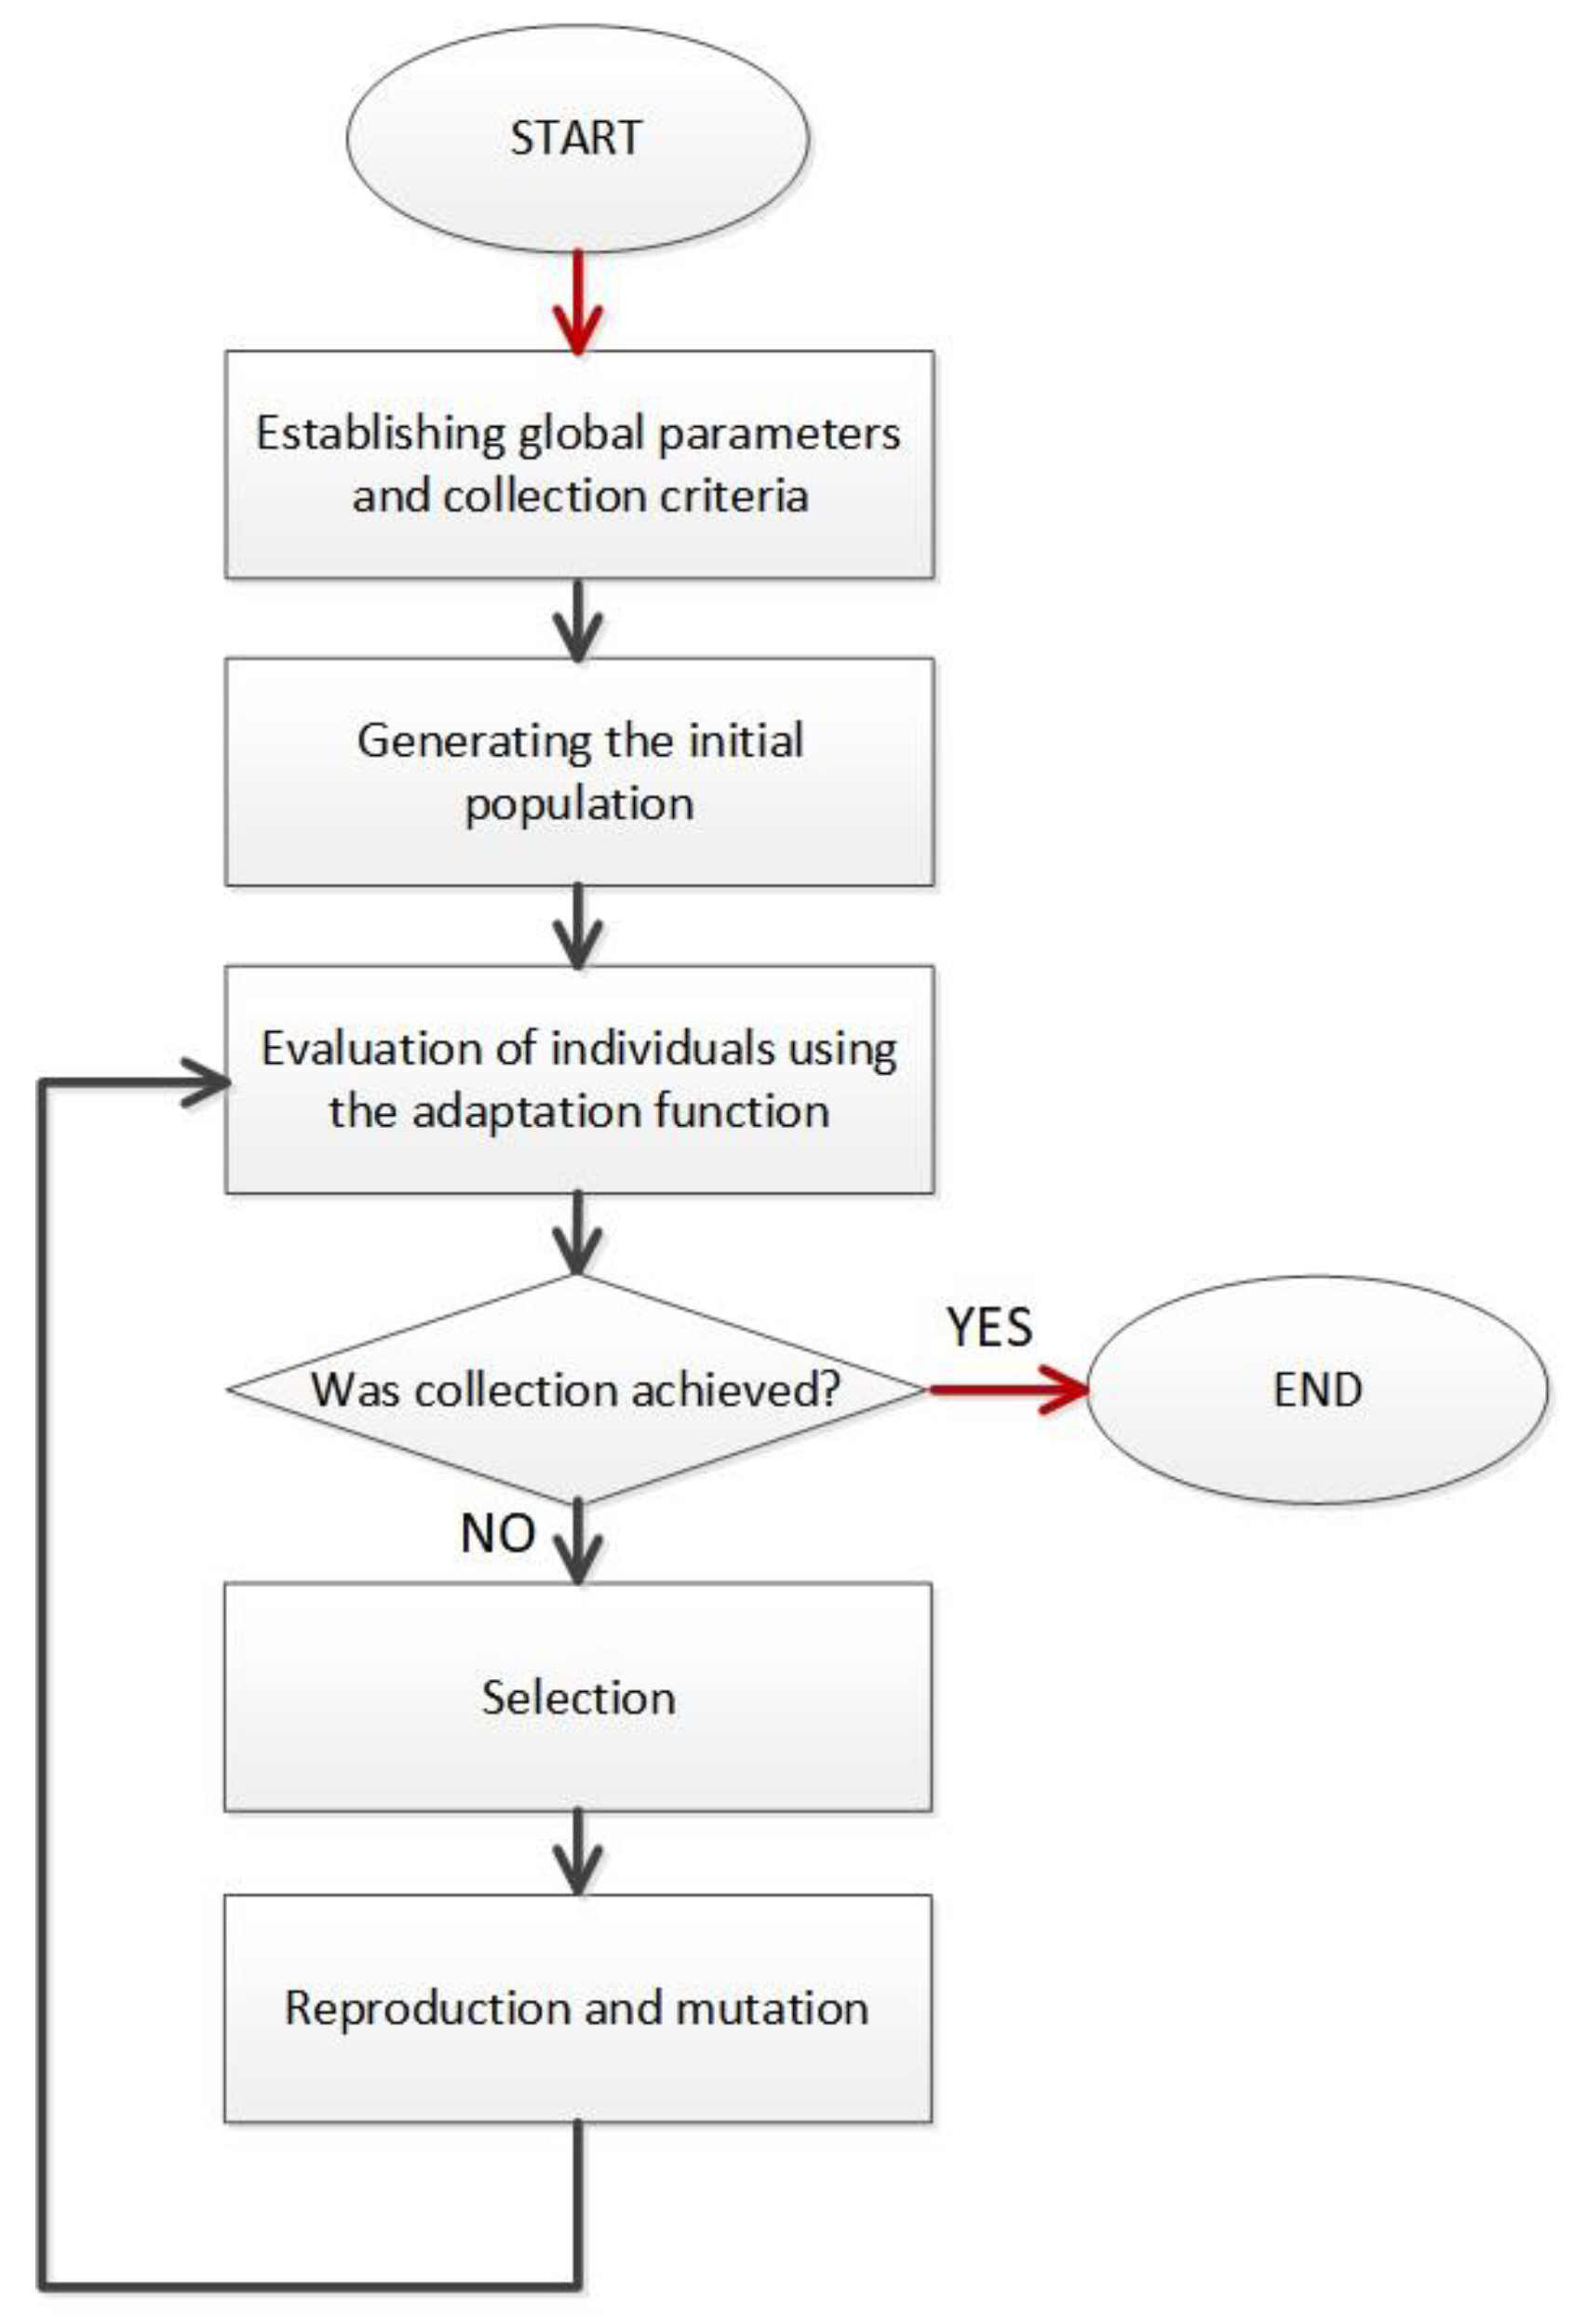
Figure 4.
Example of an individual representing the layering of a winding element.

Figure 5.
Number of generations to convergence for: (a) αmax = 5°; (b) αmax = 15°; (c) αmax = 30°.
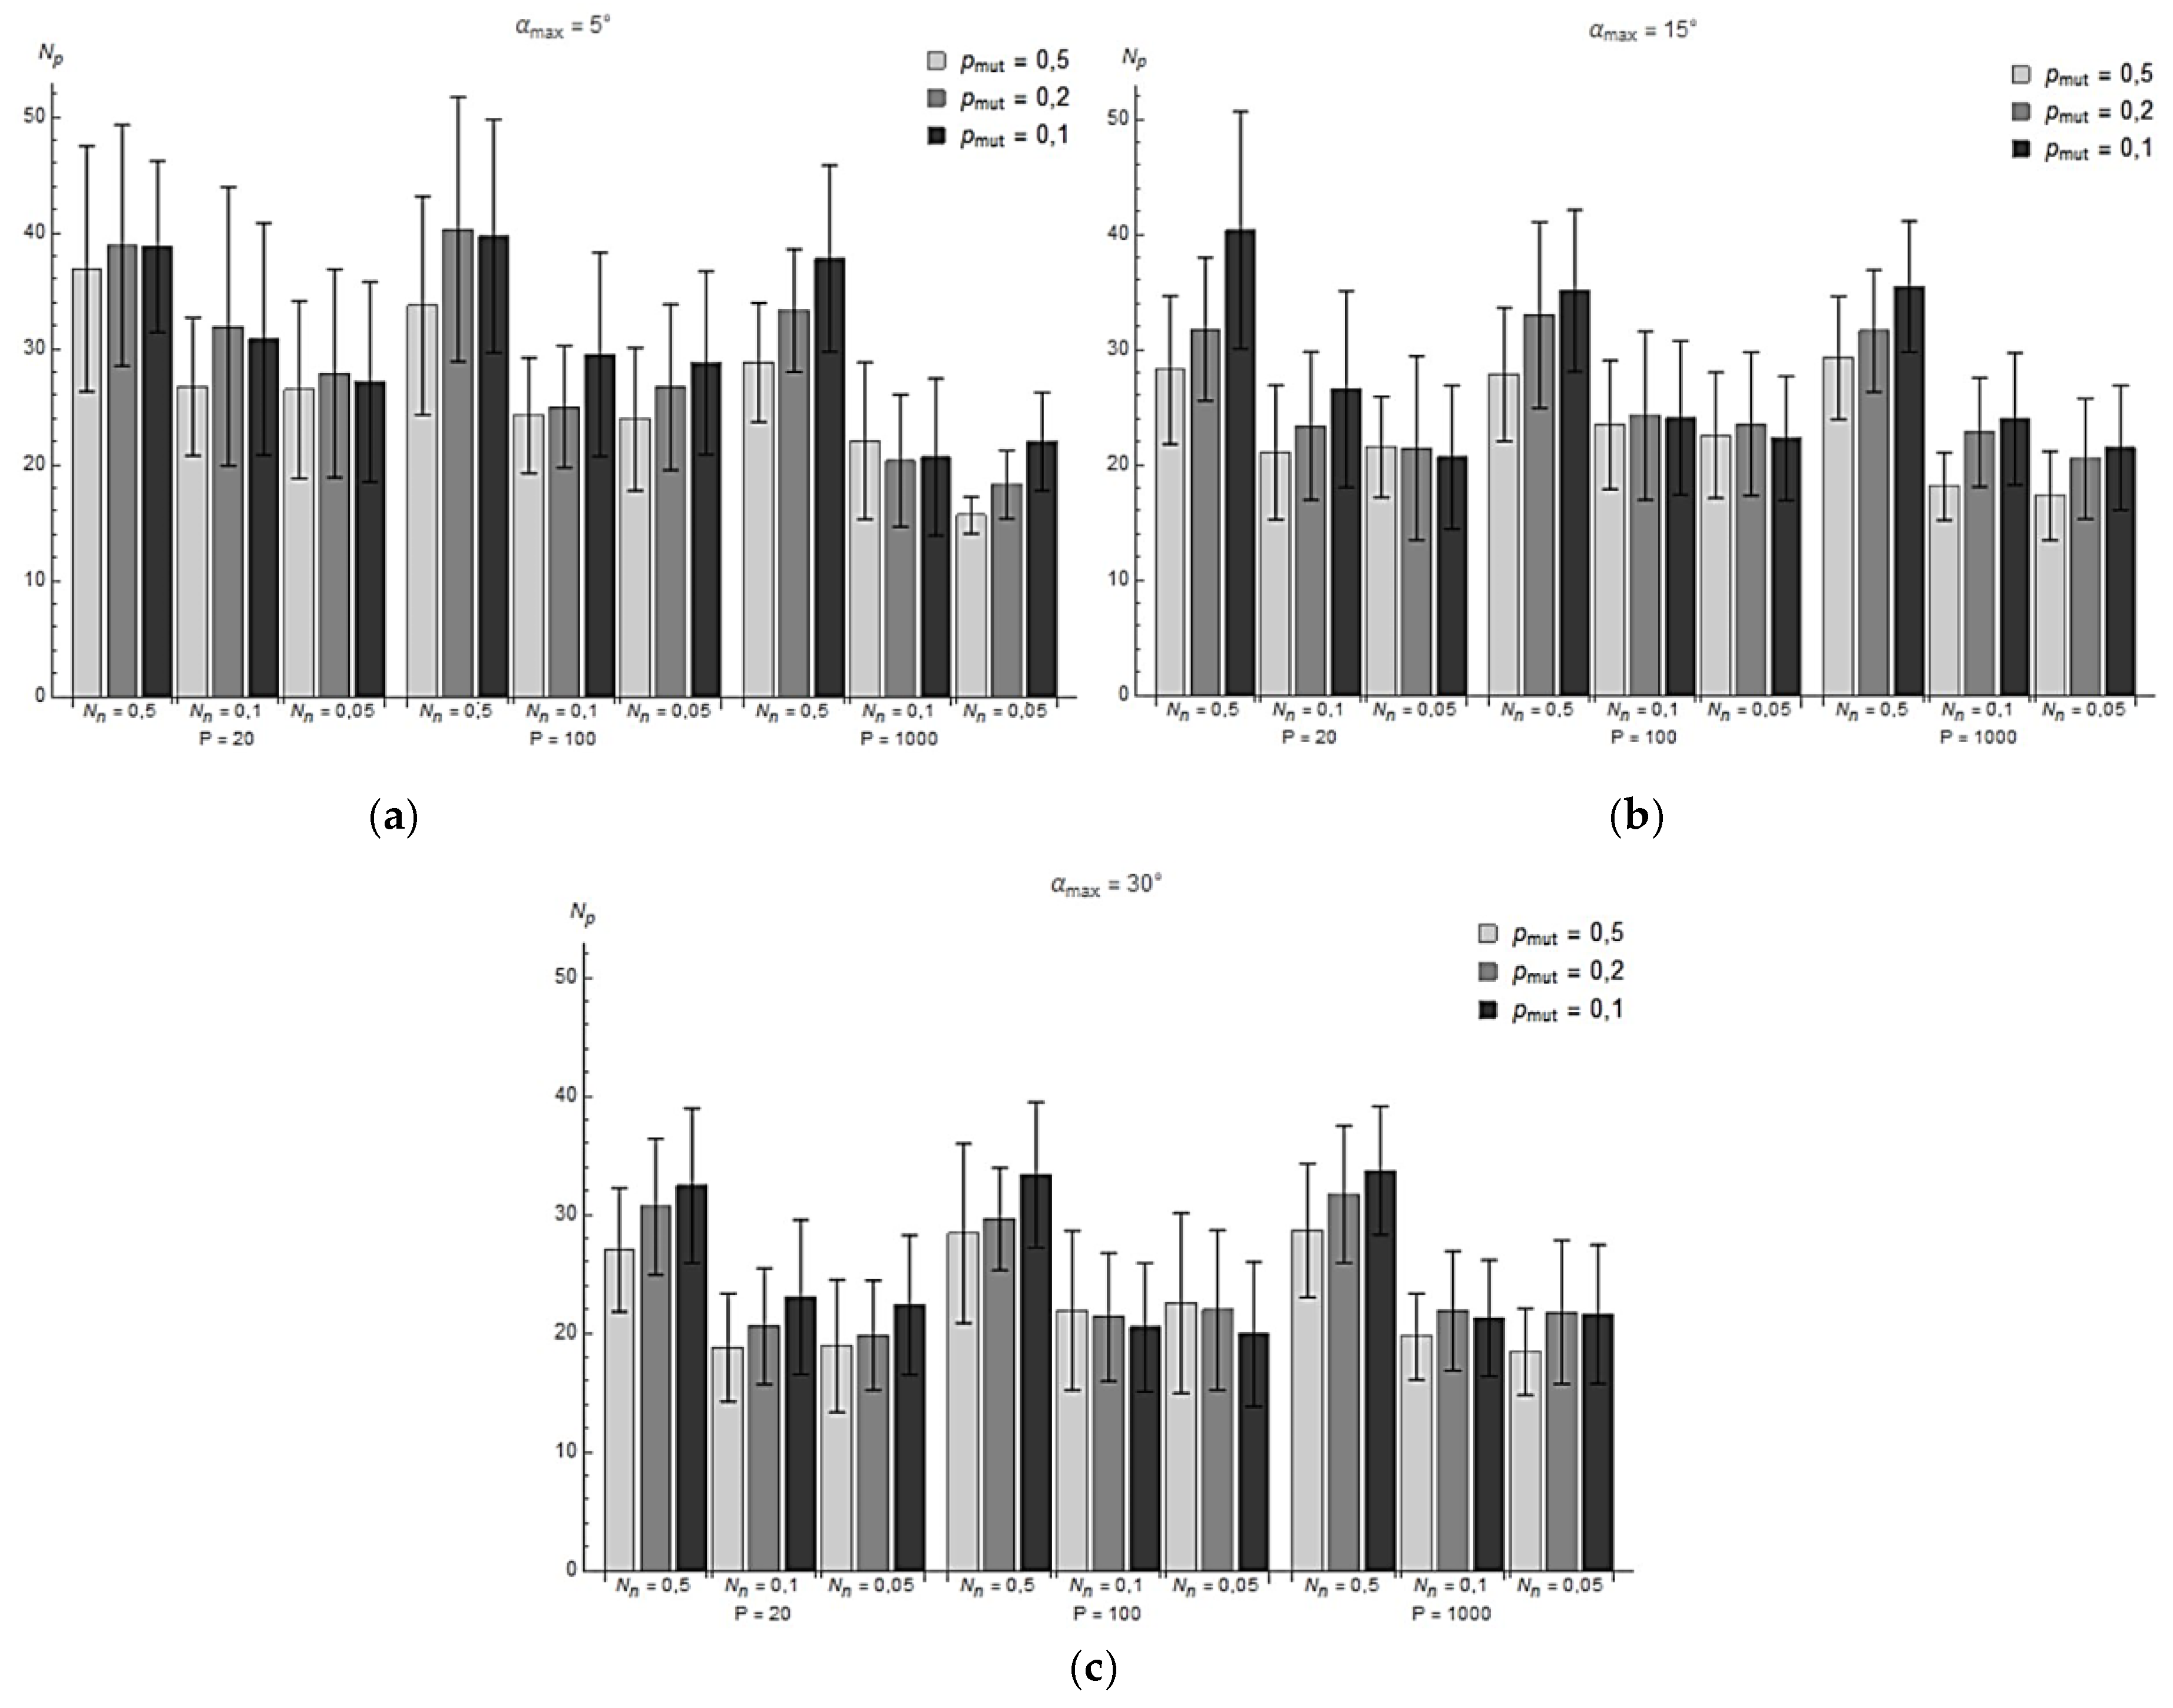
Figure 6.
Average design cost for different values of P, Nn and pmut, at: (a) αmax = 5°; (b) αmax = 15°; (c) αmax = 30°.
Figure 6.
Average design cost for different values of P, Nn and pmut, at: (a) αmax = 5°; (b) αmax = 15°; (c) αmax = 30°.
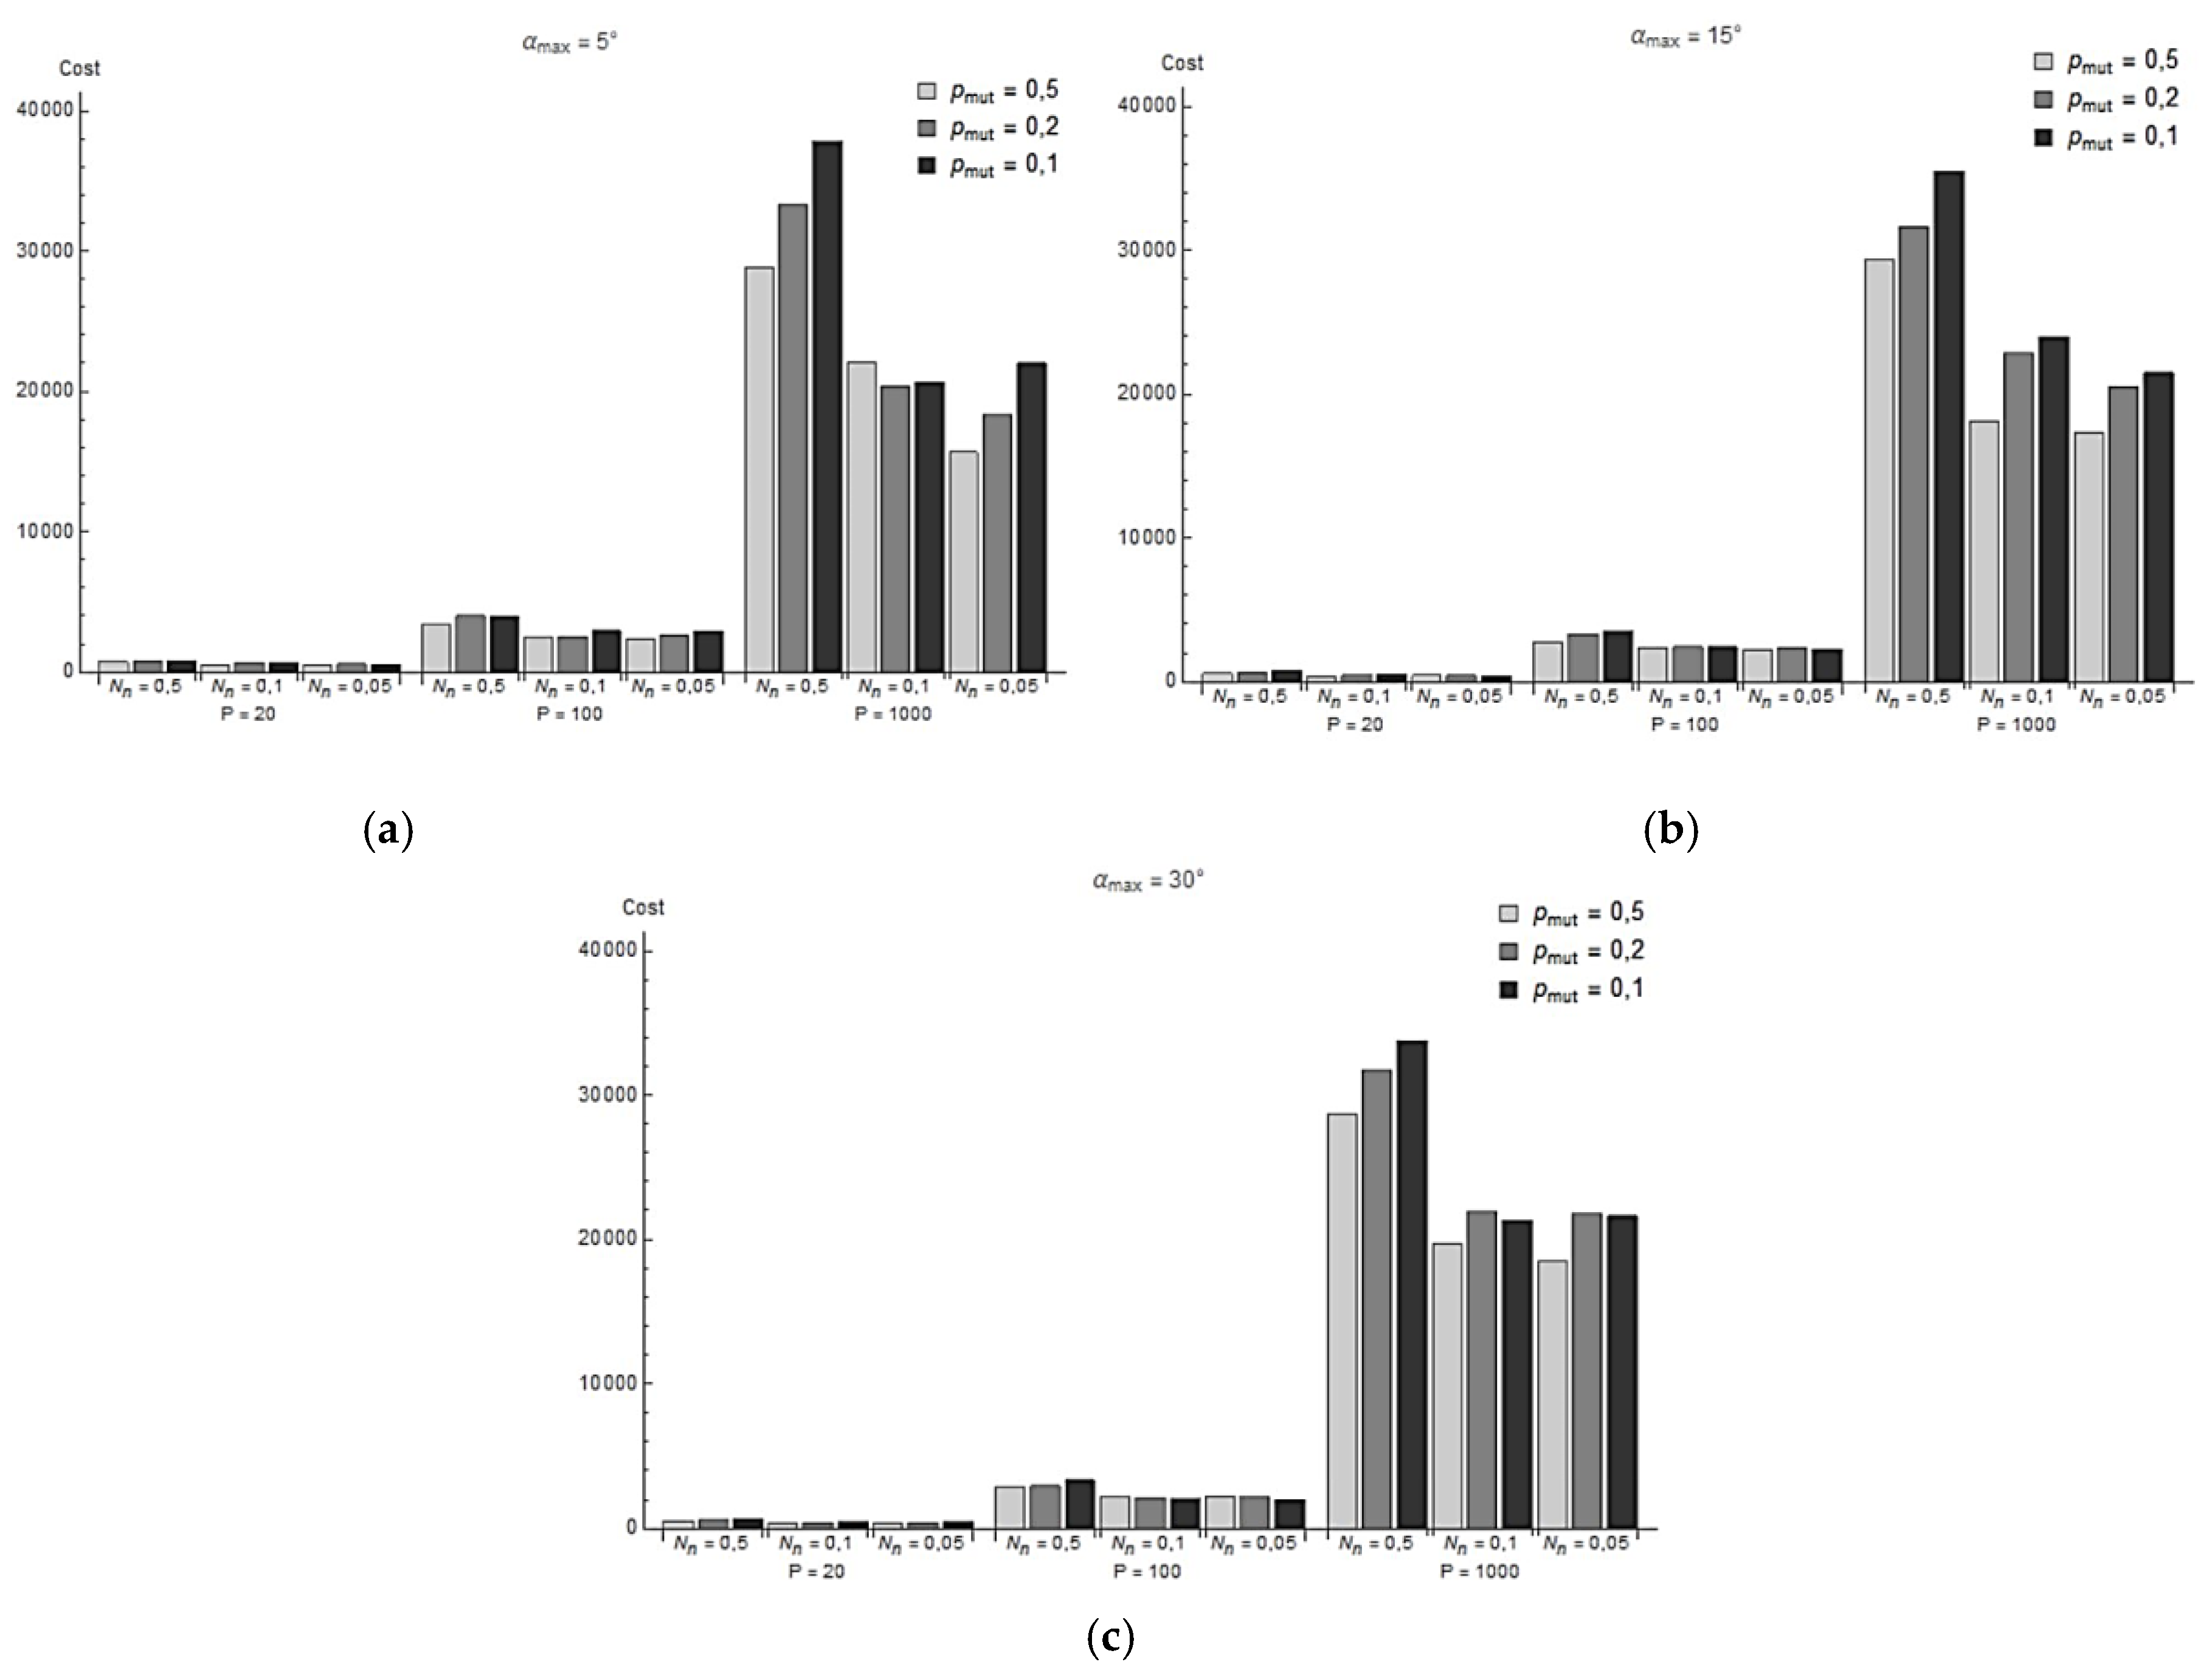
Figure 7.
Value of adaptation function reached at the end of each iteration for: (a) pmut = 0.1 and αmax = 5°; (b) pmut = 0.2 and αmax = 5°; (c) pmut = 0.5 and αmax = 5°.
Figure 7.
Value of adaptation function reached at the end of each iteration for: (a) pmut = 0.1 and αmax = 5°; (b) pmut = 0.2 and αmax = 5°; (c) pmut = 0.5 and αmax = 5°.
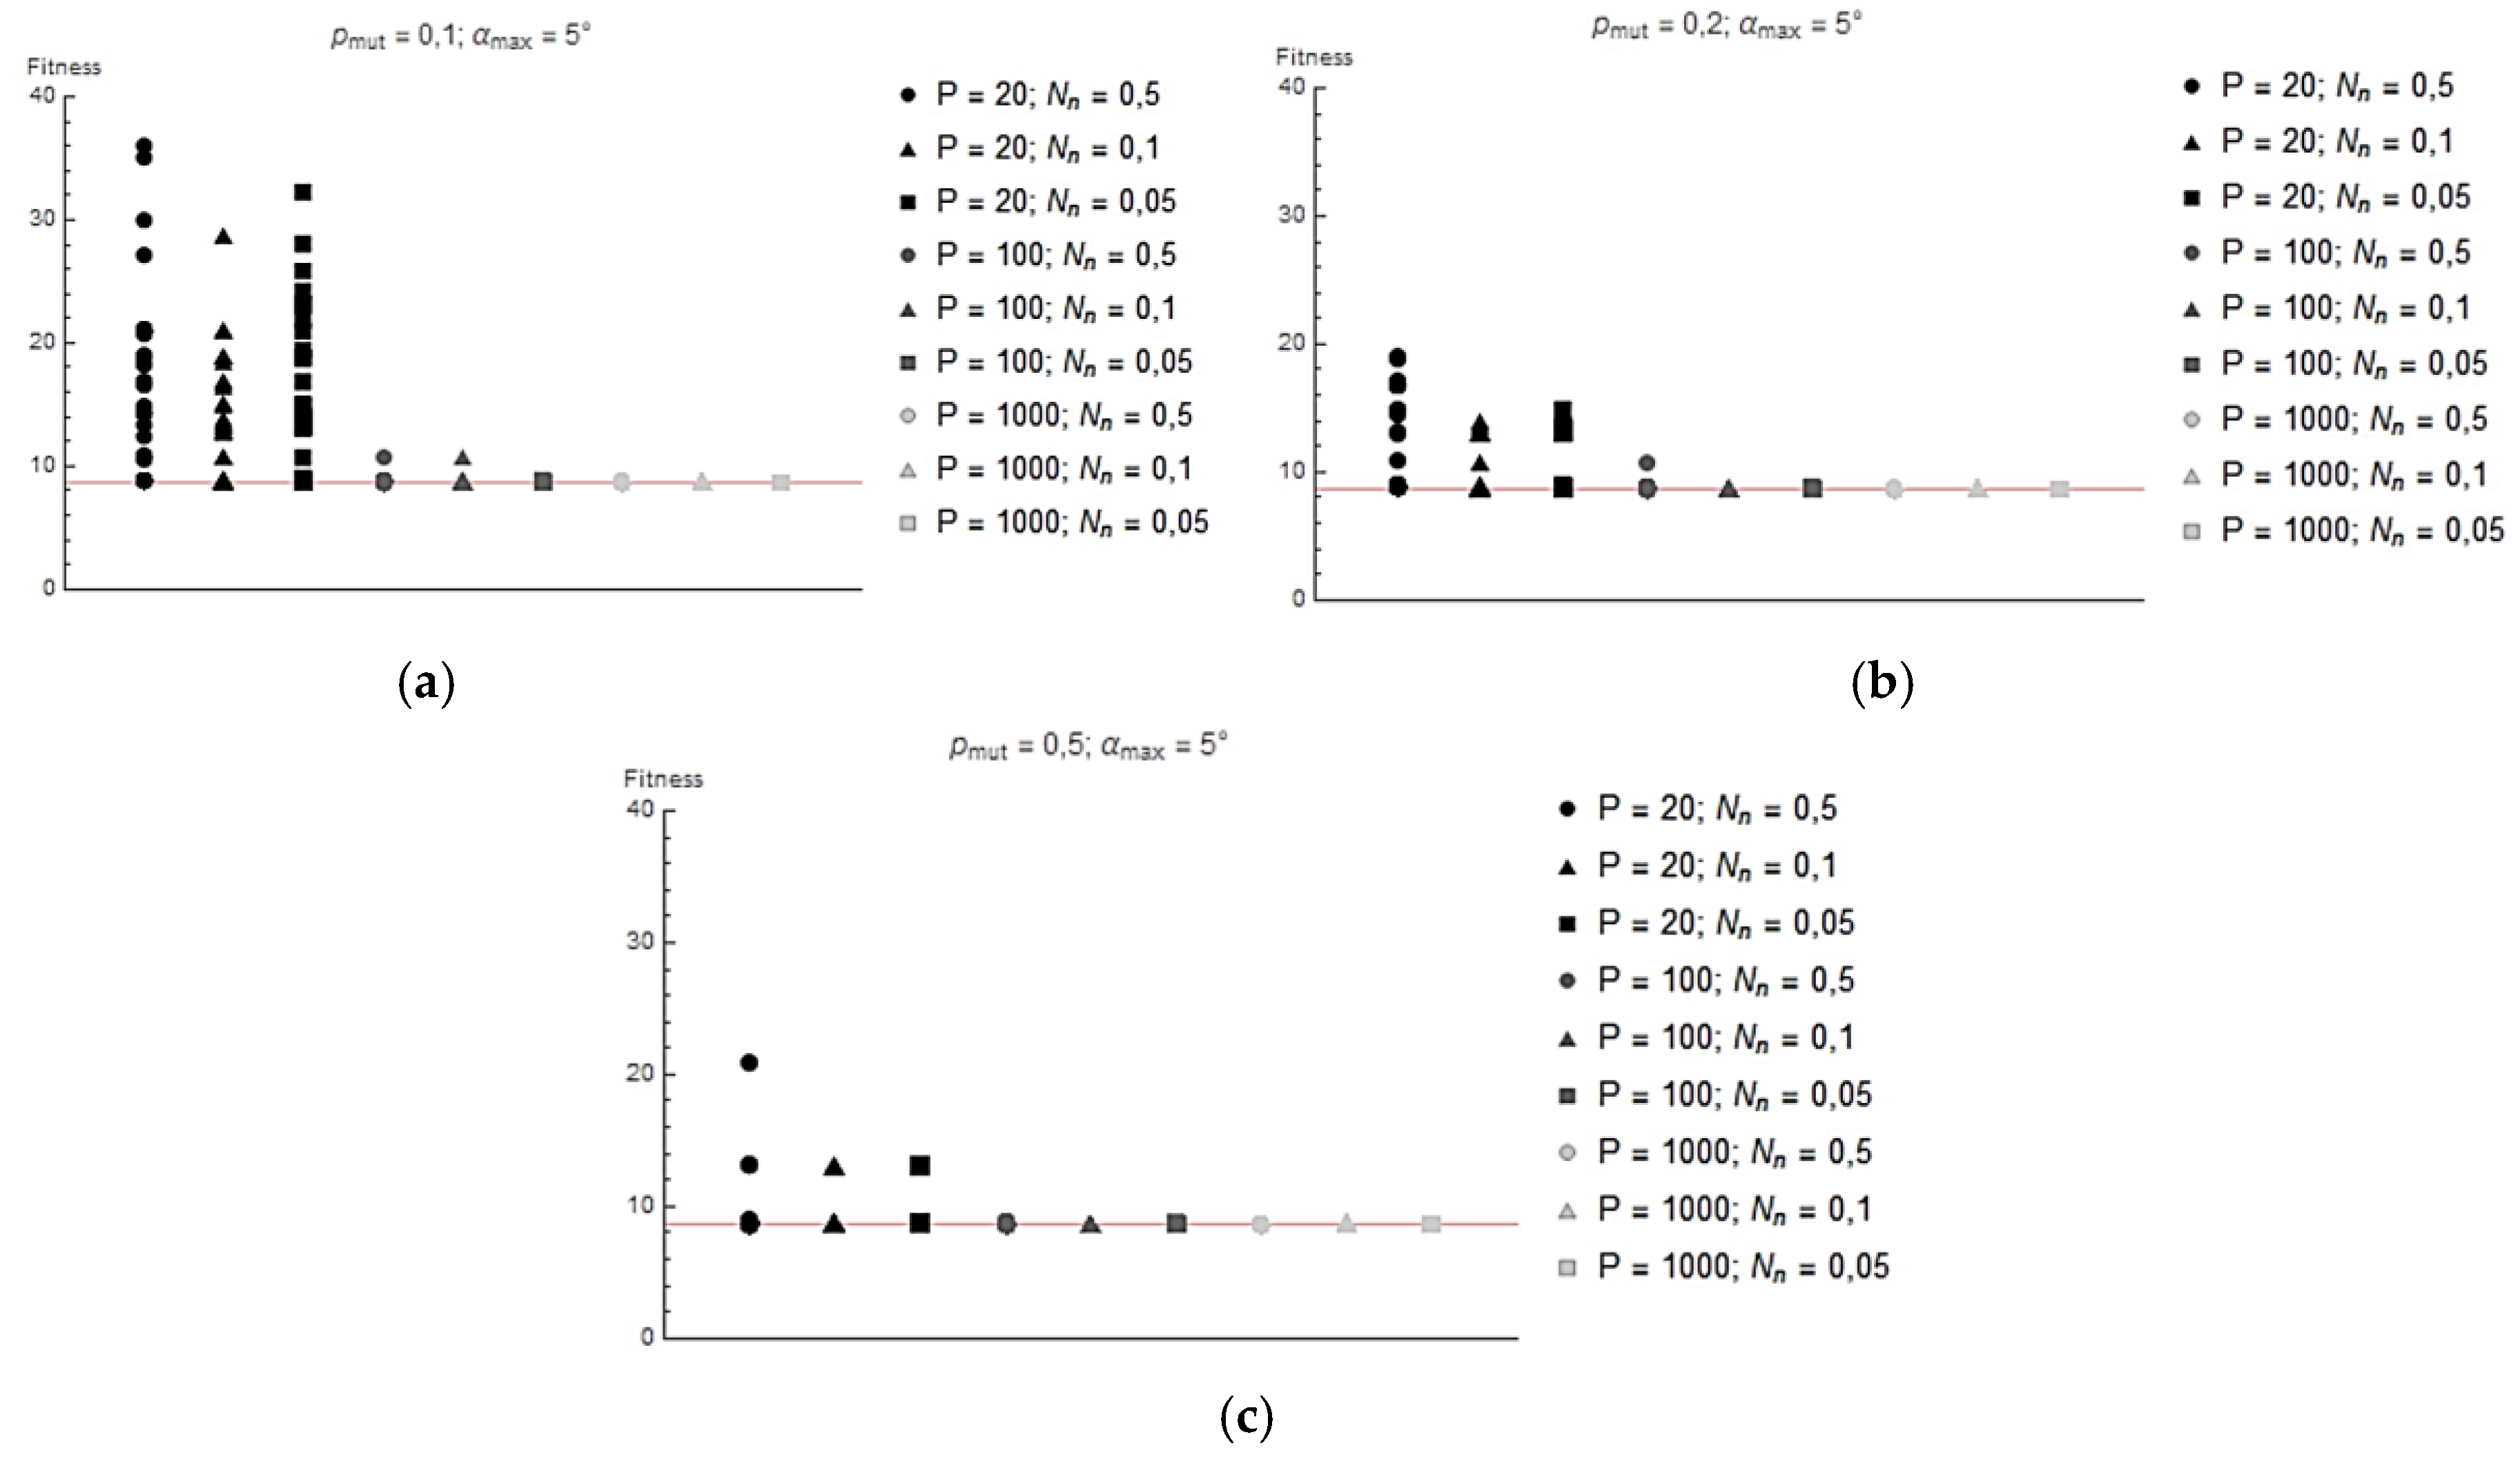
Figure 8.
Value of adaptation function reached at the end of each iteration for: (a) pmut = 0.1 and αmax = 15°; (b) pmut = 0.2 and αmax = 15°; (c) pmut = 0.5 and αmax = 15°.
Figure 8.
Value of adaptation function reached at the end of each iteration for: (a) pmut = 0.1 and αmax = 15°; (b) pmut = 0.2 and αmax = 15°; (c) pmut = 0.5 and αmax = 15°.
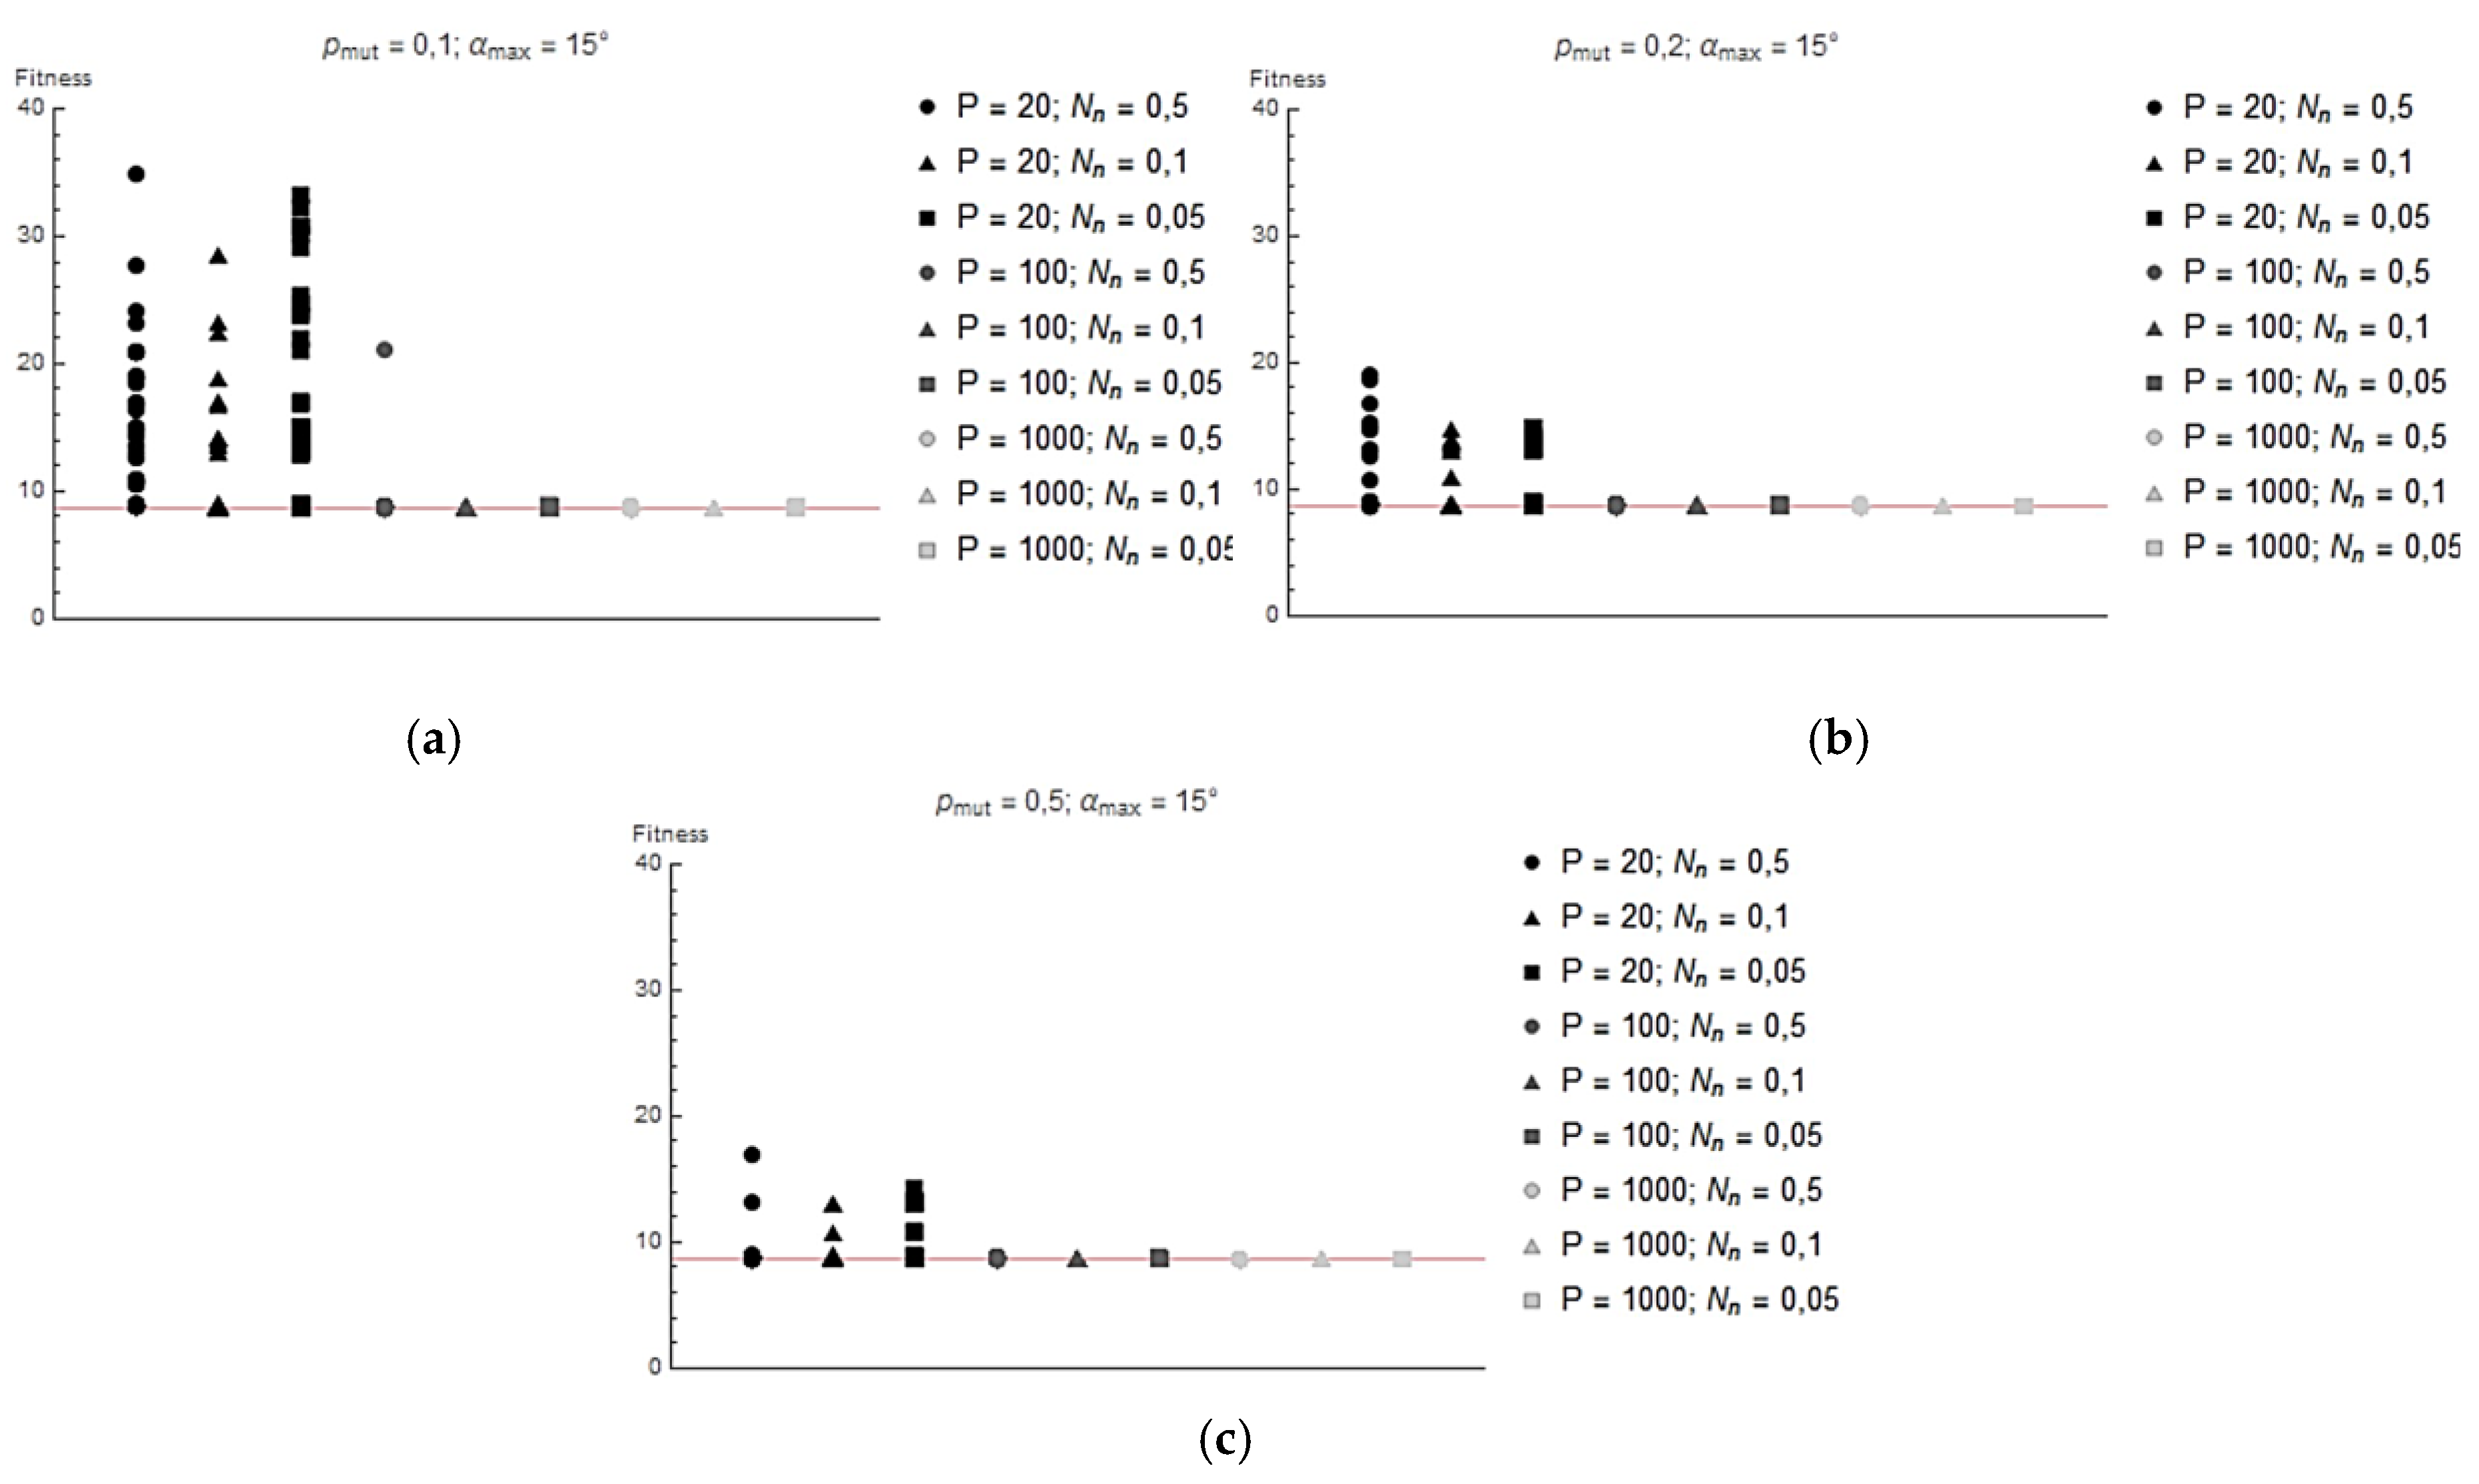
Figure 9.
Value of adaptation function reached at the end of each iteration for: (a) pmut = 0.1 and αmax = 30°; (b) pmut = 0.2 and αmax = 30°; (c) pmut = 0.5 and αmax = 30°.
Figure 9.
Value of adaptation function reached at the end of each iteration for: (a) pmut = 0.1 and αmax = 30°; (b) pmut = 0.2 and αmax = 30°; (c) pmut = 0.5 and αmax = 30°.
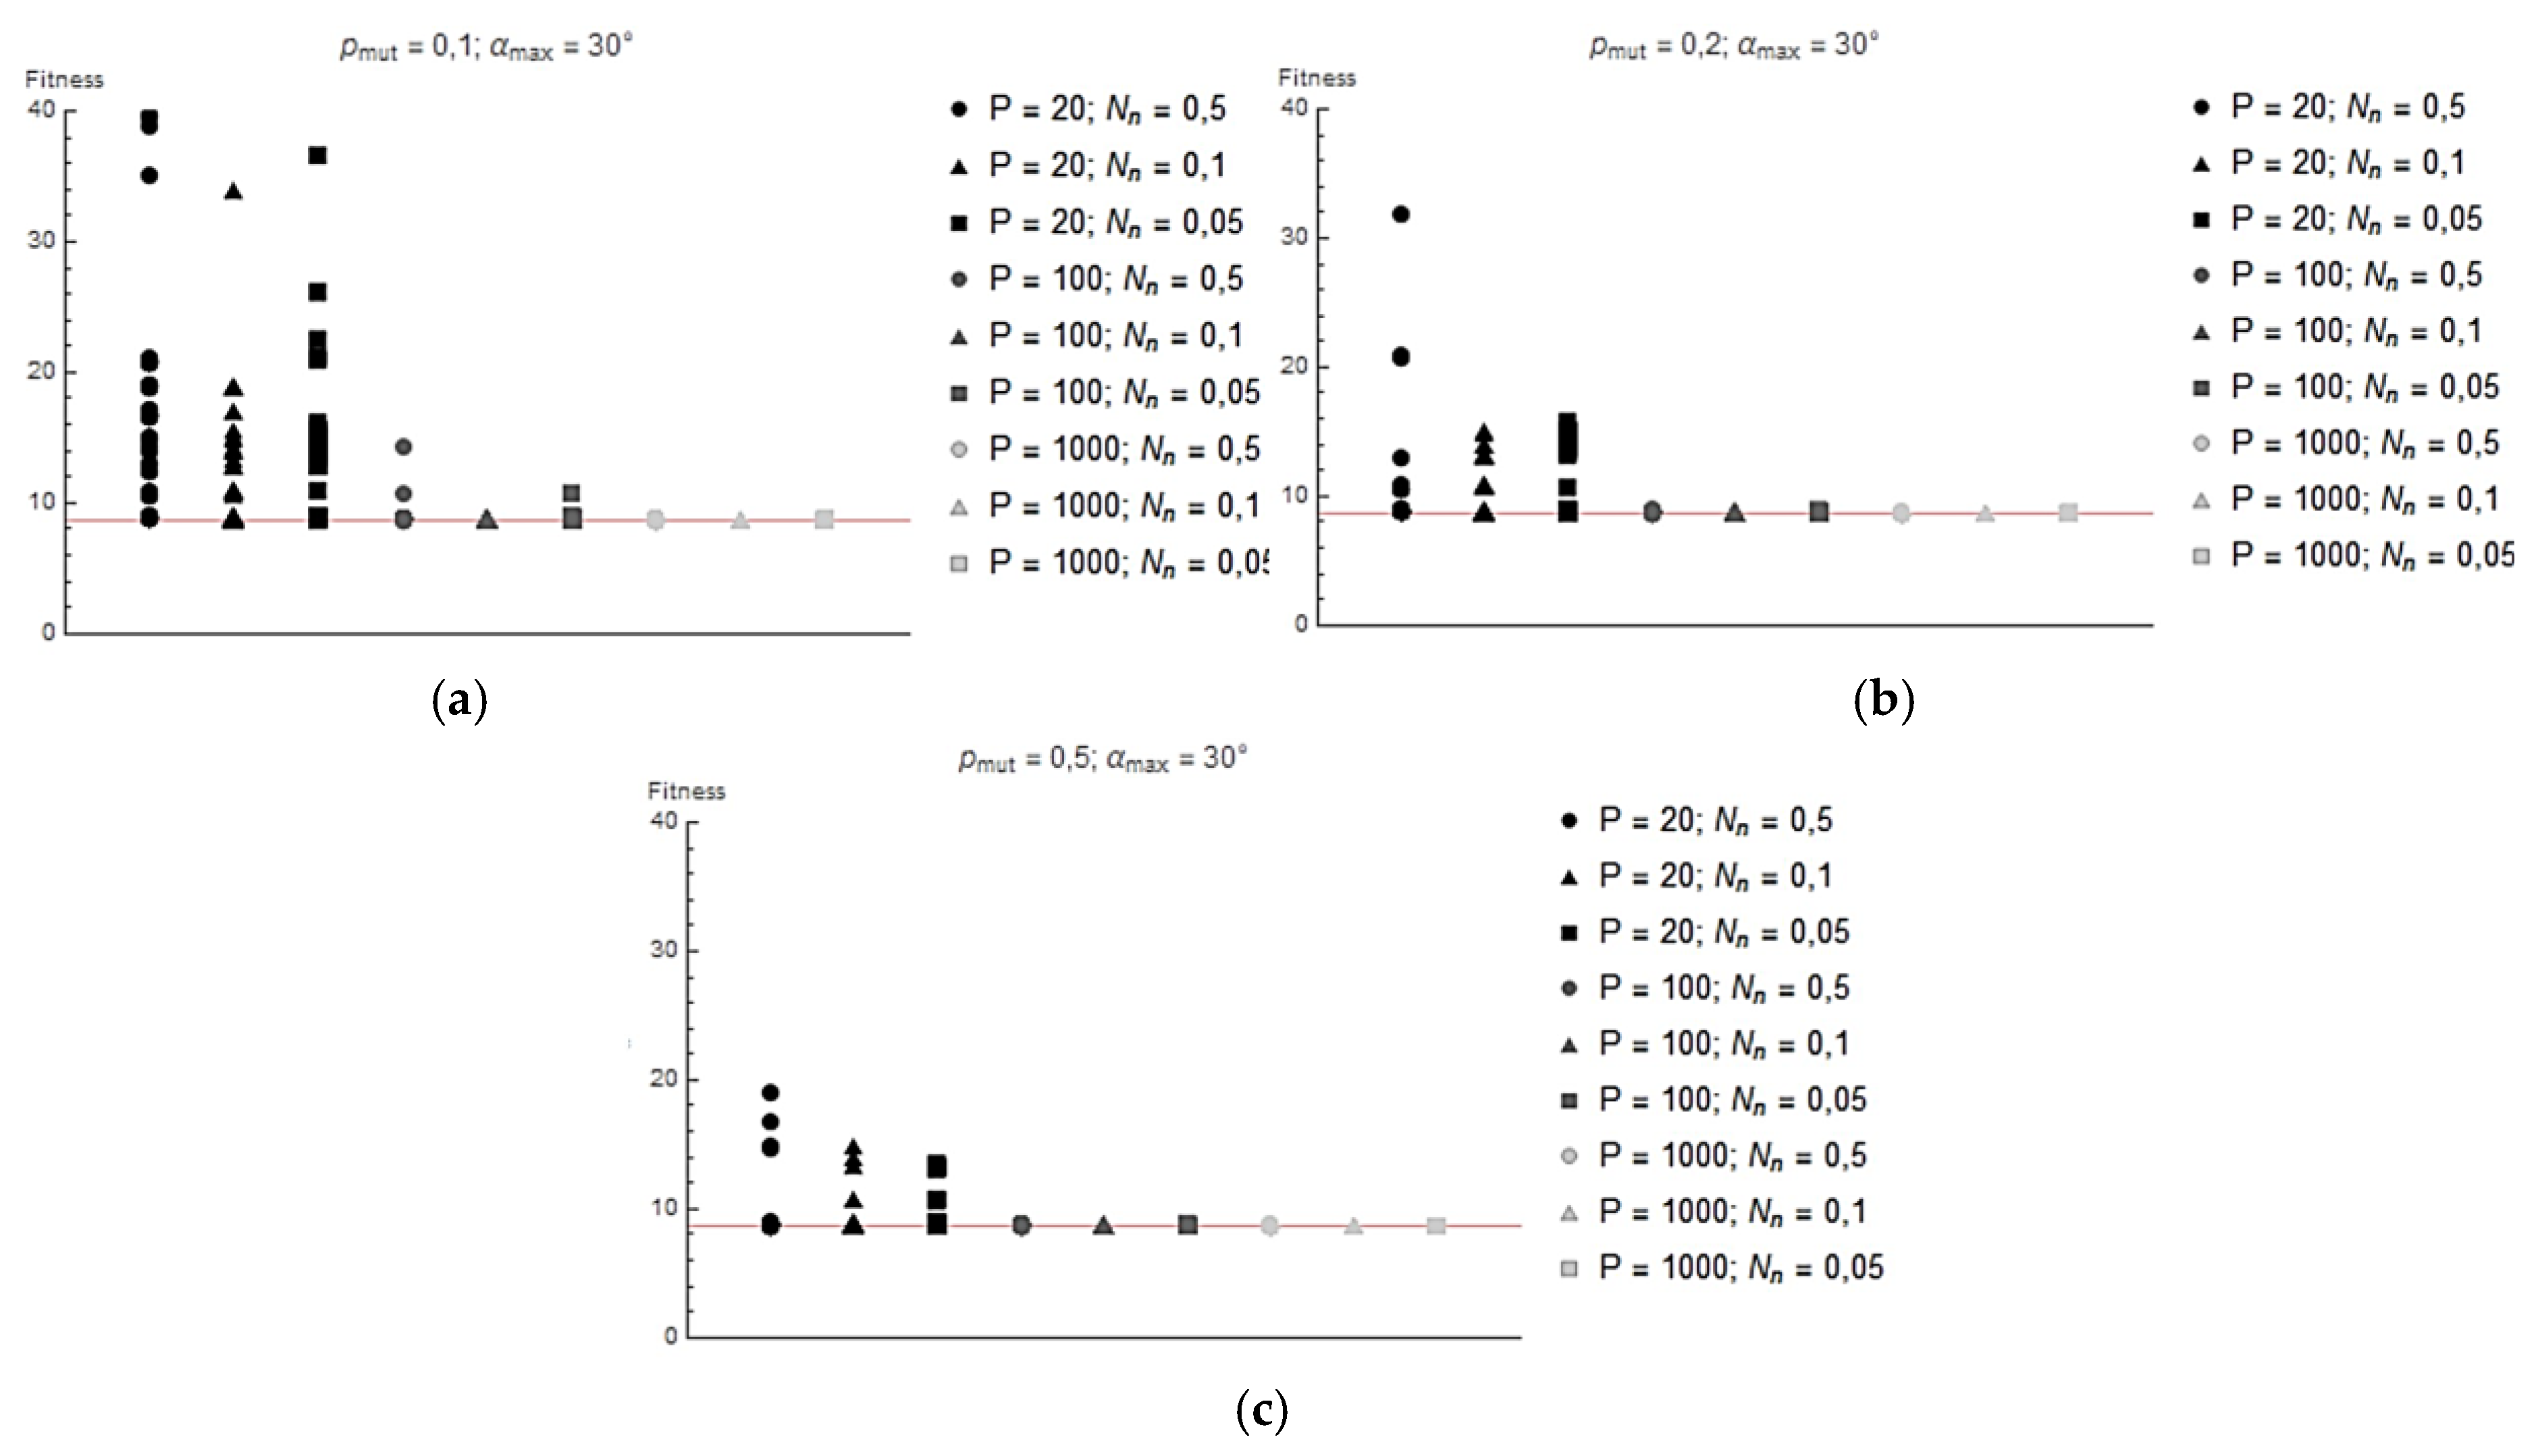
Figure 10.
Hydraulic diagram of the actuator test stand: 1 – pump; 2 – safety valve; 3 – pressure gauge; 4 – 4/3 directional control valve; 5 – 2-way flow regulator; 6 – 3-way flow regulator; 7 – check valve; 8 and 9 – flow meter; 10 and 11 – pressure sensor; 12 – tested actuator; 13 – position sensor; 14 – force sensor; 15 – load actuator; 16 – 4/3 directional control valve; 17 – pressure sensor; 18 – relief valve; 19 – safety valve; 20 – adjustable throttle valve; 21 – pump; 22 and 23 – tank.
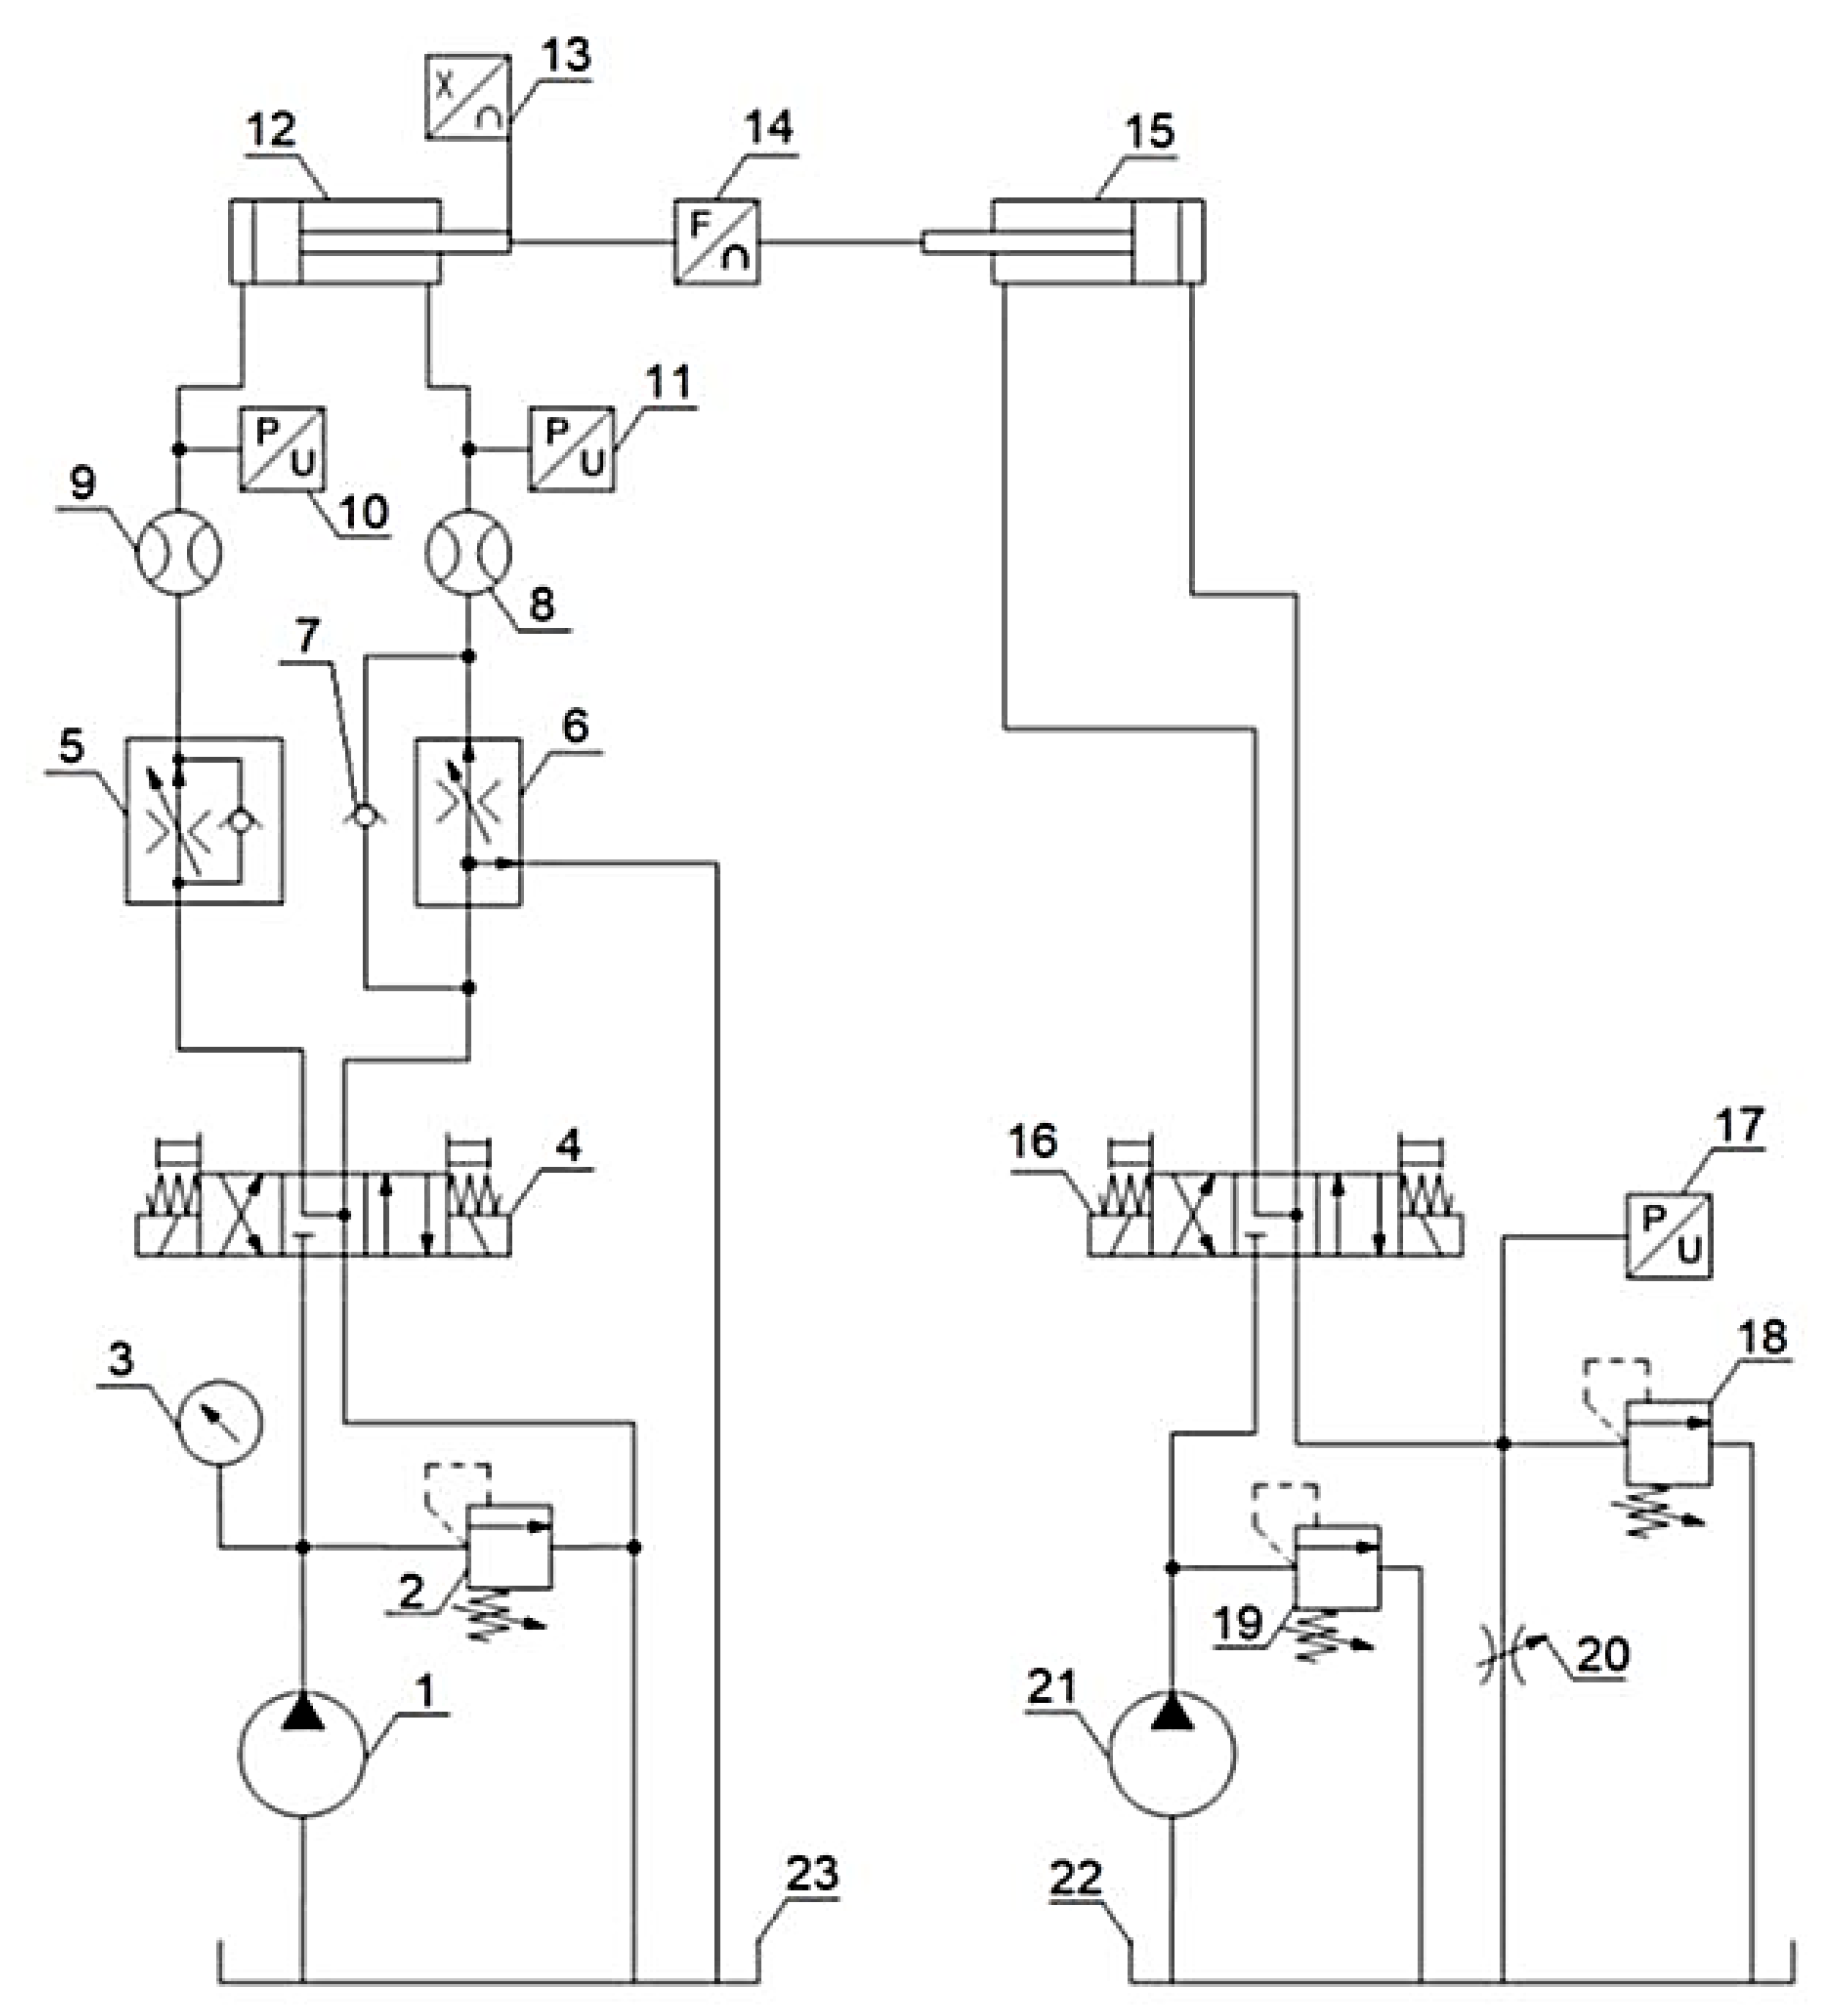
Figure 11.
Cylinder with composite cylinder [±83/±84/±85/±83] mounted on test stand.
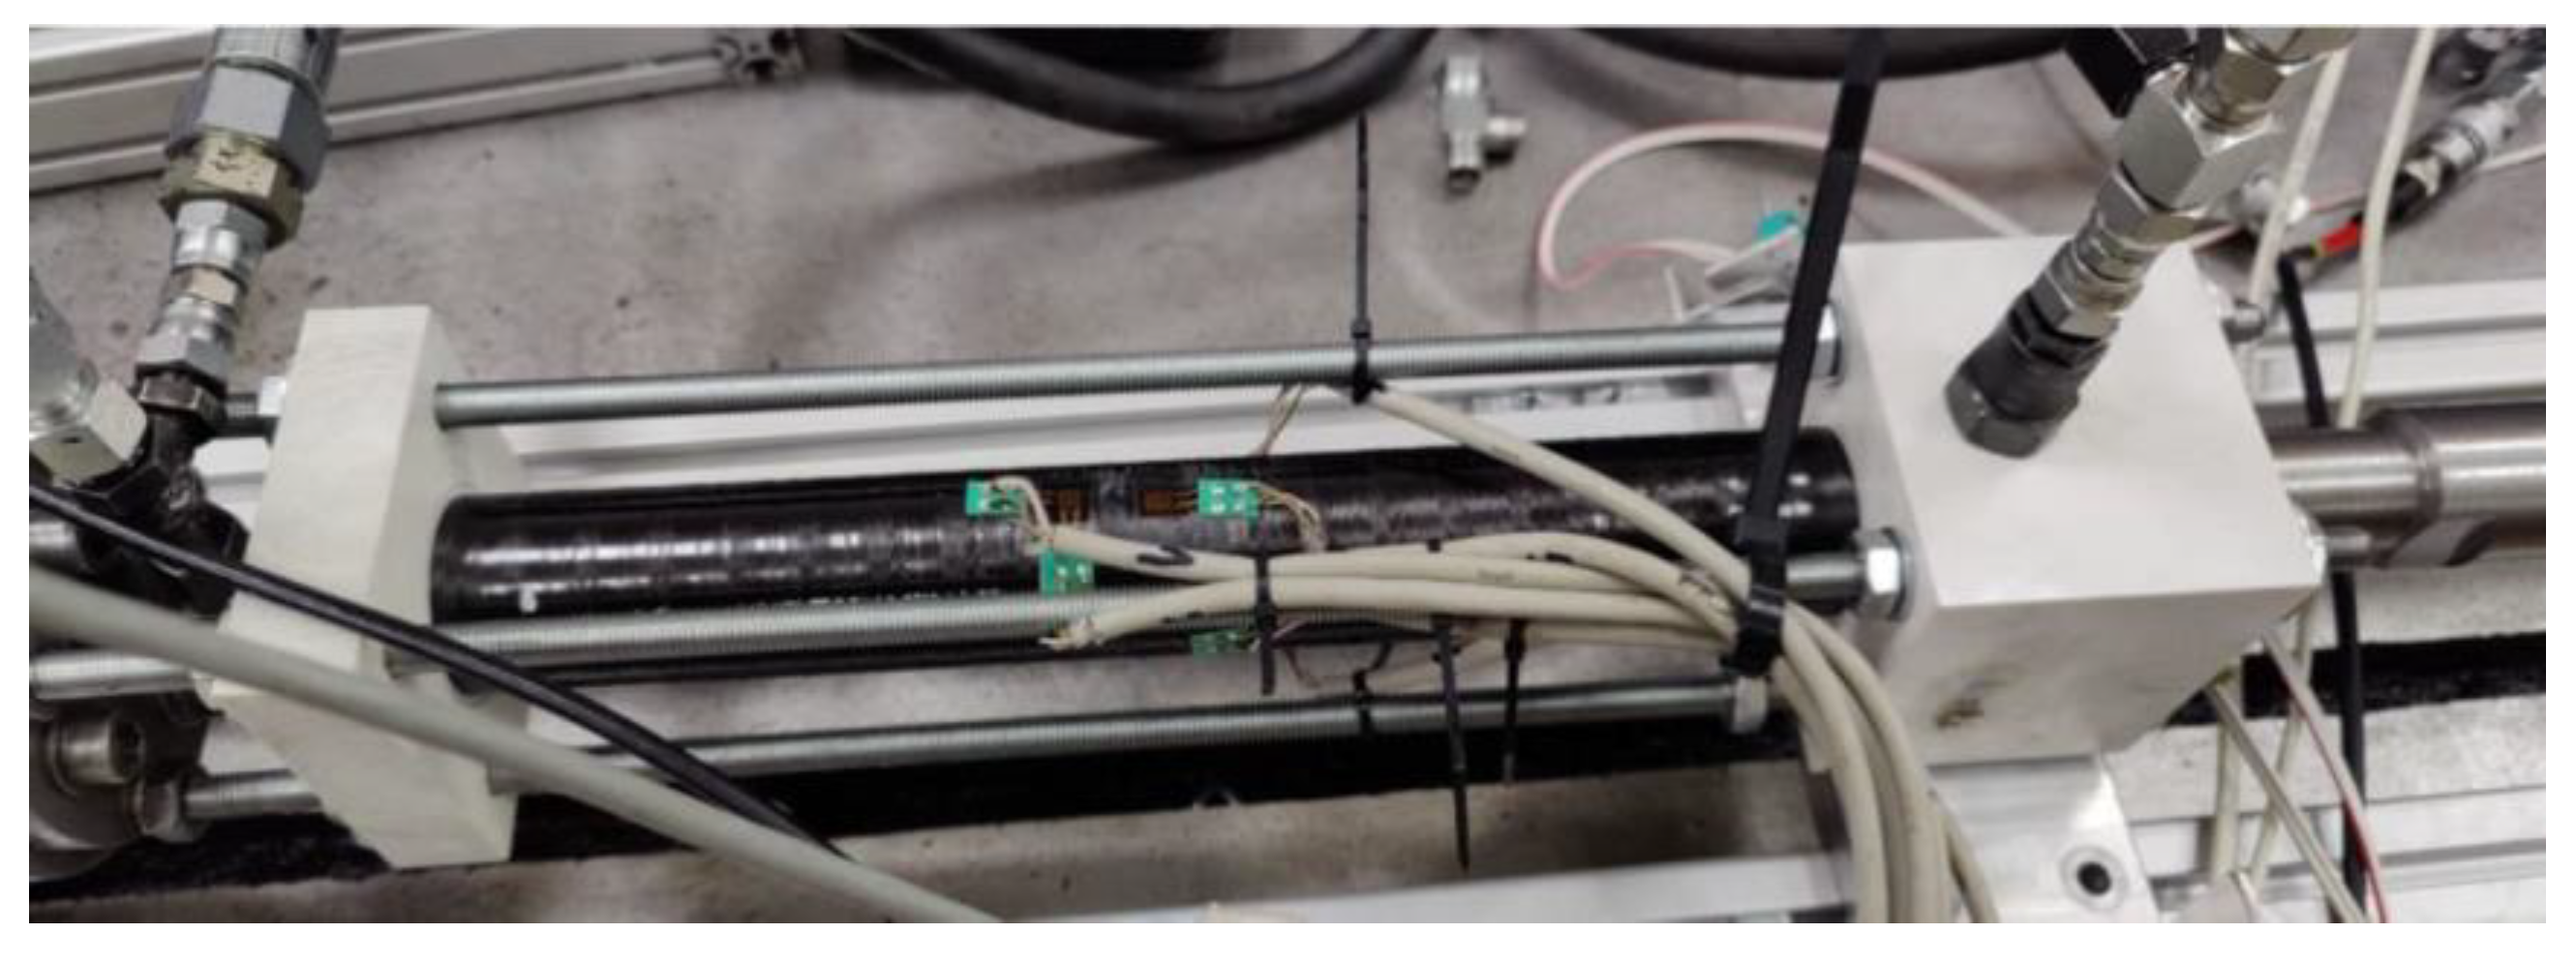
Figure 12.
Deformation of composite cylinder [±83/±84/±85/±83] during internal pressure loading.
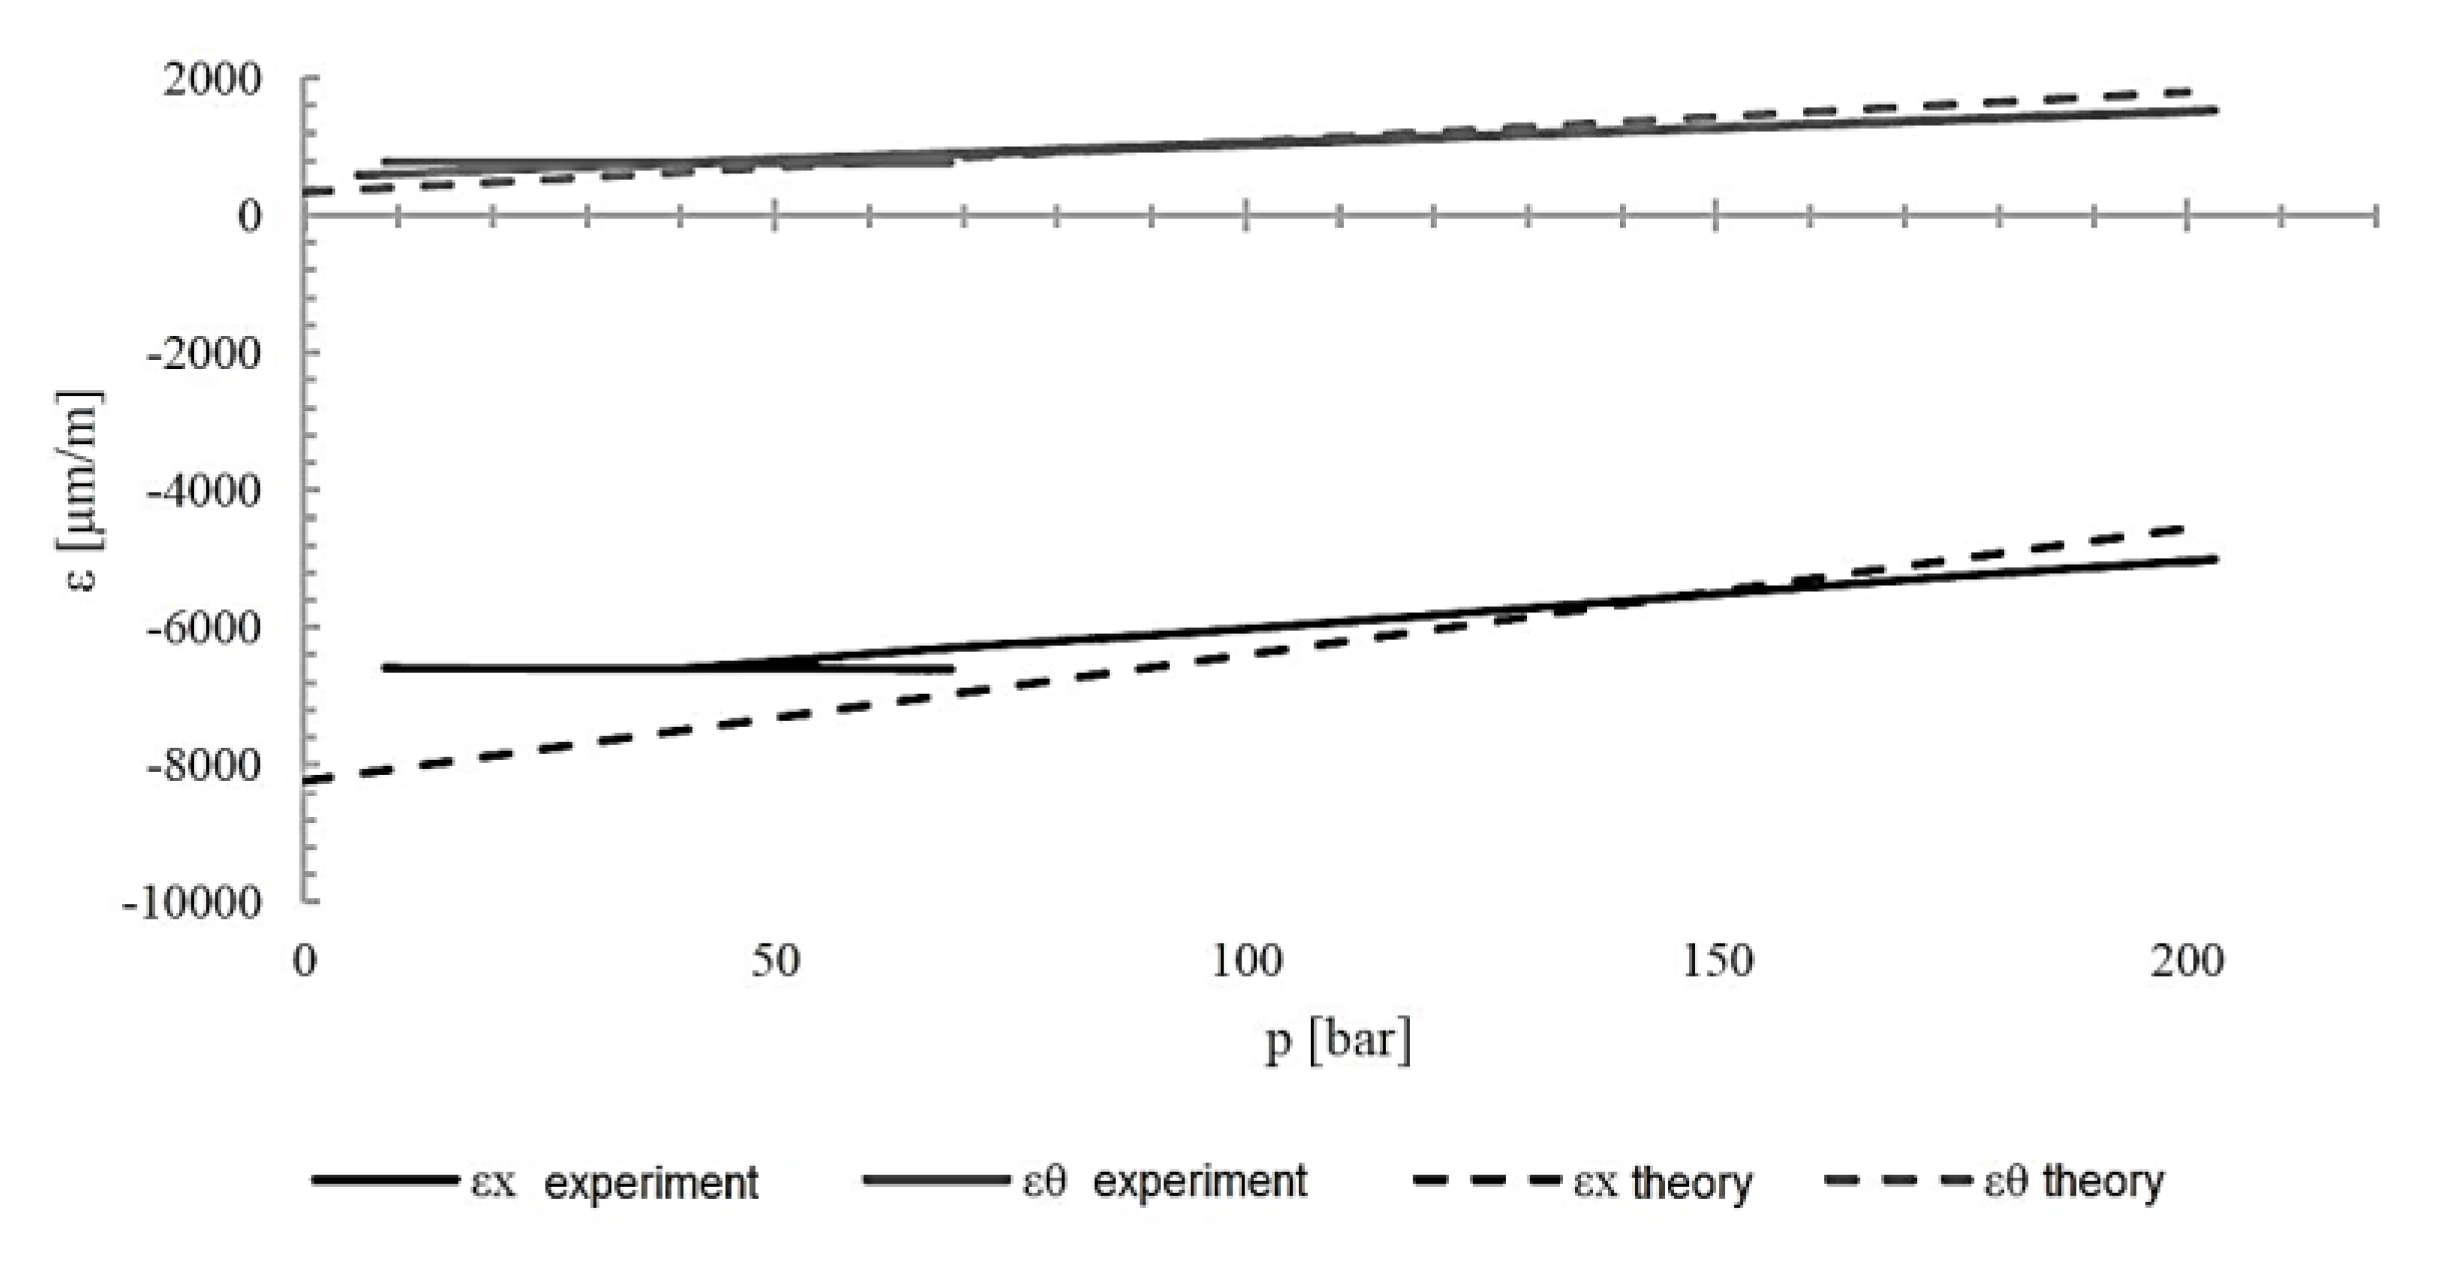
Figure 13.
Stress in individual cylinder layers [±83/±84/±85/±83] in layer coordinate systems under internal pressure loading.
Figure 13.
Stress in individual cylinder layers [±83/±84/±85/±83] in layer coordinate systems under internal pressure loading.
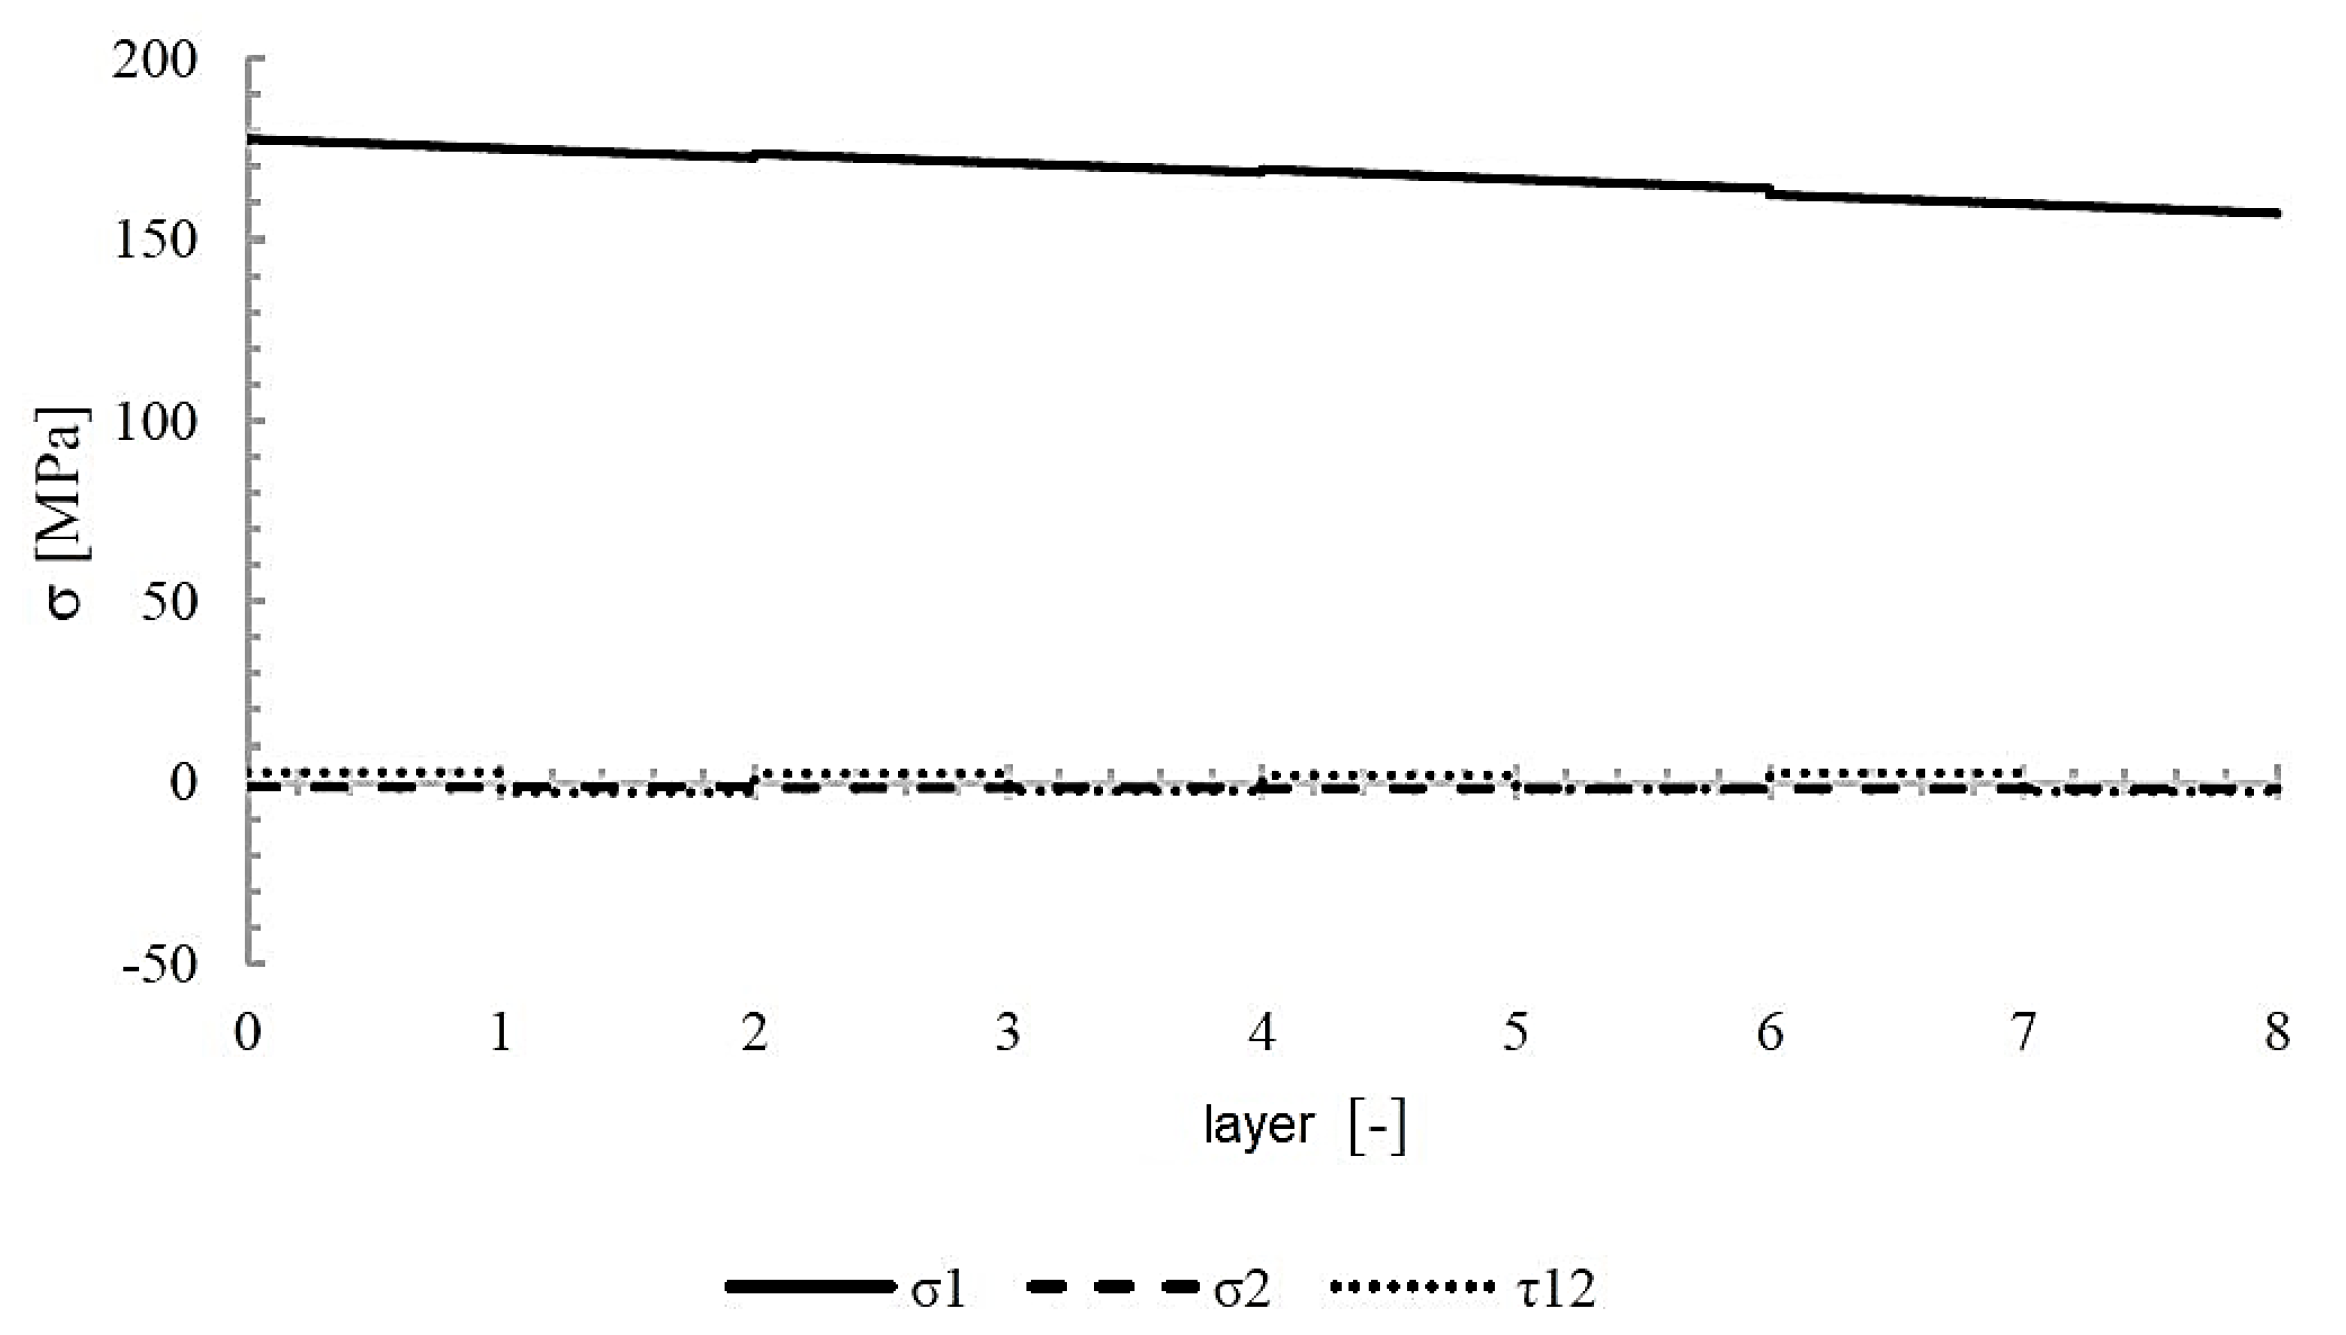
Figure 14.
Value of strength factor R in individual layers under internal pressure loading.
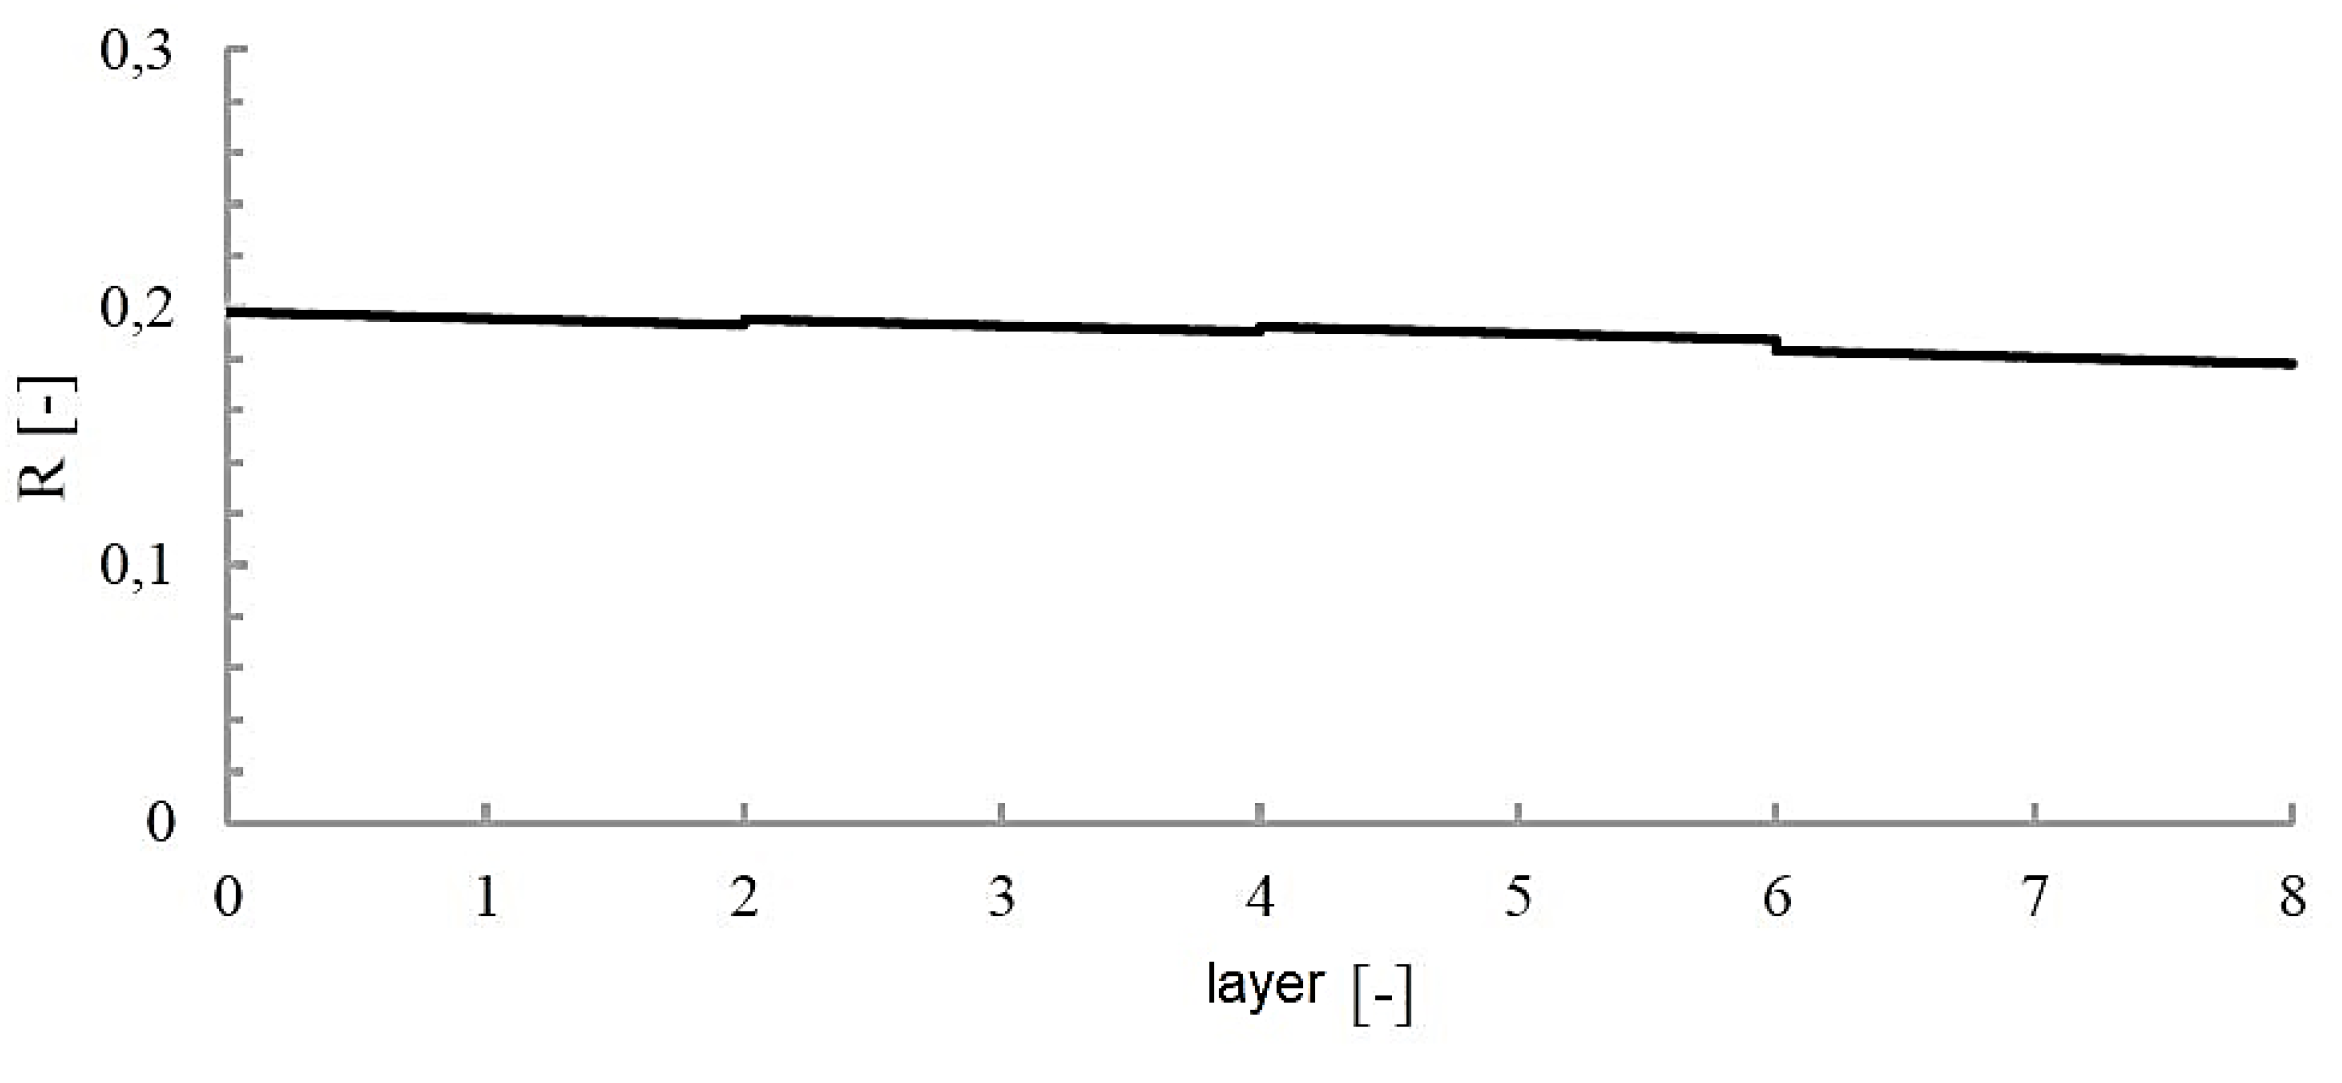
Figure 15.
Deformation of composite cylinder [90/90/±20/]2 during pressure loading.
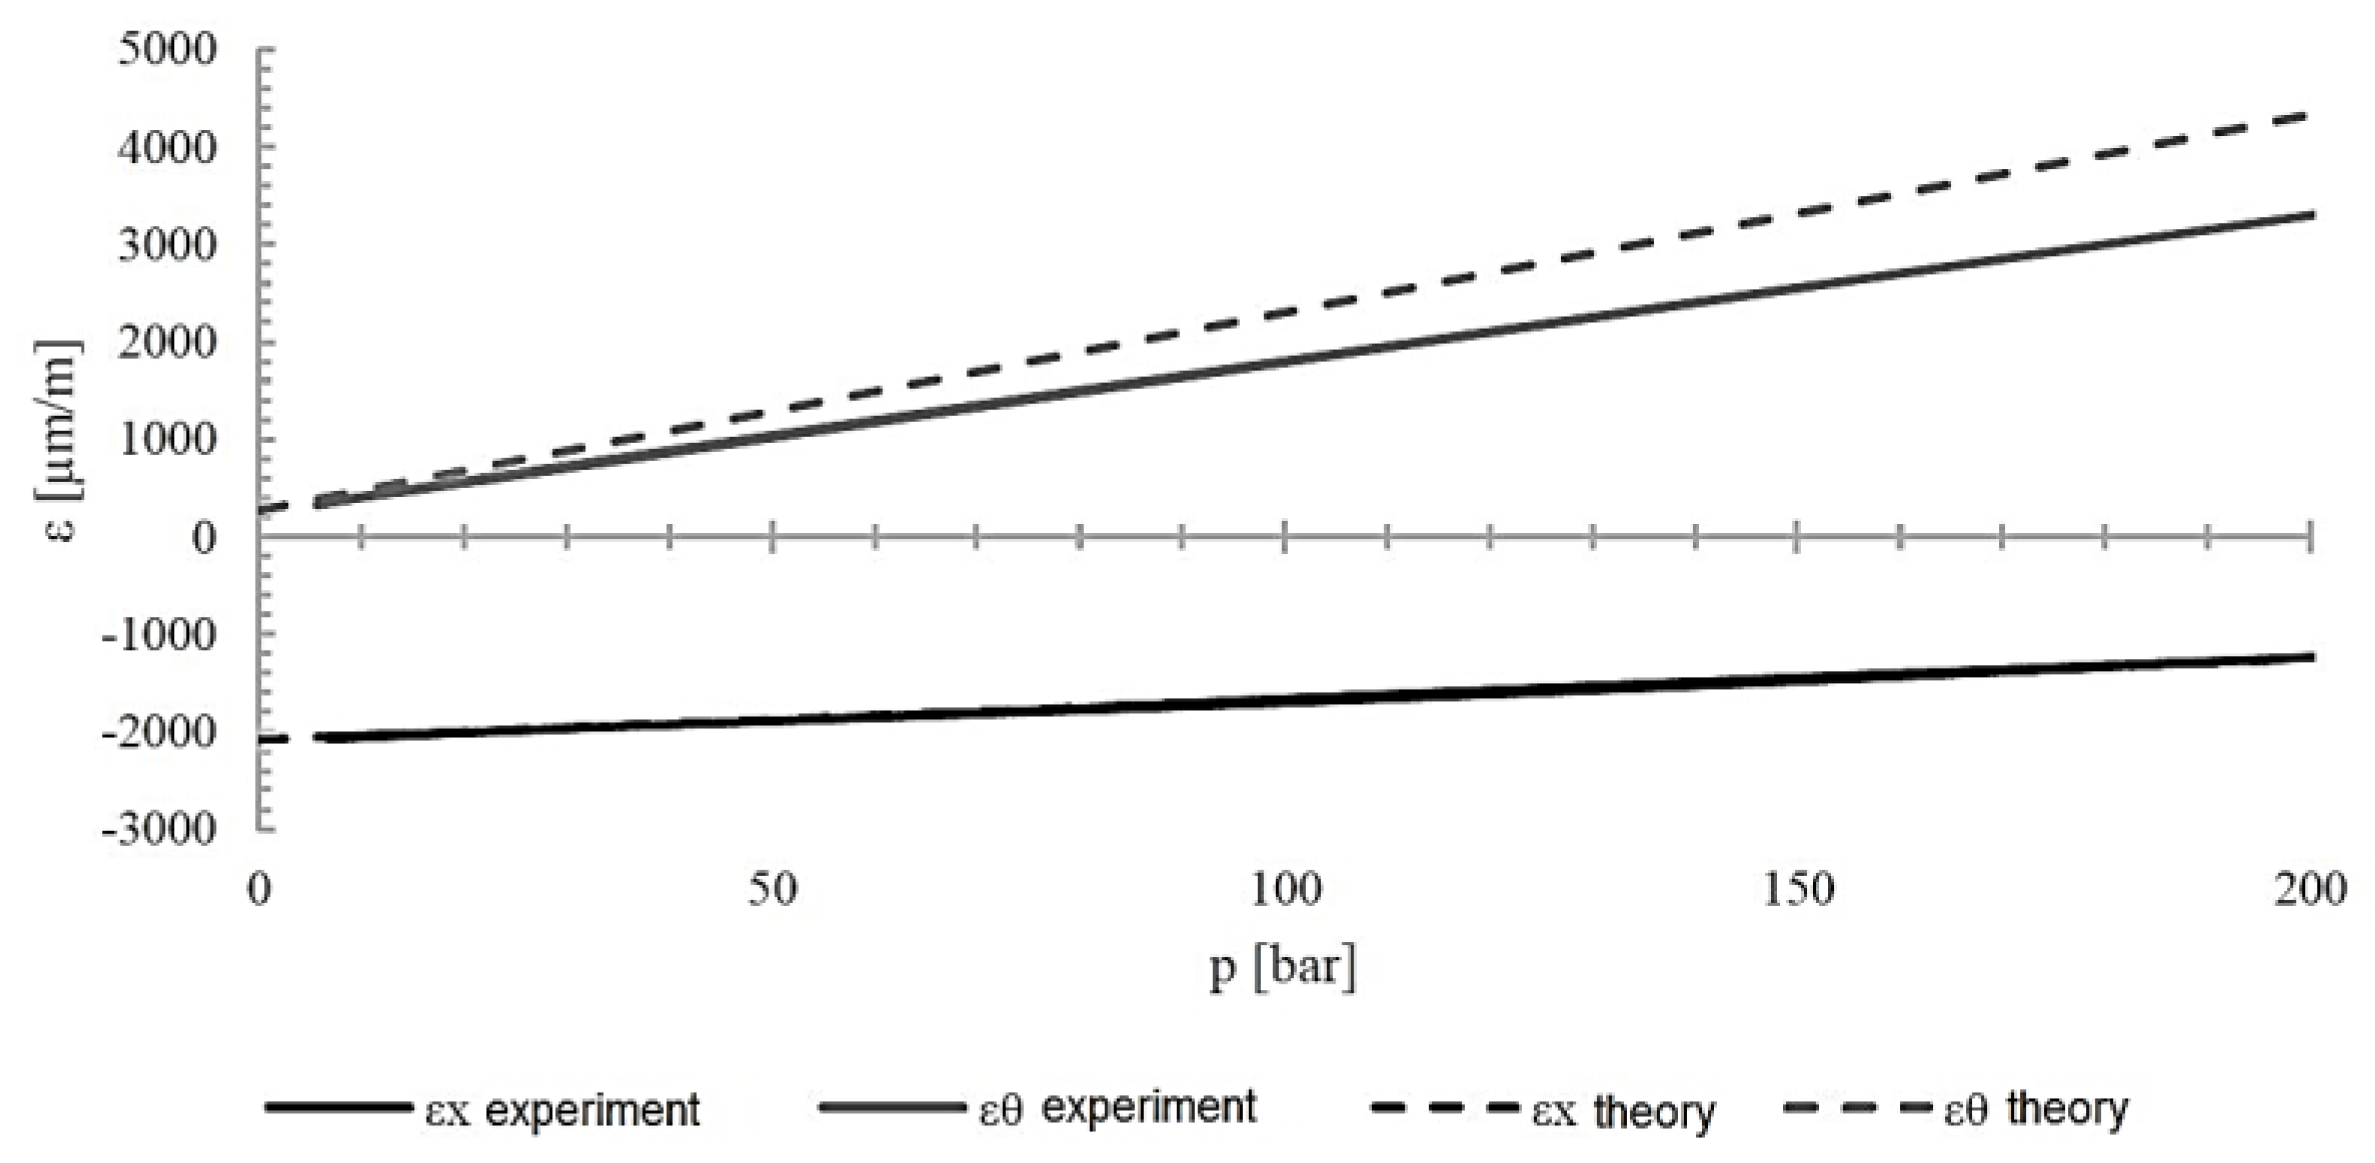
Figure 16.
Stress in individual cylinder layers [90/90/±20/]2 in layer coordinate systems under internal pressure loading.
Figure 16.
Stress in individual cylinder layers [90/90/±20/]2 in layer coordinate systems under internal pressure loading.
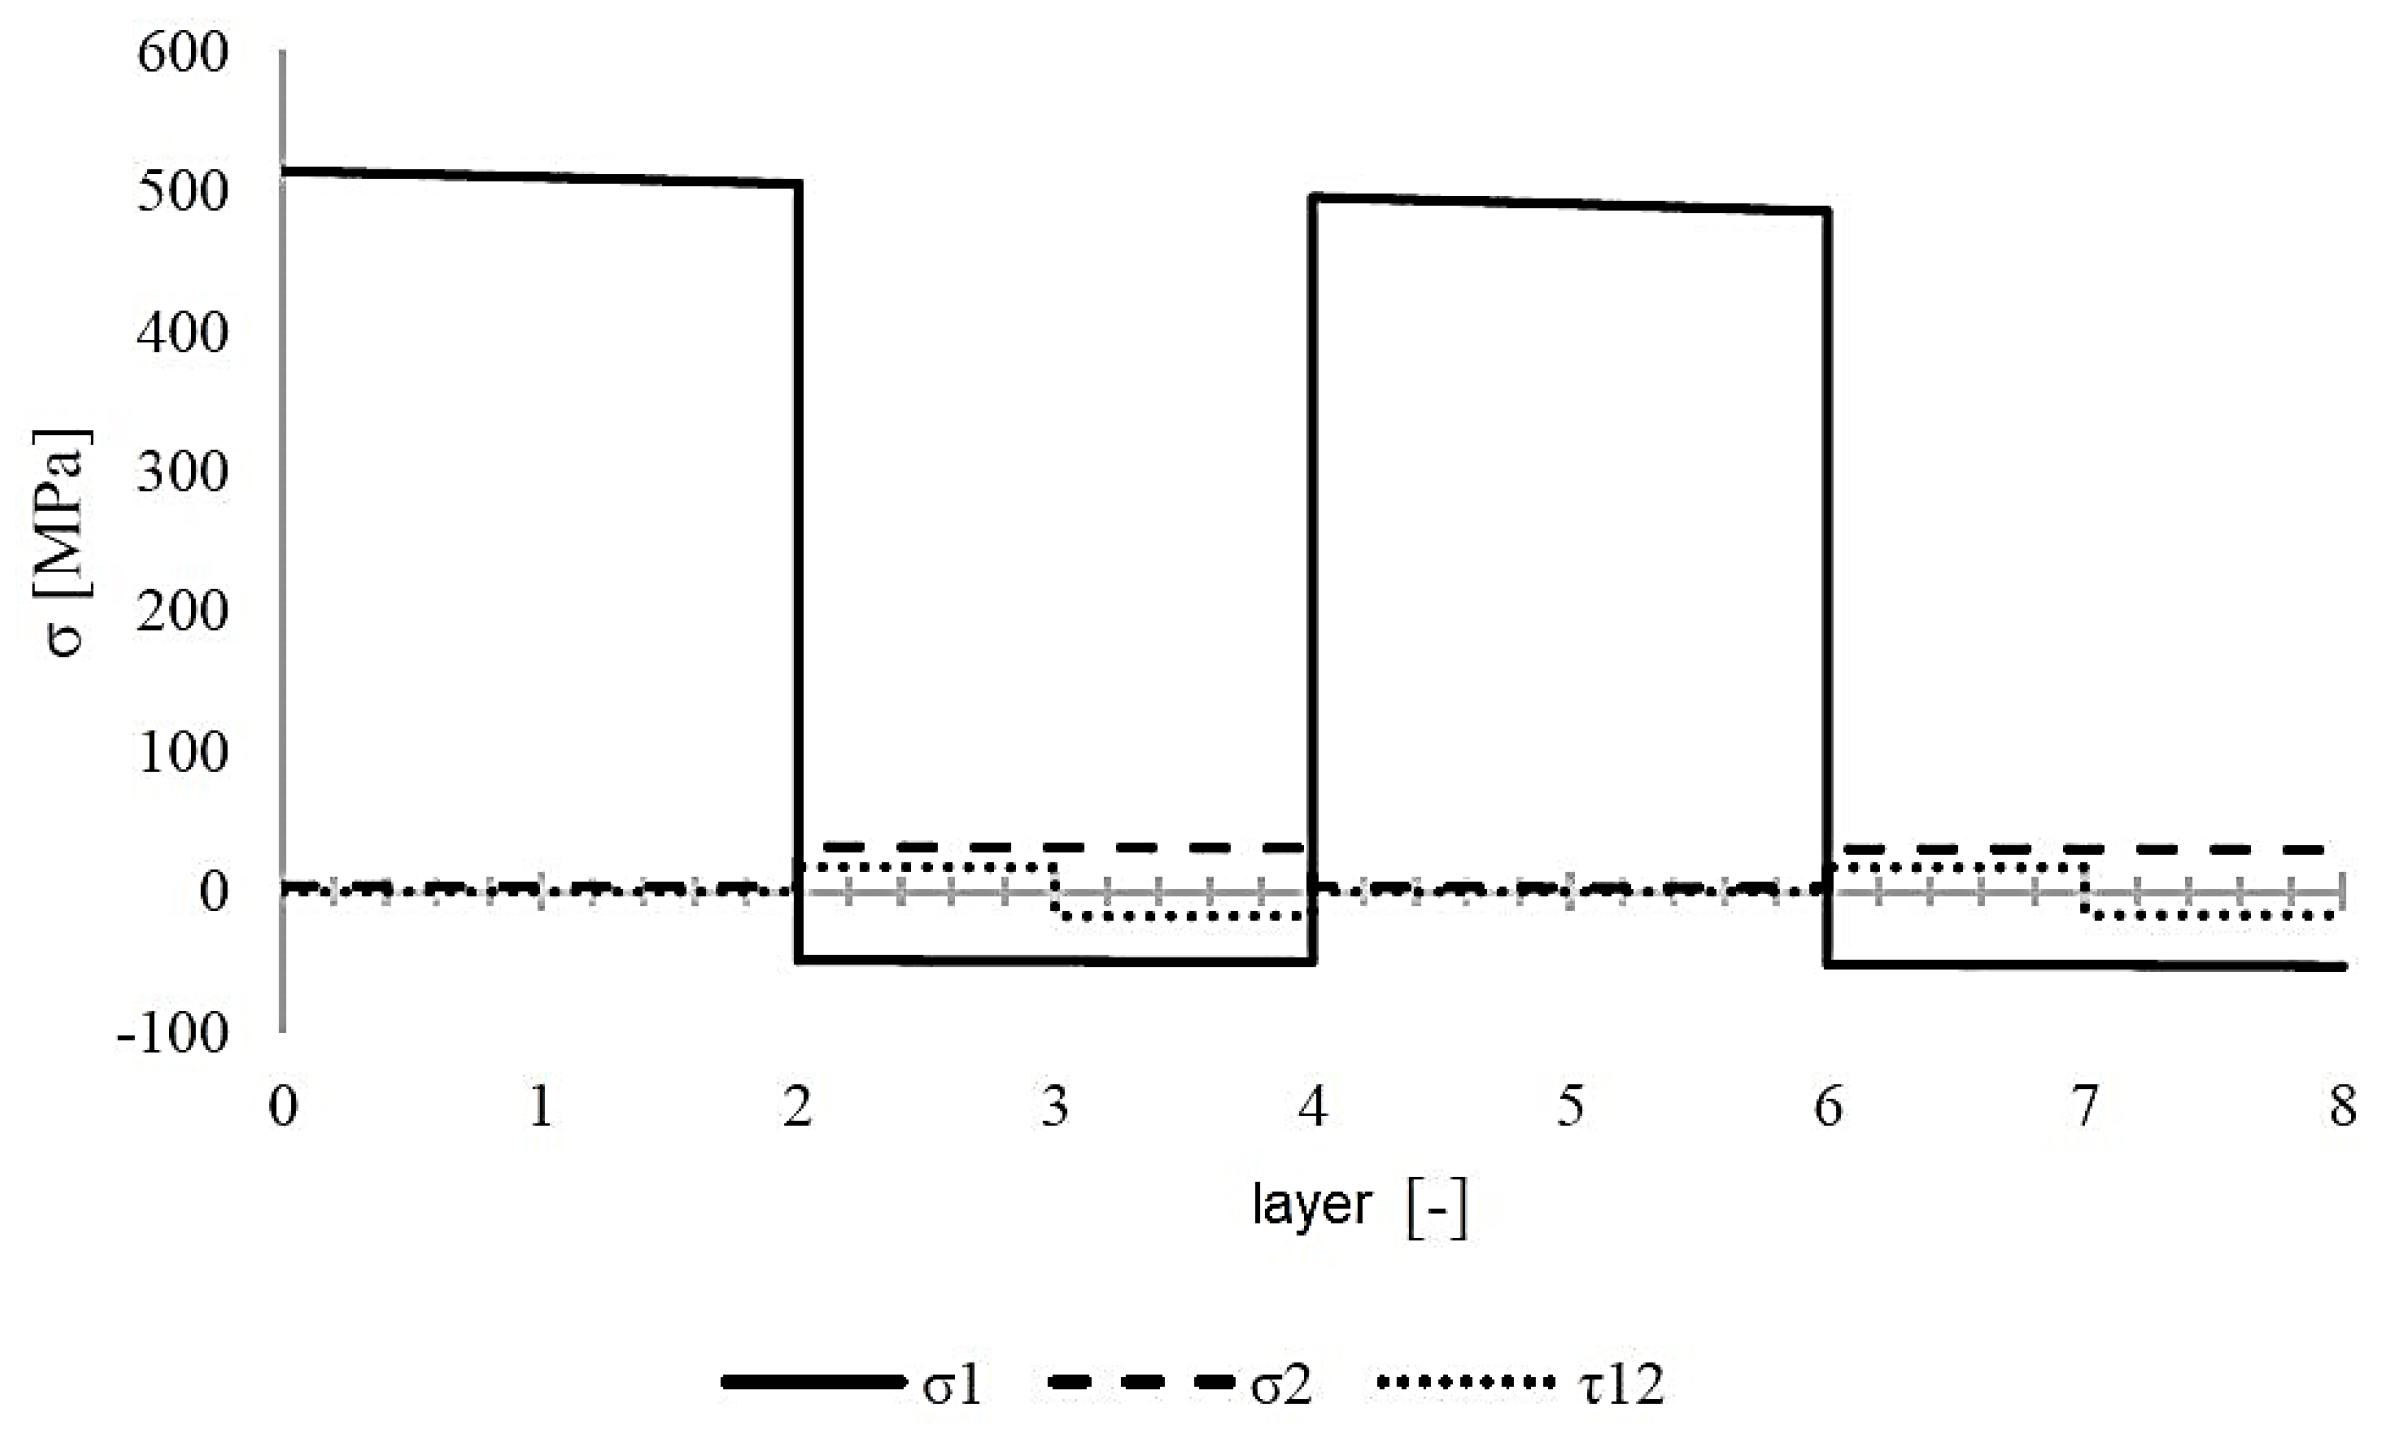
Figure 17.
Value of strength factor R in individual layers under internal pressure loading.
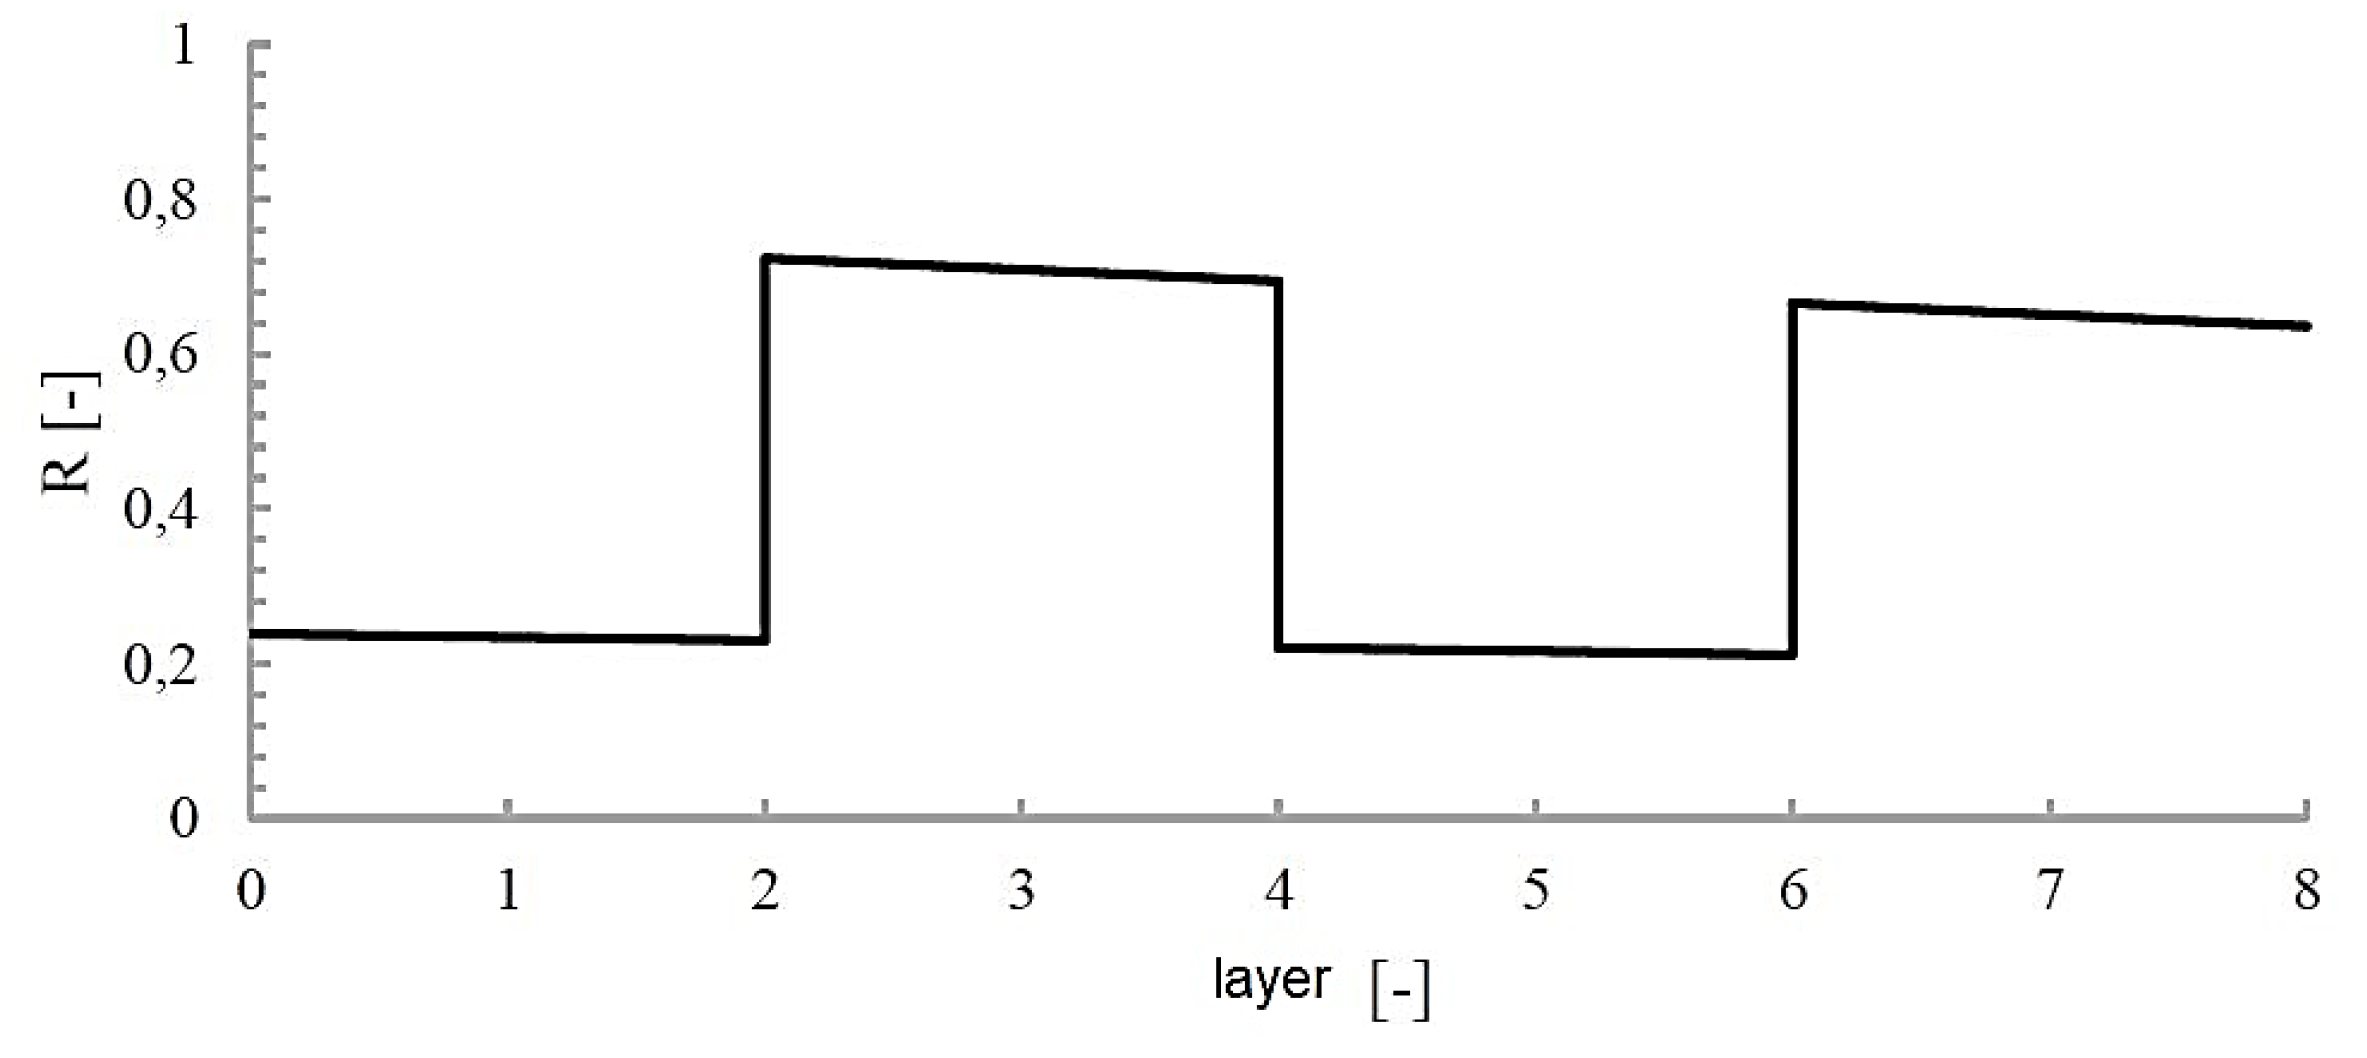
Figure 18.
Block diagram of the proposed composite cylinder design method.
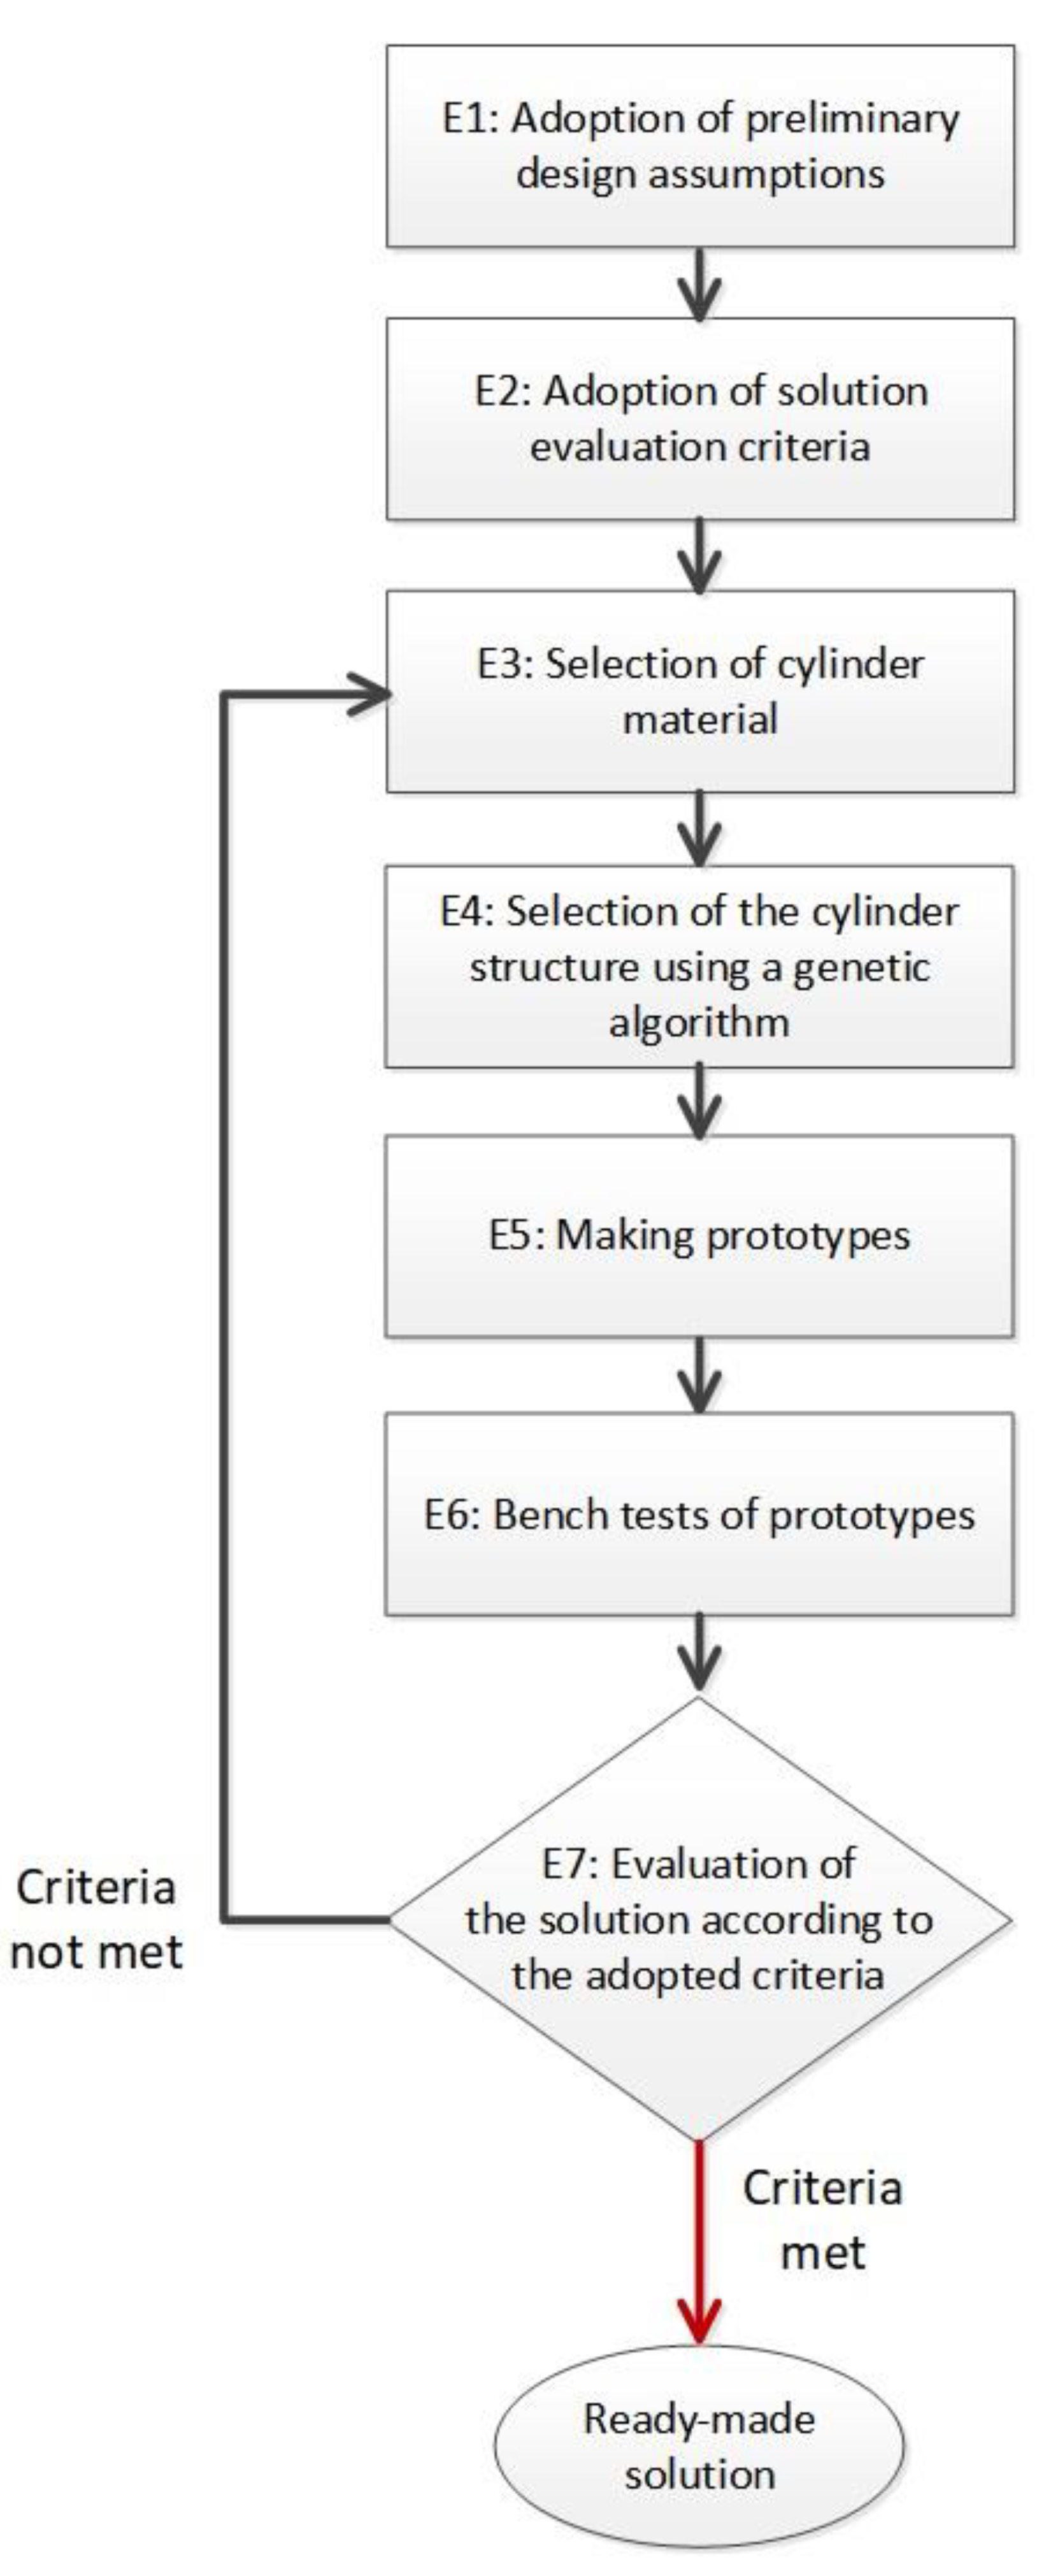

Table 1.
Material properties of the epoxy-carbon composite used.
| Parameters | Value |
|---|---|
| E1t = E1c | 103.31 [GPa] |
| E2t = E2c | 8.39 [GPa] |
| G12 | 4.64 [GPa] |
| (σ1T)ult | 1070.96 [MPa] |
| (σ2T)ult | 40.39 [MPa] |
| (σ1C)ult | 703.01 [MPa] |
| (σ2C)ult | 113.64 [MPa] |
| (τ21)ult | 63.88 [MPa] |
| ν12 =ν21 | 0.34 [-] |
Table 2.
The top five solutions found by the genetic algorithm.
| Nr. | Fiber arrangement | Customization feature |
|---|---|---|
| 1 | [90/90/±20]2 | 4.302 |
| 2 | [90/90/±21/90/90/±21] | 4.308 |
| 3 | [90/90/±22/90/90/±20] | 4.314 |
| 4 | [90/90/±22/90/90/±21] | 4.315 |
| 5 | [±83/±84/±85/±83] | 4.341 |
Table 3.
Comparison of the masses of made cylinders.
| Cylinder | Weight [g] | Difference |
|---|---|---|
| Steel | 1704 | - |
| [±83/±84/±85/±83] | 136.7 | 91.9% |
| [±83/±84/±85/±83] liner F180 | 149.6 | 91.2% |
| [±83/±84/±85/±83] steel liner | 552 | 67.6% |
| [90/90/±20/]2 | 95.5 | 94.4% |
Table 4.
Comparison of composite cylinder deformations [±83/±84/±85/±83] measured experimentally and determined theoretically using classical laminate theory.
Table 4.
Comparison of composite cylinder deformations [±83/±84/±85/±83] measured experimentally and determined theoretically using classical laminate theory.
| εx [µm/m] | εθ [µm/m] | ||||
| Experiment | Theory | Difference | Experiment | Theory | Difference |
| -5078.5 | -4556.75 | 10.3% | 1516.4 | 1796 | 18.4% |
Table 5.
Comparison of deformations of composite cylinder [90/90/±20/]2 measured experimentally and determined theoretically using classical laminate theory.
Table 5.
Comparison of deformations of composite cylinder [90/90/±20/]2 measured experimentally and determined theoretically using classical laminate theory.
| εx [µm/m] | εθ [µm/m] | ||||
| Experiment | Theory | Difference | Experiment | Theory | Difference |
| -1237.12 | -1252.9 | 1.29% | 3299.5 | 4329.13 | 31.2% |
Disclaimer/Publisher’s Note: The statements, opinions and data contained in all publications are solely those of the individual author(s) and contributor(s) and not of MDPI and/or the editor(s). MDPI and/or the editor(s) disclaim responsibility for any injury to people or property resulting from any ideas, methods, instructions or products referred to in the content. |
© 2025 by the authors. Licensee MDPI, Basel, Switzerland. This article is an open access article distributed under the terms and conditions of the Creative Commons Attribution (CC BY) license (http://creativecommons.org/licenses/by/4.0/).
Copyright: This open access article is published under a Creative Commons CC BY 4.0 license, which permit the free download, distribution, and reuse, provided that the author and preprint are cited in any reuse.


