
Submitted:
15 March 2025
Posted:
17 March 2025
You are already at the latest version
Abstract
The growing request regarding the comfort of passengers, saving the environment by using new materials to lower fuel consumption, as well as exhaust emissions of motor vehicles, is the main cause of searching for new and high-performance products in this area. Composite materials are the most promising technology. The composite leaf springs, applying as part of the elastic suspension system with high strength, load-carrying capacity, and lightweight, are one of the possible manners to achieve those goals inside of vehicles used for the carriage of goods. As an example, inside the manuscript, fabricated epoxy thermoset is blended with 10-50 wt.% of polysulfide rubber composites and reinforced with 10 wt.% of alumina powder. The characteristics of the copolymer composite blend were studied by performing ASTM mechanical tests, including tensile strength, impact strength, hardness, and damping ratio tests. Experimental test results showed that tensile strength, natural frequency, and damped ratio were decreased when the polysulfide rubber percent increase in contrast to tensile strength, which showed a noticeable decrement. From the second side, the reinforcement on the basis of alumina powder caused a weighty increase in tensile strength and natural frequency with a good improvement in deformation strength. Impact strength and damping ratio were maximized when alumina powder was added increasingly, while this increase was contrary to, causing a decrease in the hardness of reinforcement. The experimental results were optimized using the statistical methods. Design of the experiment and linear regression model used to select the most appropriate mixture inside the proposed composite material for leaf springs manufacturing. Finally, validation of the model was realized by application of the statistical method of analysis of variance and probability plots (normal distribution). The regression equations of tensile and impact strength, hardness, and damping ratio test results showed that the proposed composite material is suitable to be applied for manufacturing the leaf springs considering loadings and working conditions during exploitation of such vehicles in traffic. Finite element analysis on the basis of a finite element model of composite material was performed using SolidWorks Simulation 22. Mechanical software ANSYS 2022 R1 was used to study the mechanical properties of the leaf spring model fabricated of the proposed composite material. Finite element analysis results interpreted and showed significant reduction in leaf spring weight with very good mechanical properties considering tensile and impact strength, hardness, and damping ratio when using the proposed copolymer-reinforced composite material.
Keywords:
alumina
; ANSYS 2022 R1
; copolymer-reinforced composite material
; design of experiment
; leaf springs
; polysulfide rubber composites
; suspension system
; vehicles
1. Introduction
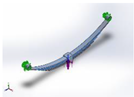
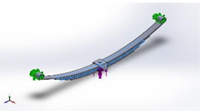
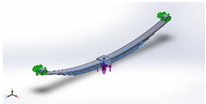
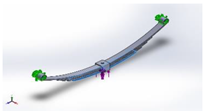
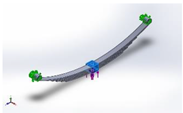
The design fundamentals of the vehicles in traffic concern the construction strength and passengers comfort while driving. Inside of vehicles used for the carriage of goods with an elastic suspension system consisting of leaf springs (light-duty trucks in this case), the payload characteristics, driver comfort, and vibration amplitude depend on leaf spring material characteristics. From that side, the main goal of the below-presented research is to find and interpret new composite material for leaf springs having lower weight and elasticity while keeping strength and toughness considerably good [1]. Generally, an elastic suspension system, as a linkage between wheels and vehicle body, absorbs vibration from road irregularity to enhance passenger comfort. Elastic suspension systems of light- and heavy-duty trucks usually consist of semi-elliptic leaf springs, specifically for rear axles. Leaf springs have many elliptical laminated elements called leaves, which are different in length. An initial curvature, or camber, is usually given to the leaf elements, starting from the master leaf, so that they flatten under loading during exploitation of trucks, (Figure 1).
The analysis of leaf springs is based on the theory of beams with uniform strength. The longest master leaf is bound by the other graduated leaves using straps [2,3].
In practice, a vast amount of strain energy could be stored using leaf springs, depending on its application and loading to enhance any rebound by releasing the energy [4].
Leaf springs are connecting with the axle and frame of the vehicle and its front eye is connected to the frame of the vehicle using a pin joint. To allow translational motion along the longitudinal axis of the vehicle, the rear eye end is suspended and connected with the frame by a flexible "U" link [5].
Many research works have been studied as a base start before defining leaf spring design consisting of composite materials having the appropriate strength and stiffness parallel to reducing the weight and cost of manufacturing.
Inside literature [6], the authors researched the structure design of experimental composite leaf springs, according to MATLAB calculation flow. Experimental and finite element method analyses (FEM) were realized for different spring dimensions in three points during the bending test. Simulation and experimental results confirmed that the bending stiffness of the experimental leaf spring was adequate for vehicle application.
The group of researchers, as an example, designed and manufactured a composite-based mono-leaf spring of polymer material with the goal to replace mono-leaf metal leaf springs of light-duty trucks. Software Abaqus was used for testing of experimental polymer materials with reinforcement in the form of fiber. After the comparison of simulated mechanical properties, it was confirmed the choice of a better mixture of materials. According to experimental test results of the prototype composite spring, achieved is 80% in weight reduction, as well as improvement in mechanical properties [7].
From the second side, in the scope of the automotive and aircraft industries, with the goal to achieve lower fuel consumption and higher frame strength, researched the possibilities regarding the change of standard chromium steel material SAE 5160 with polymer composite material reinforced with carbon fibers. In this case, Finite Element Analysis (FEA) is used, and the results of modeling are applicable for comparison of mechanical characteristics of both materials in the domain on flexural fatigue life and damages. Good results were achieved with composite materials, also [8].
Some researchers are concerned about the applicability of springs consisting of hybrid composites with integrated carbon and flax fibers in the form of reinforcements (primary and secondary). The main advantage is regarding the fact that the composite leaf spring has a 93% higher natural frequency compared to a leaf spring consisting of steel material. By this manner, the coefficient of safety increased, as well as the damping coefficient of leaf springs [9].
Exists and studies regarding the dynamic behavior of so-called CFRP leaf springs. The analysis of the experimental model was used for the investigation. The steel spring was used as a reference in comparing the impact and shaker test excitation at different temperatures. The results showed damping increase at lower temperatures, and it was greater for composite materials than steel springs [10].
There is also research regarding the application of glass fiber-reinforced polyester composite leaf springs with aluminum oxide and silicon carbide as fillers. More experimental and numerical results were available from studies of the bending of leaf springs. The results showed an improvement in bending characteristics and strength when a specific amount of filler was applied [11].
Generally, as an introduction into research, extensive work has been conducted on the application of composite materials in the production of leaf springs. Even though the fiber-reinforced polymeric matrix enhanced strength and flexibility, the blending of polysulfide rubber composites (PS) with rigid polymer (epoxy) proved to enhance strength and flexibility. The additional improvement when reinforced with high compressive strength alumina powders (AL).
The novelty of this research lies in the limited or rare investigations into the blending of PS reinforcing it with AL powder specifically to improve strength, toughness, and flexibility, making it a promising candidate for leaf spring manufacturing.
2. Materials and Methods
For the purpose of the experiment, the designed spring composite materials consist of the copolymer matrix and the reinforcement. The matrix is a blend of two materials, epoxy and PS. The first matrix material is Swancor 901; Epoxy Vinyl Resins Polymer from Swancor Ind. Co., Ltd. Company (origin from China), and the second material is Polyseal PS (origin from India), a two-component joint sealant with 10-50 wt.%. The reinforcing material is AL powder with 99.5% purity from Accuratus Corp. (USA). Mechanical properties of the experimental material are shown in (Table 1).
2.1. Experimental Procedure
During the experiment, to prepare the composite, a weighted amount of PS was mixed with weighted epoxy resin using the ultrasonic device for 30 min to have good blending of the components. The amount of 10% AL was heated to 100 °C and added to the blend, then mixed for 1 h using the ultrasonic device to ensure homogeneous dispersion of all components. The hardener of epoxy and PS, according to the mixing percentage, was added to the blend. The reinforced blend was then poured into a mold-released, wax-coated system, and the upper plate was covered with heavy weights to reduce bubbles and ensure a smooth surface. After the curing process was completed for three days; the composite was kept in a 60 °C oven for 1 h to extract air bubbles. The obtained cast was cut according to ASTM method samples. Table 2 shows the composite material percentages used during experimental research.
Experimental tests were realized to study the mechanical properties of composite materials (142 samples). Tensile and compression tests of plastic material were realized according to standard ASTM D638 by using the Tinius Olsen H50K-T UTM tensile tester (144 samples of composite material), (Figure 2; a,b) [13,14].
The standard test method according to ASTM D-256 was performed by using the (XJU-22 D IZOD) impact testing machine (manufacturer: Jinan Liangong Testing Technology Co., Ltd). In that manner, the impact strength of the composite samples was studied (Figure 2; c, d). A hardness test according to standard (ASTM D 2240) was performed by averaging the three readings using a Shore A digital hardness tester (manufacturer: AFFRI Inc.).
The hammering force in the impulse damping test was used to strike the composite material samples and examine the behavior under dynamic conditions, simulated during experimental researches. The piezoelectric charge accelerometer (B&K type KISTLER 4371 with charge sensitivity of 9.8 pC/g ±2% at 159.2 Hz; as charge per unit of acceleration) was used to measure the induced motion according to the ASTM E 756-05 standard for material damping properties, (Figure 2e,f). Conditioning signal amplifier and NEXUS control software type 7749 recorded the signal and transformed it into a digital storage by using the Instek GDS-810C 100 MHz Digital Storage Oscilloscope, manufactured by B&K, to analyze the obtained signal. Natural frequency was recorded using the SIGVIEW, signal analysis software package v2.6 program from FFT function readings. Figure 2 below shows tensile, damping, and impact blend and composite samples before and after performed experimental testing.
3. Results
3.1. Experimental Test Results
Tensile strength test results in (Table 3) were used to evaluate the composite material's flexibility and strength (which is maximum for the N5 sample), while the modulus at fracture (which is maximum at the N1 sample) was calculated due to its importance in leaf spring design [15]. It can be seen that the addition of PS caused a reduction in maximum stress and modulus at fracture while the maximum strains per cent were increased. Alumina powder addition caused a significant increase in maximum stress and modulus at fracture due to hard particles of AL imparting strength to the polymeric blend.
Impact test results in (Figure 3) show that increasing the PS percentage with the addition of AL caused a continuous increase in impact strength because PS flexibility absorbed impact energy and AL reinforcement improved the stiffness of the material mixture, which in turn enhanced the impact strength.
Analyzing the hardness as one of test results, (Figure 4) shows that all composites have higher hardness than the mixtures because of the dense network and hardness of AL particles within the epoxy matrix.
AL reinforcement of the blend enhances dissipation of vibrational energy ability by absorbing energy, which in turn increases the composite damping characteristics [17].
Figure 5 shows that the natural frequency of (N1-AL) mixture is the maximum because of the addition of PS and AL increased the density and weight inside of the composite material. Parallel, N5 has the minimum natural frequency due to the absence of AL and the increasing ductility effect of a high percent of PS.
Figure 6 shows that the damped frequency of (N1-AL) and N1 is maximum because of low percentages of PS, while N5 has the minimum value due to the effect of PS with ductile properties on the copolymer's composite stiffness.
In contrast to damped frequency, logarithmic decrement has the maximum value in the N5 copolymer because of a high percentage of rubbery PS, while N1 has the minimum value. PS flexibility and ductile properties increase the composite energy absorption and, in turn, increase logarithmic decrement (see Figure 7).
Figure 8 shows that the maximum value of the damping ratio in (N5-AL) is because of a high percentage of ductile PS with the AL effect of dissipating energy through internal friction or hysteresis effects. Conversely, AL reduces the damping ratio if the composite is harder, leading to less energy dissipating.
3.2. Optimization of the Experimental Results
The statistical methodology, Design of the Experiment (DOE), is used to analyze, plan, conduct, and understand the experimental results, which include many variable factors [18]. Factors affecting the process of mixing two polymers (epoxy and PS) and reinforcing the resulting blend with AL powder were optimized using a general linear regression model (GLM). The framework of DOE commonly employed GLM. When the response is linearly related to many input factors since multiple linear models are used [19]. Analyzing the data and studying the relation between the input factors and the resulting responses using the first order equation below:
where are:
Y = β0+ β1x1+ β2x2+ βexe+εf
Y − response variable;
β0 − intercept;
β1, β2, βe − coefficients of the factors x1, x2, xe;
εf − error term.
Using GLM, evaluate the coefficient β values and estimate their statistical significance and predict the response of variables for many combinations of factor levels [20].
Similarly, when an interaction term is added to a first-order model in two variables in equation (1) above, then the model is:
where are:
- ;
- .
Estimating the parameter when the least square normal equation and matrix approach are derived, the fitted regression model is:
Experimental results were used to build a fitted regression model of GLM, and the analysis of variance (ANOVA) and the probability plots were used to study each component's effect on the composite mechanical properties [21].
ANOVA tables show that the P-value of the tested model is valid for damped and natural frequency, damping ratio, impact strength, and hardness with a stronger value in PS with some variation in the AL source. The P-value of the logarithmic decrement showed a smaller value in PS, while it is not significant in epoxy and AL sources. Meanwhile, the AdjMS (Mean squares - adjusted) and AdjSS (Sums of squares - adjusted) show that the fitted model is a good fit for model data. The AdjMS values of epoxy are maximum values in natural and damped frequency, hardness, and impact strength, meaning that it has the larger outcome with strong evidence of valid model data. While the AdjMS values of PS are maximum in logarithmic decrement and damping ratio, indicating that PS has a larger output in these responses, as shown in (Table 4).
The probability plots of mechanical test results are in (Figure 9). As can be noticed from these figures, all the points of the analyzed data values are located in a straight line or near it, and this indicates the normal distribution of the obtained data with a standard distribution with a fit illustration model.
Using the obtained data of the experimental test results to build the GLM showed the following equations, which describe each response in accordance with the affecting factors. The regression equation of GLM for natural frequency is:
Natural frequency = 13.744 + (0.984 epoxy_1) + (1.476 epoxy_2) + (0.984 epoxy_3) + (1.476 epoxy_4) – (0.984 epoxy_5) + (3.39 PS_1) + (2.53 PS_2) – (0.41 PS_3) – (2.164 PS_4) – (4.184 PS_5) + (0.076 AL_1) + (0.176 AL_2) – (0.164 AL_3) – (0.084 AL_4) – (0.004 AL_5)
The regression equation analysis of natural frequency showed that increasing epoxy percentage caused an increase in natural frequency, and increasing PS percentage led to a decrease in natural frequency with a maximum value of (3.396).
The further increase in PS causes a decrease in the natural frequency of (-4.184). The (0.076) and (0.176) increments in natural frequency in N1-AL_1 and N2-AL_2 while the reinforcement caused a reduction in natural frequency of (-0.164), (-0.084), and (-0.004). The regression equation of GLM for damped frequency is:
Damped frequency = 12.915 – (0.683 epoxy_1) + (1.025 epoxy_2) – (0.683 epoxy_3) – (1.025 epoxy4) – (0.683 epoxy_5) + (3.461 PS_1) + (2.545 PS_2) + (0.397 PS_3) – (2.027 PS_4) – (4.37PS_5) + (0.13 AL_1) + (0.129 AL_2) – (0.08 AL_3) – (0.179 AL_4) – (0.001 AL_5)
The regression equation of damped frequency showed an increase of 1.025 in N2, while all other composites showed a decrease in damped frequency. The addition of PS caused an increase of 3.461, 2.545, and 0.397 in damped frequency with a (-2.027) decrease in the N4 sample. The addition of AL to N1 and N2 samples showed an increase in damped frequency of 0.133, and 0.129, while the other samples have a reduction effect in damped frequency. The regression equation of GLM for the damping ratio is:
Damping ratio = 0.071720 – (0.00472 epoxy_1) + (0.007 epoxy_2) – (0.004 epoxy_3) + (0.007 epoxy_4) – (0.0047 epoxy_5) – (0.021 PS_1) – (0.004 PS_2) + (0.0026 PS_3) + (0.011 PS_4) + (0.012PS_5) – (0.001 AL_1) + (0.001 AL_2) – (0.0009 AL_3) – (0.0018 AL_4) – (0.0007 AL_5)
Analyzing the regression equation of the damping ratio showed that decreasing the epoxy percent led to a decrease in the damping ratio while PS had the opposite effect. The addition of AL to N2 showed an increase in the damping ratio in spite of the decrease in the damping ratio of the other composite. The regression equation of GLM for logarithmic decrement is:
Logarithmic decrement = 0.6614 – (0.0218 epoxy_1) + (0.032 epoxy_2) – (0.0218 epoxy_3) + (0.032 epoxy_4) – (0.021 epoxy_5) – (0.189 PS_1) – (0.05 PS_2) + (0.028 PS_3) + (0.046 PS_4) + (0.165 PS_5) – (0.017 AL_1) + (0.008 AL_2) – (0.0274 AL_3) + (0.034 AL_4) + (0.002 AL_5)
Studying the regression equation of logarithmic decrement showed a fluctuating effect of epoxy on logarithmic decrement with a positive trend in the N2 sample. PS addition in N1 and N2 showed a decrease of (-0.1894) and (-0.0514), while other samples showed an increase of 0.0286, 0.0466, and 0.1654 in N3, N4, and N5. The maximum increment in logarithmic decrement is in the N4-AL sample of 0.0342. The regression equation of GLM for impact strength is:
Impact strength = 44.12 – (13.12 epoxy_1) + (19.68 epoxy_2) – (13.12 epoxy_3) + (19.68 epoxy_4) – (13.12 epoxy_5) – (18.52 PS_1) + (1.68 PS_2) + (1.68 PS_3) + (5.88 PS_4) + (9.28 PS_5) – (2.52 AL_1) – (1.32 AL_2) + (1.48 AL_3) + (1.08 AL_4) + (1.28 AL_5)
The equation shows that impact strength increased when increasing PS while the epoxy effect fluctuated. AL has an increasing effect on impact strength [22]. The regression equation of GLM for hardness is:
Hardness = 77.684 – (11.54 epoxy_1) + (17.32 epoxy_2) + (11.54 epoxy_3) + (17.32 epoxy_4) – (11.54 epoxy_5) + (11.32 PS_1) + (7.88 PS_2) + (1.38 PS_3) – (6.56 PS_4) – (14.00 PS_5) – (1.02 AL_1) + (0.32 AL_2) + (0.52 AL_3) + (1.44 AL_4) + (0.20 AL_5)
The regression equation of hardness showed that epoxy has an increasing effect, while increasing PS led to a decrease in hardness. AL addition causes an increase in hardness.
To use these composite materials in manufacturing leaf springs, a proper percentage of composite components should be chosen. The high percentage of epoxy is beneficial in enhancing natural frequency, damped frequency, and hardness, while the addition of PS enhanced damping ratio, impact strength, maximum strain, and logarithmic decrement. AL has a beneficial effect in increasing tensile strength, modulus at fracture, and dynamic properties. The balanced composite properties found in N2-AL. These composite properties will be simulated using mechanical software version ANSYS 2022 R1.
4. Finite Element Analysis of the Composite Material
Investigating the composite materials characteristics in the base of their responses to the applied loads of experimental tests, noticeable properties have been noticed for the N2-AL composite. The FEM model was used to identify the N2-AL properties as input parameters for simulation. ANSYS 2022 R1 software, in particular, was used to perform the composite leaf spring simulation. The specifications of the composite multi-leaf spring of the vehicle Toyota Hilux are in (Table 5).
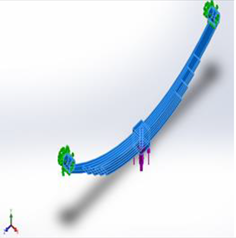
The two ends of the main leaf were constrained as fixed geometry when the applied load of 4000 N was applied at the bottom end of the box. All leaf mates were connected as parallel and coincidentally according to their motion. The constraints and applied loads were applied, and meshing the model shown in (Figure 10).
The meshing was performed with fine curvature based on four Jacobian points with a maximum element size of 15.3179 mm and a minimum element size of 5.10591 mm. Total nodes were 3728, and total elements were 9504 with a maximum aspect ratio of 5.7982. Linear dynamic analysis was chosen to study the modal behavior of the composite leaf spring with the specifications listed in (Table 6).
5. Finite Element Analysis Results
Figure 11 shows the von Mises stress of the leaf spring with a maximum value equal to (1.765x10⁷ Pa), which is less than the maximum stress of the N2-AL composite sample, which is equal to (131x10 Pa). That refers to exhibiting less stress and enduring harder applied loads upon working due to the presence of PS that impart ductility to the composite and the ceramic alumina with hard particles that enhance tensile strength.
The maximum value of the resultant displacement is equal to 34.0643 mm at the main leaf ends, as shown in (Figure 12). Due to the sudden change in leaf geometry and the type of loadings [23]. The end connection with rotating parts of the vehicle led to concentrated stress at the main leaf ends.
The resultant strain of the composite model is maximum at the main leaf ends, as shown in (Figure 13). The composite leaf spring geometry variation in thickness, curvature, and width affects the distribution of strain, leading to higher strains at the leaf spring ends in addition to the deformation in each leaf, which might add to each other, causing a cumulative effect.
Strain energy density as a measure of stored energy per unit volume due to deformation is shown in (Figure 14). Its maximum value is equal to 268.616 Nm/m³ at the position near to the leaf spring ends since the deformation is important. Having no degree of freedom in movement in the end of the spring led to exerting more loads on the spring's flexible leaves.
Modal analysis is a method used to find the structure's dynamic behavior, including mode shapes, natural frequency, and damping ratio [24]. Figure 15 shows the first six mode shapes. In these modes, the maximum deformations were at the center of the leaves, while the ends experienced no deformation due to the applied constraints. The first mode shape of the lowest natural frequency shows the uniform bends of the entire leaf spring in one direction, leading to comfort in riding with some primary dynamics, while the second mode shape at moderate frequencies shows a single node bend along its length with secondary vibration. The third mode shape at frequencies higher than the second mode deforms in a complex wave shape because it is bent with two nodes that localize the stresses causing vibrational effects with noise. The fourth mode shape shows three nodes bending with a complicated wave pattern. Springs at this mode shape may experience resonant frequencies at extreme conditions. This mode shape is not practical for operational dynamics, and it is not preferred. The two other modes shapes show deforming in more complex waves at more than three nodes, which are not practical for operating conditions.
The constraints and the boundary condition of the leaf spring led to the movement in accordance with the degree of freedom that can be reached.
Table 7 shows the resonant frequency of the first five mode shapes with the time period of each mode. Calculating resonance frequencies to avoid them for more reliable performance of the leaf springs
6. Weight Reduction of the Composite Material
One of the most effective variables in selecting leaf spring material is weight reduction, which leads to reduced fuel consumption, saving the environment and saving money. Composite material weight can be calculated by calculating the density of the composite using the rule of mixtures as below multiplied by volume [25].
The copolymer and the composite density in supplementary (Table 8) show that the addition of PS and AL increased the copolymer and the composite density because these two materials have a larger density than epoxy, and the crosslinking of the composite materials increases its density [26,27].
Table 9 shows the FEM comparison of mass, volume, and weight of each component of the composite leaf spring and traditional steel spring, showing the advantages of using composite materials considering light weight. The total weight of each component of the steel leaf spring is 18.05 kg. The total weight of each component of the experimental composite (N2-AL) leaf spring is 3.33 kg.
Weight reduction when composite material was used is 81%, which is a manufacturing demand in the transportation industry.
The effective mass participation factor (EMPF) is the percentage of the mass of the system participating in a specific mode. EMPF is a measure of how much energy is contained in each mode, considering the effective mass of the system, not the true mass [28].
EMPF of the FEM model composite leaf spring model is in (Table 10), showing that in mode 1, and the significant movement in the X direction is with 86.3% of the system mass participating. The movement in two other axes can be considered null. Mode 2 movement in the Z direction with 24.3% of the system mass participating, and the two other axes are considered null. About 73.5% of the system mass is participating in mode 3 with movement in the Y direction, and the other axis movement can be neglected. Mode 4 shows 0.019% system mass participating in the y direction, which is the smallest mass participation in the first five modes. About 20.19% of the system mass participates in the movement in the y direction. Mode 1 is a mode with large mass participation, so it is a significant contributor to the system response [29].
7. Conclusions
Because of their high strength, low density, and high stiffness, advanced composite materials are the most popular materials. Using the composite materials of epoxy PS reinforced with AL in manufacturing leaf springs substantiates to be a promising approach for enhancing strength, durability, and weight reduction while maintaining optimal performance under dynamic loading conditions.
The comparative mechanical properties result of the composite materials compared with traditional steel considering tensile strength since N1-AL has maximum stress equal to 145 MPa.
The maximum impact strength of N5-AL composite equal to 113 J/m while the minimum value equal to 12 J/m of N1 showed the significant of blending epoxy and the composite.
Hardness and damping characteristics showing the development of harder and stronger, lighter, and more durable materials.
Using composite materials with high mechanical properties has a noticed impact on industrial fields such as aerospace, automotive, and marine, since composite materials might reduce fuel consumption and emissions.
A significant weight reduction compared to steel led to less cost with comfortable riding.
FEM model results showed that von Mises stress, resultant strain, and displacement are fairly good to withstand the applied loads considering the applied working conditions of the designed composite materials.
Mode shapes of the composite leaf spring were studied, and the natural frequencies were listed to approve the validity of the used materials compared to steel.
A further investigation of working conditions of the leaf spring with carbon fiber as secondary reinforcement materials to epoxy polysulfide copolymer is essential for expanding the application of the composite materials in manufacturing leaf springs.
An important contribution of the work is the database, whose statistical processing can be used to perform optimizations and spring material selection with minimal savings of time and resources. In addition to the Taguchi method, other methods can be applied, such as TOPSIS, etc. [30].
Author Contributions
Conceptualization, E.E.K. and S.M.; methodology, E.E.K. and A.M.A.; software, E.E.K.; validation, A.M.A. and B.S.; formal analysis, A.M.A., M.R. and S.S.; resources, B.S., E.E.K. and S.M.; writing—original draft preparation, B.S. and S.M.; writing—review and editing, M.R. and S.M.; supervision, B.S., S.M. and SS.; funding acquisition, M.R. and S.M. All authors have read and agreed to the published version of the manuscript.
Funding
N/A.
Institutional Review Board Statement
N/A.
Informed Consent Statement
N/A.
Data Availability Statement
N/A.
Acknowledgments
E.E.K. and A.M.M. like to acknowledge the University of Diyala, College of Engineering—Engineering Materials department for technical support.
Conflicts of Interest
The authors declare no conflict of interest.
References
- Sivasankar, A.; Ramanathan, B. Design and Numerical Investigation of Static and Dynamic Loading Characters of Heterogeneous Model Leaf Spring. Int. J. Mech. Eng. Res. (Special Issue) 2015, 5(1), 143-162.
- Triveni, Z.; Babu, B. A. Finite Element Analysis on Leaf Spring Made of Composite Material. Int. J. Adv. Sci. Res. Eng. 2016, 5(4), 542–552. [Google Scholar]
- Nikola Nešić et al 2022 IOP Conf. Ser.: Mater. Sci. Eng. 1271 012030. [CrossRef]
- Noronha, B. , Yesudasan, S. & Chacko, S. Static and Dynamic Analysis of Automotive Leaf Spring: A Comparative Study of Various Materials Using ANSYS. J Fail. Anal. and Preven 2020, 20, 804–818. [Google Scholar] [CrossRef]
- Edan Kader, E.; Adwan, R.; Yousuf Zedan, L. Fabrication of hybrid composite materials leaf spring. J. Mech. Eng. Res. Dev. 2021, 44(2), 132–140. [Google Scholar]
- Ma, L.; He, J.; Gu, Y.; Zhang, Z.; Yu, Z.; Zhou, A.; Tam, L.-h.; Wu, C. Structure Design of GFRP Composite Leaf Spring: An Experimental and Finite Element Analysis. Polymers 2021, 13, 1193. [Google Scholar] [CrossRef] [PubMed]
- Oztoprak, N.; Gunes, M.; Tanoglu, M.; Aktas, E.; Egilmez, O.; Senocak, C.; Kulac, G. Developing polymer composite-based leaf spring systems for automotive industry. Sci. Eng. Compos. Mater. 2018, 25(6), 1167–1176. [Google Scholar] [CrossRef]
- Loganathan, T.G.; Kumar, K.V; Madhu, S. Flexural and fatigue of a composite leaf spring using finite element analysis. Materials Today: Proceedings 2020, 22, 1014–1019. [Google Scholar] [CrossRef]
- Varma, N.; Ahuje, R.; Vijayakumar, T.; Kannan, C. Design and analysis of composite mono leaf spring for passenger cars.” Materials Today: Proceedings 2021, 46(17), 7090-7098. [CrossRef]
- Krall, S.; Zemann, R. Investigation of the Dynamic Behaviour of CFRP Leaf Springs. Procedia Engineering 2015, 100, 646–655. [Google Scholar] [CrossRef]
- Howida, M.; Aly, M. F.; Shokry, A. Numerical and Experimental Characterization of Composite Leaf Spring Subjected to Bending. J. Mech. Eng. Res. Dev. 2020, 43(2), 371–383. [Google Scholar]
- Adwan, R.; Edan Kader, E.; Yousuf Zedan, L. Experimental analysis of composite materials leaf spring used in automotive. Diyala Journal of Engineering Sciences 2021, 14(4), 26–36. [Google Scholar] [CrossRef]
- Kader, E. E.; Abed, A. M.; Asaad, Lamyaa Mahde. Structural properties of Epoxy –polysulfide copolymer reinforced with silicon carbide powder. J of Mech. Eng.Res. and Develop. 2021, 44(4), 289-295.
- Radojković, M.; Stojanović, B.; Milojević, S.; Marić, D.; Savić, S.; Skulić, A.; Krstić, B. Square Openings as Sources of Stress Concentration in Parts of Machines and Devices. The. Vjesn. 2023, 30(2), 474–480. [Google Scholar] [CrossRef]
- Milojević, S.; Savić, S.; Mitrović, S.; Marić, D.; Krstić, B.; Stojanović, B.; Popović, V. Solving the Problem of Friction and Wear in Auxiliary Devices of Internal Combustion Engines on the Example of Reciprocating Air Compressor for Vehicles. Tehnički vjesnik 2023, 30(1), 122–130. [Google Scholar] [CrossRef]
- Suhas, Jaimon D. Q.; Hanumanthraya, R.; Vaishak, N. L.; Davanageri, Mahesh B. Investigation on different Compositions of E-Glass/Epoxy Composite and its application in Leaf Spring. IOSR-JMCE 2014, 11(1), ver. 5, 74-80. [CrossRef]
- Zhou, J.; Hu, C.; Wang, Z.; Ren, Z.; Wang, X.; Mao, K. Study on dynamic characteristics of leaf spring system in vibration screen. J. low freq. noise vib. act. control 2021, 40(4), 1818–1832. [Google Scholar] [CrossRef]
- Milojević, S.; Glišović, J.; Savić, S.; Bošković, G.; Bukvić, M.; Stojanović, B. Particulate Matter Emission and Air Pollution Reduction by Applying Variable Systems in Tribologically Optimized Diesel Engines for Vehicles in Road Traffic. Atmosphere 2024, 15, 184. [Google Scholar] [CrossRef]
- Edan, E.; Al-Ezzi, AS. Optimization and analysis of SiC reinforced copolymer blend composite structural springs. Proceedings of the Institution of Mechanical Engineers, Part E: Journal of Process Mechanical Engineering 2023, 0(0). [CrossRef]
- Milojević, S.; Stojanović, B. Determination of tribological properties of aluminum cylinder by application of Taguchi method and ANN-based model. J Braz. Soc. Mech. Sci. Eng. 2018, 40, 571. [Google Scholar] [CrossRef]
- Krishnaiah, K.; Shahabudeen, P. Applied Design of Experiments and Taguchi Method, PHI Learning Pvt. Ltd.: New Delhi, India, 2012; pp.22-27.
- Mittal, M. “Application of Taguchi Method for Optimization of Process Parameters in Improving the Productivity of Corrugation Operation.” International Journal of Research 2015, 2(10), 537-545.
- Milojevic, S.; Pesic, R. Theoretical and experimental analysis of a CNG cylinder rack connection to a bus roof. Int.J Automot. Technol. 2012, 13, 497–503. [Google Scholar] [CrossRef]
- Borhade, A. P.; Jayant, T. P. Dynamic Analysis of Steel Leaf Spring. Int. Res. J. Eng. Tech. 2014, 3(11), 306–310. [Google Scholar]
- Elsheltat, S.; Alshara, A.; Elshara,W. Modeling and Finite Element Analysis of Leaf Spring Using Pro-Engineer and ANSYS Softwares. In Proceedings of First Conference for Engineering Sciences and Technology (CEST-2018), Garaboulli, Libya, 25-27 September 2018.
- Kurniawan, P.; Andoko, A.; Sunu, P. W. Leaf spring type simulation with finite element method approach. IOP Conf. Ser.: Mater. Sci. Eng. 2021, 1034, 012015. [Google Scholar] [CrossRef]
- Karim, A.A.; Kader, E. E.; Hamod, A. A.; Abdulrahman, A. J. Mechanical properties of a hybrid composite material (epoxy-polysulfide rubber) reinforced with fibres. IOP Conf. Ser.: Mater. Sci. Eng. 2018, 433, 012050. [Google Scholar] [CrossRef]
- Khaleel, H. H.; Assaad, A. S.; Noor, H. D.; Nawfel, M. B. Modeling and analysis of leaf spring using finite elements method. Int. J. Mech. Eng. Technol. 2018, 9(6), 48–56. [Google Scholar]
- Mantilla, D.; Nelson, A.; Oscar, A.; Optimal design of leaf springs for vehicle suspensions under cyclic conditions. Ingeniare. Revista chilena de ingeniería 2022, 30(1), 23-36.
- Gajević, S.; Marković, A.; Milojević, S.; Ašonja, A.; Ivanović, L.; Stojanović, B. Multi-Objective Optimization of Tribological Characteristics for Aluminum Composite Using Taguchi Grey and TOPSIS Approaches. Lubricants 2024, 12, 171. [Google Scholar] [CrossRef]
Figure 1.
Leaf spring sketch.
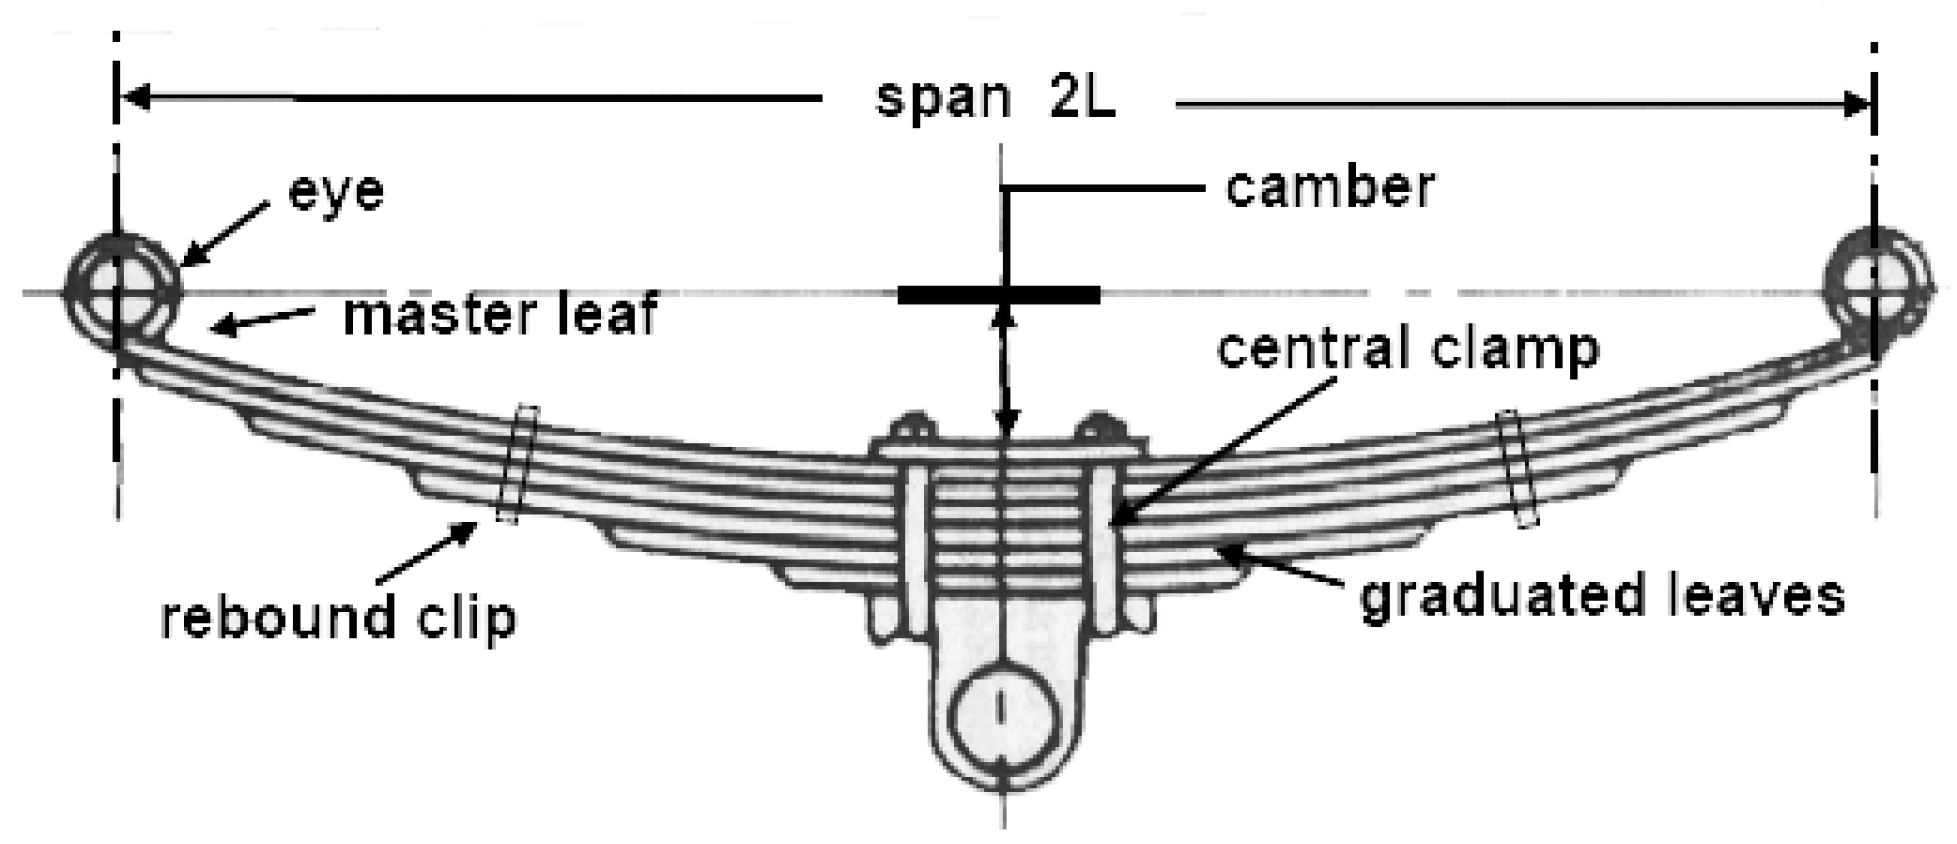
Figure 2.
(a, b) Tensile blend and composite samples; (c, d) impact blend and composite and (e, f) Camping blend and composite samples; before and after testing.
Figure 2.
(a, b) Tensile blend and composite samples; (c, d) impact blend and composite and (e, f) Camping blend and composite samples; before and after testing.
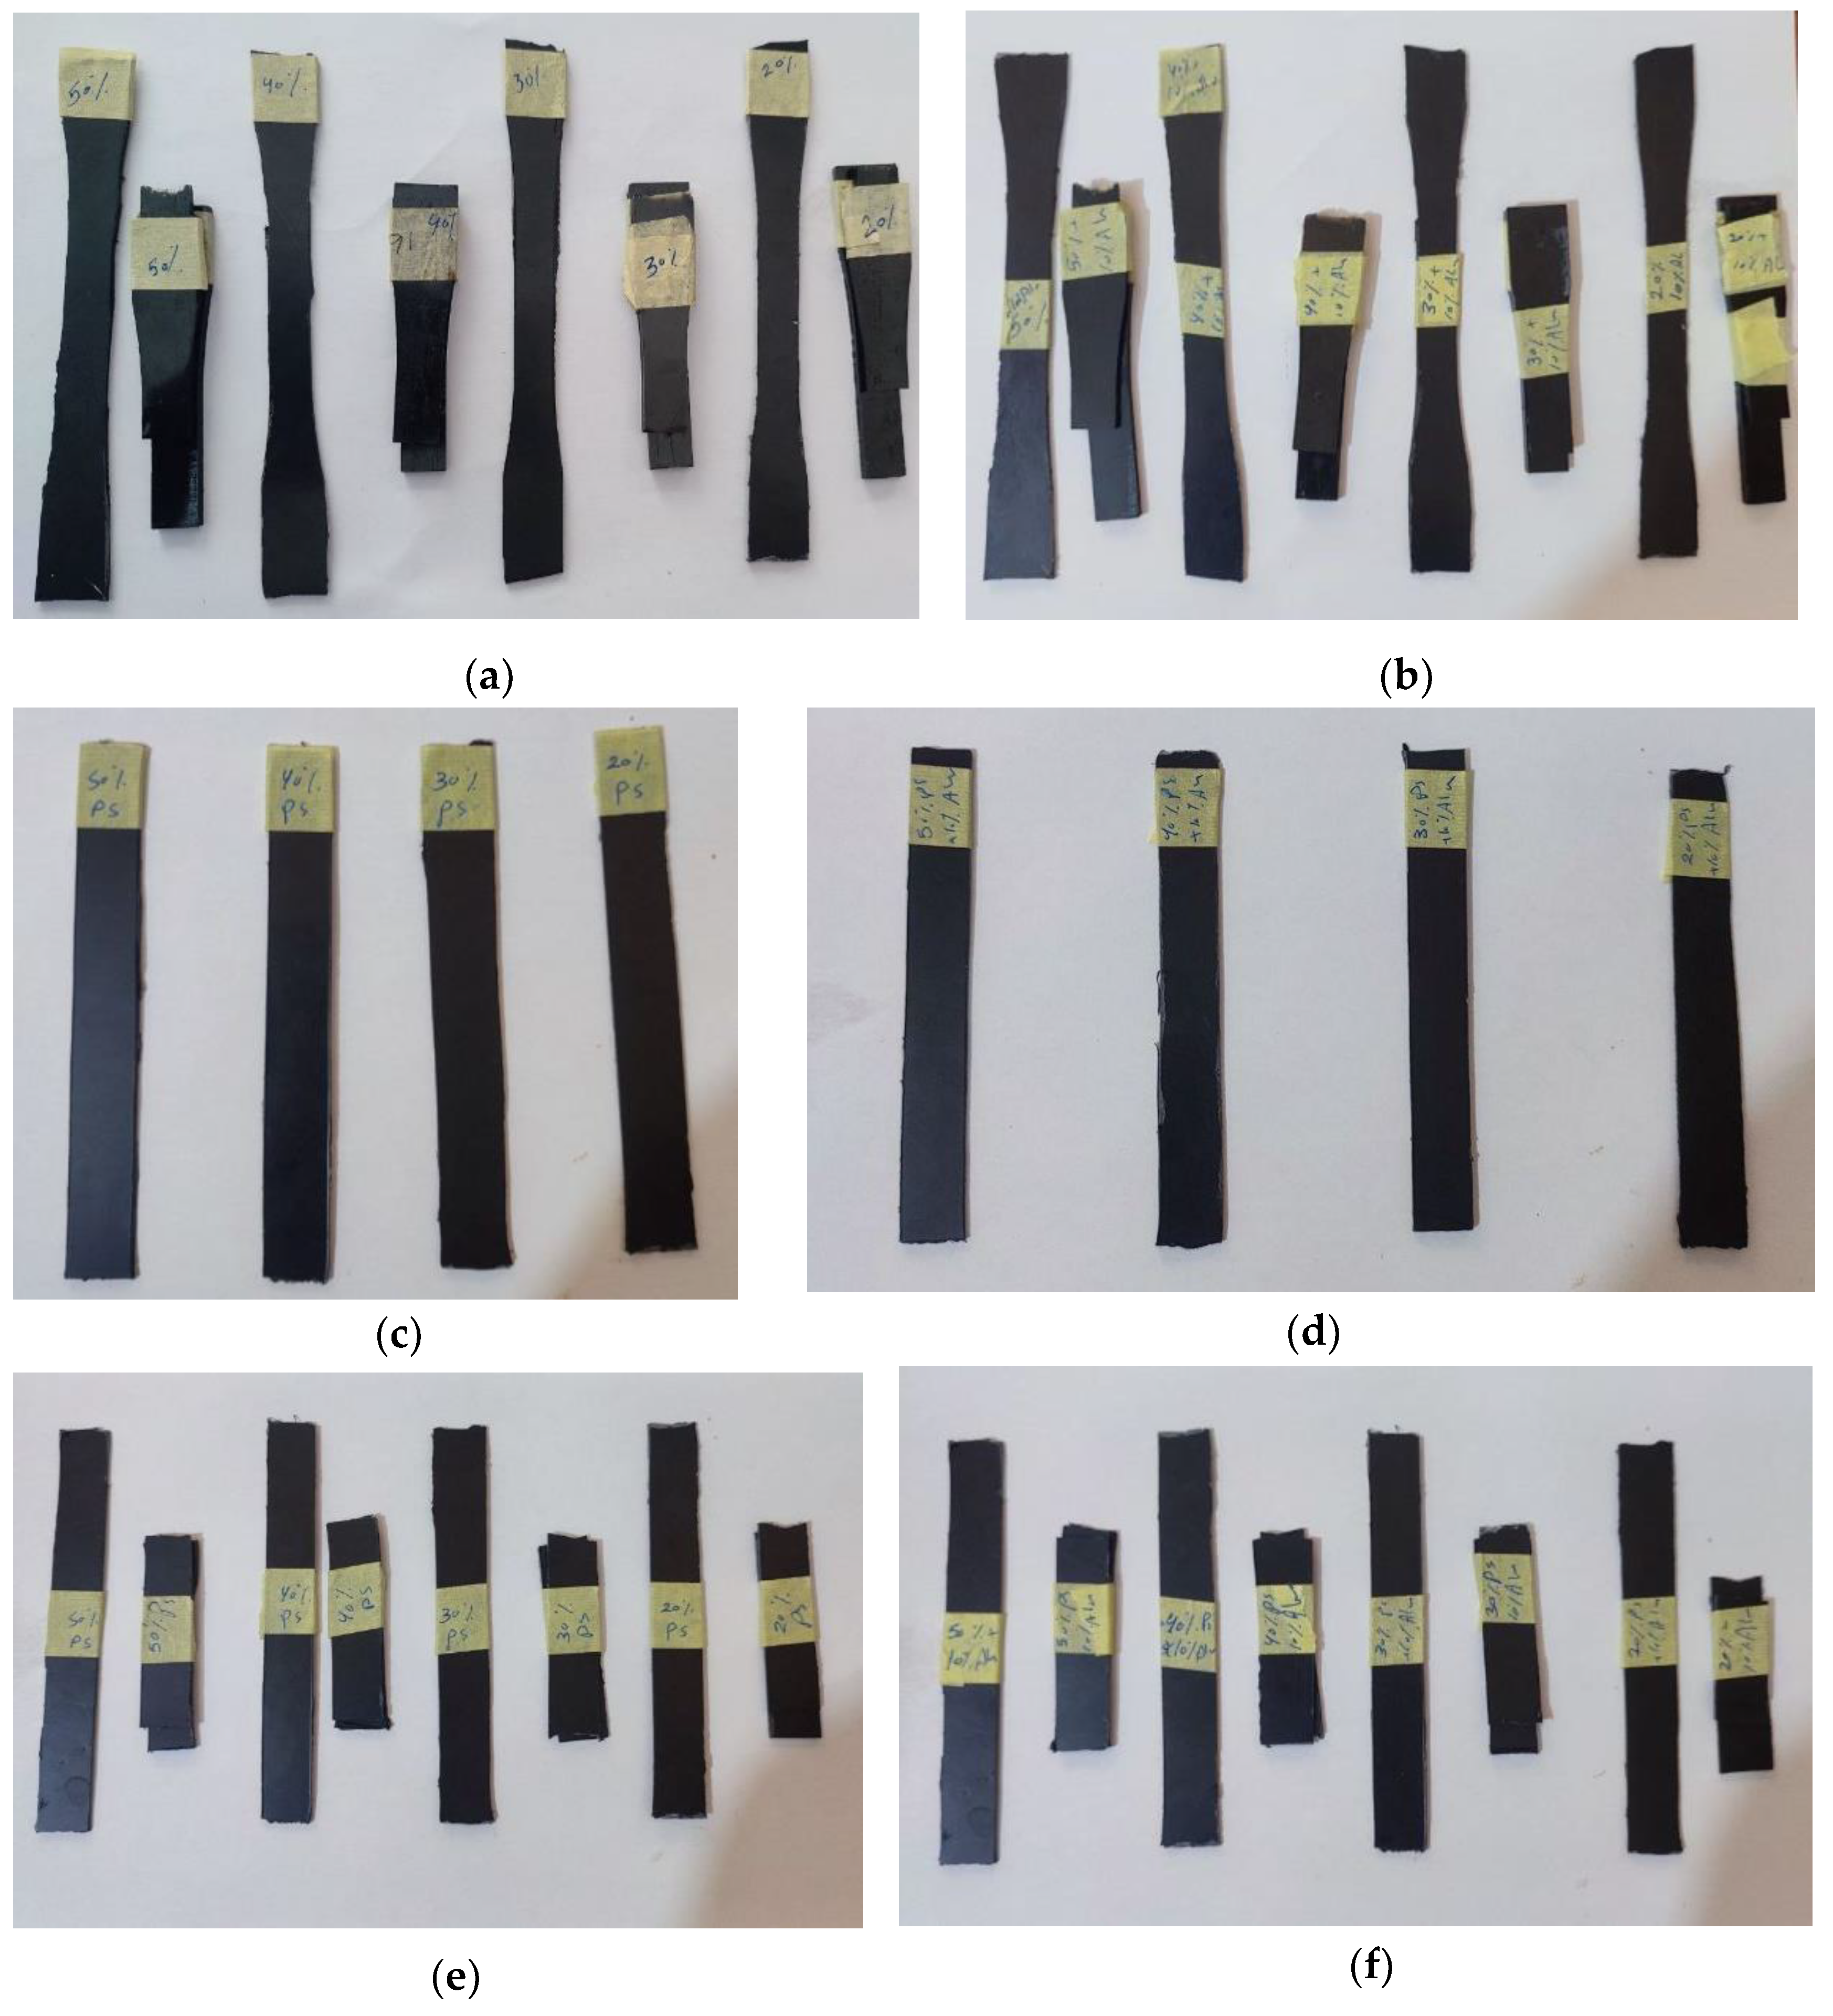
Figure 3.
Impact strength of the epoxy vs. PS and of the composite materials.
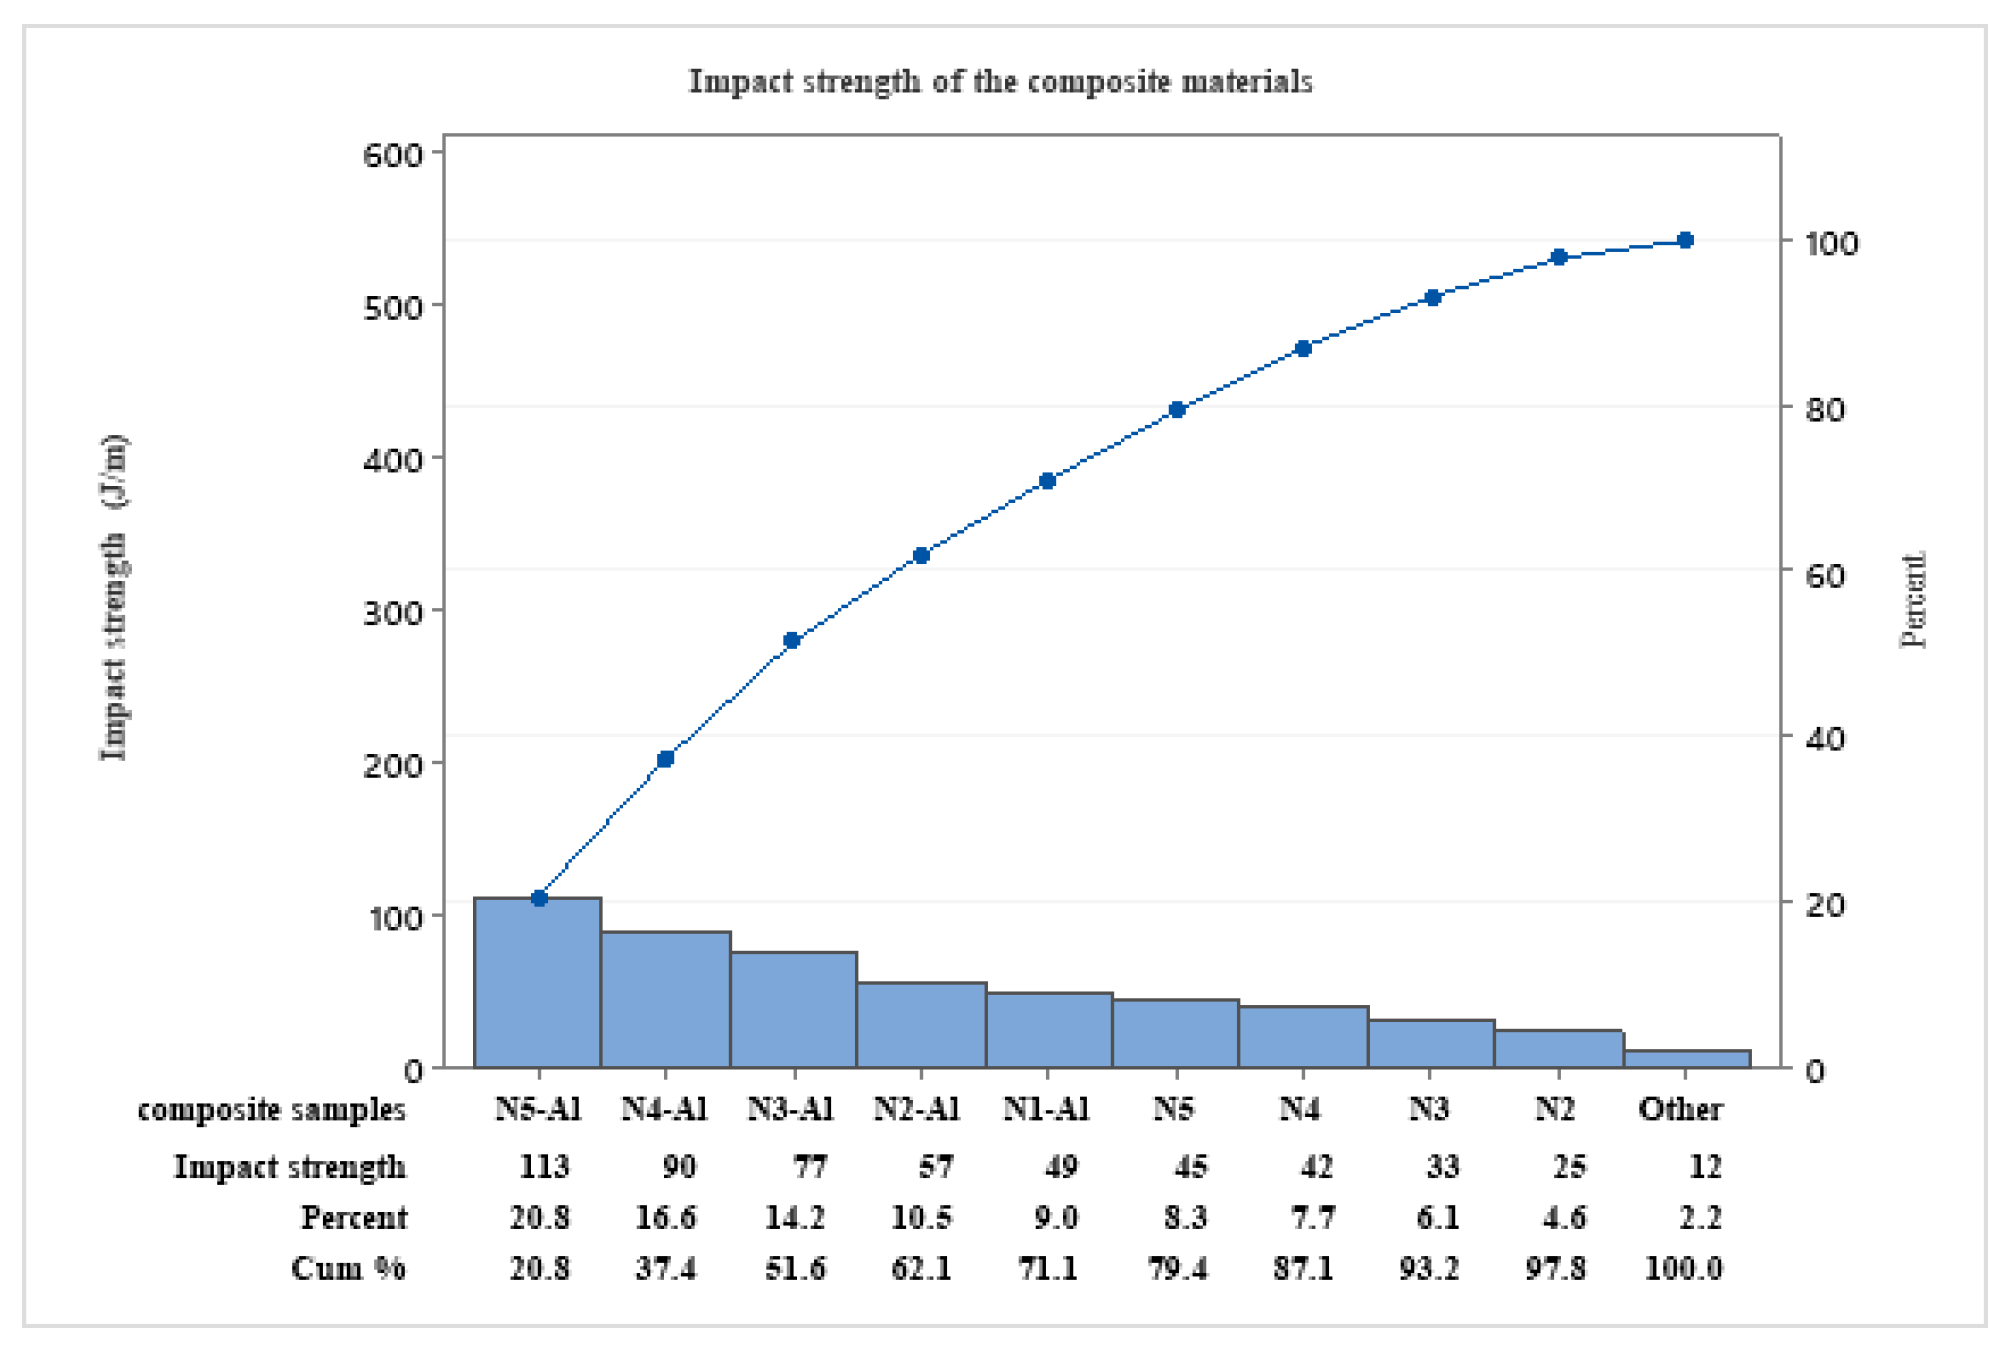
Figure 4.
Hardness of the epoxy vs. PS and of the composite materials.
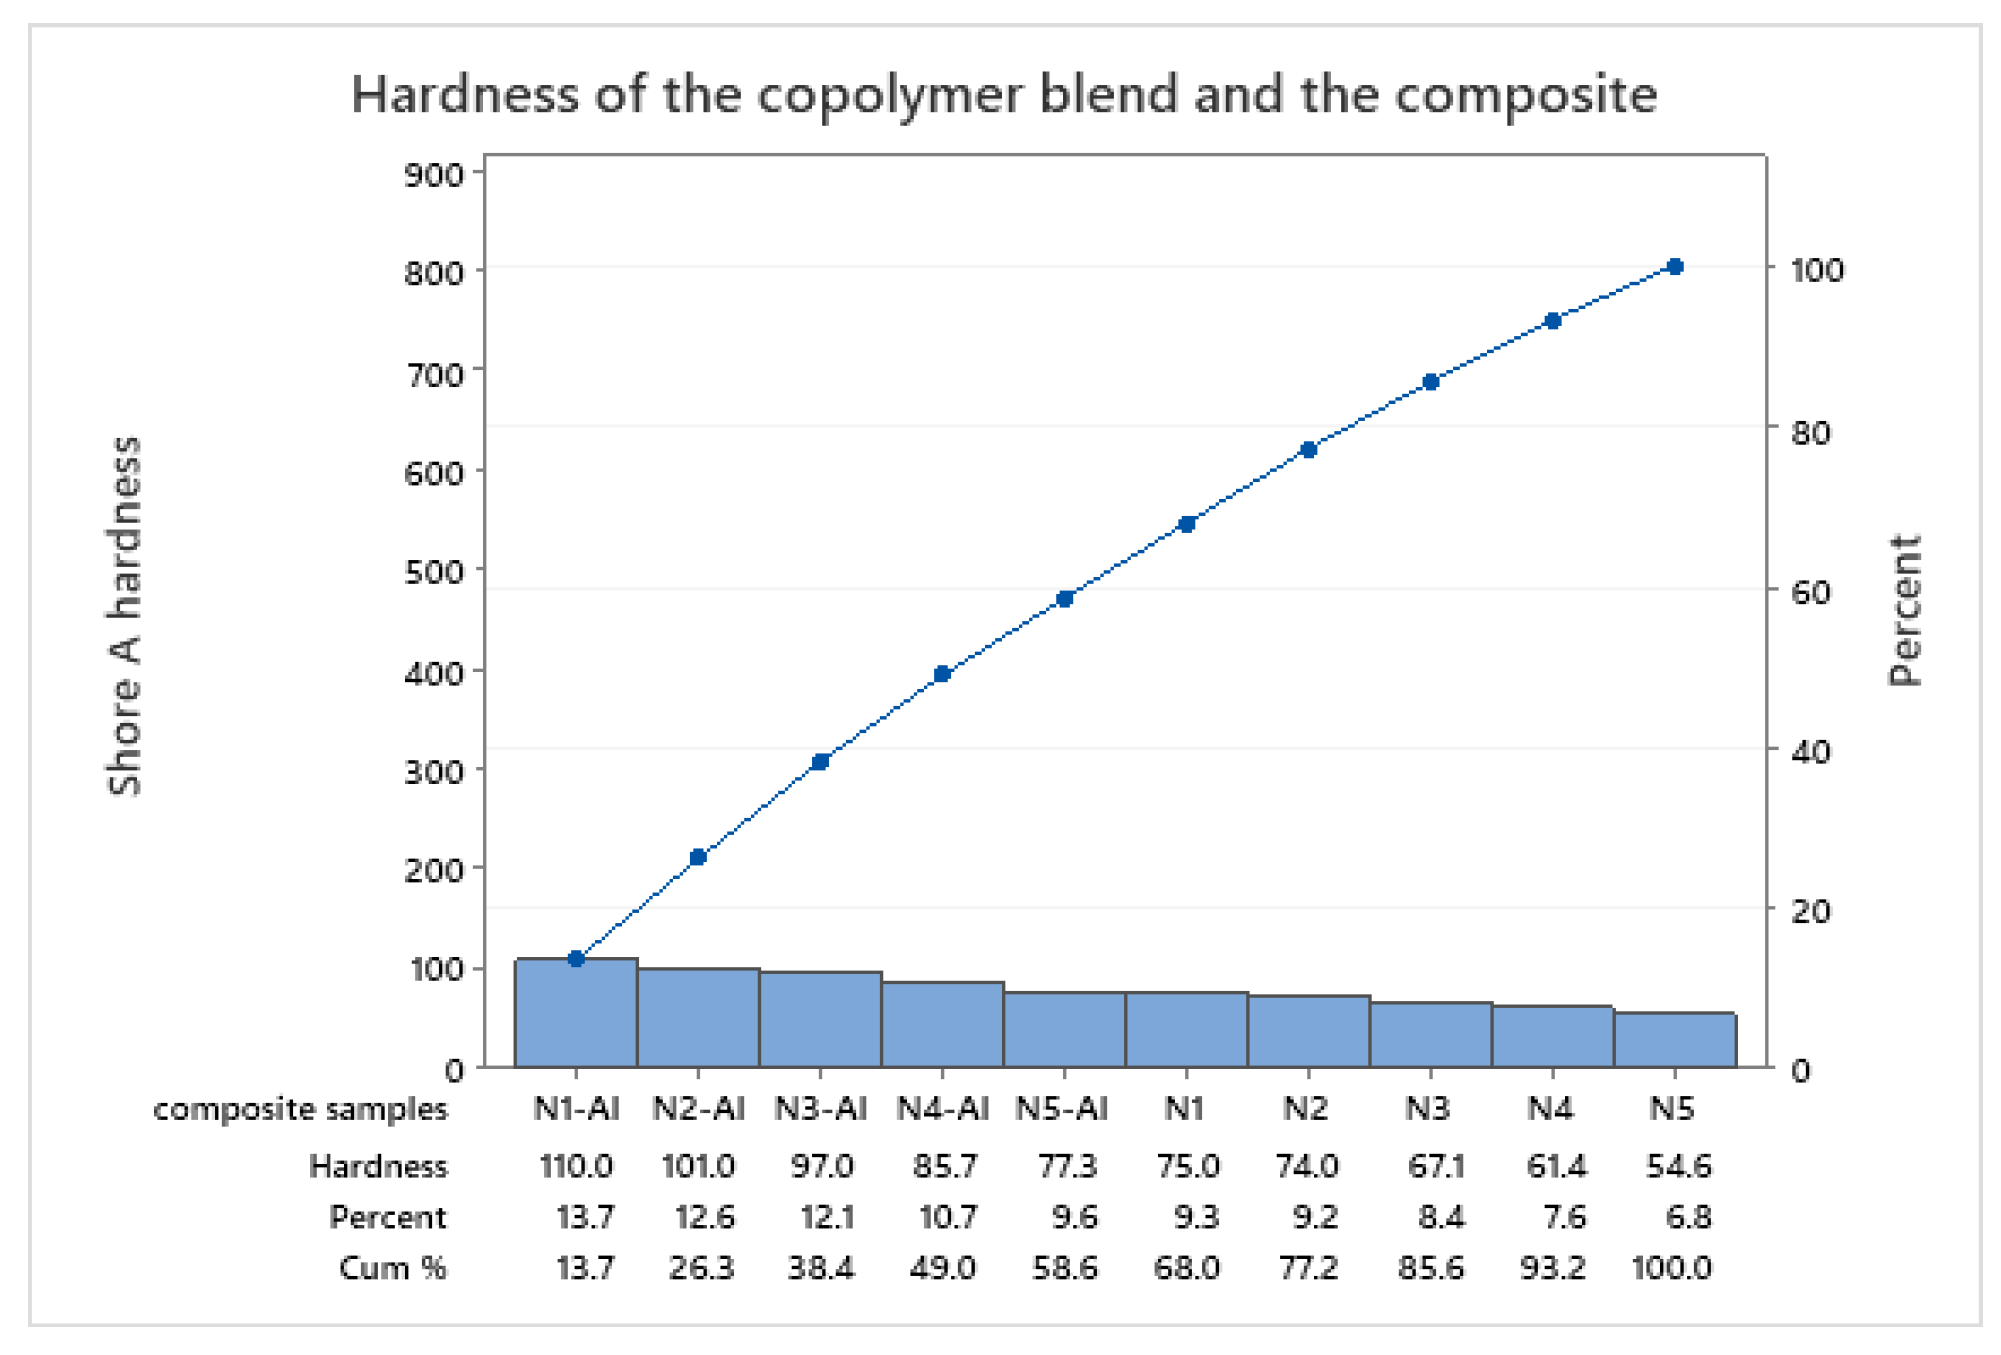
Figure 5.
Natural frequency of the epoxy vs. PS and of the composite materials.
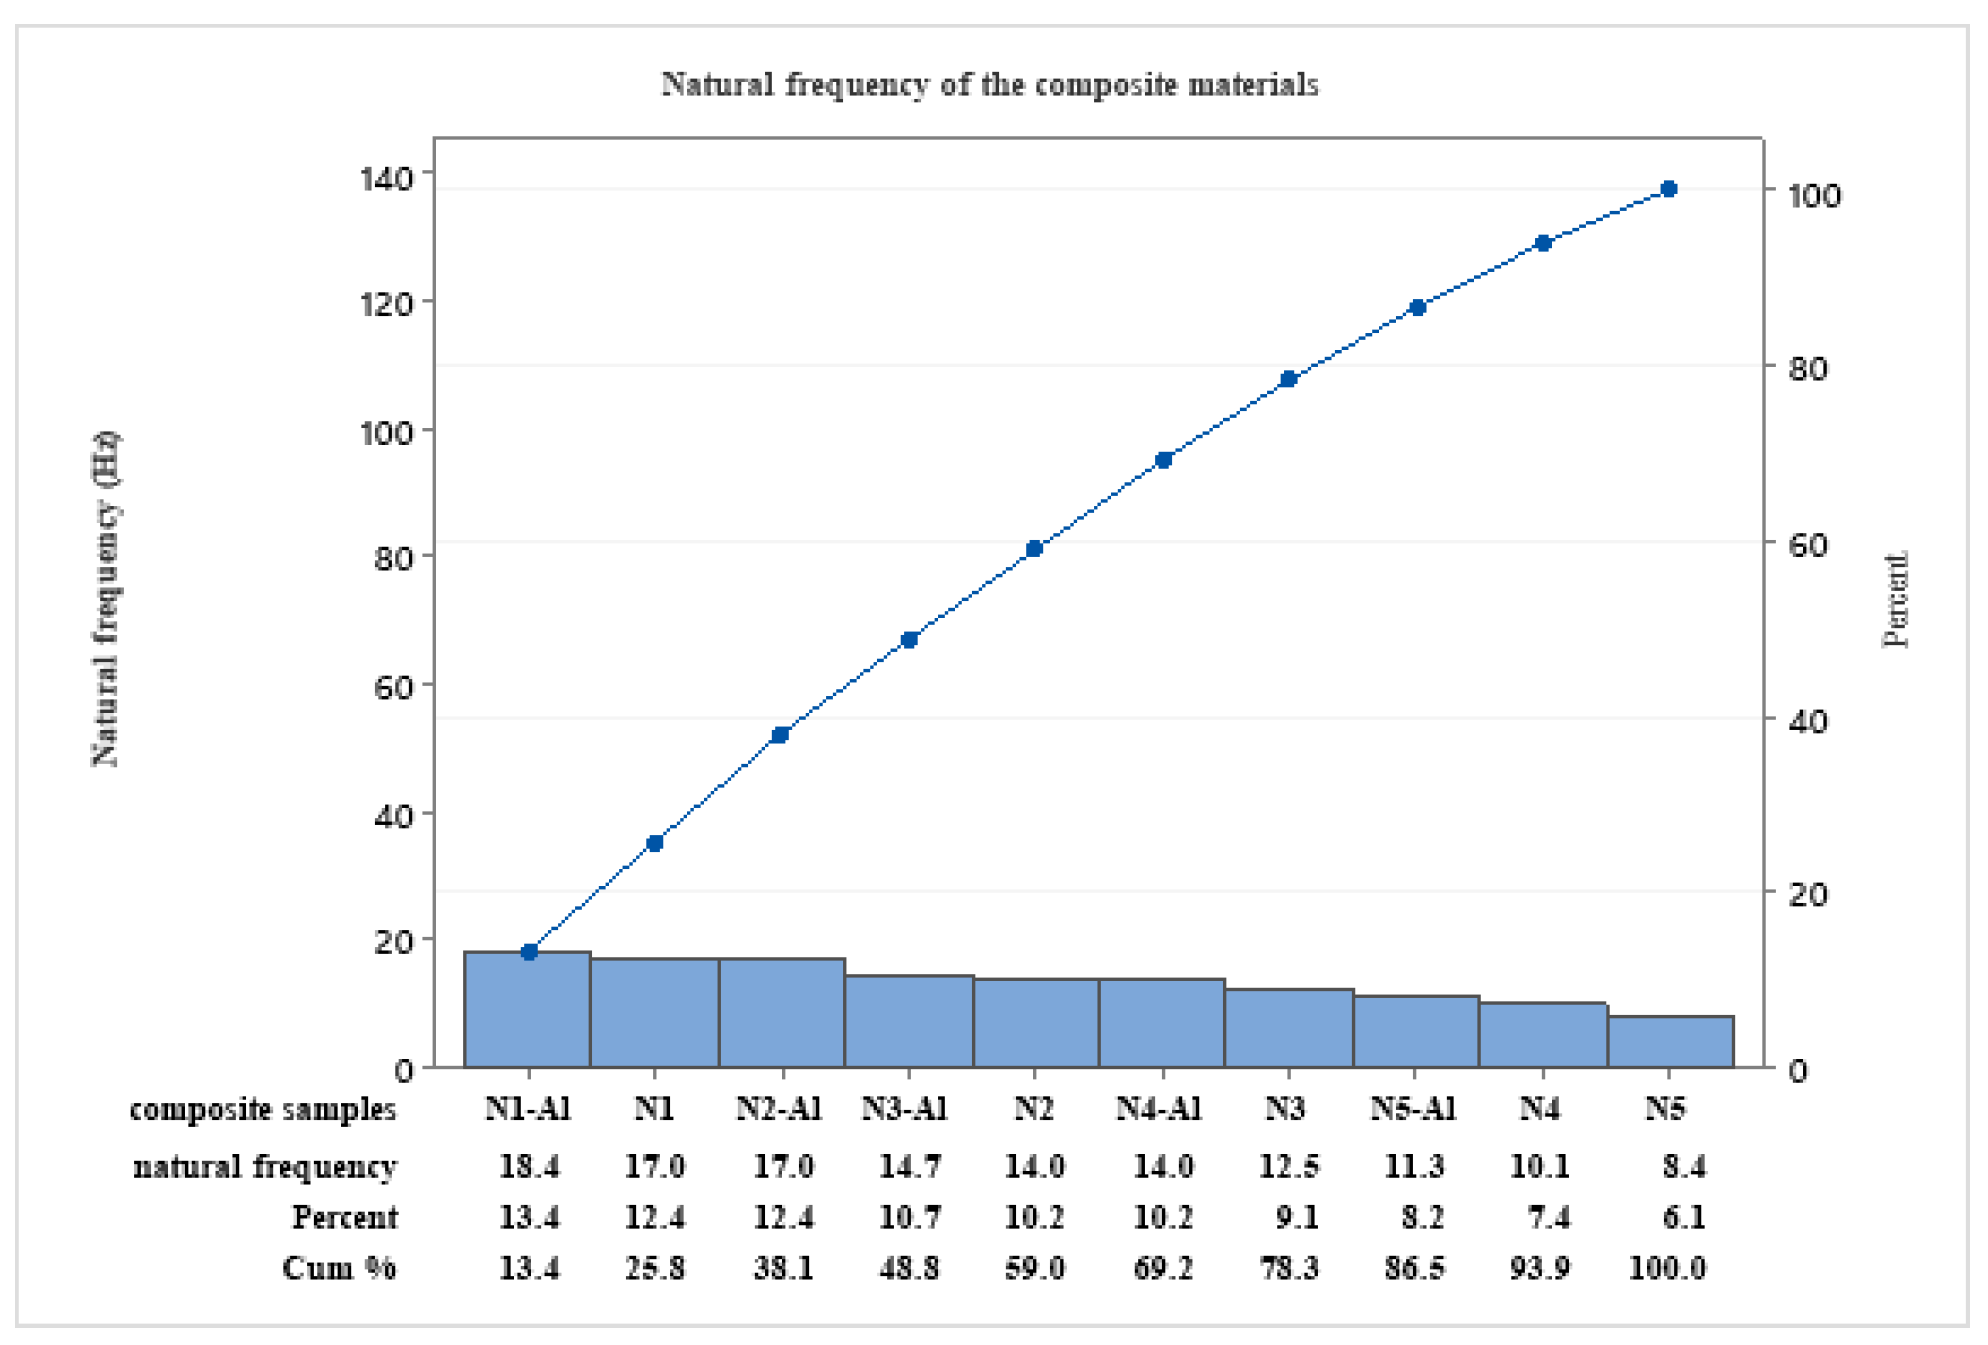
Figure 6.
Damped frequency of epoxy vs. PS and of composite materials.
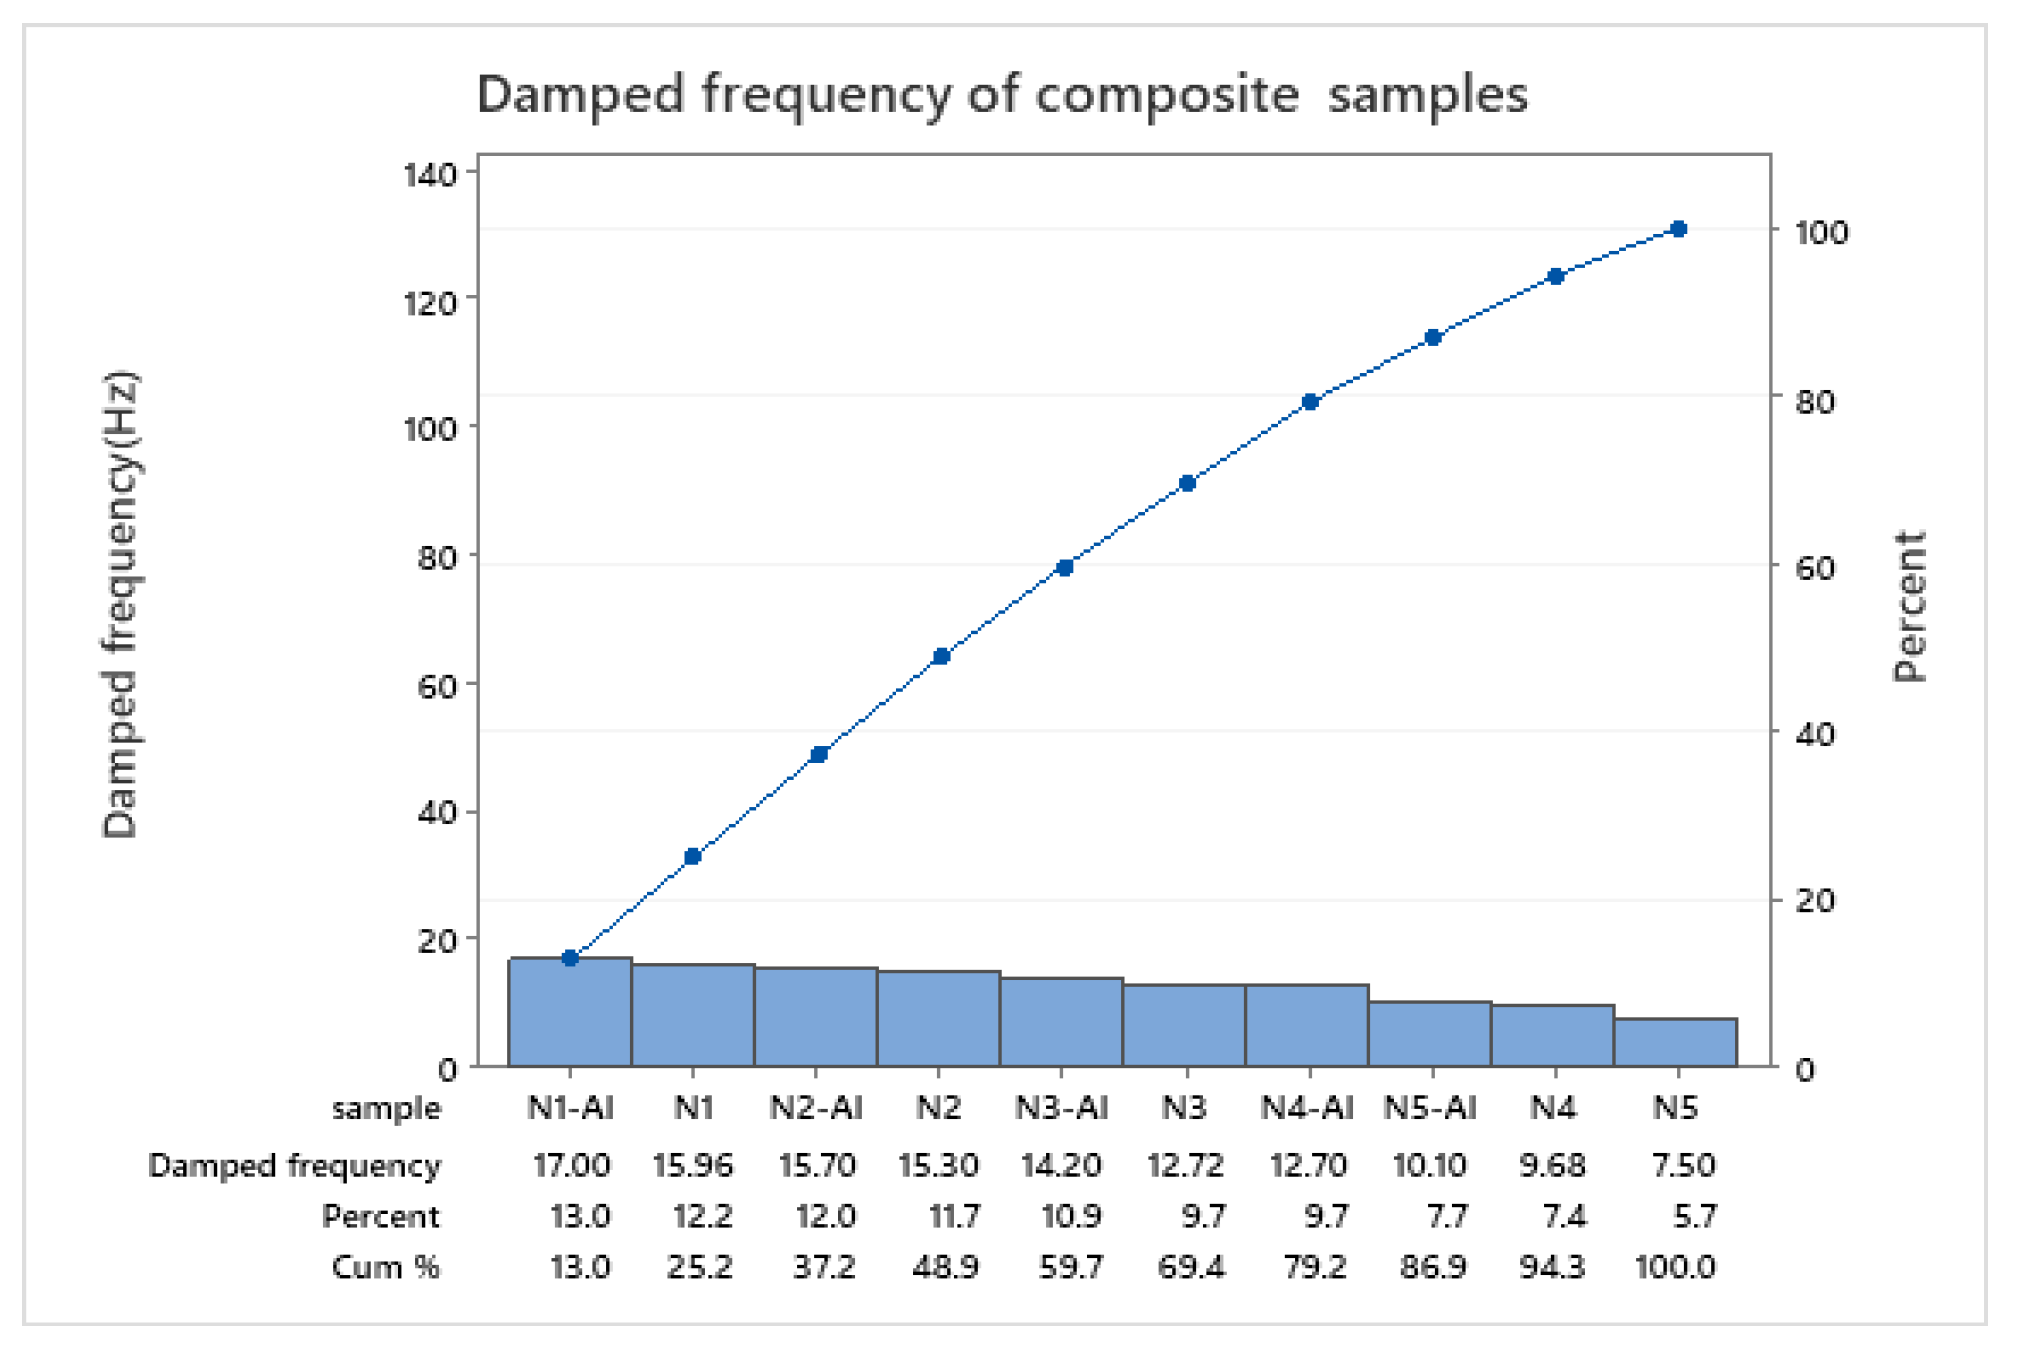
Figure 7.
Logarithmic decrement of the epoxy vs. PS and of the composite materials.
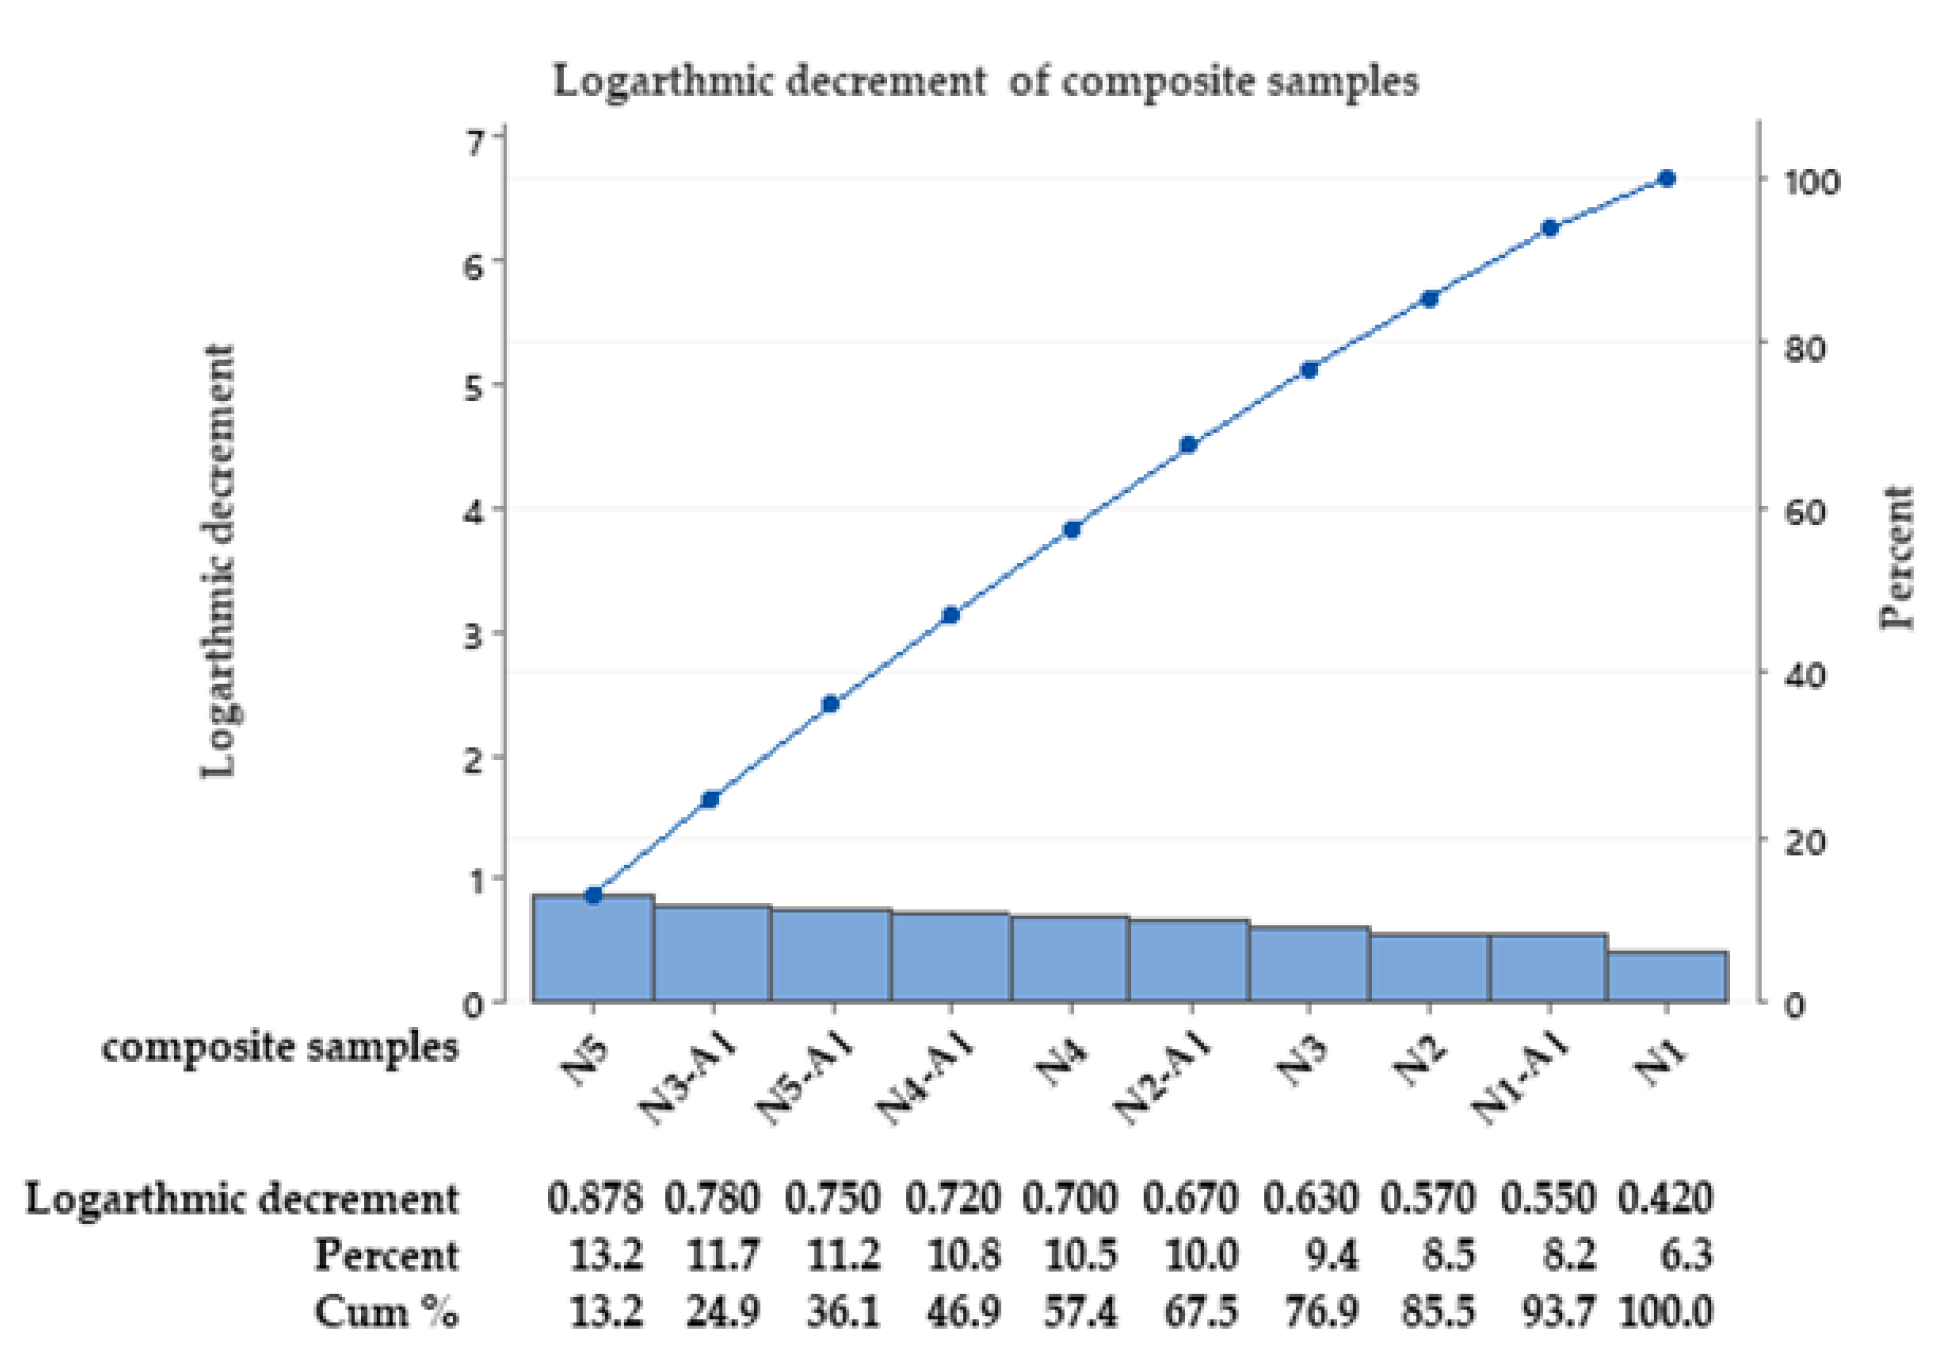
Figure 8.
Damping ratio of epoxy vs. PS and of composite materials.
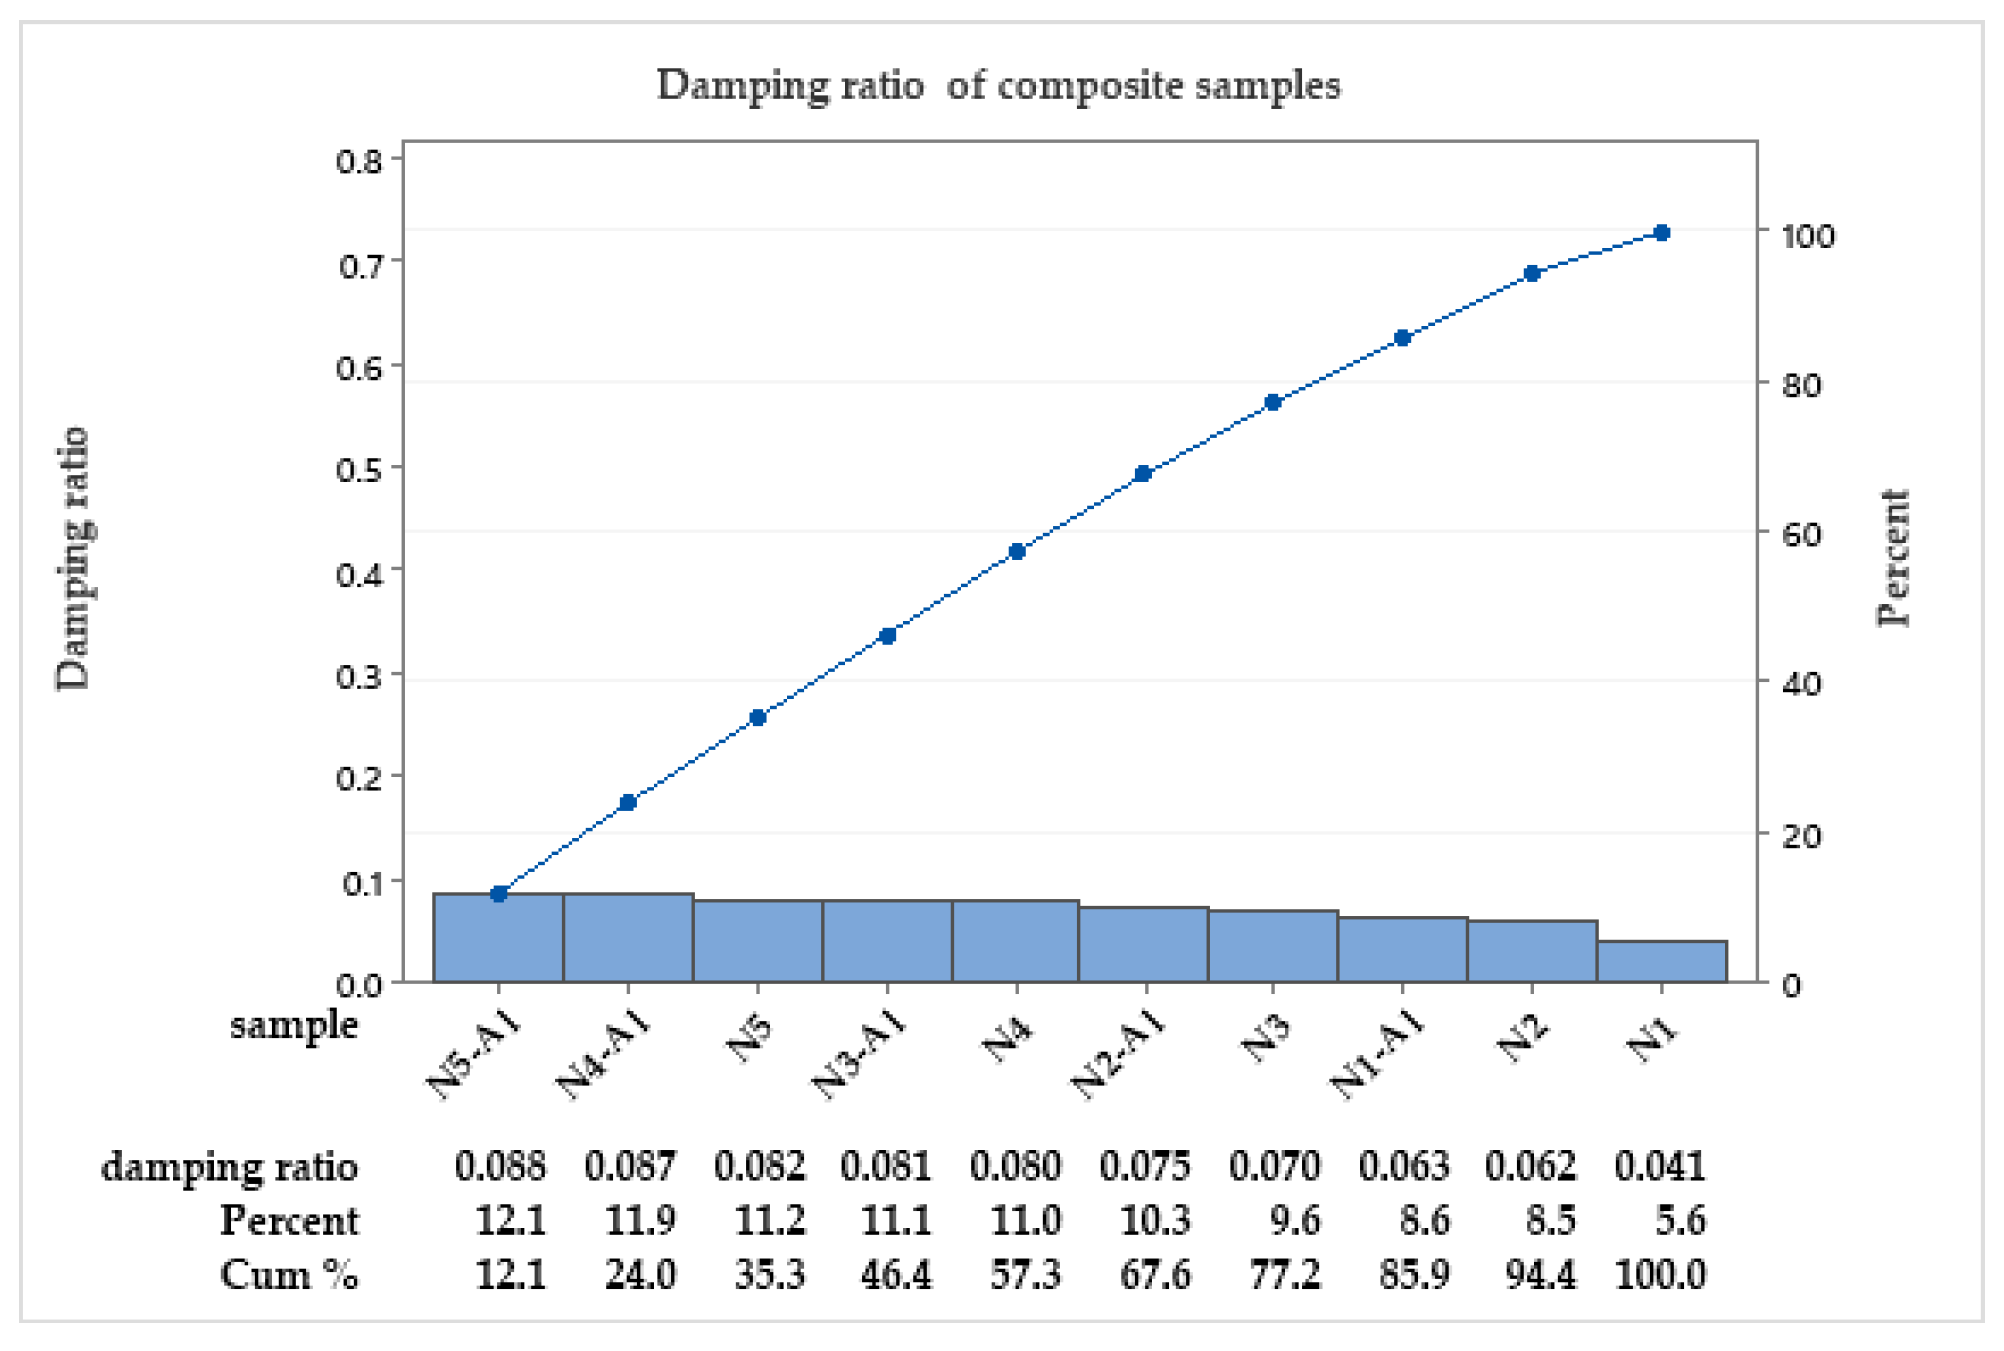
Figure 9.
Probability plot of the GLM data: (a) Natural frequency; (b) Damped frequency; (c) Damping ratio; (d) Logarithmic decrement; (e) Impact strength; (f) Hardness.
Figure 9.
Probability plot of the GLM data: (a) Natural frequency; (b) Damped frequency; (c) Damping ratio; (d) Logarithmic decrement; (e) Impact strength; (f) Hardness.
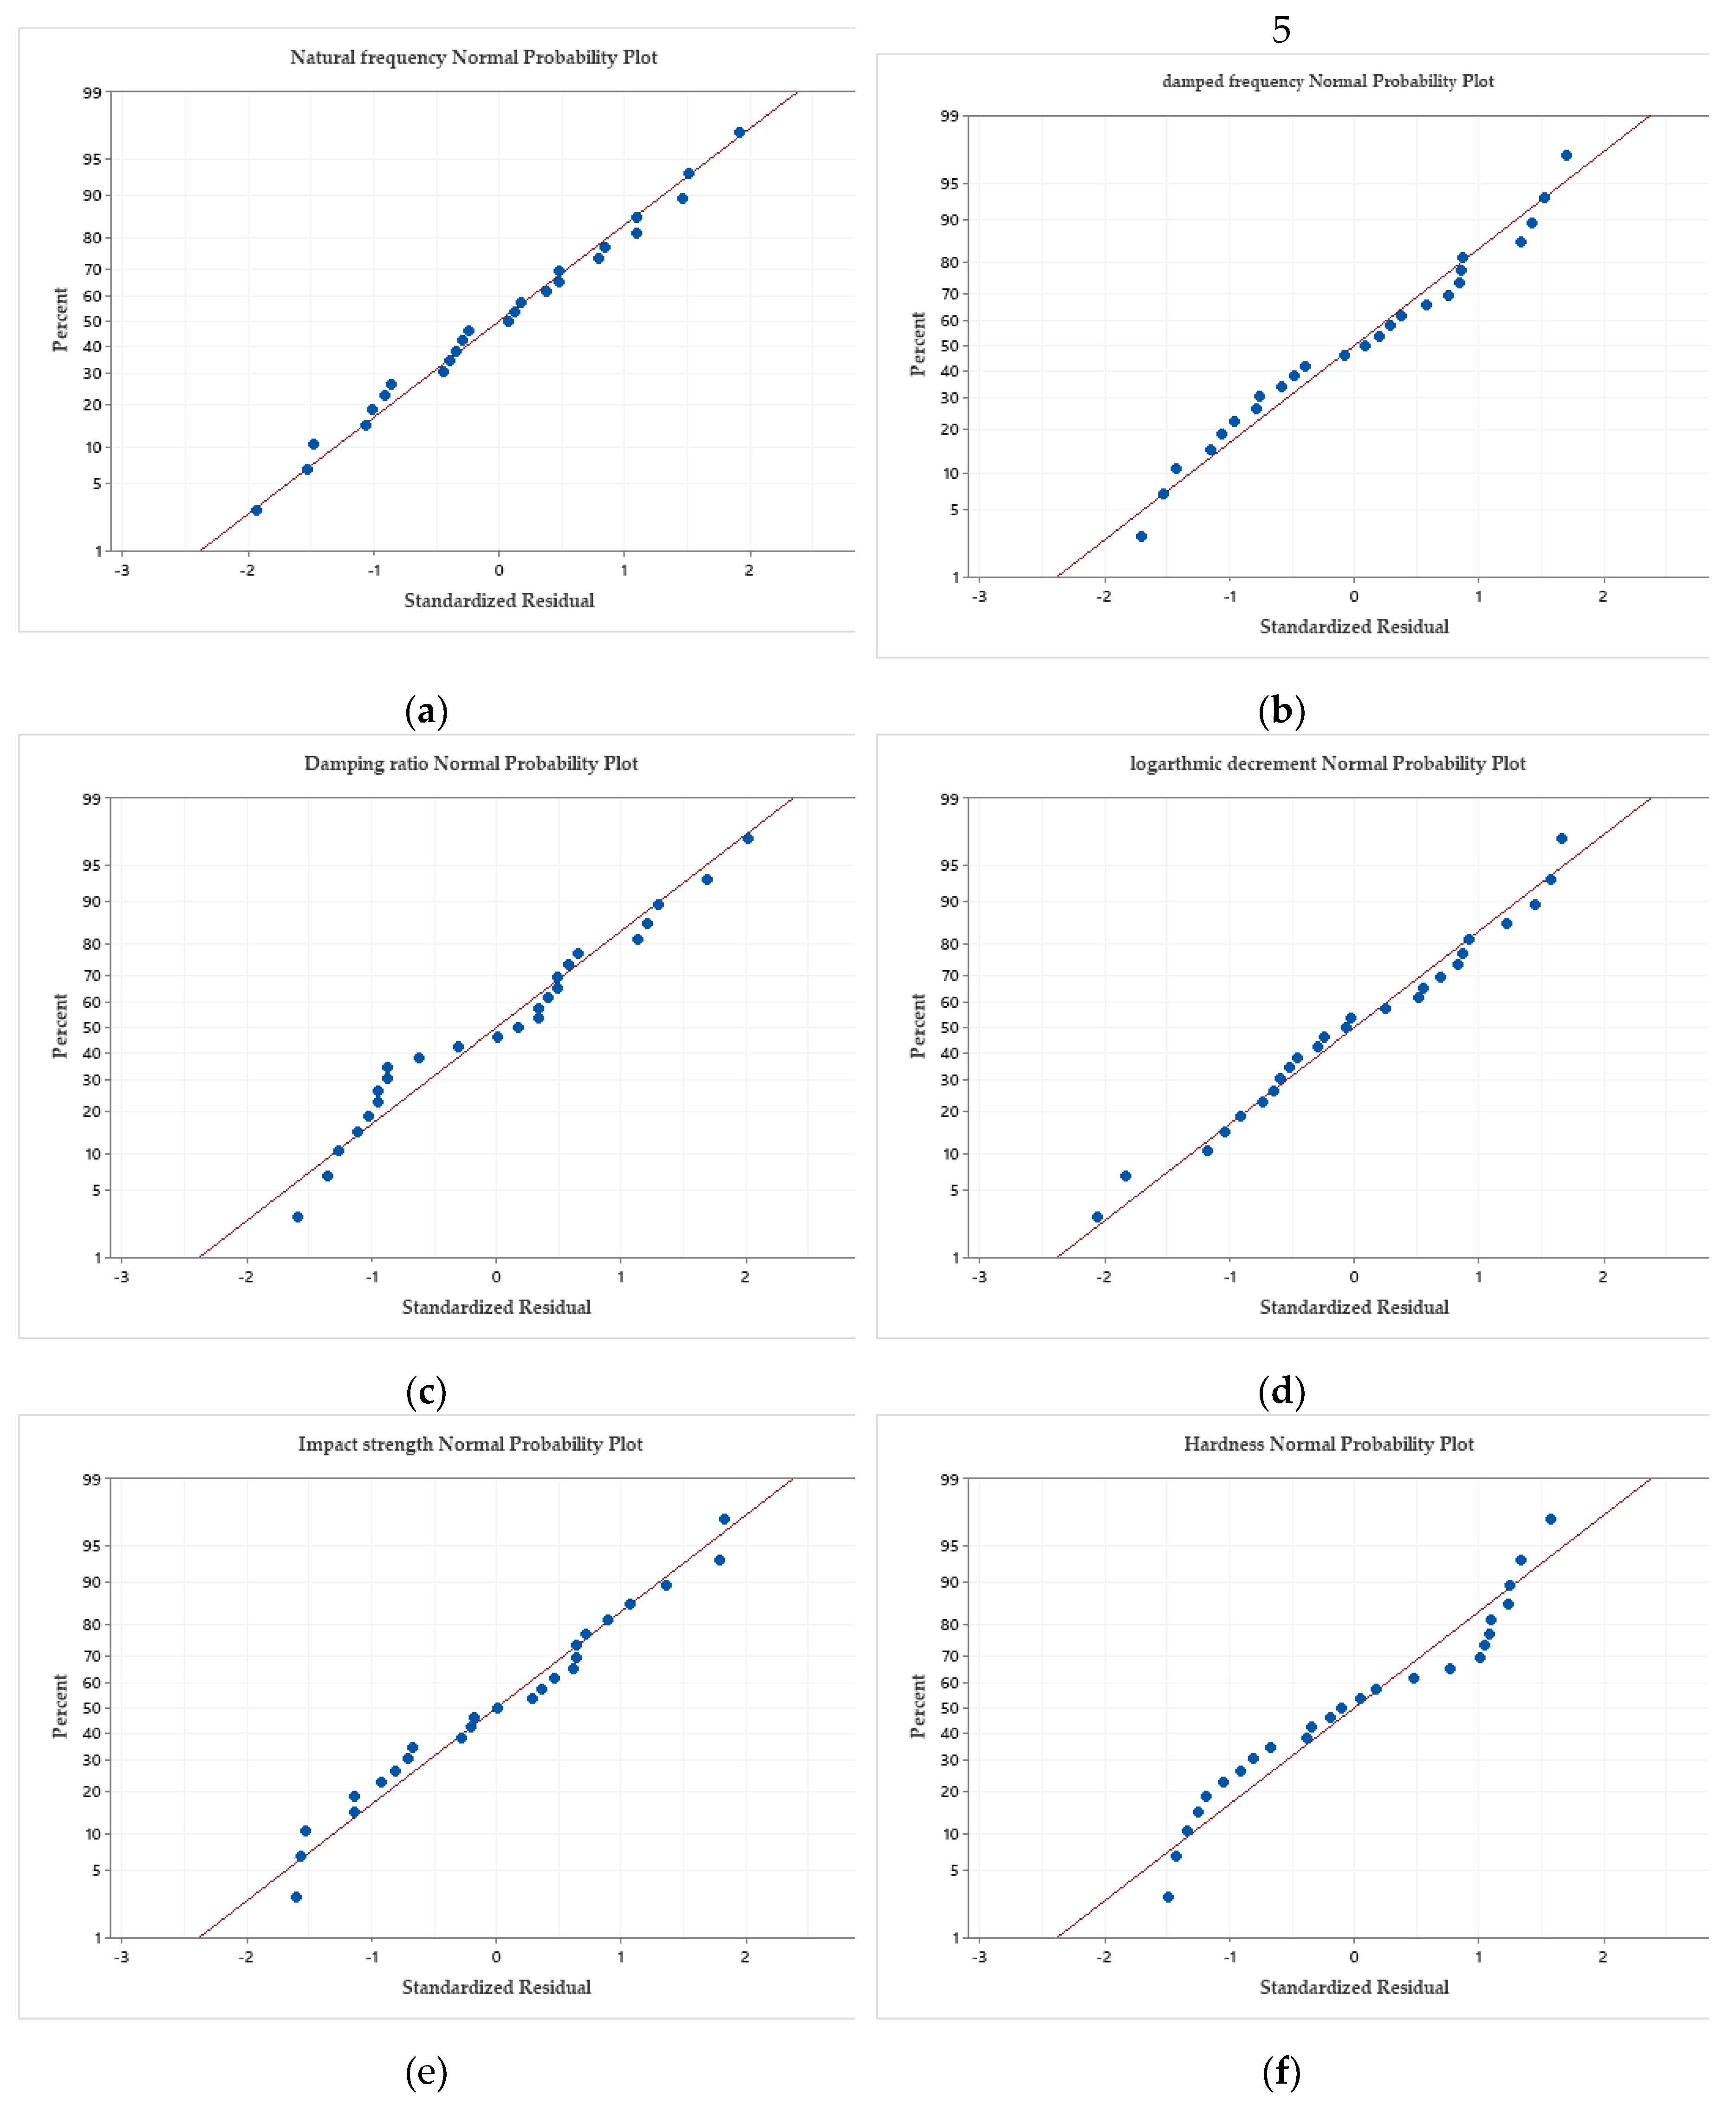
Figure 10.
FEM 3D model mesh constraints and applied loads of the composite leaf spring.
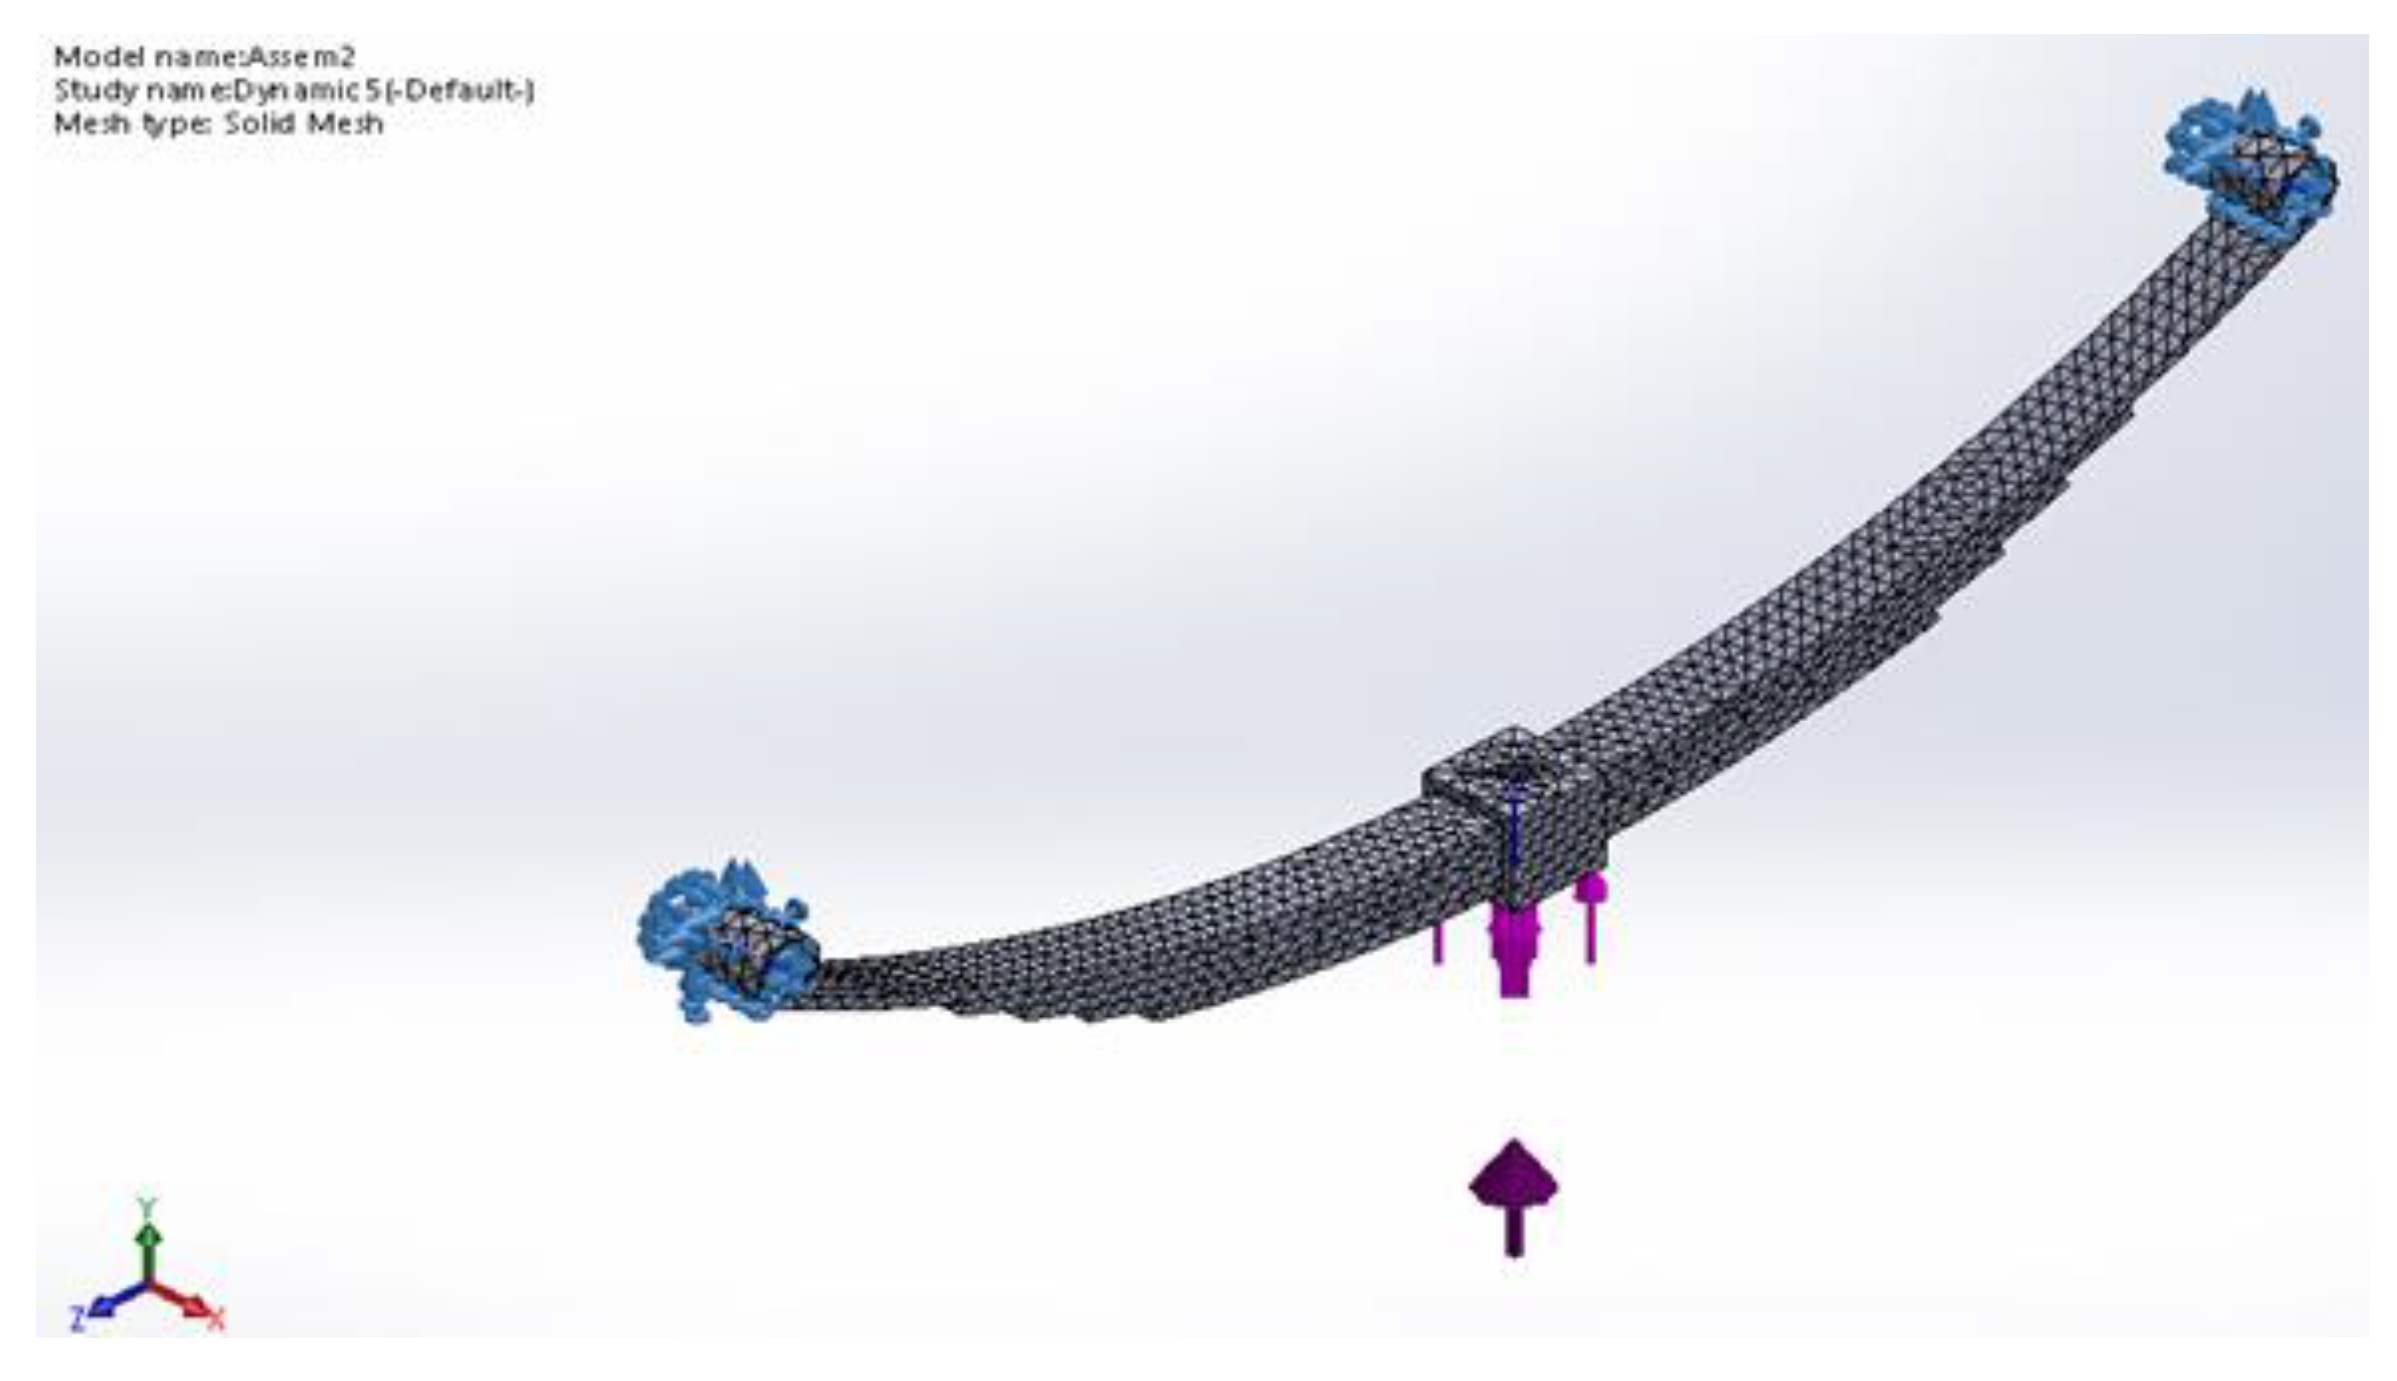
Figure 11.
FEM von Mises stress of composite leaf spring.
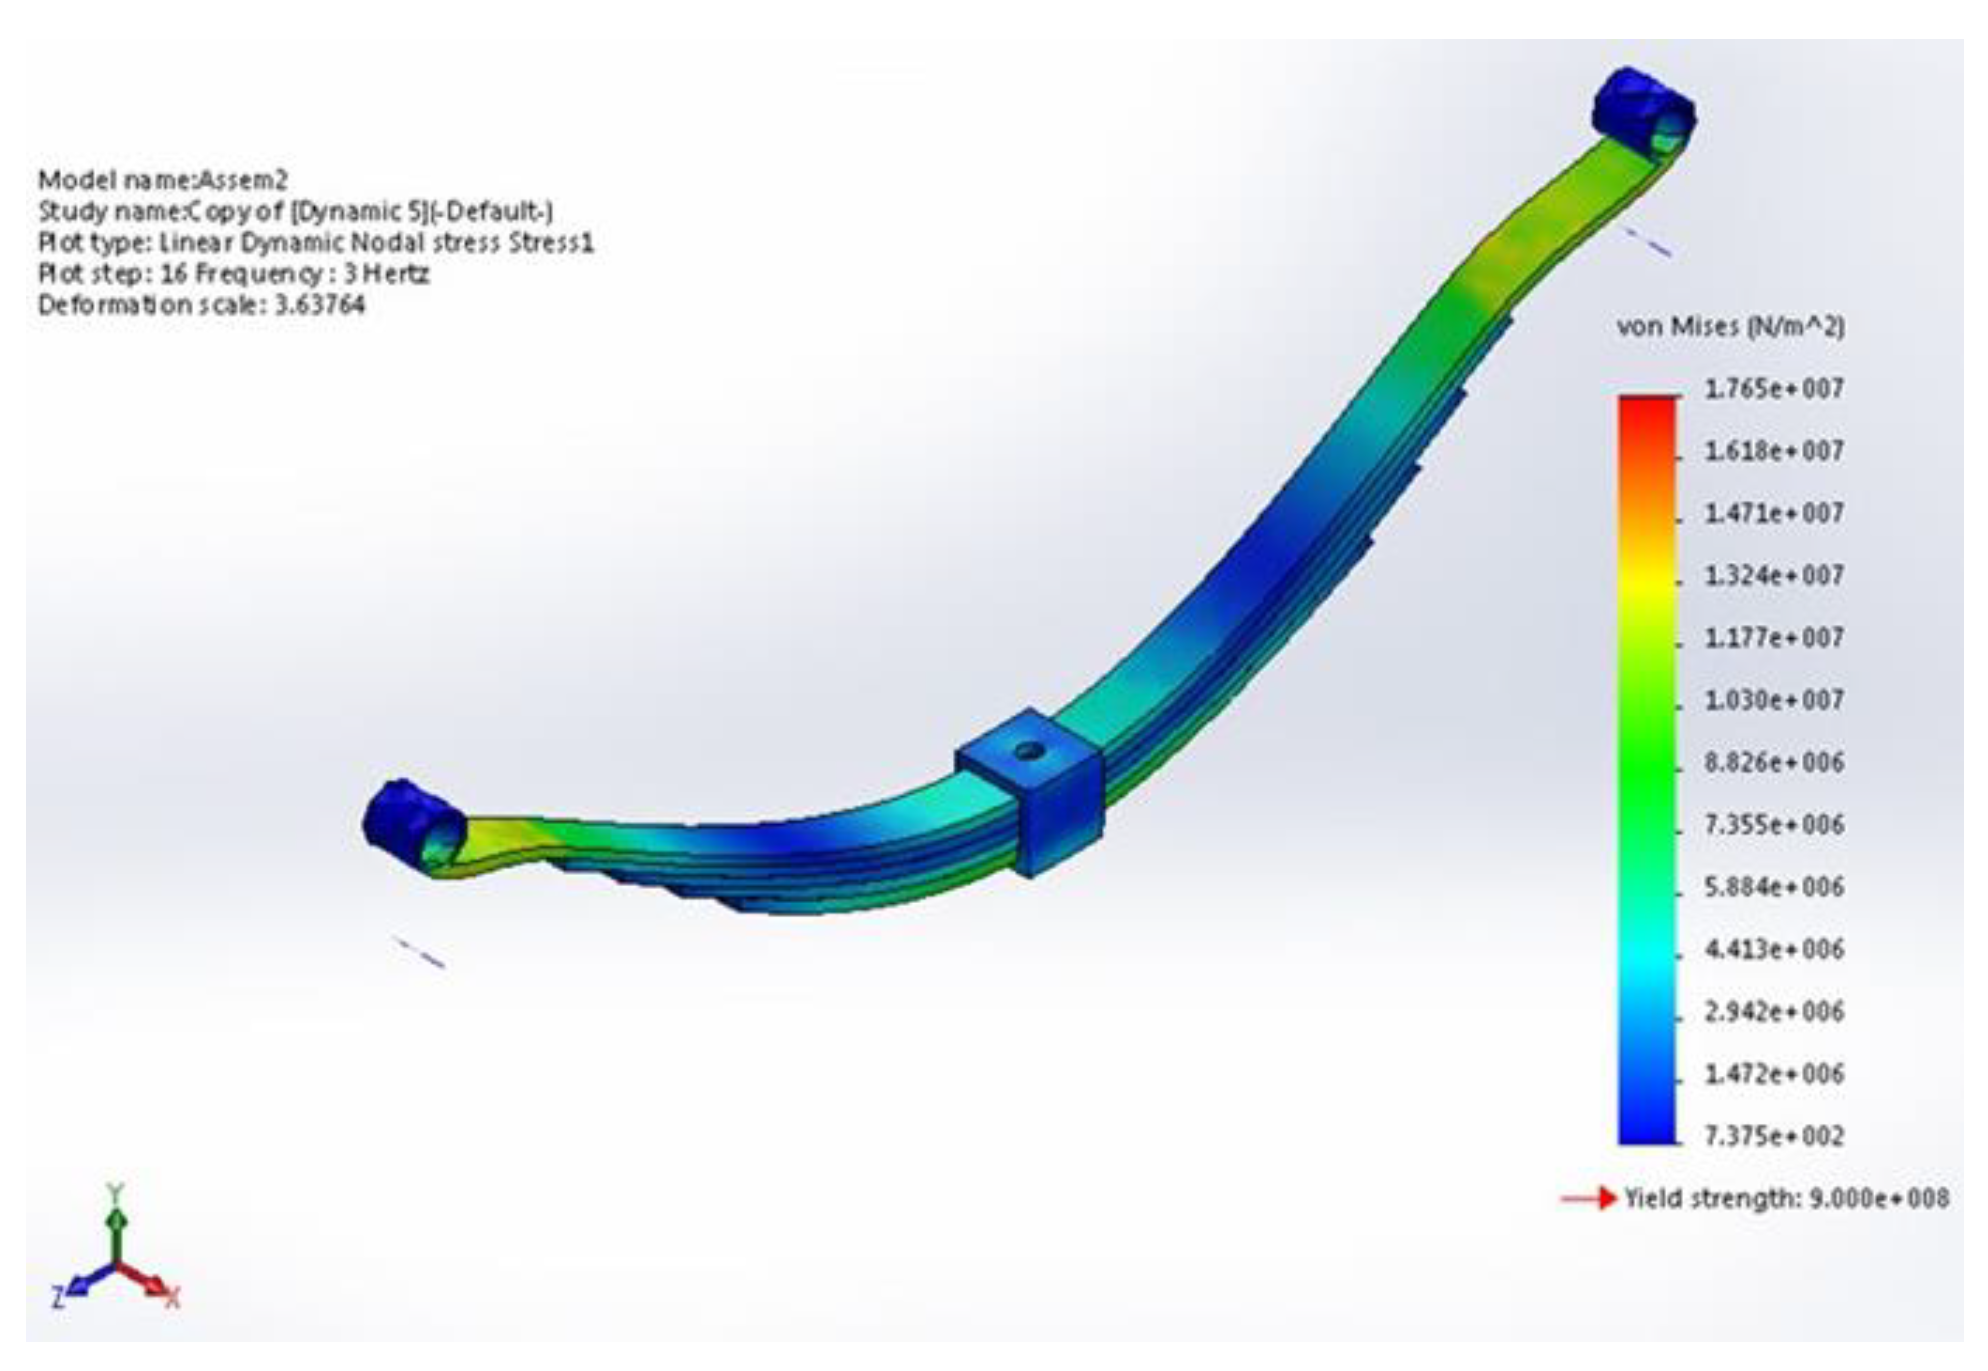
Figure 12.
FEM resultant displacement of the composite leaf springs model.
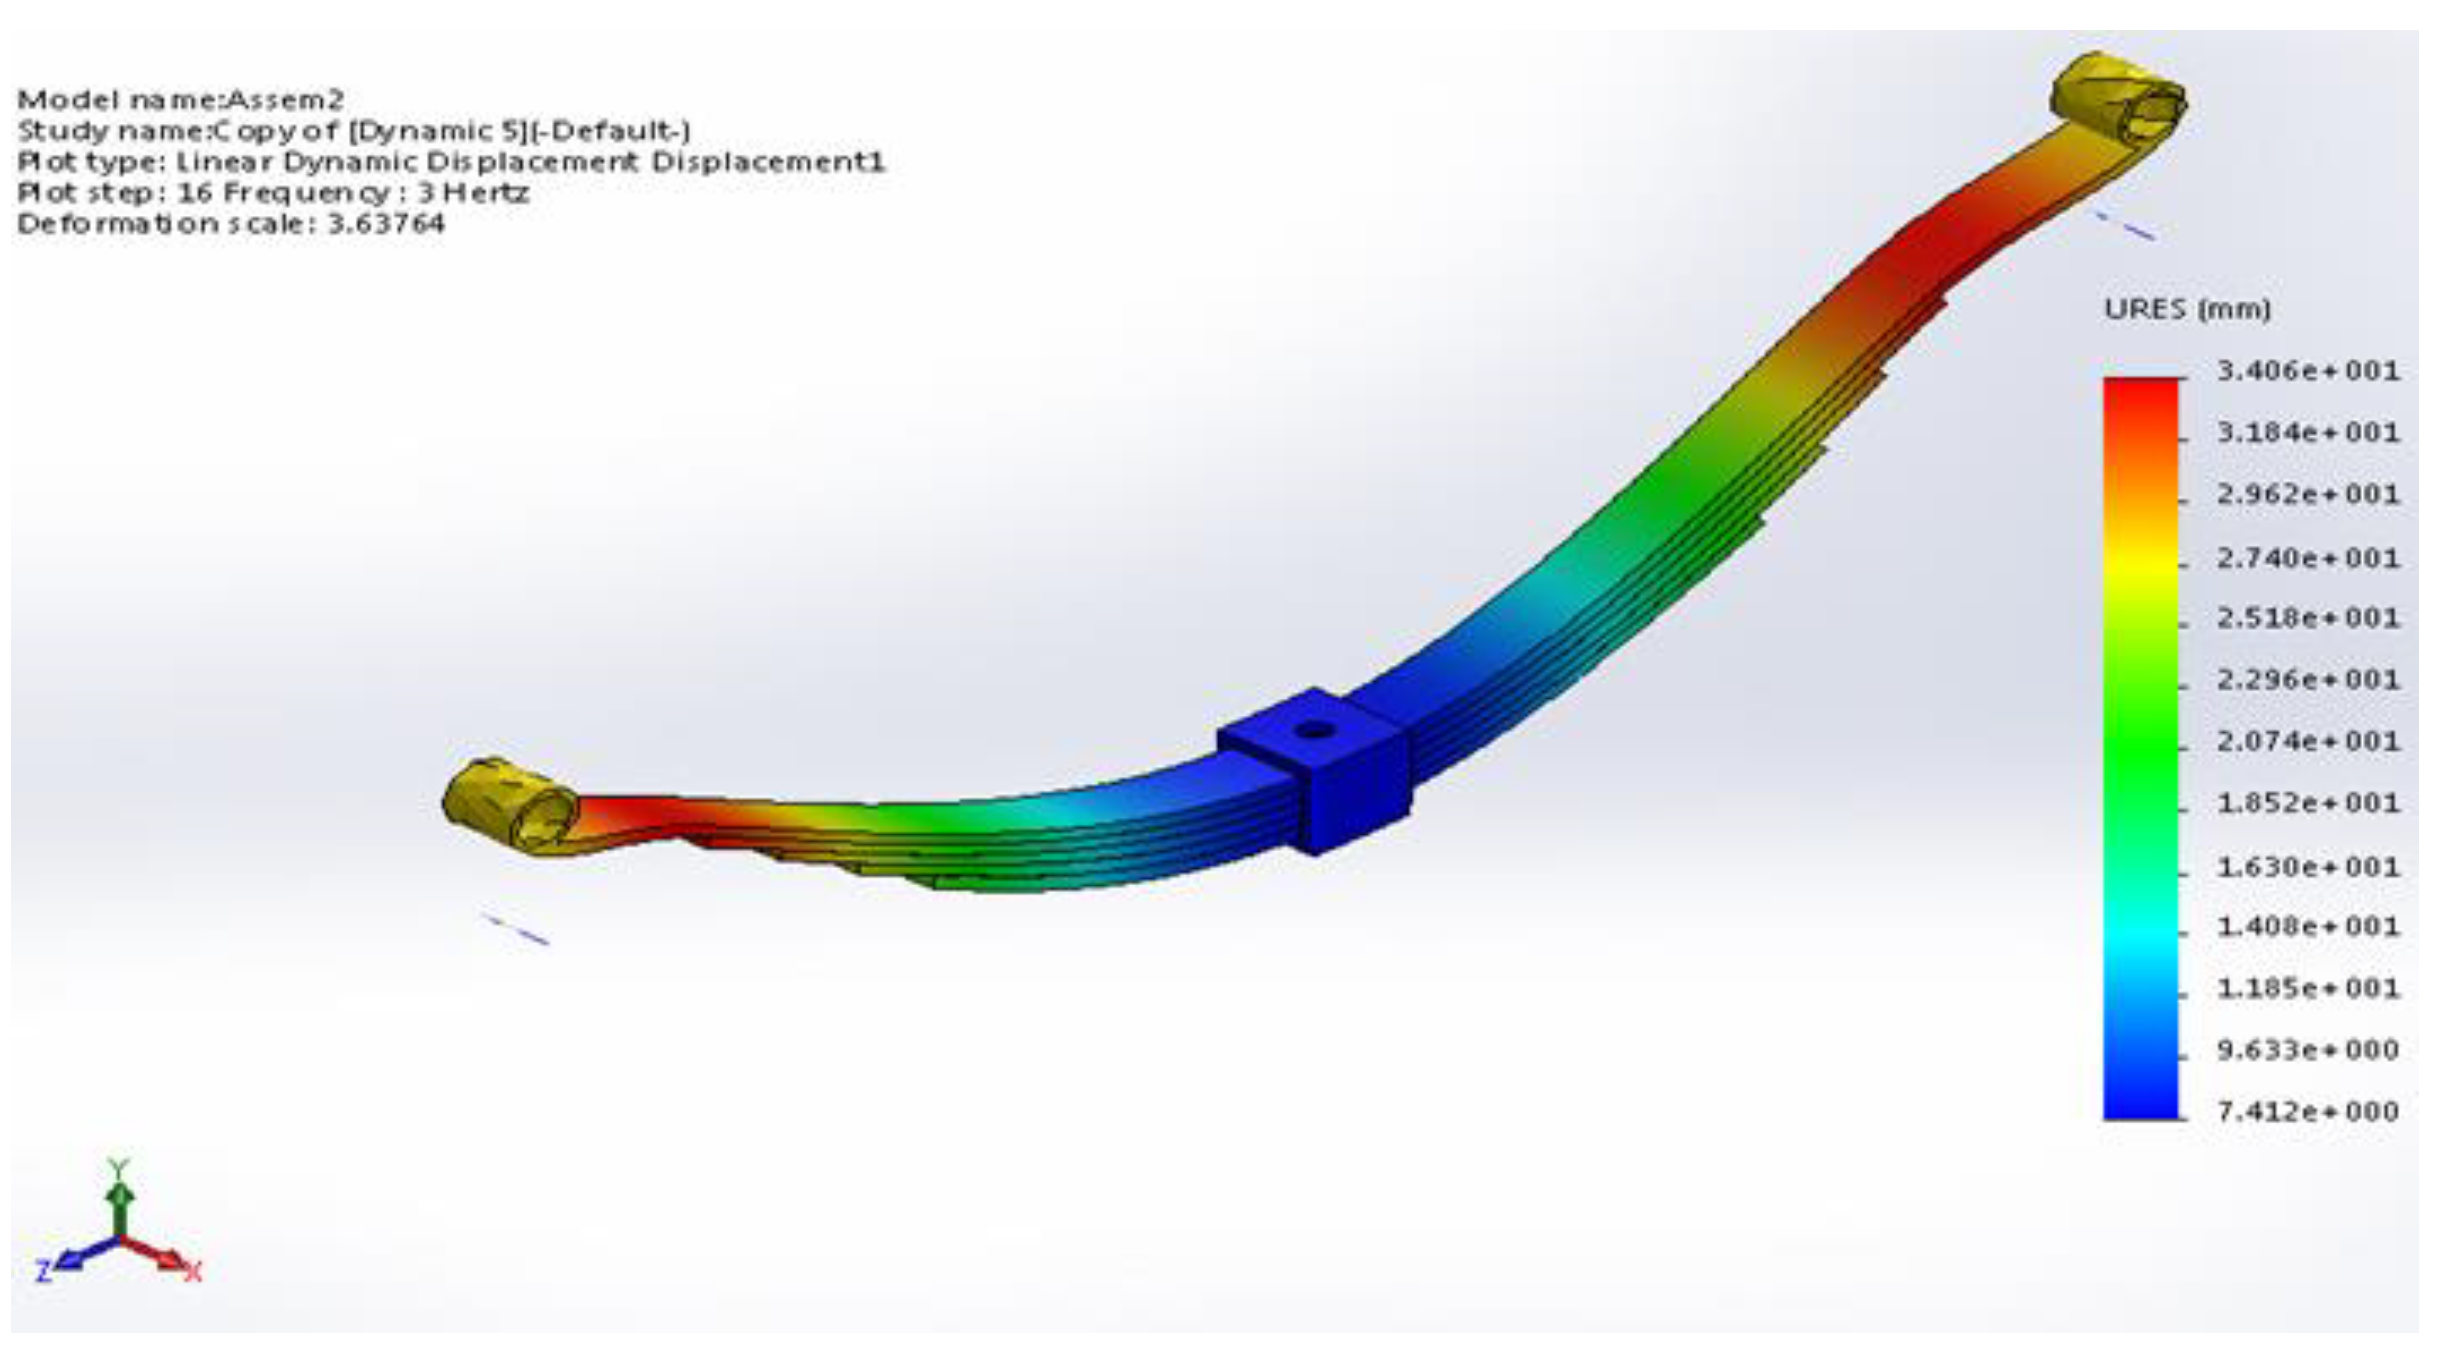
Figure 13.
FEM strain of the leaf spring composite model.
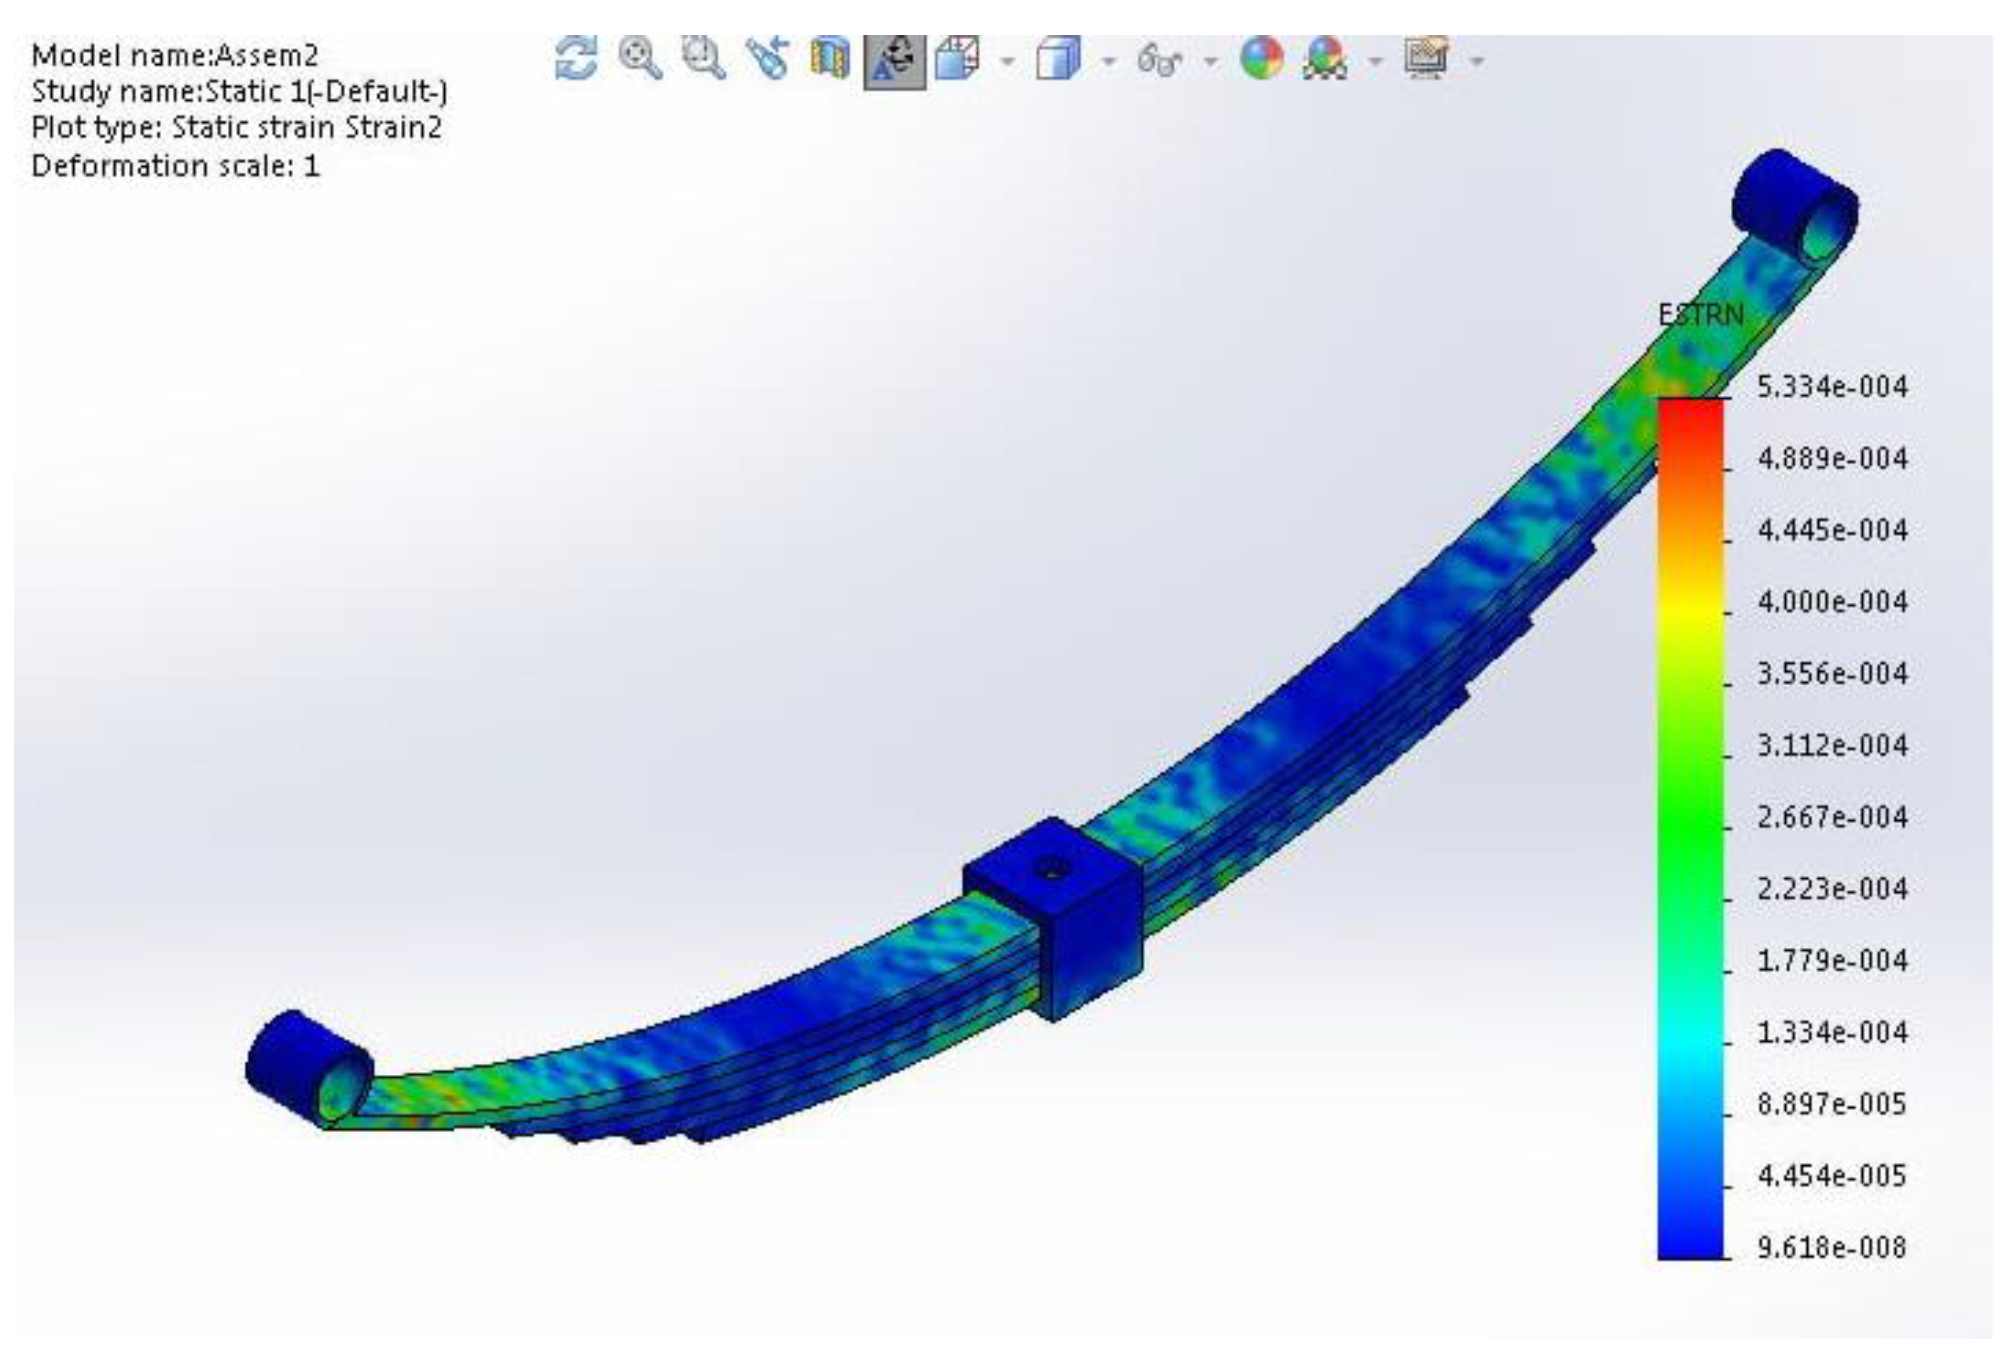
Figure 14.
FEM strain energy density of the leaf spring composite model.
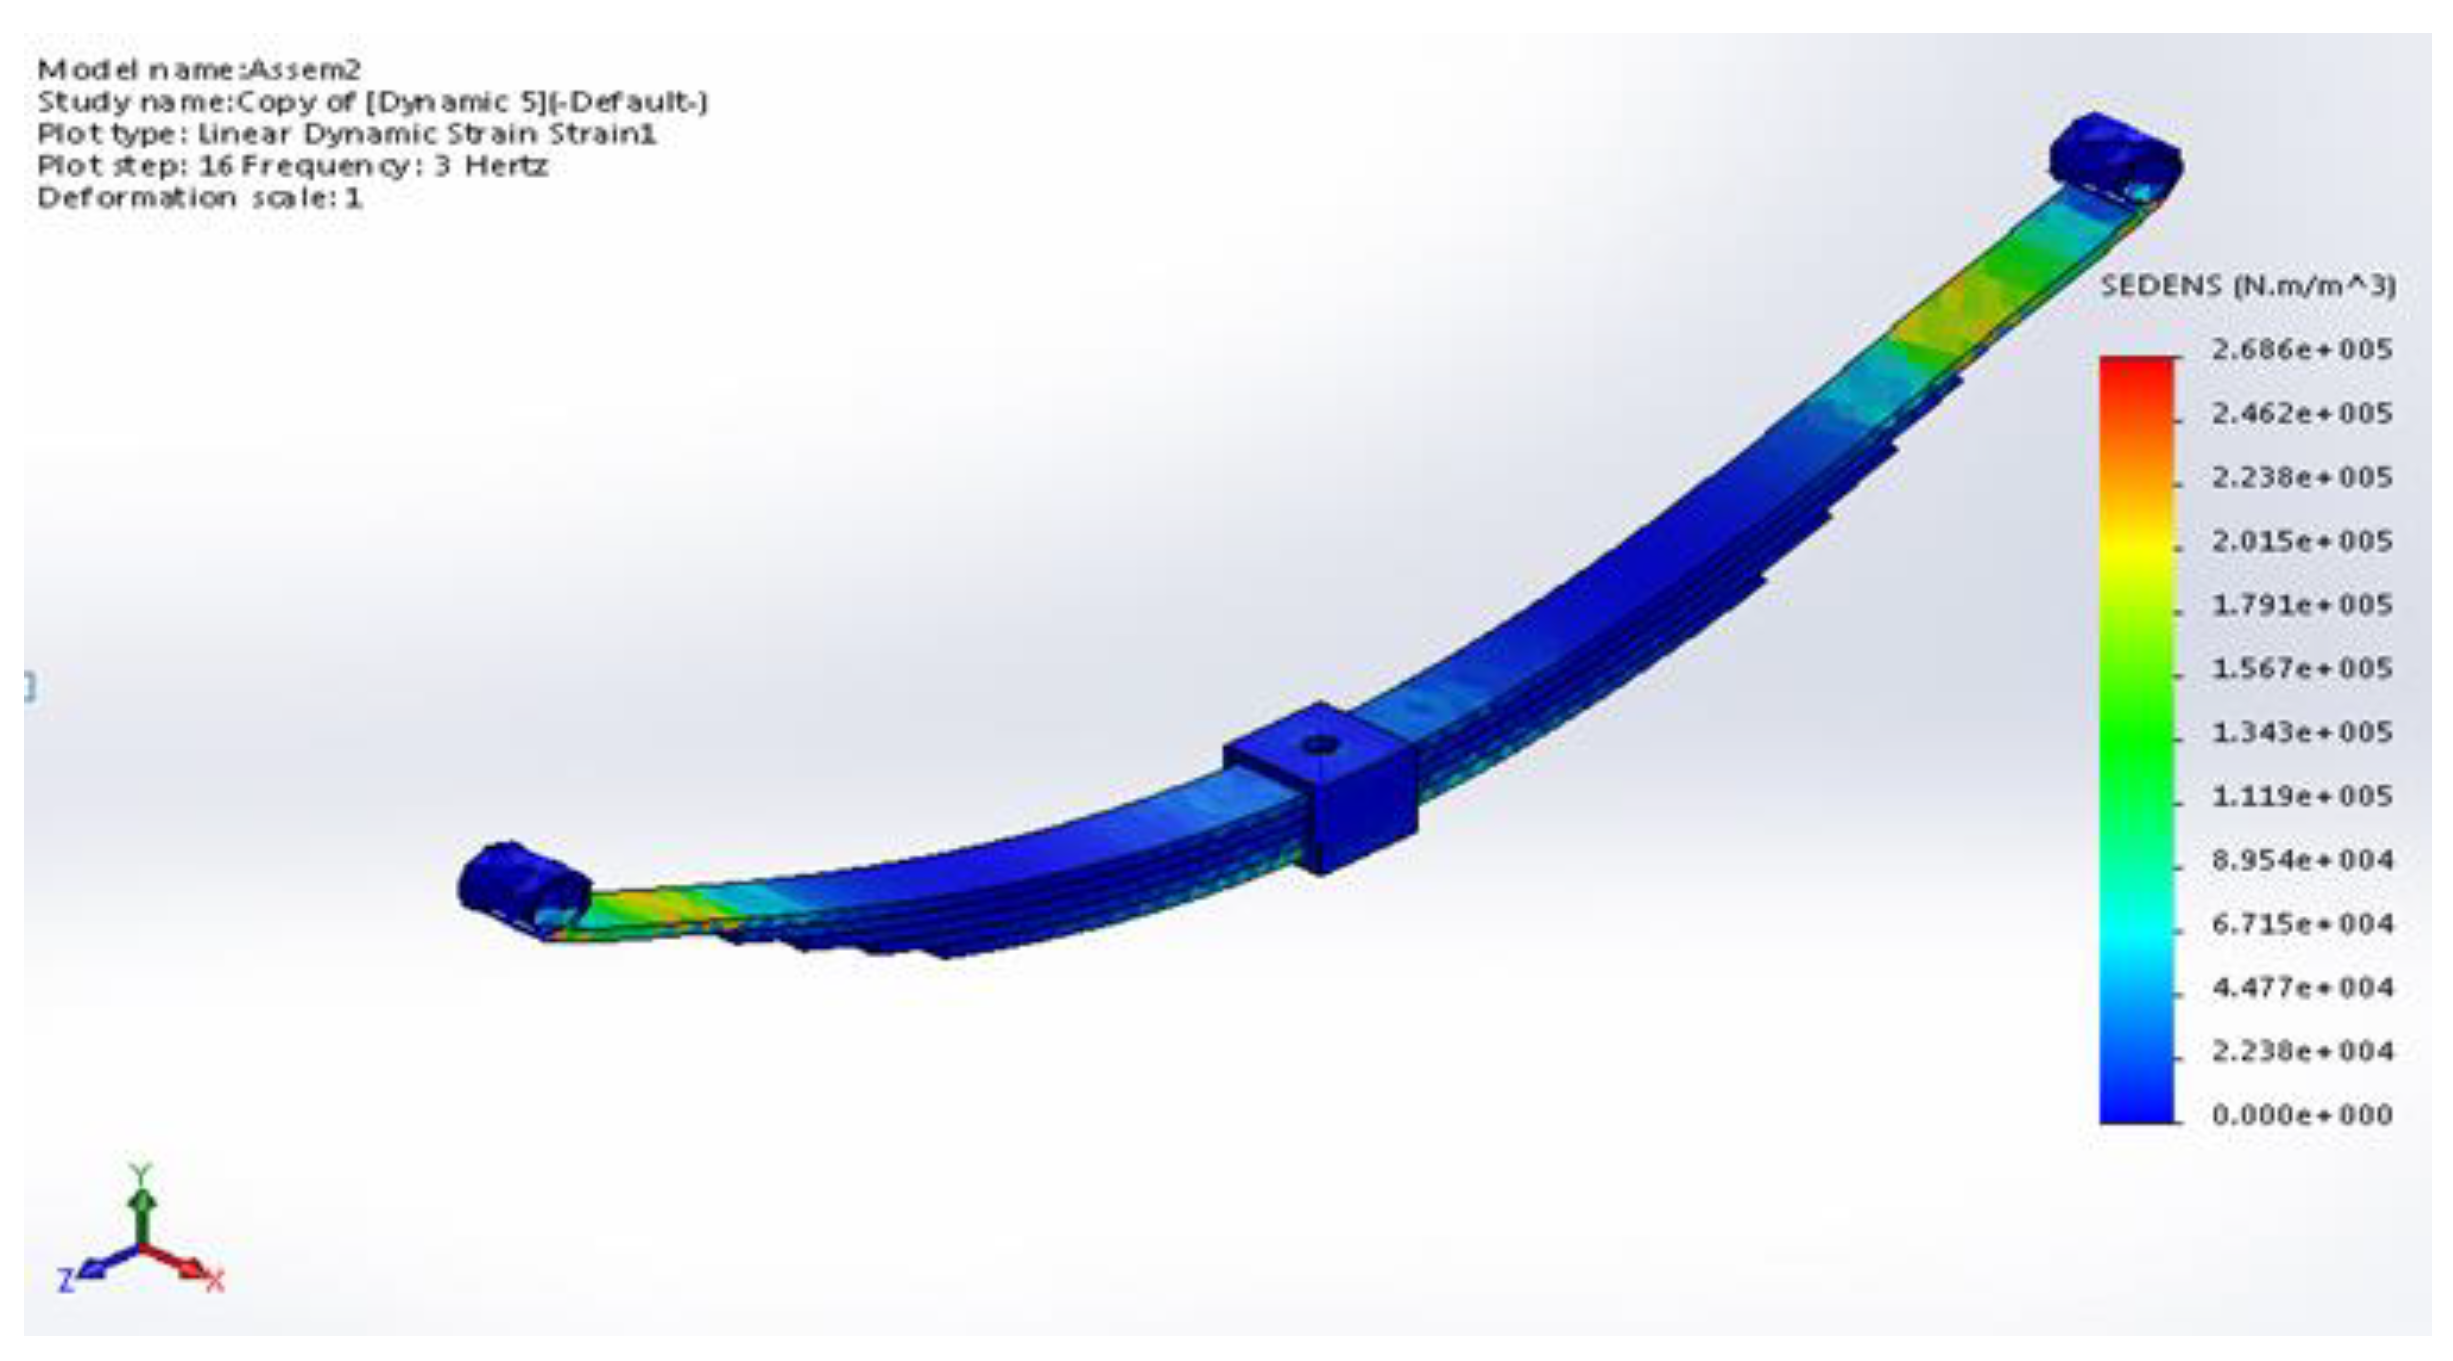
Figure 15.
FEM composite leaf spring model mode shapes.
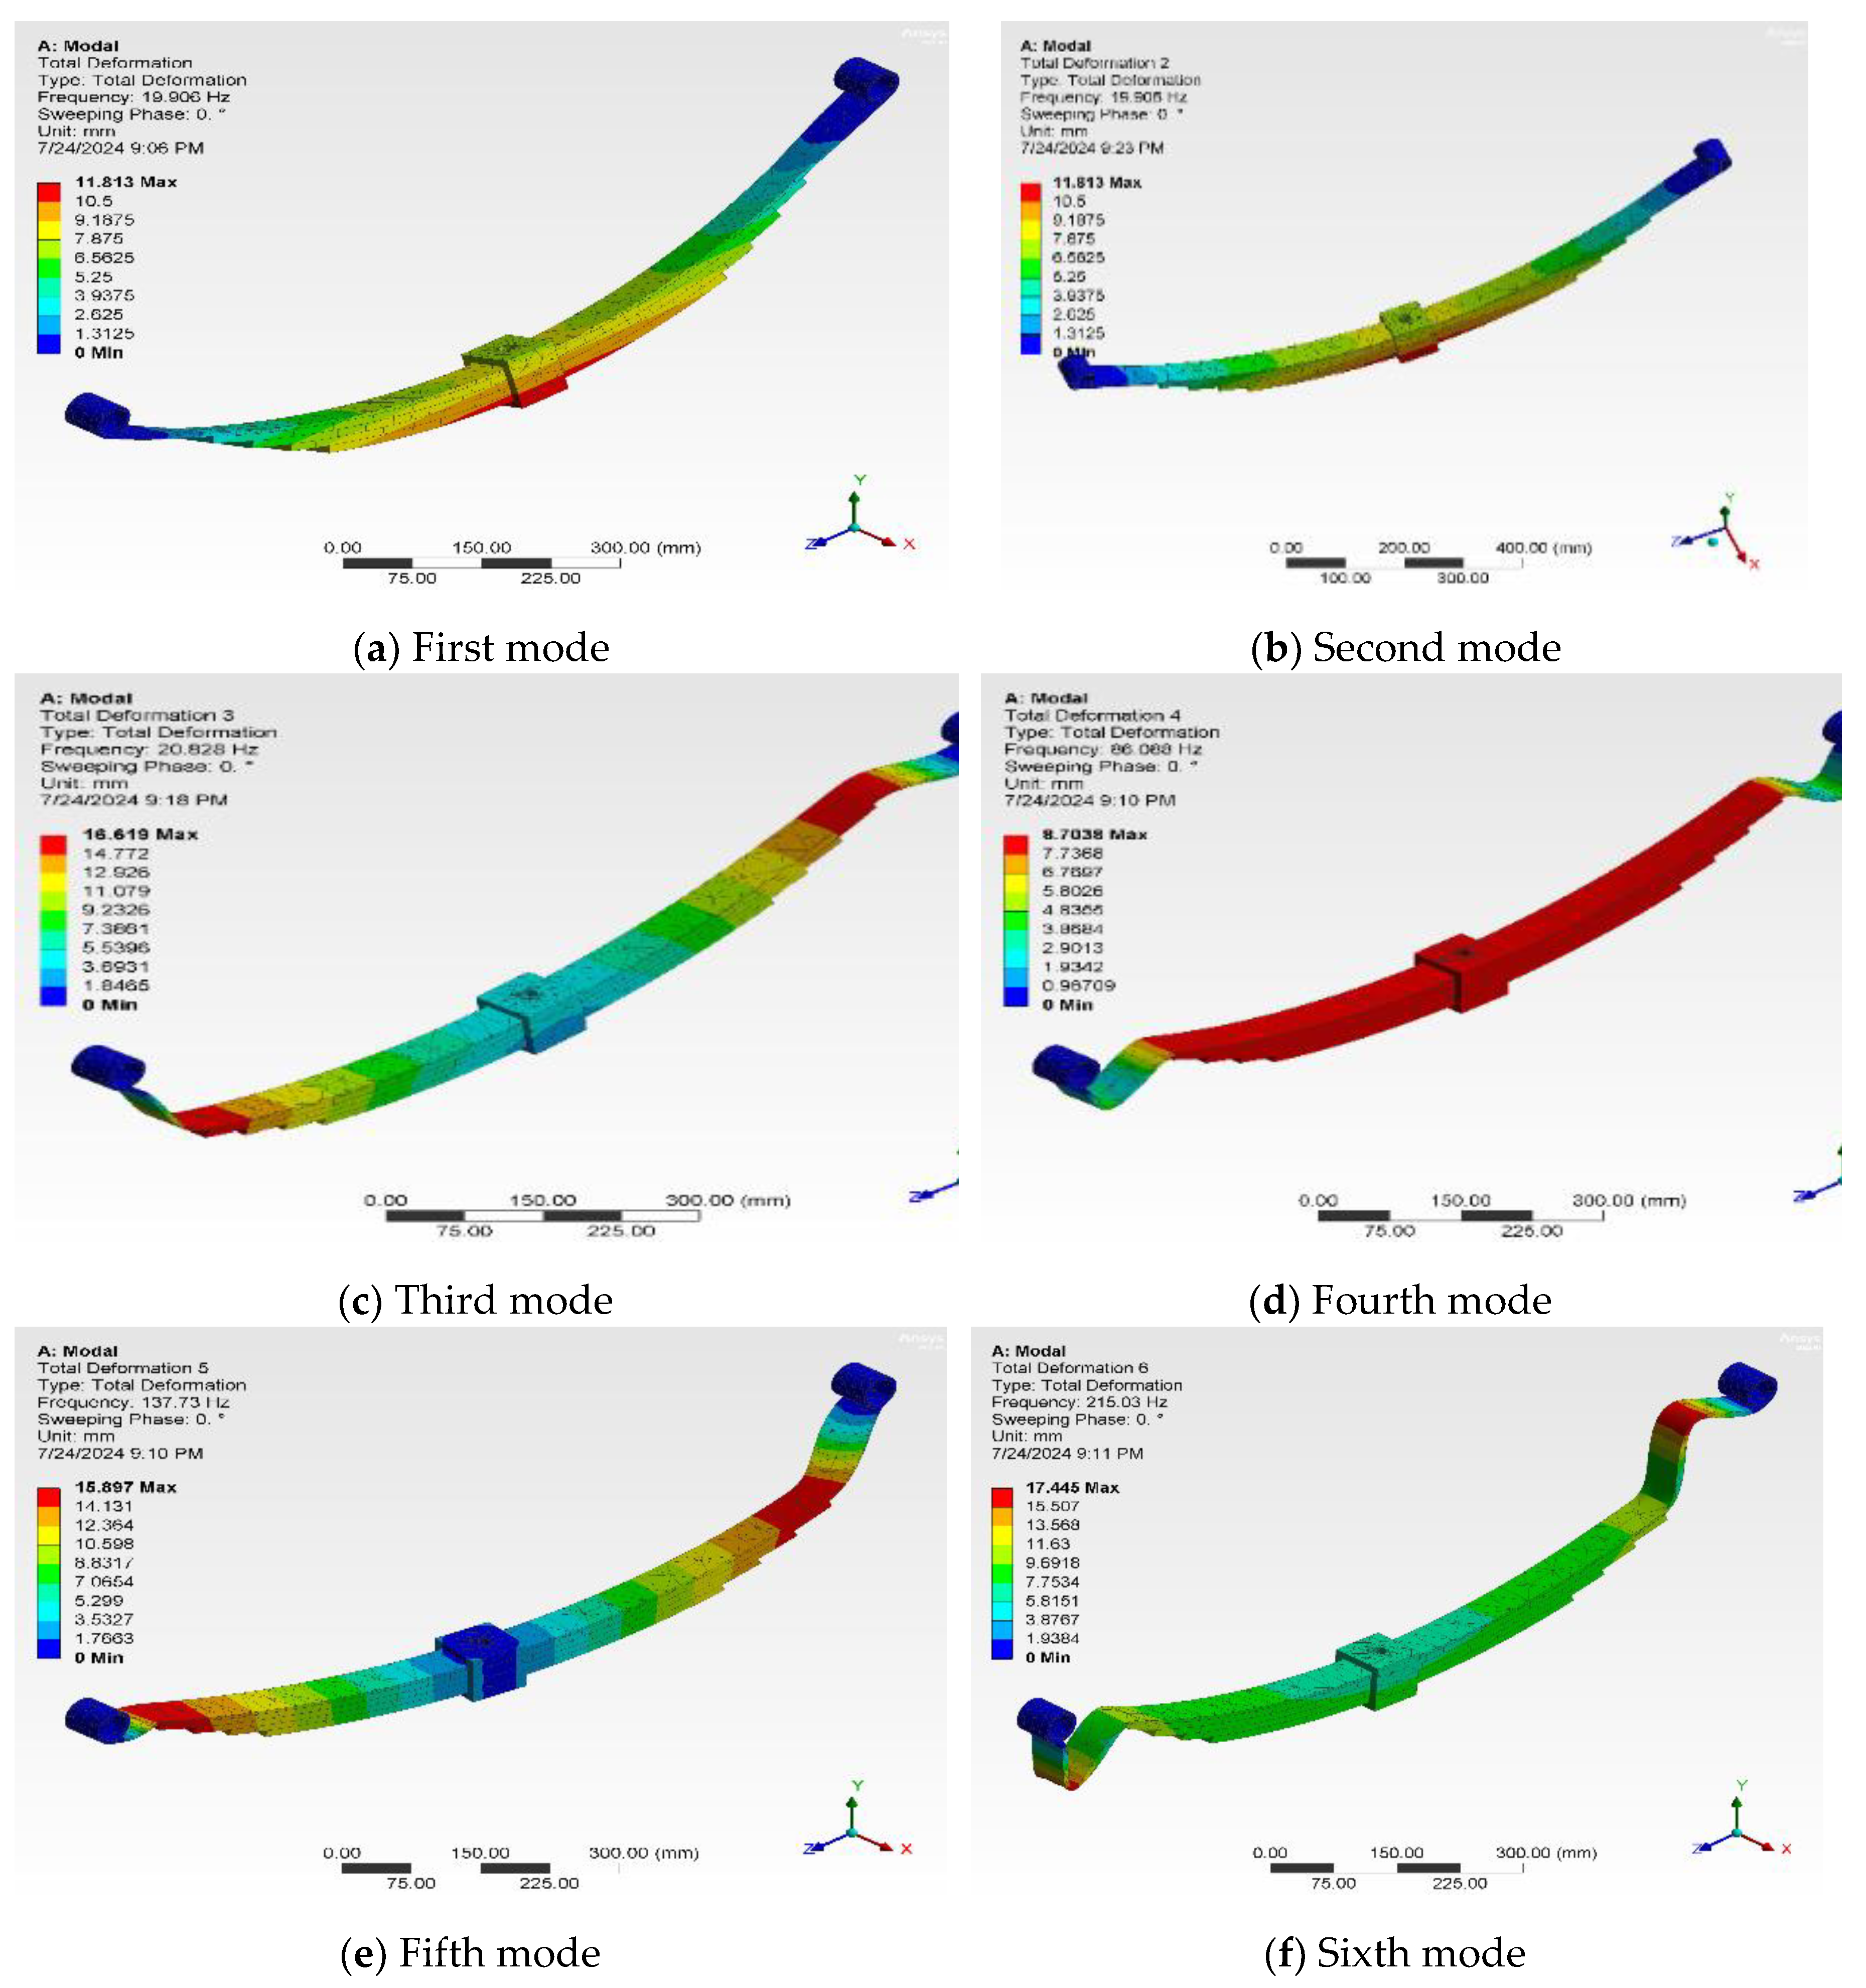

Table 1.
Mechanical properties of epoxy, PS, and alumina.
| Property | Epoxy | PS | Alumina |
| Color | Light yellow | Black | Ivory |
| Density (g/cm3) | 1.1 @ 20 °C | 1.4 | 3.89 |
| Flexural strength (MPa) | 128-146 | 50 | 379 |
| Elastic modulus (GPa) | 3.2-3.5 | 3.7-5 | 375 |
| Poisson's ratio (-) | 0.3 | 0.25 | 0.22 |
| Compressive strength (MPa) | 52 | 20-100 | 2600 |
| Tensile strength (MPa) | 80-90 | 8.3 | 250 |
| Hardness (Shore hardness; D scale) | 73 | 42 | 144 |
| Maximal temperature without load (°C) | 108-112 | (-50)-95 | 1750 |
| Coefficient of thermal expansion (x 10-6/°) | 60-80 | 55-60 | 8.4 |
| Specific gravity (-) | 1.35 | 1.35 | 3.7 |
| Failure strain (%) | 5-6 | 550 | - |
Table 2.
The composite material percentage.
| Sample ID | Epoxy (%) | PD (%) | Alumina (%) |
| N1 | 90 | 10 | 0 |
| N2 | 80 | 20 | 0 |
| N3 | 70 | 30 | 0 |
| N4 | 60 | 40 | 0 |
| N5 | 50 | 50 | 0 |
| N1-AL | 80 | 10 | 10 |
| N2-AL | 70 | 20 | 10 |
| N3-AL | 60 | 30 | 10 |
| N4-AL | 50 | 40 | 10 |
| N5-AL | 40 | 50 | 10 |
Table 3.
Maximum stress and maximum strain of the composite material.
| Sample ID | Maximum Stress(MPa) |
Modulus of Rupture (× 108 MPa) |
Maximum Strain Percentage (%) |
| N1 | 85 | 5.66 | 15 |
| N2 | 50 | 3.04 | 23 |
| N3 | 65 | 1.91 | 33 |
| N4 | 53 | 1.23 | 40 |
| N5 | 48 | 1.04 | 43 |
| N1-AL | 145 | 14.5 | 10 |
| N2-AL | 131 | 7.27 | 18 |
| N3-AL | 117 | 3.9 | 30 |
| N4-AL | 105 | 3.3 | 31 |
| N5-AL | 101 | 3.00 | 38 |
Table 4.
ANOVA of the experimental test results.
| ANOVA results (natural frequency) | ANOVA results (damped frequency) | ||||||||||||||||||||
| Source | DF | AdjSS | AdjMS | F-value | P-value | Source | DF | AdjSS | AdjMS | F-value | P-value | ||||||||||
| Epoxy | 4 | 36.310 | 9.0774 | 28.75 | 0.000 | Epoxy | 4 | 17.50 | 4.375 | 9.9 | 0.001 | ||||||||||
| PS | 4 | 201.630 | 50.4074 | 159.65 | 0.000 | PS | 4 | 209.3 | 52.32 | 118 | 0.000 | ||||||||||
| AL | 4 | 0.354 | 0.0884 | 0.28 | 0.08 | AL | 4 | 0.366 | 0.091 | 0.21 | 0.093 | ||||||||||
| Error | 12 | 3.789 | 0.3157 | Error | 12 | 5.305 | 0.442 | ||||||||||||||
| Total | 24 | 36.310 | 9.0774 | 28.75 | 0.000 | Total | 24 | 232.4 | |||||||||||||
| ANOVA results (damping ratio) | ANOVA results (logarithmic decrement) | ||||||||||||||||||||
| Source | DF | AdjSS | AdjMS | F-value | P-value | Source | DF | AdjSS | AdjMS | F-value | P-value | ||||||||||
| Epoxy | 4 | 0.0008 | 0.0002 | 16.0 | 0.00 | Epoxy | 4 | 0.0177 | 0.00443 | 20.58 | 0.000 | ||||||||||
| PS | 4 | 0.0039 | 0.0009 | 75.9 | 0.00 | PS | 4 | 0.3443 | 0.08607 | 0.69 | 0.061 | ||||||||||
| AL | 4 | 0.0003 | 0.00001 | 0.75 | 0.057 | AL | 4 | 0.0114 | 0.00286 | ||||||||||||
| Error | 12 | 0.00015 | 0.00001 | Error | 12 | 0.0501 | 0.00418 | ||||||||||||||
| Total | 24 | 0.00498 | 0.00112 | Total | 24 | 0.4237 | |||||||||||||||
| ANOVA results (impact strength) | ANOVA results (hardness) | ||||||||||||||||||||
| Source | DF | AdjSS | AdjMS | F-value | P-value | Source | DF | AdjSS | AdjMS | F-value | P-value | ||||||||||
| Epoxy | 4 | 6455 | 1613.76 | 24.59 | 0.000 | Epoxy | 4 | 4997 | 1249 | 131 | 0.00 | ||||||||||
| PS | 4 | 2346 | 586.66 | 8.94 | 0.001 | PS | 4 | 2155 | 538 | 56 | 0.00 | ||||||||||
| AL | 4 | 65.44 | 16.36 | 0.25 | 0.090 | AL | 4 | 17 | 4 | 0.4 | 0.06 | ||||||||||
| Error | 12 | 787.52 | 65.63 | Error | 12 | 114 | 9 | ||||||||||||||
| Total | 24 | 9653.96 | 2282.41 | Total | 24 | 7283 | 1800 | ||||||||||||||
Table 5.
The FEM leaf springs model specifications.
| Parameter | Value | |
| Vehicle weight (N) | 1400 kg x 9.81 m/s2 = 13734 | |
| Additional four seats weight (N) | 70 x 4 = 280 | |
| Total weight (N) | 14014 | |
| Applied weight on each multi-leaf system spring (N) | Applied weight on each multi-leaf system spring (N) | 14014/4 =3503.5 |
| Applied weight on each multi-leaf system spring (N) | ||
| Solid work leaf spring applied load (N) | 4000 | |
| Total length of main leaf, between eye centers (mm) | 1200 | |
| Length of each leaf (first/second/third/fourth), (mm) | 1150/1150/700/600 | |
| Leafs width (mm) | 60 | |
| Leafs thickness (mm) | 8 |
Table 6.
FEM leaf spring model mechanical properties.
| Model Reference | Properties | Components |
 |
Name: composite (1) (5) | SolidBody1(Cut-Etrude1)(Leaf1-1) |
| Model type: Linear Elastic Isotropic | SolidBody1(Cut-Etrude1)(Leaf2-1) | |
| Default failure criterion: Max von Misses Stress | SolidBody1(Cut-Etrude1)(Leaf3-2) | |
| Yield strength: 9e+008 Pa | SolidBody1(Cut-Etrude1)(Leaf4-1) | |
| Tensile strength: 1.31e+010 Pa | SolidBody 1(Cut-Extrude1)(box-1) | |
| Compressive strength: 1.3e+010 Pa | SolidBody1(Cut-Etrude1)(mainleaf-1) | |
| Elastic modulus: 7.27e+008 Pa | ||
| Poisson’s ratio: 0.3 | ||
| Mass density: 1.429 kg/m3 | ||
| Shear modulus: 3.189e+008 Pa | ||
| Damping ratio: 0.075 |
Table 7.
The resonant frequency of the first five modes.
| Mode No. |
Frequency (rad/s) |
Frequency (Hz) |
Period (s) |
| 1 | 2992 | 476.19 | 0.0021 |
| 2 | 6753.9 | 1074.9 | 0.00093 |
| 3 | 10901 | 1735 | 0.000576 |
| 4 | 12691 | 2019.9 | 0.000495 |
| 5 | 17341 | 2759.8 | 0.000362 |
Table 8.
The copolymer blend and the composite density.
| Material | Density (kg/m3) |
| N1 | 1.125 |
| N2 | 1.15 |
| N3 | 1.175 |
| N4 | 1.2 |
| N5 | 1.225 |
| N1-AL | 1.404 |
| N2-AL | 1.429 |
| N3-AL | 1.454 |
| N4-AL | 1.479 |
| N5-AL | 1.504 |
Table 9.
FEM comparison of composite and steel leaf springs each component characteristics.
| Solid Bodies |
Volumetric Properties of Steel |
Volumetric Properties of Composite Material |
Comp. |
| Cut-Extrude1 | Mass (kg): 3.44094 | Mass (kg): 0.638584 | Leaf1.SLDPRT |
 |
Volume (m3): 0.00044 | Volume (m3): 0.00044 | |
| Density (kg/m3): 7700 | Density (kg/m3): 1429 | ||
| Weight (N): 33.7212 | Weight (N): 6.25813 | ||
| Cut-Extrude1 | Mass (kg): 3.21978 | Mass (kg): 0.59754 | Leaf2.SLDPRT |
 |
Volume (m3): 0.00041 | Volume (m3): 0.00041 | |
| Density (kg/m3): 7700 | Density (kg/m3): 1429 | ||
| Weight (N): 31.5538 | Weight (N): 5.85589 | ||
| Cut-Extrude1 | Mass (kg): 2.67592 | Mass (kg): 0.496608 | Leaf3.SLDPRT |
 |
Volume (m3): 0.00034 | Volume (m3): 0.00034 | |
| Density (kg/m3): 7700 | Density (kg/m3): 1429 | ||
| Weight (N): 26.224 | Weight (N): 4.86676 | ||
| Cut-Extrude1 | Mass (kg): 2.48378 | Mass (kg): 0.46095 | Leaf4.SLDPRT |
 |
Volume (m3): 0.000322 | Volume (m3): 0.00032 | |
| Density (kg/m3): 7700 | Density (kg/m3): 1429 | ||
| Weight (N): 24.341 | Weight (N): 4.51731 | ||
| Cut-Extrude1 | Mass (kg): 1.256 | Mass (kg): 0.233094 | Box.SLDPRT |
 |
Volume (m3): 0.00016 | Volume (m3): 0.00016 | |
| Density (kg/m3): 7700 | Density (kg/m3): 1429 | ||
| Weight (N): 12.3088 | Weight (N): 2.28432 | ||
 |
Mass (kg): 5.03329 | Mass (kg): 0.934101 | MainLeaf.SLDPRT |
| Volume (m3): 0.00065 | Volume (m3): 0.00065 | ||
| Density (kg/m3): 7700 | Density (kg/m3): 1429 | ||
| Weight (N): 49.3263 | Weight (N): 9.15419 |
Table 10.
EMPF of the FEM composite leaf spring.
| Mode No. | Frequency(Hz) | X direction | Y direction | Z direction |
| 1 | 476.19 | 0.86375 | 5.449e-007 | 5.0924e-006 |
| 2 | 1074.9 | 1.5279e-005 | 3.984e-007 | 0.2436e-006 |
| 3 | 1735 | 2.3441e-007 | 0.7351 | 1.0623e-006 |
| 4 | 2019.9 | 4.4779e-007 | 0.0001906 | 3.8658e-006 |
| 5 | 2759.8 | 2.6258e-006 | 0.2019 | 9.6323e-006 |
| Sum X = 0.86376 |
Sum Y = 0.93719 |
Sum Z = 0.24362 |
Disclaimer/Publisher’s Note: The statements, opinions and data contained in all publications are solely those of the individual author(s) and contributor(s) and not of MDPI and/or the editor(s). MDPI and/or the editor(s) disclaim responsibility for any injury to people or property resulting from any ideas, methods, instructions or products referred to in the content. |
© 2025 by the authors. Licensee MDPI, Basel, Switzerland. This article is an open access article distributed under the terms and conditions of the Creative Commons Attribution (CC BY) license (http://creativecommons.org/licenses/by/4.0/).
Copyright: This open access article is published under a Creative Commons CC BY 4.0 license, which permit the free download, distribution, and reuse, provided that the author and preprint are cited in any reuse.


