
Submitted:
20 November 2025
Posted:
21 November 2025
You are already at the latest version
Abstract
Rural and agricultural runoff continues to pose a threat to water quality and human health despite a plethora of research identifying likely causes. Large livestock operations and leaking septic systems have proven to be significant sources of both nutrients and bacteria in the form of algal blooms and antibiotic-resistant Escherichia coli. Many times, these impacts are witnessed on a watershed scale. Implementing remedies are complicated by livestock operations defined as point source facilities under the USA Clean Water Act (CWA) but regulated as non-point source agricultural runoff. Additionally, the State of Michigan is the only state in the USA without a comprehensive rural septic system law. Pollutant assessment of watersheds involves a wide array of sampling parameters that focus primarily on impacts after-the-fact. Non-point source pollution, particularly in rural areas, lacks regulatory teeth; this watershed management approach is not sustainable as evidenced by continual degradation of our rural watersheds. This study lays out a streamlined methodology incorporating focused parameters that can infer pollutant pathways and processes. We illustrate the methodology using data collected in the Pine River watershed (central Michigan) where multiple pollutant inputs were defined as exceeding water quality standards in channels and reservoirs. The results of this work beg for better understanding of what should be defined as sustainable and unsustainable land use/watershed management. Using simplified field and laboratory techniques, it is possible for local communities, educational institutions, and regulatory agencies to identify likely pollutant sources violating water quality standards regardless of point or nonpoint designation.
Keywords:
nutrient loading
; E. Coli
; CAFO
; point source
; algal bloom
; clean water act
; septic system
; agricultural runoff
; sustainable agriculture
1. Introduction
Since their inclusion in the Clean Water Act (CWA), large livestock facilities, AFOs (Animal Feeding Operations) and CAFOs (Confined or Concentrated Animal Feeding Operations) have been researched as to their impacts on surface and groundwater [1]. A recent study showed that the number and size of these large livestock facilities have grown and tend to occur in clusters, increasing nutrient and bacterial loading in nearby streams. These impacts are measured on a watershed scale and are susceptible to climate-related exacerbations [2,3,4,5].
Specific effects from these operations include algal blooms and high concentrations of fecal coliform bacteria, including antibiotic resistant Escherichia coli (E. coli) and other microbial organisms [6,7,8]. High concentrations of E. coli in waterways poses a real and present risk to human health in many forms [1,6,9]. In large part, this is why the United States Environmental Protection Agency (USEPA) has identified agricultural runoff as the leading cause of national water quality impairment [10].
Livestock operations occur in rural areas across the USA where enough water is present to meet animal demands – often, in the headwaters of riverine watersheds. Animal waste production, handling, and manure land application in headwaters result in pollutant impacts far downstream [1,2]. In the Great Lakes, there are growing concerns about eutrophic impediments similar to Lake Erie’s harmful algal blooms (HABs) [11]. Studies from Saginaw Bay show increased nutrient and bacterial loading from the watersheds that feed into it. Combined with climate-related impacts such as warmer surface water and heavier rain events, this can result in long-term flushing of agricultural pollution downstream [12]. Roso [13] describes the risks of nutrient migration far downstream due to inadequate and sometimes incompatible assessment regimens and regulations by State water quality agencies. From these studies and others, it is clear that the water quality management approach for this type of agriculture is not sustainable or protective of water quality.
The reason for this is due to how the regulatory structure of CAFOs has evolved. According to the 1977 amendments to the CWA, CAFOs are listed with municipal wastewater treatment plants (WWTP) and factories as point-source discharging facilities. As such, they must obtain a National Pollutant Discharge Elimination System (NPDES) permit to operate [14]. Factory and WWTP permits set standards on emissions into nearby waterways such as nutrients, bacteria, metals, and other pollutants. Exceedance of standards are enforced by state agencies such as Michigan’s Department of Environment, Great Lakes and Energy (EGLE) and USEPA [15].
CAFOs are agricultural operations and as such, their permits are written as if they are non-point source operations. This is because in theory, there exist no effluent conduits from CAFO operations to nearby waterways. Their permits are based mainly on how animal waste is handled through a nutrient management plan that promotes best management practices [15]. Violations of CAFO permits, if they are not violating general CWA standards are not enforced except in the form of warnings or citations. If however, CAFO operations do violate CWA standards, they are subject to the same enforcement measures as factories and WWTPs [16].
Given the ubiquitous use of drain-tiles (underdrains) in most agricultural regions of the country, research has shown CAFO operations and the fields over which manure is applied essentially can act as point source inputs [17,18,19]. If a specific input of manure (E. coli, nutrients, etc…) could be identified either through manure application or from the facilities themselves, regulatory agencies could take action to mitigate inputs at their source. This is a critical point for this paper in that regulatory action that can be linked with specific CWA violations that will result in mitigation at the source promoting more sustainable land use practices [15].
In the Central, Lower Peninsula region of Michigan, several examples of watershed-level impacts have been observed [2,6,8]. According to the USEPA, rural communities are growing frustrated where State or federal water enforcement agencies are unable or unwilling to address issue(s) such as widespread algal blooms [20]. However, most communities - even remote, rural communities have at their disposal multiple sources of aid. These include colleges and universities; local village and township offices; municipalities; national, state and regional non-profit organizations and even local community foundations. Likewise, county drainage commissioners, county conservation districts, and even individual residents may be willing and able to spend time meeting and developing plans to address specific problems. Magner [21] found that developing and promoting a systems approach between experts and end-users as well as other stakeholders can lead to improved management of waterways. Additionally, the internet is a powerful and useful tool to access both reports and experts in the field [22].
The Pine River Watershed in the Upper Saginaw River Drainage Basin has been studied continuously and extensively for nearly twenty-five years by Alma College. Over that time, results have shown a widespread degradation of the watershed due to nutrient and bacterial loading, mostly as a result of animal waste runoff from manure application sites, livestock facilities, and illegal dumping [2]. This presents a problem: how can specific pollutant sources be identified within a background of almost complete watershed impairment? More importantly, is there a methodology that can be implemented by colleges and universities, non-profit organizations and even state enforcement agencies to identify these pollutant sources within a reasonable timeframe at a reasonable cost?
This paper summarizes streamlined field and lab processes and applied those methods to a case study where algal blooms have been observed in an intensively managed watershed. The goal is to demonstrate that point-source pollution can be identified even in a region of intense agricultural activity using simplified procedures accessible to local municipalities, colleges, and non-profit organizations.
2. Setting: Upper Saginaw River Drainage Basin
The Pine River Watershed occupies the upper reaches of the Saginaw River Drainage Basin, one of the largest freshwater basins in the U.S. The Saginaw River Drainage Basin ultimately feeds into Saginaw Bay which is part of Lake Huron [23] (Figure 1). The entire portion of the headwaters of the Pine River has been impacted by runoff, mainly due to over-storage and widespread application of animal waste from large livestock facilities. Until 2017-2018, these impacts were mainly confined to a region of the watershed above the Alma Dam in the main trunk of the Pine River [2] (Figure 2).
By 2017 and 2018, residents downstream of the Alma Dam near St. Louis, Michigan noticed a precipitous and pervasive growth of algae and aquatic vegetation in the Pine River. By 2019, there was a formal complaint lodged at a City of St. Louis Commission meeting as reported in the Gratiot County Herald. Alma College, the Great Lakes Watershed Institute, and the State of Michigan were contacted by the cities of St. Louis and Alma, Michigan to help ascertain why algal blooms are suddenly appearing downstream of the Alma Dam. Because the watershed was so heavily impacted by agricultural inputs, it was assumed nutrients from upstream sources flowing over the Alma Dam were the main source of the algal blooms. Upon closer inspection other possible sources emerged [2].
An attempt was made to identify all potential nutrient inputs into the Pine River above St. Louis. Four sites of interest were identified (Figure 3). These included: 1. Water coming over the Alma Dam; 2. The City of Alma Wastewater Treatment Plant (WWTP); 3. A tributary entering the Pine River from the South (Horse Creek); and 4. A tributary entering the Pine River from the North (Sugar Creek) [2].
The City of Alma WWTP has been monitored by Alma College as a potential source of nutrient and bacterial loading for at least a decade. Results from those sampling events as well as the annual reports on WWTP emissions showed no statistically significant differences in either nutrients or E. coli compared with the water coming over the Alma Dam. Therefore, the WWTP plant could be eliminated as a potential source of nutrient loading [2]. This left two tributaries and the Pine River at Alma Dam as potential sources. All of these potential sources are heavily impacted by agricultural runoff. A specific methodology needed to be established not only to identify general sources, but the specific inputs or point sources that were responsible for the algal bloom.
3. Methodology
As mentioned in the introduction, the regulatory action regarding water pollution according to the Clean Water Act is determined by the presence of point source inputs. This is true for a permitted CAFOs even though landscape runoff occurs as non-point source pollution. If point source inputs can be identified, swifter and more effective, and sustainable action can be taken to improve water quality.
Methodology governing agricultural inputs tends to follow regulatory monitoring guidelines such as Total Maximum Daily Load (TMDL) parameters. TMDLs are required for waters that fail to meet water quality standards including numerous analytes such as NH3 -N; NO3-N; Total Nitrogen; Total Phosphorus; Soluble Reactive Phosphorus (SRP); Dissolved (electrically-charged) solids; Dissolved Oxygen; Water Temperature; pH, bacteria, and many more [24]. This study describes a methodology that streamlines field sampling and laboratory analyses including some methods that are not well-represented in the literature. This streamlined methodology is evaluated through their application to a case study in an impacted watershed.
3.1. Streamlining Parameters
This study streamlines sampling and analytical work to only three parameters: ammonia as nitrogen (NH3-N); Soluble Reactive Phosphorus (SRP or orthophosphate) and thermotolerant Escherichia coli (E. coli) bacteria. Dissolved oxygen and temperature are useful, but only towards the end of the sampling season as continued nutrient inputs cause algae “pulses” that spike oxygen levels commensurate with inputs [18]. Three arguments provide reasons for streamlining findings to these parameters: First, these parameters are universally representative of agricultural impacts – especially those impacts from large livestock facilities [25,26,27]. Second, these parameters can be used to determine proximity of impacts to known agricultural source(s) through a simple correlation of NH3-N and SRP [17,18,28]. Third, these parameters are also excellent indicators of overall health of the watershed [29]. Finally, it is important to note that these parameters are relatively easy and inexpensive to incorporate into a comprehensive sampling plan for any rural community, two-year or four-year college, or non-profit entity to employ.
3.2. Distinguishing Livestock Waste Impacts from Chemical Fertilizers
Some studies have compared the efficacy of using chemical (synthetic) fertilizers vs. organic (animal waste) from the perspective of life cycle assessment [30]. But these studies rarely look at the external costs (environmental and financial) due to runoff. In fact, as early as 1979, the use of manures as fertilizers was considered less effective compared with chemical fertilizers. A University of Nebraska study found, “[l]iquid manures have little potential economic value as fertilizer outside the farm where produced.” [31]. In short, the main reason for applying manure to cropland is to relieve the storage containment systems where it resides. This is why manure many times is applied to fallow land.
Recent studies have shown that nitrogen isotope analyses can distinguish chemical fertilizer nutrients from those in animal waste due to the fact animals ingest nitrogen stored in plants [32]. However, past arguments have been made that if these two sources mix downstream (via runoff), it is difficult to determine a dominant source. The mixing of nitrogen isotopes begins in the soil nutrient pool, and changes depending on whether soil thaws or summer rains are driving mobilization of nutrients. This shows that it is difficult to obtain definitive results [33]. The USEPA now has an application produced by Microsoft that models relative proportions of chemical and animal nutrient sources using stable carbon and nitrogen isotopes [34]. This assessment is complicated and expensive, given samples must be collected and sent to specialized laboratories that do isotope analyses. Borrello [18,28] found that regular sampling in certain impacted areas of a watershed can distinguish dominant inputs through the addition of an E. coli concentration analysis accompanying nutrient data. Part of the reason for this is that E. coli that accompanies nutrients reveal an organic source. It has been shown that this combination continues to impact surface water longer due to climate change [5]. Adding E. coli assessment to nutrient sampling is inexpensive and has a much swifter turn-around time than if samples were sent to external labs. Consistently high concentrations of nutrients near a suspected input site without associated high concentrations of E. coli would indicate chemical fertilizers as the dominant source while excessive concentrations of E. coli correlative with high nutrient concentrations might indicate animal waste as a potential source [35].
3.3. Distinguishing Septic System Leakage from Livestock Runoff
Michigan is the only state in the USA without a comprehensive septic code [36]. The Michigan State Extension Office has determined that leaking septic systems are second only to agricultural runoff as the major source of water pollution in Michigan [37]. As a result, it is difficult to distinguish the origin of bacterial and nutrient loading in a waterway [38].
Differentiating bacteria (E. coli) produced by livestock and humans is not as straight-forward as it might appear. Carson [39] found ribotyping bacteria (a form of fingerprinting by isolating rRNA bacteria genes) was helpful, but field testing shows it is not always accurate. Tyagi [40] conducted a review of methods on speciating gut bacteria such as E. coli as well as chemical methods of isolation. They found, “…it is unlikely that any single determinant to be useful in all situations, but a multiple biomarker approach or statistical analysis of microbial and chemical determinants offer the possibility of identifying and apportioning human and animal fecal inputs to natural waters.” In short, determining sources of human vs. livestock bacteria has proved expensive and problematic.
In this study, we were able to use simple field techniques to assess the likely origin of E. coli. As mentioned in the introduction, most livestock waste enters surface water via underdrains. Manure slurry can stagnate in these underdrains until a rain event acts as a flushing agent [41]. Conversely, human waste enters surface water as groundwater seeps if a septic tank is missing or from a “direct connect” or bypass pipe usually constructed by the owner many generations prior. In Michigan, a faulty septic system is usually due to water bypassing a disconnected or overfilled tank discharging as contaminated groundwater into the nearest surface water body [41].
Pandey [42] showed that rain events (over 1.25 – 2 cm in a 24-hour period) in rural Iowa mobilized animal-related E. coli primarily through underdrain flushing and provided a short lag time between the rain events and E. coli found both in water and stream sediment. Leaking septic systems, however, do not respond proportionally to the same to rain events. There is a maximum flow rate defined by Darcy’s equation for subsurface flow. One study showed mobilization of microbial contaminants from septic systems to shallow wells, took at least one-to-two weeks even in highly permeable soils [43]. In short, E. coli flushing from underdrains after a rain event results in swifter impacts to surface water compared with septic waste flowing through permeable media. The method of using rain events as a distinguisher between septic and livestock inputs is effective, simple, and inexpensive.
3.4. Determining Proximity of Nutrient Inputs Using SRP and NH3 Correlations
As mentioned, consistent water sampling in an impacted region may yield geochemical signatures identifying input sources (17,18,28]. As manure leaves the animal host, SRP and NH3-N degrade in different ways and at different rates. Ammonia will volatilize and oxidize eventually to a more stable nitrate (NO3-N). SRP does not volatilize but is taken up by micro-plants including aquatic plants such as duckweed (i.e., Lemna minor and Lemna perpusilla) and algae.
A simple Pearsons Coefficient Correlation analysis between SRP and NH3-N can help identify the point source of impact [17,28,44]. Studies have shown when there are no significant inputs between suspected point sources, correlation (r values) can reach over 90%. As time and space separate suspected point sources, the r value is reduced in a linear fashion, though it is unclear how far in time and space the linear relationship exists [28].
3.5. Application of Methods
The methods described above were implemented in a case study intended to identify a point source in relation to the appearance of a recent algal bloom. All sampling and analytical work followed established protocols by USEPA and the State from where samples were being taken (QAPP guidelines). These protocols, for the most part rely on those highlighted in Mitchell and Stapp [45]. Frequent discussions with Michigan’s Department of Environment, Great Lakes, and Energy (EGLE) were made when faced with unusual incidents, such as extremely low-flow conditions or interruptions by land-owners.
For field sampling, sterile and plastic containers were used to obtain water samples. Samples were placed on ice and taken to the laboratory for analyses within sixty minutes. Once in the lab, a DREL 3900 Spectrophotometer was used in which triplicate aliquots were run. Averages were calculated and outliers (those outside of 20% of the mean), were discarded. For three divergent samples, three new aliquots were run. A one-way ANOVA analysis was run including t-tests for significance and Pearsons Correlation Coefficient as specified in the results below. For thermotolerant E. coli measurements, Micrology labs Easygel ® media were used but were compared with media production and plating using USEPA Procedure 1603 in the Great Lakes Watershed Institute lab. Coliscan Easygel is an easy, efficient, and inexpensive means of determining thermotolerant E. coli. Triplicate plates were created and number of colonies on each plate were averaged. All results were assessed for significance.
4. Pine River Results: Protocol Applied
For over six decades, Alma College, and now the Great Lakes Watershed Institute (GLWI) have aided local municipalities and State and federal regulatory agencies to create a water quality database for understanding watershed-level degradation. When an algal bloom appeared relatively suddenly near the small town of St. Louis, Michigan, Alma College and GLWI began water sampling in order to help identify potential source(s).
As mentioned, there are only four potential inputs that could feed algae and aquatic vegetation in the areas observed (see Figure 3). These included two tributaries flowing into the Pine River upstream of the algal bloom, the city of Alma’s wastewater treatment plant, and the water flowing over the Alma Dam. Regarding the wastewater treatment plant, data taken between 2012-2024 show no significant difference (p ≤ 0.91) in SRP or E. coli (p≤ 0.88) concentrations between the sampling sites at the Alma Dam and just downstream of the WWTP. Therefore, the Alma WWTP was eliminated as a potential source and focus remained on water coming over the Alma Dam and the two tributaries.
4.1. Comparing Data Between Three Potential Input Sites Using Streamlined Parameters
Data collected since 2012 show the three potential sites (Alma Dam, Horse Creek, and Sugar Creek) all have been impacted by agricultural inputs, but there is a change in the relationship between Sugar Creek and the other sites (Figure 4). Results show similar nutrient and E. coli concentrations until 2019 when Sugar Creek becomes the dominant source of nutrients as well as E. coli.
Though helpful, merely identifying a tributary as a major nutrient source is not enough to accomplish any meaningful regulatory action. In short, the only sustainable solution would result from the identification of an NPDES permitted point source input. The NPDES permit is a strong legal means of enforcement of CWA violations. A consent decree would then drive remedial action to improve the algal bloom problem. The decision was made to focus on the headwaters of Sugar Creek.
4.2. Application of Methods: Towards Finding Specific Point Sources for Sugar Creek
Data show that over the past several years, sampling sites beginning in Sugar Creek’s headwaters had the highest concentrations of both nutrients and E. coli (Figure 5). Other realities became clear when reviewing Sugar Creek data: a) Nutrients were linked with E. coli concentrations, which were both consistently high throughout the Summer, and b) Nutrient and especially E. coli concentrations fluctuated significantly after rain events. Figure 6 illustrates how E. coli concentrations responded within hours of a rain event of over 2 cm within a 12-hour period. This was also observed in past years (Figure 7).
Interestingly, excessive concentrations of both nutrients and E. coli did not appear to be linked with any obvious inputs adjacent to the creek. Aerial images showed very few homes near the areas where high concentrations of nutrients and E. coli were being reported. Additionally, manure application permits do not involve any lands adjacent or even within a 1.5 Km radius of Sugar Creek. When comparing data from 2024, results for 2025 exhibit similar trends over time including a downward (negative) trend for NH3-N and an upward (positive) trend for soluble reactive phosphorus moving downstream from the headwaters of Sugar Creek (Figure 8). This correlation of trends for the same sampling sites was moderately strong for field-based data. It is important to note that the three sites are no more than 1.2 Km from the visible start of Sugar Creek.
Since concentrations of both nutrients and E. coli were high in an area of the creek that had no obvious inputs, a correlative analysis was done with NH3-N and SRP to see if there was either a point source directly at the headwaters, or if a linear relationship between SRP and NH3-N occurred in a downstream direction. Results show a stronger correlation at the start of the creek and decreasing in a linear fashion downstream. These results were highly unique when compared with a similar three sample sites (control) in another location on the Pine River (Figure 9).
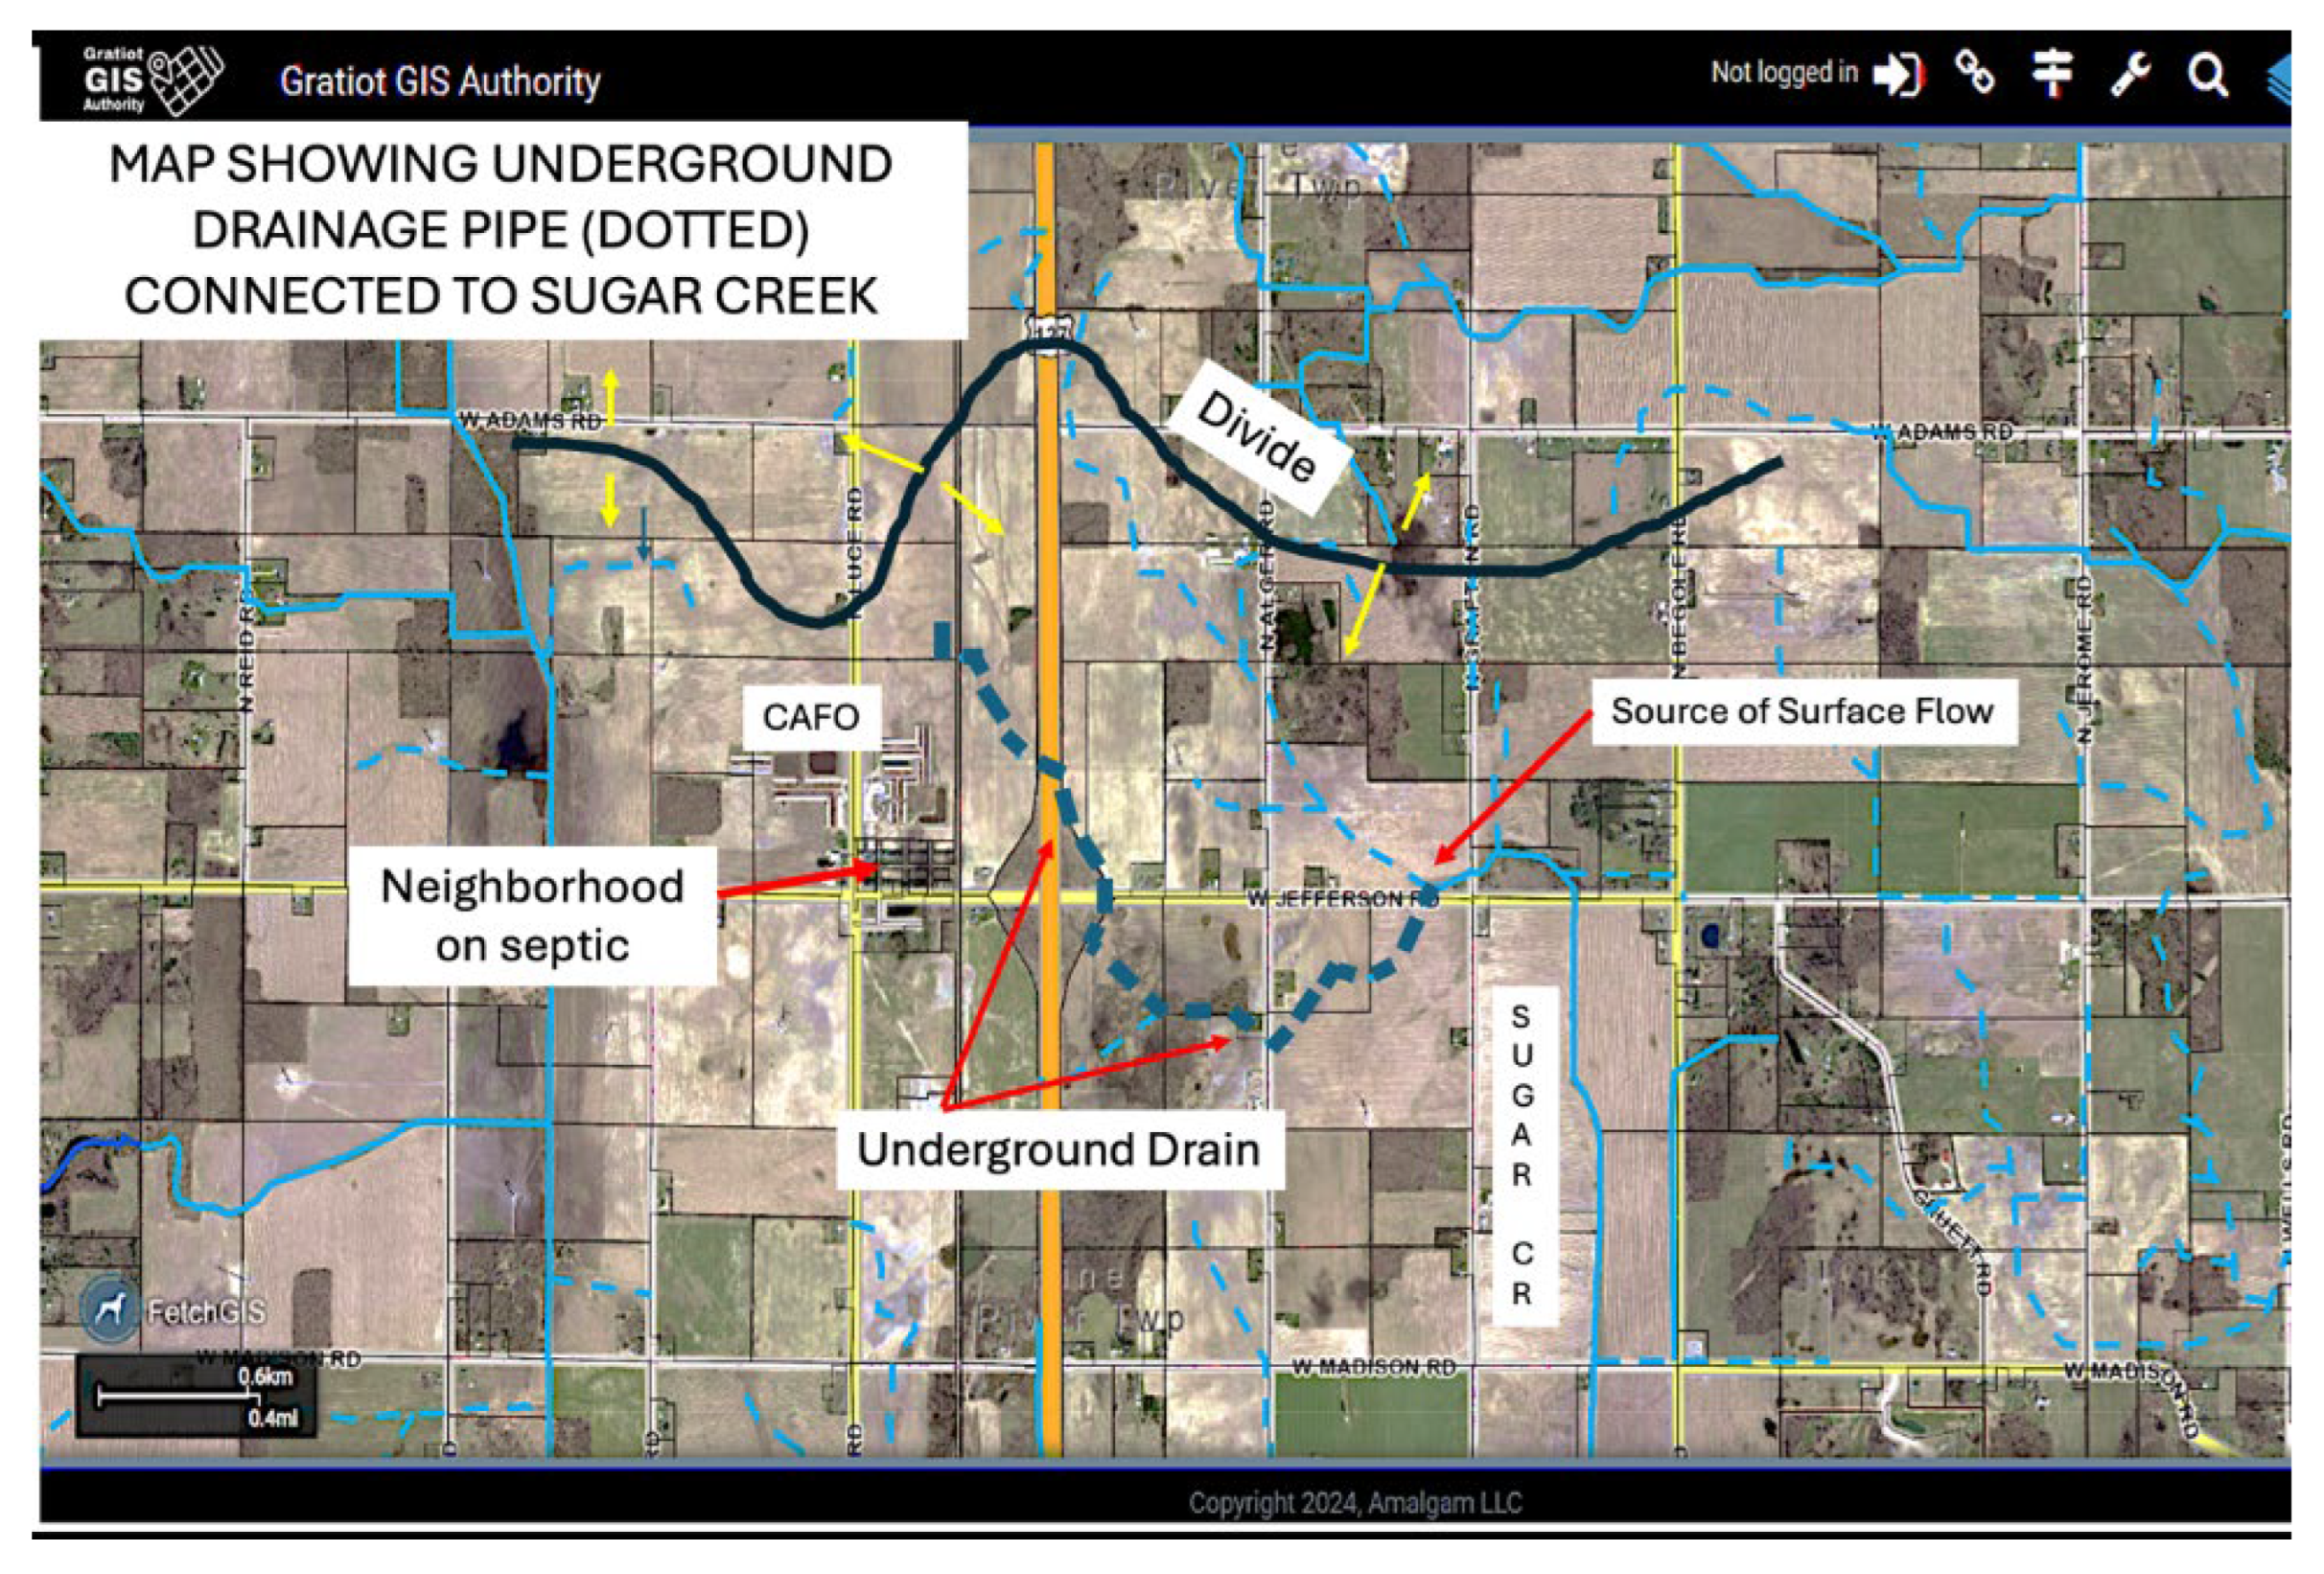
Since data indicated there is an input of both nutrients and E. coli at the headwaters of Sugar Creek, it is possible there is a hidden impact further up gradient. Sugar Creek is both a natural tributary and a county drain, so a county drain map was consulted through the Michigan Geographic Framework (MGF). This map showed the connection of an underground pipeline (drain) at the source of Sugar Creek. As Figure 10 shows, this underground drain (noted by dotted blue lines) bifurcates but connects Sugar Creek with some potential sources not obvious from field view.
Satellite imagery from a publicly-available county drain website was used to see if the underground drain showed any surface indicators of inputs into the drain. Comparing satellite images from different timeframes, there appears to be a connection between a livestock facility and a drain basin (surface access point or manhole) that links the underground drain to Sugar Creek. Adding a topographic profile GIS tool to the image, a downgradient slope from the livestock facility to the manhole was determined. Further analysis and slight enhancement of image characteristics show staining on the surface between the livestock facility and drain basin. This is first identified in the 2015 image and appears to expand in size and deepen in color in the 2024 image (Figures 11- 12).
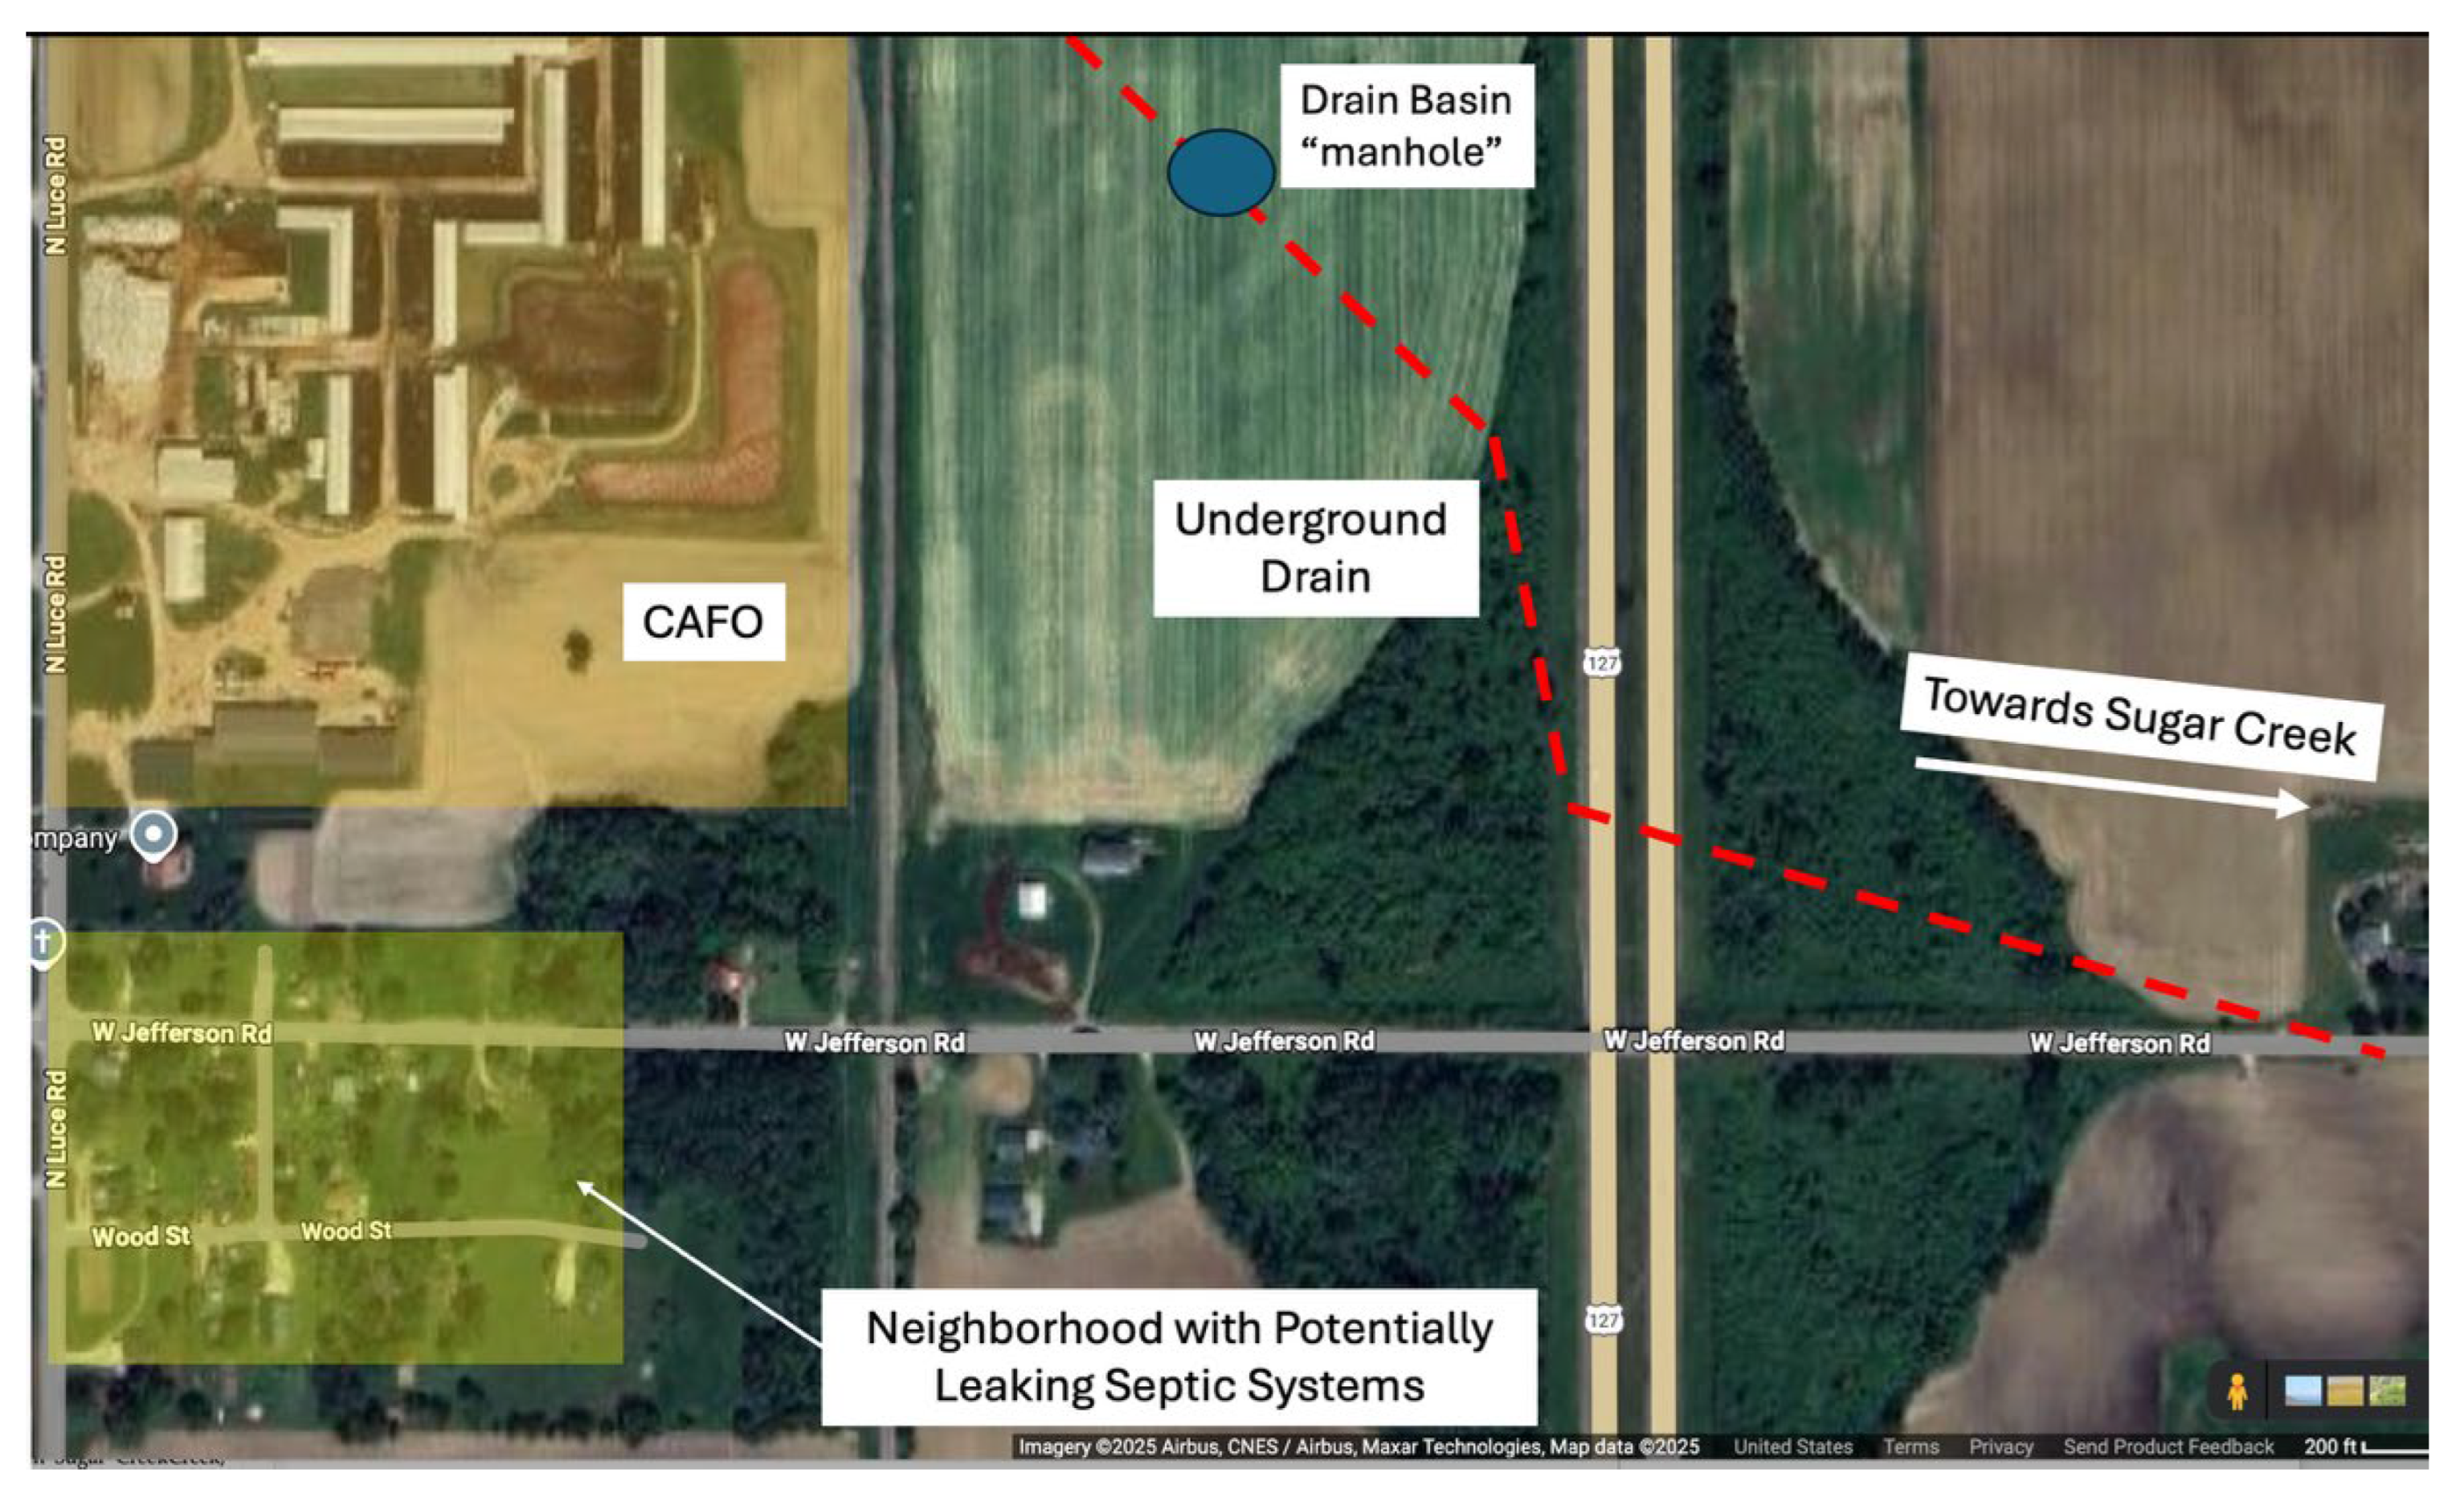
After observing the results from the MGF satellite maps, the County Drain Commissioner was consulted and a second potential input was identified in the small neighborhood south of the CAFO property. County Drain records indicated few homes had any septic system permits leaving the possibility for septic seepage into the drain basin connecting the underground drain with Sugar Creek (Figure 13).
5. Discussion
Several unique methods were applied to an algal bloom problem in the Pine River in rural, Central Michigan. New algal activity points to unsustainable upgradient land use. The goal was to identify potential point source(s) responsible for the recent appearance of the algal bloom. Referring to past data collected on the headwaters of the Pine River watershed near the location of the algal bloom, it was obvious one tributary (Sugar Creek) was the dominant source of nutrients and potentially the source of the algae. Despite the fact Sugar Creek was already impacted from agricultural runoff, a streamlined methodology helped identify specific inputs (point sources) that are likely the ultimate source of nutrients feeding the observed algae. Results of this study provide evidence of the following:
5.1. Nutrient Sources Are Coming from Animal Waste, Not Chemical Fertilizer
Sugar Creek flows through extensive agricultural land, much of which is fertilized with chemical (inorganic) fertilizers. High concentrations of thermotolerant E. coli are measured with high concentrations of nutrients (NH3-N and SRP) in Sugar Creek indicating that the source of nutrients is likely animal waste. Trends of both E. coli and nutrients over time are observed and have a reasonably high correlation for field-based data (r = 0.78). Therefore, it is unlikely that there are chemical fertilizer sources of nutrients and an unrelated E. coli source coming into Sugar Creek.
5.2. Input of Nutrients into Sugar Creek is Occurring Upgradient of the Head or Source of the Creek
High nutrient and E. coli concentrations occur in the headwaters of Sugar Creek despite no obvious inputs at this location. Concentrations are highest at the headwaters compared with other sites along the creek. A simple Pearsons Coefficient Correlation analysis between NH3-N and SRP showed a negative linear trend of correlation from the very head of the creek downstream. This shows there is likely a source input upgradient of the start of Sugar Creek and no significant sources beyond the headwaters. Satellite images and county drain maps confirm the existence of an underground drain that begins in the vicinity of a CAFO and small neighborhood which ties directly into the headwaters of Sugar Creek, thereby making it the likely input conduit of nutrients and E. coli.
5.3. The Source of Nutrients Is Likely Livestock Waste and Not Septic System Leakage
The underground drain terminates in the vicinity of a CAFO, and small, rural community (neighborhood). However, rain events produced sharp, and significant increases in nutrients and thermotolerant E. coli occurred in the headwaters of Sugar Creek. The evidence suggests surface runoff from the CAFO and not groundwater leakage contributing to the nutrient and bacterial loading in Sugar Creek. The response to the rain event was measured after only a few hours, much faster than what groundwater flow could produce.
Additionally, satellite images taken at five-year intervals over the last fifteen years show the appearance, and expansion of a dark surface stain leading from the CAFO across a field to a drain field (access point) of the underground drain that leads directly to the start of Sugar Creek. The stain appears adjacent to a line of cattle stalls and near to a manure lagoon. Not only does this indicate the potential for runoff from the CAFO as the main nutrient and bacterial source, but the timing of the stain’s appearance also coincides with the timing of residents’ observations of the algal bloom near the city of St. Louis.
5.4. Other Possibilities: Future Studies
Though the CAFO appears to be the main source of both nutrients and bacteria, the potential impact from the rural neighborhood community itself cannot be completely discounted. Consultations with the Drain Commissioner revealed that there are many cases in which owners of older rural homes, in lieu of a permit (which may not have been available at the time), constructed their own septic systems that tied in with other neighboring systems. Many times, these collective drains tie into an underground pipe/drain that leads to the nearest surface waterway.
The data gathered and presented here provides enough information for regulatory agencies to investigate the potential inputs GLWI identified. Furthermore, because these are point source inputs, the regulatory response can be more than a notice of violation of a CAFO permit, which carries few (if any) penalties. Point source inputs violate the CWA and as such are subject to fines and penalties that are likely to produce a stronger, more thorough, and longer-lasting response by the violator.
6. Conclusions
Agricultural impacts are the number one source of water pollution in the USA. Rural communities struggle to address this problem as they are the most vulnerable with the fewest resources. Part of the dilemma local communities face in addressing agricultural impacts is due to the way some of these operations are regulated, as well as the difficulty in identifying specific inputs or sources creating massive algal blooms and bacterial loading. This manuscript highlights the current unsustainable regulatory enforcement mode. Sustainable water quality in the Pine River Watershed will require citizens to rise up and demand better land use management and enforcement of the CWA. But they need ammunition in the form of the identification of specific inputs.
Through the use of simple, relatively inexpensive tools and consistent sampling, it is possible to identify inputs into waterways that could be causing water quality impairment. Streamlining methodology and creating partnerships with stakeholders in the local community prove extremely helpful and can save time and resources. The study herein can be a template for use in other watersheds impacted by persistent agricultural runoff. Community groups, academic institutions, and environmental non-profits all possess the ability to, with a little investment of resources, replicate the findings in this study
Author Contributions
Conceptualization, M.B., H.A., M.H. and J.M.; methodology, H.A., E.G., B.C., L.M., C.C., M.B.; software, H.A., C.C., B.C..; validation, M.B. and M.H..; formal analysis, M.B.; investigation, M.B., H.A., E.G., B.C., C.C., L.M.; resources, M.B.; data curation, H.A., B.C., C.C.; writing—original draft preparation, M.B.; writing—review and editing, M.B., H.A., J.M. M.H.; visualization, M.B.; supervision, M.B.; project administration, M.B.; funding acquisition, M.B. All authors have read and agreed to the published version of the manuscript.
Funding
This research was funded by a Department of Education grant no: P116Z240174, and by a donation from the Healthy Pine River Group.
Institutional Review Board Statement
This study did not include humans or animals and therefore did not require institution review of any kind.
Data Availability Statement
Data supporting this study, and previous data on similar areas of the watershed mentioned herein may be accessed through written request to the lead author at: borrello@alma.edu
Conflicts of Interest
The authors declare no conflicts of interest.
Abbreviations
The following abbreviations are used in this manuscript:
| CWA GLWI AFO |
Clean Water Act Great Lakes Watershed Institute Animal feeding operations |
| CAFO | Confined animal feeding operations |
| HAB | Harmful algal blooms |
| WWTP | Wastewater treatment plant |
References
- Burkholder, J.A.; Libra, B; Weyer, P.; Heathcote, S; Kolpin, D.; Thorne, P.S. Impacts of waste from Concentrated Animal Feeding Operations on water quality. Env Health Persp. 2007, 15, 309-312. [CrossRef]
- Borrello, M.C.; McPhail, C.; Pink, S.; Veverka, J. General Overview of the Status of the Upper Saginaw River Drainage Basin, Pine River Watershed, Central Lower Peninsula, Michigan. Report submitted to the Office of Water Enforcement and Compliance, U.S. Environmental Protection Agency, Region V. Water enforcement and compliance assurance, Chicago, IL. July, 2023.
- Miralha, L.; Sidique, S.; Muenich, R. The spatial organization of CAFOs and its relationship to water quality in the United States. Jrnl of Hydrol. 2022. 613 128301. [CrossRef]
- Waller, D.; Meyer, A.; Raff, Z.; Apfelbaum, S. Shifts in precipitation and agricultural intensity increase phosphorus concentrations and loads in an agricultural watershed. Jrnl of Env Mangt. 2021. 284. 112019. [CrossRef]
- Su, H. Impact of Industrial Agriculture on the Water Environment and Human Health – Focusing on Watersheds that Feed Lake Michigan and Lake Huron. MSc in Environmental Protection and Management. University of Edinburgh, Edinburgh, Scotland, UK., 25 August, 2020.
- Hamilton, B.M.; Harwood, A.D.; Wilson, H.R.; Keeton, T.P.; Borrello, M.C. Are anglers exposed to Escherichia coli from an agriculturally impacted river? Env Monit Assess. 2020. 192. 216 (9pp). [CrossRef]
- Gilbert, P. From Hogs to HABs: Impacts of Industrial farming in the U.S. on nitrogen and phosphorus and greenhouse gas pollution. Biogeochm. 2020. 150. 139-180.
- Borrello, M.C.; Keeton, T.P.; McGrew, T.; VanHavel, E.; Montoye, E.; Swift, C. Measuring nutrient loading and associated antibiotic resistant E. coli in water and air samples near large livestock facilities in Michigan. In Proceedings of American Association for the Advancement of Science Annual Meeting, Boston, MA, USA. February 14-18, 2013.
- Mallin, M.A.; Cahoon, L.B. Industrialized animal production – a major source of nutrient and microbial pollution to aquatic ecosystems. Pop and Env. 2003. 24. 369-385.
- U.S. EPA National water quality inventory: report to Congress. EPA 84-R-16011. https://www.epa.gov/sites/production/files/2017-12/documents/305brtc_finalowow_08302017.pdf. Available Online. Accessed, July 14, 2025.
- Ho, J.C.; Michalak, A.M. Challenges in tracking harmful algal blooms: A synthesis of evidence from Lake Erie. Jrnl of Grt Lakes Res. 2015. 41. 317-325. [CrossRef]
- Oun, A.; Yin, Z.; Munir, M.; Xagoraraki, I. Microbial pollution characterization of water and sediment at two beaches in Saginaw Bay, Michigan. Jrnl of Grt Lakes Res. 2017. 43. 64-72.
- Rosov, K.A.; Mallin, M.A.; Cahoon, L.B. Waste nutrients from U.S. animal feeding operations: Regulations are inconsistent across states and inadequately assess nutrient export risk. Jrnl of Env Mngmt. 2020. 269. 110738. [CrossRef]
- Clean Water Act. 40 CFR. Chapter I, Subchapter D, Part 122, 412. https://www.law.cornell.edu/cfr/text/40/122.23. Available Online. Accessed August 11, 2025.
- State of Michigan, Department of Environment, Great Lakes, and Energy. National Pollutant Discharge Elimination System Wastewater Discharge General Permit for Concentrated Animal Feeding Operations. https://www.michigan.gov/-/media/Project/Websites/egle/Documents/Programs/WRD/CAFO/MIG010000-General-Permit-2025.pdf?rev=82f751c312ef467a92a13f97ce41f983. Available Online. Accessed June 12, 2025.
- Moses, A.; Tomaselli, P. Industrial animal agriculture in the United States: Concentrated animal feeding operations (CAFOs). In International farm animal, wildlife and food safety law. Cham: Springer International Publishing. (2017). 185-214).
- Oemke, M.P.; Borrello, M.C. Geochemical signatures of large livestock operations on surface water. ICFAI Jrnl of Env Sci. 2008. 2. 7-18.
- Borrello, M.C.; Chessin, K.; Scribner, M. Using soluble reactive phosphorus and ammonia to identify point source discharge from large livestock facilities. Proceedings of the American Geophysical Union Fall Conference. San Francisco, CA, USA. December 9 – 13, 2013.
- Frey, S.K.; Topp, E.; Ball, B.R.; Edwards, M.; Gottschall, N.; Sunohara, M.; Zoski, E.; Lapen, D.R. Tile drainage management influences on surface-water and groundwater quality following liquid manure application. Jrnl of Env Qual. 2013. 42. 881-892.
- U.S. EPA Nonpoint Source Agriculture. https://www.epa.gov/nps/nonpoint-source-agriculture#:~:text=Agricultural%20operations%20can%20have%20significant,can%20also%20degrade%20water%20quality. Available Online. Accessed September 1, 2025.
- Magner, J. Tailored watershed assessment and integrated management (TWAIM): A systems thinking approach. Water. 2011. 3. 590-603. [CrossRef]
- Chun, S.A.; Shulman, S.; Sandoval, R., Hovy, E. Making connections between citizens, data and government. Inform. Polity. 2010. 15. 1-9. [CrossRef]
- Selzer, M.D.; Joldersma, B.; Beard, J. A Reflection on restoration progress in a Saginaw Bay watershed. Jrnl of Grt Lakes Res. 2014. 40. 192-200. [CrossRef]
- United State Environmental Protection Agency. Impaired Waters and TMDLs. https://www.epa.gov/tmdl/overview-total-maximum-daily-loads-tmdls. Available Online. Accessed June 14, 2025.
- Raff, Z.; Meyer, A. CAFOs and surface water quality: Evidence from Wisconsin. Amer Jrn of Ag Econ. 2022. 104. 161-189.
- Baldwin, D.S. Nutrients in freshwater ecosystems: Towards best practice in land-based salmonid farming. Proceedings of a workshop held in Eildon, Victoria, BC, Canada. April 28, 1998. Brett Ingram, Ed.
- U.S. EPA Nonpoint Source Agriculture. https://www.epa.gov/nps/nonpoint-source-agriculture#:~:text=Agricultural%20operations%20can%20have%20significant,can%20also%20degrade%20water%20quality. Accessed September 1, 2025.
- Borrello, M.C.; Keeton, T.P.; Harwood, A.; St. John, L.; Jeffery, H.; DesMarais, A. Combining bacterial loading and nutrient loading to source agricultural impacts on surface water. Proceedings of the SETAC North American World Congress Conference, Orlando, FL, USA., November 6-10, 2016.
- Li, H.; Song, C.; Yang, L.; Qin, H.; Cao, X.; Zhou, Y. Nutrients regeneration pathway, release potential, transformation pattern and algal utilization strategies jointly drove cyanobacterial growth and their succession. Jrnl of env sci. 2021. 103. 255-267. [CrossRef]
- Litskas, V. Environmental impact assessment for animal waste, organic and synthetic fertilizers. Nitrogen. 2023. 4. 16-25.
- Wilkinson, S.R. Plant nutrient and economic value of animal manures. Pub from USDA-ARS/UNL Faculty. 1979. 268.
- Lee, J.; Choie, H.L. The dynamics of nitrogen derived from a chemical nitrogen fertilizer with treated swine slurry in paddy soil-plant systems. PloS one, 2017. 12. E0174747.
- Magner, J.A.; Alexander, S.E. Geochemical and isotopic tracing of water in nested southern Minnesota corn-belt watersheds. Water Sci and Tech. 2002. 45. 37-42. [CrossRef]
- U.S. Environmental Protection Agency Stable Isotope Mixing Model. Available online. https://www.epa.gov/eco-research/stable-isotope-mixing-models-estimating-source-proportions#:~:text=Stable%20isotope%20analysis%20can%20be,mixture%2C%20using%20mathematical%20mixing%20models. Accessed September 1, 2025.
- Meals, D.W.; Braun, D.C. Demonstration of methods to reduce E. coli runoff from dairy manure application sites. Jrnl of env qual. 2006. 35. 1088-1100. [CrossRef]
- Michigan Lakes and Streams Association: Septic System Ordinances. Available online: https://mymlsa.org/government-and-legal-issues/ordinances/septic-system-ordinances/#:~:text=AKA:%20Point%20of%20Sale%20(POS,Resource%20Link. Accessed, July 14, 2025.
- Michigan State University Extension Office. Available Online: https://water.msu.edu/feature/septic-system-pollution#:~:text=1.3%20million%20homes%20and%20businesses%20in%20Michigan,quality%2C%20and%20pose%20risks%20to%20human%20health. Accessed, September 27, 2025.
- Kloot, R.B. Locating Escherichia coli contamination in a rural South Carolina watershed. Jrnl of Env Mangt. 2007. 83. 402-408.
- Carson, C.A.; Shear, B.L.; Ellersieck, M.R.; Asfaw, A. Identification of fecal Escherichia coli from humans and animals by ribotyping. Appl and Env Microbio. 2001. 67. 1503-1507.
- Tyagi, P.; Edwards, D.R.; Coyne, M.S. Distinguishing between human animal sources of fecal pollution in waters: a review. Intnl Jrnl of Wtr. 2009. 5. 15-34. [CrossRef]
- Kalita, P.K.; Cooke, R.A.; Anderson, S.M.; Hirschi, M.C.; Mitchell, J.K. Subsurface drainage and water quality: the Illinois experience. Trans of the ASABE. 2007. 50. 1651-1656. [CrossRef]
- Pandey, P.K.; Soupir, M.L. Assessing linkages between E. coli levels in streambed sediment and overlying water in an agricultural watershed in Iowa during the first heavy rain event of the season. Trans of the ASABE. 2014. 57. 1571-1581. [CrossRef]
- Murphy, H.M.; McGinnis, S.; Blunt, R; Stodyk, J.; Wu, J.; Cagle, A.; Denno, D.M.; Spencer, S.; Firnstahl, A.; Borchardt, M.A. Septic systems and rainfall influence human fecal marker and indicator organism occurrence in private wells in southeastern Pennsylvania. Env Sci & Tech. 2020. 54. 3159-3168.
- Borrello, M.C.; Oemke, M.P.; Snowdon, L; Farley, A. Geochemical impacts of CAFOs: Implications for modifying existing regulatory standards in Michigan. Eos. 2004 85. 47.
- Mitchell, M.; Stapp, W. Field manual for water quality monitoring, 13th Edition. D. Katz, ed. Kendall Hunt Publ. USA. 2015; 145 pgs.
Figure 1.
Pine River Watershed within the Saginaw River Drainage Basin, Central, Michigan. The Pine River Watershed is part of the Lake Huron/Saginaw Bay Drainage Basin [23].
Figure 1.
Pine River Watershed within the Saginaw River Drainage Basin, Central, Michigan. The Pine River Watershed is part of the Lake Huron/Saginaw Bay Drainage Basin [23].
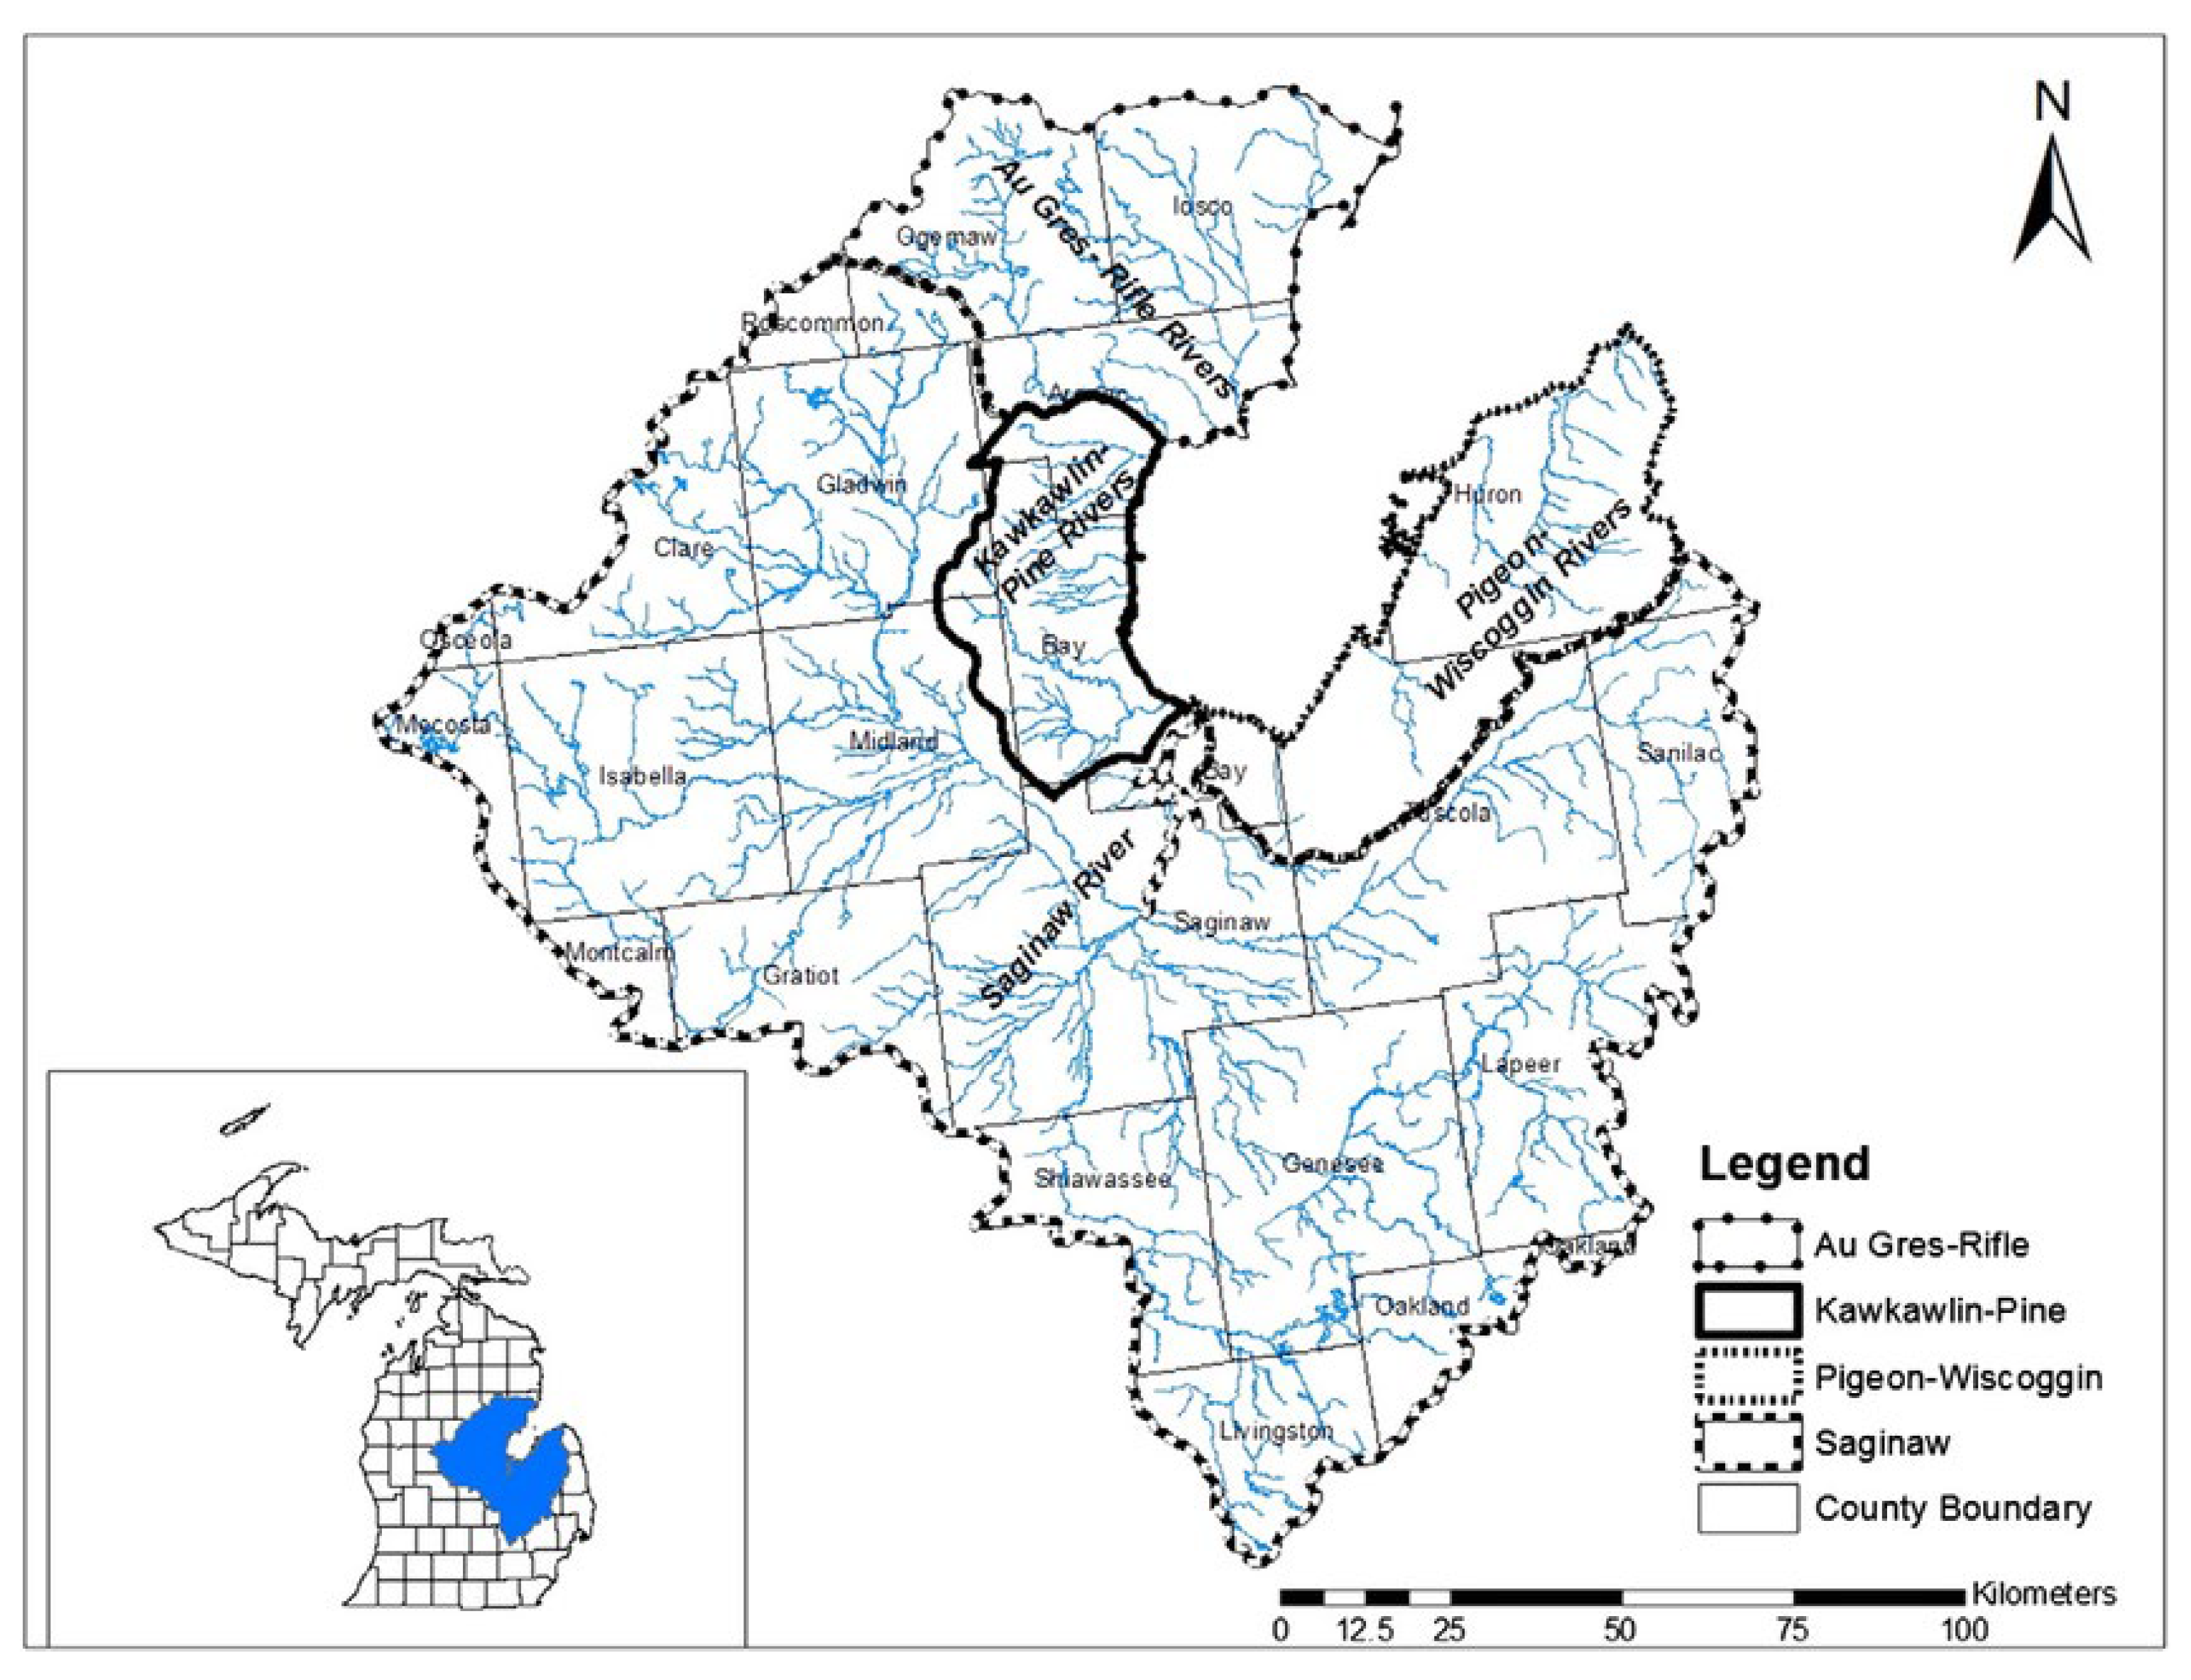
Figure 2.
The Pine River Watershed is divided at the Alma Dam between dominantly agricultural impacts upstream and dominantly industrial impacts downstream. The appearance of a large algal bloom in the area of the industrial impacts was relatively sudden and unexpected.
Figure 2.
The Pine River Watershed is divided at the Alma Dam between dominantly agricultural impacts upstream and dominantly industrial impacts downstream. The appearance of a large algal bloom in the area of the industrial impacts was relatively sudden and unexpected.
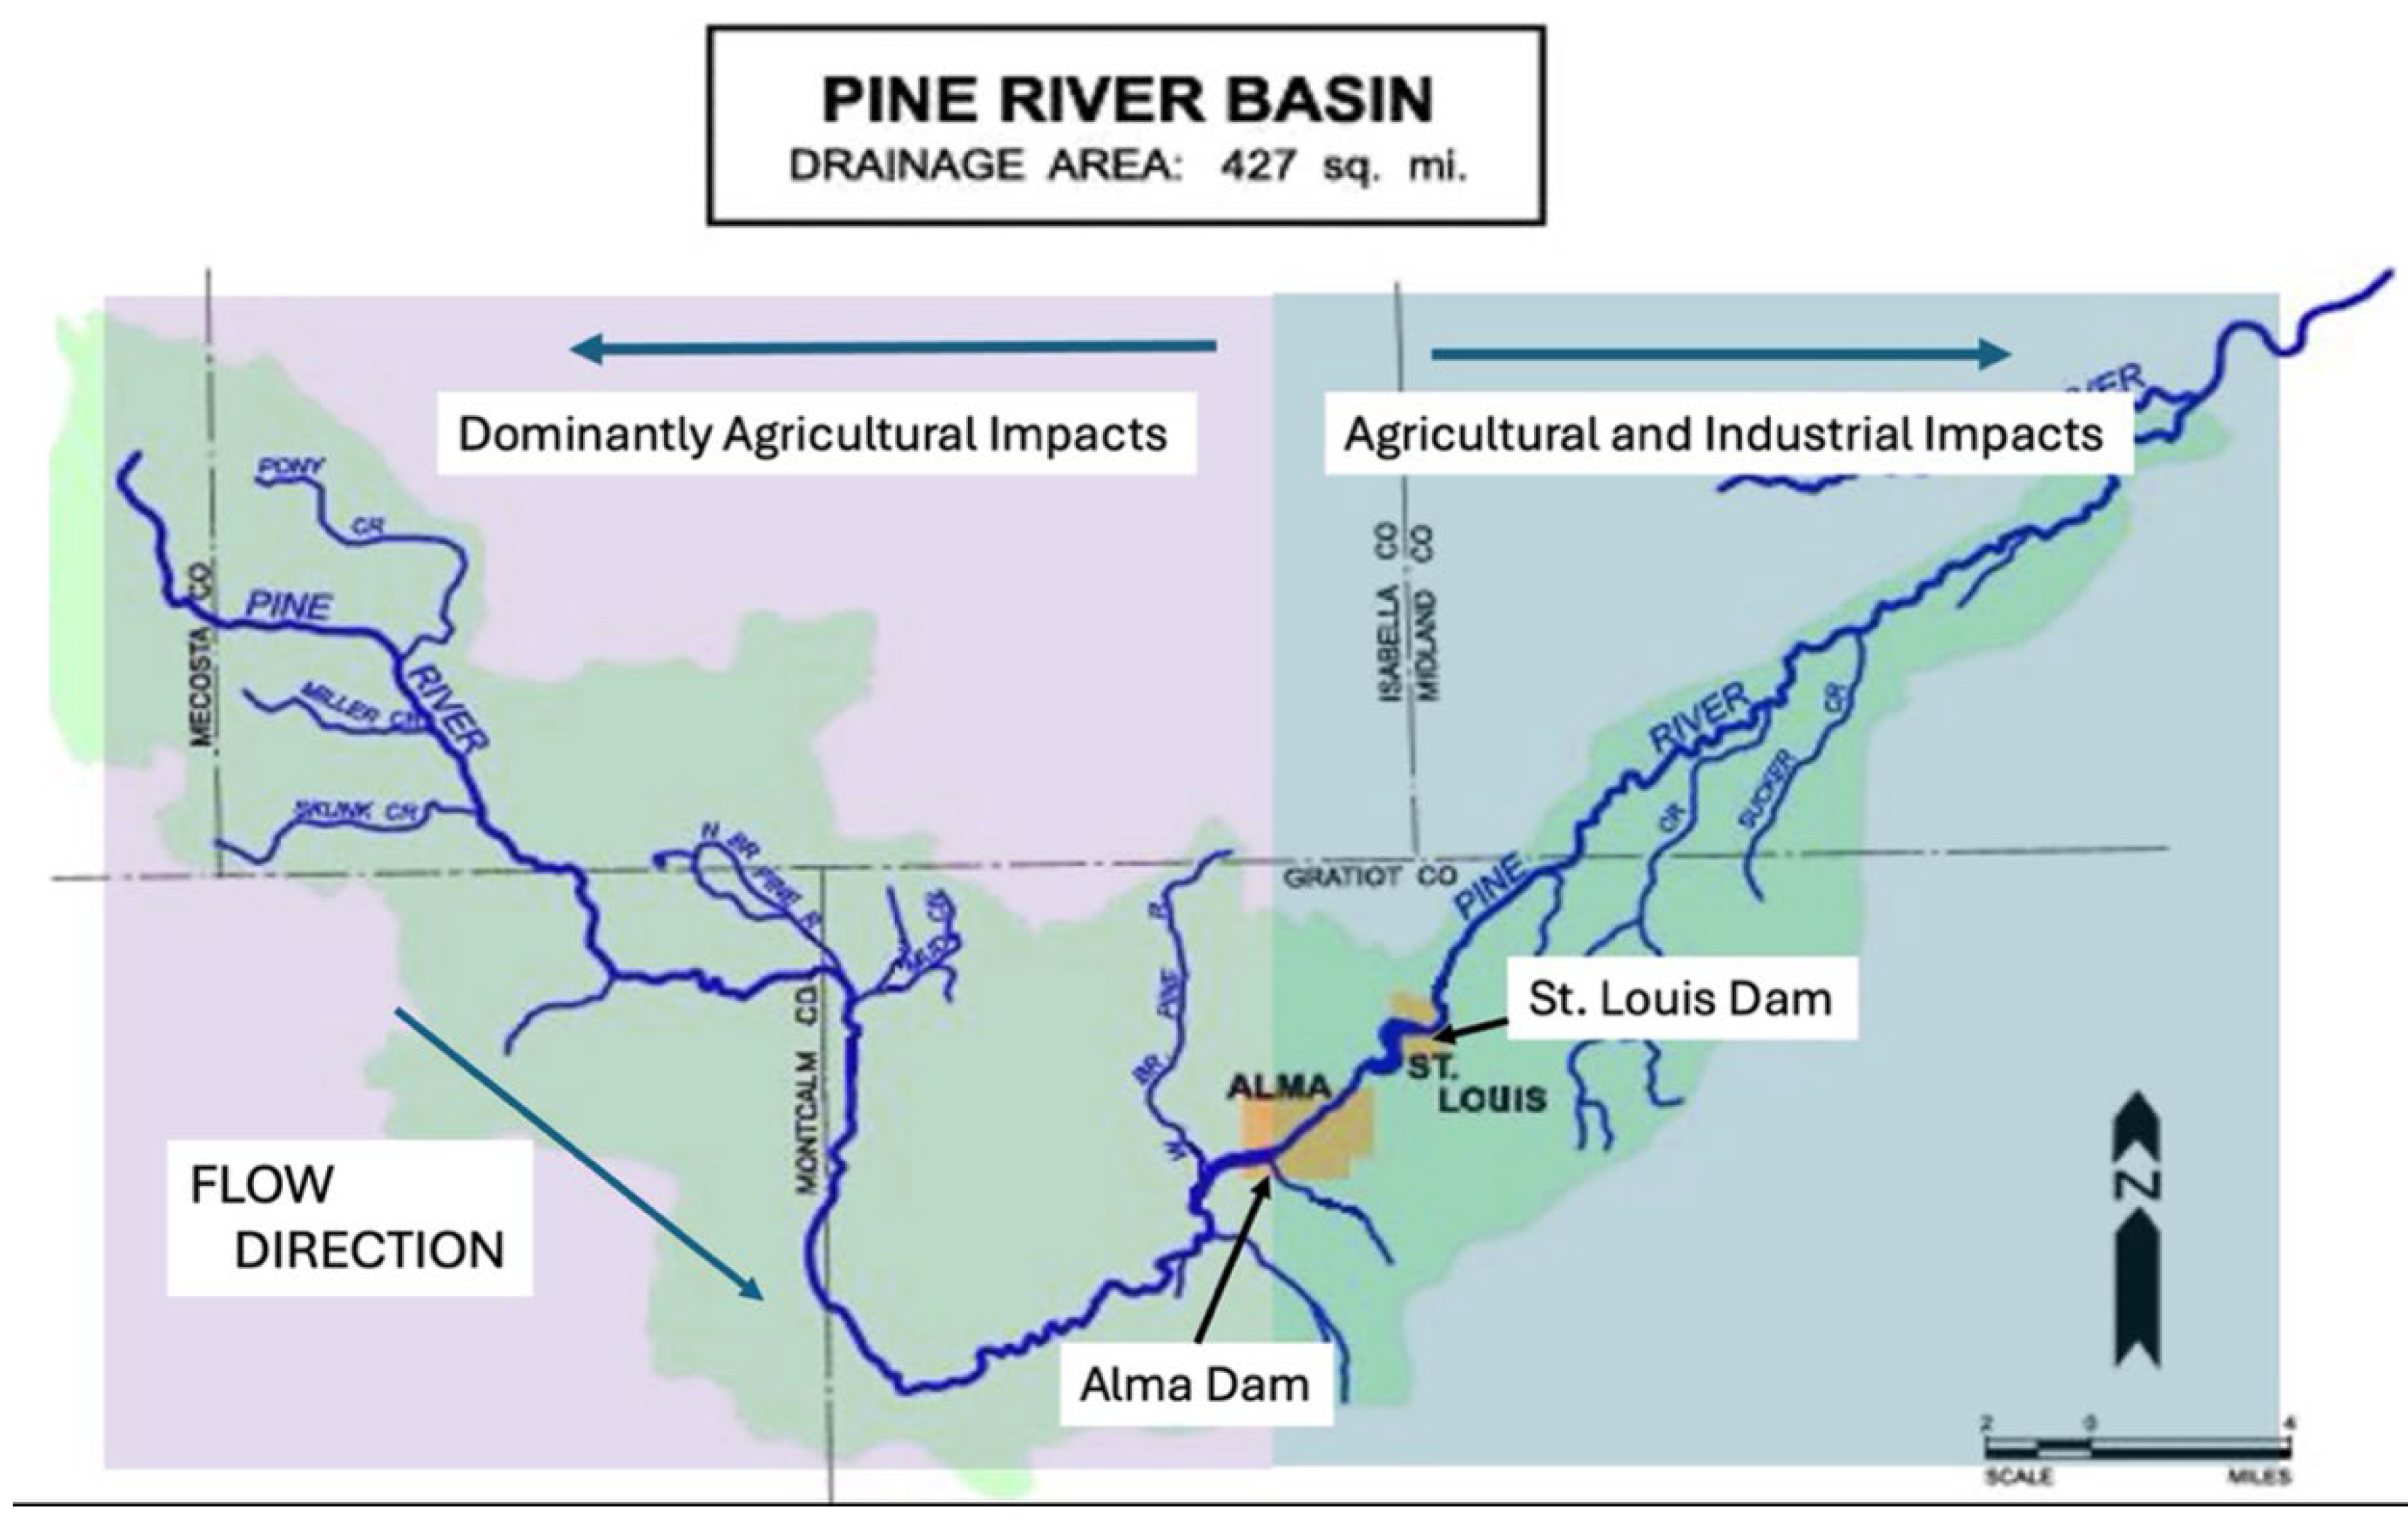
Figure 3.
Location of potential nutrient sources causing the sudden appearance of an algal bloom near St. Louis, Michigan. Flow of the main river body (Pine River) is towards the Northeast.
Figure 3.
Location of potential nutrient sources causing the sudden appearance of an algal bloom near St. Louis, Michigan. Flow of the main river body (Pine River) is towards the Northeast.
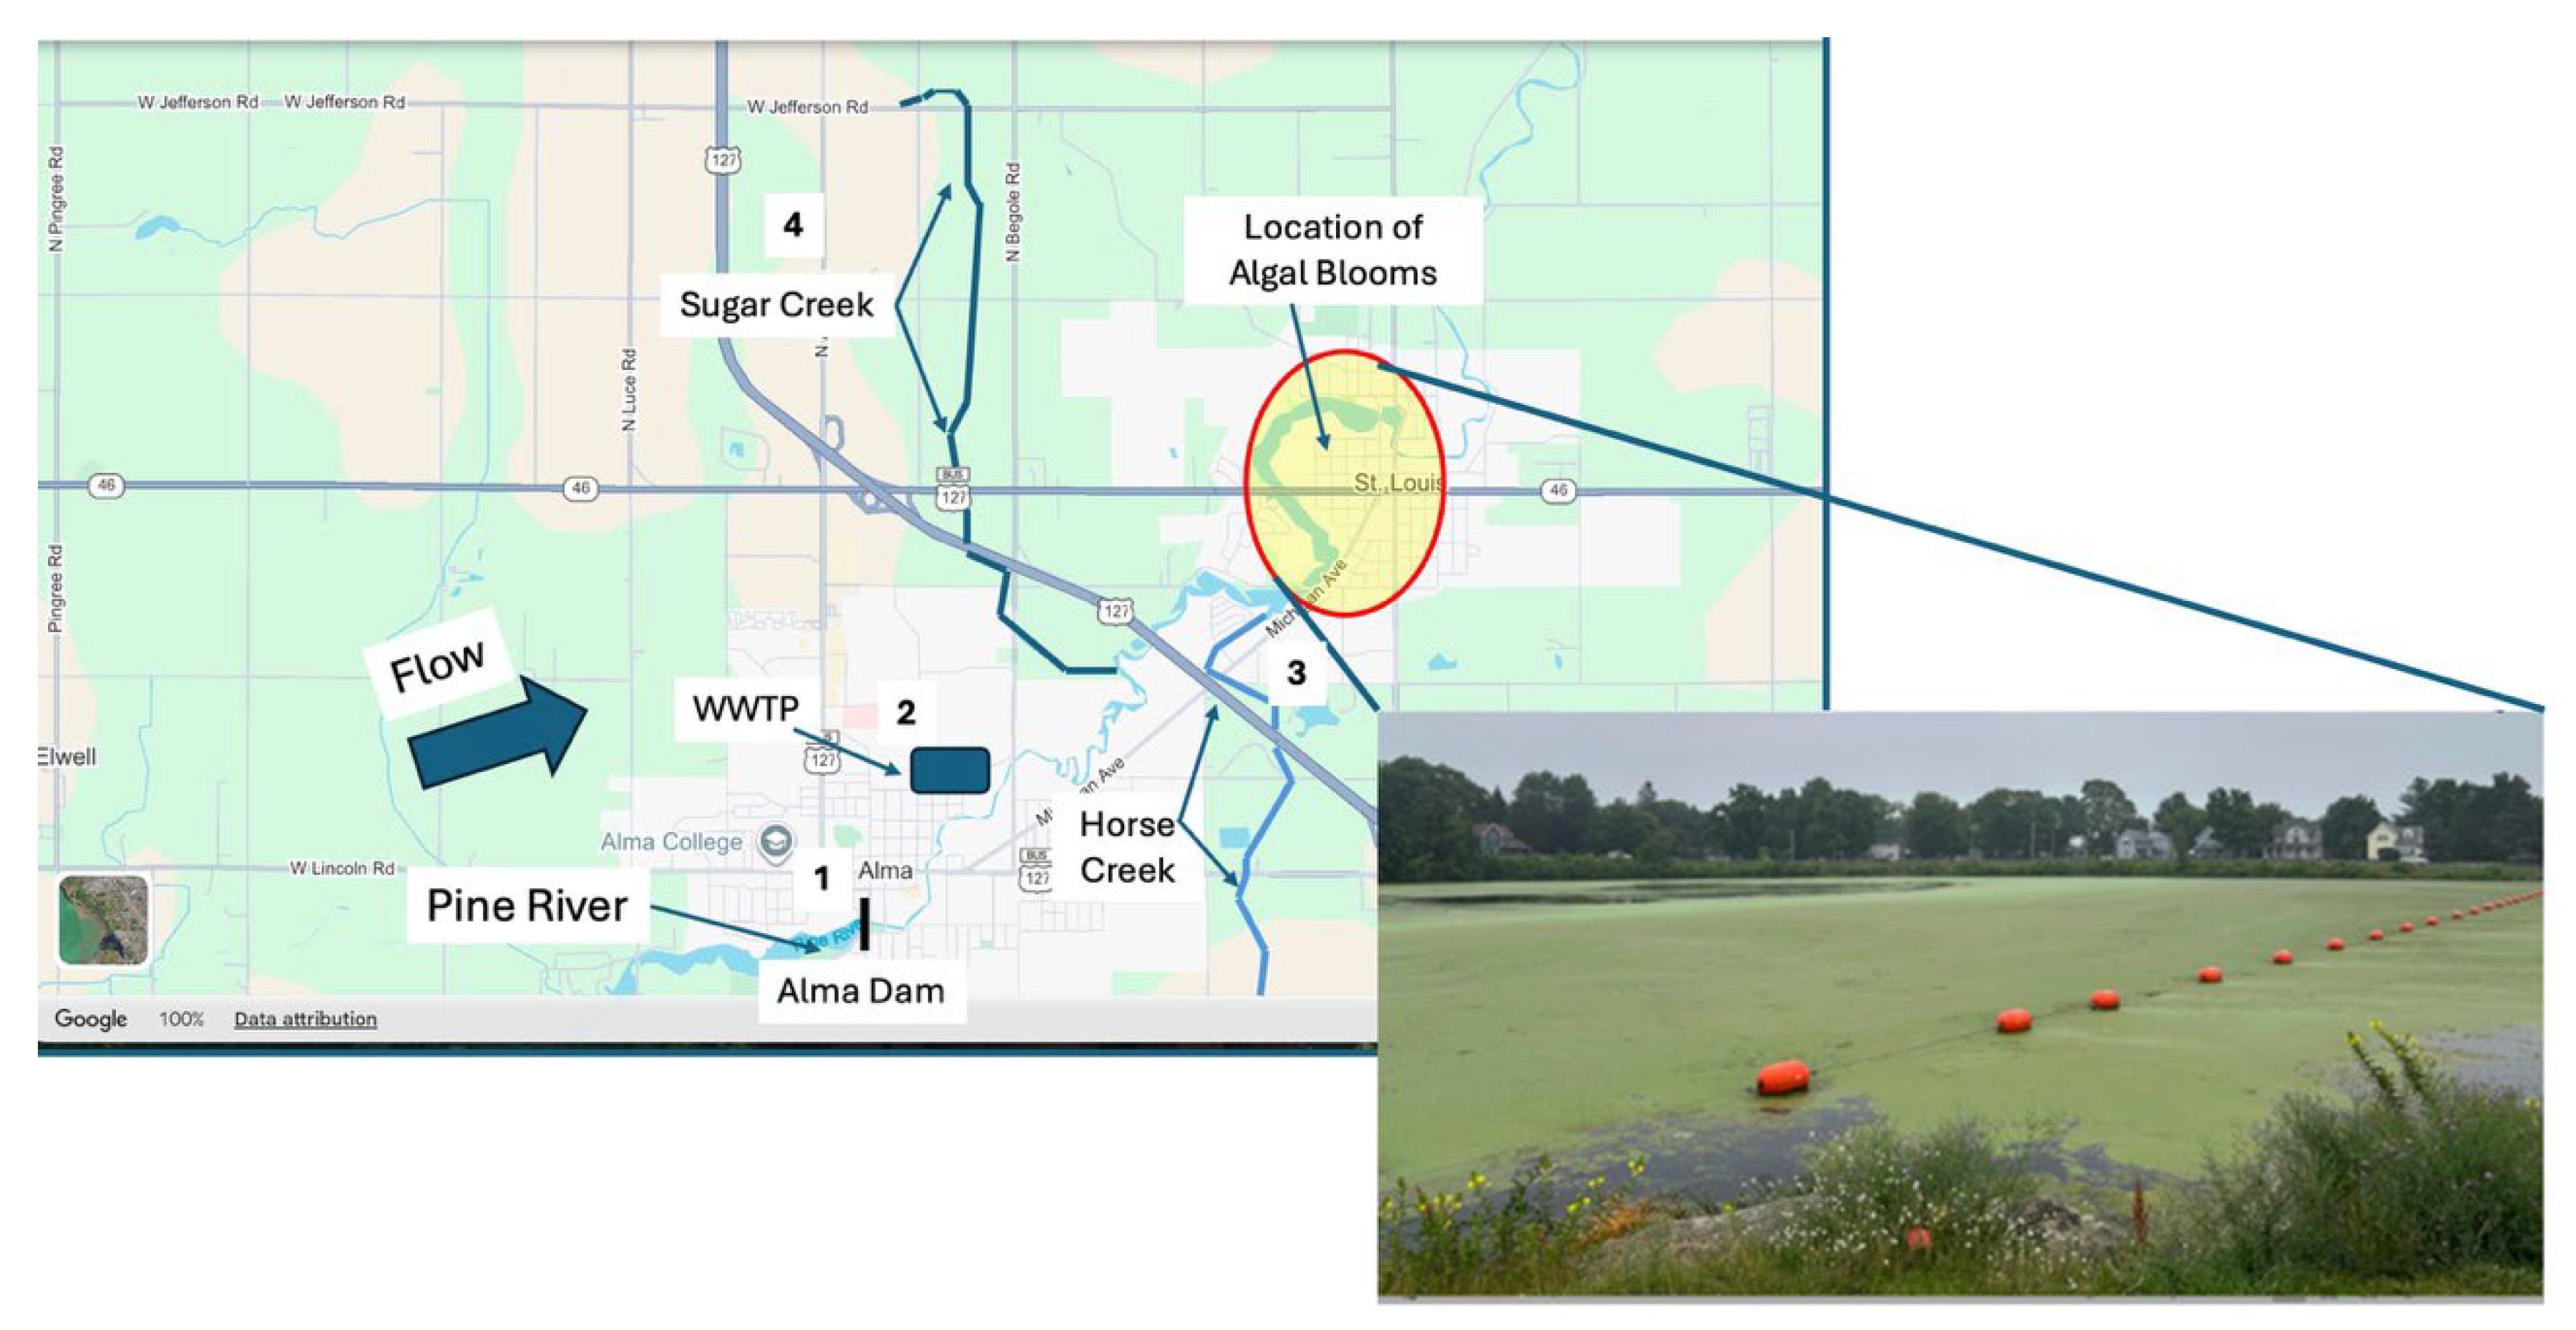
Figure 4.
Comparison of phosphorus (as SRP) and thermotolerant E. coli potential inputs causing the algal bloom near St. Louis, Michigan. Sugar Creek dominates both nutrient and E. coli inputs compared with other sites after 2018. Comparison of phosphorus (as SRP) and thermotolerant E. coli potential inputs causing the algal bloom near St. Louis, Michigan. Sugar Creek dominates both nutrient and E. coli inputs compared with other sites after 2018.
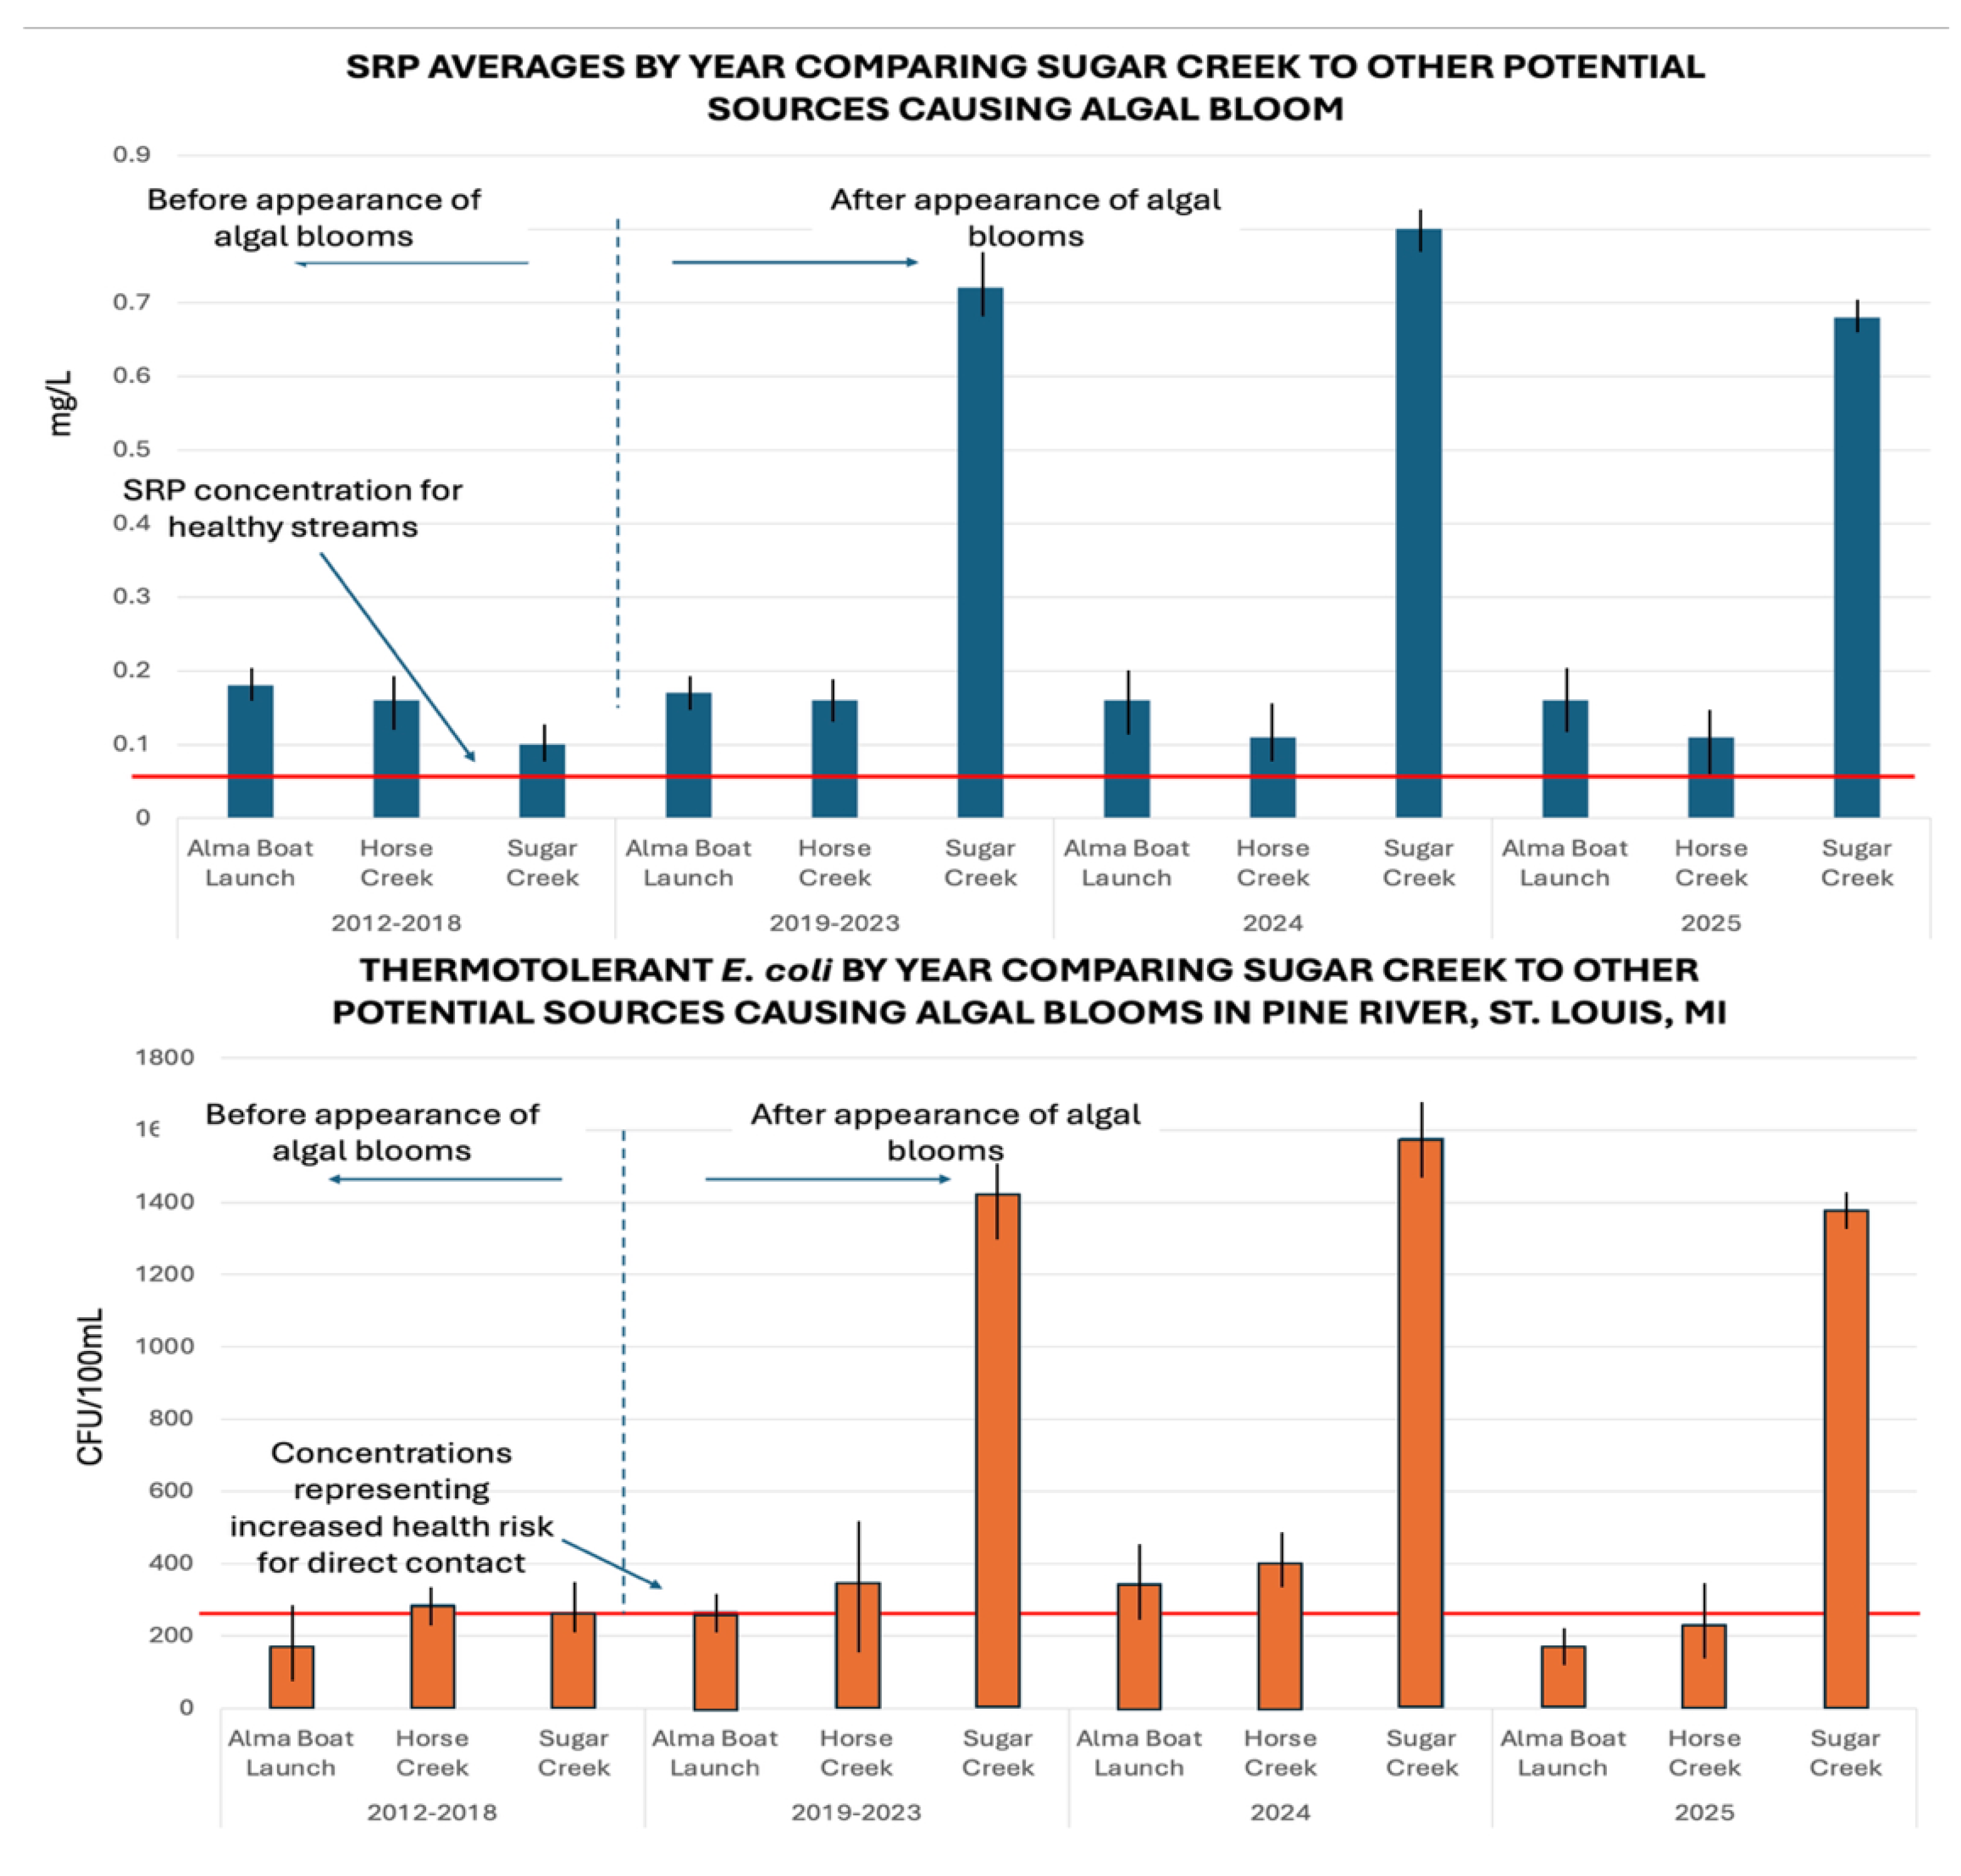
Figure 5.
Sugar Creek headwaters dominate nutrient and E. coli inputs.
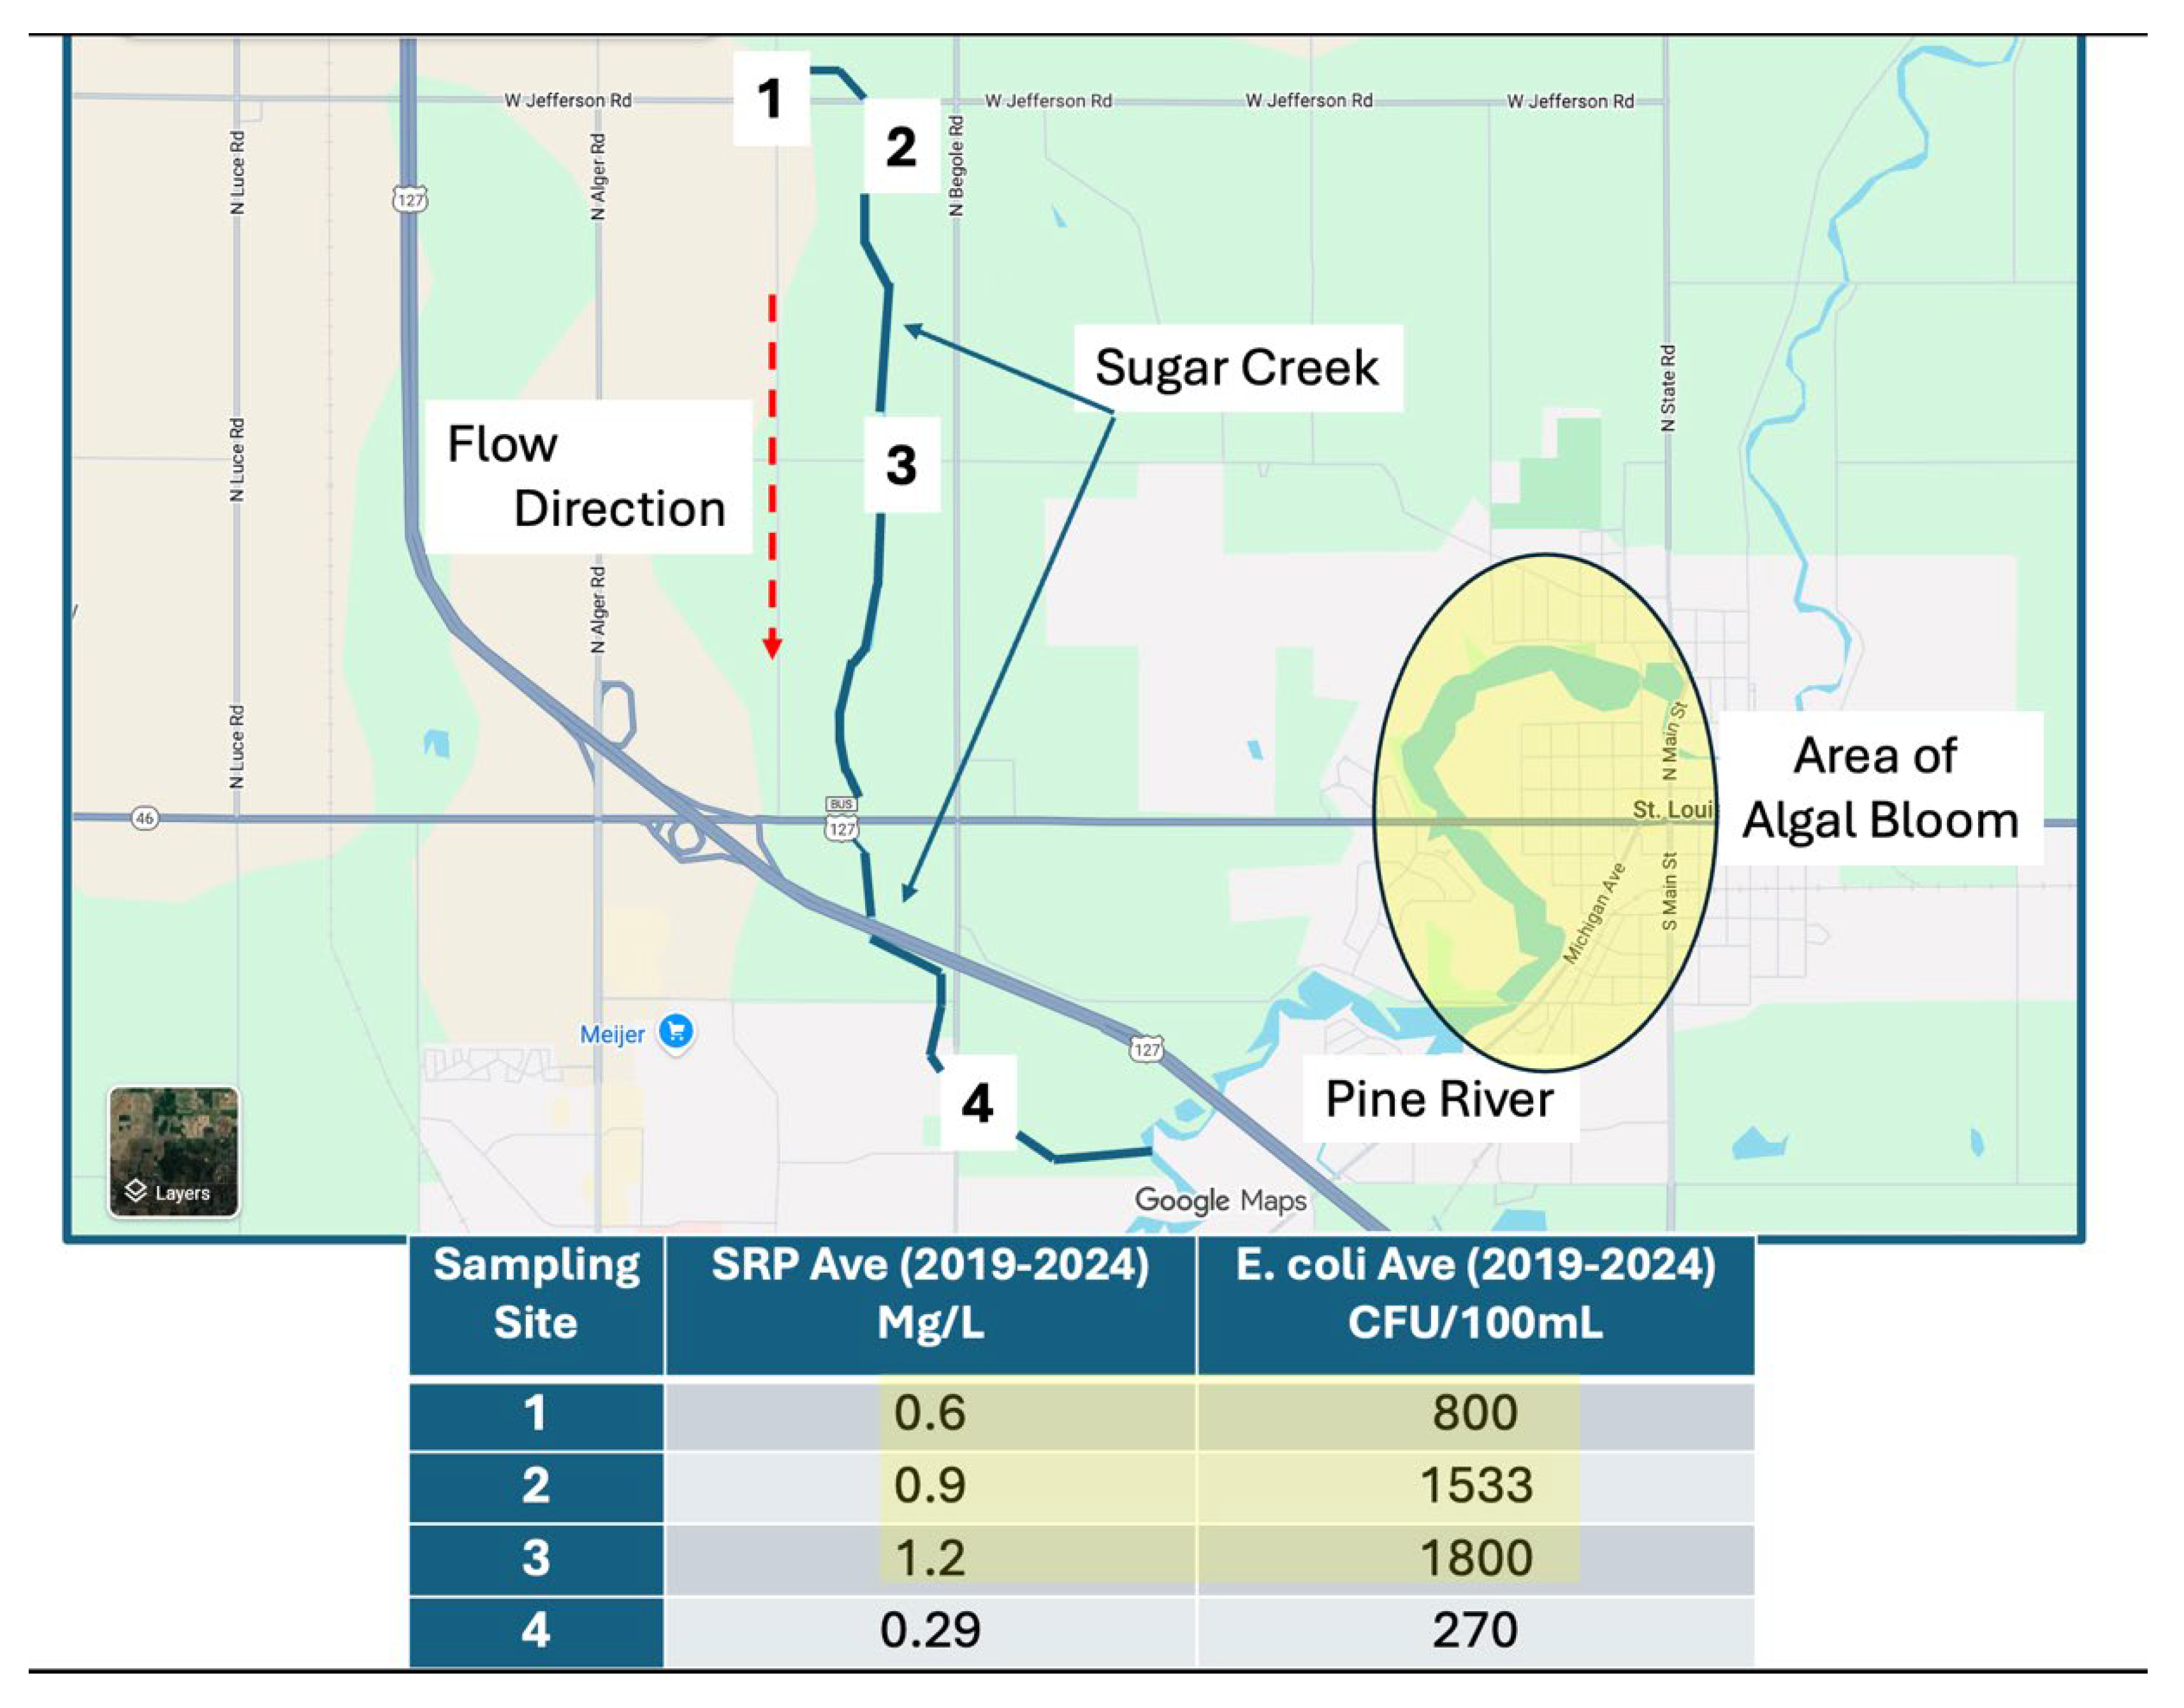
Figure 6.
Spike in E. coli shortly after a rain event indicating that the input source is likely underdrains and not leaking septic systems (2025).
Figure 6.
Spike in E. coli shortly after a rain event indicating that the input source is likely underdrains and not leaking septic systems (2025).

Figure 7.
Spikes in phosphorus (as SRP) and E. coli after rain events in Sugar Creek during sampling season 2024 indicating the input source is coming from underdrains.
Figure 7.
Spikes in phosphorus (as SRP) and E. coli after rain events in Sugar Creek during sampling season 2024 indicating the input source is coming from underdrains.
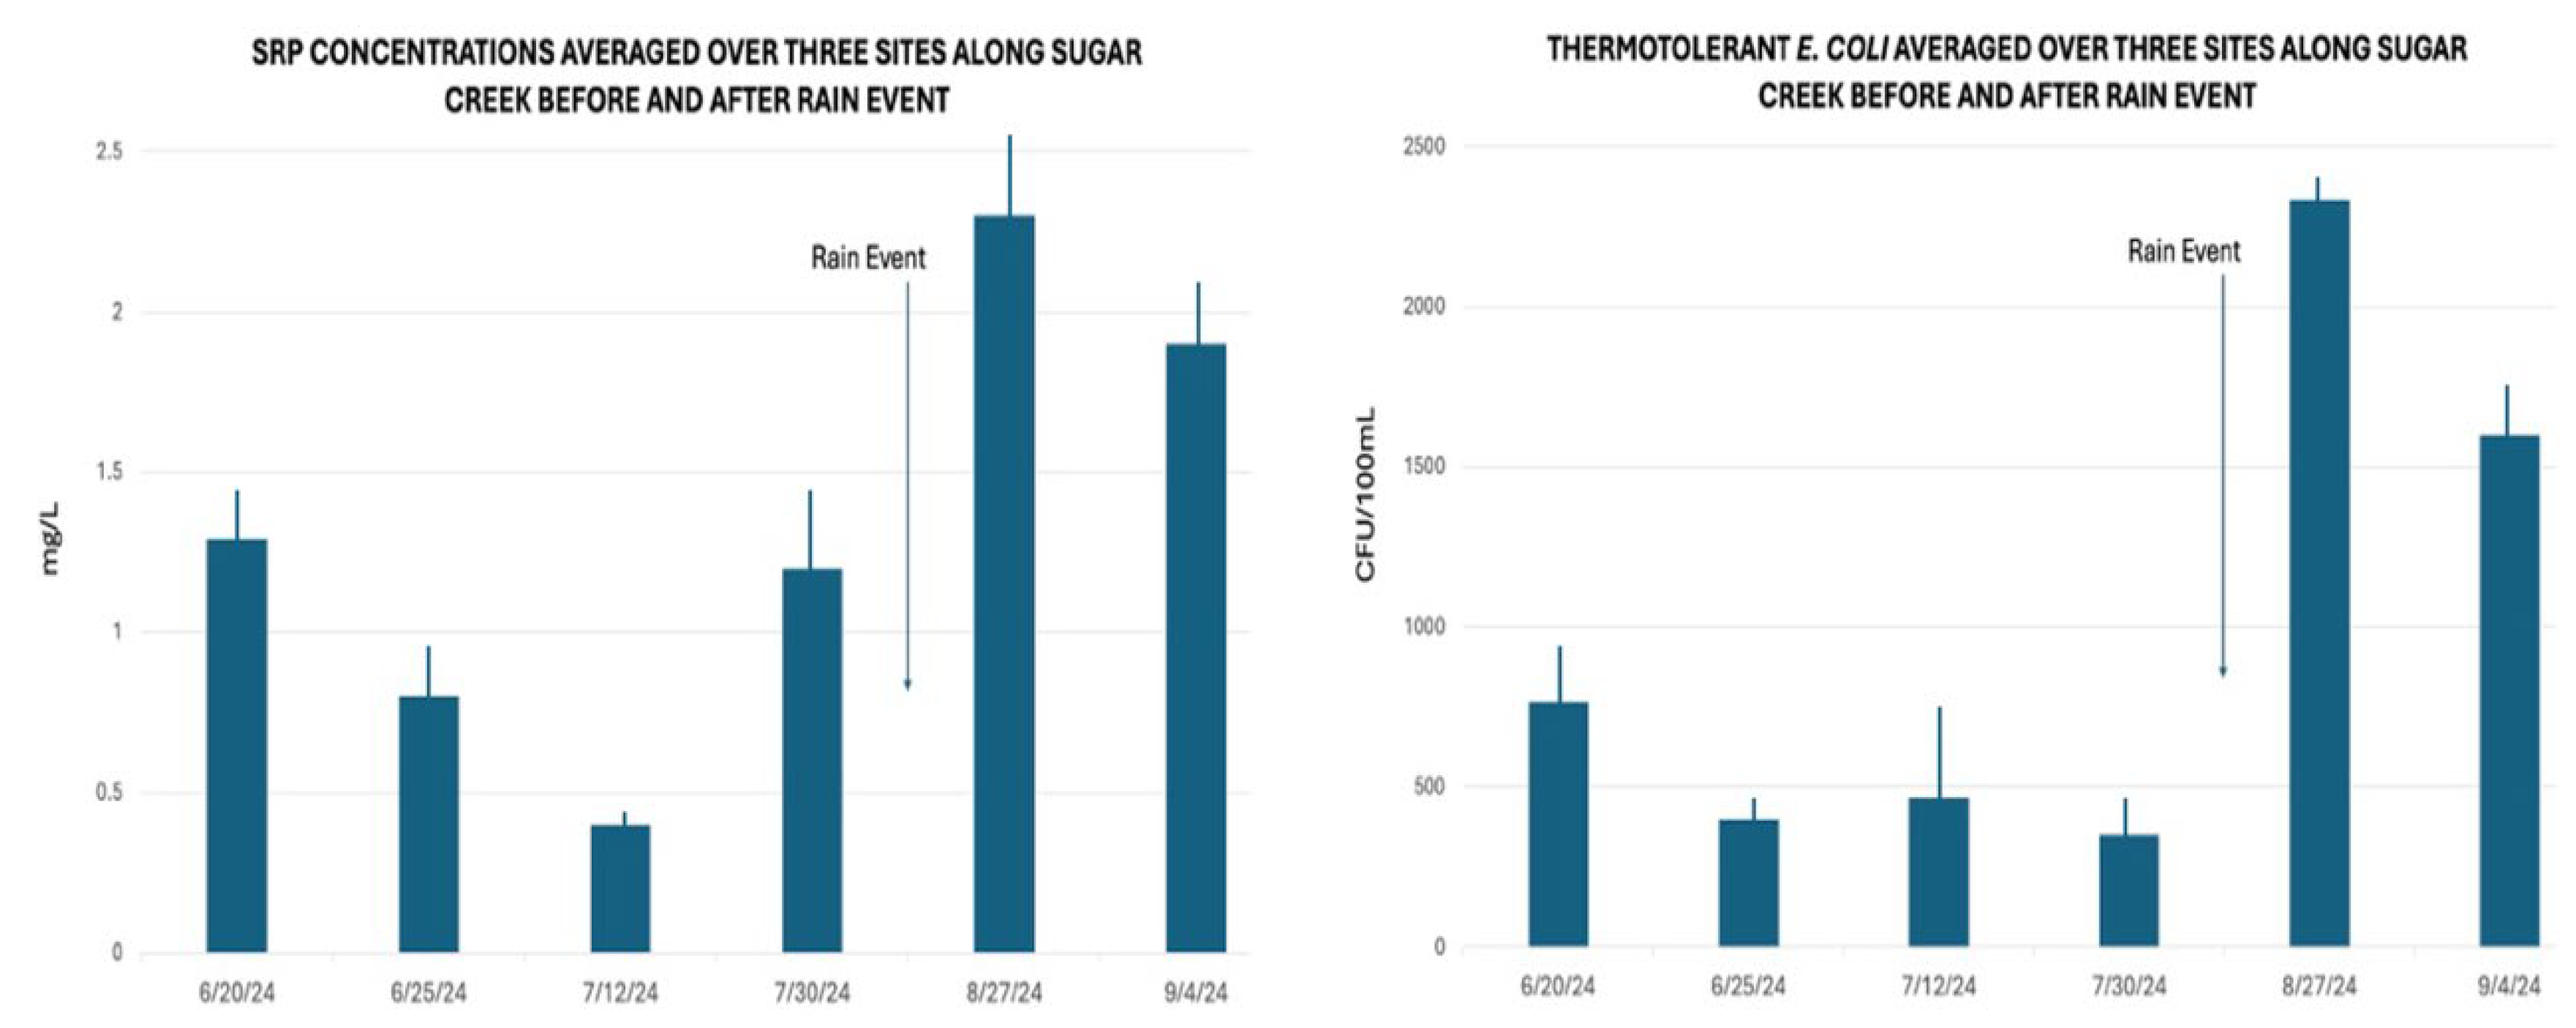
Figure 8.
Trends in NH3-N and SRP have been consistent from the headwaters downstream for Sugar Creek indicating a likely strong single source of inputs.
Figure 8.
Trends in NH3-N and SRP have been consistent from the headwaters downstream for Sugar Creek indicating a likely strong single source of inputs.
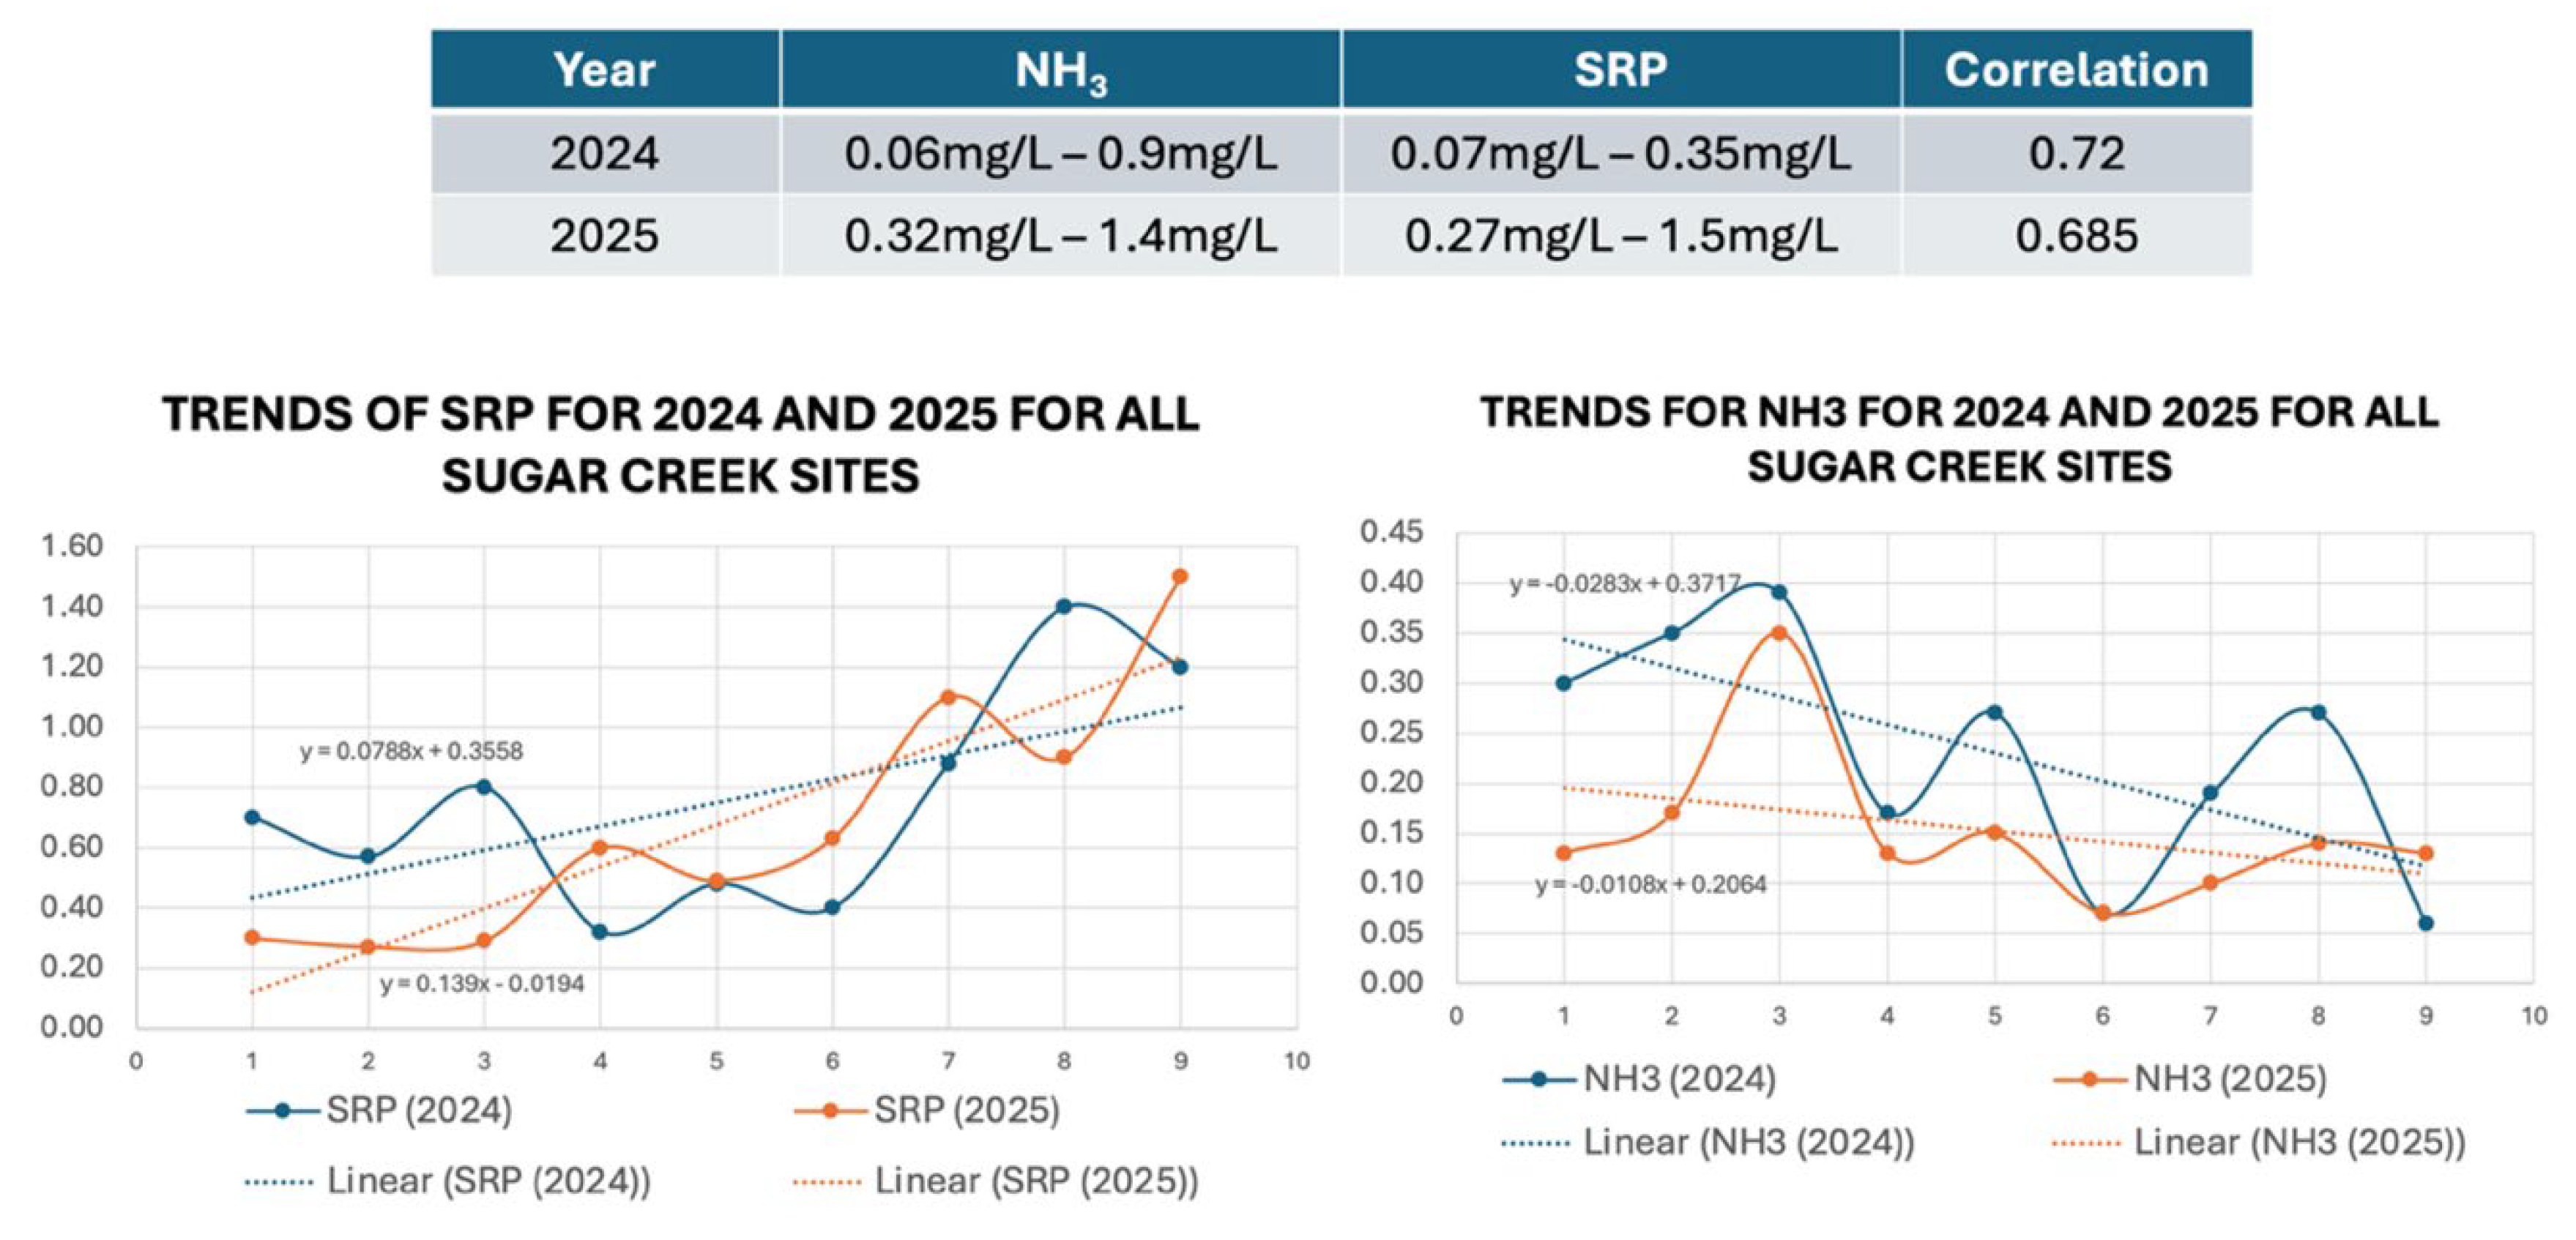
Figure 9.
Analysis between NH3-N and SRP shows a stronger correlation at the headwaters and decreasing in a strong linear fashion downstream. This indicates the source is nearer to the first sampling site at the very source of Sugar Creek and no other significant inputs occur downstream. A similar analysis was conducted on three sites in the Pine River as a control. The control shows likely nutrient inputs entering the Pine River between sites.
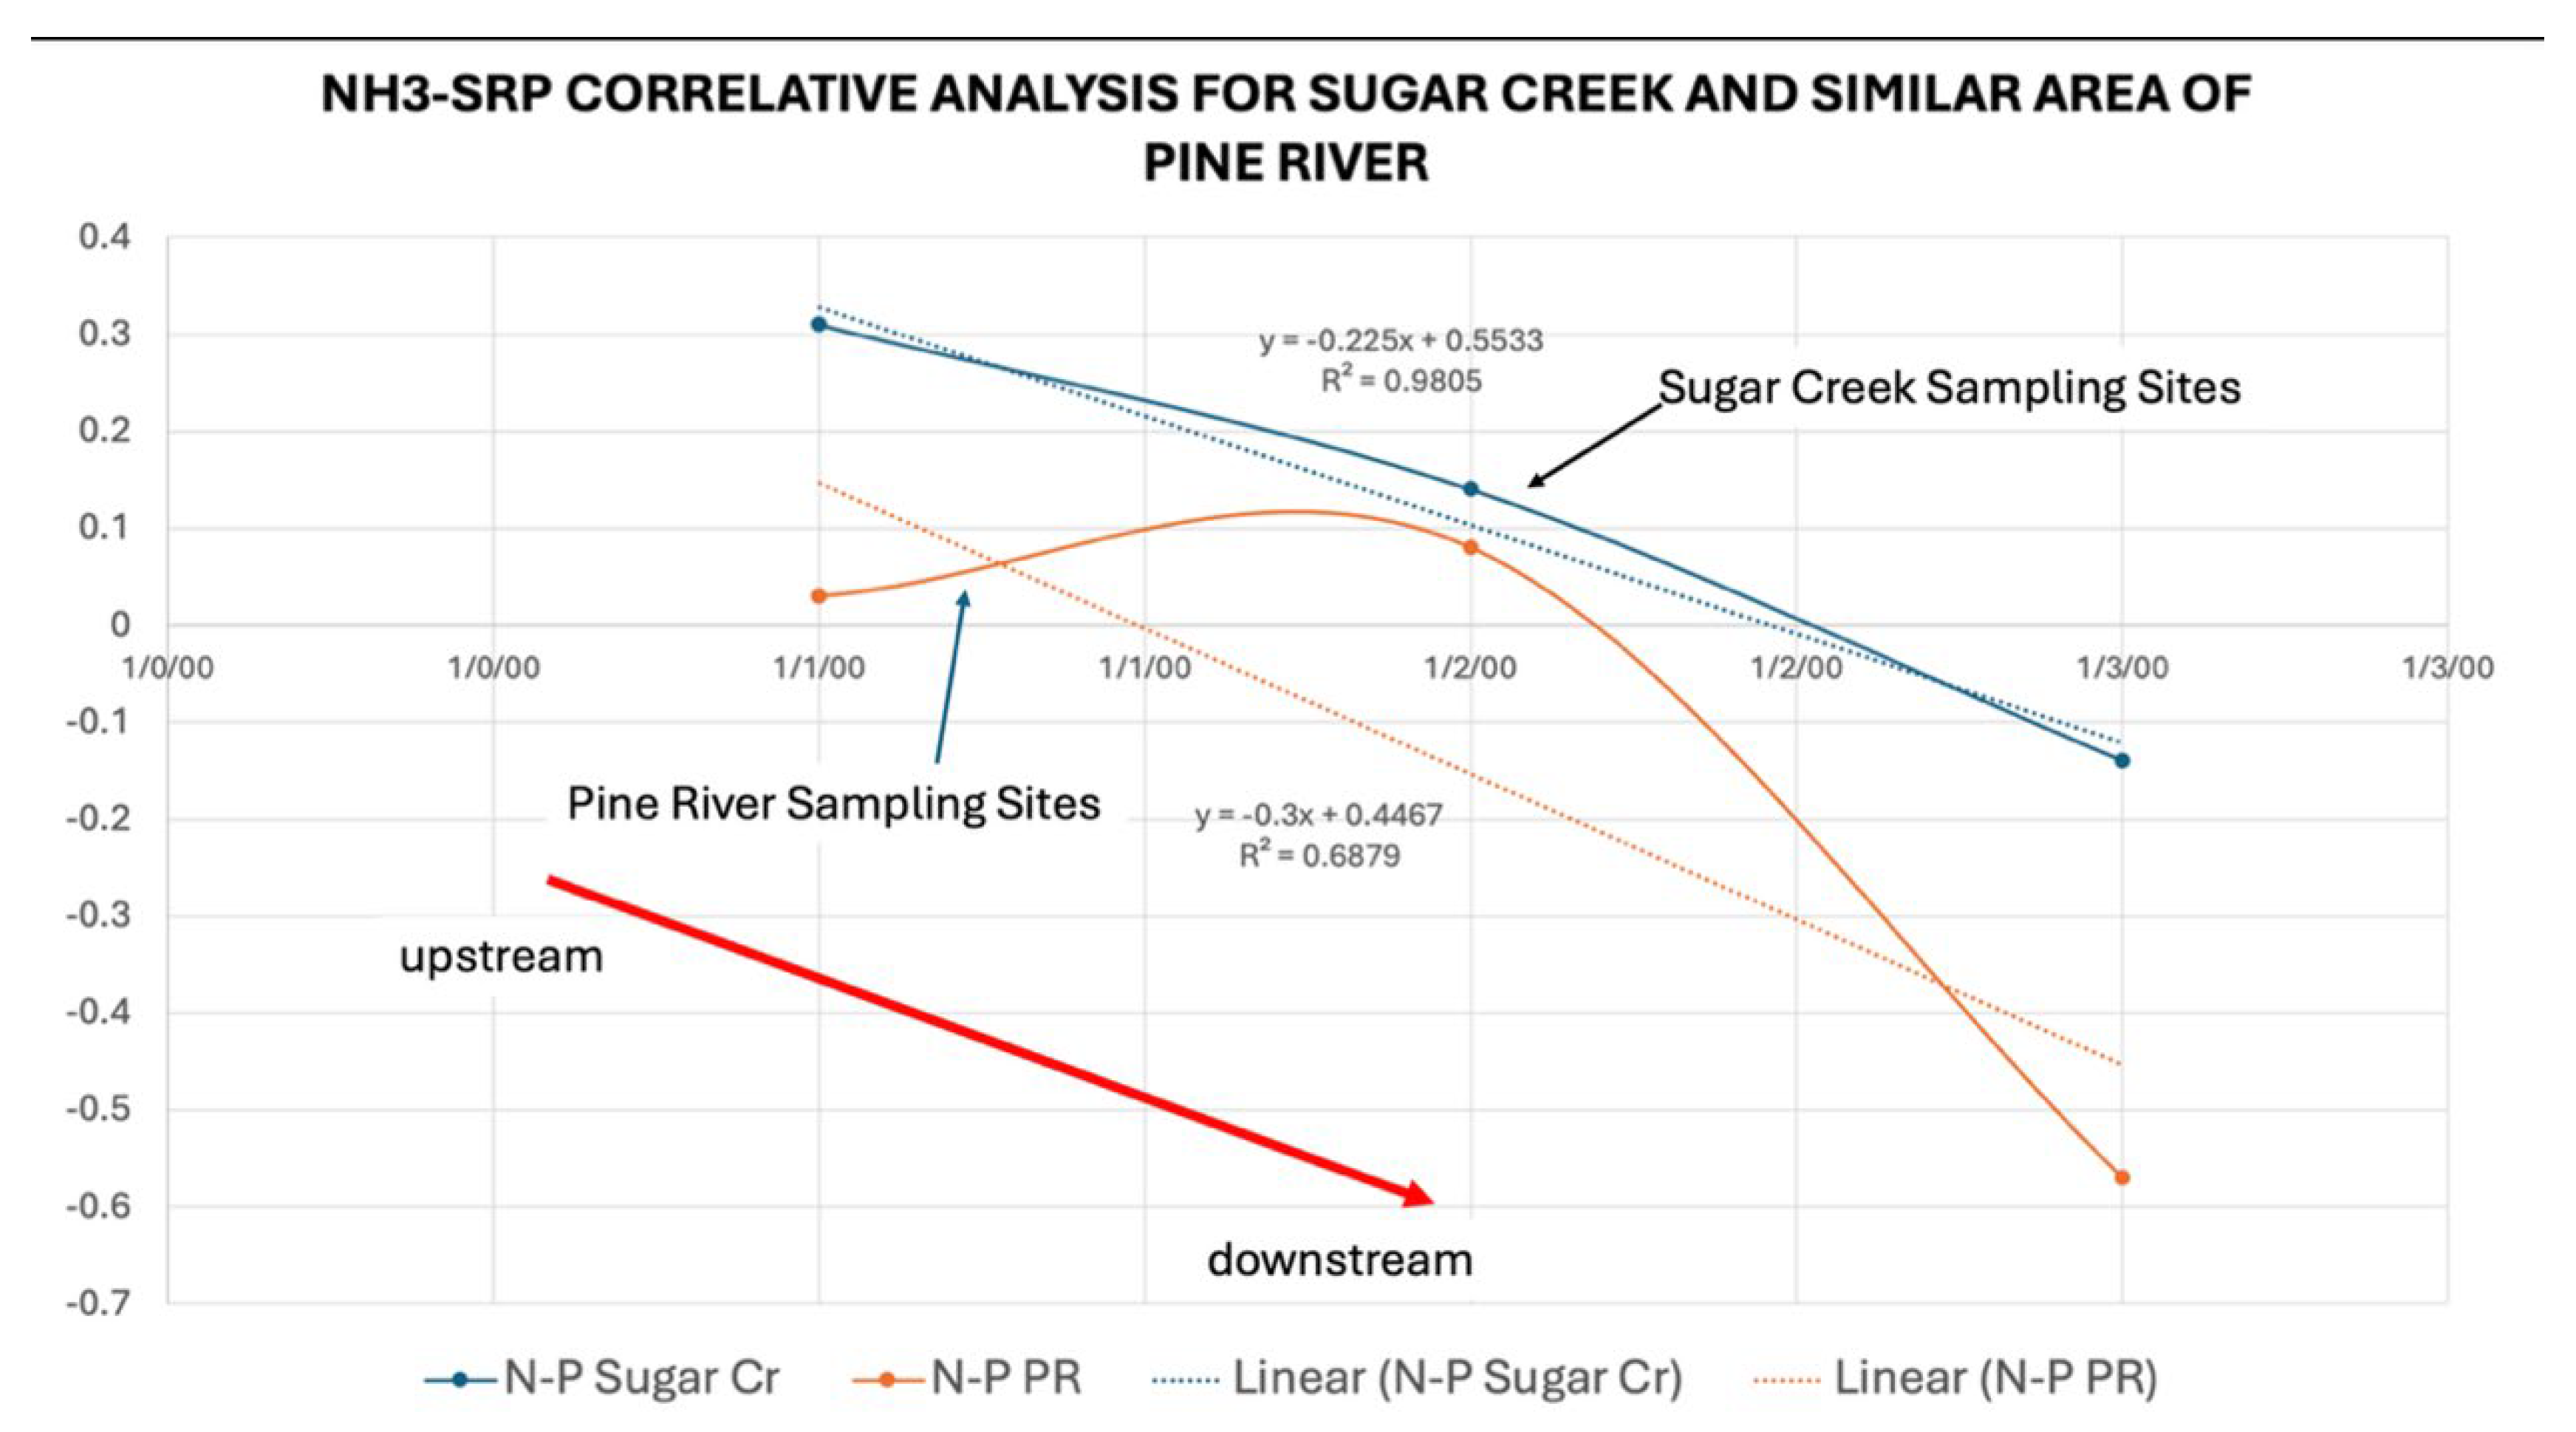
Figure 10.
County drain map showing underground drain from nearby livestock facility to the head of Sugar Creek.
Figure 10.
County drain map showing underground drain from nearby livestock facility to the head of Sugar Creek.
Figures 11 and 12.
Satellite imagery shows increased staining on the surface from the livestock facility to a drain basin (node) that connects with the head of Sugar Creek.
Figures 11 and 12.
Satellite imagery shows increased staining on the surface from the livestock facility to a drain basin (node) that connects with the head of Sugar Creek.
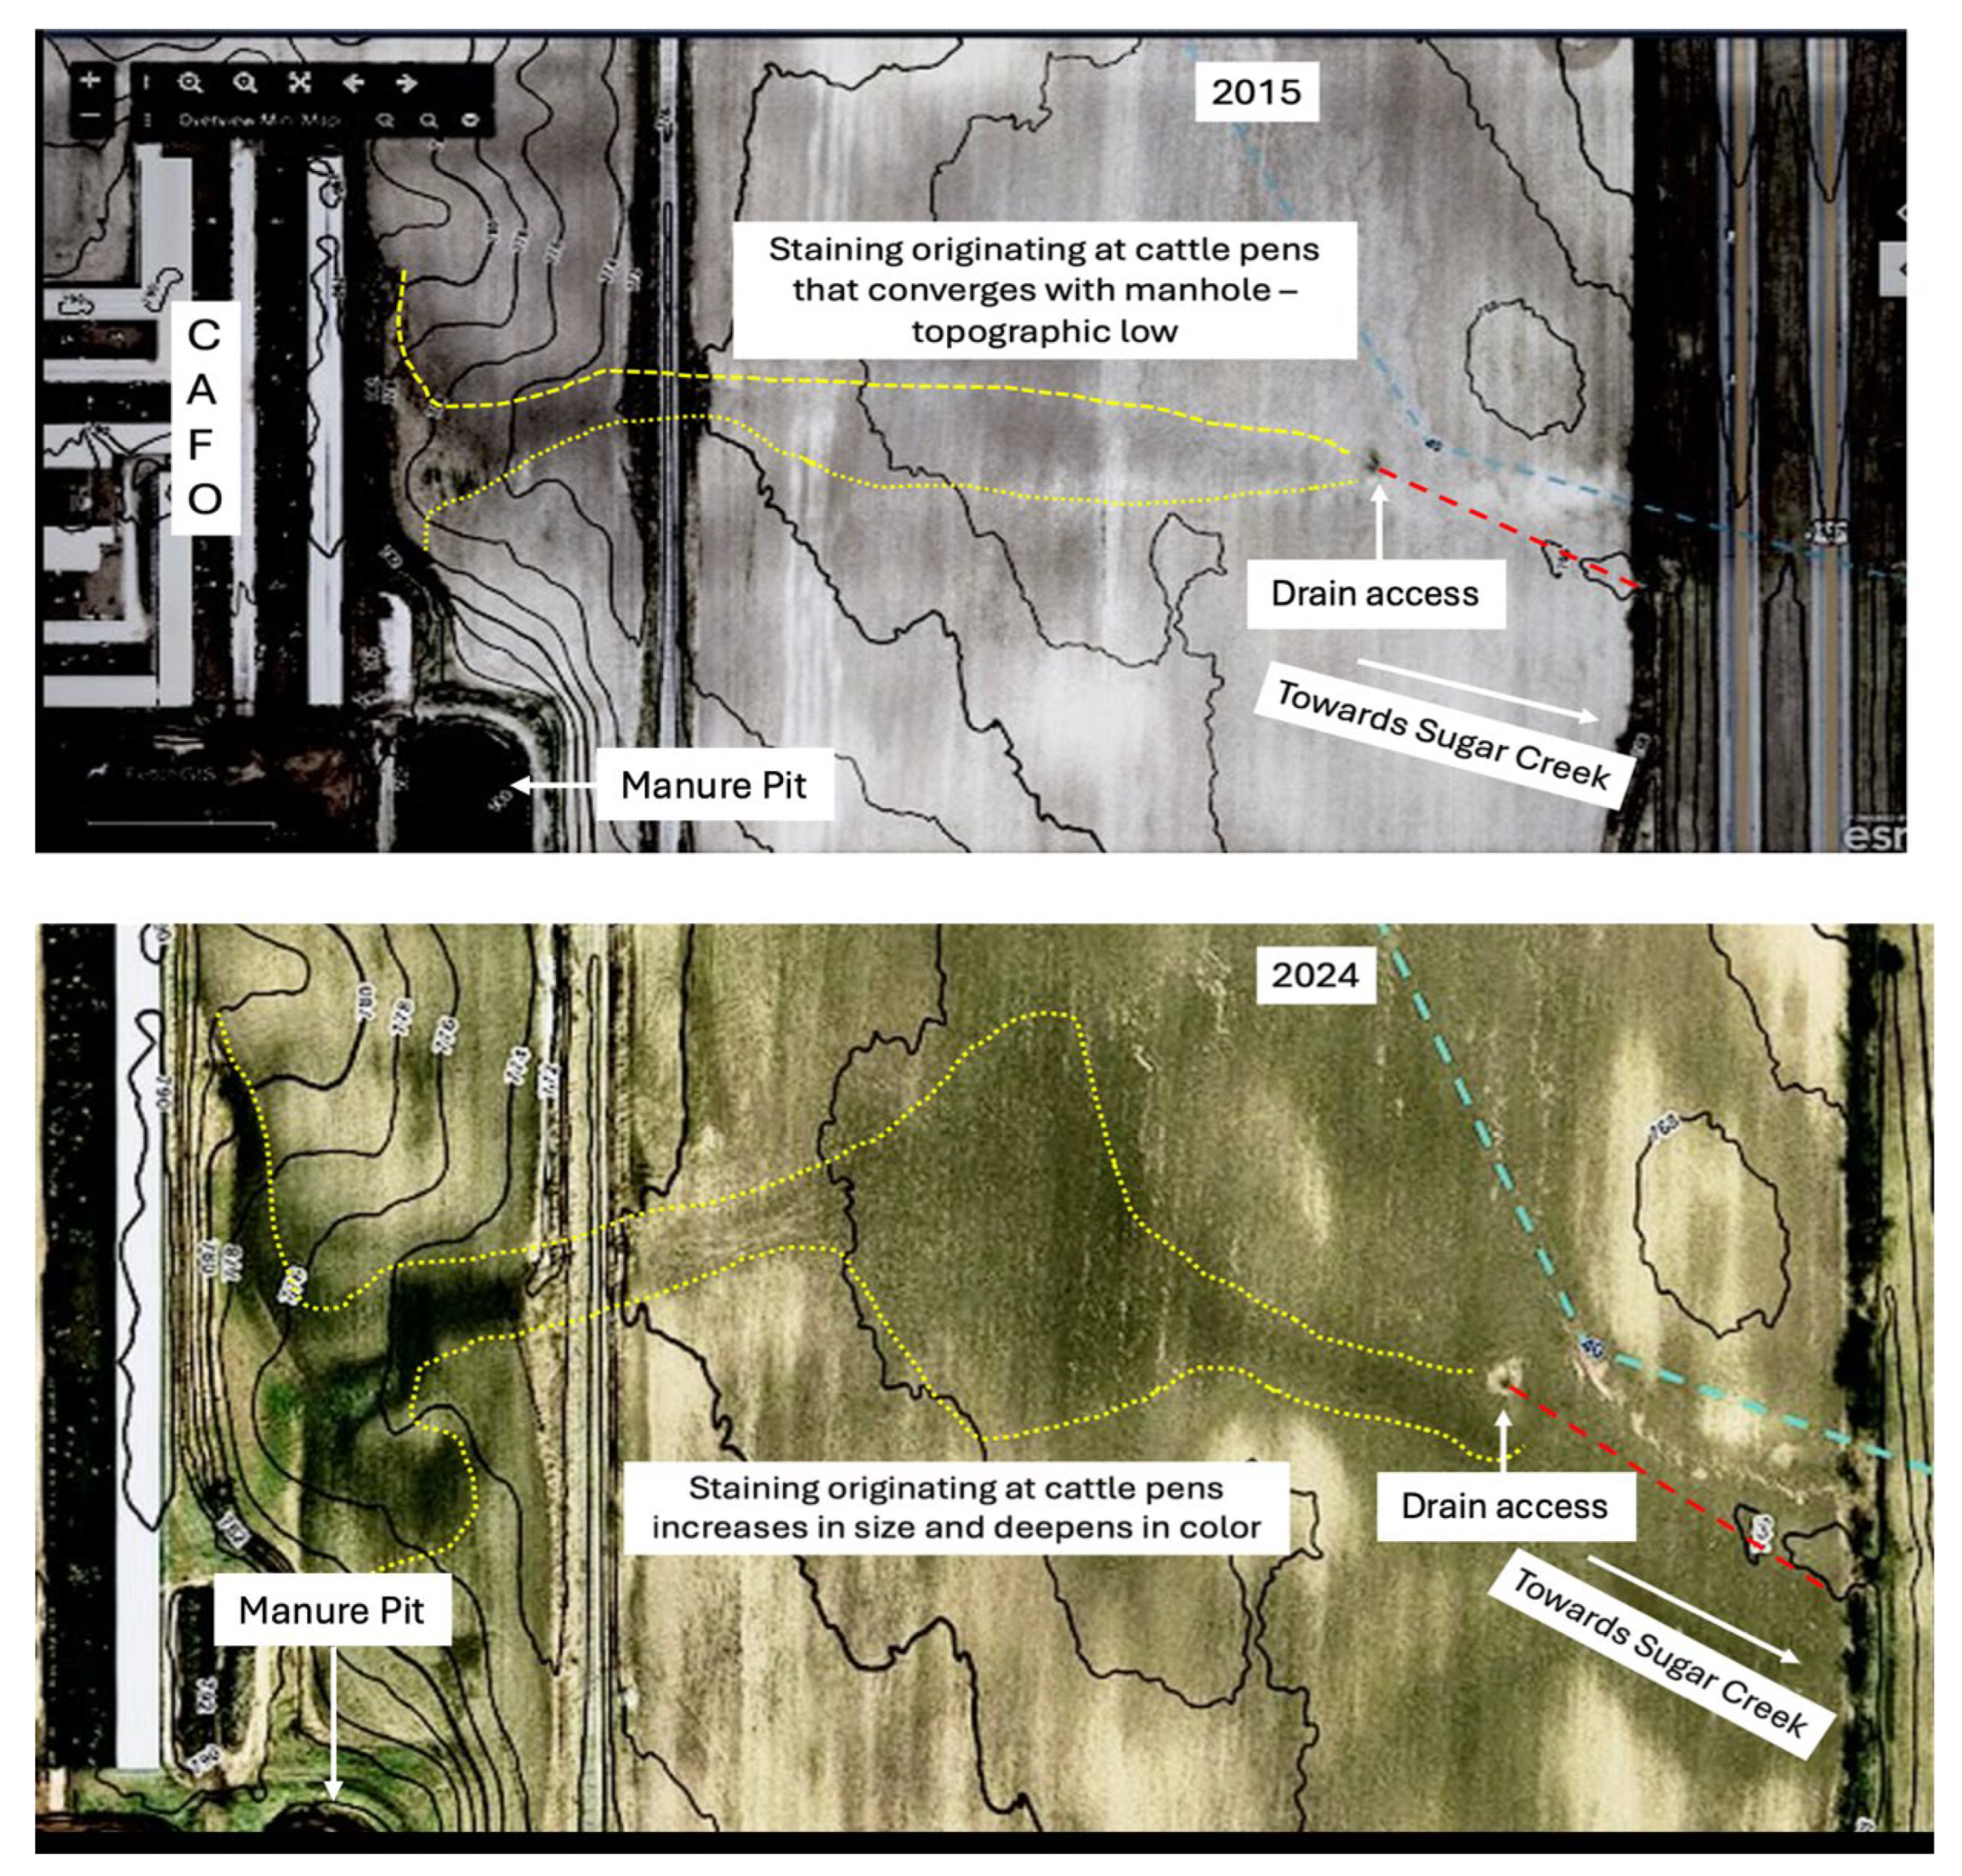
Figure 13.
Potential secondary input from a small community of homes on septic systems. Further investigation needs to address the possibility of a connection between the neighborhood septic systems and the underground drain that ties into Sugar Creek.
Figure 13.
Potential secondary input from a small community of homes on septic systems. Further investigation needs to address the possibility of a connection between the neighborhood septic systems and the underground drain that ties into Sugar Creek.
Disclaimer/Publisher’s Note: The statements, opinions and data contained in all publications are solely those of the individual author(s) and contributor(s) and not of MDPI and/or the editor(s). MDPI and/or the editor(s) disclaim responsibility for any injury to people or property resulting from any ideas, methods, instructions or products referred to in the content. |
© 2025 by the authors. Licensee MDPI, Basel, Switzerland. This article is an open access article distributed under the terms and conditions of the Creative Commons Attribution (CC BY) license (http://creativecommons.org/licenses/by/4.0/).
Copyright: This open access article is published under a Creative Commons CC BY 4.0 license, which permit the free download, distribution, and reuse, provided that the author and preprint are cited in any reuse.


