
Submitted:
19 November 2025
Posted:
21 November 2025
You are already at the latest version
Abstract
This article presents the results of calculating changes in the Earth's kinetic energy associated with periodic changes in its rotation speed. It has been shown that the power of the kinetic energy change is sufficient to fully sustain all tectonic activity. A method for predicting earthquakes based on the quantitative calculation of geodynamic field parameters is proposed. The Earth's rotation field is presented as a separate physical field, and together with the gravitational field and the Earth's elasticity field, it fully describes the dynamics on a rotating planet without any hypotheses about the internal structure of the Earth. The proposed method allows for the prediction of both natural and anthropogenic earthquakes.
Keywords:
earth’s rotation field
; kinetic energy
; potential energy
; geodynamic field
; energy balance
; laws of conservation of energy-momentum
; tectonic activity
; earthquake forecasting
; astronomical observations
; geophysical data
; anthropogenic earthquakes
Summary: This study explores the remarkable changes in the Earth’s rotation speed over the past 62 years, revealing that the average daily length of a day shifts by a minuscule 0.138 milliseconds. To put this into perspective, altering the day’s length by such a small amount requires an immense amount of energy – approximately the equivalent of detonating 2794.5 “Tsar Bomba,” each with an energy release of 58.6 megatons of TNT. Interestingly, the energy required to drive all of the tectonic activities on our planet is almost 30 times less than this amount. Our research is uniquely based on actual measurement data, avoiding any assumptions or hypotheses. The article details a method for predicting earthquakes using a standard geophysical approach to describing and measuring Earth’s physical fields. This method relies purely on empirical calculations, avoiding hypothetical assumptions, and promises to deliver accurate earthquake predictions. This breakthrough has significant implications for our understanding of Earth’s geodynamics and offers a vital tool for earthquake preparedness.
The 2011 earthquake in Japan raised a huge tsunami wave and brought to the surface the question: ‘How are changes in the Earth’s rotation parameters connected with the Earth’s seismic activity and how can this be used for earthquake forecasting?’
All media covering the tragic news of the catastrophe reported: ‘The earthquake’s magnitude was so great that it caused a shift in the Earth’s daily rotation axis by 10-17 centimeters and the earth’s day shortened by 18 microseconds,’ citing studies (Jet Propulsion Laboratory NASA 2011). Similar data were presented by specialists after the Sumatra earthquake (Jet Propulsion Laboratory NASA 2004) and after the Chilean earthquake (NASA 2010).
If we look at the graphs of the pole’s movement and variations in the Earth’s rotation (Figure 1 and Figure 2) according to the International Earth Rotation and Reference Systems Service (n.d.), we will see that the Earth’s rotation axis is in continuous motion relative to the Earth’s body and the length of the day constantly changes. The daily changes in these parameters exceed the figures announced in the media by 1-2 orders of magnitude. In the article (Gross R. & Chao B. 2006), the authors emphasize that their calculated figures are significantly lower than those that IERS registers daily. Specialists from Rosstandart released an official statement on March 22, in which, among other things, they noted that ‘the energy of an individual earthquake is negligibly small compared to the energy of the entire rotating Earth, and the earthquake itself occurs too quickly. Therefore, the effect of an individual earthquake, even as large as the earthquake in Japan, does not lead to significant changes in the rotation of the Earth’ (Rosstandart n.d.).
The authors’ idea of quantitatively assessing the magnitude of various geodynamic events using energy is quite reasonable, but unfortunately, it has not yet been correctly implemented. For example, in the article ‘Can Earth’s rotation and tidal braking control plate tectonics?’ (Riguzzi et al. 2010), only thermal energy estimates are presented, and there are no estimates of the kinetic or potential energy of the Earth, despite the fact that any movement, including tectonic movement, is by definition estimated by kinetic energy. This study fills this gap and perform a quantitative assessment of the change in kinetic energy due to the change in the Earth’s rotation speed.
To calculate the kinetic energy of rotation, it is sufficient to know only the angular velocity of rotation and the moment of inertia of the Earth relative to the polar axis, without any assumptions about the internal structure or material composition of the Earth. As initial data, we will take two time series of instantaneous values of the Earth’s angular velocity before and after subtracting the tidal component, according to the IERS EOP C04 20 from 1962 to 2023 (International Earth Rotation and Reference Systems Service n.d.). We will perform an assessment of the total amount of kinetic energy of rotation of the entire Earth using the formula:
where I is the moment of inertia of the Earth relative to the polar axis, equal to 8.0365x1037 kg*m2 (International Earth Rotation and Reference Systems Service n.d.), and ω is the instantaneous angular velocity of the Earth.
As a result of the continuous change in the Earth’s rotation speed (Figure 3a), its kinetic energy also changes. To estimate the magnitude of this energy change, we will take its time derivative (Figure 3b) and construct a graph of the RMS estimate of the power of the change in kinetic energy in a sliding window of 365 days (Figure 3c). Further analysis of the observed change in the Earth’s rotation speed, considering tidal effects, will be presented. An additional assessment of the change in the Earth’s rotation speed without considering tidal effects will allow us to judge the causes of this process. The RMS estimate of the average daily energy change is 6.846×10^20 Joules, which is equivalent to the energy of approximately 2794.45 “Tsar Bombs,” each with an energy of 58.6 megatons (one Tsar Bomba - 2.45×10^17 Joules). For verification, we will perform the calculation in another way. Let’s calculate the RMS estimate of the change in the length of the day (LOD). It is about 0.138 ms per day. Now it is enough to calculate the difference in the amount of energy for the average day length from 1962 to 2023 - 86164.100456 seconds, and for the day length of 86164.100318 seconds, i.e., 0.138 ms shorter. We will again get the energy equivalent to 2794.45 “Tsar Bombs” per day. For comparison, the total power of the modern world’s nuclear arsenal is equivalent to approximately 21.35 Tsar Bombs, and the total annual energy consumption of humanity in 2022 amounted to 762.61 Tsar Bombs. Thus, the daily flow of energy through the Earth is 100 times greater than the entire arsenal of nuclear weapons and 3.5 times greater than the annual energy consumption of all humanity. The graph of the RMS estimate of the power change in kinetic energy for the period from 1962 to 2023 shows no signs of attenuation of the periodic process, nor are there any signs of attenuation in the movement of the axis of rotation in the Earth’s body. This can only be the case when the attenuation of the energy of the process due to the expenditure of part of the energy on tectonic processes and heat losses is fully compensated by the influx of energy from external sources. Energy estimates with and without considering the tidal component show that tidal interaction provides about 75% of the energy in the process of changing the Earth’s rotation speed. The remaining 25% is associated with such processes as the movement of lithospheric plates, seismic activity, volcanism, non-tidal movements of the atmosphere and hydrosphere.
The change in rotation speed is directly related to changes in its shape, which inevitably leads to the redistribution of mass and, consequently, to changes in the Earth’s gravitational field energy. The Earth’s figure of equilibrium is determined not only by the balance of forces acting on it but also by the energy balance of the corresponding fields. This means that a change in the Earth’s kinetic energy of rotation must be compensated by an equal amount of potential energy. Using the formula (Landau L. D. & Lifshitz E. M., 1973, p. 379), it is possible to estimate the change in the Earth’s equatorial radius necessary to generate the same amount of potential gravitational energy. Calculations show that to release energy equivalent to 2794.45 “Tsar Bombs,” it is enough to change the equatorial radius by only 0.146 mm, which is comparable to the thickness of a human hair. A detailed description of the calculation methodology, source data, and Python code were posted in the repository (GitHub n.d.) and are publicly available.
One of the fundamental questions in geological science is about the sources of energy for the movement of the Earth’s crust. Plate tectonics postulates that the main mechanism of the Earth’s tectonic movements is mantle convection, and the main source of energy is the Earth’s thermal field. However, other forms of energy existence, such as kinetic and potential (gravitational energy, elastic energy of deformation), are not even considered. For example, in the work of F. Riguzzi et al. (2010), only the part of tidal energy that is converted into heat in the process of tidal friction is considered. And it is by this part of the energy that the possible energy contribution of tidal interaction processes to the energy balance of tectonic movement is judged. Any tectonic movement is a process of mass redistribution, where the main energy characteristics are kinetic and potential energy. Mass redistribution processes can also include other non-tectonic processes: tides, changes in the Earth’s rotation speed, motion of the rotation axis within the Earth’s body, oceanic and sea currents, atmospheric movements. Each mass redistribution process is accompanied by energy dissipation in the form of heat losses, and tidal friction is just one of such processes. In essence, mantle convection is a process of returning the lost energy that has been converted into heat back into the mass redistribution process. Such a process is quite possible, but due to its extremely low efficiency in terms of the second law of thermodynamics, it cannot claim the role of the main one. Much more efficient would be any process of direct exchange between the Earth’s kinetic and potential energies in processes of mass redistribution. For example, during an earthquake, the accumulated potential energy of elastic deformations is converted into the kinetic energy of tectonic movement and elastic waves (which are also characterized by kinetic and potential energy at the micro level), and only a small part of this energy is transformed into heat. In the process of convection, the main part of the energy goes directly to the convection itself, i.e., to the mass redistribution in the mantle, and only a part of this energy can be spent on the movement of tectonic plates. Table 1 presents energy estimates collected in the work of F. Riguzzi et al. (2010) and (Davis J. H. & Davis D. R., 2010) as well as estimates of the Earth’s rotational energy.
Considering that the surface heat flow is the part of the thermal flow that reached the Earth’s surface and thus was not used for tectonic processes during mantle convection, it is necessary to subtract this part of the energy from the total thermal flow. Thus, we obtain the thermal energy that can be spent on Earth’s tectonic activity: 39.33 – 106.43 ‘Tsar Bombs’ per day. It turns out that the efficiency (thermal efficiency) of mantle convection ranges from 79.86% to 161.96%. For comparison, the thermal efficiency of a gasoline engine rarely exceeds 50%. If, however, we consider the energy associated with changes in the Earth’s rotation speed as a source, we get an efficiency of 4.28% to 7.44%, which appears more realistic. It should be noted that we performed an energy assessment related only to changes in rotation speed, without taking into account the movement of the rotation axis in the Earth’s body. Thus, the energy of the Earth’s rotation is more than enough to provide not only tectonic activity but also the energy of the entire thermal field of the Earth.
The interconnection between tectonic and planetary movements of the Earth was first pointed out by B. L. Lichkov (Lichkov, 1944). Subsequently, this topic was addressed in a series of studies, including the research by K. F. Tyapkin (Tyapkin, 1982). Recently, works have emerged studying the influence of variations in the Earth’s rotation speed on seismic activity. For example, Riguzzi et al. (2010) investigated the possible influence of Earth’s rotation and tidal braking on plate tectonics. Levin et al. (2014) considered the impact of tidal effects on the process of earthquake preparation. Moreover, significant contributions were made by Shanker Kapur and Singh (2001), who confirmed the correlation between variations in the Earth’s rotation speed and seismic activity parameters. Xu (2020) conducted a study on changes in the Earth’s rotational kinetic energy caused by earthquakes from 1976 to 2019. These works remain relevant and contribute significantly to our understanding of the planet’s dynamics.
Today, there are many methods of earthquake forecasting based on precursors, and none are fully based on the theory of lithospheric plate tectonics and mantle convection. Let’s consider a method of earthquake prediction based on the theory of the Earth’s rotation, constructed without any assumptions or conjectures.
Geodynamic Field and Earthquake Prediction
Currently, in geophysics, the Earth’s rotation field is not distinguished as a separate geodynamic field. The components of this field are included in the composition of the Earth’s potential gravitational field in the form of a centrifugal potential obtained from the centrifugal acceleration of the stationary rotation field. In the potential field, there is no analogue of momentum, so momentum simply has no place in the Earth’s gravitational field. In other words, in gravimetry, the field of daily rotation is reduced and integrated into the gravity field, losing key empirical information for solving earthquake prediction tasks. As a result, researchers bound by these limitations have no choice but to interpret temporal variations of the gravitational field as a fluctuating Earth’s core (Barkin, 2005). The proposed method is based on a theory that describes the Earth’s rotational geodynamic field alongside other physical fields of the Earth, with its own set of physical components, and its connection with potential fields using the laws of energy-momentum conservation and transformation (Semashev, 2006).
The result of any tectonic movements is the redistribution of mass and an increase in entropy due to the conversion of part of the energy into heat, which is the source of convection. From an entropy perspective, a more energy-efficient process could be the direct input of energy from sources directly altering the Earth’s mass distribution, but not tectonic, such as deformations related to changes in the Earth’s rotation speed and the movement of the rotation pole. We have made an assessment of the total power of energy flow associated with changes in the Earth’s rotation speed. This assessment provides only an integral picture and theoretically can only be useful for predicting the timing of a seismic event, but not its spatial localization. Let’s move on to examining the physical fields of the Earth directly related to geodynamic processes.
The Earth’s rotation field can be represented as a composition of two elementary movements, describing the daily rotation of the planet and the movement of the geographic poles (Figure 4). The vector product of these simple rotations gives a distribution of instantaneous rotation speed vectors on the Earth’s surface, analytically continuing into the geological space. For each point of the Earth’s crust, it is possible to assign geographic coordinates, a moment in time associated with the given position of the north geographic pole, as well as vector quantities of rotation speeds and accelerations.
The field of rotations in geological space is just as much a physical reality and as closely connected with the masses of rocks as other geophysical fields. Each point of the Earth’s crust can be associated with geographical coordinates, a moment in time related to a given position of the north geographical pole, as well as vector quantities of rotation speeds and accelerations. Knowing the distribution of densities in the Earth’s crust, it is possible to calculate in each point of space the quantities derived from speeds and accelerations: E - kinetic energy, P - momentum, and Fi - inertial forces, using the formula:
where m = υρ, υ - unit volume of an element in geological space, ρ - density of rocks, m - mass, v - instantaneous speed of daily rotation, a - increment of speed of daily rotation per unit time (acceleration).
The distributions of energy, momentum, and inertial forces reflect the physical properties of the geological space under investigation. It is convenient to combine these distributions and consider the aggregate of the scalar E and vectors P and Fi at each point of the geological space as components of a single inertial rotation field.
The components of the gravitational field of the geological space include: U - potential gravitational energy, Fg - the force of attraction, calculated using the following formulas:
where m is the mass of an element in the geological space, G is the gravitational constant, M is the mass of the Earth, r is the distance to the center of mass of the Earth, and g* is the acceleration created by the force of gravity.
U = GMm/r; Fg = mg*;
Components of the elasticity field of the geological space: W - potential energy of elasticity, stress tensor σij, strain tensor εij, elasticity modulus tensor Cijkl:
where components of the stress tensor σij depend both on the current values of stresses, determined by the geodynamic and gravitational field, and on the accumulated stresses in the given area of geological space. Instantaneous stresses are defined as the part of stresses that can be analytically determined by the instantaneous values of the gravity force at each moment in time and spatial distributions of densities in a given area of geological space. The vertical component of instantaneous stresses is determined as the difference between the lithostatic pressure (the weight of all overlying rock mineral skeleton) and the hydrostatic pressure (pressure of the fluid column at the same depth). The horizontal components of instantaneous stresses can be determined from information about the lateral pressure coefficients of rock formations. Accumulated stresses can be calculated as the difference between actual and instantaneous stresses. The presence of accumulated stresses is related to the heterogeneity of the Earth’s structure and the ability of the geological space to accumulate and redistribute elastic energy.
Components of all three fields are interrelated, therefore, these three fields are conveniently combined and considered within the framework of a single geodynamic field.
Analysis of the computational formulas of the geodynamic field shows:
1. When the Earth’s rotation speed changes, the inertial component of the stress field will change, leading to a change in its compression. A change in compression leads to the redistribution of mass, and therefore, to a change in the Earth’s potential gravitational field. An increase in kinetic energy due to an increase in the Earth’s rotation speed leads to an increase in compression. It is known that a spherical body without compression has the maximum potential gravitational energy, therefore, with increased compression, the Earth’s potential gravitational energy decreases, and vice versa.
2. The process of energy transformation should also be observed due to the movement of the geographic poles. Indeed, when the position of the North geographic pole changes, all points of the Earth receive coordinate increments (Figure 3), therefore, in individual areas of the Earth’s space, there will be increments of potential and kinetic energy of opposite signs. Changes in the elastic stress field due to changes in the parameters of the inertia force field lead to a change in the deformation field, which should lead to a change in the position of the compression axis relative to the Earth’s body. This leads to the redistribution of mass and, consequently, to a change in the Earth’s potential gravitational field.
3. The irregularities of the Earth’s daily rotation and the complex trajectory of the North geographic pole’s movement create a variable geodynamic field or geodynamic background.
4. Increments in the components of the inertial and gravitational fields can be caused by the movement of rock masses during mining operations, as well as by tectonic movements.
5. Density inhomogeneities in the geological space and the curvature of geological surfaces lead to local non-uniformity in the distribution of the geodynamic field components. In areas of the Earth’s crust with smooth changes in relief, on platforms, we will see smooth changes in the forms of the geodynamic field. In areas of high-density differentiation, in the regions of continental orogens and oceanic basins, the picture is different. Here we will see anomalies of the geodynamic field in the form of sharp bends in isolines and changes in the magnitudes and directions of vector fields. In areas of sharp changes in the densities of rock formations, the impulse component increases, and in addition, during tectonic movements, potential energy of compression, extension, and torsion of crustal blocks, differing in density, accumulates. The contrast in densities of rock formations can be caused not only by their material composition but also by sharp changes in the Earth’s surface relief, the relief of underlying structural surfaces, and faults with the displacement of layers of different densities. It is in such places that strong earthquakes are registered.
6. The components of the geodynamic field are interconnected by the laws of conservation and transformation of energy: a change in the energy of one field is compensated by the same amount of energy in the components of another field, and the total energy in a certain area of the geological space remains constant at each moment in time. The impulse component is defined only for the inertial field, so the law of conservation of momentum applies only to the inertial field. However, an increase in momentum leads to the emergence of additional stresses due to the appearance of additional inertial forces, which also affects the overall energy balance of all three fields. Taking into account the increments of the geodynamic field values, the energy balance in the studied space area is determined.
7. The elasticity field plays a connecting role between the inertial and gravitational fields of the Earth. The stress field always contains both components of inertia and gravity forces in the form of the force of gravity. A distinctive feature of this field is its ability to accumulate and redistribute the energy of both fields. It can be said that this field has ‘memory’ in the sense that, in addition to information about the current geodynamic situation, it additionally contains integral information about the geodynamic situation over a certain period of time. The ability to accumulate and redistribute energy is most characteristic of the solid shells of the Earth.
8. The components of the tidal interaction field should be considered as additional perturbing terms to the existing components of the Earth’s rotation, gravity, and elasticity fields. All necessary components of such a field can be calculated based on tidal theory. Currently, IERS uses the solid Earth zonal tides of the 2010 IERS Conventions as a working model. From the analysis of the Earth’s rotational kinetic energy, it follows that the role of the main source of energy for tectonic activity should be attributed to tidal interaction. The theory of atmospheric and hydrosphere dynamics is also well described by modern models. According to these theories, energy exchange between different Earth’s shells can be carried out using the transfer of momentum and pressure, which can also be reflected in the equations of energy and momentum balance. Thus, there are prospects for including solar thermal energy as an additional energy source in the model. The processes of mantle convection may well exist, but their energy contribution is significantly exaggerated. It should be noted that if, in addition to tidal friction, all processes of dissipation associated with the redistribution of mass are considered, then the Earth’s rotation may also turn out to be the main source of energy for the thermal field. In this case, two mechanisms of energy input from the Earth’s rotation should be considered: direct – through the exchange of kinetic and potential energy, and indirect – through the dissipation of energy into thermal form and the return of this energy back into the mechanisms of mass redistribution through thermal convection in the mantle.
The enumerated properties of the method allow modeling all three fields, quantitatively describing phenomena of energy transformation in the Earth’s crust, and thus using geodynamic maps in solving applied geophysical problems. The informativeness of geodynamic maps and sections is higher than the informativeness of the sum of the original data, as digital processing methods based on vector and tensor analysis can be applied to the geodynamic field, using the laws of conservation and transformation of energy.
Below is a description of the process for constructing the simplest map of the distribution of kinetic energy - E in a certain area of geological space, applicable also for constructing maps of other components of the geodynamic field. The raw material for constructing the graphical image of the geodynamic field consists of an ordered sequence of numerical values of rock density in geographical coordinates and depth from the surface of the geoid, measured by petrophysical methods or calculated using remote geophysical methods. The studied area of geological space is divided into small fragments by establishing a three-dimensional network of lines with a constant step between the points of rock density measurement. Using IERS data, at the nodes of the network, values of instantaneous linear rotation speed and acceleration are calculated based on their geographic coordinates and depth values. At each point of rock density measurement, the value of kinetic energy is calculated using the above formula. The calculation results are processed by known methods in geophysics and cartography for visualization and are plotted on a paper basis in the form of function graphs, or using isolines in any convenient section of the studied geological space for analysis. Horizontal sections of space by a plane are maps, and vertical ones are sections of the components of the geodynamic field. The scales of geodynamic maps and sections of the Earth’s crust can vary widely and are selected by the geophysicist according to the conditions for solving the research task. The use of technical means of digital data processing of geological and astronomical observations allows for flexible changes in visualization parameters, the application of various coordinate systems and networks for differentiating geological space into elementary volumes, as well as the use of modeling the distribution of geodynamic fields over time, for example, by animation methods. In the algorithms of programs for calculating geodynamic maps, methods of spherical or Riemannian geometry should be used.
Rock Burst and Anthropogenic Earthquake Forecasting
The excavation of mining operations is often accompanied by the phenomenon of rock bursts. The nature of this dangerous phenomenon is poorly understood, and currently, the origin of the energy of rock bursts is explained by hypotheses. Constructing geodynamic maps in the area of a planned mining operation allows for calculating the safest parameters for the extraction of rock masses without resorting to any hypotheses. The maps determine the direction of excavation with the minimal increments and gradients of the components of the geodynamic field. Geodynamic fields of artificial and natural origin are summed up, and, depending on the direction of the artificial fields, they can either strengthen or weaken each other. Monitoring natural geodynamic fields using data from the International Pole Movement Service allows for considering the energy background and predicting an increased risk of rock bursts. Critical parameters of rock bursts include: geographical location, direction of excavation, speed, and volume of rock mass extraction.
Anthropogenic earthquakes are often observed with the abrupt discharge of large masses of water from reservoirs or as a result of intensive extraction of fluids from oil and water wells. These phenomena can be quantitatively described based on computational formulas or by constructing geodynamic maps before and after anthropogenic intervention in geological processes. A retrospective analysis of numerous seismically hazardous sites in different areas of the Earth will allow establishing cause-and-effect relationships between the parameters of the movement of the geographic poles, the geographical location, and the geological structure of seismically active areas of the Earth’s crust, thereby increasing the accuracy of earthquake forecasting.
Forecasting of Powerful Natural Earthquakes
Currently, in the field of seismology, factors related to the Earth’s irregular rotation and the laws of conservation and transformation of energy are not taken into account. In the geophysical model of seismic phenomena, it is necessary to construct maps of natural geodynamic fields and consider their variations over time. Building geodynamic maps allows for a more comprehensive investigation of the processes of transforming the energy of geophysical fields into the energy of seismic waves, modeling phenomena based on known physical laws while taking into account the peculiarities of the Earth’s crust structure and the movement of the geographic poles, and accumulating empirical information for the purpose of solving earthquake forecasting tasks. Analysis of the distribution of epicenters of strong earthquakes allows establishing a correlation with increased values of gradients in geodynamic fields.
The method of constructing geodynamic maps of the Earth’s crust for solving seismological tasks should be modified as follows. On the map of the studied seismically active area of the Earth’s crust, values are plotted not of the magnitudes E, P, Fi, U, W, Fg, σij themselves, but of their increments: ΔE, ΔP, ΔU, ΔW, ΔFi ,ΔFg , Δσij between two moments in time corresponding to major earthquakes in the area. Additional material includes seismic data accumulated over more than a century of instrumental observations. Let’s call these maps differential (anomalous) geodynamic field maps. These maps allow for a quantitative assessment of the critical energy level, exceeding which in a given area leads to a catastrophic earthquake. However, this is not enough to warn people about the impending danger, as the moment when the earthquake will occur is also crucial. For this, data from the international service for monitoring pole movement should be used. If the parameters of the pole movement and changes in the rotation speed are close to or coincide with critical moments of catastrophic earthquakes in the area in the past, it means that a seismic event may recur.
In the absence of initial data on density, elasticity moduli, and information about the current stress state necessary for constructing geodynamic maps, statistical analysis methods are used to search for correlational links between time intervals of seismic activity in the region and energy estimates of changes in the Earth’s rotation speed and the parameters of the movement of the North geographic pole. The periodicity of tectonic activity will be directly proportional to the total energy received from external gravitational sources and correlate with the periodicity of the arrival of this energy. Using this magnitude as a time delay in calculating correlational links between the total accumulated RMS estimate of kinetic energy associated with changes in the Earth’s rotation parameters and the parameters of the Earth’s tectonic activity manifestation can significantly improve the reliability of earthquake forecasts both in specific regions of the Earth and for the Earth as a whole. The physical mechanism of such periodicity is explained by the fact that the possibility of energy accumulation in individual regions is limited by the strength limit of rocks in areas of the highest stress concentration. When the accumulated energy exceeds a certain threshold, there is a release of elastic energy in the form of a seismic event, leading to both a redistribution of mass and a reduction in accumulated elastic energy. If the seismic event did not result in significant structural changes, then the ability to accumulate stresses in this area of geological space remains at the same level.
The interrelation between the geodynamic, electrical, magnetic, and other fields of the Earth may be more complex and mediated, so including these fields in the consideration at this stage does not have practical benefits. As data accumulates on studying the mechanisms of energy accumulation and redistribution between the three fields, discrepancies in the energy or momentum balance may arise, indicating the need to include new physical fields in the proposed model.
Should we search for hypothetical sources of movement in the inaccessible depths of our planet when an ocean of unaccounted energy of the Earth’s movement as a planet rages around us? We do not notice geological storms due to the very short duration of human life, but we can reconstruct the face of the Earth in past geological epochs and quantitatively assess the amount of energy released as a result of the irregular rotation of the Earth and the movement of the geographic poles. This energy has been spent somewhere, and naturally, we should look for its traces in geological observation materials. Indeed, on geographical maps, we see many signs of the movement of parts of the Earth’s crust, but we cannot quantitatively assess the work spent on tectonic movement due to the lack of a mathematical model of the Earth’s crust movement. Based on the laws of conservation and transformation of energy, energy balance equations can be compiled. All geophysical fields are energetically connected, so it is possible to investigate processes of energy transformation from one form of a geophysical field to another. These studies will allow building a comprehensive geophysical model of the Earth, necessary for solving many current tasks of geophysics, including the construction of a unified theory of geophysical methods.
Expertise and Verification. The proposed approach has undergone independent scientific and technical examination within the framework of the Eurasian patenting procedure (Patent No. 046828 dated 2024.04.25), which confirmed its novelty, inventive step, and industrial applicability. This objectively proves that the method represents not a hypothesis, but an operational scientific methodology ready for practical application. The full patent text is available at: https://www.eapo.org/pubservices/prod/file-object/EA/A1/202393345/TEXT-24042024.pdf
Conclusions
The method of earthquake forecasting based on a complex of astronomical and geophysical observation data does not contain speculative geological hypotheses and a priori assumptions about the internal mechanisms of the Earth’s crust movement.
The new method of describing tectonic movements uses modern mathematical theory and empirical observational materials on the structure of the Earth’s crust.
The method of earthquake forecasting based on a complex of astronomical and geophysical observation data allows integrating the experience of astronomy and physics in solving scientific and applied problems of geology and geophysics.
The implementation of the proposed method of earthquake forecasting based on a complex of astronomical and geophysical observation data does not require the creation of any additional devices but only requires the availability of initial measurement data and software.
Data Availability Statement
The data utilized in this study were sourced from the publicly accessible IERS EOP C04 database all and can be found at: http://hpiers.obspm.fr. The Python code employed for the calculations in this research has been made available on a GitHub repository, ensuring full transparency and reproducibility of the results. The repository is accessible to all and can be found at: https://github.com/semashev/EarthEnergy.
Acknowledgments
The author expresses gratitude for the support received during the research and manuscript preparation process. This work was conducted independently without any financial support.
References
- Barkin, Yu.V. (2005). Celestial Mechanics of Earth’s Core and Mantle: Geodynamic and Geophysical Consequences. In: Tectonics of the Earth’s Crust and Mantle. Tectonic Patterns of Mineral Deposits: Proceedings of the XXXVIII Tectonic Meeting. Moscow: GEOS, pp. 30-33.
- Davis, J. H. & Davis, D. R. (2010). Earth’s Surface Heat Flow. Solid Earth 1, 5-24. [CrossRef]
- GitHub. (n.d.). Calculation of Earth’s Kinetic and Potential Energy. Available at: https://github.com/semashev/EarthEnergy.
- Gross, R. S., and Chao, B. F. The Rotational and Gravitational Signature of the December 26, 2004 Sumatran Earthquake, Surv. Geophs., 27(6), 615–632. 2006. [CrossRef]
- International Earth Rotation and Reference Systems Service (IERS). (n.d.). Official Portal. Available at: http://hpiers.obspm.fr/.
- Jet Propulsion Laboratory NASA. (2004). NASA Details Earthquake Effects on the Earth. Available at: https://www.jpl.nasa.gov/news/nasa-details-earthquake-effects-on-the-earth.
- Jet Propulsion Laboratory NASA. (2011). Japan Quake May Have Shortened Earth Days, Moved Axis. Available at: https://www.jpl.nasa.gov/news/japan-quake-may-have-shortened-earth-days-moved-axis.
- Landau, L. D. & Lifshitz, E. M. (1973). Theoretical Physics Volume II. Moscow: Nauka Publishing. p. 379.
- Lichkov, B. L. (1944). Changes in the Earth’s Relief in Connection with its Movement and Energetics (To the Characteristics of Geological Space). Reports of the Academy of Sciences of the USSR, Vol. XLV 8.
- NASA. (2010). Chilean Quake May Have Shortened Earth Days. Available at: https://www.nasa.gov/chilean-quake-may-have-shortened-earth-days.
- Rosstandart. (n.d.). Explanation of the Parameters of Earth’s Rotation. Available at: https://iso-consulting.ru/novosti-razyasnenie-rosstandarta-parametrov-vrashheniya-zemli.html.
- Riguzzi, F., Panza, G., Varga, P., & Doglioni, C. (2010). Can Earth’s Rotation and Tidal Despinning Drive Plate Tectonics? Tectonophysics 484(1-4), 60-73. [CrossRef]
- Semashev, A. T. (2006). A Complex of Astronomical and Geophysical Observations for Earthquake Prediction. Geophysics 3, pp. 60-63.
- Semashev, A. T., Semashev, G. A. (2024). Method for earthquake prediction based on complex astronomical and geophysical observation data (Eurasian Patent No. 046828). Eurasian Patent Organization. https://www.eapo.org/pubservices/info/registry/inventions/patents/046828?ipType=InventionPatentCase.
- Tyapkin, K. F. & Kivelyuk, T. T. (1982). Study of Fault Structures by Geological-Geophysical Methods. Moscow: Nedra.
- Началo фoрмы.
Figure 1.
Chart of the movement of the North Geographic Pole from 21.01.2011 to 01.04.2011 (left) and an enlarged fragment from 09.03.2011 to 13.03.2011 (right).
Figure 1.
Chart of the movement of the North Geographic Pole from 21.01.2011 to 01.04.2011 (left) and an enlarged fragment from 09.03.2011 to 13.03.2011 (right).
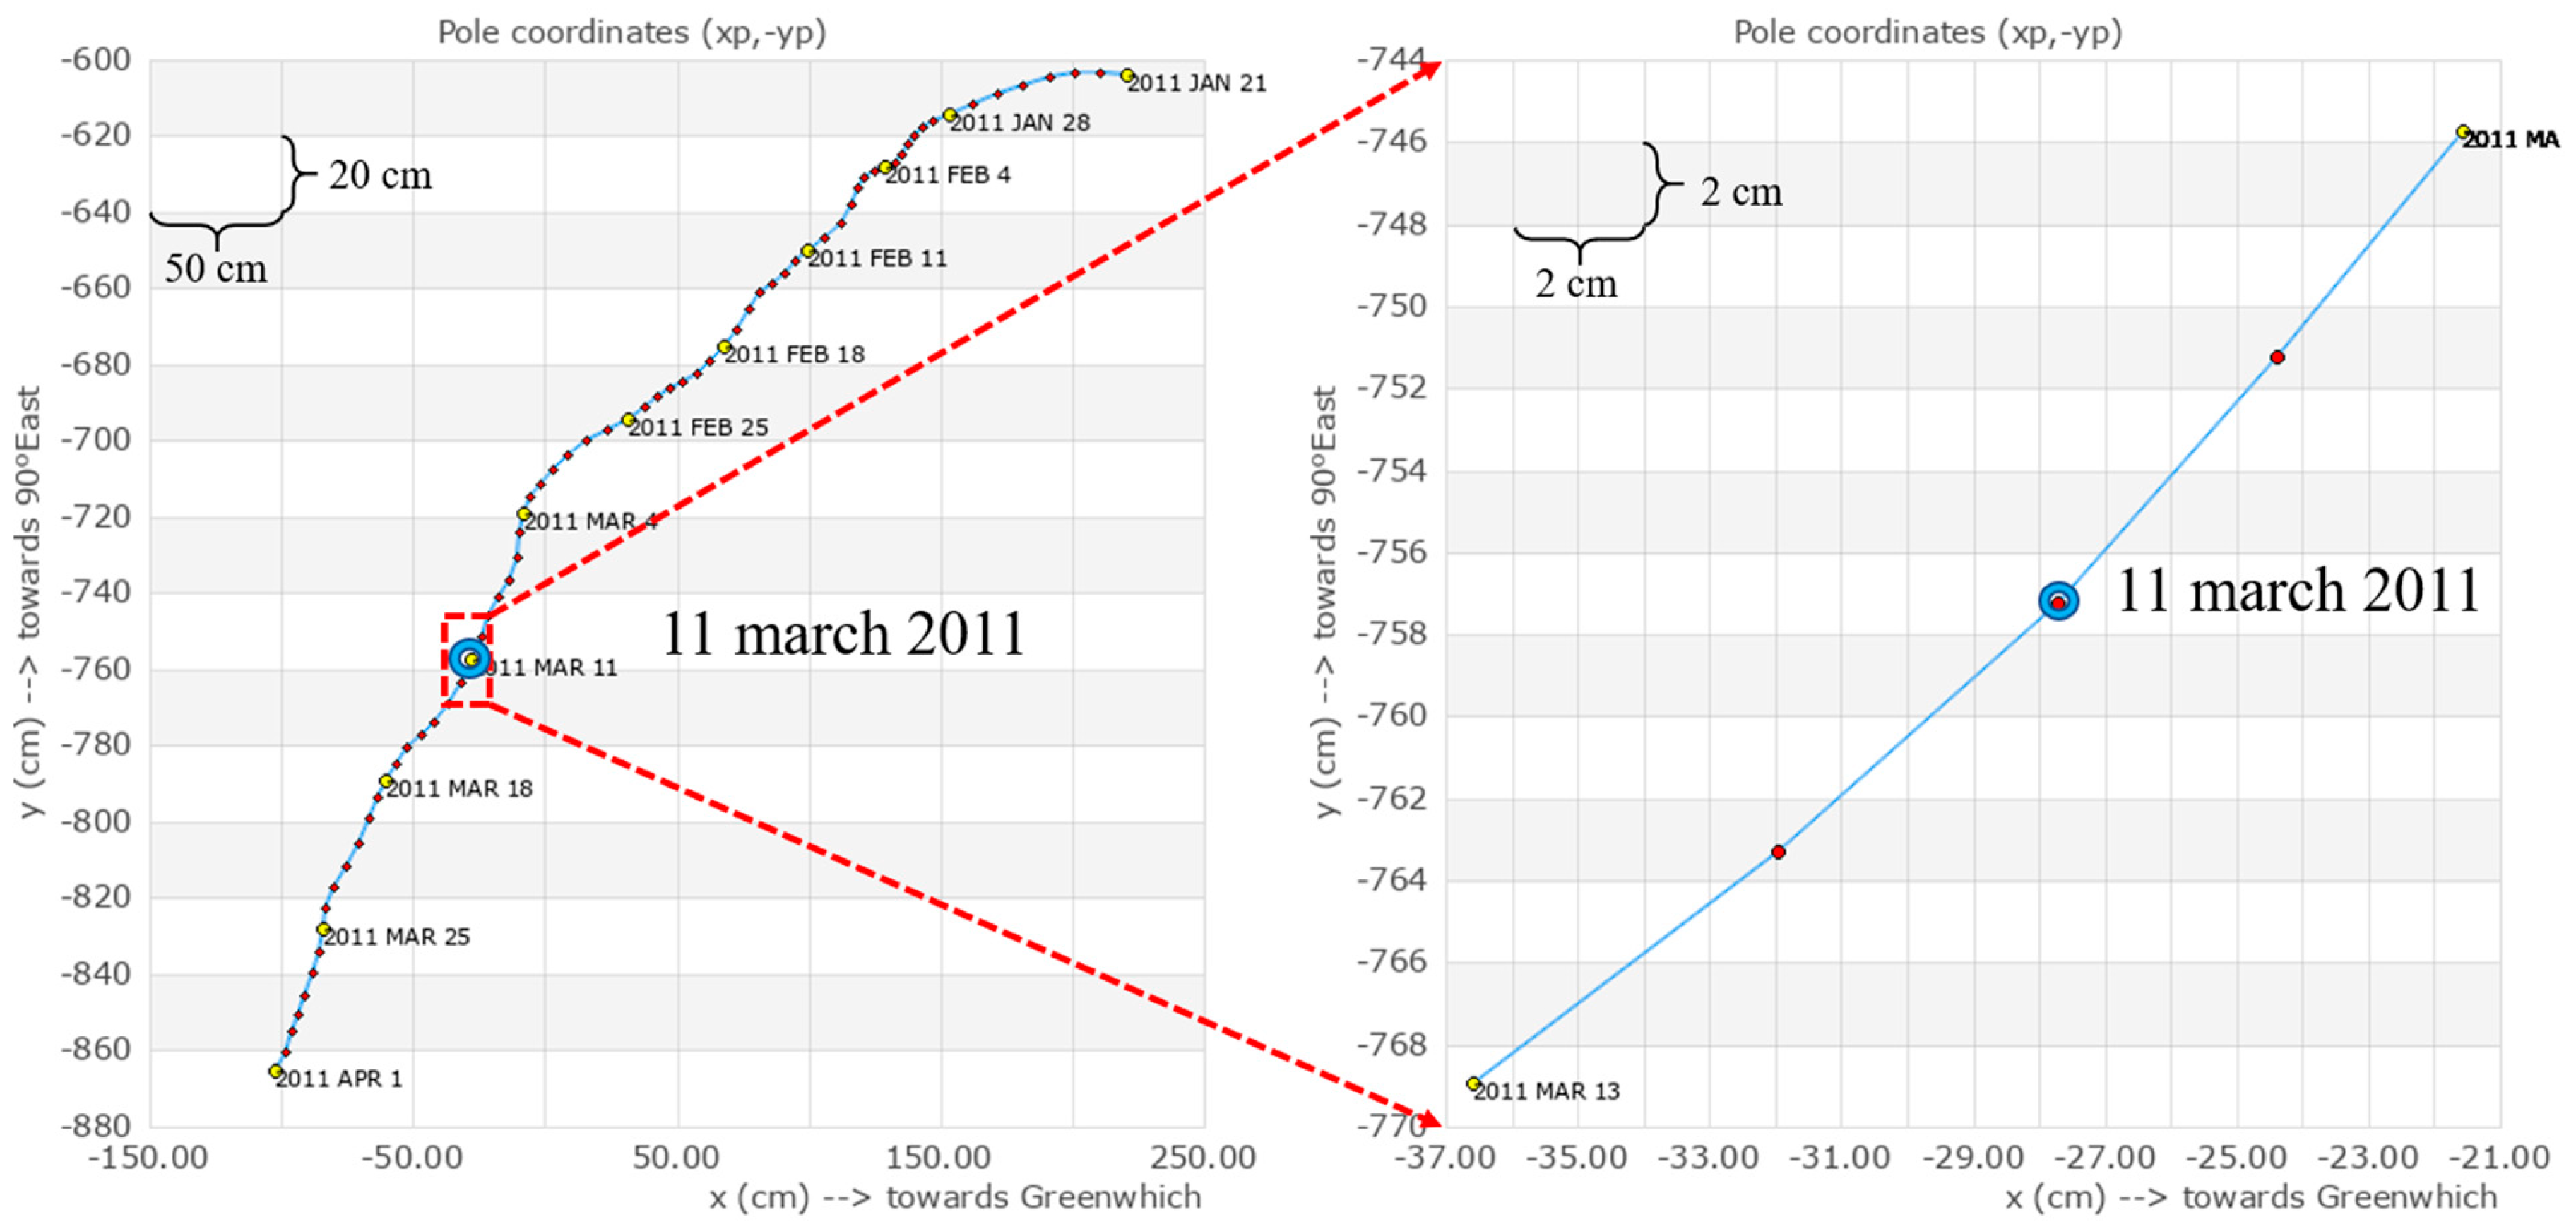
Figure 2.
Chart of the changes in the length of the day from 21.01.2011 to 01.04.2011 (left) and an enlarged fragment from 09.03.2011 to 13.03.2011 (right).
Figure 2.
Chart of the changes in the length of the day from 21.01.2011 to 01.04.2011 (left) and an enlarged fragment from 09.03.2011 to 13.03.2011 (right).
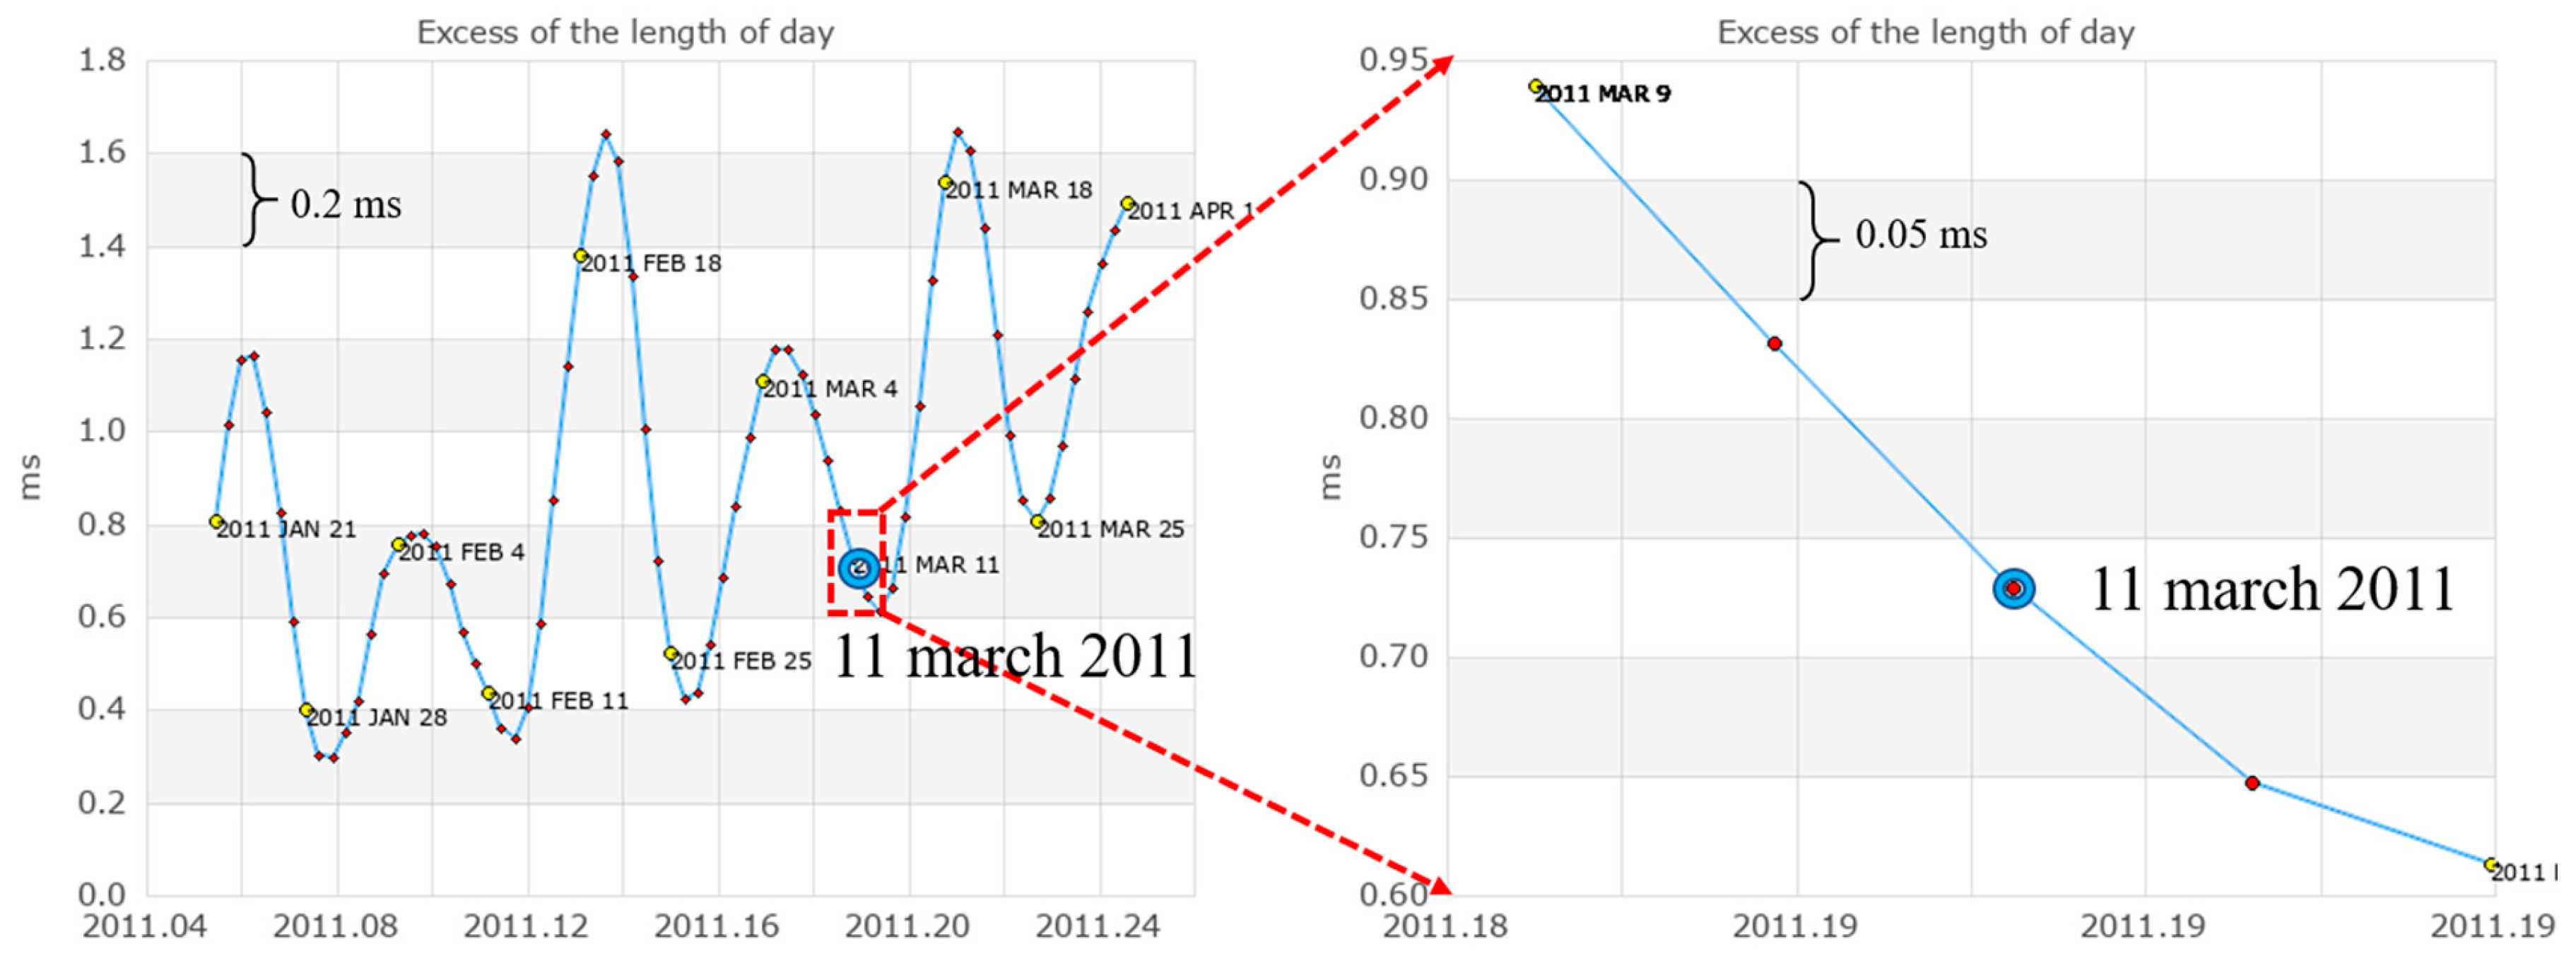
Figure 3.
Assessment of changes in the Earth’s rotational kinetic energy for the period from 1962 to 2023, according to IERS data.
Figure 3.
Assessment of changes in the Earth’s rotational kinetic energy for the period from 1962 to 2023, according to IERS data.
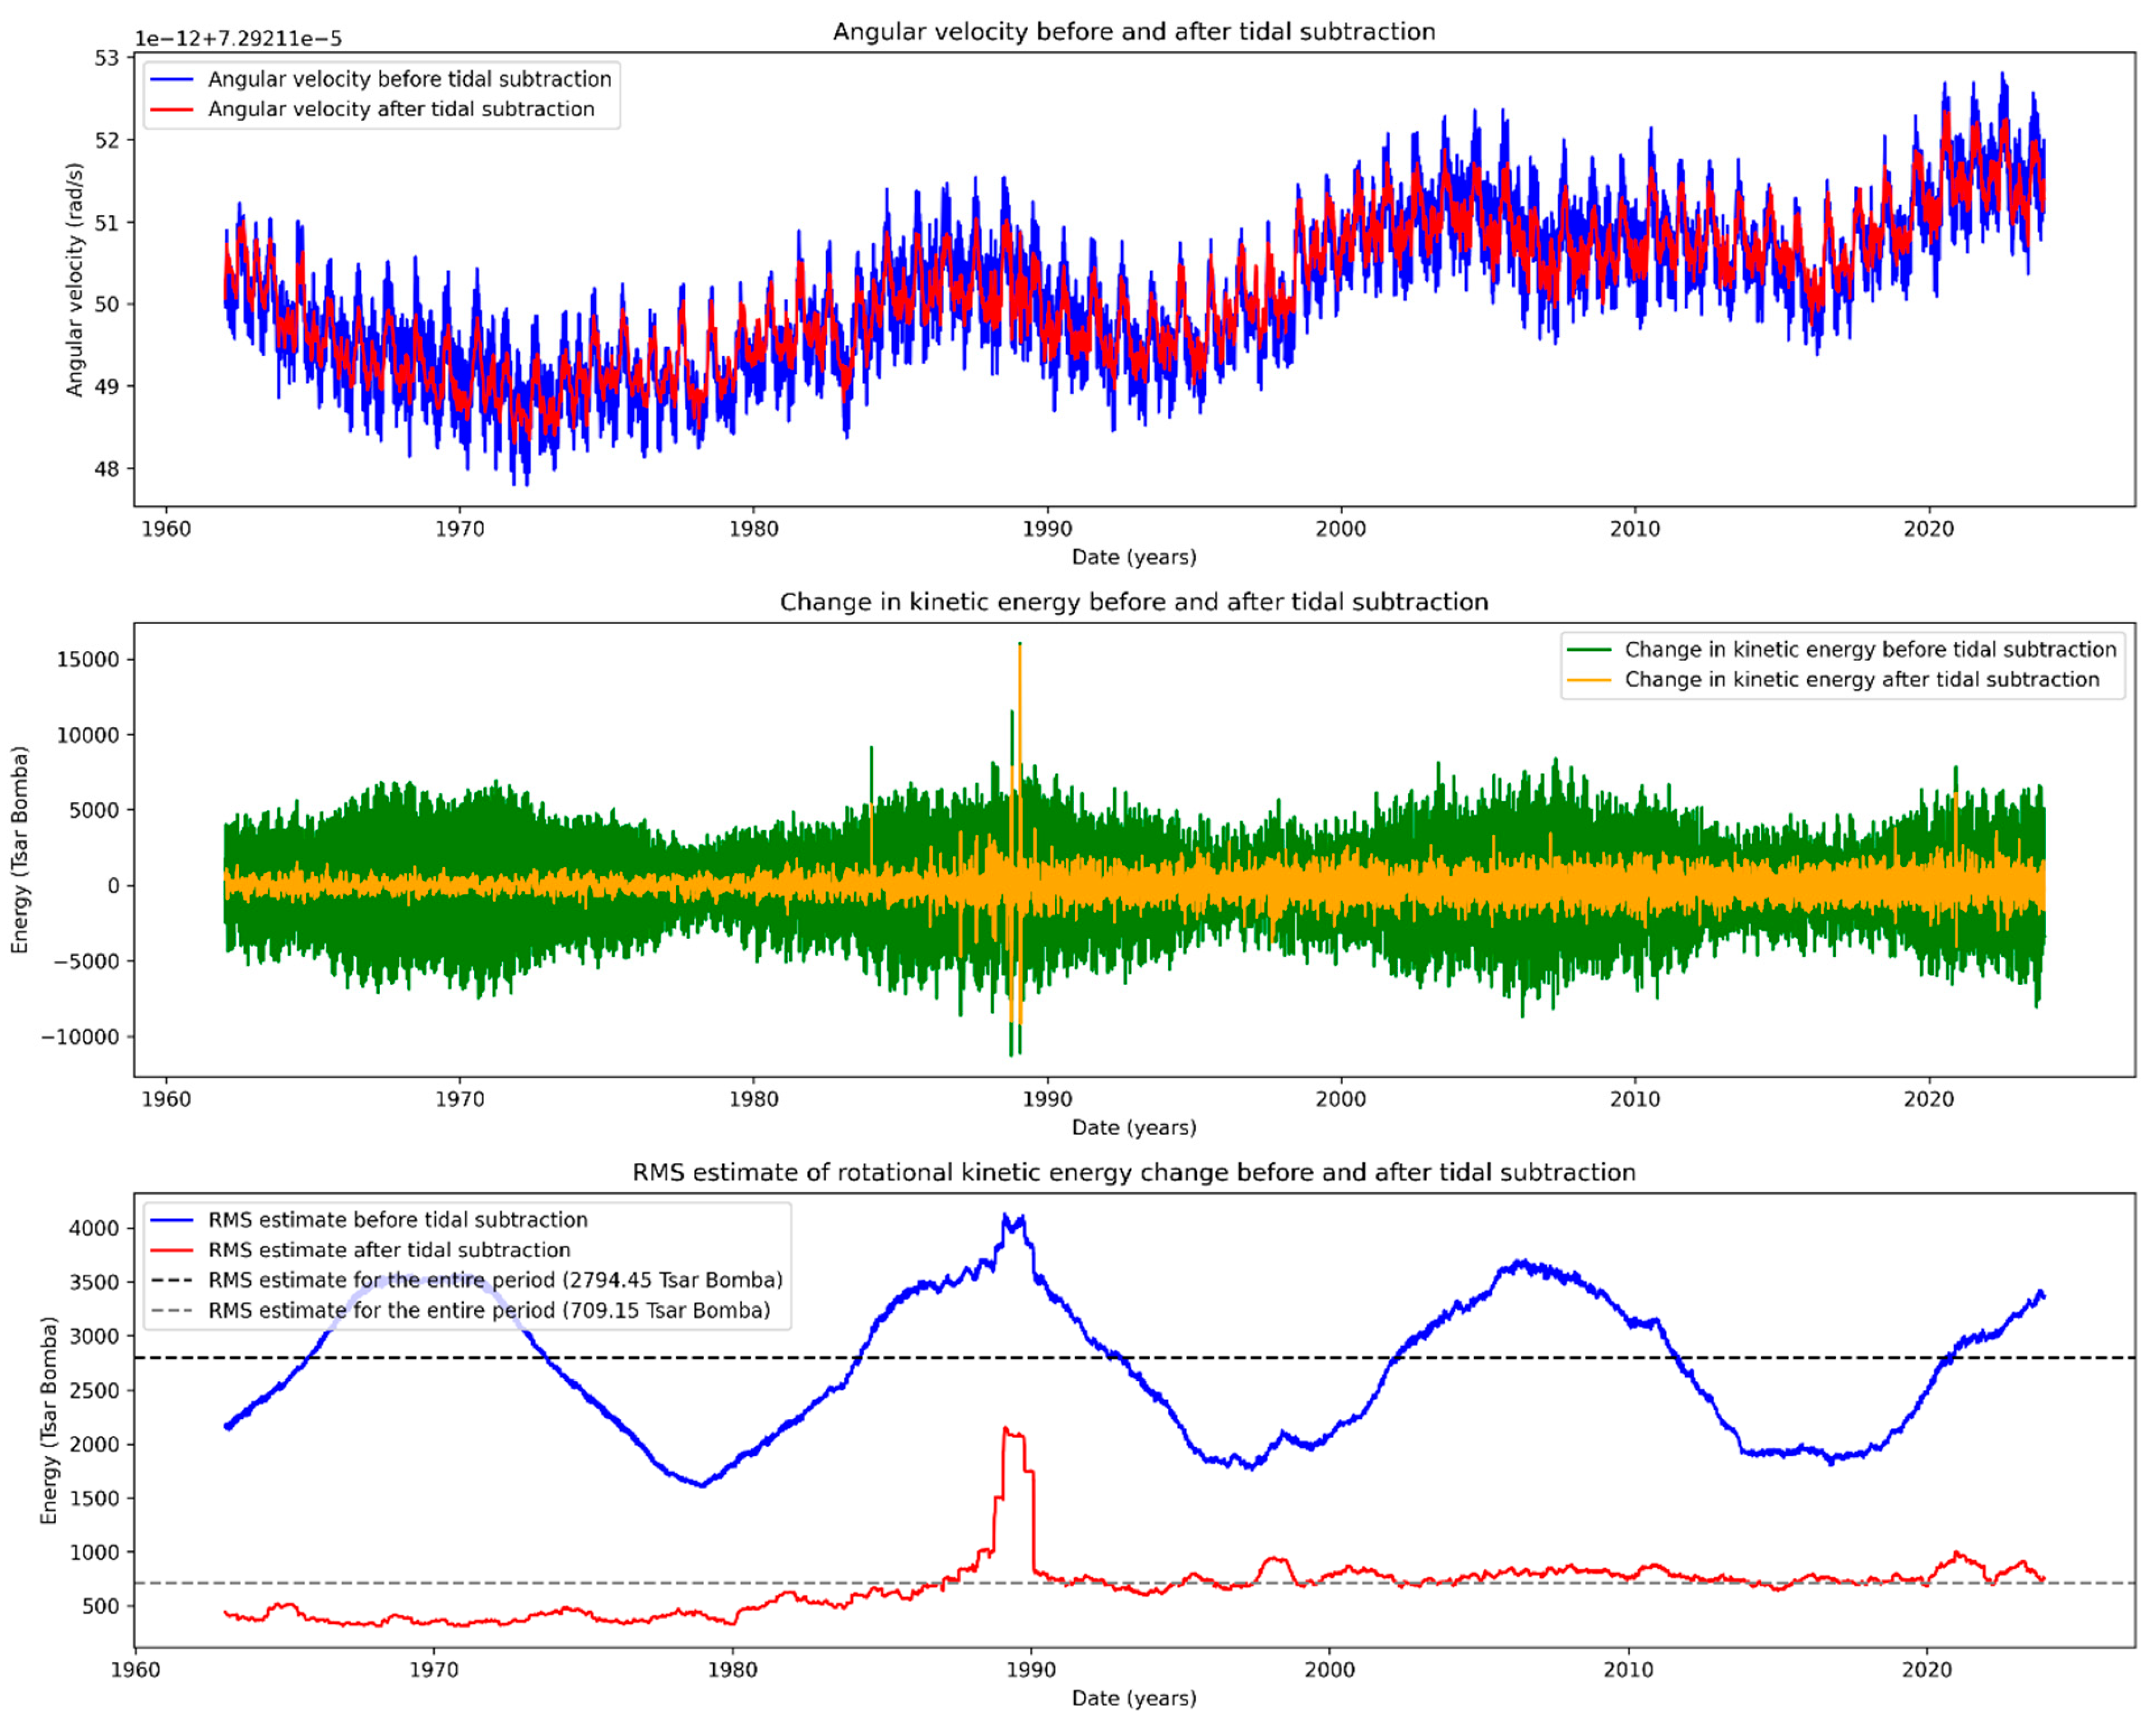
Figure 4.
Group of elementary Earth’s rotations: a) corresponds to the rotation of the Earth’s body with the shift of the rotation axis; b) corresponds to the rotation of the Earth relative to the current position of the rotation axis.
Figure 4.
Group of elementary Earth’s rotations: a) corresponds to the rotation of the Earth’s body with the shift of the rotation axis; b) corresponds to the rotation of the Earth relative to the current position of the rotation axis.
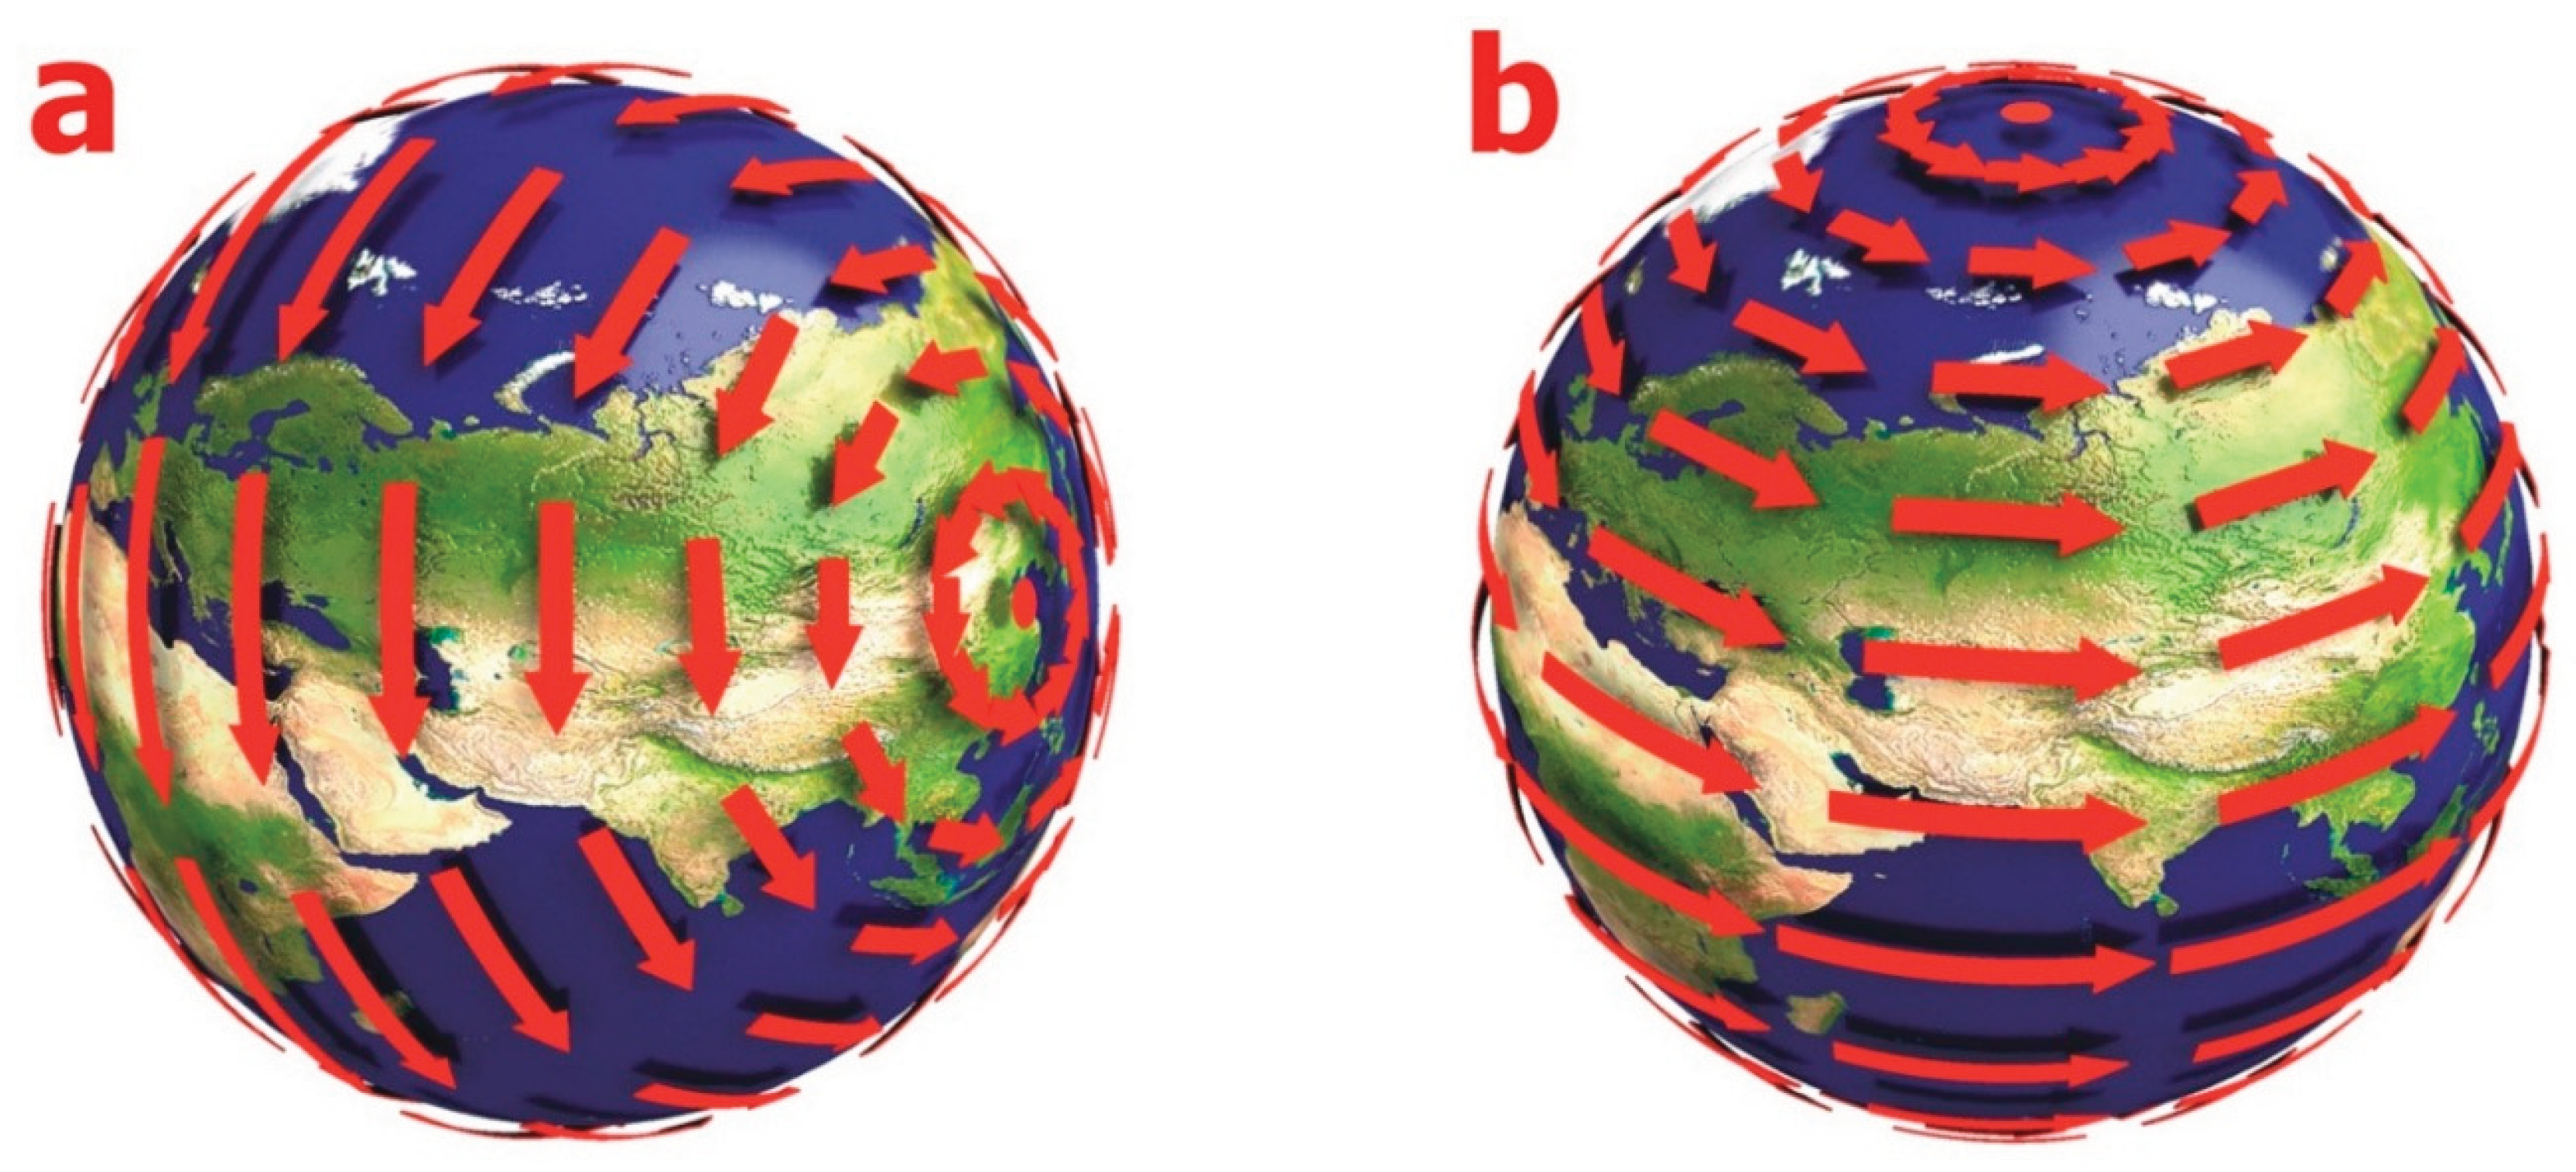

Table 1.
Energy estimates of various Earth processes.
| Energy Process | Evaluation (*e1020 Joules /year) | Evaluation (“Tsar Bombs” /day) |
|---|---|---|
| Global Tectonic Activity | 57–76 | 63.7 – 85.0 |
| Total Heat Flow from the Earth’s Interior | 50–110 | 55.9 – 123.0 |
| Earth’s Surface Heat Flow (Davis J. H. & Davis D. R., 2010) |
14.83 | 16.57 |
| Energy Available for Tectonic Activity | 35.17–95.17 | 39.33 – 106.43 |
| Tidal Friction Energy | 0.4–1.1 | 0.45 – 1.23 |
| Change in Earth’s Rotational Kinetic Energy (including tides) |
2500.50 | 2794.45 |
| Change in Earth’s Rotational Kinetic Energy (excluding tides) |
632.88 | 709.15 |
Disclaimer/Publisher’s Note: The statements, opinions and data contained in all publications are solely those of the individual author(s) and contributor(s) and not of MDPI and/or the editor(s). MDPI and/or the editor(s) disclaim responsibility for any injury to people or property resulting from any ideas, methods, instructions or products referred to in the content. |
© 2025 by the authors. Licensee MDPI, Basel, Switzerland. This article is an open access article distributed under the terms and conditions of the Creative Commons Attribution (CC BY) license (http://creativecommons.org/licenses/by/4.0/).
Copyright: This open access article is published under a Creative Commons CC BY 4.0 license, which permit the free download, distribution, and reuse, provided that the author and preprint are cited in any reuse.


