Submitted:
01 December 2025
Posted:
02 December 2025
You are already at the latest version
Abstract
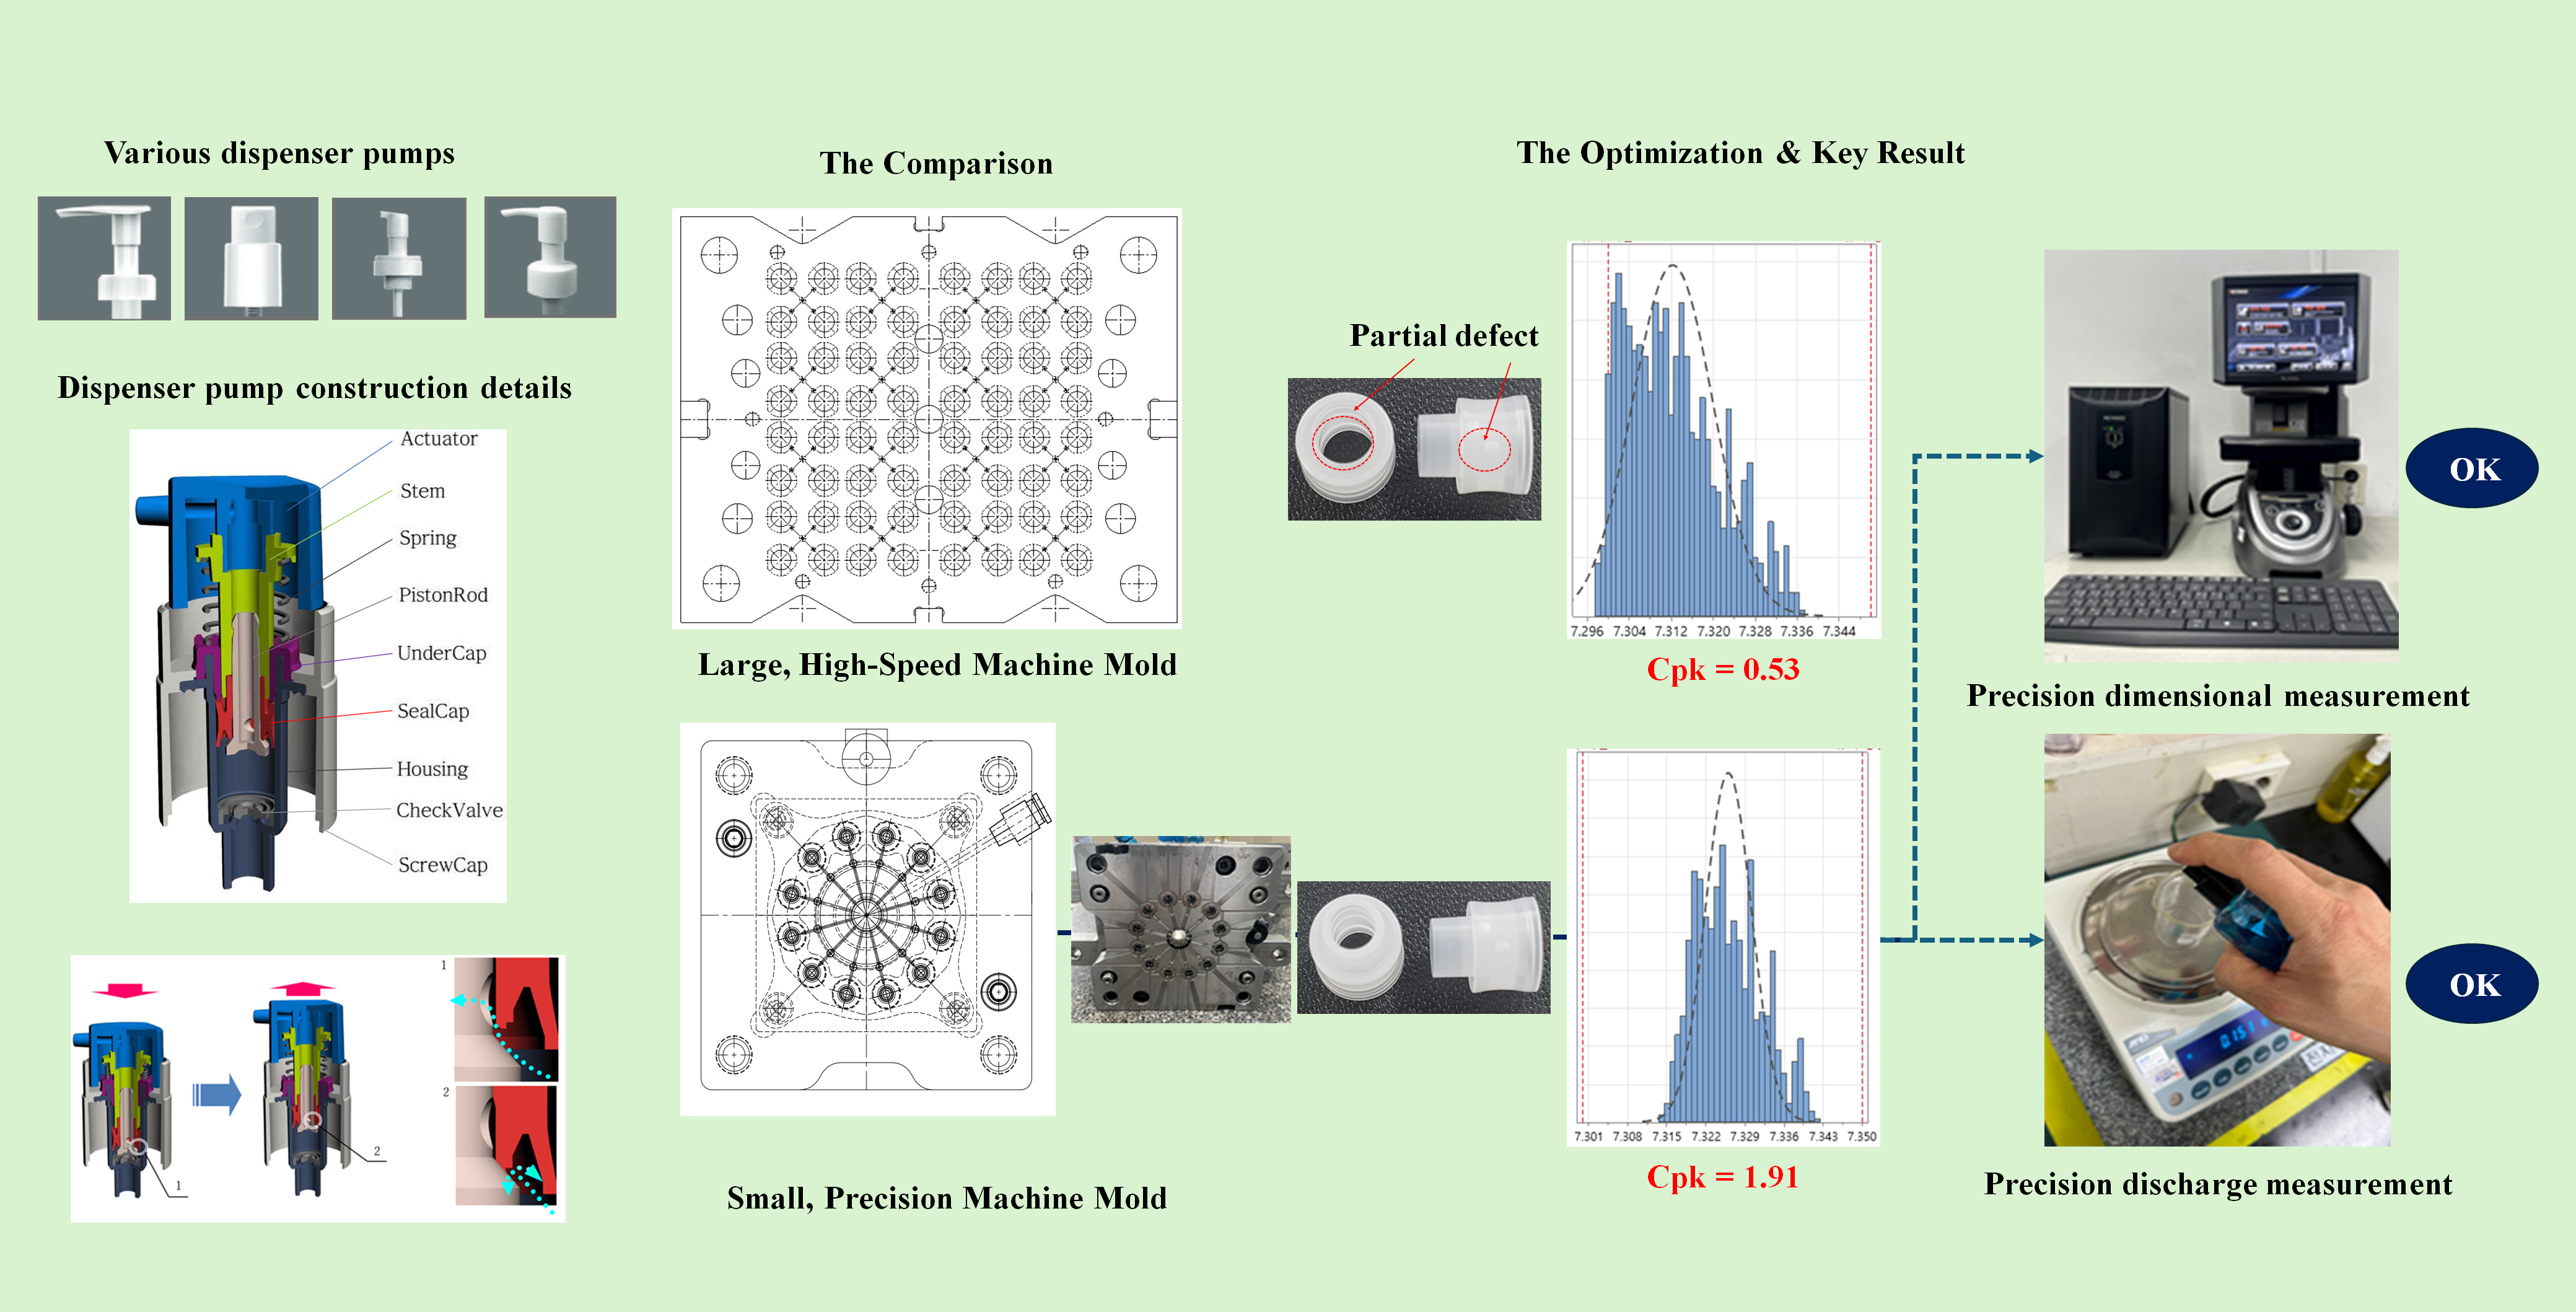
The dimensional stability of the SealCap, a critical polymer component in cosmetic dispenser pumps, is crucial for ensuring consistent discharge volume and preventing functional defects. This study aimed to optimize the injection molding process for high-precision SealCaps by analyzing changes in machine type and processing conditions. We conducted a comparative analysis between a large 64-cavity high-speed machine and a small 12-cavity precision machine. For the precision machine, three conditions were tested by varying the holding pressure time (3.0–3.5 s), resulting in cycle times of 7.2–7.7 s. The dimensional stability of the SealCap's outer diameter and the discharge volume of assembled pumps were evaluated using process capability indices (Cp and Cpk). The results demonstrated that the small precision machine under condition C (7.7 s cycle time) achieved the highest process capability, with a dimensional Cpk of 1.91, significantly outperforming the large high-speed machine (Cpk = 0.53). Similarly, the discharge volume Cpk was highest under condition C at 1.31, indicating superior functional consistency. These findings indicate that a longer cycle time enhances process stability and reduces inter-cavity variation, leading to improved dimensional quality. Therefore, condition C was identified as the optimal manufacturing process, confirming that utilizing a precision injection molding machine with optimized parameters is a highly effective strategy for producing high-quality, high-precision polymer components.
Keywords:
injection molding
; process optimization
; process capability index (Cpk)
; cosmetic dispenser
; dimensional stability
1. Introduction
The demand for high-precision polymer components is paramount in various industries, where dimensional accuracy directly impacts functional performance and product reliability. In the cosmetics industry, dispenser pumps serve as a prime example, requiring consistent and reliable operation for customer satisfaction. These devices consist of several intricately assembled polymer parts, where the SealCap is a particularly critical internal component, as illustrated in Figure 1. The SealCap's primary function is to create the dynamic seal necessary for pressure generation. Achieving the required tolerances for this component often demands advanced micro-injection molding techniques[1]. Even minute dimensional deviations can compromise the integrity of the assembly, leading to significant failures such as inconsistent dosing or leakage.
It is well-established that injection molding process parameters—such as holding pressure, cooling time, and mold temperature—critically influence the shrinkage and warpage of molded parts, and thus their final dimensional quality [2,3]. Research in this field is extensive, addressing these challenges not only through process optimization but also through the development of specialized equipment, for instance, to handle materials like recycled polymer waste [4]. Concurrently, recent advancements have moved towards integrating sophisticated analysis tools, such as multiscale modeling and in-situ characterization, to gain a deeper understanding of polymer behavior during the molding process [5,6].
While traditional optimization focuses on minimizing defects, recent trends emphasize statistical process control (SPC) to ensure long-term stability. The process capability index (Cpk) is an effective metric for this purpose, and it has been successfully applied as a target response for optimizing injection molding parameters. However, a critical challenge in mass production is the "cavity-to-cavity variation" in multi-cavity molds, which significantly degrades overall process capability. Achieving a balanced filling across all cavities is a complex problem influenced by runner and gate design, polymer viscosity, and process conditions [7]. Despite the proposal of theoretical models and systematic approaches, empirical research comparing the process stability of large-scale, high-speed systems against small-scale, precision-oriented systems remains limited. Furthermore, a quantitative correlation between the dimensional Cpk of a component and the functional performance consistency of the final assembled product has not been fully investigated.
This study aims to bridge this gap by conducting a systematic process optimization for a high-precision cosmetic dispenser SealCap. The primary objectives are: (1) to com-pare the process capability of a large 64-cavity high-speed injection molding system with that of a small 12-cavity precision system; (2) to investigate the effect of holding pressure time and cycle time on dimensional stability; and (3) to quantitatively correlate the di-mensional Cpk with the functional performance (discharge volume Cpk) of the assembled pump. By achieving these objectives, this research seeks to identify optimal manufactur-ing strategies for high-precision polymer components.
2. Materials and Methods
2.1. Materials
The SealCaps were manufactured using a blend of low-density polyethylene (LLDPE) and high-density polyethylene (HDPE). This material combination was selected for its excellent processability, flexibility, chemical resistance, and suitability for cosmetic packaging applications, being harmless to the human body and fully recyclable. The key physical properties of the LLDPE and HDPE used in this study are detailed in Table 1.
2.2. Injection Molding Equipment
Two distinct injection molding systems were used for a comparative analysis. The primary system was a small-scale, high-precision injection molding machine (MicroPower 15ton, Wittmann Battenfeld, Austria), the detailed specifications of which are provided in Table 2. This machine was equipped with a custom-designed 12-cavity mold (150 mm × 150 mm × 169 mm) utilizing a side-gate system. Figure 2 shows a schematic of the injection mold and the final molded SealCap part. For baseline comparison, a conventional large-scale, 64-cavity high-speed injection molding machine was used, representing a standard mass-production process.
2.3. Experimental Conditions
To investigate the effect of processing parameters on the dimensional stability of the SealCap, four distinct experimental conditions were established, as summarized in Table 3. Conditions #A, #B, and #C were performed on the small-scale precision machine, where the holding pressure time was systematically varied from 3.0 s to 3.5 s, resulting in cycle times of 7.2 s, 7.4 s, and 7.7 s, respectively. Other parameters, including a holding pressure of 385 bar, a coolant temperature of 15 °C, and a cylinder nozzle temperature of 170 °C, were kept constant. Condition #D was performed on the large-scale high-speed machine, with a cycle time of 13.0 s, a coolant temperature of 19 °C, and a nozzle temperature of 180 °C, serving as the benchmark for a conventional process.
2.4. Measurement and Analysis
The outer diameter of the molded SealCaps was measured using a non-contact image measurement system (IM-6225, Keyence, Japan) with a resolution of 0.001 mm. The target specification for the outer diameter was 7.30–7.35 mm. For conditions #A, #B, and #C, a total of 960 samples (12 cavities × 80 shots) were sampled for each condition. For condition #D, 1,152 samples (64 cavities × 18 shots) were collected.
To assess functional performance, the molded SealCaps were assembled into complete cosmetic dispenser pumps. The discharge volume per actuation was measured by dispensing water onto a precision electronic balance (FX-200i, AND, Japan) with a resolution of 0.001 g. The quality specification for the discharge mass was 0.15 ± 0.02 g. A total of 1,008 assembled pumps were tested for each of the four conditions.
The stability and capability of the injection molding process under each condition were quantitatively evaluated using Minitab® statistical software. The process capability indices, Cp and Cpk, were calculated for both the dimensional (outer diameter) and functional (discharge volume) data. Cp represents the potential process capability assuming the process is centered, while Cpk accounts for any shift in the process mean relative to the specification limits, thus reflecting the actual process performance.
3. Results and Discussion
3.1. Effect of Molding Conditions on Dimensional Stability
The dimensional stability of the molded SealCaps, a critical factor for their functional performance, was quantitatively evaluated using the process capability indices Cp and Cpk. Table 4 summarizes the statistical outcomes for the outer diameter measurements under the four experimental conditions, with the process capability results graphically represented in Figure 3.
A clear trend emerged from the analysis. Condition #C, which utilized the small precision machine with the longest cycle time (7.7 s), exhibited the highest process capability. It achieved a Cp value of 2.00 and, more importantly, a Cpk value of 1.91. This Cpk value significantly exceeds the industry standard of 1.67 for high-precision manufacturing (often associated with Six Sigma quality levels), indicating a highly capable and centered process. In contrast, condition #D, representing the large-scale high-speed manufacturing process, yielded the lowest capability with a Cpk of just 0.53, which is well below the generally accepted minimum of 1.33 for a capable process. Conditions #A (Cpk = 1.15) and #B (Cpk = 1.24) on the precision machine showed acceptable but lower capabilities compared to condition #C.
The discussion of these results highlights two key engineering insights. Firstly, within the precision molding setup (conditions #A, #B, #C), a longer cycle time, directly resulting from an increased holding pressure time, led to a substantial improvement in process capability. This is attributed to a more effective packing stage, where the extended holding pressure compensates for volumetric shrinkage more completely, and a more stable cooling phase, which reduces thermal variations. Secondly, the stark difference between condition #C (Cpk=1.91) and #D (Cpk=0.53) underscores the inherent challenge of maintaining dimensional consistency across a large number of cavities (64 vs. 12). The increased variability in the large-scale system likely stems from non-uniformities in melt flow, pressure distribution, and thermal gradients across the expansive mold, which ultimately compromises the dimensional precision of individual parts.
3.2. Analysis of Inter-Cavity Variation
To further investigate process stability, the variation in dimensional quality among the different cavities of the 12-cavity mold was analyzed. Figure 4 provides a schematic layout of the mold, indicating the numbering and spatial position of each cavity, which serves as a reference for the subsequent analysis. Figure 5 illustrates the Cpk values for each of the 12 cavities as a function of cycle time. The results reveal a significant trend: as the cycle time increased from 7.2 s (Condition #A) to 7.7 s (Condition #C), the variability of Cpk values across the cavities markedly decreased. In Condition #A, there was a considerable spread in process capability between cavities, indicating inconsistent part quality. This variation was progressively reduced in Condition #B and became most uniform in Condition #C, where all cavities demonstrated a consistently high Cpk.
This finding suggests that a longer cycle time is crucial for achieving thermal and rheological homogeneity within a multi-cavity mold. A shorter cycle time may result in incomplete or non-uniform packing and cooling, particularly in cavities located further from the sprue, leading to greater dimensional discrepancies. By extending the cycle time, the pressure and temperature distributions across all cavities are allowed to equalize more effectively before part ejection. This ensures that each cavity produces a dimensionally consistent SealCap, which is a critical requirement for high-precision, multi-cavity injection molding.
3.3. Correlation between Dimensional Stability and Functional Performance
The ultimate goal of enhancing dimensional stability is to improve the functional performance of the final product. To validate this relationship, the discharge volume of assembled dispenser pumps was measured, and its process capability was analyzed, as summarized in Table 5 and Figure 6.
The functional performance results directly mirrored the dimensional stability trends. Condition #C, which yielded the highest dimensional Cpk, also demonstrated the highest process capability for discharge volume, with a Cpk of 1.31. This value meets the general industry requirement for a capable process (Cpk ≥ 1.33). Conversely, condition #D, with the lowest dimensional stability, also showed the poorest functional consistency (Cpk = 0.98), failing to meet the capability standard.
This strong positive correlation confirms the initial hypothesis of the study: the precise dimensional control of the SealCap is directly linked to the reliable performance of the dispenser pump. The discussion points to the underlying mechanism: a highly consistent outer diameter on the SealCap ensures a uniform and reliable seal within the pump housing during actuation. This consistent sealing action leads to stable pressure generation and, consequently, a highly repeatable discharge volume. This result empirically establishes that optimizing for dimensional process capability is an effective and predictive strategy for achieving high functional quality in assembled mechanical products like cosmetic dispensers.
4. Conclusions
This study systematically optimized the injection molding process for a high-precision polymer SealCap, successfully demonstrating a clear pathway to achieving superior dimensional and functional quality. The key conclusions are as follows:
A significant performance gap was confirmed between manufacturing systems. The optimized process on the small-scale, 12-cavity precision machine (Condition #C) achieved a dimensional Cpk of 1.91, which was vastly superior to the 0.53 Cpk from the large-scale, 64-cavity high-speed process. This highlights the critical impact of machine selection and scale on process stability.
The primary driver for this improvement was the implementation of a longer cycle time (7.7 s). This allowed for more effective compensation of volumetric shrinkage during the packing phase and enhanced thermal homogeneity during cooling, which in turn minimized process variability and significantly reduced inter-cavity variation.
Crucially, this enhanced dimensional stability was empirically shown to directly correlate with functional performance. The optimal process (Condition #C) yielded the highest functional Cpk for discharge volume (1.31), confirming that precise dimensional control is an effective and predictive strategy for ensuring high functional reliability in assembled products.
In conclusion, this research provides a key manufacturing insight: for high-precision functional polymer components, a strategy prioritizing process stability and homogeneity—achieved through optimized cycle times on a well-controlled, precision machine—is more effective for achieving Six Sigma quality levels than a conventional approach focused solely on maximizing production throughput. The identified optimal process offers a robust and practical solution for reducing defect rates and improving product value in demanding industrial applications.
Supplementary Materials
The following supporting information can be downloaded at the website of this paper posted on Preprints.org, Table S1: Raw measurement data for the outer diameter of all SealCap samples under conditions #A, #B, #C, and #D; Table S2: Raw measurement data for the discharge volume of all assembled pump samples under conditions #A, #B, #C, and #D.
Author Contributions
Conceptualization, J.P.C. and H.L.; methodology, H.L.; software, J.P.C.; validation, J.P.C. and H.L.; formal analysis, J.P.C.; investigation, H.L.; resources, J.P.C.; data curation, H.L.; writing—original draft preparation, H.L.; writing—review and editing, J.P.C.; visualization, H.L.; supervision, J.P.C.; project administration, J.P.C.; funding acquisition, J.P.C. All authors have read and agreed to the published version of the manuscript.
Funding
This work was supported by the Institute of Information & Communications Technology Planning & Evaluation (IITP) grant funded by the Korean government (MSIT) (No. IITP-2025-RS-2023-00259678, Innovative Human Resource Development for Local Intellectualization). The Article Processing Charge (APC) was funded by Inha University.
Data Availability Statement
The data presented in this study are available in the article and the associated Supplementary Material.
Acknowledgments
The authors are grateful to all faculty members of the Graduate School of Manufacturing Innovation at Inha University for their invaluable teaching and advice. Special thanks are extended to the laboratory colleagues for their technical support throughout the experimental process. The first author (H.L.) would also like to express his sincere gratitude to the corresponding author (J.P.C.) for his unwavering support and mentorship.
Conflicts of Interest
The authors declare no conflict of interest. The funders had no role in the design of the study; in the collection, analyses, or interpretation of data; in the writing of the manuscript; or in the decision to publish the results.
Abbreviations
The following abbreviations are used in this manuscript:
| ASTM | American Society for Testing and Materials |
| Cp | Process Capability Index |
| Cpk | Process Capability Index (Adjusted for Process Centering) |
| DOE | Design of Experiments |
| HDPE | High-Density Polyethylene |
| LLDPE | Low-Density Polyethylene |
| MI | Melt Index |
| SPC | Statistical Process Control |
References
- LIAO, Qianghua, et al. Efficient and Precise Micro-Injection Molding of Micro-Structured Polymer Parts Using Micro-Machined Mold Core by WEDM. Polymers, 2019, 11. [CrossRef]
- WANG, Jian, et al. Effects of Injection Molding Parameters on Properties of Insert-Injection Molded Polypropylene Single-Polymer Composites. Polymers, 2021, 14. [CrossRef]
- WILCZYŃSKI, K.; WILCZYŃSKI, K. ; BUZIAK, Kamila. Modeling and Experimental Studies on Polymer Melting and Flow in Injection Molding. Polymers, 2022, 14. [CrossRef]
- SYNYUK, O. , et al. Development of Equipment for Injection Molding of Polymer Products Filled with Recycled Polymer Waste. Polymers, 2020, 12. [CrossRef]
- DENG, Lin, et al. Multiscale Modeling and Simulation of Polymer Blends in Injection Molding: A Review. Polymers, 2021, 13. [CrossRef]
- YIN, Jin, et al. High-Throughput in Situ Characterization of Polymer Crystallization under an Intense Flow, High Pressure, and Cooling Gradient during Injection Molding. Macromolecules, 2023. [CrossRef]
- CHIEN, Minyuan, et al. Impact of Runner Size, Gate Size, Polymer Viscosity, and Molding Process on Filling Imbalance in Geometrically Balanced Multi-Cavity Injection Molding. Polymers, 2024, 16. [CrossRef]
Figure 1.
Schematic of the cosmetic dispenser pump assembly. This exploded, cross-sectional view illustrates the main components and their assembly order. The figure highlights the location and functional importance of the SealCap (the component of interest in this study), which is critical for creating the internal seal required for consistent product discharge.

Figure 2.
Schematic of the multi-cavity injection mold and the final molded part. (2a) Top-view schematic of the 12-cavity mold used with the high-precision injection molding machine, illustrating the radial arrangement of the cavities. (2b) Photograph of a single, as-molded polymer SealCap, which is the high-precision component investigated in this study.
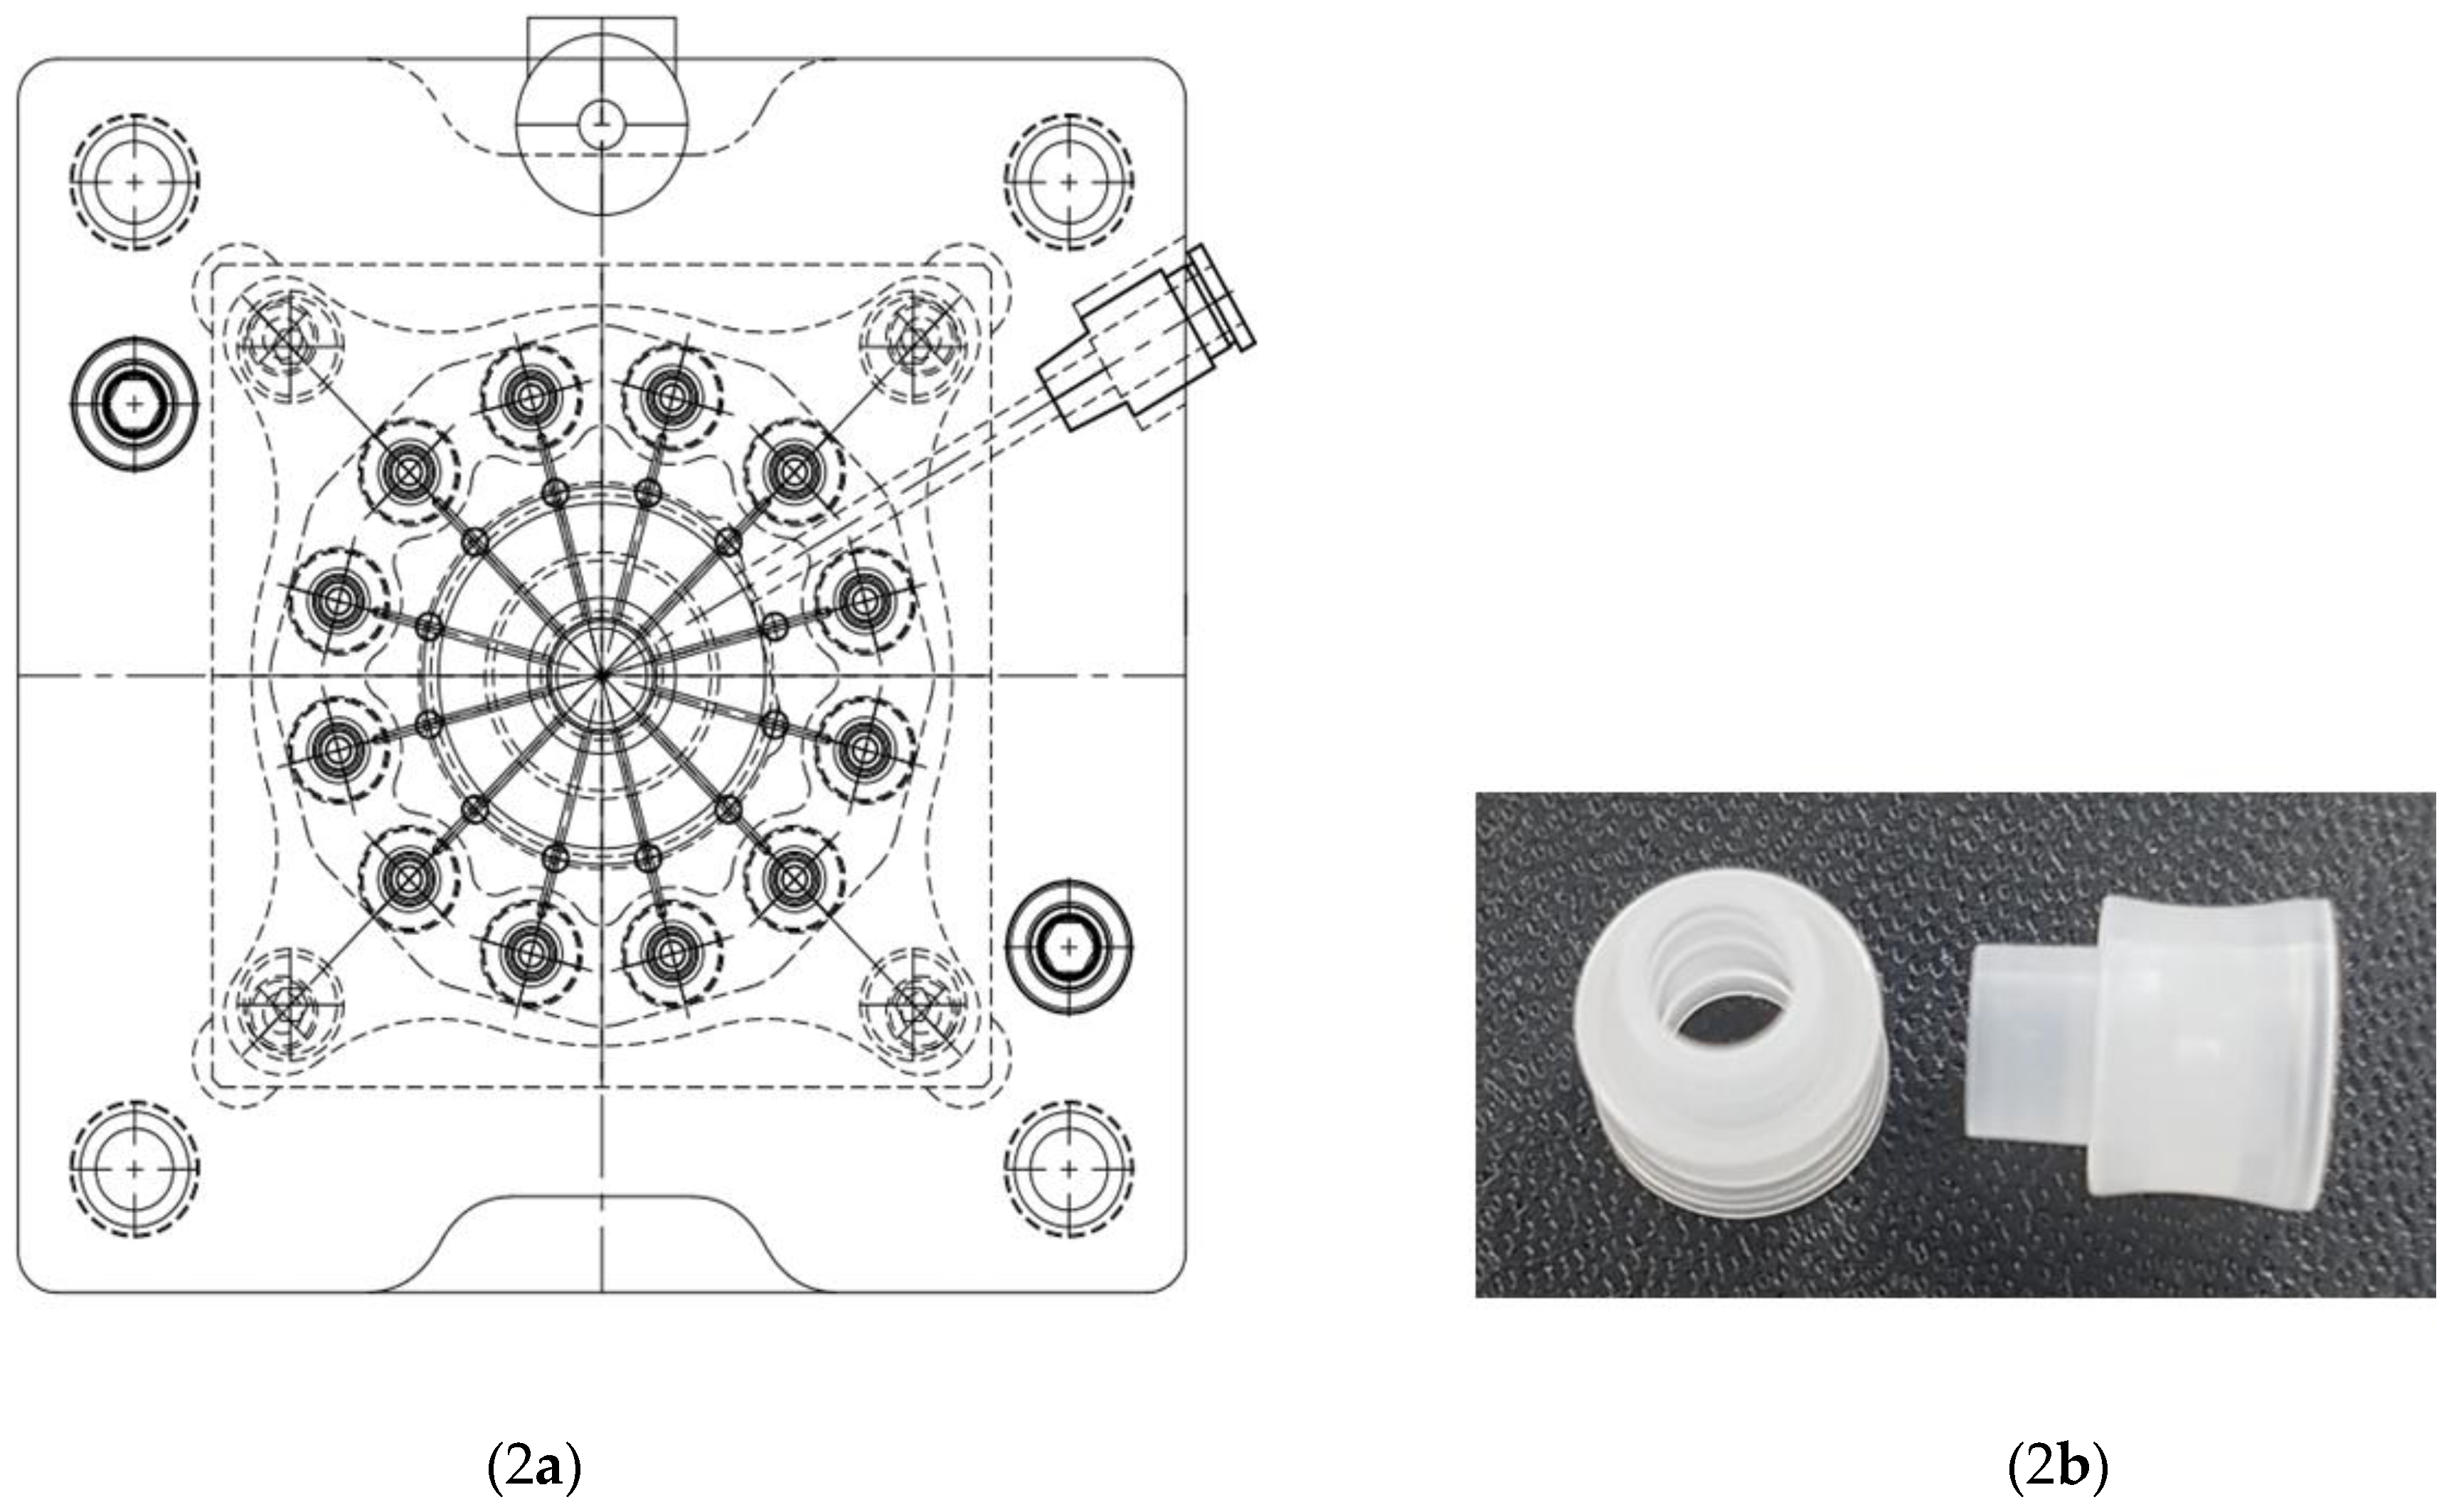
Figure 3.
Process capability analysis for the outer diameter of the SealCaps under four different molding conditions (#A, #B, #C, and #D). (3a) Comparison of the potential process capability index (Cp). (3b) Comparison of the actual process capability index (Cpk), which accounts for the process mean shift. Condition #C (small precision machine, 7.7 s cycle time) demonstrates significantly superior capability in both indices compared to the other conditions, especially the conventional high-speed process (Condition #D).
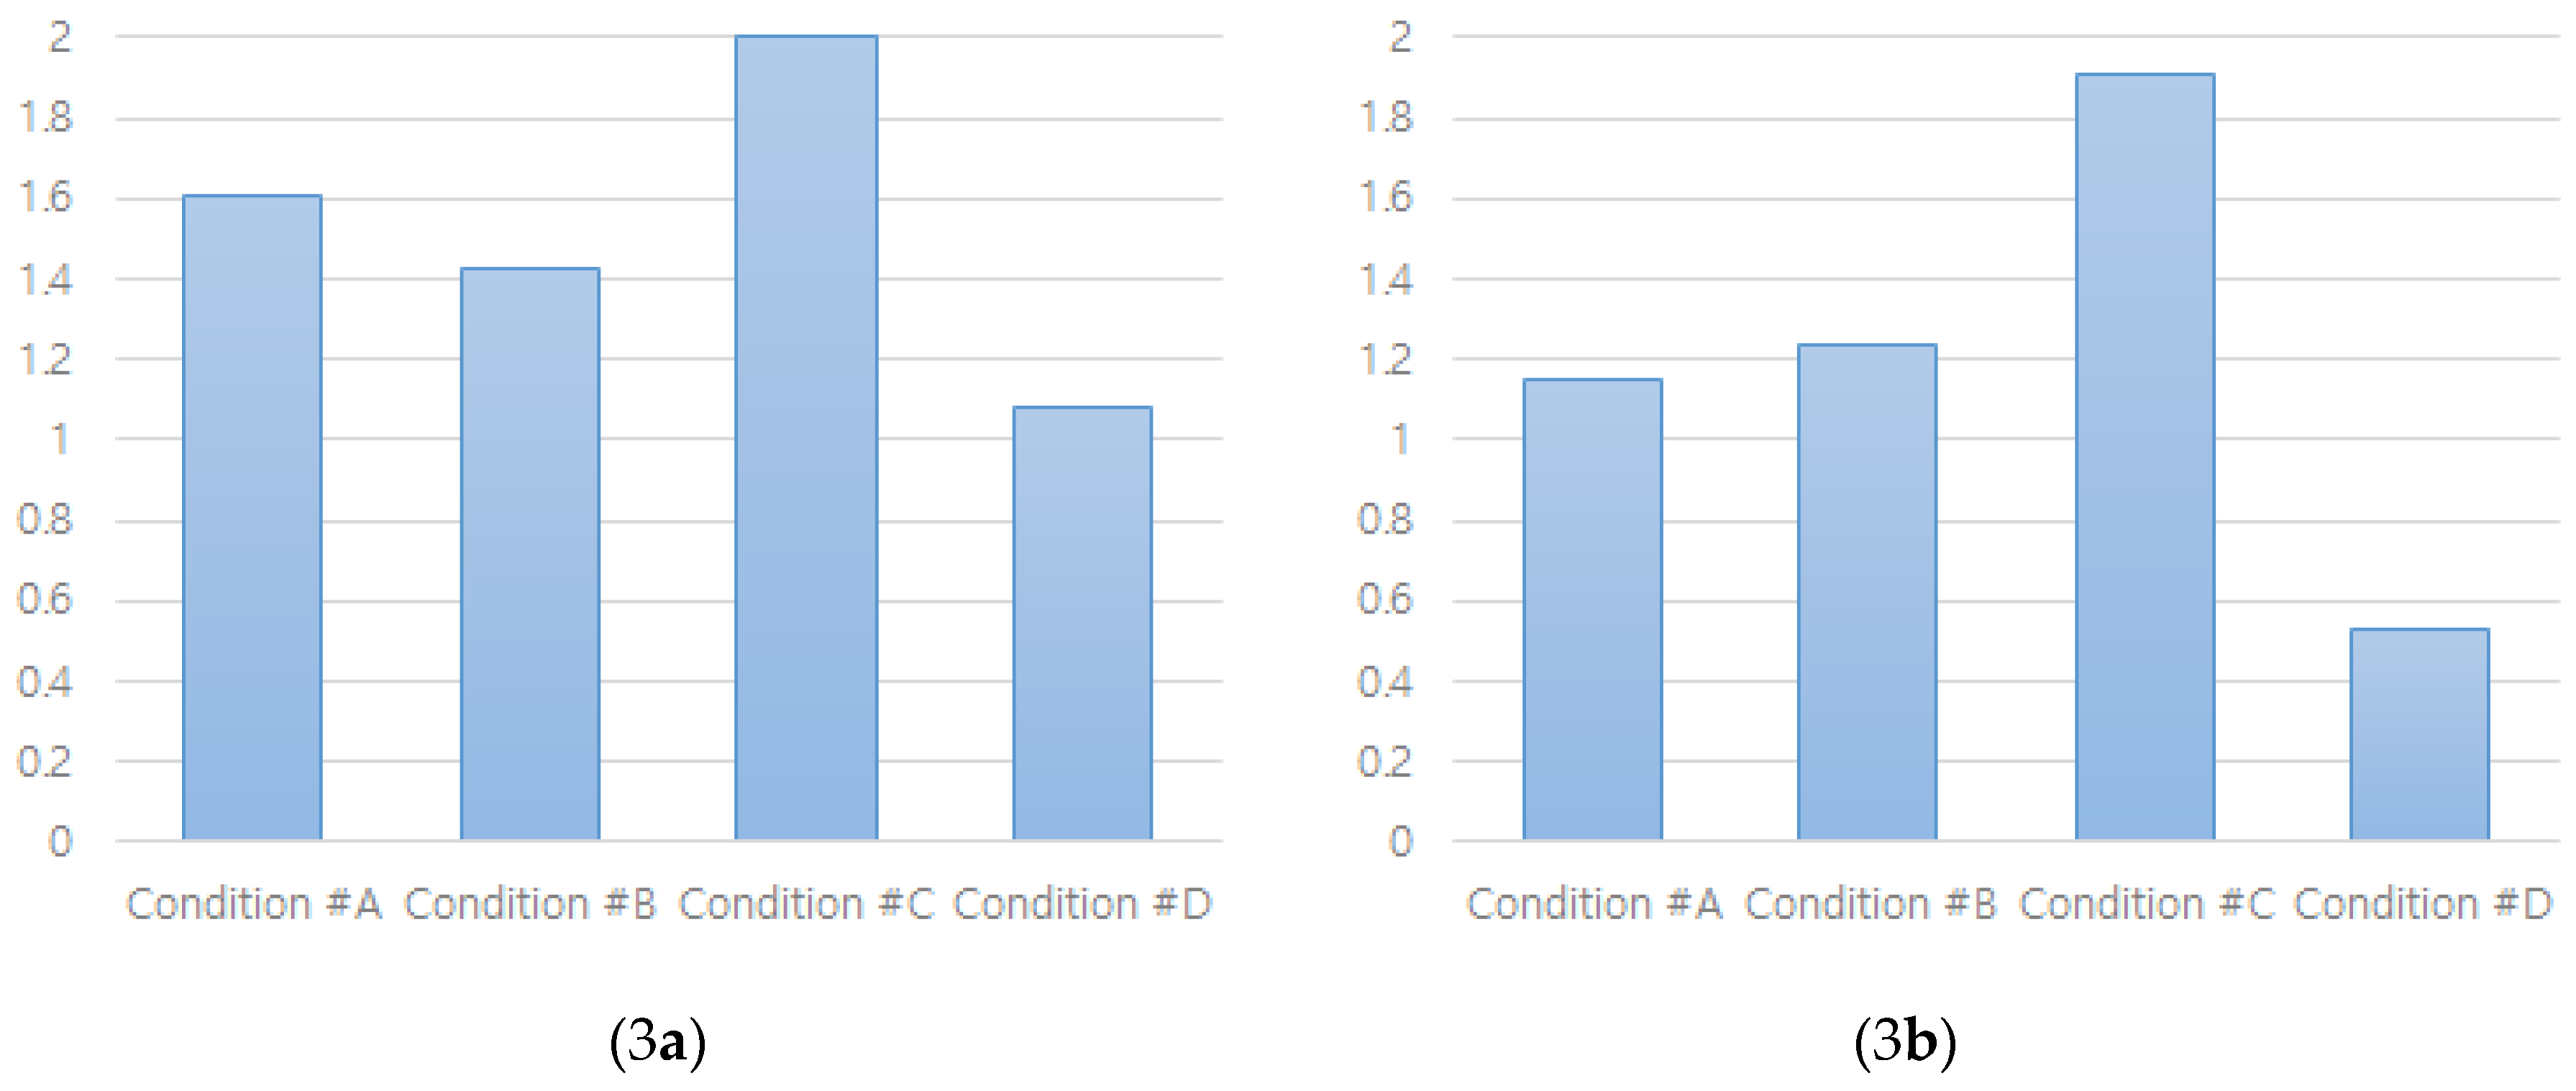
Figure 4.
Schematic layout of the 12-cavity mold used in the precision injection molding process. The numbers indicate the specific designation and radial arrangement of each cavity. This map provides a spatial reference for the inter-cavity variation analysis presented in Figure 5.
Figure 4.
Schematic layout of the 12-cavity mold used in the precision injection molding process. The numbers indicate the specific designation and radial arrangement of each cavity. This map provides a spatial reference for the inter-cavity variation analysis presented in Figure 5.
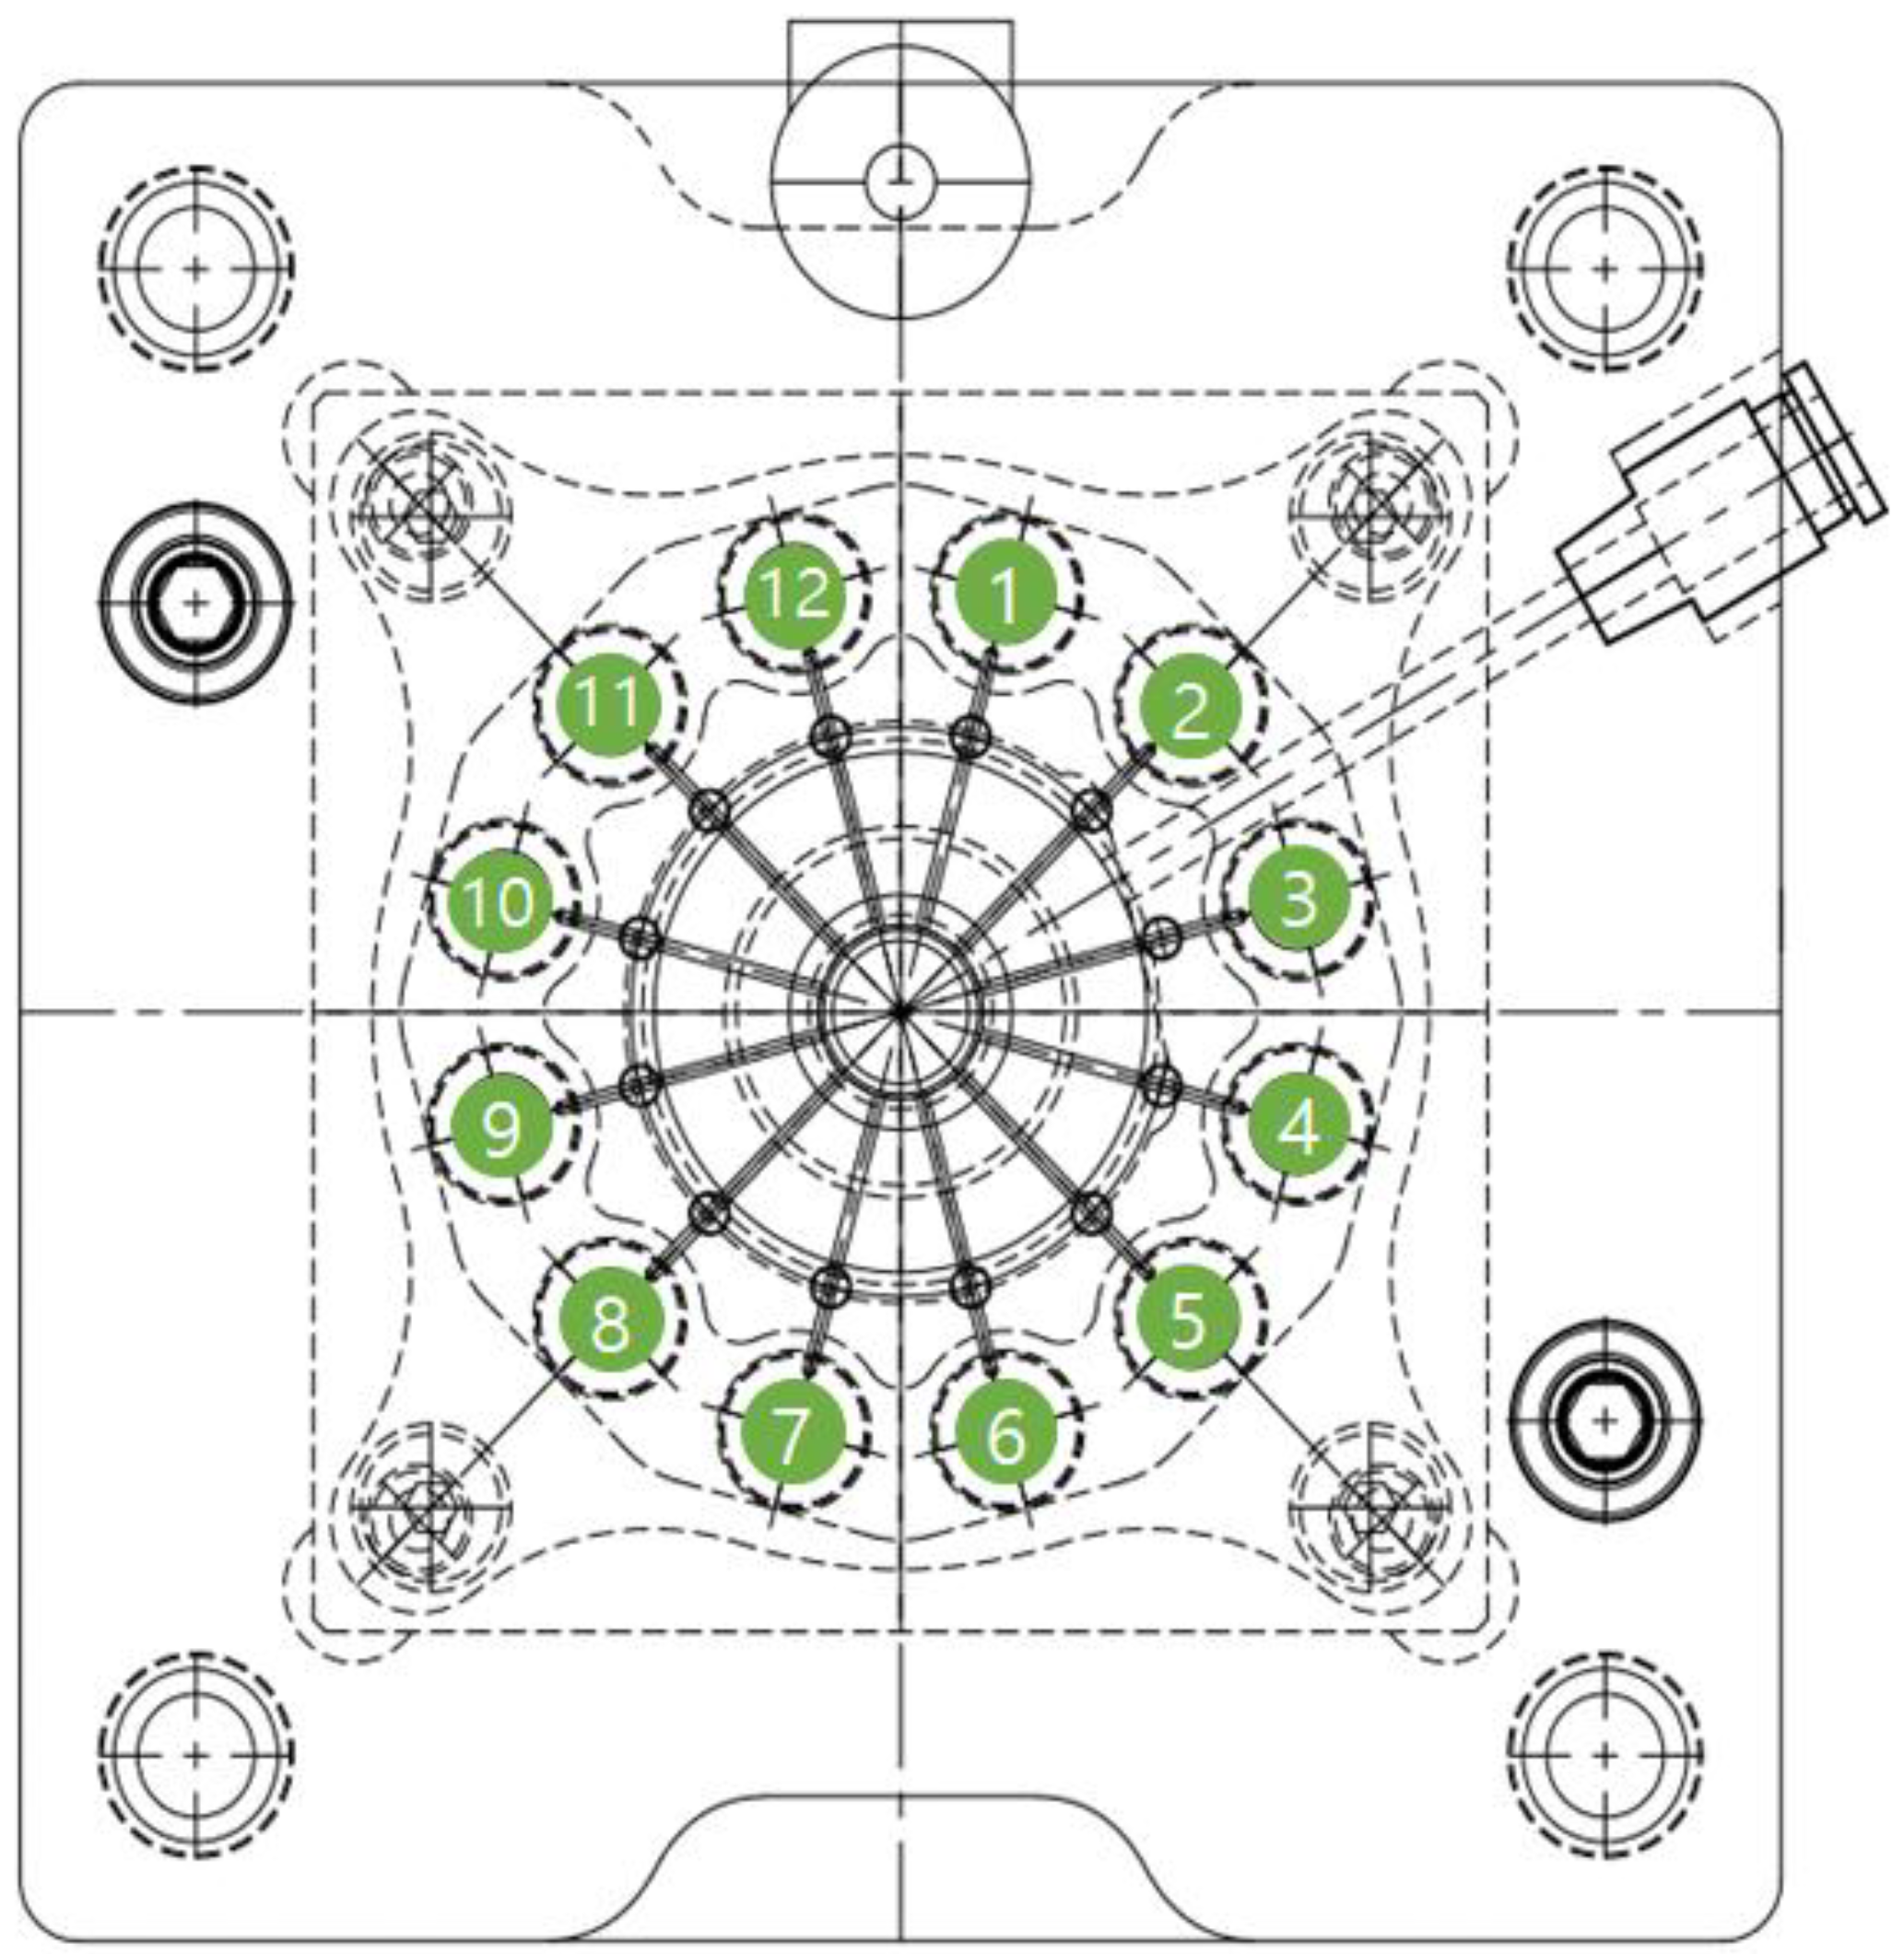
Figure 5.
Analysis of inter-cavity variation in dimensional stability for the 12-cavity precision injection molding process. The plots show the process capability indices (Cp and Cpk) for each individual cavity under three different cycle times: (5a) 7.2 s (Condition #A), (5b) 7.4 s (Condition #B), and (5c) 7.7 s (Condition #C). A clear trend of reduced variability in Cpk values across the cavities is observed as the cycle time increases, indicating enhanced process homogeneity and part-to-part consistency.
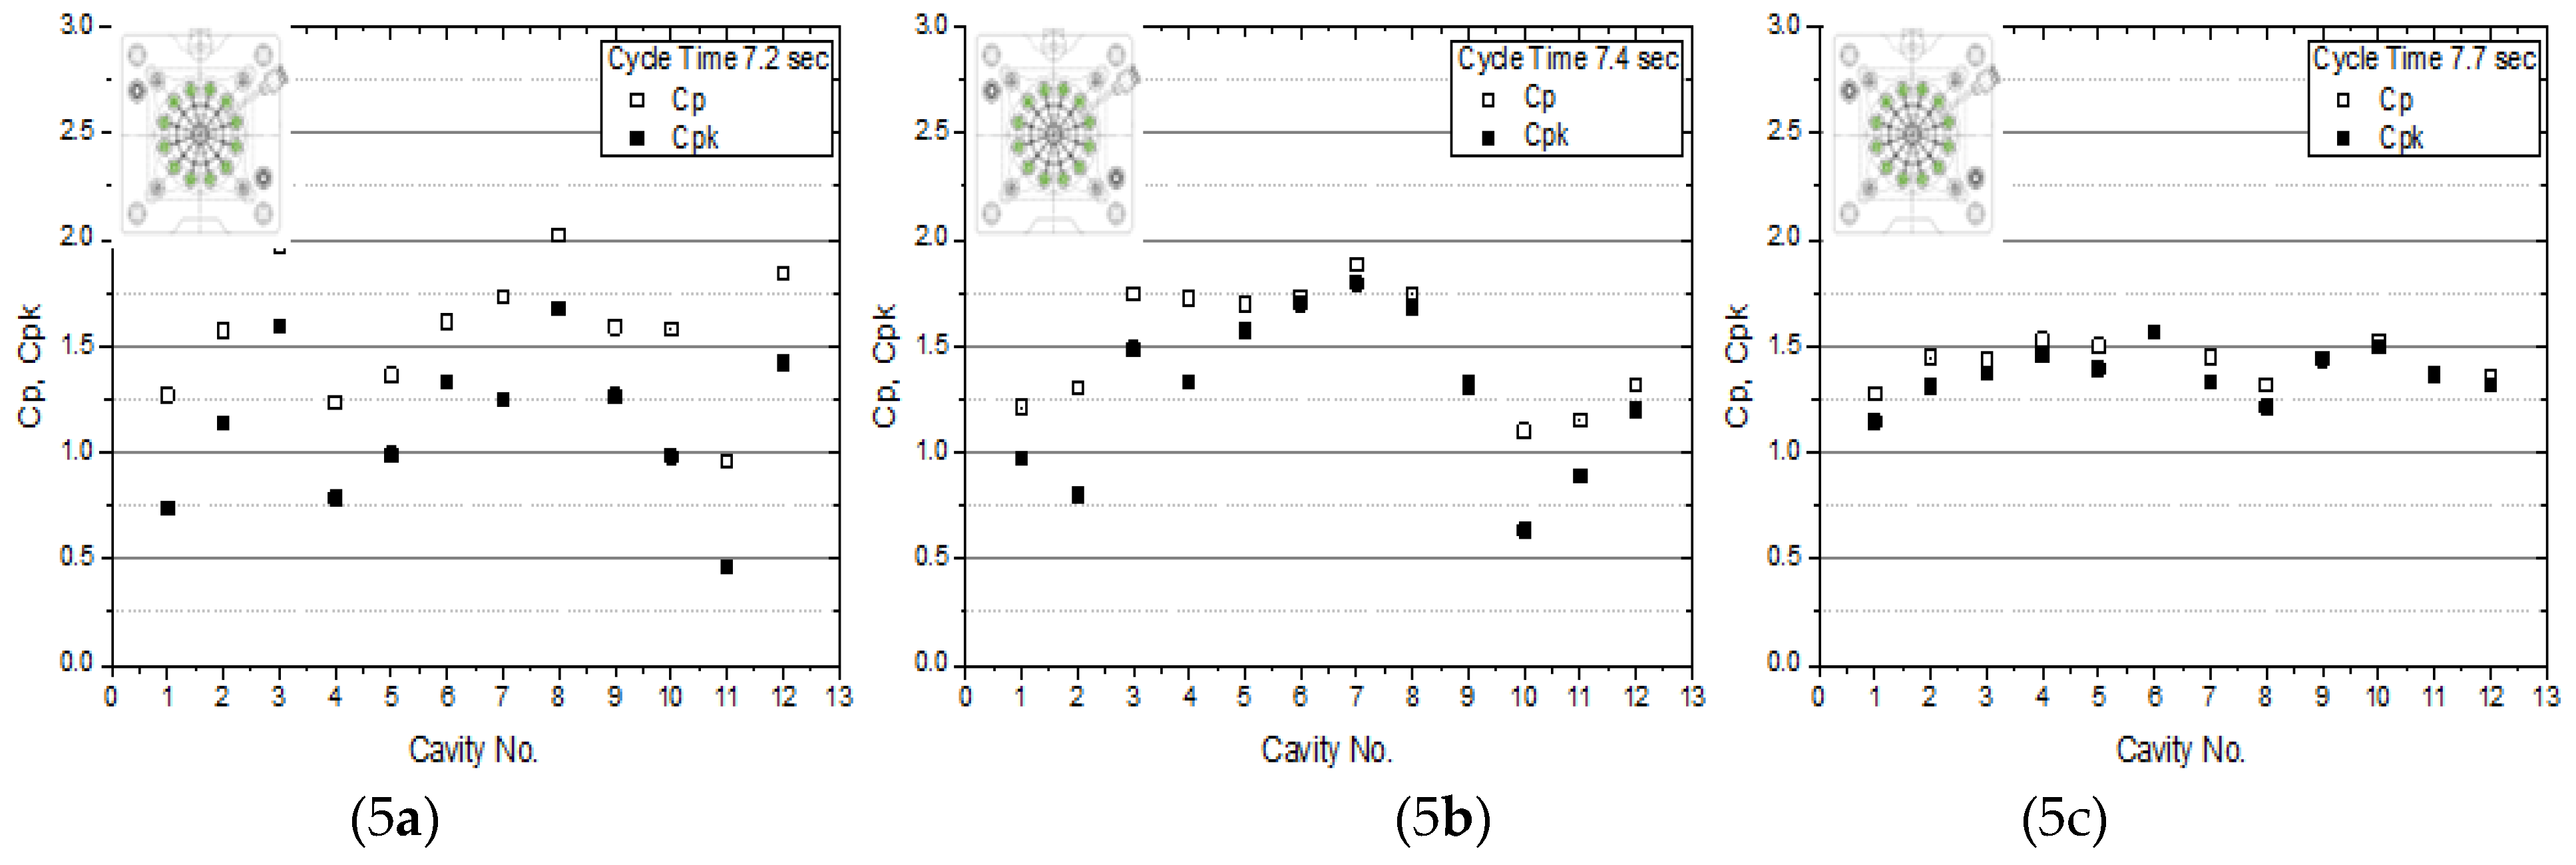
Figure 6.
Process capability analysis for the functional performance (discharge volume) of assembled pumps fabricated under the four molding conditions. (6a) Comparison of the potential process capability index (Cp). (6b) Comparison of the actual process capability index (Cpk). The results show a strong correlation with the dimensional stability trends observed in Figure 3, with Condition #C achieving the highest Cpk value of 1.31, indicating the most consistent functional performance.
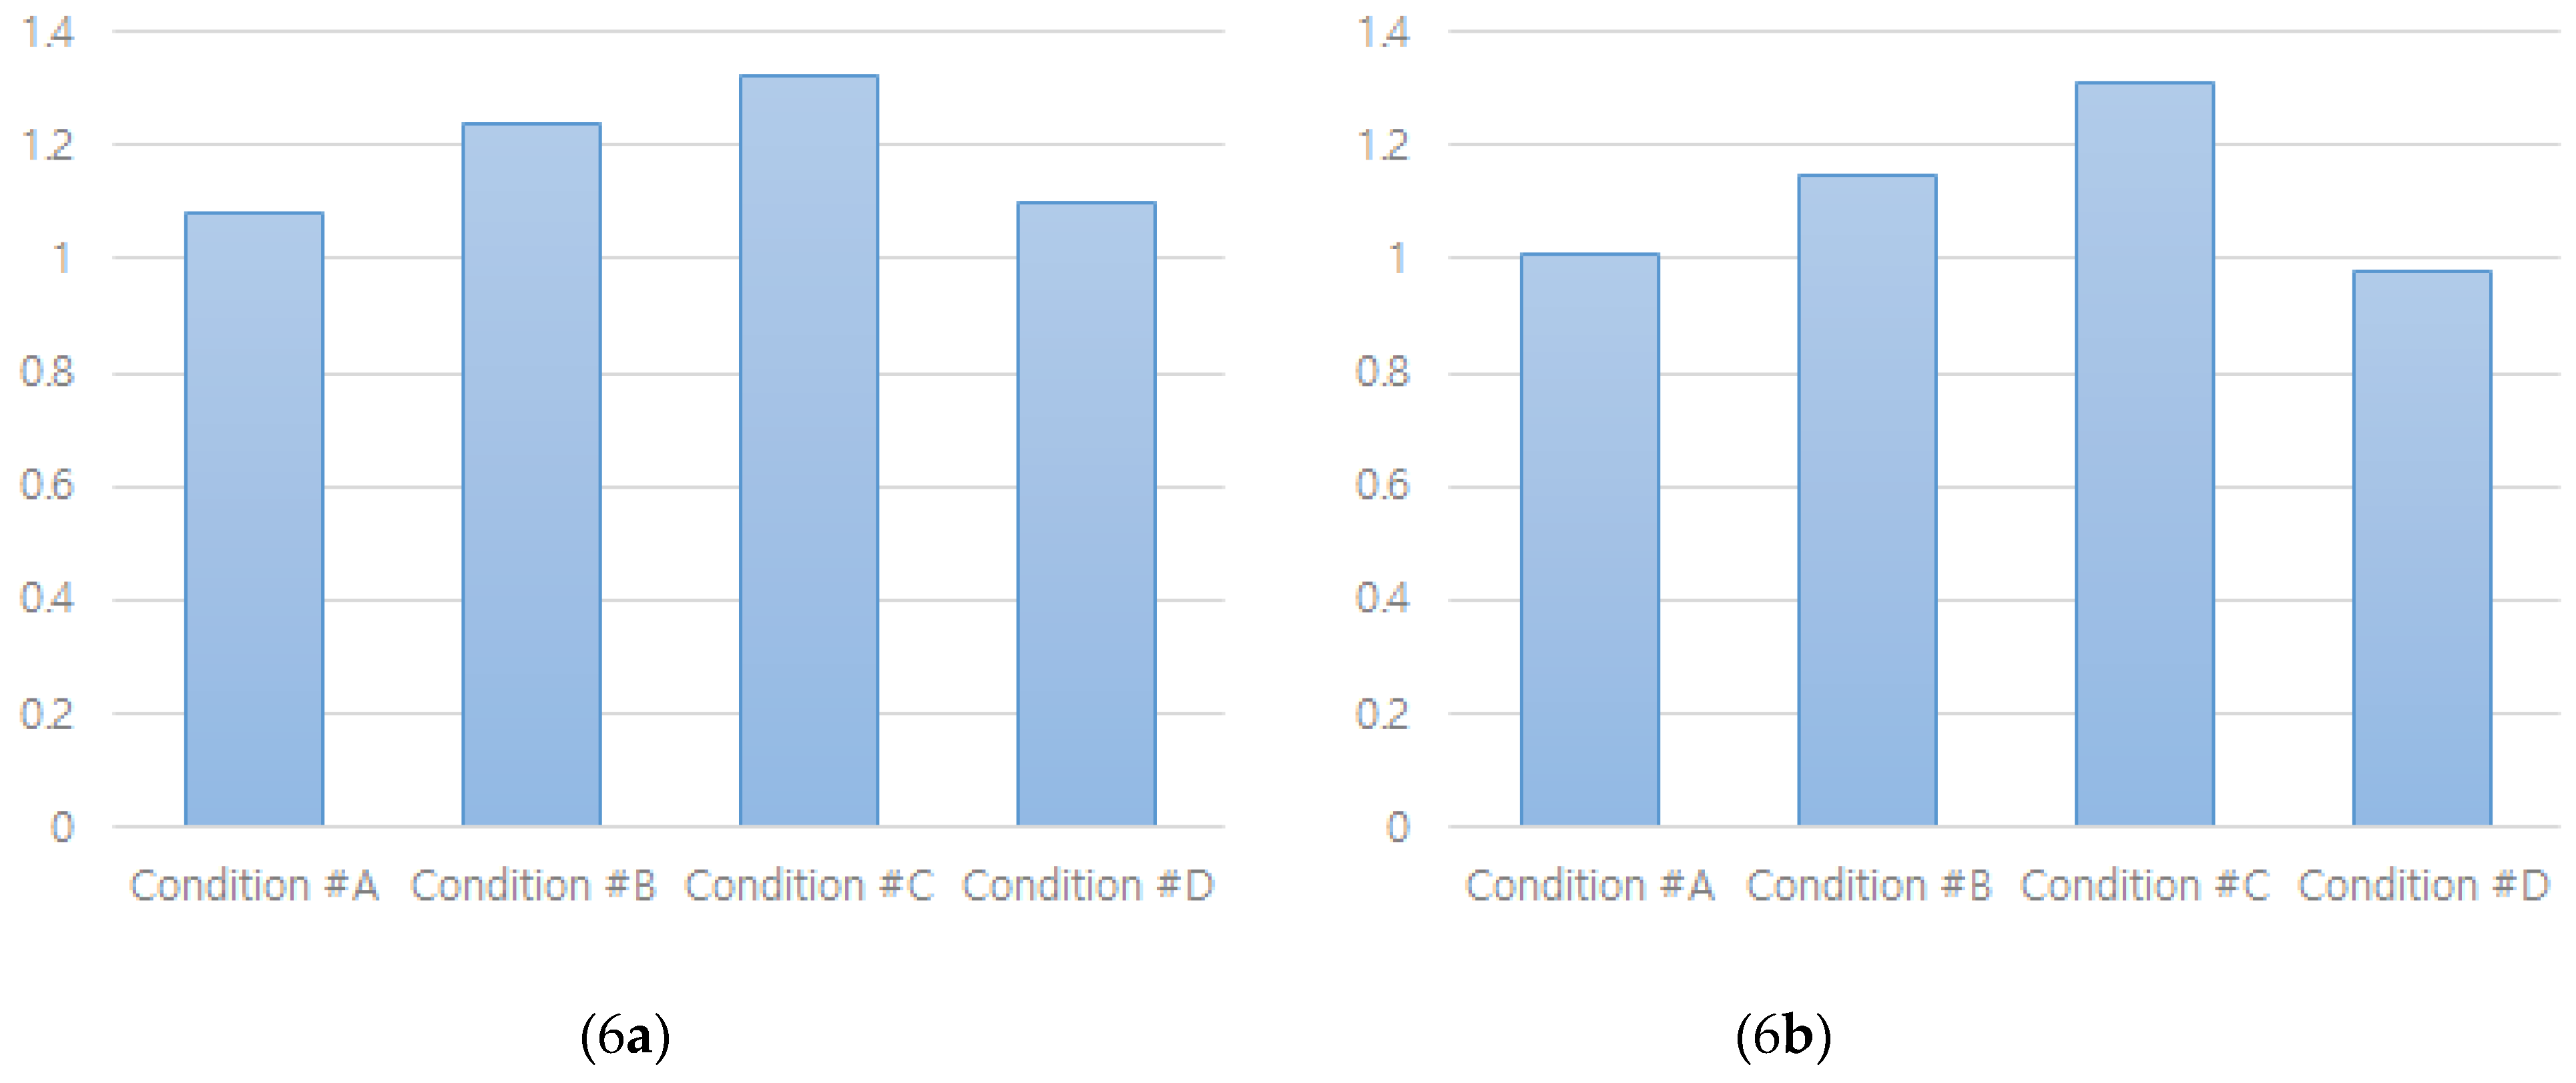

Table 1.
Physical properties of the LLDPE and HDPE used in this study.
| Property | Melt Index (MI) ¹ | Tensile Strength at Yield | Density | Elongation at Break |
|---|---|---|---|---|
| Test Method | ASTM D1238 | ASTM D638 | ASTM D1505 | ASTM D638 |
| Unit | g/10 min | kgf/cm² | g/cm³ | % |
| LLDPE | 20 | 150 | 0.924 | 600 |
| HDPE | 5 | 260 | 0.965 | 500 |
1 The test conditions for Melt Index were a load of 2.16 kg at a temperature of 190 °C.
Table 2.
Specifications of the high-precision injection molding machine (MicroPower 15ton).
| Parameter | Unit | Specification |
|---|---|---|
| Clamping force | kN | 150 |
| Opening stroke / Opening force | mm/kN | 100 / 15 |
| Ejector stroke / Ejector force | mm/kN | 40 / 5 |
| Dosing screw diameter | mm | 14 |
| Screw L/D ratio | - | 20 |
| Specific injection pressure | Mpa | 250 |
| Injection plunger diameter | mm | 8 |
| Max. screw speed | rpm ¹ | 200 |
| Nozzle stroke / Contact force | mm/kN | 230 / 40 |
| Injection speed | mm/s | 750 |
| Barrel heating power (nozzle incl.) | kW | 2.45 |
| Number of heating zones | - | 4 |
| Dimensions (Length × Width × Height) | m | 2.6 × 1.3 × 2.2(2.52) |
| Net weight | kg | 2400 |
| Mold height (min. / max.) | mm | 100 / 300 |
1 revolutions per minute.
Table 3.
Summary of processing parameters for the four experimental conditions (#A, #B, #C, and #D).
Table 3.
Summary of processing parameters for the four experimental conditions (#A, #B, #C, and #D).
| Parameter | Unit | Condition #A | Condition #B | Condition #C | Condition #D |
|---|---|---|---|---|---|
| Machine Type | - | Small Precision | Small Precision | Small Precision | Large High-Speed |
| Holding Pressure Time | sec | 3.0 | 3.2 | 3.5 | - |
| Holding Pressure | Bar | 385 | 385 | 385 | - |
| Cycle Time | sec | 7.2 | 7.4 | 7.7 | 13.0 |
| Coolant Temperature | °C | 15 | 15 | 15 | 19 |
| Cylinder Nozzle Temp. | °C | 170 | 170 | 170 | 180 |
1 Not Applicable: These parameters were part of the standard benchmark process on the large-scale machine and were not varied as independent variables in this study's design.
Table 4.
Statistical summary and process capability indices (Cp and Cpk) for the outer diameter of the SealCaps under the four experimental conditions.
Table 4.
Statistical summary and process capability indices (Cp and Cpk) for the outer diameter of the SealCaps under the four experimental conditions.
| Parameter | Unit | Condition #A | Condition #B | Condition #C | Condition #D |
|---|---|---|---|---|---|
| Machine Type | - | Small Precision | Small Precision | Small Precision | Large High-Speed |
| Sample Mean | mm | 7.33222 | 7.32831 | 7.32612 | 7.31236 |
| Sample Size | ea | 960 | 960 | 960 | 1,152 |
| Standard Deviation | - | 0.00517131 | 0.00583075 | 0.00416017 | 0.00773477 |
| Process Capability | Cp | 1.61 | 1.43 | 2.00 | 1.08 |
| Process Capability | Cpk | 1.15 | 1.24 | 1.91 | 0.53 |
Table 5.
Statistical summary and process capability indices (Cp and Cpk) for the discharge volume of assembled pumps under the four experimental conditions.
Table 5.
Statistical summary and process capability indices (Cp and Cpk) for the discharge volume of assembled pumps under the four experimental conditions.
| Parameter | Unit | Condition #A | Condition #B | Condition #C | Condition #D |
|---|---|---|---|---|---|
| Machine Type | - | Small Precision | Small Precision | Small Precision | Large High-Speed |
| Sample Mean | g | 0.151353 | 0.151567 | 0.149978 | 0.152234 |
| Sample Size | ea | 1,008 | 1,008 | 1,008 | 1,008 |
| Standard Deviation | - | 0.0061661 | 0.00535689 | 0.00506526 | 0.00603378 |
| Process Capability | Cp | 1.08 | 1.24 | 1.32 | 1.10 |
| Process Capability | Cpk | 1.01 | 1.15 | 1.31 | 0.98 |
Disclaimer/Publisher’s Note: The statements, opinions and data contained in all publications are solely those of the individual author(s) and contributor(s) and not of MDPI and/or the editor(s). MDPI and/or the editor(s) disclaim responsibility for any injury to people or property resulting from any ideas, methods, instructions or products referred to in the content. |
© 2025 by the authors. Licensee MDPI, Basel, Switzerland. This article is an open access article distributed under the terms and conditions of the Creative Commons Attribution (CC BY) license (http://creativecommons.org/licenses/by/4.0/).
Copyright: This open access article is published under a Creative Commons CC BY 4.0 license, which permit the free download, distribution, and reuse, provided that the author and preprint are cited in any reuse.


