Submitted:
19 November 2025
Posted:
19 November 2025
You are already at the latest version
Abstract
Integrating nanostructured carbon materials with flexible substrates to form binder-free electrode architectures is a promising strategy for enhancing the capacitive performance and rate capability of supercapacitors, yet it remains a significant challenge. In this study, we report a facile method for the direct synthesis of carbon nanofibers (CNFs) on knitted carbon fabric (CF) via chemical vapor deposition (CVD), enabling their use as electrodes in all-solid-state flexible supercapacitors. The resulting CNFs exhibit two typical average diameters—approximately 25 nm and 50 nm—depending on the growth temperature, with both displaying highly graphitized structures. The electrochemical performance of CNFs/CF electrodes was evaluated in 1 M H2SO4 aqueous electrolyte using cyclic voltammetry (CV), galvanostatic charge/discharge (GCD), and electrochemical impedance spectroscopy (EIS), confirming electric double-layer capacitor (EDLC) behavior. Notably, the 25 nm-CNFs/CF electrode achieves a high specific capacitance of 87.5 F/g, significantly outperforming the 50 nm-CNFs/CF electrode, which reaches 50.2 F/g. Compared to previously reported carbon nanotube (CNT)/CF electrodes, the 25 nm-CNFs/CF electrode exhibits superior capacitance and lower resistance. These results underscore its strong potential for application in flexible and wearable electronic devices. Furthermore, the structure-performance relationship revealed in this study provides valuable insights for the rational design of next-generation carbon-based energy storage systems.
Keywords:
electrochemical performance
; flexible electronics
; carbon nanofiber
; CNTs
; composite
1. Introduction
Climate change and the diminishing availability of fossil fuels are driving an urgent global transition toward sustainable and renewable energy sources. To enable the efficient use of these clean energy technologies, the development of high-performance energy storage devices is critically needed [1]. Supercapacitors, which bridge the gap between conventional capacitors and batteries, have attracted significant attention due to their low cost, lightweight, rapid charge-discharge capability, and long cycle life [2].
Supercapacitors are generally categorized into two types based on their energy storage mechanisms: pseudocapacitors and electric double-layer capacitors (EDLCs). Pseudocapacitors store charge through fast and reversible Faradic redox reactions at the electrode-electrolyte surface, while EDLCs store energy through electrostatic charge accumulation at the interface without any chemical reaction. As a result, EDLCs demonstrate excellent cycle stability and reversibility [3].
Carbon-based materials have been widely used in commercial supercapacitors due to their large specific surface area (SSA), high electrical and thermal stability, chemical inertness, and cost-effectiveness [4]. Commonly used carbon materials include activated carbon [5,6], reduced graphene oxide (rGO) [7,8], carbon nanotubes (CNTs) [1,2,4,9,10], carbon nanofibers (CNFs) [11,12], carbon paper (CP), and carbon fabric (CF) [1,4,13,14,15,16,17]. Among them, CNTs and CNFs stand out for their 1D structure, offering high specific surface area (SSA), excellent electrical conductivity, and superior chemical stability, which make them promising candidates for electrochemical energy storage devices [1,2,4,9,10,11,12].
Recently, flexible carbon substrates such as CP and CF have been explored as lightweight, conductive current collectors to support 1D carbon nanomaterials, including CNTs and CNFs. These composite structures benefit from a three-dimensional (3D) interconnected porous network that enhances ion transport, charge storage, and mechanical flexibility—without the need for polymer binders. Consequently, integrating 1D carbon nanomaterials with CP or CF to form binder-free 3D flexible electrode architectures has become a promising strategy to achieve enhanced capacitive performance and rate capability [1,4,13,14,15,16,17]. However, the direct integration of structure-controlled nanostructured carbon materials with flexible substrates to form stable, binder-free architectures remains a significant challenge.
In this study, we propose a straightforward approach for fabricating integrated 3D composite electrodes by directly growing 1D CNFs on flexible commercial carbon fabric (CF) via a chemical vapor deposition (CVD) method. The morphology and structure of the resulting CNFs/CF composites were characterized by scanning electron microscopy (SEM), transmission electron microscopy (TEM), and Raman spectroscopy. Their electrochemical performance was evaluated in a three-electrode configuration using cyclic voltammetry (CV), galvanostatic charge/discharge (GCD), and electrochemical impedance spectroscopy (EIS). As-prepared EDLCs demonstrate excellent cycle stability and reversibility. Notably, the 25 nm-CNFs/CF electrode delivers a high specific capacitance of 87.5 F/g. Furthermore, we systematically investigate the influence of morphology, microstructure, fiber diameter, interfacial phase, and pore distribution on the electrochemical properties, thereby revealing the structure-performance relationship for carbon-based supercapacitor systems.
2. Experimental Section
2.1. Fabrication of Carbon Nanofibers/Carbon Fabric (CNFs/CF) Composite
The fabrication of CNFs/CF is shown schematically in Figure 1. The first step was to prepare the catalyst slurry. The phenolic resin (PF 2313; 96.5% purity) was dispersed in ethanol to increase the viscosity and wettability of the solution. Then, nano-sized nickel (Ni) particles (average diameters 30 nm, 99.9% purity) and nano-sized SiO2 particles (mean diameters 10 nm, 99.9% purity) were added to the above resin solution. The weight ratio of phenolic resin, Ni particles, and SiO2 particles was 3:3:1. In this process, phenolic resin, Ni particles, and SiO2 particles acted as adhesive, catalyst, and dispersant, respectively. Afterwards, ultrasonication was employed for 10 min to form a homogeneous solution. The second step was dipped and dried to realize the effective impregnation of slurry. The carbon fabric (CF, 1K, T-300, plain weave, Toray Co., Japan) was selected as the substrate. Subsequently, the CF was dipped in catalyst slurry for 30 seconds. Then, it was put on the filter paper and dried at room temperature for 30 min.
The third step was the CVD process. The as-prepared 2D CF was used as a preform to grow CNFs in a horizontal tube furnace (Hefei Kejing Materials Technology Co, OTF-1200X). Before growth, a 15 min heat treatment was prepared under H2 (60 standard cubic centimeters per minute (sccm)) and Ar (120 sccm). The heat treatment temperature was the same as the growth temperature. In this process, the reaction temperatures were heated to 750 and 800 ℃, respectively. The reaction time was fixed at 15 min. At the growth stage, flowing C2H4 gas (60 sccm) was used as the carbon source to produce CNFs at ambient pressure. Then, the furnace was gradually cooled to ambient temperature under Ar (120 sccm). Before electrochemical measurement, the CNFs/CF were treated with 1M HNO3 aqueous solution for 30 min to remove the remaining catalyst particles to accurately measure the intrinsic capacitance of the CNFs/CF.
2.2. Performance Characterization of CNFs/CF
The morphology was investigated by SEM (S-4700, Hitachi, 15 kV) and TEM (G-20, FEI-Tecnai, 200 kV). Raman spectra were carried out using a Renishaw Ramoscope (Confocal Raman Microscope, in Via, Renishaw) equipped with a He-Ne laser (λ=514 nm). A Solartron electrochemical workstation (Solartron Analytical, 1400, UK) was employed to obtain the electrochemical properties of CNFs/CF electrodes in a three-electrode system at room temperature. The three electrodes----working, counter, and reference electrodes are CNFs/CF, Pt foil, and standard saturated calomel electrode, respectively. A 1M H2SO4 aqueous solution was used as the electrolyte. Cyclic voltammetry (CV) was performed over the potential range from 0 to 1V at scan rates ranging from 5 to 200 mVs-1. Galvanostatic charge/discharge was conducted over the potential range from 0 to 1 V at current densities ranging from 0.1A g-1 to 2A g-1. The frequency of electrochemical impedance spectra (EIS) ranges from 10 MHz to 100 kHz. The initial potential of the capacitor is 0 V and the potential is ±5mV around the equilibrium potential. All the specific capacitances and current densities of the composites were calculated based on the mass of CNFs.
3. Results and Discussion
3.1. Morphology and Microstructure of CNFs/CF
Figure 1 exhibits the morphology of CNFs/CF with various diameters at different magnifications. The as-grown CNFs are slightly entangled, forming a well-developed network with tremendous open pores. This porous 3D architecture allows the rapid transport of ions from the electrolyte to the entire surface of the CNFs/CF electrodes and makes it quickly available for electric double-layer formation. When the reaction temperature reached 800 ℃ (Figure 1a–c), the carbon fibers of the fabrics were interconnected by CNFs, and the boundary between fiber and fiber was indistinct. The surface of the carbon fiber was covered by a thick mat of CNFs which were with an average diameter of approximately 25 nm. At this temperature, the catalysts exhibited improved catalytic performance, and the carbon sources had a higher diffusion rate, resulting in CNFs with a bigger length-diameter ratio and a smaller diameter. In this experiment, we included a control group where the reaction temperature was set at 750 ℃. As shown in Figure 1d–f, the carbon fibers were coated with CNFs, and the average diameter of the CNFs was around 50 nm.
Figure 2 shows the TEM and Raman spectra of 25 nm-CNFs/CF. It can be seen from Figure 2a,b that the CNFs were solid cylinders and the catalyst particles were located at the top. Figure 2c exhibits the wall stripes and diffraction spots. It can be seen that the CNFs were not hollow and possessed a high degree of graphitization. The diameter of the CNFs was approximately 25 nm which was consistent with SEM observations. Figure 2d displays the Raman spectrum of CNFs/CF. As can be seen, there were two main bands in the Raman spectrum: the D peak at around 1350 cm-1 and the G peak at around 1580 cm-1. The G-band corresponds to graphite mode (sp2-bonds), while the D-band corresponds to diamond mode (sp3-bonds), which indicates the presence of disorder or defects in the nanofiber structures. The graphitization degree of 25 nm-CNFs/CF can be determined by the ID/IG ratio (defined as R). The lower R-value indicates a higher degree of graphitization in the sample [18,19]. Specifically, the R-value for the 25 nm-CNFs/CF sample was 0.66, while that of the CF sample was 0.88. Therefore, the Raman spectra suggested that in situ formations of CNFs lead to a higher microcrystal order of carbon and an improved graphitization degree.
3.2. Electrochemical Properties of CNFs/CF
To investigate the electrochemical performance of CNFs/CF composites, cyclic voltammetry (CV), galvanostatic charge/discharge (GCD), and electrochemical impedance spectroscopy (EIS) techniques were applied in a three-electrode system. The objective was to clarify the regulatory role of the morphology and microstructure in modulating the electrochemical performance of the composite electrodes, thereby providing experimental insights for the rational design of high-performance supercapacitor electrode materials.
Figure 3 displays the CV curves and specific capacitance of CNFs/CF composites with different diameters under varying scan rates. The potential window in this test ranged from 0 to 1 V, and the scanning rates were set at 5 mV/s, 10 mV/s, 20 mV/s, 50 mV/s, 100 mV/s, and 200 mV/s, respectively. Theoretically, an ideal electric double-layer capacitor (EDLC) exhibits a CV curve with a regular rectangular shape, which arises from the instantaneous formation of an electric double layer at the electrode-electrolyte interface and the rapid stabilization of current upon scan direction reversal. However, deviations from this ideal morphology are commonly observed in practice, due to electrode internal resistance, surface functional groups, and other interfacial effects.
Figure 3a,c demonstrate that the CV curves of CNFs/CF composites with both diameters exhibit symmetric parallelogram profiles, and no distinct redox peaks are detected across the entire potential window. This observation confirms that the energy storage mechanism of the CNFs/CF electrodes is dominated by electric double-layer capacitance. The electrolyte ions can be rapidly and uniformly adsorbed onto the CNFs/CF surface to form a stable electric double layer. Upon instantaneous reversal of the scan direction, the current promptly inverts and stabilizes, demonstrating excellent electrochemical reversibility of the CNFs/CF composites. The scan rate exerts a significant influence on the current intensity and enclosed area of the CV curve, which are directly correlated with the specific capacitance of the electrode material, and experimental results indicate that with increasing scan rate, the current of the CV curves for both CNFs/CF composites increases proportionally, the enclosed area expands synchronously while the curve morphology remains essentially unchanged, which is an indication of the good rate capability of the materials.
The specific capacitance (C, F g-1) can be calculated from the CV curves based on equations (1):
where m is the mass of the CNFs, v is the potential scan rate, (Va-Vc) is the sweep potential window, and I (V) is the voltametric current on CV curves. The calculated results are summarized in Table 1.
As exhibited in Table 1, the specific capacitances of the two CNFs/CF composites exhibit a decreasing trend with the elevation of scan rate. Specifically, at a scan rate of 5 mV/s, the specific capacitances of the 20 nm-diameter and 50 nm-diameter CNFs/CF composites attain 77.0 F/g and 46.8 F/g, respectively; when the scan rate is increased to 200 mV/s, their specific capacitances decrease to 36.3 F/g and 28.3 F/g, respectively. This variation tendency is highly consistent with the energy storage mechanism of EDLCs. At lower scan rates, the electrolyte solution is afforded sufficient time to interact with the electrode surface, which facilitates the complete formation of the electric double layer and thereby results in a higher specific capacitance. In contrast, at higher scan rates, the diffusion rate of electrolyte ions is unable to keep up with the rate of voltage change, leading to the incomplete formation of the electric double layer and a subsequent reduction in specific capacitance. Furthermore, under the same scan rate condition, the CNFs/CF composite with a smaller diameter presents a larger enclosed area in its cyclic voltammetry (CV) curve, which is indicative of more excellent capacitive performance. Experimental results demonstrate that the 25 nm-CNFs/CF composite exhibits superior energy storage performance. Furthermore, the variation relationship between specific capacitance and scan rate further enables the analysis of the capacitance retention characteristics of the electrode materials. The 50 nm-CNFs/CF retained a higher capacitance, approximately 60.47%, at 200 mV/s compared to its capacitance at 5 mV/s, as opposed to 47.14% for 25 nm-CNFs/CF. This high capacitance retention rate of the 50 nm-CNFs/Cf composite can be ascribed to the relatively larger pore size of its constituent CNFs. Specifically, the larger pore structure enables more effective electrolyte penetration even at high scan rates, which in turn ensures the efficient utilization of the electrode's surface area and ultimately contributes to the higher capacitance retention.
Figure 4 shows the galvanostatic charge-discharge (GCD) curves of CNFs/CF with different diameters under various scan rates. GCD measurements were conducted with current densities ranging from 0.1 to 2 A/g, and the voltage was limited to 0 and 1 V. From the perspective of electrochemical theory, the GCD curve of an ideal supercapacitor should exhibit a standard isosceles triangular shape, which is a direct reflection of its charge-discharge efficiency approaching 100%. However, due to multiple factors in practical test systems, a perfect GCD curve is difficult to achieve. An abrupt potential drop commonly occurs at the initial stage of constant current discharge, which is defined as the IR drop. Previous studies have confirmed [20] that the IR drop attributed to the resistance of electrolytes, the contact resistance between carbon and the current collector, and the inner resistance of ion migration in carbon micropores. Among these, the internal resistance of ion migration within carbon micropores accounts for the highest proportion of the total IR drop. It is worth noting that smaller IR drop indicates lower internal resistance of the electrode material.
Figure 4 exhibit the GCD curves of 25 nm-CNFs/CF and 50 nm-CNFs/CF, respectively. It can be seen that the shapes of the curves which indicated superior reversible faradic reactions were close to the theoretical isosceles triangle curve with basically linear slopes, exhibiting good symmetry at every current density. Meanwhile, only a slight IR drop appears at the initial stage of the discharge curves of both composites, which indicates that the CNFs/CF composites have low internal resistance properties, reflecting the formation of a good interfacial bonding between CNFs and the CF substrate, and the device as a whole exhibits excellent electrical conductivity and ion diffusion/transport capabilities. It should be particularly noted that the discharge time of the CNFs/CF composites is slightly longer than the charge time under all test conditions. Taking the test results of 50 nm-CNFs/CF in Figure 4b at a current density of 0.1 A/g as an example, the charge time is 505.6 s, while the discharge time is 502 s. This difference may be related to the kinetic characteristics of the ion adsorption-desorption process on the electrode surface. Further analysis shows that with the increase of current density, the specific capacitances of both 25 nm-CNFs/CF and 50 nm-CNFs/CF gradually decrease. This regularity indicates that the ion accessibility within the CNFs layer is the dominant factor leading to capacitance degradation. At high current densities, electrolyte ions cannot fully diffuse into the microporous structure of the electrode material within a short time, resulting in reduced utilization of the electrode surface and ultimately manifesting as a decrease in specific capacitance. Overall, both CNFs/CF composites exhibit stable capacitance output characteristics and good electrochemical reversibility when used as supercapacitor electrode materials. This conclusion is highly consistent with the analysis results of cyclic voltammetry (CV) tests, verifying the reliability of the characterization results.
The specific capacitance (C, F/g) can be calculated from the charge/discharge curves based on Equation (2):
where m represents the mass of the CNFs, I is the applied current, and dV/dt is the slope of the discharge curve after the IR drop.
Table 2 summarizes the calculated specific capacitance results of CNFs/CF composites with different diameters under various current densities. As can be seen from the data in Table 2, at a low current density of 0.1 A/g, the specific capacitances of 25 nm-CNFs/CF and 50 nm-CNFs/CF reach 87.5 F/g and 50.2 F/g, respectively. When the current density increases to 1 A/g, the specific capacitances of the two materials are 72.8 F/g and 42.8 F/g, with corresponding capacitance retentions of 83.20% and 85.26%, respectively. When the current density further increases to 2 A/g, the specific capacitances of 25 nm-CNFs/CF and 50 nm-CNFs/CF still maintain at 67.6 F/g and 40.0 F/g, demonstrating good rate stability.
The maximum specific capacitances of 25 nm-CNFs/CF and 50 nm-CNFs/CF were determined to be 87.5 F/g and 50.2 F/g, respectively. A prior study [4] systematically investigated the structural and electrochemical properties of VACNT/CF and ECNT/CF composites, where the maximum specific capacitances of 50 nm-VACNT/CF and 50 nm-ECNT/CF were reported as 75 F/g and 42 F/g, respectively. To elucidate the key factors governing the specific capacitance of carbon-based composite electrodes, comparative analyses were conducted between the materials synthesized in this work and those reported in the literature [4].
A comparison of the specific capacitance values of 25 nm-CNFs/CF as presented in this study reveals that the maximum specific capacitance of 25 nm CNFs/CF can reach 87.5 F/g, whereas that of 50 nm- VACNT/CF is only 75 F/g. This result indicates that the outer diameter exerts a significant influence on the specific capacitance. For the VACNT/CF electrode system, the VACNTs can only grow along certain directions [22,23]. Directional growth constraints limit the expansion of the surface area, as evidenced by lesser specific capacitance than irregularly porous 25 nm-CNFs/CF.
To further clarify the role of structural characteristics in determining capacitance performance, a comparative evaluation of the maximum specific capacitances between 50 nm-CNFs/CF and 50 nm-ECNT/CF electrodes was performed, which demonstrates that the unique hollow structure of CNTs does not exert a substantial effect on enhancing specific capacitance. It is widely recognized that the most prominent structural distinction between CNTs and CNFs resides in the presence or absence of a characteristic hollow tubular architecture. Theoretically, the intrinsic tubular structure of CNTs should endow them with a larger specific surface area and thus superior specific capacitance relative to CNFs. However, several factors mitigate this theoretical advantage: firstly, the interlayer spacing of multi-walled CNTs (MWCNTs) is typically smaller than the ionic radius of adsorbing species, which inhibits ion penetration into the interlayer regions and thereby eliminates capacitance contribution from these domains [9]; secondly, the inner channels of CNTs are often underutilized due to size-dependent limitations on ion infiltration, offsetting the potential capacitance gains associated with their hollow structure; additionally, microstructural defects and growth mechanisms of the nanomaterials can modulate the internal resistance of the electrode, a parameter that is closely correlated with the measured specific capacitance. In the present study, the as-synthesized CNFs exhibit a high degree of graphitization (Figure 2c), and the tip-growth mechanism adopted during their fabrication facilitates the formation of robust C-C covalent bonds at the interface between the CNFs and the carbon fiber current collector. Consequently, despite the absence of a distinct hollow structure, the 50 nm-CNFs/CF electrode demonstrates a marginally higher specific capacitance than 50 nm-ECNT/CF electrode.
To further understand the charge transfer and electrochemical kinetics of the electrodes, The EIS measurements were conducted in the frequency from 10 MHz to 100 kHz with a perturbation amplitude of 5 mV versus the open circuit potential. The resulting Nyquist plots and a partially enlarged view focusing on the high-frequency region of the 25 nm-CNFs/CF and 50 nm-CNFs/CF composites are displayed in Figure 5.
The Nyquist plots comprise (i) the high frequencies region. When a high-frequency signal is applied to the ideal supercapacitor, the curve in this zone should be perpendicular to the horizontal coordinate. However, owing to the influence of Faraday reactions occurring on the electrode surface, a typical observation here is a semicircle. Therefore, this region serves to characterize the Faraday impedance of the electrode materials. The size of the semicircle is related to the morphology and conductivity of the material, the diameter of the semicircle corresponds to the charge transfer resistance (Rct) at the electrode/electrolyte interface, the intersection of the X-axis and semi-circular curve can characterize the electrode resistance (Rt) of the material which is mainly related to the electrolyte resistance (Rs), the internal resistance of the active material (Rm) and the contact resistance (Rc) between the collector and the electrolyte. (ii) the medium frequencies region, also known as the Warburg region. It usually appears a straight line with a slope of 45◦ which corresponds to semi-infinite Warburg impedance (Rw). By extending the line in the reverse direction, the intersection of the X-axis can characterize the value of Rw. (iii) the low frequencies region. (iii) the very low frequencies region. In this region, it presents a vertical line which is due to the accumulation of ions at the bottom of the pores of the electrode material. The line's proximity to being parallel to the Y-axis indicates the proximity to an ideal capacitor [21].
Figure 5 illustrates an incomplete semicircle in the high frequencies region for both CNFs/CF composites. It indicated that the CNFs/CF electrodes exhibited low resistance between CNFs and CF. Compared with 25 nm-CNFs/CF, the semicircle-wrapped area of 50 nm-CNFs/CF was larger. Analyzing the Nyquist plots in the high-to-medium frequencies region, the charge transfer resistances (Rt) for 25 nm-CNFs/CF and 50 nm-CNFs/CF composites, obtained from the x-intercept, are measured at 1.2 Ω and 1.4 Ω, respectively. In the medium-frequency region, the value of Rw of 20 nm-CNFs/CF and 50 nm-CNFs/CF composites were found to be 1.25 Ω and 1.8 Ω, respectively. At low frequencies, the plots of 50 nm-CNFs/CF took on an almost vertical line, indicating an ideal capacitive behavior with low diffusion resistance. Conversely, the 25 nm-CNFs/CF electrodes exhibited a relatively low slope. To summarize, the results showed that the resistance of 25 nm-CNFs/CF was smaller, and its energy storage characteristic was better. On the other hand, 50 nm-CNFs/CF approached an ideal capacitor, displaying higher capacitance retention. These findings aligned with the results obtained from CV tests.
4. Conclusions
The CNFs/CF composite electrodes with high surface area and a good degree of graphitization were successfully fabricated by directly growing CNFs on CF via the CVD method. The optimal CNF morphology was achieved at 800 °C, resulting in fibers with an average diameter of approximately 25 nm. Electrochemical studies confirmed that the CNFs/CF electrodes exhibited EDLC characteristics, achieving a specific capacitance of up to 87.5 F/g. Comparison with previously reported CNTs/CF electrodes highlights the importance of comprehensively considering factors such as morphology, microstructure, fiber diameter, interfacial phase, and pore distribution when evaluating electrochemical performance. These findings suggest that CNFs/CF is a promising candidate for high-performance EDLC electrodes, with strong potential for use in flexible, portable, and wearable electronic devices.
References
- Zhou C, Liu J. Carbon nanotube network film directly grown on carbon cloth for high-performance solid-state flexible supercapacitors[J]. Nanotechnology, 2013, 25(3): 035402. [CrossRef]
- Lu W, Qu L, Henry K, et al. High performance electrochemical capacitors from aligned carbon nanotube electrodes and ionic liquid electrolytes[J]. Journal of Power Sources, 2009, 189(2): 1270-1277. [CrossRef]
- Hu S, Lee C Y, Chiu H T. Chemical vapor deposition of carbon nanocoils three-dimensionally in carbon fiber cloth for all-carbon supercapacitors[J]. ACS omega, 2019, 4(1): 195-202. [CrossRef]
- Lv P, Zhang P, Li F, et al. Vertically aligned carbon nanotubes grown on carbon fabric with high rate capability for super-capacitors[J]. Synthetic metals, 2012, 162(13-14): 1090-1096. [CrossRef]
- Frackowiak E. Carbon materials for supercapacitor application[J]. Physical chemistry chemical physics, 2007, 9(15): 1774-1785.
- Faraji S, Ani F N. The development supercapacitor from activated carbon by electroless plating—A review[J]. Renewable and Sustainable Energy Reviews, 2015, 42: 823-834. [CrossRef]
- Razaq A, Bibi F, Zheng X, et al. Review on graphene-, graphene oxide-, reduced graphene oxide-based flexible composites: From fabrication to applications[J]. Materials, 2022, 15(3): 1012. [CrossRef]
- Ke Q, Wang J. Graphene-based materials for supercapacitor electrodes–A review[J]. Journal of Materiomics, 2016, 2(1): 37-54. [CrossRef]
- Honda Y, Takeshige M, Shiozaki H, et al. Vertically aligned double-walled carbon nanotube electrode prepared by transfer methodology for electric double layer capacitor[J]. Journal of Power Sources, 2008, 185(2): 1580-1584. [CrossRef]
- Zhang H, Cao G, Yang Y, et al. Comparison between electrochemical properties of aligned carbon nanotube array and entangled carbon nanotube electrodes[J]. Journal of the Electrochemical Society, 2007, 155(2): K19. [CrossRef]
- Tiwari A P, Mukhiya T, Muthurasu A, et al. A review of electrospun carbon nanofiber-based negative electrode materials for supercapacitors[J]. Electrochem, 2021, 2(2): 236-250. [CrossRef]
- Zhou X, Liu B, Chen Y, et al. Carbon nanofiber-based three-dimensional nanomaterials for energy and environmental applications[J]. Materials Advances, 2020, 1(7): 2163-2181. [CrossRef]
- Hu S, Lee C Y, Chiu H T. Chemical vapor deposition of carbon nanocoils three-dimensionally in carbon fiber cloth for all-carbon supercapacitors[J]. ACS omega, 2019, 4(1): 195-202. [CrossRef]
- Kim B, Chung H, Kim W. Supergrowth of aligned carbon nanotubes directly on carbon papers and their properties as supercapacitors[J]. The Journal of Physical Chemistry C, 2010, 114(35): 15223-15227. [CrossRef]
- Hsieh C T, Chen W Y, Cheng Y S. Influence of oxidation level on capacitance of electrochemical capacitors fabricated with carbon nanotube/carbon paper composites[J]. Electrochimica Acta, 2010, 55(19): 5294-5300. [CrossRef]
- Hsieh C T, Teng H, Chen W Y, et al. Synthesis, characterization, and electrochemical capacitance of amino-functionalized carbon nanotube/carbon paper electrodes[J]. Carbon, 2010, 48(15): 4219-4229. [CrossRef]
- Chen H, Li Y, Feng Y, et al. Electrodeposition of carbon nanotube/carbon fabric composite using cetyltrimethylammonium bromide for high-performance capacitor[J]. Electrochimica acta, 2012, 60: 449-455. [CrossRef]
- Luo, H. , Lv, S., Liu, G., Cheng, Y., Ge, X., Wang, X., Chen, F. Multi-interfacial magnetic carbon nanotubes encapsulated hydrangea-like NiMo/MoC/Ndoped carbon composites for efficient microwave absorption, carbon. [CrossRef]
- Cuesta A, Dhamelincourt P, Laureyns J, Alonso A M, Tascon J M D. Raman microprobe studies on carbon materials[J]. Carbon 1994; 32(8): 1523-1532. [CrossRef]
- Hsieh C T, Chen W Y, Lin J H. Synthesis of carbon nanotubes on carbon fabric for use as electrochemical capacitor[J]. Microporous and mesoporous materials, 2009, 122(1-3): 155-159. [CrossRef]
- Lv P, Zhang P, Feng Y, et al. High-performance electrochemical capacitors using electrodeposited MnO2 on carbon nanotube array grown on carbon fabric[J]. Electrochimica acta, 2012, 78: 515-523. [CrossRef]
- Yamamoto N, Hart A J, Garcia E J, et al. High-yield growth and morphology control of aligned carbon nanotubes on ceramic fibers for multifunctional enhancement of structural composites[J]. Carbon, 2009, 47(3): 551-560. [CrossRef]
- Garcia E J, Wardle B L, Hart A J, et al. Fabrication and multifunctional properties of a hybrid laminate with aligned carbon nanotubes grown in situ[J]. Composites Science and Technology, 2008, 68(9): 2034-2041. [CrossRef]
Figure 1.
The SEM images of CNFs/CF grown at different temperature with different diameters. (a-c) 25 nm- CNFs/CF, (d-f) 50 nm- CNFs/CF.
Figure 1.
The SEM images of CNFs/CF grown at different temperature with different diameters. (a-c) 25 nm- CNFs/CF, (d-f) 50 nm- CNFs/CF.

Figure 2.
The TEM images and Raman spectrum of 25 nm-CNFs/CF.
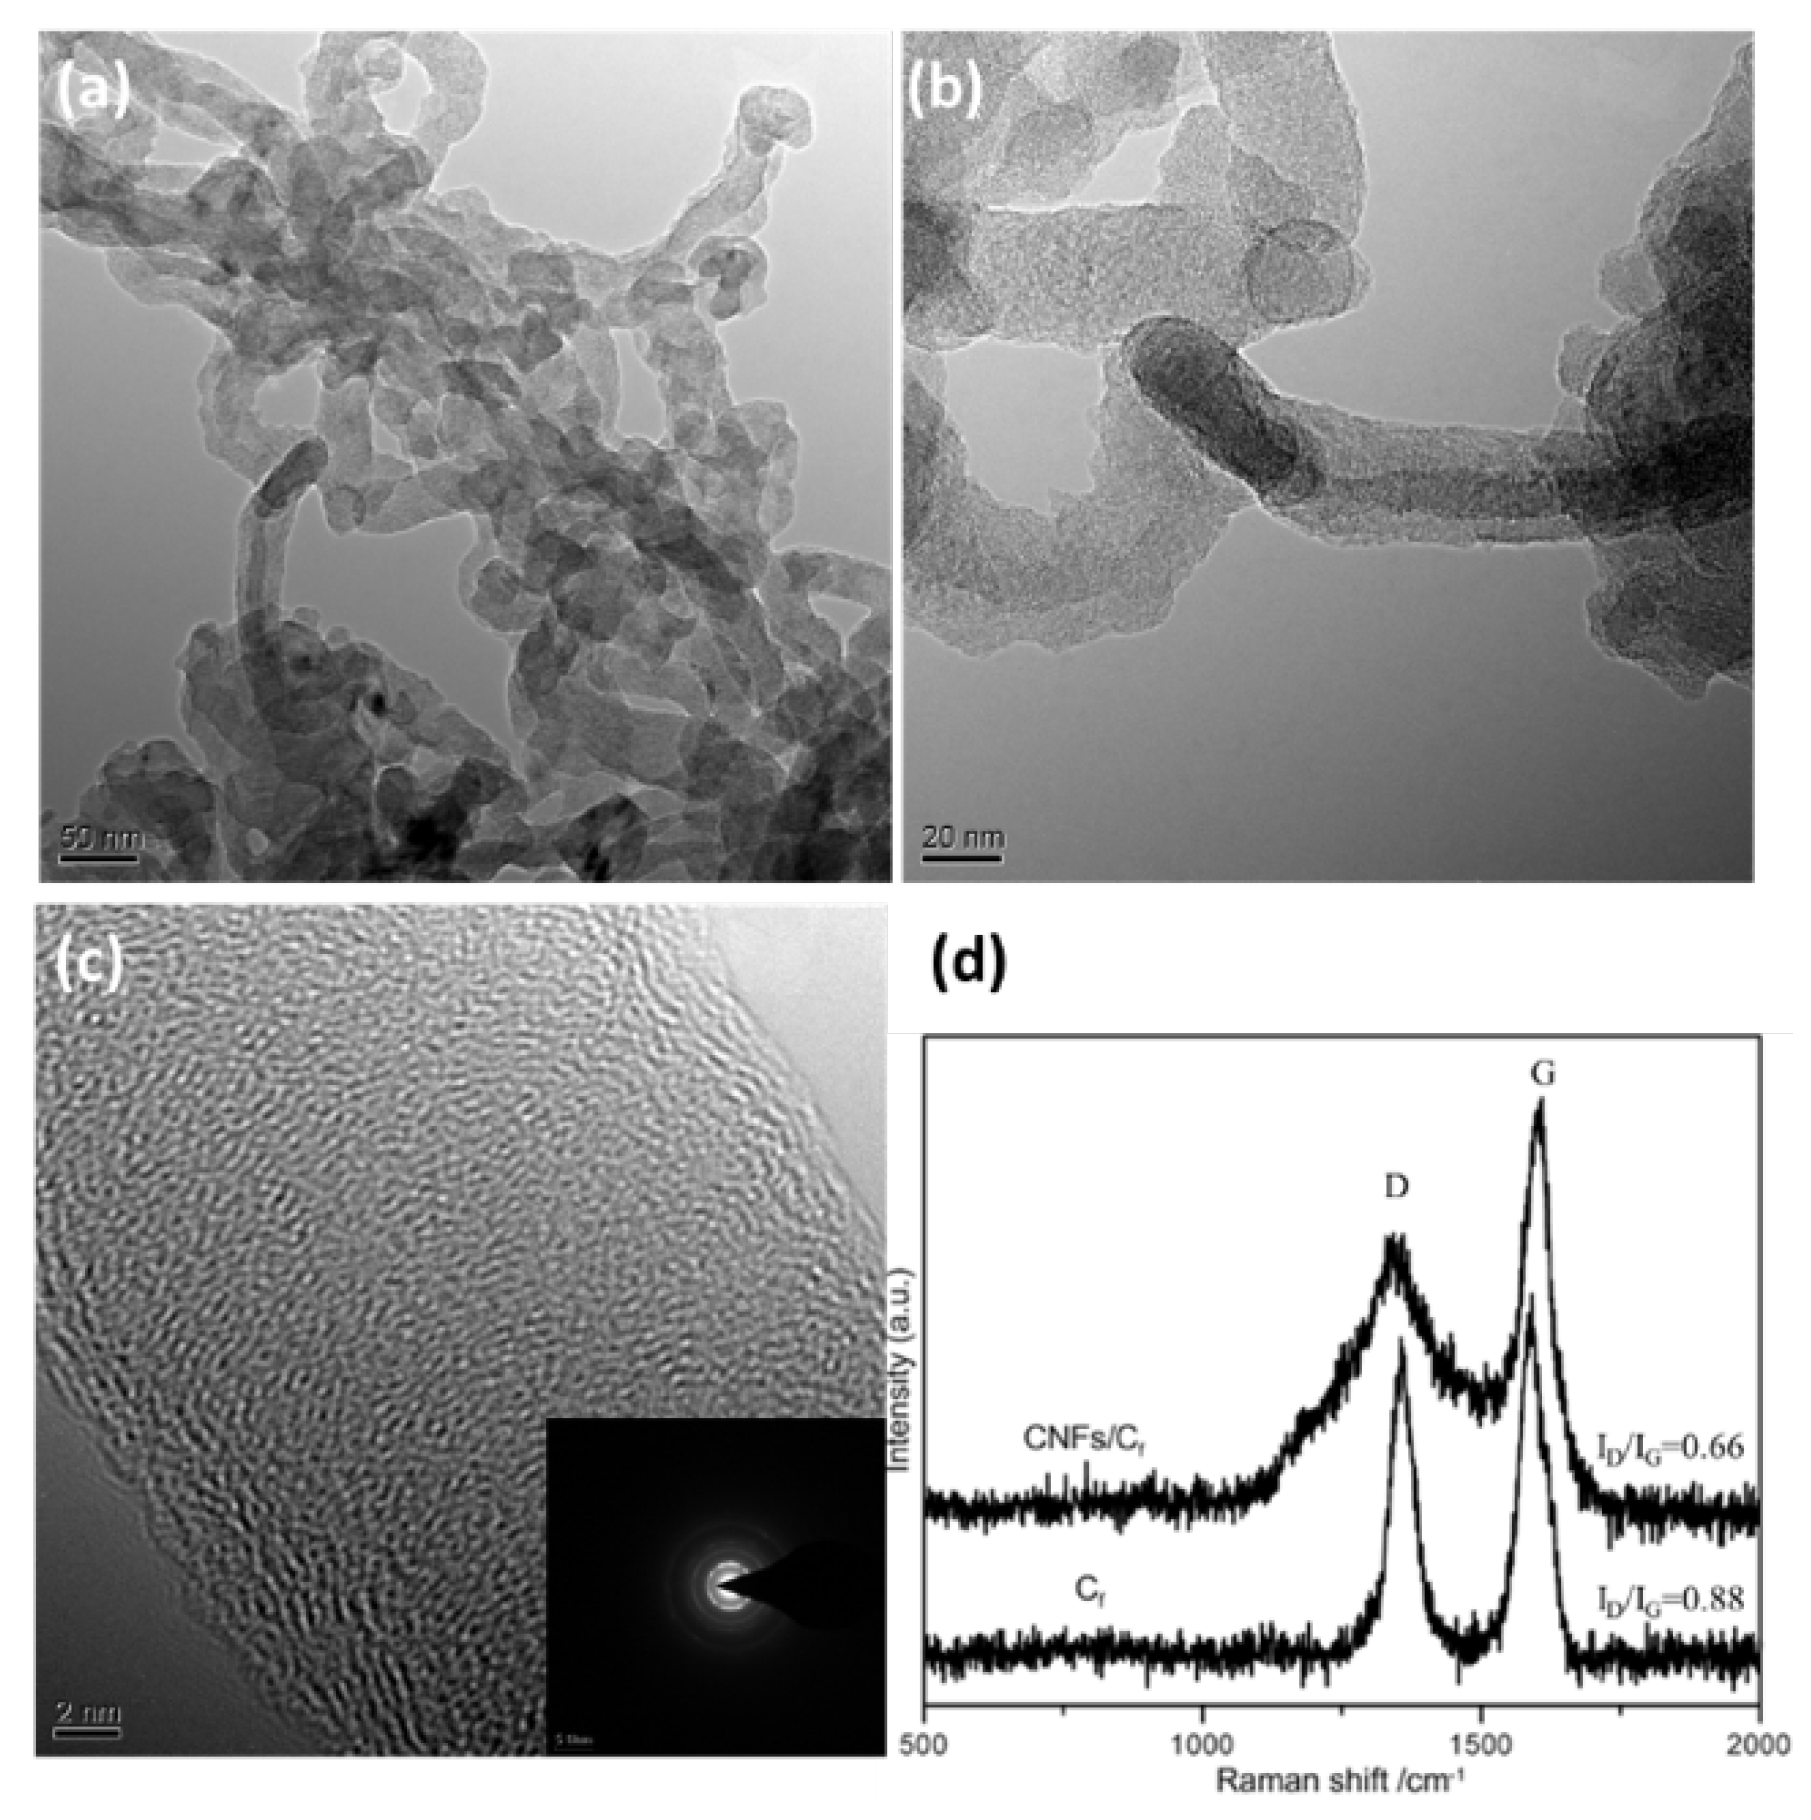
Figure 3.
The cyclic voltammetry and specific capacitance of CNFs/CF with different diameters under different scan rates. (a) 25 nm-CNFs/CF, (b) 50 nm-CNFs/CF.
Figure 3.
The cyclic voltammetry and specific capacitance of CNFs/CF with different diameters under different scan rates. (a) 25 nm-CNFs/CF, (b) 50 nm-CNFs/CF.
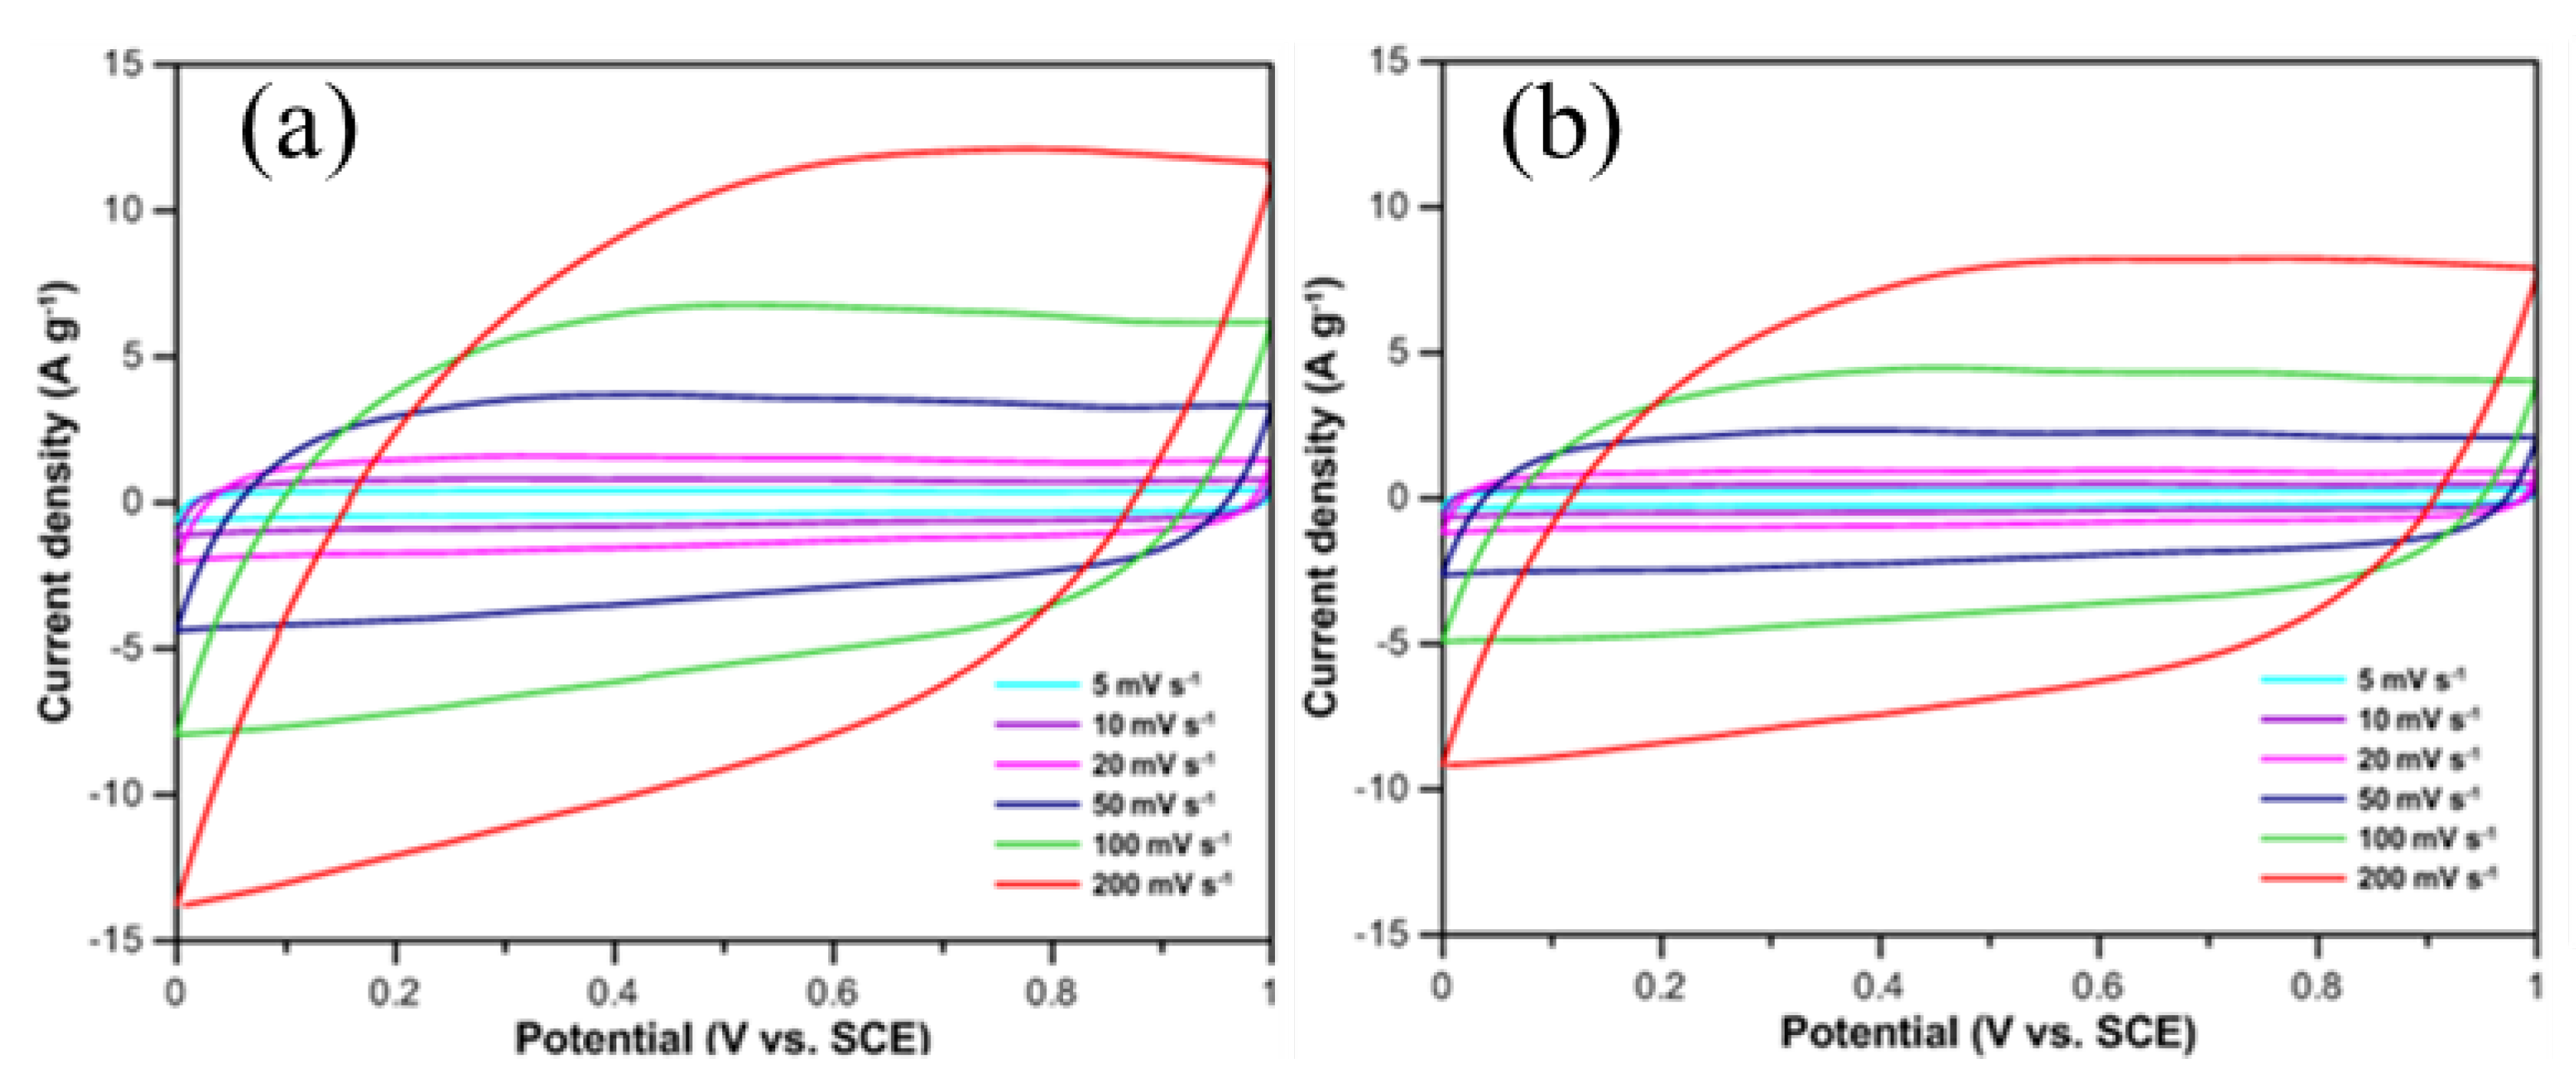
Figure 4.
The galvanostatic charge/discharge curves and specific capacitance curves of CNFs/CF with different diameters under different scan rates. (a) 25 nm-CNFs/CF, (b) 50 nm-CNFs/CF.
Figure 4.
The galvanostatic charge/discharge curves and specific capacitance curves of CNFs/CF with different diameters under different scan rates. (a) 25 nm-CNFs/CF, (b) 50 nm-CNFs/CF.
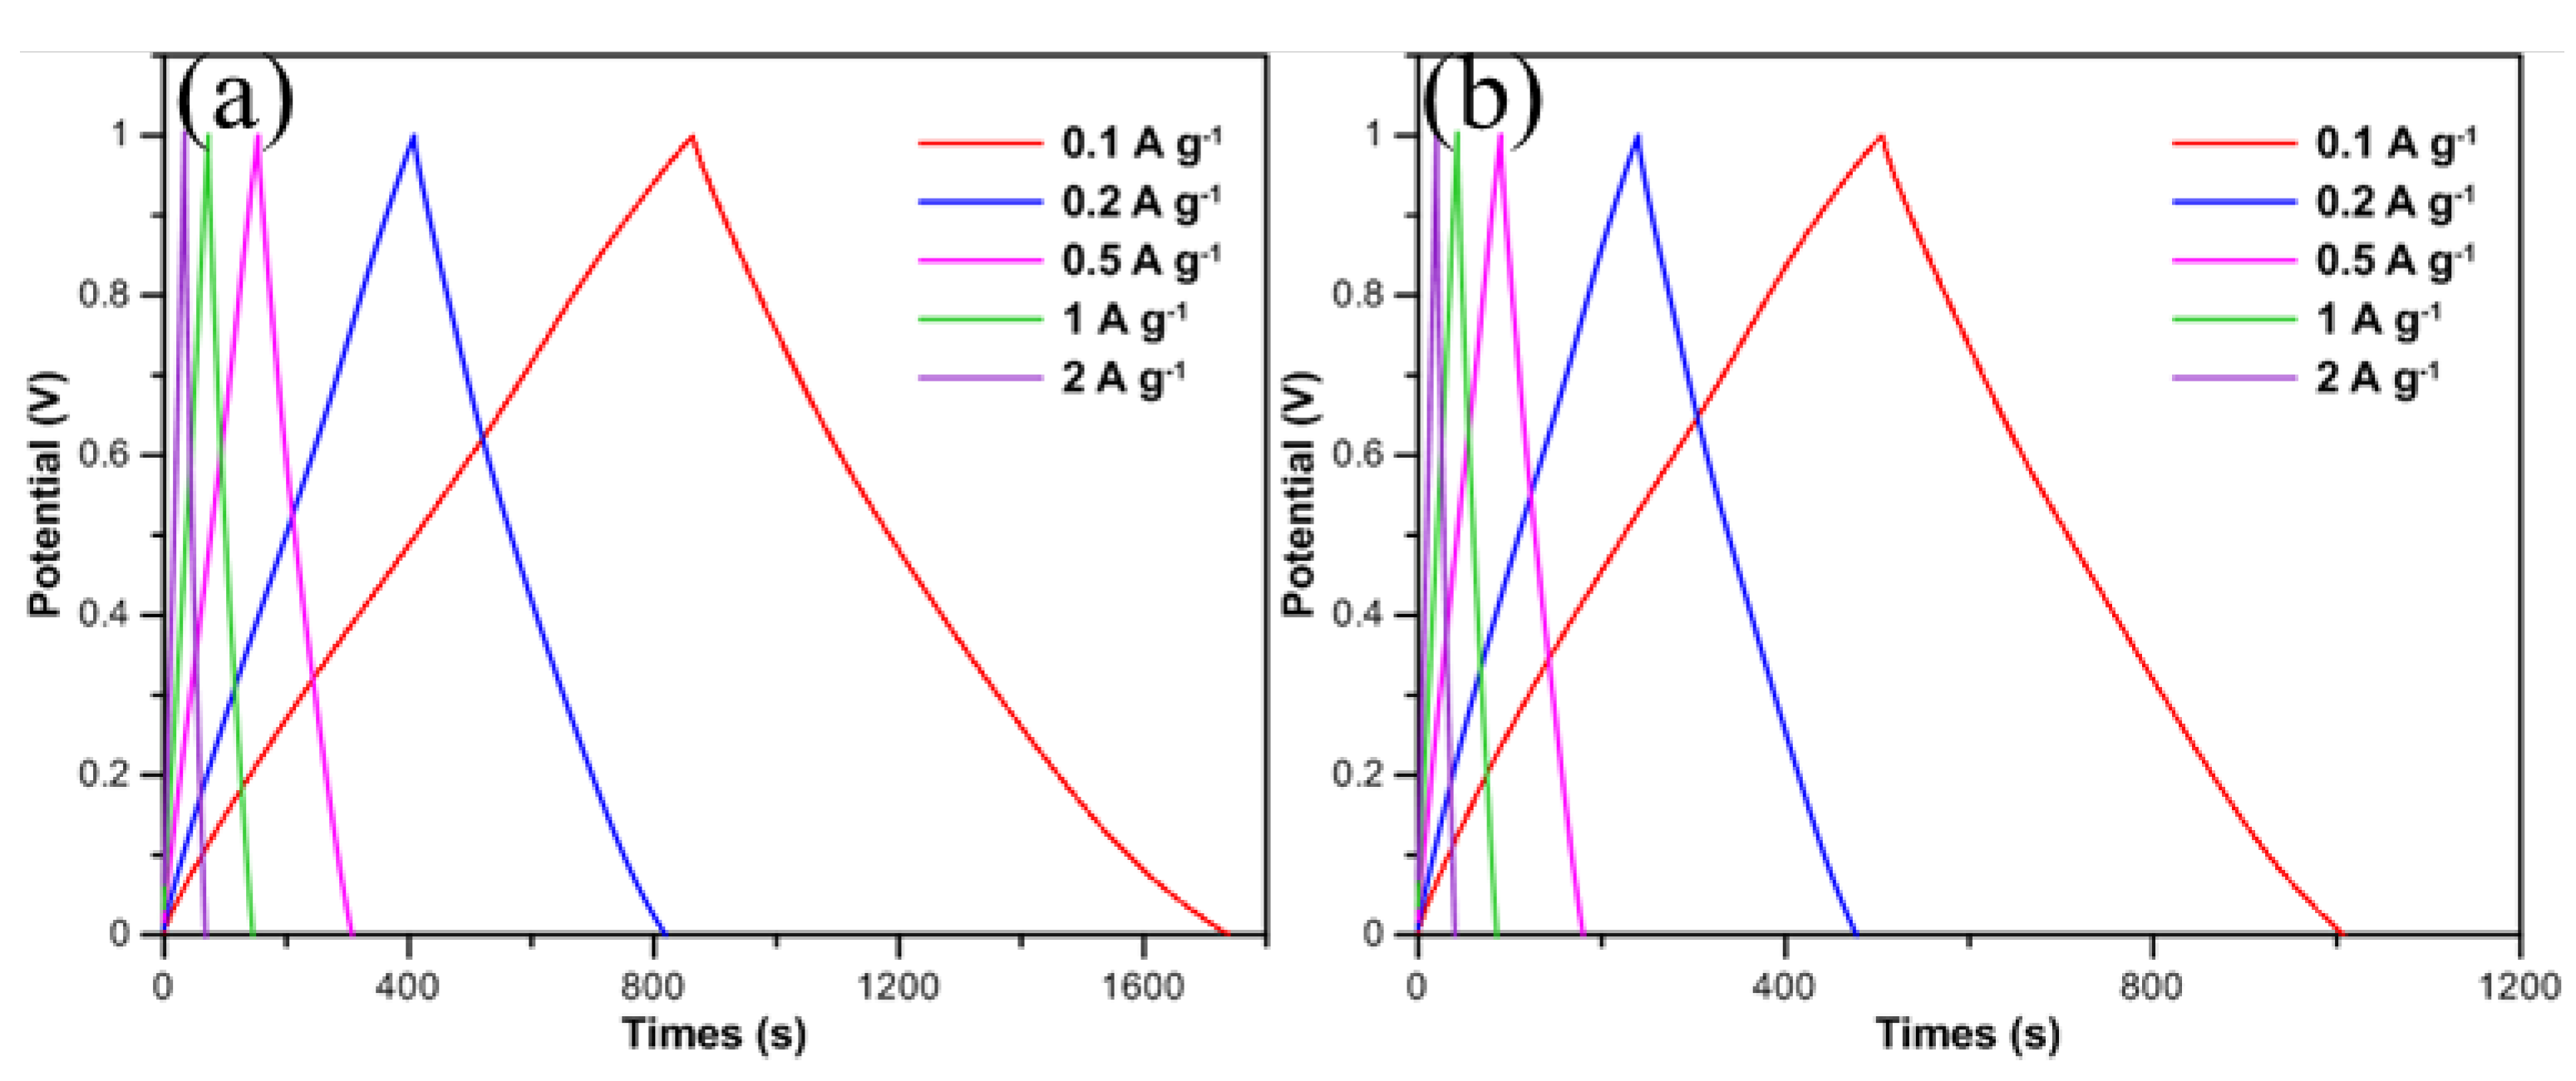
Figure 5.
The EIS images of CNFs/CF with different diameters.
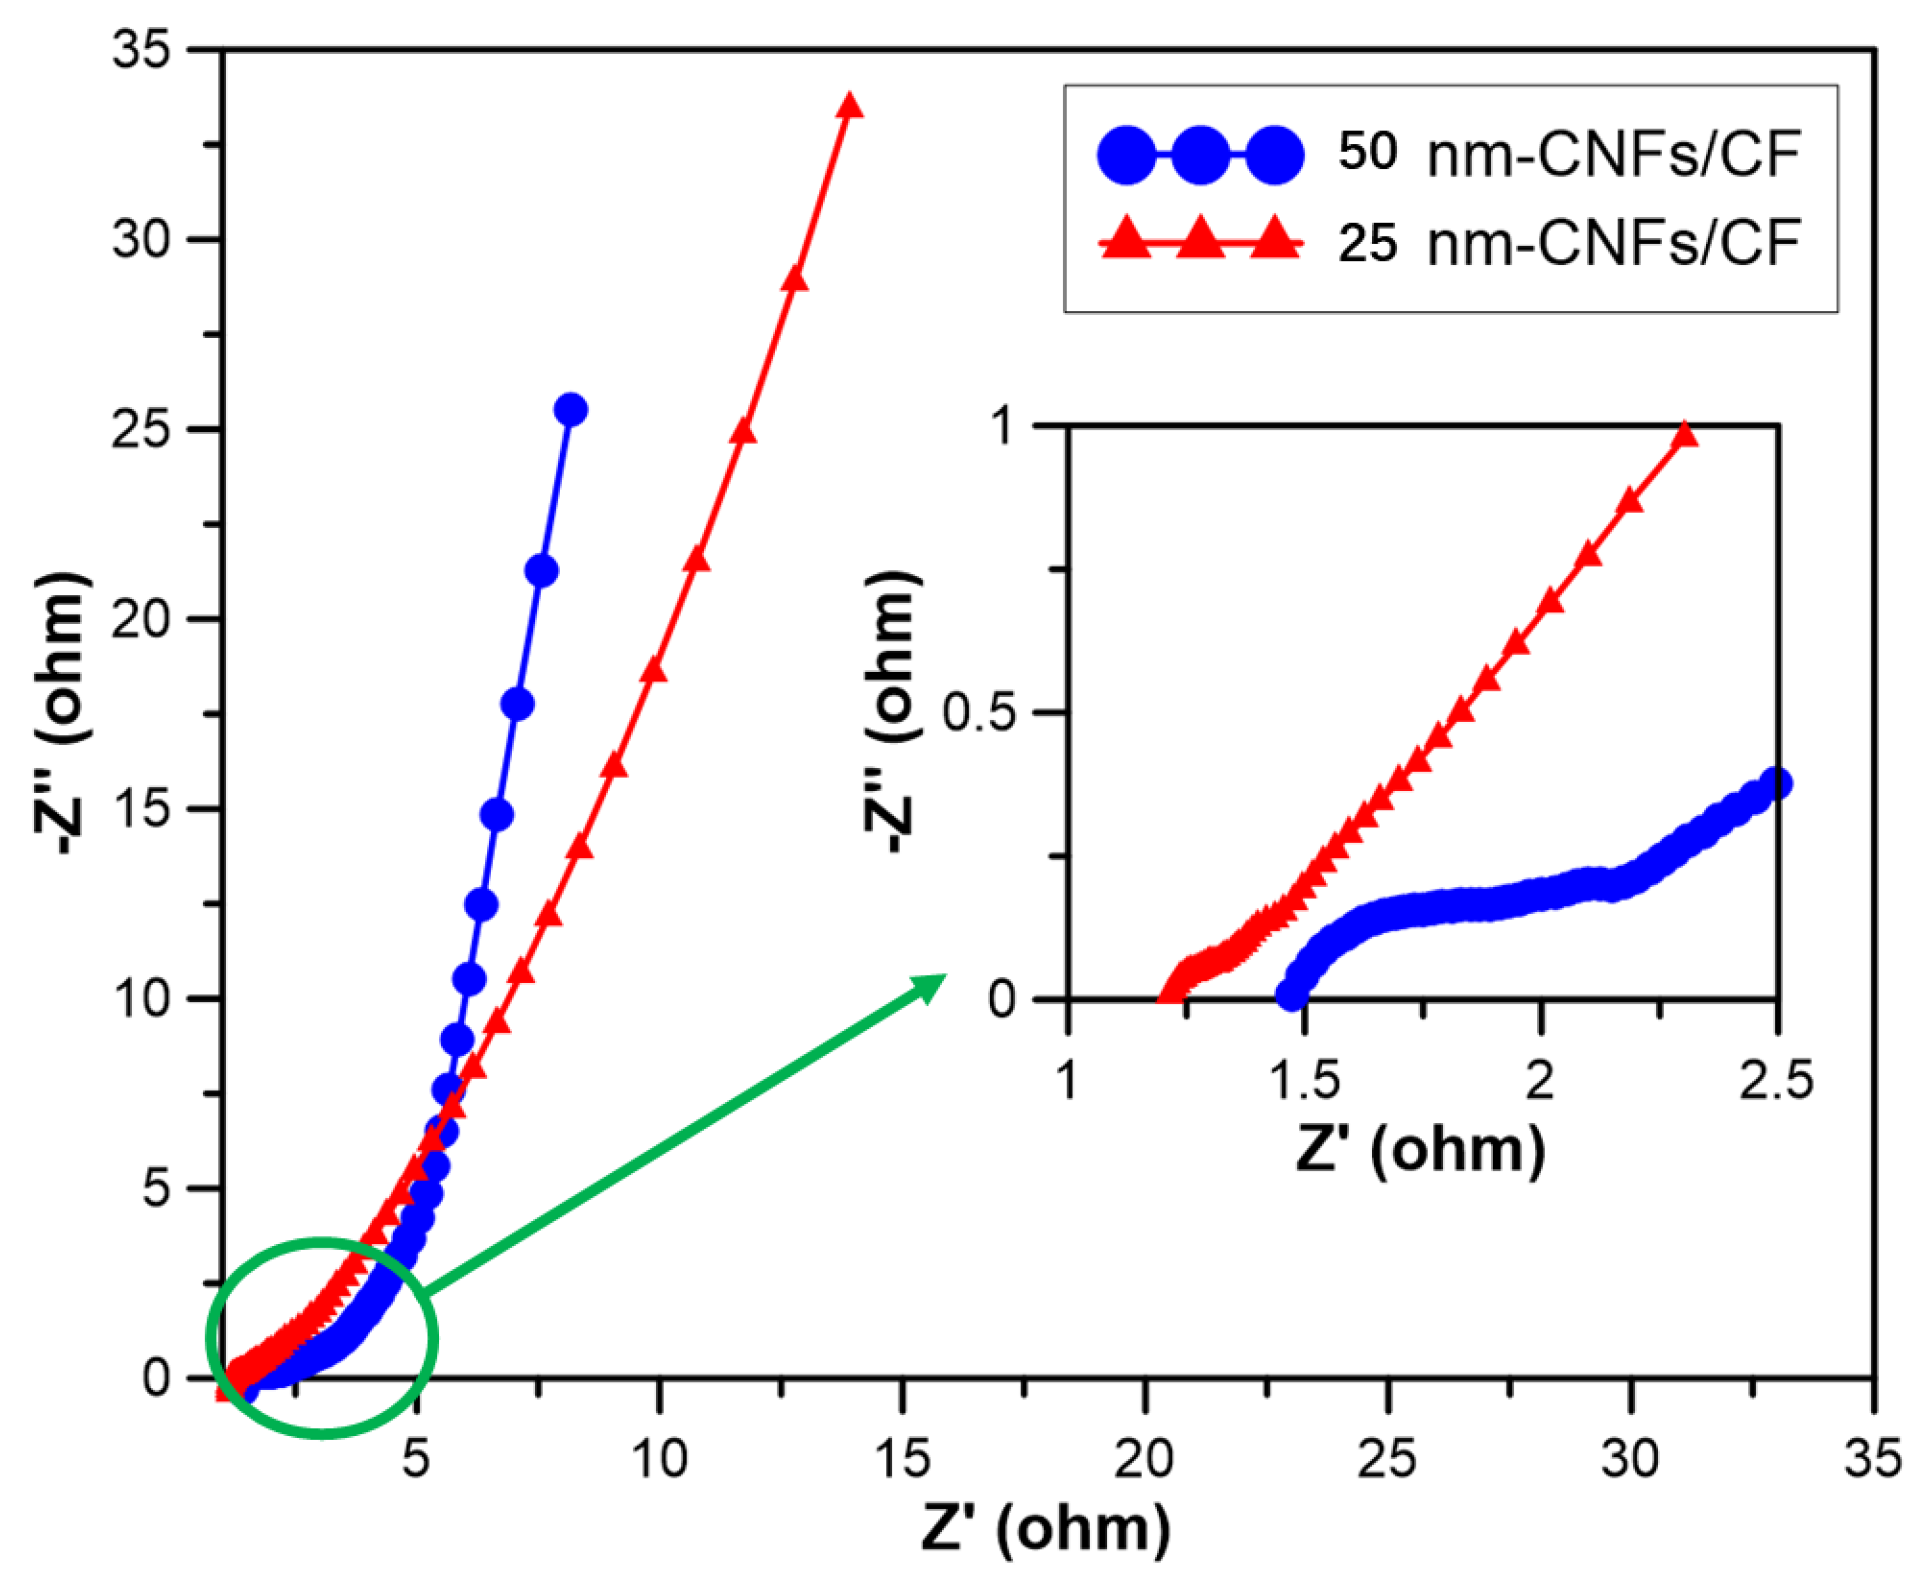

Table 1.
The specific capacitance of different diameters under different scan rates.
| Scan rates(mV/s) | 5 | 10 | 20 | 50 | 100 | 200 |
| The specific capacitance of 25 nm-CNFs/CF(F/g) | 77.0 | 72.8 | 68.0 | 59.0 | 49.1 | 36.3 |
| The specific capacitance of 50 nm-CNFs/CF(F/g) | 46.8 | 44.7 | 42.7 | 39.1 | 34.9 | 28.3 |
Table 2.
The specific capacitance of CNFs/CF with different diameters under different current densities.
Table 2.
The specific capacitance of CNFs/CF with different diameters under different current densities.
| Current density (A/g) | 0.1 | 0.2 | 0.5 | 1 | 2 |
| The specific capacitance of 20 nm-CNFs/CF (F/g) | 87.5 | 82.2 | 76.7 | 72.8 | 67.6 |
| The specific capacitance of 50 nm-CNFs/CF (F/g) | 50.2 | 47.5 | 44.8 | 42.8 | 40 |
Disclaimer/Publisher’s Note: The statements, opinions and data contained in all publications are solely those of the individual author(s) and contributor(s) and not of MDPI and/or the editor(s). MDPI and/or the editor(s) disclaim responsibility for any injury to people or property resulting from any ideas, methods, instructions or products referred to in the content. |
© 2025 by the authors. Licensee MDPI, Basel, Switzerland. This article is an open access article distributed under the terms and conditions of the Creative Commons Attribution (CC BY) license (http://creativecommons.org/licenses/by/4.0/).
Copyright: This open access article is published under a Creative Commons CC BY 4.0 license, which permit the free download, distribution, and reuse, provided that the author and preprint are cited in any reuse.


