
Submitted:
19 November 2025
Posted:
19 November 2025
You are already at the latest version
Abstract
The unpredictability, increasing frequency and severity of extreme climatic events, is forcing researchers and farmers to urgently develop adaptation practices to enhance the resilience of agroecosystems to climate change. The identification of farming systems that have withstood recent climatic events and understanding the agroecological features that allowed such systems to resist and/or recover from drought and/or hurricanes is of strategic importance. This paper describes a number of methodologies aimed at assessing the resilience of Latin American agroecosystems by estimating the level of vulnerability and the response capacity of selected farming systems to cope with climatic threats. The methodologies utilize a set of socio-ecological indicators that can be easily evaluated in the field, allowing farmers to assess whether their farms can withstand or not a major climatic event (drought or hurricane) and what to do to enhance the resiliency of their farms in preparation for future events. The derived resiliency principles and practices that underlie the success of resistant farms can then be disseminated to thousands of farmers, thus contributing to the scaling up of the adoption of agroecological adaptation practices.
Keywords:
climate change
; resilience
; vulnerability
; response capacity
; agroecology
1. Introduction
It is now well established that extreme meteorological events associated with climate change such as rising of average temperature, heat waves, storms, floods and drought, can lower agricultural productivity, including worsening food quality and nutritional values by affecting plant physiological processes, enhancing pests and diseases or other processes [1]. It is expected that under the most severe climate change scenarios and without adaptation, crop yield losses could range from 7% to 23%, however effects will vary according to various regions, depending on the latitude, altitude, access to irrigation, cropping practices, management intensity and other factors [2]. Given predicted climate change impacts on agricultural productivity there is an urgent need to design adapted agroecosystems to ensure future food sovereignty [3].
A growing body of evidence suggests that farming systems aligned with principles of agroecology featuring practices such as crop diversification in the form of intercropping, agroforestry and rotations, complemented with organic soil management and water conservation strategies enhance climate change adaptation [4]. Several studies conducted in Latin America confirm that increased diversification of agricultural systems (including animal and tree integration) at the field and landscape level leads to greater farm-level resilience protecting farmers against climatic extremes [5]. In particular, agroecology is increasingly recognized as a viable adaptation strategy among small farmers in developing countries, without compromising crop yields while conserving agrobiodiversity, and improving dietary and nutritional diversity [6].
In general, greater agroecosystem diversity buffers against shifting rainfall and temperature patterns and at times can reverse downward trends in yields, as a variety of crop species and varieties respond differently to such shocks [7]. Farming systems managed with agroecological principles exhibit a number of socio-ecological features that when identified, measured and monitored, suggest that farms are or not resilient. The absence of adaptive capacities suggests vulnerability and movement away from a state of resilience [8].
Resilience is usually defined as the capacity of farming systems to maintain crop yields in the midst of climatic variability. Therefore, assessing resilience requires consideration of the socio-ecological complexities of farm management, in addition to location-specificities, climatic and non-climatic stressors, including the variation in crop species responses to climatic variabilities. Assessing resilience implies the need to embrace the systemic nature of agroecosystems and the dynamic interactions between components, making the choice of indicators complicated [9].
Numerous measurement frameworks have emerged, but there is still no consensus on which is the best method to assess resilience and challenges for their field applicability still remain [10]. Despite the myriad of theoretical papers and methodologies available, a major challenge for researchers in Latin America is to develop resilience assessment tools that are simple and operational, while addressing complexity of the rural communities being evaluated. Herein we provide examples of methodologies tested in various rural communities in Latin America featuring simple farmer friendly indicators that can be applied at the farm level in a participatory manner. Several groups have utilized the Holistic Risk Index (HRI) which assesses the risk imposed by extreme climatic events on farms by evaluating the relationship between the level of vulnerability of each farm and the farmers’ adaptive responses. This methodology can be used to assess resilience after the system has successfully coped, adapted or collapsed after an event, allowing to retrospectively assess the climate resilience of farming systems after an extreme climatic episode and providing criteria to select agroecological interventions that can be implemented to prepare the farm system to new climatic extremes. Two additional methodologies (traffic light and happy/sad faces) are presented which are useful to evaluate how well prepared are farming systems to withstand potential climatic shocks by assessing the condition of various indicators at the landscape and farm level. Analysis of results helps farmers to implement practical recommendations leading to farm redesigns that improve their resilience in anticipation of hurricanes, droughts, etc. This retrospective climate resilience assessment can suggest ideas about designs and practices that may be implemented to prepare the farm system to new and unpredictable climatic extremes.
2. Framing the Risk Assessment Methodology
A “resilient” agroecosystem should be capable of maintaining a certain level of food production, when challenged by the risk imposed by a severe drought or by excess rainfall. On the contrary, a vulnerable agroecosystem would be unable to cope with adverse effects of climate variability risking loss of productivity [11]. When exposed to climate change, the resulting risk endured by a farm is determined by the interaction between the intensity of the climatic threat, its level of vulnerability and the farmers response capacity. The Holistic Risk Index (HRI) was originally proposed by Barrera et al [12] to evaluate the risk imposed by insect pests on Mexican coffee systems.
To calculate the HRI the following formula is utilized (1):
Where, Threat; determined by the climatic event’s intensity, frequency, duration and level of impact, which is usually equal to all farms evaluated therefore is given a value of 1. Vulnerability: the possibility of loss of biodiversity, soil and water resources, or productivity by an agroecosystem when affected by a climatic event. Response capacity: refers to the agroecological features of the farms and the management strategies used by farmers to reduce climatic risks and to resist and recover from such events.
The level of vulnerability of a farm to a threat is determined by its agroecological infrastructure (level of landscape, crop and genetic diversity, soil quality, soil cover, etc.) and the levels of farmers response which is linked to the levels of family/community organization, networking capabilities, degree of food self-sufficiency, farm management skills, etc. The capacity of farmers to adapt is based on attributes such as traditional knowledge and skills, levels of social organization, and safety networks, etc; and also, on farm attributes such as cropping system diversity and soil quality. The relationships between threat, vulnerability and response capacity are depicted in Figure 1 in reference to a case study conducted in Chile and described in section 3.2 below.
A community’s vulnerability is higher if the levels of landscape and farm diversity are low and the community’s social organization is weak. Vulnerability can be reduced by the response capacity of the community by making adjustments to reduce risks. Communities with high levels of response capacity usually exhibit strong cohesive social networks and collective action skills able to mobilize agroecological knowledge to deploy diversified designs that enhance the overall resilience of farms [13]. In general, the ability of farmers to reduce risk and enhance resilience depends on the biophysical and sociocultural context, which in turn determines the ability of farmers to react and adapt to changes. Farmer’s capacity to adapt is enhanced if they join community organizations which collectively have the ability to transform farm systems in critical environmental conditions [14].
Participating farmers conduct observations of the landscape in which their farms are inserted to determine their level of vulnerability considering variables such as slope, exposure, presence of windbreaks or distance to protective forests. Similarly, farmers carry out observations of farm features such level of crop species and genetic diversity, soil cover, soil structure and organic matter content, etc. Each of these observed features or characteristics is considered an indicator, which reflects an aspect, condition or change of the landscape or farm. Selected indicators are given values from 1-5 ,1-10 or another scale, where a value of 1 denotes high vulnerability and low response capacity, while a value of 5 or10 denotes high response capacity and low vulnerability.
After the diagnosis is conducted, farmers can explore different agroecological interventions and select those viable to be applied to enhance resiliency for each individual farm, depending on each farmer’s situation. Sources of innovations can usually be derived locally as many small farmers have developed farming strategies to withstand challenging climatic conditions. At times this implies a process of recovery of traditional management practices which represent strategies to prepare for climate change, and in other occasions scientific knowledge must complement local knowledge by providing methodological and technical contributions [15].
3. Assessing the Holistic Risk Index (HRI) in Latin American Farms
3.1. Coffee Systems in Colombia
Machado-Vargas et al. [16] utilized the HRI to assess the socio-ecological resilience of nine small coffee farms undergoing different stages of agroecological transition. The study was conducted in in the Porce river basin located in the northeast of the department of Antioquia (Colombia), a region with with an annual rainfall between 2000 and 3500 mm, an average temperature between 18°-25°C, where coffee is grown by small farmers between 1000 and 1800 masl.
The HRI was based on an assessment of water availability, one of the main threats affecting farmers, but other risks such as the prices of coffee and fertilizers also affected farmers livelihoods. The main vulnerability indicators chosen were coffee productivity, food self-sufficiency and level of internal inputs use, and the response capacity of farms was estimated based on indicators such as the percentage of shade trees, the diversity of coffee systems, the dependence on external inputs, farmers autonomy from markets and the level of farmer´s organization.
The scale implemented to measure each vulnerability and response capacity indicator ranged from 1 to 4, with 4 being the highest value = high vulnerability/high response capacity and 1= low vulnerability and low response capacity. The results of the HRI evaluation of the nine coffee-growing families studied are shown in Table 1 depicting their respective threat, vulnerability and response capacity indices. The HRI was standardized as a base of 1, where values > 1 denote more vulnerable systems exhibiting higher risk, therefore, lower socio-ecological resilience and values close to zero denote systems with less risk, therefore, exhibiting higher levels of socio-ecological resilience. In general, the higher the risk level the lower is the value of the level of socioecological resilience. The HRI values and the socioecological resilience levels corresponding to each coffee-growing family indicate that two (A3 and A7) of the nine coffee growers exhibited high risk and low resilience level, two farmers (A1 and A4) exhibited a medium resilience level, four farmers (A2, A5, A6, A9) presented high resilience levels and only one coffee grower (A8) reached a very high resilience status. Results suggest that higher resilience to climate variability was associated with those farms undergoing a more advanced stage of agroecological transitioning.
3.2. Assessing HRI in Small Farms in South Chile
In participatory workshops with farmers’ organizations representing Mapuche (indigenous) Chilean (criollo) and European descendant farmers from areas near Temuco, South Chile, drought was identified as the main threat. The group selected the indicators to assess key aspects of farm vulnerability and adaptive responses. Vulnerability indicators included: (a) difficulty to water access, (b) proximity to surrounding forest plantations, (c) crop homogeneity, and (d) farm location within the watershed. Indicators of drought response capacity included: (e) farmers’ knowledge about drought coping practices, (f) conservation and use of drought-tolerant crop varieties, and (g) participation in water-related social networks.
Field measurements suggest that Mapuche farmers showed lower levels of vulnerability, largely due to their higher level of crop diversity and reduced proximity to pine plantations which are known to reduce water reserves in micro-watersheds. European-descendant farms exhibited greater crop diversity than Chilean farms. Mapuche farms scored high values of response capacity linked to their strong knowledge of adaptive practices and the conservation and use of drought-tolerant crops and varieties. Chilean farmers, however, demonstrated greater involvement in social networks that control access to irrigation water (Figure 2). Estimated resilience levels were highest among Mapuche farms, with a mean value of 0.88, compared with 0.55 for European-descendant farms and 0.52 for Chilean farms.
These results indicate that Mapuche smallholder systems possess greater resilience to drought, primarily linked to agroecological diversity and the maintenance of traditional knowledge and practices, such as seed conservation and exchange. The findings underscore the importance of agricultural biodiversity and culturally embedded practices in enhancing resilience to climate change.
3.3. Assessing HRI in Uruguayan Livestock Farms
The study reports results from 25 surveyed livestock ranchers who use the grazing lands available in the Farrapos Estuaries which are part of Uruguay’s National System of Protected Areas. Unfortuntely in this region, agricultural intensification via expansion of soybean monocultures is shrinking grazing lands and contributes to worsening the effects of increasingly common flooding, challenging the ability of cattle ranchers to maintain their operations [18].
The survey of vulnerability, adaptive response and perceived threat was completed by conducting semi-structured interviews with 25 farmers who collectively answered 135 questions. The producers answered each question according to its importance to them, assigning a value between 1 and 5, with 5 being the most important. Based on these results, three data matrixes were constructed for the responses of the 25 interviewees with a total of 135 variables (60 for vulnerability, 60 for responsiveness, and 15 for threat). Table 2 provides a scale depicting the relationship between the level of risk and the resilience of the systems. The calculated holistic risk index values allowed for the identification of those ranchers exhibiting lower risk, providing information about the specific elements of their buffering capacity which provided them with greater ability to face threats, reduce risk and increase resilience.
Results indicate that four livestock ranchers exhibited low risk due to their high responsiveness linked to their use of traditional herd management practices, knowledge of the area, control of animal stock and social organization. Eighteen producers were shown to have medium risk and were divided into high vulnerability, low vulnerability and increased responsiveness groups; and three producers were shown to have high risk due to high threat and vulnerability, determined by the low availability of forage, difficulty in flood management, ranchers acting individually, etc; these three ranchers also exhibited a lower responsive capacity. Ranchers exhibiting high responsiveness were characterized by having detailed knowledge of the estuary, an intensive use of local resources and utilization of diversified management strategies, as well as high collaboration with other producers in the search of adaptive management strategies that are more resilient. Overall, the ability to organize to manage the estuary was the primary variable determining vulnerability and response capacity for all risk groups, followed by the ability to identify productive and economic alternatives outside of the estuary during flooding.
3.4. Estimating HRI in the Colombian Andes
This study reports the results of the resiliency assessment of six farms (three conventional monocultures and three diversified farms managed with agroecological practices) located in the central Andes of Antioquia [19]. Six indicators were selected to estimate vulnerability (slope, landscape diversity, soil’s susceptibility to erosion, etc) and 13 indicators to assess the response capacity (soil conservation practices, water management practices, crop diversity levels, food self-sufficiency, etc.) of the six farms. Indicators were ranked from 1 to 5 (values 1 or 2 express a high level of vulnerability and values 4-5 denote high response capacity). Ranking the indicators allowed to estimate the vulnerability levels and response capacity of each farm, but also to compare the performance of particular farms with others. According to the values given to the indicators, the agroecological farms (green) exhibited low vulnerability due to their high response capacity in relation to the conventional farms which expressed high vulnerability and low response capacity (red) (Figure 3a and b).
As shown in Figure 4, placing the risk values in a triangle permits locating farms where they fit along a gradient of vulnerability and response capacity values and thus depending on their location within the gradient it is possible to identify in a particular community which farms are at high or low risk. Farms presenting high respond capacity and low vulnerability can then serve as demonstration farms showcasing successful adaptive strategies.
4. Other Methodologies
4.1. The Semaforo (Traffic Light) Method
The “semaforo” (traffic lights) method was applied to evaluate the preparedness to hurricanes by farmers tending cacao agroforests in Talamanaca, Costa Rica. The method allowed farmers to select 15 indicators and rank each indicator using colors: red signifies high risk (values 1-2 in a scale of 1-5), yellow (medium risk-values 3-4) and green (little or no risk, value of 5). Each indicator listed in Table 3 was assigned an X under the corresponding color, based on farmers’ perception regarding the condition of each indicator to enhance or reduce vulnerability of their farms to potential hurricanes. A farm scoring more than 8 Xs marked green, was considered to be transitioning toward resilience [20].
Colors prompted farmers to think about what it means that a set indicators exhibit the color red or yellow and the consequences for each famer if the indicators remain yellow or red. Such reflections lead farmers to think about what to do to transition their systems towards a state of higher resilience (moving from red and yellow towards a green color).
For example, a farm located in a landscape void of natural vegetation received a red score for the indicator landscape diversity. On the contrary a farm totally surrounded by forests would receive a green score for the same indicator. Similarly depending on its vegetational structure (species composition, density and stratification), location, windbreaks surrounding farms were given a green color if windbreaks were effective in the interception of dominant winds and thus exert a protective role.
Farms characterized by lower plant diversity and complexity (vertical stratification) received red or yellow color ratings. Agroforests with trees with deep roots were given a green color as they tend to hold the soil and are more resistant to being uprooted by strong winds. Green color was also given to soils with a thick litter or a living cover crop which diminish erosion rates. Farmers receiving more than 8 red or yellow rankings became interested in planting additional shade trees and the use of soil conservation practices such as mulching, living or dead barriers, terraces, contour planting to protect soils from the erosive effect of runoff.
4.2. The Happy/Sad Faces Method
This study conducted in the Mixteca region describes the strategies small farmers of three communities (Zaragoza, Coxcaltepec and El Rosario) were implementing to adapt to recent increases in temperature, erratic rainfall intensity and delayed rainfall onset [21]. Farmers identified 14 indicators to evaluate the adaptive capacity of four agroecosystems, including four landscape indicators: territorial composition, windbreaks, field location and soil conservation practices. Crop rotation, crop varieties, polyculture, soil amendments and soil cultivation were selected as farmer management indicators. Six soil quality indicators included spontaneous non-crop plants, soil productivity, soil organic matter, soil depth and soil texture. Farmers ranked the condition of each indicator utilizing happy faces (value 5=optimal condition), neutral faces (3-4=acceptable condition) or sad faces (1-2= marginal condition).
As shown on Figure 5 farmers from the three communities gave on average 1 sad face and 3 neutral faces to landscape indicators. Despite the marginal values assigned, farmers recognized that heterogeneous forested landscapes (with vegetated borders and perennial vegetation) protected fields from climatic variability by accumulating soil organic matter and retaining groundwater. Four out of 5 indicators of farmer management at the field level were given happy faces, highlighting the importance of crop genetic and species diversity for stabilizing overall yields. Soil quality indicators ranked 3 neutral and 2 happy faces. Farmers from the three communities associated soil moisture retention with soil texture and depth. Generally, clayey soils were described as the most productive in drought years, but also difficult to cultivate in wet years. Farmers considered deep soils to be the most productive soils in both wet and dry years.
In participatory workshops, farmers were prompted to analyze the results of their evaluations as a group by addressing the following questions:
- How to obtain more happy faces (i.e., the optimal condition) in the landscape, farmer management, and soil quality categories?
- How to maintain the happy faces (i.e., optimal condition) in all three categories?
Farmers identified multiple strategies to improve landscape indicators (moving from sad and neutral faces to happy faces) to better prepare for climatic variability, including establishment of perennial vegetation and adopting more soil conservation practices along field margins, such as stone borders for stabilizing soils. Some farmers proposed planting fruit trees and acacia at the edges of fields to diversify the production of food, forage, and fodder, as well as to stabilize soils.
4.3. Assessing Drought Resilience in Cuban Farms
This study reports the results of an assessment of the resilience to drought of three farms (La Victoria, Media Luna and La China) undergoing agroecological transition, located in suburban areas of the province of Havana [22]. To determine the resilience capacity (RCd) of the surveyed farms the following indicators were utilized:
Resistance-absorption: ability of the agroecosystem to resist-absorb the prolonged effects of drought
Recovery: ability of the agroecosystem to return to the productive state prior to the incidence of the event.
Transformability Capacity: ability of the production system to achieve resilience influenced by public policies and the adaptability skills of farmers.
RCd values above 0.50 indicate that the production system is starting to exhibit drought resilience capabilities; values around 1.0 denote advancement towards a state of resilience and values above 1.5 evidence high resilience capabilities.
The sensitivity of natural resources (SNRd) was determined considering sensitivity of crops, animals, and the availability soil and water supply when exposed to a drought of varying frequency and duration. SNRd was considered very high when the value obtained was above 0.8; high for values between 0.6- 0.8; medium when values ranged between 0.4-0.59; low with values 0.2-0.39 and very low below with values 0,1- 0.2.
The three farms exhibited similar resistance-absorption values (between 0.59 and 0.72) mostly determined by the low structure of the production system matrix and poor spatial/ temporal design of crop and livestock systems. “La Victoria” farm (0.27) and “Media Luna” (0.42) showed low recovery values due to lower availability of means of production, poor infrastructure and low food self-sufficiency for people and animals. ”La China” (0.72) disclosed higher recovery values due to better infrastructure, access to inputs and higher level of food self-sufficiency. Transformation ability was greater for the “La China” farm (0.79), followed by “Media Luna” (0.61) and “La Victoria” (0.51). The variables that most limited transformability were: lack of self-organization and finance management, low productive stability and poor access to extension services.
The General Resilience Index to droughts (GRId) was determined using the following equation: GRId=RCd/SNRd. The lowest drought resilience capacity was exhibited by farm La Victoria (GRId=0.66). The GRId for Media Luna was 0.93 (medium) and La China exhibited a high GRId (value 3.21) reflecting high resilience capacities (values above 1.5). The three farms are above the drought resilience threshold (GRId >0.5), evidencing that production systems under agroecological transition build resilience over time. In the three studied farms, the drought resilience capacity (RCd) is inverse to the sensitivity of natural resources (SNRd) of productive importance such as crops, animals, soil, water supply. Clearly results indicate that as resilience capabilities increase, sensitivity decreases (Figure 6).
5. Conclusions
The various methodologies presented herein offer useful tools for assessing the vulnerability of farming communities and their adaptive capacity which enables farmers and their farms to respond to climatic events. More importantly, the methodologies provide hints about principles and mechanisms that underlie why some farming systems resist and/or recover from droughts, storms, floods, or hurricanes. Such analysis offers opportunities for farmers to explore alternative insights into farm management strategies that enhance buffering capabilities in the short-term as well as long-term transformability and adaptation. The buffer capability is linked to the ability of farmers to mobilise resources and implement practices to maintain the farm through a disruption. Such capability of resisting small disturbances can comprise the initial phase of a broader strategy to cope with larger climatic shocks [23].
A common result from the evaluations is that although agroecological strategies such as crop diversification, maintaining local genetic diversity, animal integration, soil organic management (mulch, cover, organic matter addition, etc.), water conservation and harvesting reduce vulnerability and enhance adaptive capacity of farming systems, these practices by themselves are not sufficient to achieve resiliency. Social resilience must go hand in hand with ecological resiliency [24]. This is why the methodologies include indicators that assess the level of social organization, consolidation of networks, farming knowledge skills etc which conform key components of resiliency. The holistic risk index indicates that the level of vulnerability of farming communities depends on how well developed is their natural and social capital. Such capital when strengthened can then be mobilized at the community level in the form of agroecological interventions implemented through collective action.
The challenge is how to quickly disseminate the principles and practices that have allowed certain farm systems to resist climatic shocks, so that it can be widely applied to the restoration of agrolandscapes already affected by droughts and/or hurricanes or to prepare those rural areas that are most likely to be impacted by climate change. For this horizontal transfer to occur quickly, emphasis must be placed on directly involving farmers in the extension of innovations through farmer-to- farmer exchanges including field days, cross-visits, on farm demonstrations, short seminars or courses, etc. Such pedagogical activities aim at building capacity among farmers to be able to apply the methodologies (described above) to assess the level of resiliency of their farms, but also to train them to deploy agroecological interventions in order to enhance farms’ resistance to both drought and strong storms.
Although there is overwhelming evidence of the potential of agroecology to protect farmers against climatic extremes, it is important to recognize the limits of resilience. The ability of agroecosystems to adapt to climate change has limits delineated by certain thresholds, after which damages (crops destroyed by heavy winds or extreme drought, landslides, erosion gullies, etc.) may overwhelm farmers adaptation responses, especially when long droughts or severe storms lead to irreversible consequences [25]. In those situations, resource poor farmers may need additional assistance such as financial incentives for adopting agroecological practices (soil and water conservation, crop diversification, etc.) or for landscape restoration programs, technical assistance and crop insurance.
Author Contributions
Conceptualization, C. I. N. and M. A. A.; methodology, L. V., R. M., M. M., A.H., and I. G; investigation, A. S. R., L. V., R. M., M. M., A. H. and I. G.; writing—review and editing, C. I. N, M. A. A. and A. S. R.
Data Availability Statement
No new data were created or analyzed in this study. Data sharing is not applicable to this study.
Acknowledgments
Authors gratefully acknowledge the collaboration of participating farmers in Chile, Colombia, Cuba, Mexico and Uruguay.
References
- Challinor, A. J.; Watson, J. , Lobell, D. B.; Howden, S. M.; Smith, D. R.; & Chhetri, N. A meta-analysis of crop yield under climate change and adaptation. Nature climate change 2014, 4, 287–291. [Google Scholar] [CrossRef]
- Chakraborty, S. & Newton, A. C. Climate change, plant diseases and food security: an overview. Plant pathology 2011, 60, 2–14. [Google Scholar] [CrossRef]
- Anderson, R.; Bayer, P. E. & Edwards, D. Climate change and the need for agricultural adaptation. Current opinion in plant biology 2020, 56, 197–202. [Google Scholar] [CrossRef] [PubMed]
- Altieri, M. A.; Nicholls, C. I.; Henao, A. & Lana, M. A. Agroecology and the design of climate change-resilient farming systems. Agronomy for sustainable development 2015, 35, 869–890. [Google Scholar] [CrossRef]
- Carolina, Q.; Alejandra, A. & Nadine, A. Evidence of agroecology’s contribution to mitigation, adaptation, and resilience under climate variability and change in Latin America. Agroecology and Sustainable Food Systems 2024, 48, 228–252. [Google Scholar] [CrossRef]
- Dagunga, G.; Ayamga, M.; Laube, W.; Ansah, I. G. K.; Kornher, L. & Kotu, B. H. Agroecology and resilience of smallholder food security: a systematic review. Frontiers in Sustainable Food Systems 2023, 7, 1267630. [Google Scholar] [CrossRef]
- Lin, B.B. Resilience in agriculture through crop diversification: adaptive management for environmental change. Bioscience 2011, 61, 183–193. [Google Scholar] [CrossRef]
- Tittonell, P. Assessing resilience and adaptability in agroecological transitions. Agricultural systems 2020, 184, 102862. [Google Scholar] [CrossRef]
- Meuwissen, M. P.; Feindt, P. H.; Spiegel, A.; Termeer, C. J.; Mathijs, E.; De Mey, Y. . & Reidsma, P. A framework to assess the resilience of farming systems. Agricultural Systems 2019, 176, 102656. [Google Scholar] [CrossRef]
- Douxchamps, S.; Debevec, L.; Giordano, M. & Barron, J. Monitoring and evaluation of climate resilience for agricultural development–A review of currently available tools. World Development Perspectives 2017, 5, 10–23. [Google Scholar] [CrossRef]
- Dittmer, K. M.; Rose, S.; Snapp, S. S.; Kebede, Y.; Brickman, S.; Shelton, S. . & Wollenberg, E. Agroecology can promote climate change adaptation outcomes without compromising yield in smallholder systems. Environmental Management 2023, 72, 333–342. [Google Scholar] [CrossRef] [PubMed]
- Barrera, J. F.; Herrera, J. Gómez, J. Riesgo-vulnerabilidad hacia la broca del café bajo un enfoque de manejo holístico. In La broca del café en América tropical: hallazgos y enfoques, Barrera, J.F.; García, A., Ed.; Domínguez, V. & Luna, C. Sociedad Mexicana de Entomología y El Colegio de la Frontera Sur: México, 2007; pp. 131–141. [Google Scholar]
- Cabell, J. F. & Oelofse, M. An indicator framework for assessing agroecosystem resilience. Ecology and Society 2012, 17. [Google Scholar]
- Altieri, M. Construyendo resiliencia socio-ecológica en agroecosistemas: algunas consideraciones conceptuales y metodológicas. In Agroecología y resiliencia socioecológica: adaptándose al cambio climático, C. Nicholls, L. Osorio, and M. Altieri, Eds. Redagres. Medellín. Colombia 2013. pp. 94-104.
- Valdivia, C.; Seth, A.; Gilles, J. L.; García, M.; Jiménez, E.; Cusicanqui, J. ... & Yucra, E. Adapting to climate change in Andean ecosystems: Landscapes, capitals, and perceptions shaping rural livelihood strategies and linking knowledge systems. In Geography of climate change, Aspinall, R. Ed. Routledge, London, 2013; 1st Edition, pp. 94-10. [CrossRef]
- Machado-Vargas, M. M.; Nicholls-Estrada, C. I. & Ríos-Osorio, L.A. Resiliencia socioecológica de la pequeña producción de café de la cuenca del Río Porce, Antioquia, Colombia. Idesia (Arica) 2018, 36, 141–151. [Google Scholar] [CrossRef]
- Montalba, R.; García, M.; Altieri, M.; Fonseca, F. & Vieli, L. Utilización del Índice Holístico de Riesgo (IHR) como medida de resiliencia socioecológica a condiciones de escasez de recursos hídricos. Aplicación en comunidades campesinas e indígenas de la Araucanía, Chile. Agroecología 2013, 8, 63–70. [Google Scholar]
- Gazzano, I.; Altieri, M. A.; Achkar, M. & Burgueño, J. Holistic Risk Index: A Case Study of Cattle Producers in the Protected Area of Farrapos Estuaries—Uruguay. Agroecology and Sustainable Food Systems 2015, 39, 209–223. [Google Scholar] [CrossRef]
- Henao, A. H. Propuesta metodológica de medición de la resiliencia agroecológica en sistemas socio-ecológicos: Un estudio de caso en los Andes Colombianos. Agroecología 2013, 8, 85–91. [Google Scholar]
- Altieri, M. A. Developing and promoting agroecological innovations within country program strategies to address agroecosystem resilience in production landscapes: a guide. Berkeley, CA, 2016, University of California.
- Rogé, P.; Friedman, A. R.; Astier, M. & Altieri, M. A. Farmer strategies for dealing with climatic variability: a case study from the Mixteca Alta region of Oaxaca, Mexico. Agroecology and Sustainable Food Systems 2014, 38, 786–811. [Google Scholar] [CrossRef]
- Vázquez, L. , Aymerich, Y., Díaz, A., Peña, A., Cobas, R., Álvarez, E.,... & Rodríguez, M. Resiliencia a sequia sobre bases agroecológicas. Sistematización de un proceso de co-innovación participativa. Provincia de Guantánamo, Cuba 2016, Ed. OXFAM, Gobierno Belga, CITMA, ANAP. Guantánamo.
- Darnhofer, I. Resilience and why it matters for farm management. European Review of Agricultural Economics 2014, 41, 461–484. [Google Scholar] [CrossRef]
- Cretney, R. Resilience for whom? Emerging critical geographies of socio-ecological resilience. Geography compass 2014, 8, 627–640. [Google Scholar] [CrossRef]
- Altieri, M. A.; Nicholls, C. I.; Montalba, R.; Vieli, L. & Vazquez, L. L. Agroecology and the limits to resilience: Extending the adaptation capacity of agroecosystems to drought. Frontiers in Agronomy 2025, 7, 1534370. [Google Scholar] [CrossRef]
Figure 1.
A schematic representation of the relationship between threat, vulnerability and response capacity in the case of small farmers affected by drought in southern Chile.
Figure 1.
A schematic representation of the relationship between threat, vulnerability and response capacity in the case of small farmers affected by drought in southern Chile.
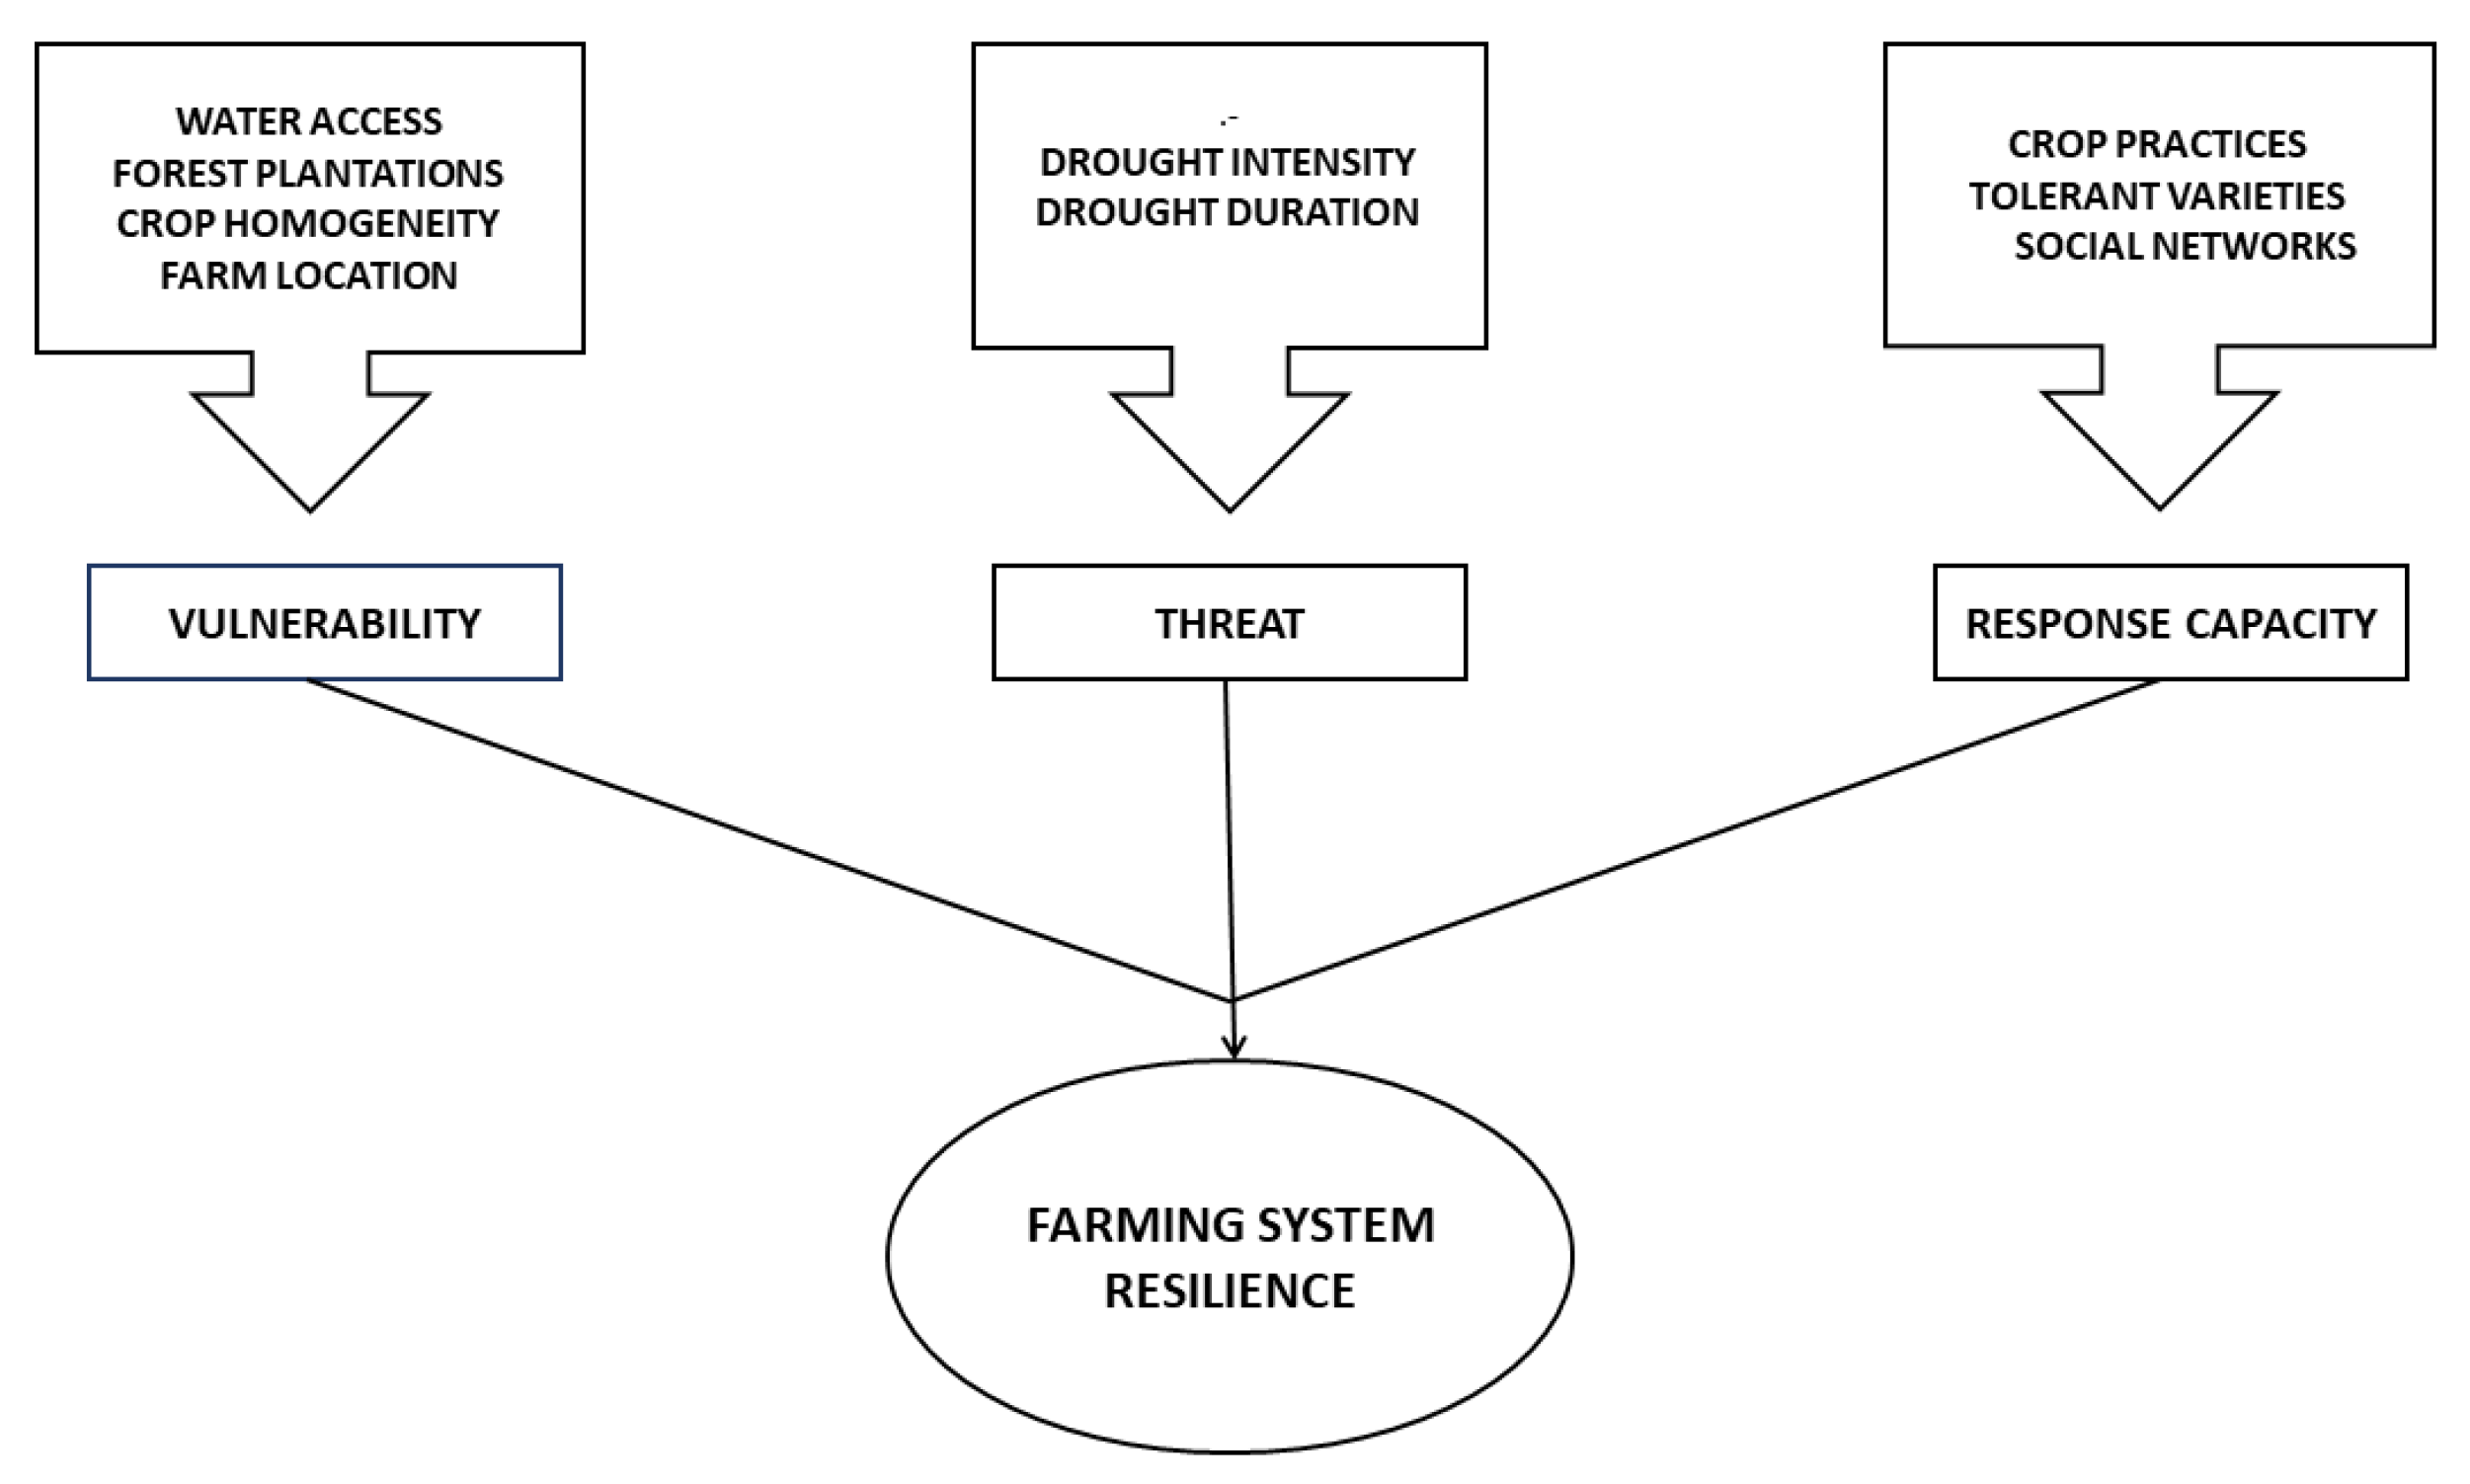
Figure 2.
Indicators used to estimate levels of vulnerability (first row) and drought response capacity (second row). In each plot, higher values indicate higher vulnerability or drought response capacity according to the indicator assessed. For each of these indicators, sampled farms were grouped by the cultural/ethnic origin of the farmers, based on self-identification [17].
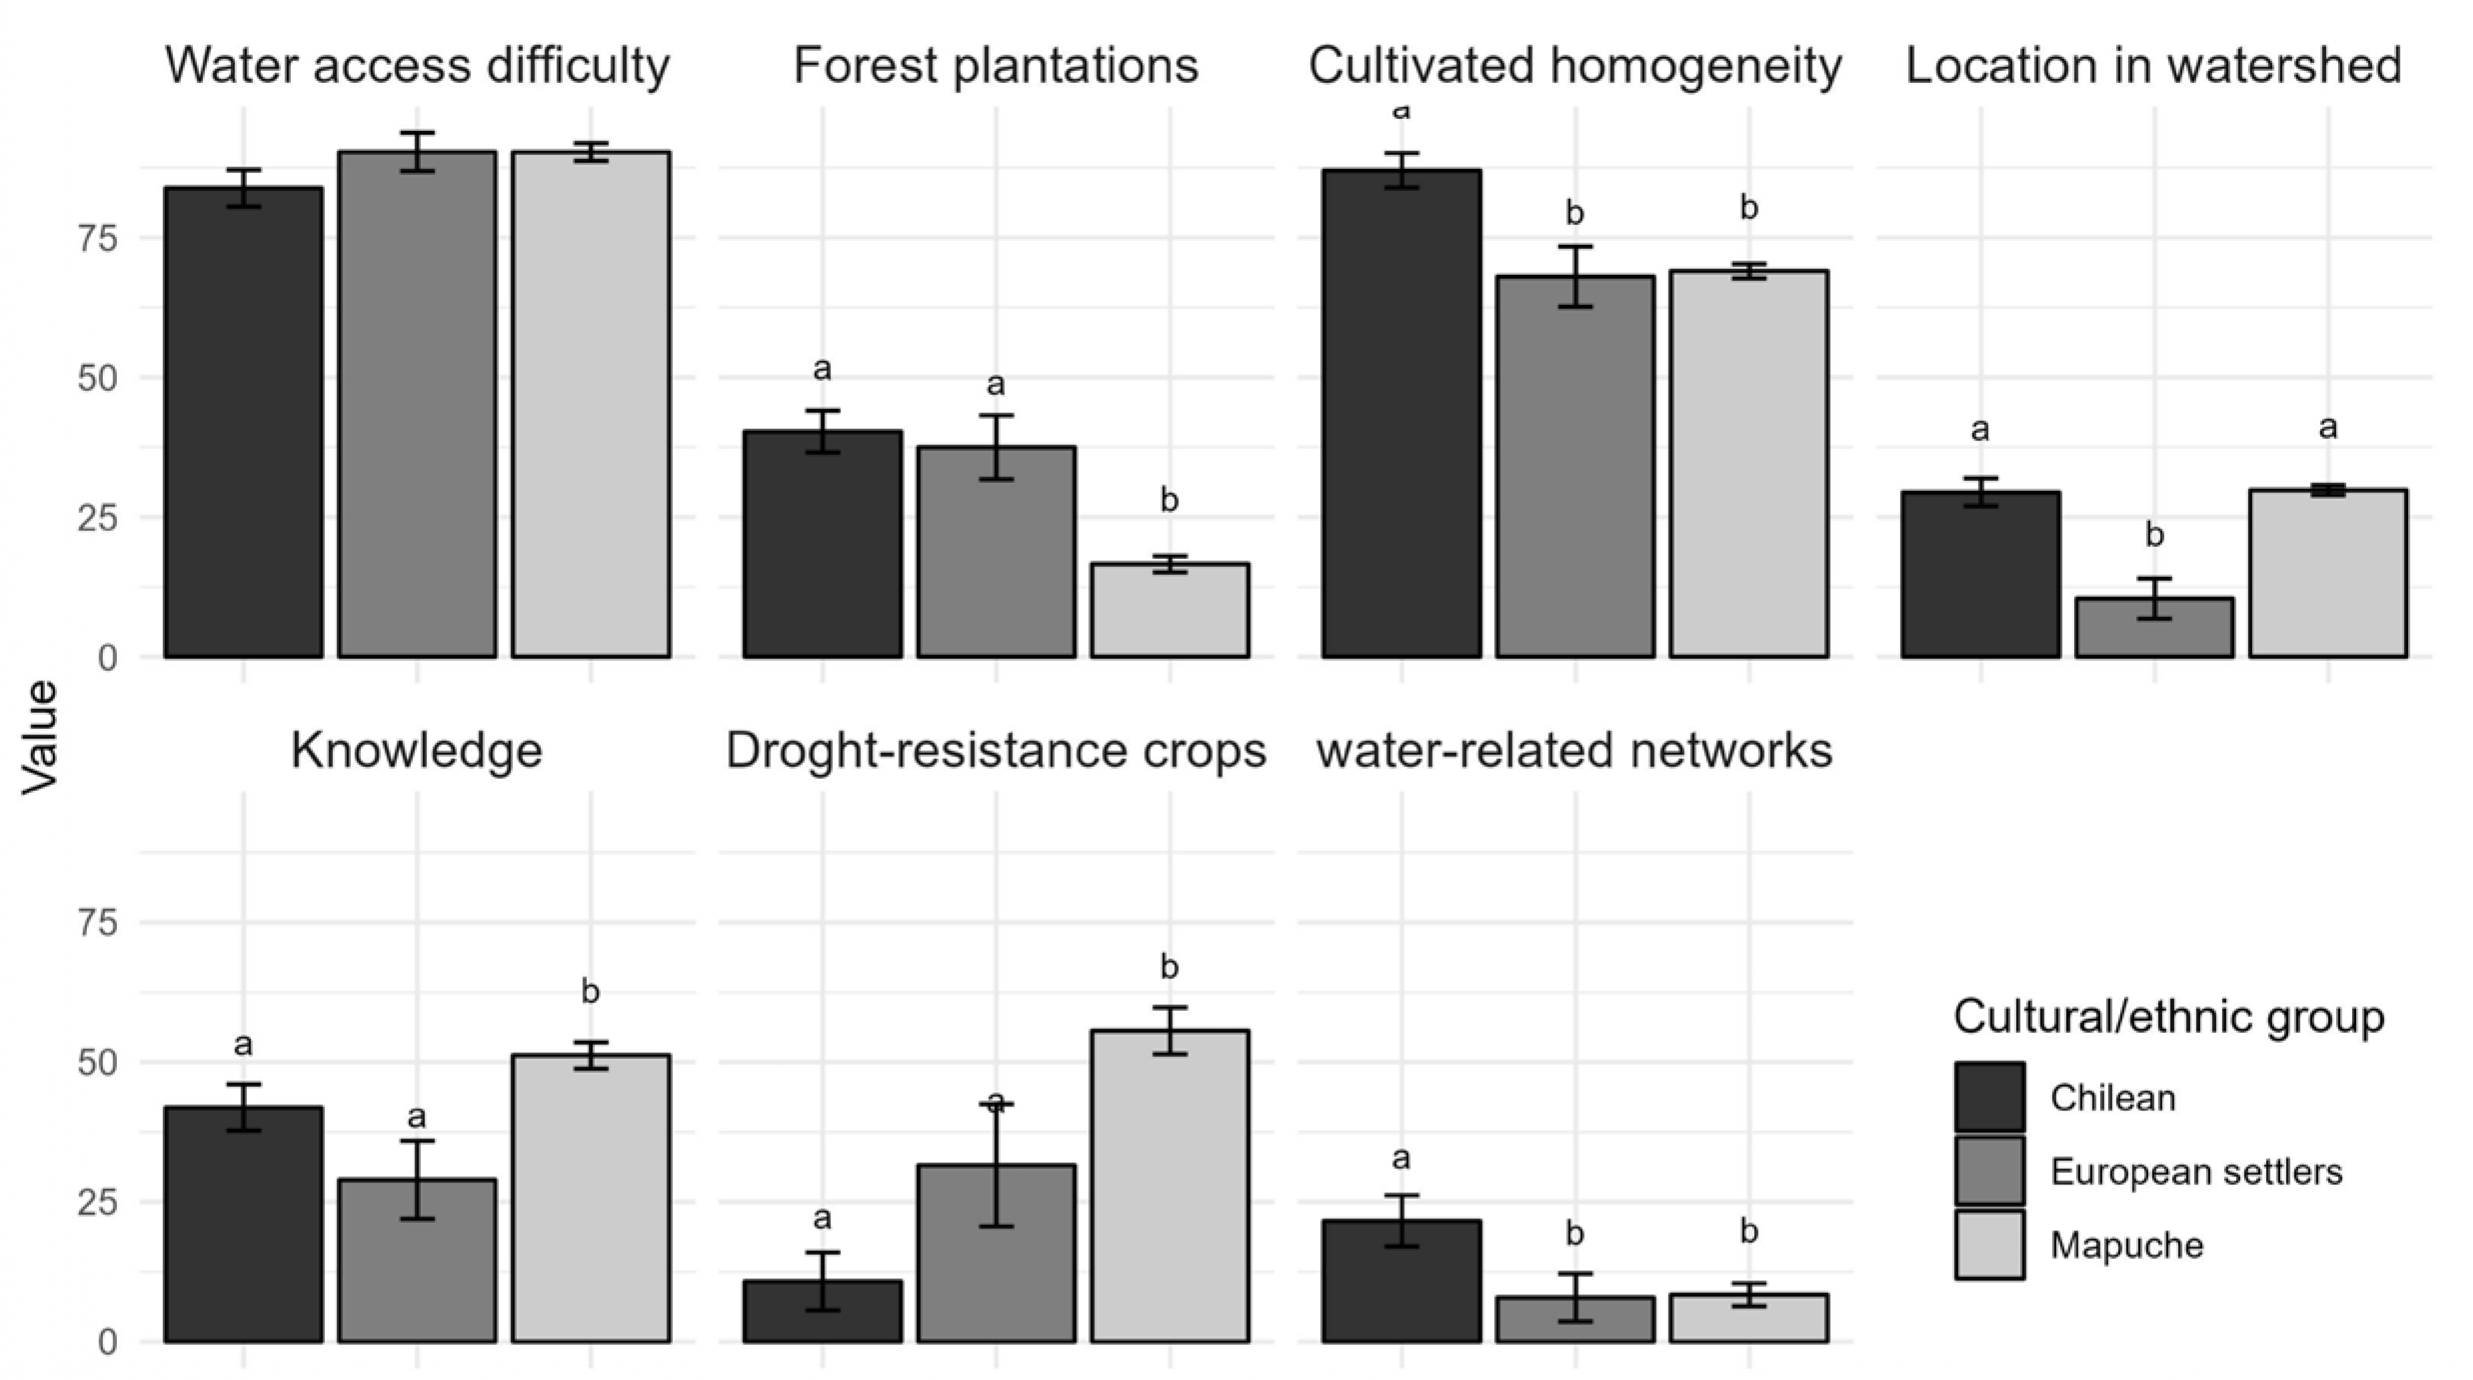
Figure 3.
a) An amoeba diagram showing vulnerability values of conventional(red) versus agroecological(green) farms in Antioquia, Colombia [19]. b) An amoeba diagram depicting response capacity values obtained from conventional (red) versus agroecological (green) farms in Antioquia, Colombia [19].
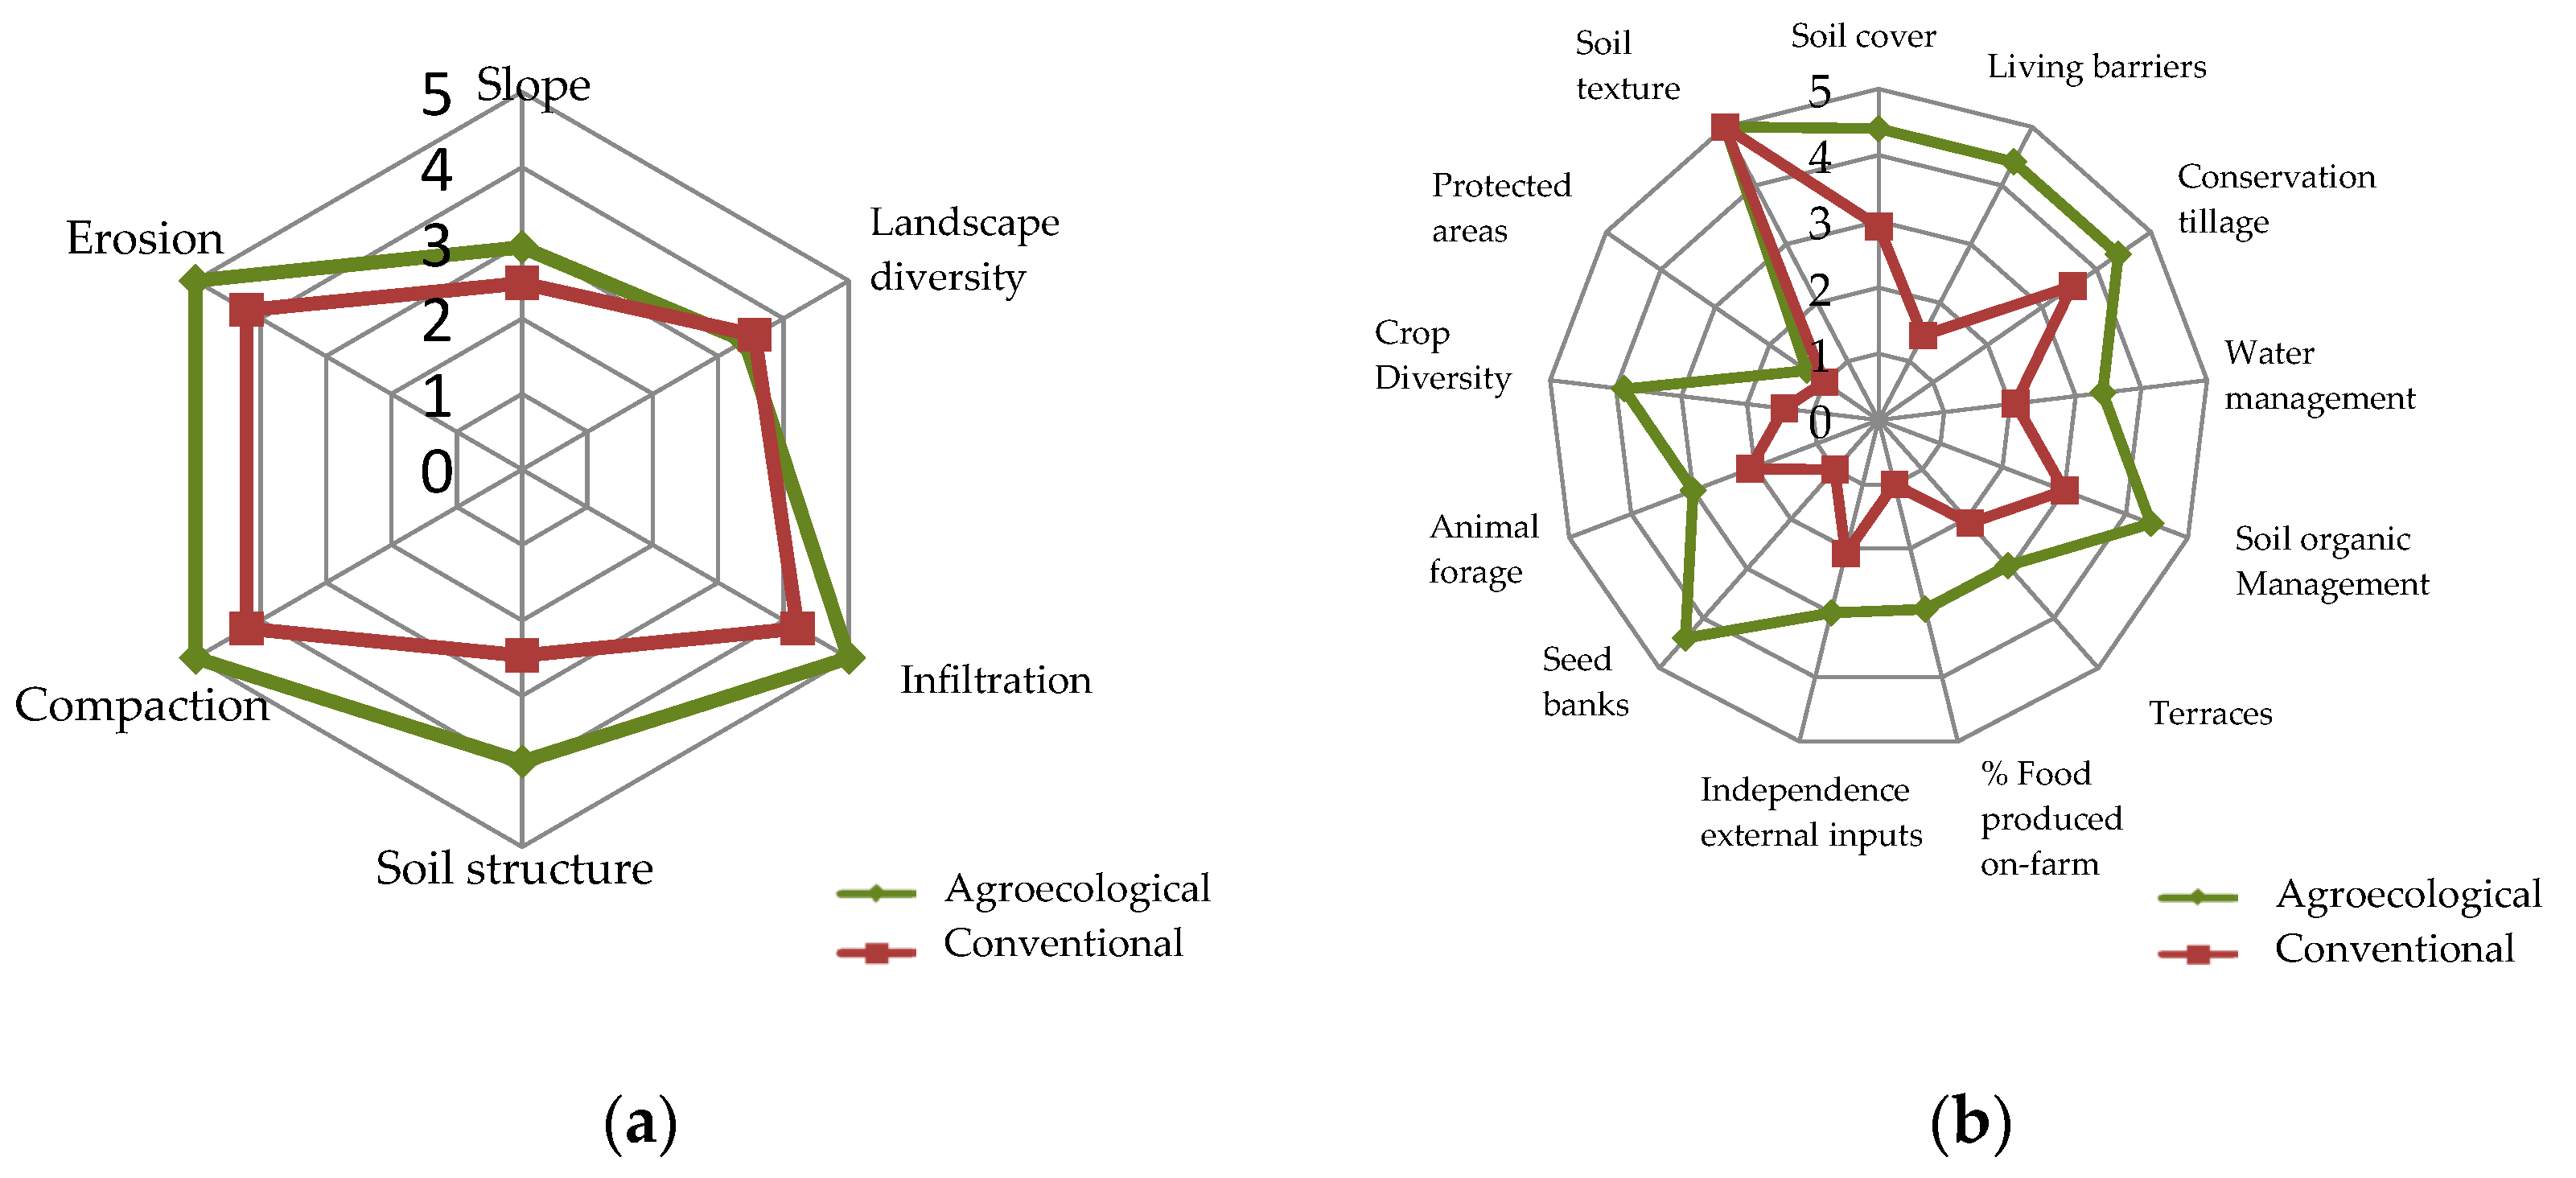
Figure 4.
A risk triangle showing the location of agroecological farms (green dots) and conventional farms (orange dots) in Antioquia along a gradient of vulnerability and of response capacity values [19].
Figure 4.
A risk triangle showing the location of agroecological farms (green dots) and conventional farms (orange dots) in Antioquia along a gradient of vulnerability and of response capacity values [19].
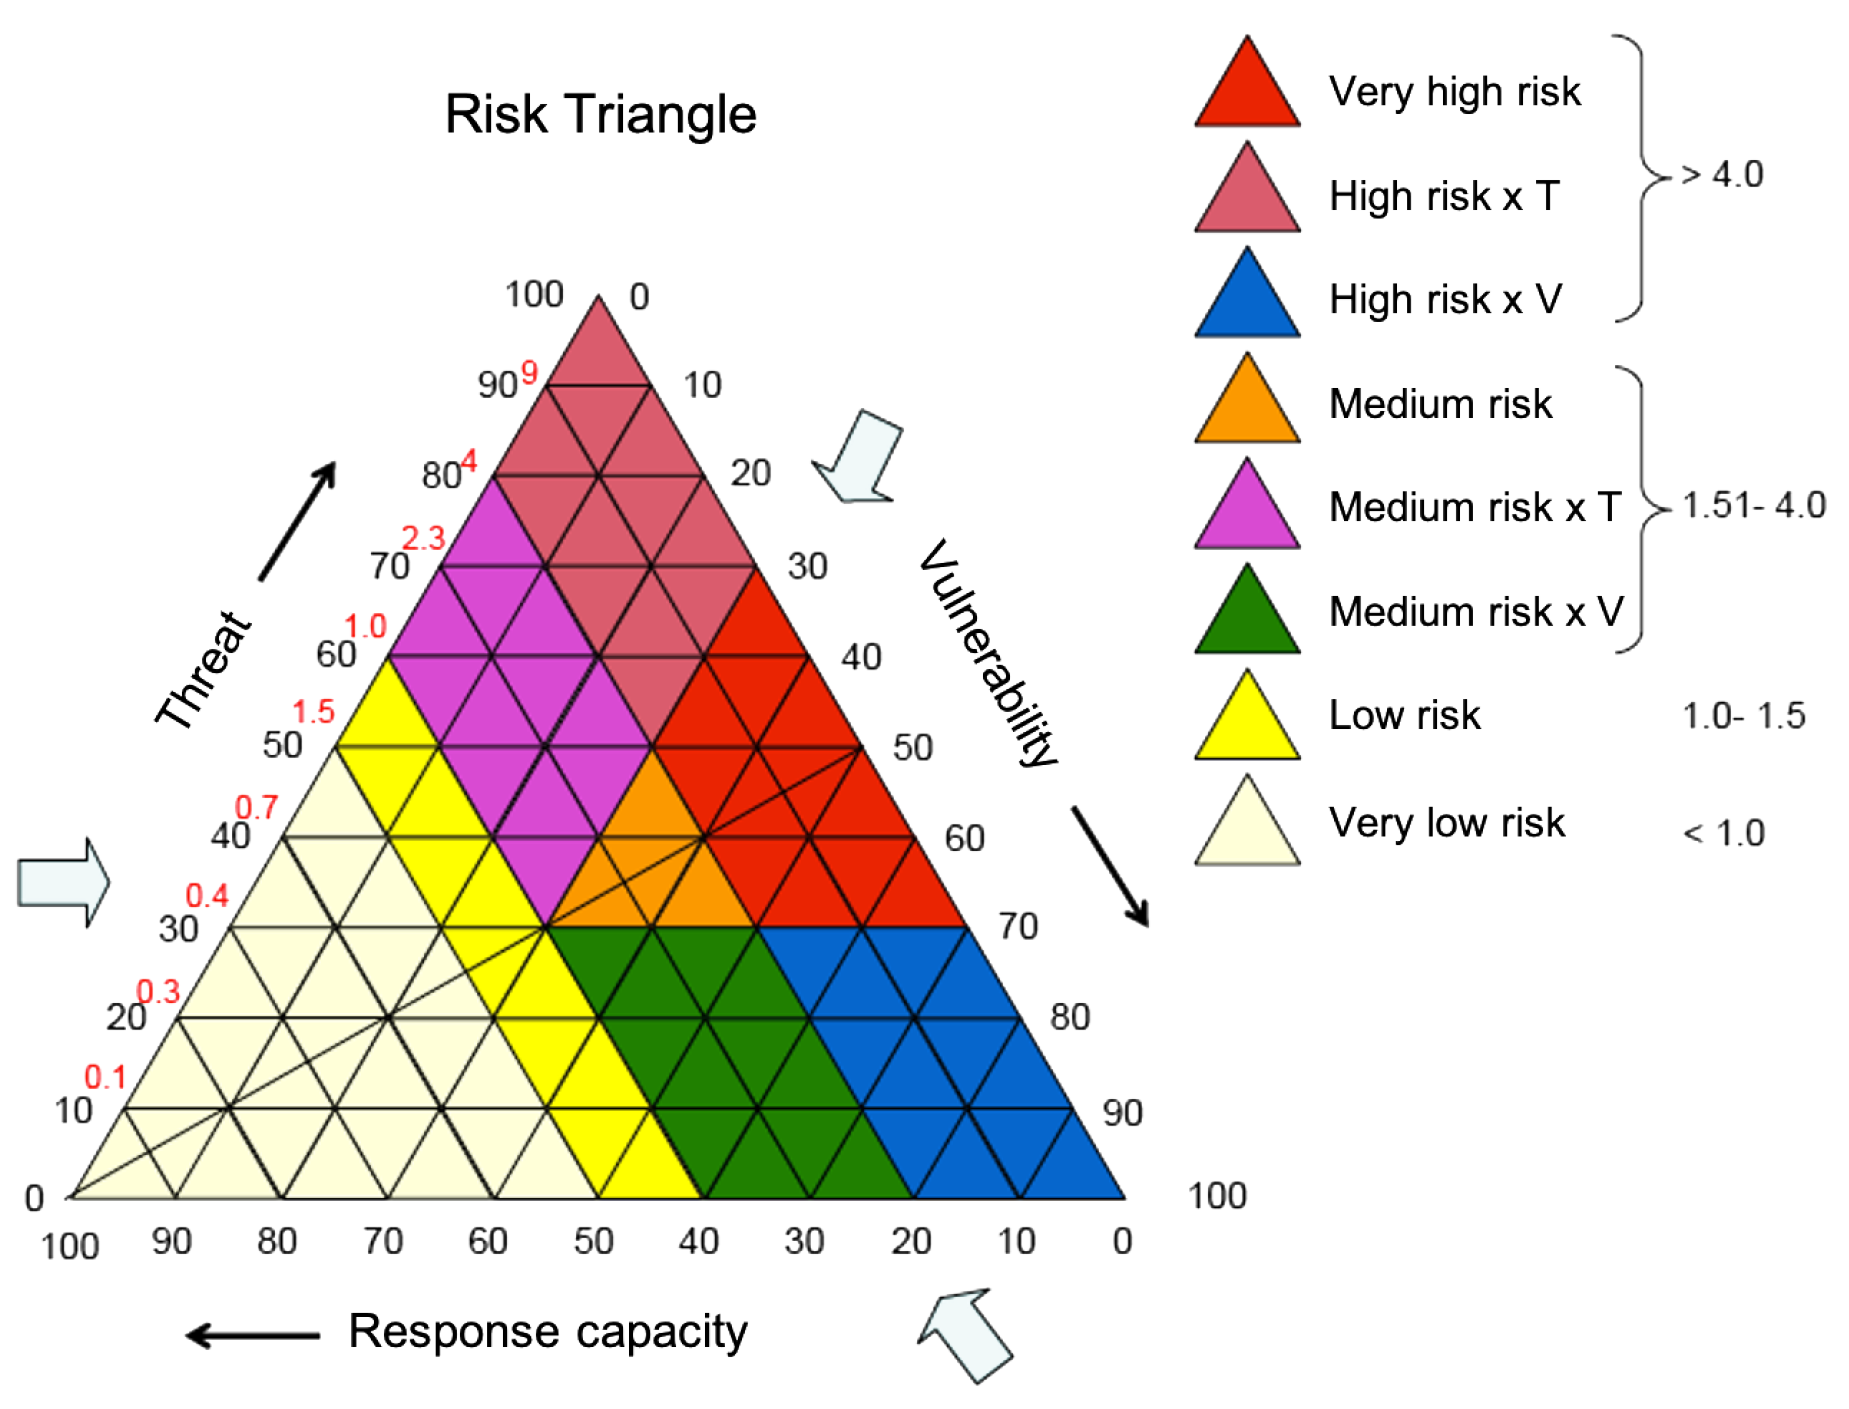
Figure 5.
Actual diagram done by Mixtecan farmers depicting scores (happy, neutral and sad faces) assigned to the perceived condition of landscape, farm management and soil quality indicators [21].
Figure 5.
Actual diagram done by Mixtecan farmers depicting scores (happy, neutral and sad faces) assigned to the perceived condition of landscape, farm management and soil quality indicators [21].
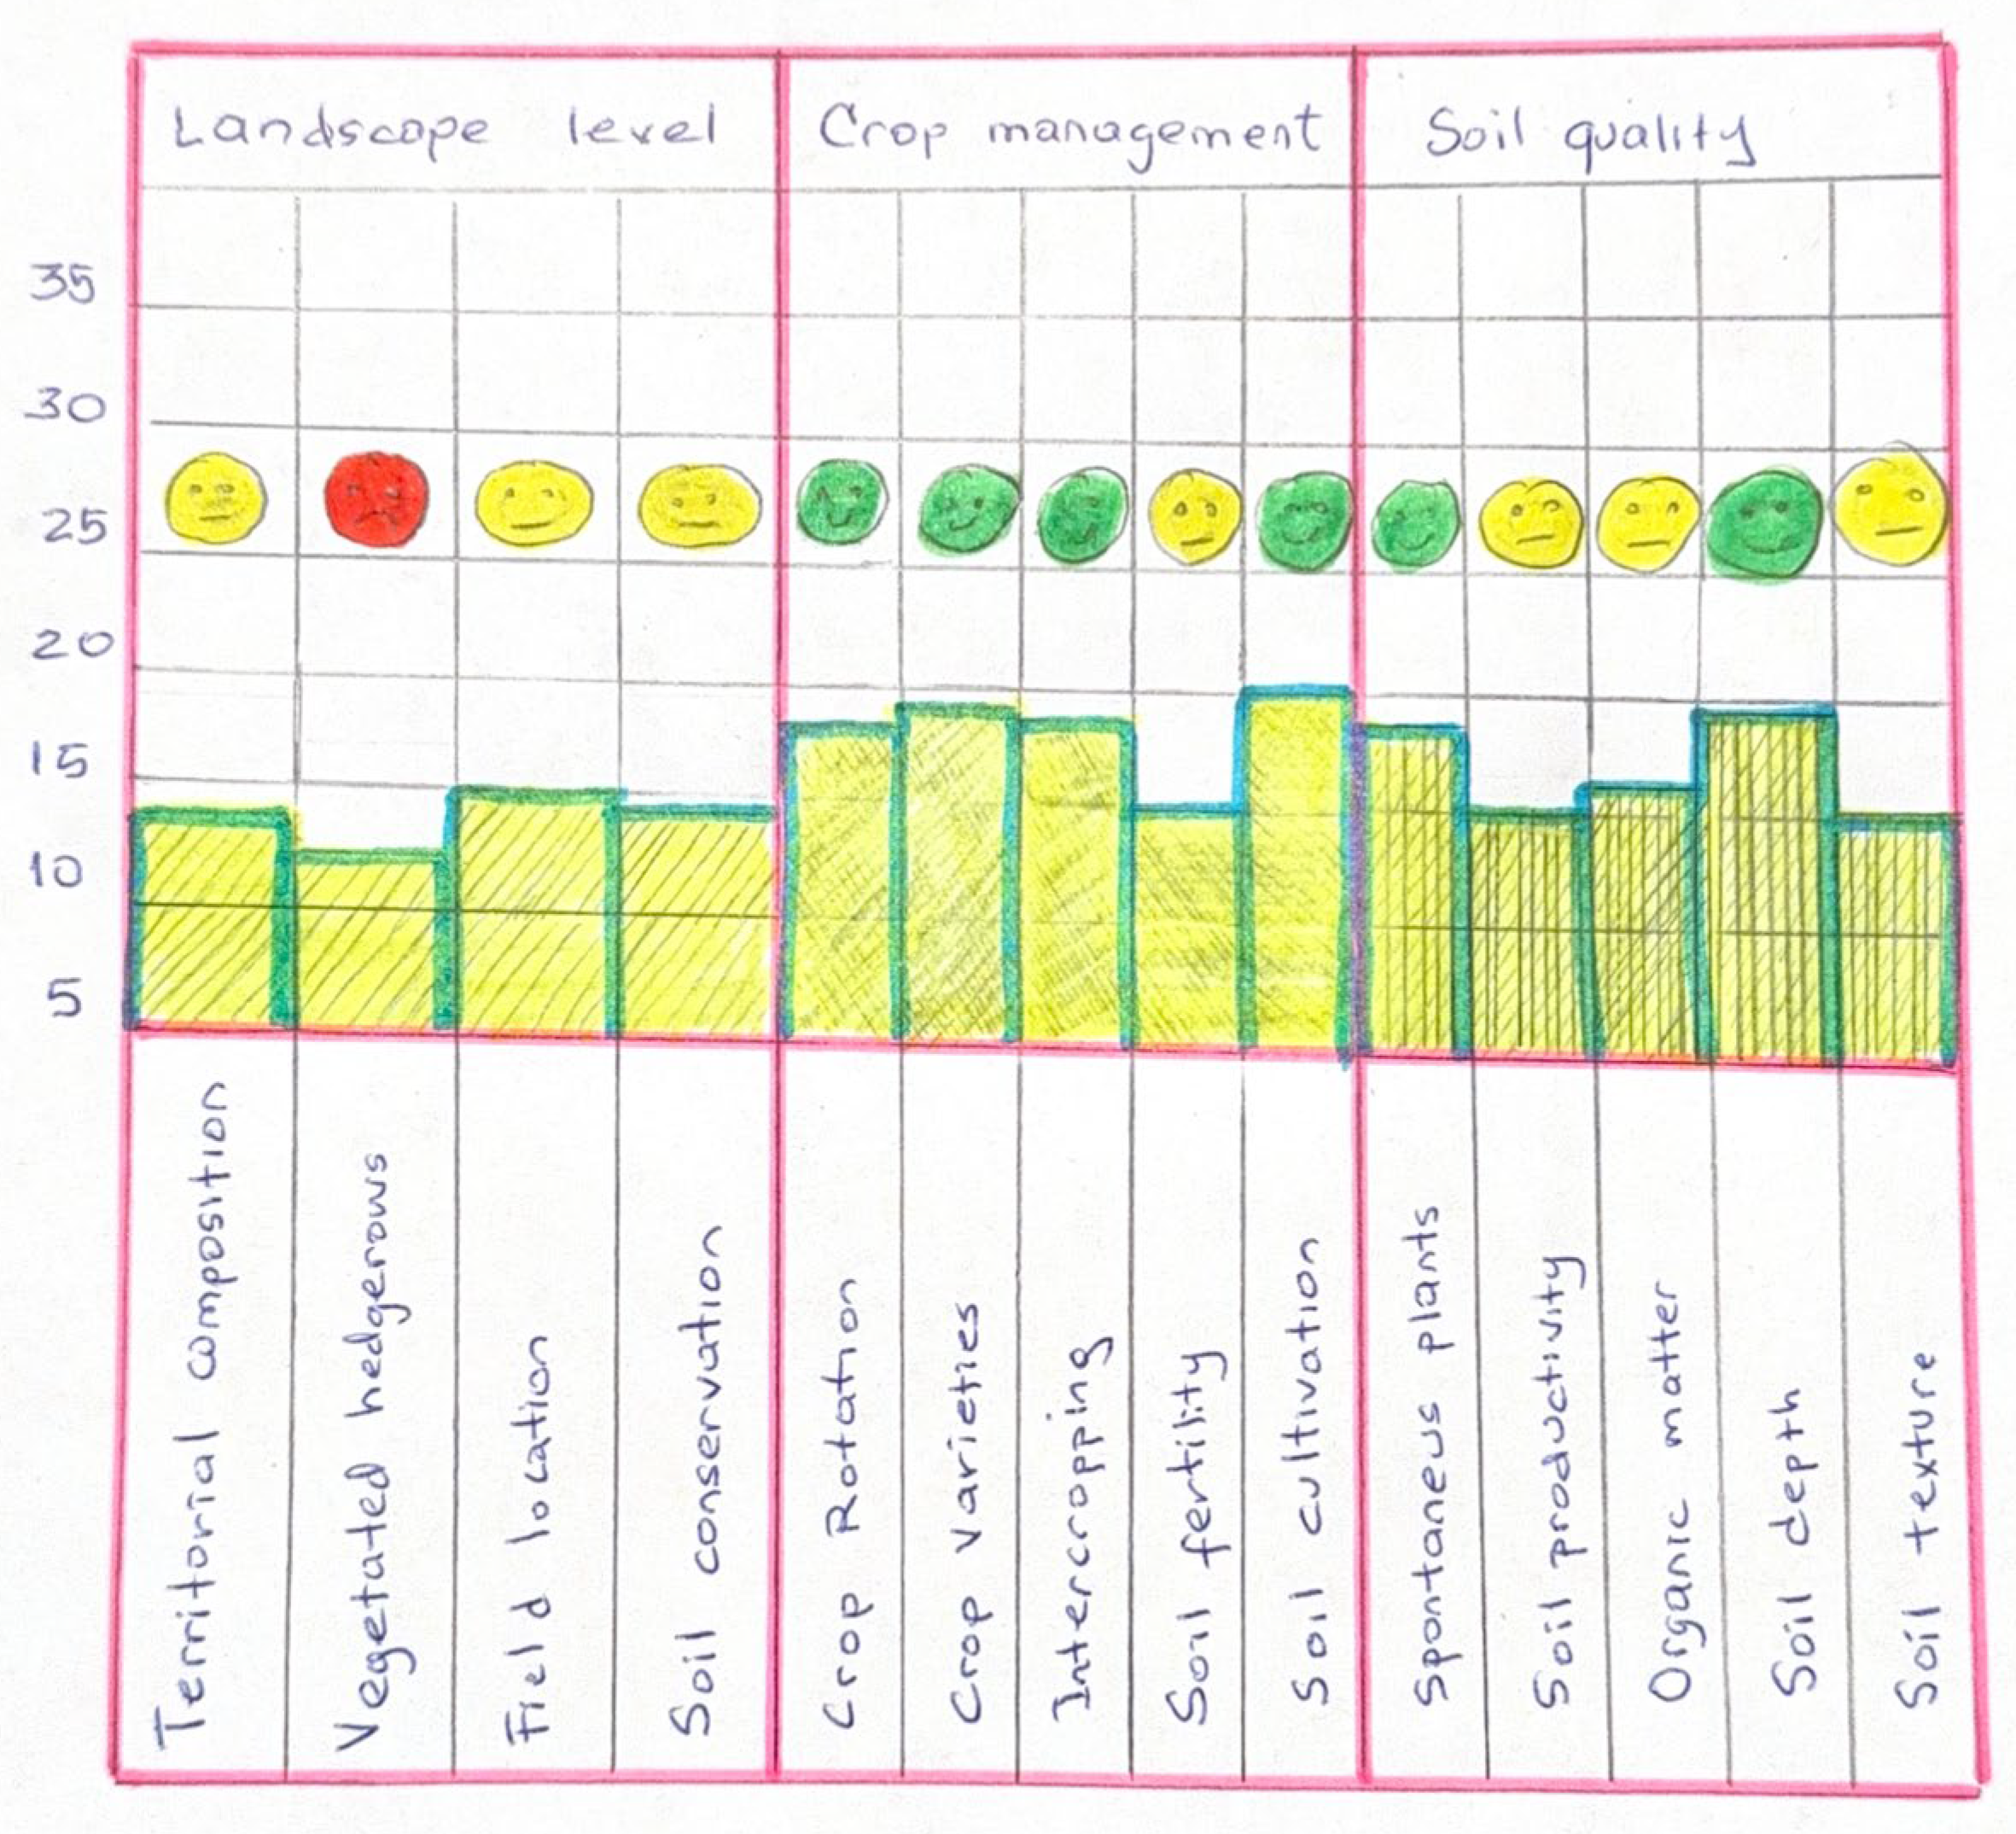
Figure 6.
Calculated indicator values of resistance-absorption, recovery and transformability from three farms in La Habana, Cuba with estimation of the General Drought Resiliency index for each farm [22].
Figure 6.
Calculated indicator values of resistance-absorption, recovery and transformability from three farms in La Habana, Cuba with estimation of the General Drought Resiliency index for each farm [22].
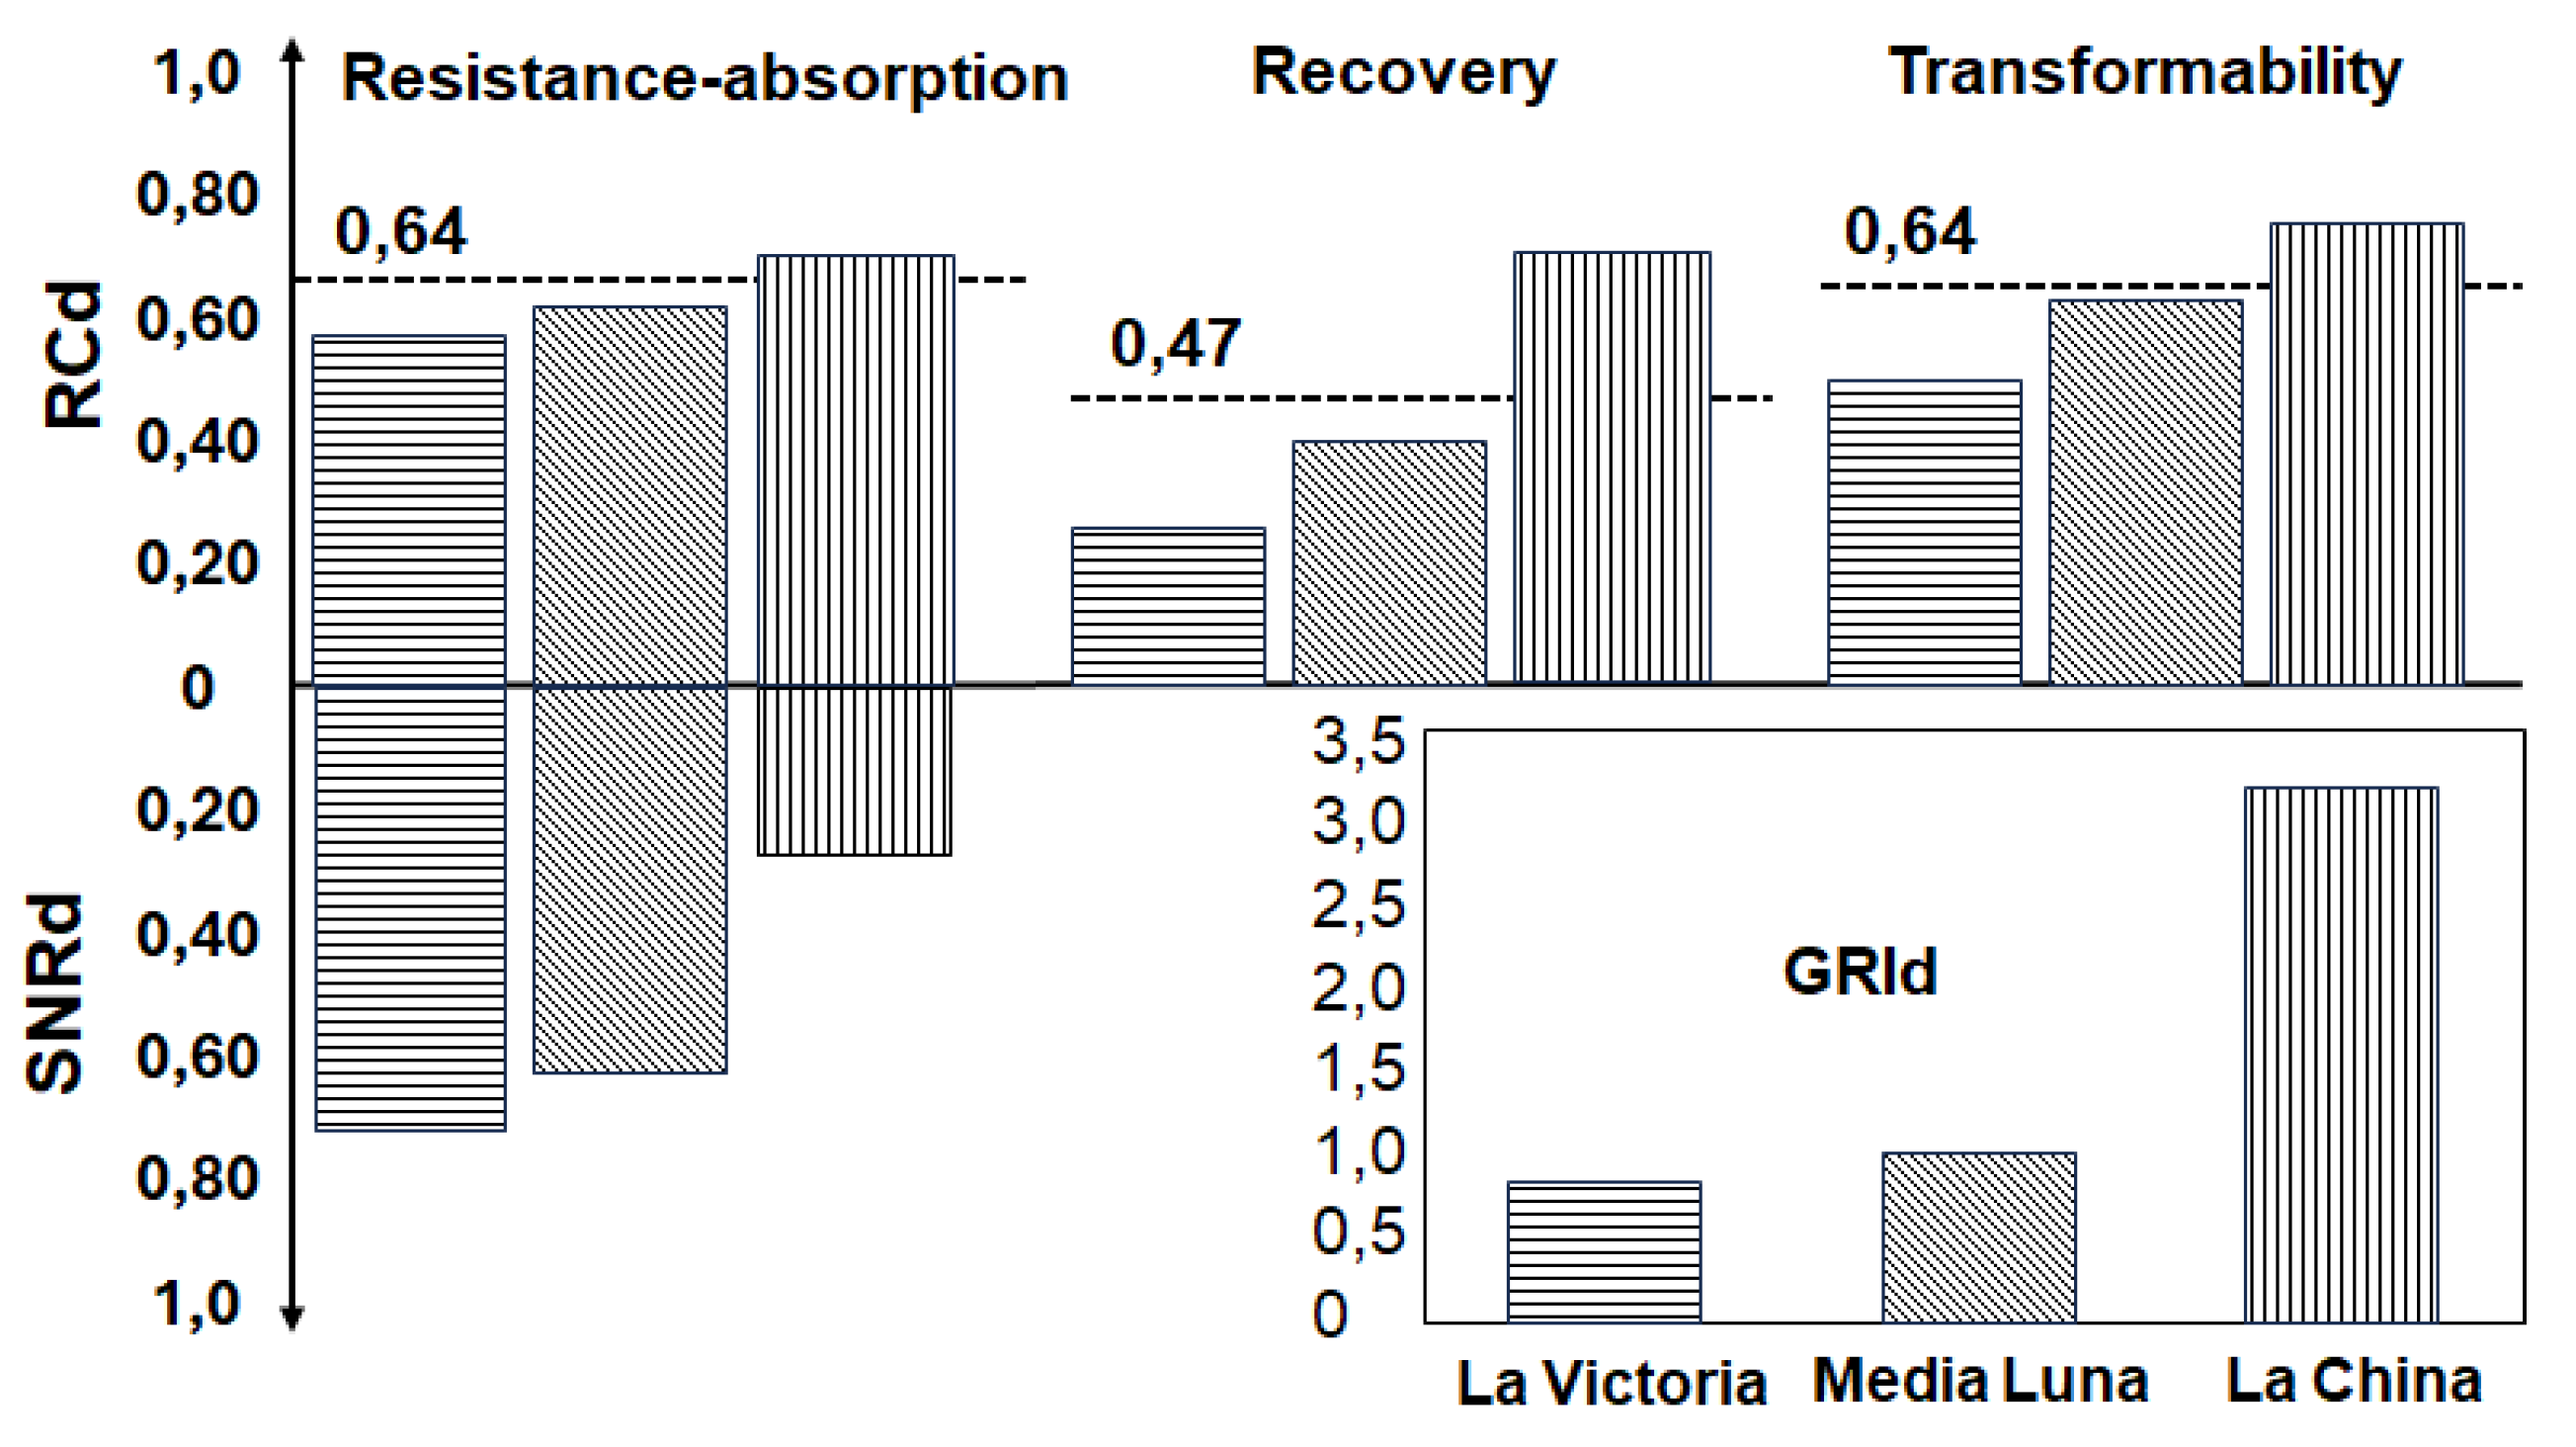

Table 1.
Vulnerability and response capacity scores and Holistic Risk Index of the nine farms selected in the Porce river basin, northeast of Antioquia [16].
Table 1.
Vulnerability and response capacity scores and Holistic Risk Index of the nine farms selected in the Porce river basin, northeast of Antioquia [16].
| FARM | A1 | A2 | A3 | A4 | A5 | A6 | A7 | A8 | A9 |
|---|---|---|---|---|---|---|---|---|---|
| Threat | 1 | 1 | 1 | 1 | 1 | 1 | 1 | 1 | 1 |
| Vulnerability | 2,60 | 2,20 | 2,80 | 2,00 | 1,60 | 1,60 | 2,80 | 1,40 | 1,80 |
| Response capacity |
2,17 | 2,25 | 1,67 | 1,75 | 2,42 | 1,83 | 1,58 | 2,75 | 2,75 |
| Risk Index (HRI)* | 1,66 | 1,42 | 2,28 | 1,71 | 1,08 | 1,42 | 2,40 | 0,87 | 1,02 |
Table 2.
Scale levels for HRI, risk level and resilience values derived from a survey of 25 livestock ranchers in the Farrapos Estuary, Uruguay [18].
Table 2.
Scale levels for HRI, risk level and resilience values derived from a survey of 25 livestock ranchers in the Farrapos Estuary, Uruguay [18].
| HRI Value | Risk Level | Resilience level |
|---|---|---|
| = o < 1 | Low | Very high |
| 2 a 3 | Medium | Medium |
| 4 | High | Low |
| = o> 5 | Very high | Very low |
Table 3.
Platform for Talamancan cacao farmers to score the condition of various indicators (red =high risk, yellow=medium risk and green little or no risk) [20].
Table 3.
Platform for Talamancan cacao farmers to score the condition of various indicators (red =high risk, yellow=medium risk and green little or no risk) [20].
| Indicator | CONDITION | ||
|---|---|---|---|
| Green (Optimum) |
Yellow (medium) |
Red (Low) |
|
| Landscape diversity | |||
| Slope | |||
| Slope exposure | |||
| Soil cover | |||
| Soil structure (infiltration capacity) | |||
| Species diversity | |||
| Root depth | |||
| Tree diameter at chest height | |||
| Soil conservation practices | |||
| Drainages | |||
| Living fences | |||
| Proximity to forest | |||
| Proximity to rivers | |||
| Protective hills | |||
| Food Self -sufficiency | |||
Disclaimer/Publisher’s Note: The statements, opinions and data contained in all publications are solely those of the individual author(s) and contributor(s) and not of MDPI and/or the editor(s). MDPI and/or the editor(s) disclaim responsibility for any injury to people or property resulting from any ideas, methods, instructions or products referred to in the content. |
© 2025 by the authors. Licensee MDPI, Basel, Switzerland. This article is an open access article distributed under the terms and conditions of the Creative Commons Attribution (CC BY) license (http://creativecommons.org/licenses/by/4.0/).
Copyright: This open access article is published under a Creative Commons CC BY 4.0 license, which permit the free download, distribution, and reuse, provided that the author and preprint are cited in any reuse.


