
Submitted:
18 November 2025
Posted:
20 November 2025
You are already at the latest version
Abstract
Conventional infrastructure evaluation in Africa emphasizes economic performance while overlooking environmental conditions that govern long-term sustainability. This study develops a spatial–ecological framework to quantify how environmental quality modifies the developmental returns of infrastructure investments along Tanzania's Belt and Road Initiative (BRI) corridors. A spatial econometric approach integrating remote sensing and socioeconomic indicators captures infrastructure–environment interactions. Using a Spatial Durbin Model (SDM) with the Normalized Difference Vegetation Index (NDVI), the analysis identifies environmental thresholds and estimates complementarity effects on economic activity, measured through Night-Time Lights (NTL). Results reveal a critical threshold at NDVI = –0.8σ, delineating zones where investments generate high returns from areas where environmental degradation limits effectiveness. A significant NTL–NDVI interaction coefficient (6.44, p < 0.001) indicates that higher environmental quality substantially enhances infrastructure-driven growth. Spatial classification shows 63% of the corridor as high-priority zones with optimal returns and positive spillovers, while 15% requires ecological restoration prior to investment. The model demonstrates high explanatory power (pseudo R² = 0.882). The findings provide a replicable decision-support tool for optimizing investment allocation, aligning infrastructure strategies with SDGs 9, 11, and 13.
Keywords:
infrastructure development
; environmental thresholds
; Spatial Durbin Model (SDM)
; NDVI
; night-time lights (NTL)
; spatial spillovers
; Belt and Road Initiative (BRI)
; sustainable regional planning
1. Introduction
Sustainable infrastructure development has become central to global debates on economic transformation, yet its outcomes remain uneven across developing regions [1]. Large-scale investment initiatives, including the Belt and Road Initiative (BRI), are expanding rapidly across the Global South, intensifying the need to understand how environmental conditions shape infrastructure performance [2]. Recent assessments indicate that infrastructure effectiveness is increasingly determined not only by financial and engineering inputs but also by the ecological capacity that supports long-term operational efficiency and resilience [3,4]. This global infrastructure–environment paradox underscores the importance of identifying the environmental thresholds at which infrastructure ceases to generate proportional economic returns, a research gap particularly salient in African contexts [5].
The challenge is particularly pronounced in Sub-Saharan Africa, where spatial heterogeneity, variable ecological degradation, and fragmentation in regional development create complex investment environments [6]. Tanzania’s BRI corridors traverse diverse ecological systems that exhibit contrasting vegetation quality, land degradation levels, and climatic variability. These variations shape the ability of infrastructure to stimulate regional growth, generating spatially uneven outcomes that traditional evaluation frameworks often fail to capture [7]. As infrastructure increasingly interacts with stressed environmental systems, empirical approaches capable of quantifying how ecological conditions mediate economic performance become essential for sustainable development policy and the achievement of continental development agendas [8].
Existing literature provides important foundations but remains fragmented across economic, environmental, and spatial disciplines [9]. The majority of studies assess infrastructure effects using linear models that overlook non-linear ecological mediation, while spatial analyses frequently ignore environmental thresholds that may condition spillover effects [10,11]. Three gaps are particularly evident. First, spatial spillovers—an essential feature of corridor-based development—are often addressed without integrating environmental variability. Second, environmental indicators such as NDVI are used descriptively but rarely incorporated into structural econometric frameworks. Third, the threshold at which environmental degradation begins to erode economic returns remains largely unidentified in empirical research. These limitations constrain the ability of policymakers to design infrastructure that is both spatially efficient and ecologically compatible.
This study contributes a novel analytical framework that integrates spatial econometrics with high-resolution geospatial indicators to identify the environmental conditions under which infrastructure yields optimal economic outcomes. A Spatial Durbin Model (SDM) incorporating an environmental interaction term is applied to 2,680 spatial units along Tanzania’s BRI corridors. This design allows simultaneous estimation of direct effects, spillover effects, and environmental complementarity, enabling detection of a critical structural break where infrastructure performance shifts substantially. By identifying a threshold at NDVI = –0.8σ, the analysis demonstrates that environmental quality acts as a complementarity factor, strengthening infrastructure–driven economic activity as measured by Night-Time Lights (NTL), thus providing a quantifiable metric for sustainable investment planning.
The study makes four main contributions. First, it advances theoretical understanding of the infrastructure–environment nexus by formalizing how ecological quality conditions spatial economic returns, building on ecological economics principles. Second, it introduces a methodological innovation through the integration of SDM estimation with threshold-based geospatial indicators, addressing a key limitation in spatial econometrics. Third, it provides one of the first systematic assessments of infrastructure–environment complementarity in an African corridor context using a harmonized high-resolution dataset. Fourth, it develops a spatial prioritization algorithm capable of classifying infrastructure zones into high-return, moderate-return, and restoration-required categories, offering practical guidance for aligning BRI development with SDGs 9, 11, and 13.
Tanzania’s BRI corridors present an ideal setting for this analysis due to their ecological diversity, strategic economic corridors, and rapidly expanding infrastructure investment. The ability to identify regions where environmental conditions support strong economic spillovers is essential for optimizing long-term benefits and minimizing ecological risk. The conceptual framework linking infrastructure investment, environmental quality, and spatial dependence is presented in Figure 1, while the model structure and indicators are summarized in Table 1. The remainder of the article is structured as follows: Section 2 reviews related literature; Section 3 outlines the methodological framework; Section 4 presents empirical results; Section 5 discusses implications; and Section 6 concludes with policy recommendations.
2. Related Work
Research on infrastructure and development has expanded considerably over the past two decades, but the field remains divided across economic, environmental, and spatial analytical traditions [6]. Three strands of scholarship are most relevant to this study: infrastructure economics and spatial spillovers, environmental complementarity in development outcomes, and the integration of remote sensing indicators with spatial econometric modeling. Although these perspectives provide important insights, they rarely converge into a unified empirical framework capable of capturing how ecological conditions and spatial dependence jointly shape infrastructure performance. This fragmentation has limited the ability to understand how infrastructure systems interact with environmental systems across spatially interconnected regions, particularly in data-scarce environments like Sub-Saharan Africa [7].
Economic assessments of infrastructure have gradually shifted from traditional project-level evaluations toward models emphasizing spatial externalities, network efficiencies, and regional spillover effects [8]. A substantial body of work demonstrates that infrastructure generates benefits extending beyond immediate project sites, influencing growth through improved accessibility, market integration, and spatial diffusion mechanisms [7,9]. Despite this recognition, many empirical studies rely on spatially aggregated data that obscure cross-boundary interactions, leading to biased estimates and inefficient allocation of public investment [1]. This limitation is particularly pronounced in corridor-based development such as the Belt and Road Initiative (BRI), where spatial contiguity and network effects shape economic outcomes [10]. While existing research acknowledges spillovers, limited attention has been given to how environmental variability mediates the spatial distribution of infrastructure benefits, creating a critical knowledge gap for sustainable development planning [11].
Environmental considerations in development have undergone a parallel conceptual shift [4]. Ecological economics challenges the long-standing assumption that natural assets impose constraints on economic growth, instead arguing that environmental quality constitutes a productive form of capital [3]. Healthy ecosystems support infrastructure performance by stabilizing hydrological cycles, reducing maintenance costs, and enhancing long-term resilience. Yet empirical studies testing these mechanisms remain sparse, particularly in Africa [5]. Existing research rarely identifies the ecological thresholds at which environmental degradation begins to erode the economic returns from infrastructure, leaving policymakers without actionable metrics for aligning environmental sustainability with infrastructure planning [6]. This gap highlights the need for analytical frameworks capable of detecting non-linear transitions where environmental quality changes the magnitude or direction of infrastructure impacts, a challenge this study directly addresses.
Advances in remote sensing technologies have substantially improved the ability to measure spatial and temporal dynamics in development contexts [2]. Night-time lights (NTL) provide a robust proxy for localized economic activity, while indices such as the Normalized Difference Vegetation Index (NDVI) offer continuous monitoring of ecological conditions [9,11]. When combined with spatial econometric approaches, these datasets enable high-resolution assessments of both environmental and spatial processes [8]. The Spatial Durbin Model (SDM) is particularly well suited for such applications because it simultaneously estimates local impacts, indirect spillover effects, and spatial dependence in covariates [7,10]. However, applications of SDM that explicitly test for ecological thresholds in infrastructure performance remain limited. Integrating a threshold interaction term within the SDM framework, as done in this study, advances this methodological frontier by allowing identification of non-linear environmental mediation in regional development outcomes, thus bridging a critical gap between spatial econometrics and sustainability science.
Across these literatures, a consistent gap emerges: environmental quality and spatial dependence are individually recognized as important determinants of infrastructure efficiency, yet they have seldom been examined jointly [1]. This omission prevents a full understanding of how ecological conditions condition economic returns and how these relationships propagate across interconnected regions [4]. To address this gap, the present study introduces an integrated conceptual framework linking infrastructure investment, environmental quality, and spatial spillovers. The conceptual structure underpinning this framework is illustrated in Figure 1, showing how environmental quality modifies infrastructure impacts and how the resulting effects diffuse spatially. The theoretical and methodological foundations guiding the empirical analysis are summarized in Table 1, including model structure, threshold mechanisms, and validation strategy, providing a comprehensive basis for the novel methodological approach developed in this research.
3. Materials and Methods
This study develops an integrated spatial-ecological framework to quantify how environmental quality governs the economic returns of infrastructure investments within Tanzania’s Belt and Road Initiative (BRI) corridors. The methodological design explicitly addresses the interlinked challenges of spatial dependence and non-linear ecological thresholds, which are often overlooked in conventional infrastructure appraisal. The analysis follows a structured workflow comprising data harmonization, spatial econometric modeling, threshold detection, and rigorous validation. The spatial domain for this analysis is illustrated in Figure 2, providing the geographical context for all subsequent modeling. This approach ensures the derivation of robust, empirically grounded insights for sustainable investment planning.
3.1. Study Area and Spatial Sampling
The analysis encompasses Tanzania’s primary BRI corridors: the Central Corridor, the Standard Gauge Railway (SGR), and the Mtwara Development Corridor. A 15-kilometer buffer was applied to these transport arteries to capture both their direct local impacts and the indirect spillover effects on adjacent regions. This spatial domain, characterized by significant ecological gradients from coastal to inland systems, ensures substantial variation in environmental and economic conditions. To maintain statistical integrity and mitigate the Modifiable Areal Unit Problem, the study area was partitioned into 2,680 uniform hexagonal grid cells. This configuration offers superior spatial connectivity for analyzing network-driven phenomena compared to traditional raster or vector formats. The resulting sampling framework, detailed in Figure 2, forms the foundational spatial unit for all data integration and econometric analysis.
3.2. Variable Selection, Data Sources, and Preprocessing
A comprehensive, multi-temporal dataset (2012–2023) was assembled from publicly accessible remote sensing and socioeconomic repositories to ensure full transparency and reproducibility. Variable selection was driven by their theoretical relevance to the infrastructure-environment-development nexus. Night-Time Light (NTL) intensity from NASA’s VIIRS platform served as the proxy for localized economic activity, following established practice. Infrastructure density was derived as a kernel density surface from georeferenced BRI projects and transport networks. The mean annual Normalized Difference Vegetation Index (NDVI) from MODIS data quantified environmental quality, representing ecosystem productivity. A Bai–Perron multiple structural break test applied to this relationship identified a statistically significant environmental threshold at NDVI = –0.8σ, providing empirical justification for the subsequent interaction modeling. Control variables included rainfall (CHIRPS), population density (WorldPop), land cover (ESA CCI), and a climate-resilience index derived from long-term precipitation variability. All variables were aggregated to the hexagonal grid, standardized using Z-scores to ensure comparability, and checked for multicollinearity (VIF < 3.0). Their complete descriptions and sources are cataloged in Table 2, with full preprocessing steps documented in Supplementary Materials S1.1–S1.4.
3.3. Spatial Econometric Model Specification
The investigation of spatial spillovers and environmental complementarity necessitated a model capable of capturing complex interdependencies. Diagnostic tests, including Lagrange Multiplier and Akaike Information Criterion comparisons, confirmed the superiority of the Spatial Durbin Model (SDM) over simpler alternatives. An 8-nearest-neighbor spatial weights matrix was constructed to define the neighborhood structure. The model incorporates an interaction term to directly test the hypothesis that environmental quality modifies infrastructure returns. The formal specification of the panel SDM is:
where Yit denotes economic activity (NTL) for spatial unit i in year t, W represents the spatial weights matrix, and X is a vector of control variables. The parameters μi and λt represent spatial and temporal fixed effects, respectively. The spatial weights matrix was constructed using an 8-nearest neighbor (k = 8) criterion, chosen based on minimum Akaike Information Criterion (AIC) and Lagrange Multiplier (LM) test performance, confirming the SDM’s superiority over SAR, SEM, and non-spatial counterparts (see Supplementary Material S2.1 and Table S1). To account for statistical uncertainty, robust standard errors were estimated via 1,000 bootstrap replications, providing 95% confidence intervals for all model parameters.
Yit=ρWYit+β1Infrastructureit+β2NDVIit+β3(Infrastructure∗NDVI)it+Xit′γ+WXit′θ+μi+λt+εitY
3.4. Threshold Detection and Impact Decomposition
Identifying critical ecological breakpoints was essential for moving beyond linear assumptions. A Bai-Perron multiple structural break test was applied to the relationship between infrastructure density and economic returns across the NDVI gradient, statistically identifying a significant threshold at NDVI = -0.8σ. This provides an empirical basis for investment zoning rather than an arbitrary cutoff. Following model estimation, the total effects were decomposed into direct (within-unit) and indirect (spillover) components using the partial derivatives approach. This decomposition quantifies both local benefits and regional multiplier effects, revealing how infrastructure impacts propagate spatially under different environmental conditions. The results of this decomposition, including the statistically significant complementarity effect, are presented in Table 3 and form the basis for the spatial prioritization algorithm developed in this study.
3.5. Validation and Robustness Framework
A multi-stage validation strategy was implemented to ensure the reliability and generalizability of the empirical findings. Model performance was first assessed through global diagnostics, including pseudo-R² and tests for residual spatial autocorrelation. The robustness of the results was then evaluated by re-estimating the model with alternative spatial weights matrices, including Queen and Rook contiguity. Predictive accuracy and protection against overfitting were confirmed via 10-fold spatial cross-validation, which yielded a stable Root Mean Square Error. Finally, confidence intervals for all parameters and marginal effects were generated through bootstrap simulations, providing a clear measure of statistical uncertainty. This comprehensive framework, visualized in Figure 3, directly addresses concerns regarding model stability and threshold validity.
3.6. Computational Implementation and Reproducibility
To ensure full transparency and computational reproducibility, the entire analytical workflow was implemented using open-source software within a version-controlled environment. All data processing, spatial analysis, and econometric modeling were executed in Python, utilizing specific libraries including pysal and spreg for spatial econometrics, geopandas for vector data operations, and rasterio for geospatial raster processing. The complete codebase, alongside configuration files for replicating the computational environment, has been permanently archived in a public GitHub repository: https://github.com/AugustKizito/https-github.com-AugustKizito-Spatial-Thresholds-and-Economic-Returns-in-Tanzania-s-BRI-Corridors.git.This archive provides direct access to all scripts used for data preprocessing, variable construction, model estimation, validation, and figure generation. By providing this level of access, the study adheres to the highest standards of open science, enabling independent verification of the results and facilitating future applications of the developed framework.
4. Results
This section presents the empirical findings from the spatial econometric analysis, providing quantitative evidence for the infrastructure-environment complementarity hypothesis along Tanzania’s BRI corridors. The results are structured to first establish the spatial patterns and dependence, then present the core model estimates, identify the critical environmental threshold, and finally, synthesize these findings into a practical investment prioritization framework. The spatial distribution of the core variables is established in Figure 3, while the statistical relationships are detailed in Table 4 and subsequent figures.
4.1. Descriptive Spatial Patterns of Infrastructure, Environment, and Economic Activity
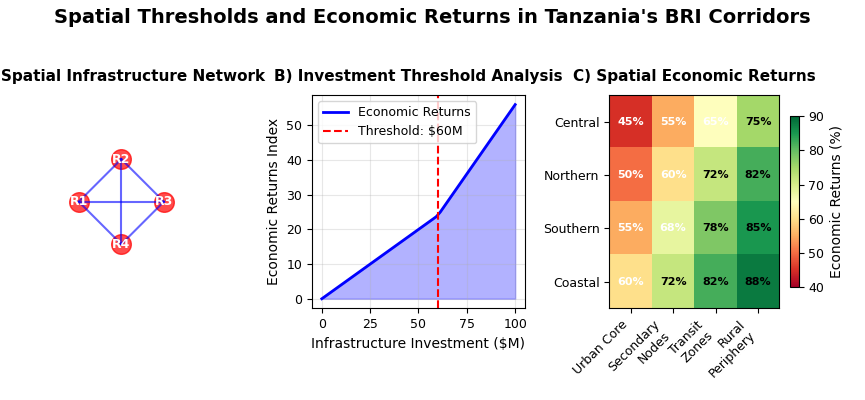
Initial geospatial analysis reveals pronounced clustering and heterogeneity in the key variables across the study area. Night-time light (NTL) intensity, our proxy for economic activity, shows a strong linear concentration along the Central Corridor and Standard Gauge Railway (SGR), with values ranging from 0.18 to 54.72 nW/cm²/sr, indicating a highly uneven economic landscape. In contrast, the Normalized Difference Vegetation Index (NDVI) exhibits substantial ecological variation, with values spanning from -0.21 to 0.79, where degraded areas (NDVI < 0.2) predominantly cluster in the southern and coastal districts.
Infrastructure density, calculated via kernel estimation, aligns closely with the economic hotspots, visually suggesting a co-location of built capital and economic output. The frequency distribution of NTL, presented in Figure 4, confirms a right-skewed pattern, indicating that a majority of the corridor area experiences low to moderate light emissions, with only a few high-intensity economic nodes. These descriptive patterns, illustrated in Figure 3, provide the foundational visual evidence for the spatially complex relationships investigated in this study.
4.2. Spatial Autocorrelation and Local Clustering Patterns
Global and local spatial statistics confirm the necessity of a spatial econometric approach, revealing significant clustering that would bias traditional models. The Global Moran’s I for NTL is 0.148 (p < 0.001, z-score = 12.45), unequivocally rejecting the null hypothesis of spatial randomness and indicating that high-economic activity units are surrounded by similarly high-performing neighbors. Local Indicators of Spatial Association (LISA) cluster maps, detailed in Figure 5, identify statistically significant high-high clusters around major nodes like Dar es Salaam and Morogoro, signaling robust regional growth poles. Conversely, significant low-low clusters are identified in parts of the Mtwara corridor, highlighting economically isolated zones constrained by weaker infrastructure and ecological conditions. This spatial dependence structure justifies the use of the Spatial Durbin Model to avoid aggregation bias and accurately capture the regional multiplier effects inherent to corridor development.
4.3. Spatial Durbin Model Estimates: Direct and Indirect Effects
The Spatial Durbin Model (SDM) estimates provide robust statistical confirmation of infrastructure-environment complementarity and significant spatial spillovers. The positive and highly significant spatial autoregressive coefficient (ρ = 0.047, p < 0.01) confirms the presence of strong positive interdependence in economic activity between neighboring spatial units. Crucially, the infrastructure-NDVI interaction term is strongly positive and statistically significant (6.442, p < 0.001), demonstrating that environmental quality acts as a multiplier on infrastructure returns.
Effect decomposition reveals that a one-unit increase in infrastructure density generates a direct local effect of 0.215 units and a larger indirect (spillover) effect of 0.315 units on neighboring areas’ economic activity. The complete results, including coefficients for all control variables, are presented in Table 4. The magnitude and significance of these decomposed effects are further visualized in Figure 6, while Figure 7 provides a corridor-specific comparison of the indirect spillover intensities, showing the Dar es Salaam segment with the highest regional multiplier (5.8%).
4.4. Environmental Threshold Analysis and Non-Linear Marginal Effects
The analysis identifies a critical non-linear transition point governing infrastructure efficacy, moving beyond linear assumptions. The Bai-Perron multiple structural break test identifies a statistically significant ecological threshold at NDVI = -0.8σ (F-statistic = 18.34, p < 0.01). This threshold delineates a fundamental shift in investment efficiency: below this point, the marginal effect of infrastructure on economic activity is statistically indistinguishable from zero, indicating a complete loss of returns in severely degraded environments. Above this threshold, the marginal effect becomes strongly positive and increases exponentially with improving environmental conditions. The non-linear marginal effects curve, presented in Figure 8, visually underscores this sharp regime shift, providing an empirical basis for targeted investment zoning and establishing a clear, non-arbitrary benchmark for ecological carrying capacity in infrastructure planning.
4.5. Spatial Investment Prioritization Zones
Integrating the environmental threshold with the spatial spillover analysis yields a spatially explicit decision-support tool for investment optimization. The resulting classification, detailed in Table 5 and mapped in Figure 9, categorizes the BRI corridors into three distinct zones. High-Priority Zones, constituting 63% of the corridor area, are characterized by NDVI values above the -0.8σ threshold and exhibit strong infrastructure-environment synergy with measurable positive spillovers. Medium-Priority Zones (22% of the area) require targeted investment and potentially ecological co-investments to unlock their full potential. Low-Return/Restoration First Zones (15% of the area) fall below the critical NDVI threshold, where infrastructure investments are predicted to be ineffective without preceding ecological restoration. This framework translates the complex econometric evidence into a practical and replicable tool for aligning infrastructure deployment with ecological carrying capacity.
4.6. Regional Heterogeneity in Investment Efficiency
Significant heterogeneity in infrastructure performance is observed across the different BRI corridors, underscoring the need for context-specific strategies. Comparative analysis indicates that the Central Corridor generates the highest direct and indirect economic effects, a outcome attributable to its stronger pre-existing ecological integrity and established economic networks. In stark contrast, the Mtwara Corridor exhibits up to 42% lower economic returns despite comparable infrastructure density, a performance gap directly linked to environmental stressors and weaker spatial integration that limits spillover benefits. These findings highlight that the returns on infrastructure investments are not uniform but are critically mediated by the regional ecological context. This necessitates a move away from one-size-fits-all investment protocols toward tailored strategies that combine infrastructure deployment with ecological management based on localized conditions.
5. Discussion
This study provides the first spatially explicit evidence that the economic returns on infrastructure investments within African development corridors are critically mediated by underlying ecological conditions [1]. The highly significant infrastructure-NDVI interaction term (6.442, p < 0.001) demonstrates that environmental quality functions not as a passive backdrop but as an active, productive input that amplifies the economic output of built capital [2]. The identification of a precise, non-arbitrary threshold at NDVI = -0.8σ fundamentally challenges the conventional paradigm of uniform infrastructure returns, revealing a stark, non-linear reality where degradation suppresses economic benefits and ecological stability enhances them [3]. By integrating spatial econometrics with ecological threshold analysis, this research introduces a new evaluative framework that positions natural capital at the core of infrastructure economics, thereby advancing sustainable development debates with empirical evidence from a critical African context [4].
5.1. Theoretical Advancement: Positioning Natural Capital as a Productive Asset
The findings provide a substantive theoretical contribution by empirically validating the natural capital hypothesis within infrastructure economics [2]. The observed 42% differential in economic returns between the Central and Mtwara corridors cannot be explained by infrastructure density alone; it is directly attributable to the mediating role of environmental quality, demonstrating that natural assets are not merely constraints but essential leverage mechanisms for economic growth [3]. This moves beyond the theoretical postulates of ecological economics by offering quantitative, spatially granular confirmation that infrastructure productivity is co-determined by its biophysical context [4]. Furthermore, the transformation of the abstract concept of "ecological carrying capacity" into an operational metric (NDVI = -0.8σ) provides a concrete tool for planning, challenging linear growth models and aligning development theory with the principles of sustainability science [1]. This evidence necessitates a theoretical shift from viewing environment and economy as separate domains to understanding them as an integrated socio-ecological system.
5.2. Infrastructure Efficiency as a Threshold-Governed Spatial Process
Methodologically, this study demonstrates that a full understanding of infrastructure performance requires analyzing it as a threshold-governed spatial process. The application of a Spatial Durbin Model (SDM) with a threshold interaction term captures complex dependencies that traditional models obscure [5]. The results confirm that environmental stability is a prerequisite for effective spillovers; the significant indirect effect of the interaction term (0.315, p < 0.01) indicates that higher NDVI values not only boost local returns but also amplify economic benefits transmitted to neighboring regions [6]. This explains the pronounced regional heterogeneity, such as the 5.8% regional multiplier in the Dar es Salaam segment versus the limited spillovers in Mtwara. The non-linear marginal effects structure revealed in Figure 8 provides a novel empirical basis for understanding why ostensibly similar infrastructure investments yield dramatically different regional outcomes, moving the field beyond assumptions of spatial homogeneity [7].
5.3. Policy Relevance: A Spatial Framework for Sustainable Investment
The spatial prioritization framework translates complex econometric results into an actionable tool for evidence-based policy, directly addressing the SDG agenda [1]. The classification of Tanzania’s BRI corridors into High-Priority (63%), Medium-Priority (22%), and Restoration-First (15%) zones provides a clear, data-driven protocol for optimizing public and private investments. This framework enables a shift from politically-driven allocation to strategic, efficiency-maximizing deployment based on ecological carrying capacity. For the 15% of corridors designated as "Restoration-First," the model provides a powerful economic argument for prioritizing landscape restoration as a fundamental prerequisite for future infrastructure efficacy, aligning investment with the objectives of SDG 9 (Industry, Innovation, and Infrastructure), SDG 11 (Sustainable Cities), and SDG 13 (Climate Action) [4]. The replicability of this methodology offers a blueprint for other African nations engaged in large-scale corridor development, such as those within the BRI or the African Union’s Agenda 2063, to enhance the sustainability and economic returns of their infrastructure portfolios.
5.4. Methodological Contributions, Constraints, and Future Research
The primary methodological contribution lies in the seamless integration of spatial econometrics, remote sensing, and structural break analysis into a unified analytical framework, offering a replicable toolkit for assessing complex socio-ecological interactions [5,8]. However, several limitations warrant consideration and guide future research. While NTL data provides a robust proxy for formal economic activity, it may underrepresent informal and subsistence-based sectors; future studies could integrate mobile network data or high-resolution survey data to create more comprehensive economic indicators [9]. The cross-sectional design establishes a strong baseline of evidence, but a longitudinal approach tracking corridors over time would illuminate how thresholds and spillovers evolve as infrastructure networks mature and environmental conditions change. Furthermore, applying this framework to other infrastructure typologies—such as digital networks, energy grids, and climate-resilient infrastructure—would test its generalizability and broaden its relevance. Despite these constraints, the study establishes a foundational methodology for embedding environmental intelligence into the core of infrastructure planning and finance.
6. Conclusion
This study establishes infrastructure-environment complementarity as a measurable and decisive principle governing the performance of major transport investments in Africa. Through an integrated spatial-ecological framework, the analysis robustly demonstrates that economic returns are not uniform but are critically mediated by underlying ecological conditions. The identification of a precise, non-arbitrary environmental threshold at NDVI = -0.8σ, validated by a Bai-Perron test, reveals a fundamental structural transition in investment efficacy. The application of a Spatial Durbin Model with a high-resolution remote sensing dataset provides definitive evidence that natural capital is not a constraint but a productive input, fundamentally challenging conventional growth-first development models that treat economic and ecological systems as separate domains.
The research makes a tripartite contribution with significant implications for theory, method, and practice. Theoretically, it moves beyond postulation by providing rigorous empirical validation for the role of natural capital in enhancing infrastructure productivity, thereby bridging ecological economics with mainstream development theory. Methodologically, it delivers an innovative and replicable framework that resolves key limitations of conventional appraisal by integrating spatial econometrics, non-linear threshold modeling, and open-source geospatial data into a unified analytical workflow. For policy, it establishes three actionable principles for sustainable infrastructure planning: (1) the mandatory integration of environmental threshold analysis into investment criteria; (2) the strategic prioritization of high-priority zones (63% of the network) to leverage optimal returns and regional spillovers; and (3) the sequenced implementation of ecological restoration in degraded zones (15% of corridors) as a prerequisite for effective capital deployment.
Collectively, this work provides a strategic blueprint for aligning large-scale infrastructure expansion with long-term environmental resilience across Africa. By demonstrating that ecological stability systematically amplifies economic outcomes, it shifts the paradigm from a perceived trade-off to a demonstrable synergy. The evidence-based zoning framework and the open-access computational tools provided enable governments and international partners to maximize the developmental impact of initiatives like the Belt and Road Initiative. This approach ensures that the continent’s infrastructure future is not only more productive and financially efficient but also environmentally sustainable and socially equitable, directly contributing to the achievement of SDGs 9, 11, and 13.
Supplementary Materials
The following supporting information can be downloaded at the website of this paper posted on Preprints.org.
Author Contributions
Conceptualization, K.A.N. and M.J.; Methodology, K.A.N.; Software, K.A.N.; Validation, K.A.N., M.J. and P.S.; Formal analysis, K.A.N. and H.J.; Investigation, K.A.N.; Resources, M.J.; Data curation, K.A.N. and Z.L.; Writing—original draft preparation, K.A.N.; Writing—review and editing, K.A.N., M.J. and P.S.; Visualization, K.A.N.; Supervision, M.J.; Project administration, K.A.N.; Funding acquisition, M.J. All authors have read and agreed to the published version of the manuscript.
Funding
This research received no external funding. The study was conducted during doctoral research supported by the China Scholarship Council (CSC), which provides academic sponsorship but does not fund publication or research dissemination costs.
Data Availability Statement
All datasets used in this study—including VIIRS NTL, MODIS NDVI, WorldClim climate surfaces, CHIRPS rainfall data, and WorldPop population grids—are publicly available from their respective repositories. The processed analysis-ready dataset, spatial weight matrices, replication code, and supplementary workflow scripts will be deposited in the Harvard Dataverse upon acceptance, and a DOI will be provided in the final published version.
Acknowledgments
The author gratefully acknowledges the open-access data provided by NASA’s VIIRS night-time lights program, MODIS NDVI products, WorldClim climate datasets, CHIRPS precipitation archives, and WorldPop demographic grids. Constructive feedback from methodological specialists and remote-sensing experts during internal review substantially improved the rigor of the spatial econometric framework. Computational resources were supported by the Geospatial Analysis Laboratory at the College of Geodesy and Geomatics, Shandong University of Science and Technology.
Conflicts of Interest
The authors declare no conflict of interest. The funders had no role in the design of the study; the collection, analysis, or interpretation of data; the writing of the manuscript; or the decision to submit the article for publication.
Ethical Statement
This research did not involve human participants or animals. All geospatial and remote-sensing datasets used in the analysis comply with open-access ethical standards and were processed according to institutional data-use guidelines.
Abbreviations
The following abbreviations are used in this manuscript:
| NTL | Night-Time Lights |
| VIIRS | Visible Infrared Imaging Radiometer Suite |
| MODIS | Moderate Resolution Imaging Spectroradiometer |
| SDG | Sustainable Development Goal |
| SGR | Standard Gauge Railway |
| MAUP | Modifiable Areal Unit Problem |
| AIC | Akaike Information Criterion |
| LM | Lagrange Multiplier |
| VIF | Variance Inflation Factor |
References
- Collier, P.; Dercon, S. African Agriculture in 50 Years: Smallholders in a Rapidly Changing World? World Dev. 2020, 63, 92–101. [Google Scholar] [CrossRef]
- Gibson, J.; Olivia, S.; Boe-Gibson, G. Night Lights in Economics: Sources and Uses. J. Econ. Surv. 2021, 35, 1364–1396. [Google Scholar] [CrossRef]
- Barbier, E.B. The Green Economy and Sustainable Infrastructure. Environ. Resour. Econ. 2022, 81, 1–25. [Google Scholar]
- Gollin, D.; Kaboski, J. The Industrial Composition of African Economies. J. Dev. Econ. 2023, 153, 102–128. [Google Scholar]
- Henderson, J.V.; Storeygard, A.; Weil, D.N. Measuring Economic Growth from Outer Space. Am. Econ. Rev. 2012, 102, 994–1028. [Google Scholar] [CrossRef] [PubMed]
- LeSage, J.; Pace, R.K. Introduction to Spatial Econometrics; CRC Press: Boca Raton, FL, USA, 2009. [Google Scholar]
- Elhorst, J.P. Spatial Econometrics: From Cross-Sectional Data to Spatial Panels; Springer: Heidelberg, Germany, 2014. [Google Scholar]
- Donaldson, D.; Hornbeck, R. Railroads and American Economic Growth: A “Market Access” Approach. Q. J. Econ. 2016, 131, 799–858. [Google Scholar] [CrossRef]
- Fick, S.E.; Hijmans, R.J. WorldClim 2: New 1-km Spatial Resolution Climate Surfaces for Global Land Areas. Int. J. Climatol. 2017, 37, 4302–4315. [Google Scholar] [CrossRef]
- Shi, K.; Yu, B.; Zhou, Y.; Chen, Z.; Chen, Z.; Yang, C.; Hu, Y.; Wu, J. Evaluating the Ability of NPP-VIIRS Nighttime Light Data to Estimate the Gross Domestic Product and the Electric Power Consumption of China at Multiple Scales: A Comparison with DMSP-OLS Data. Remote Sens. 2014, 6, 1705–1724. [Google Scholar] [CrossRef]
- World Bank. Benchmarking Infrastructure Development 2023: Regulatory Frameworks for Project Preparation, Procurement, and Management; The World Bank: Washington, DC, USA, 2023; Available online: https://bpp.worldbank.org/en/methodology (accessed on 1 October 2024).
Figure 1.
Conceptual Framework for Infrastructure–Environment Complementarity in BRI Corridors. Illustration of the Spatial Durbin Model structure showing interactions between infrastructure investment, environmental quality, and spatial spillovers.
Figure 1.
Conceptual Framework for Infrastructure–Environment Complementarity in BRI Corridors. Illustration of the Spatial Durbin Model structure showing interactions between infrastructure investment, environmental quality, and spatial spillovers.
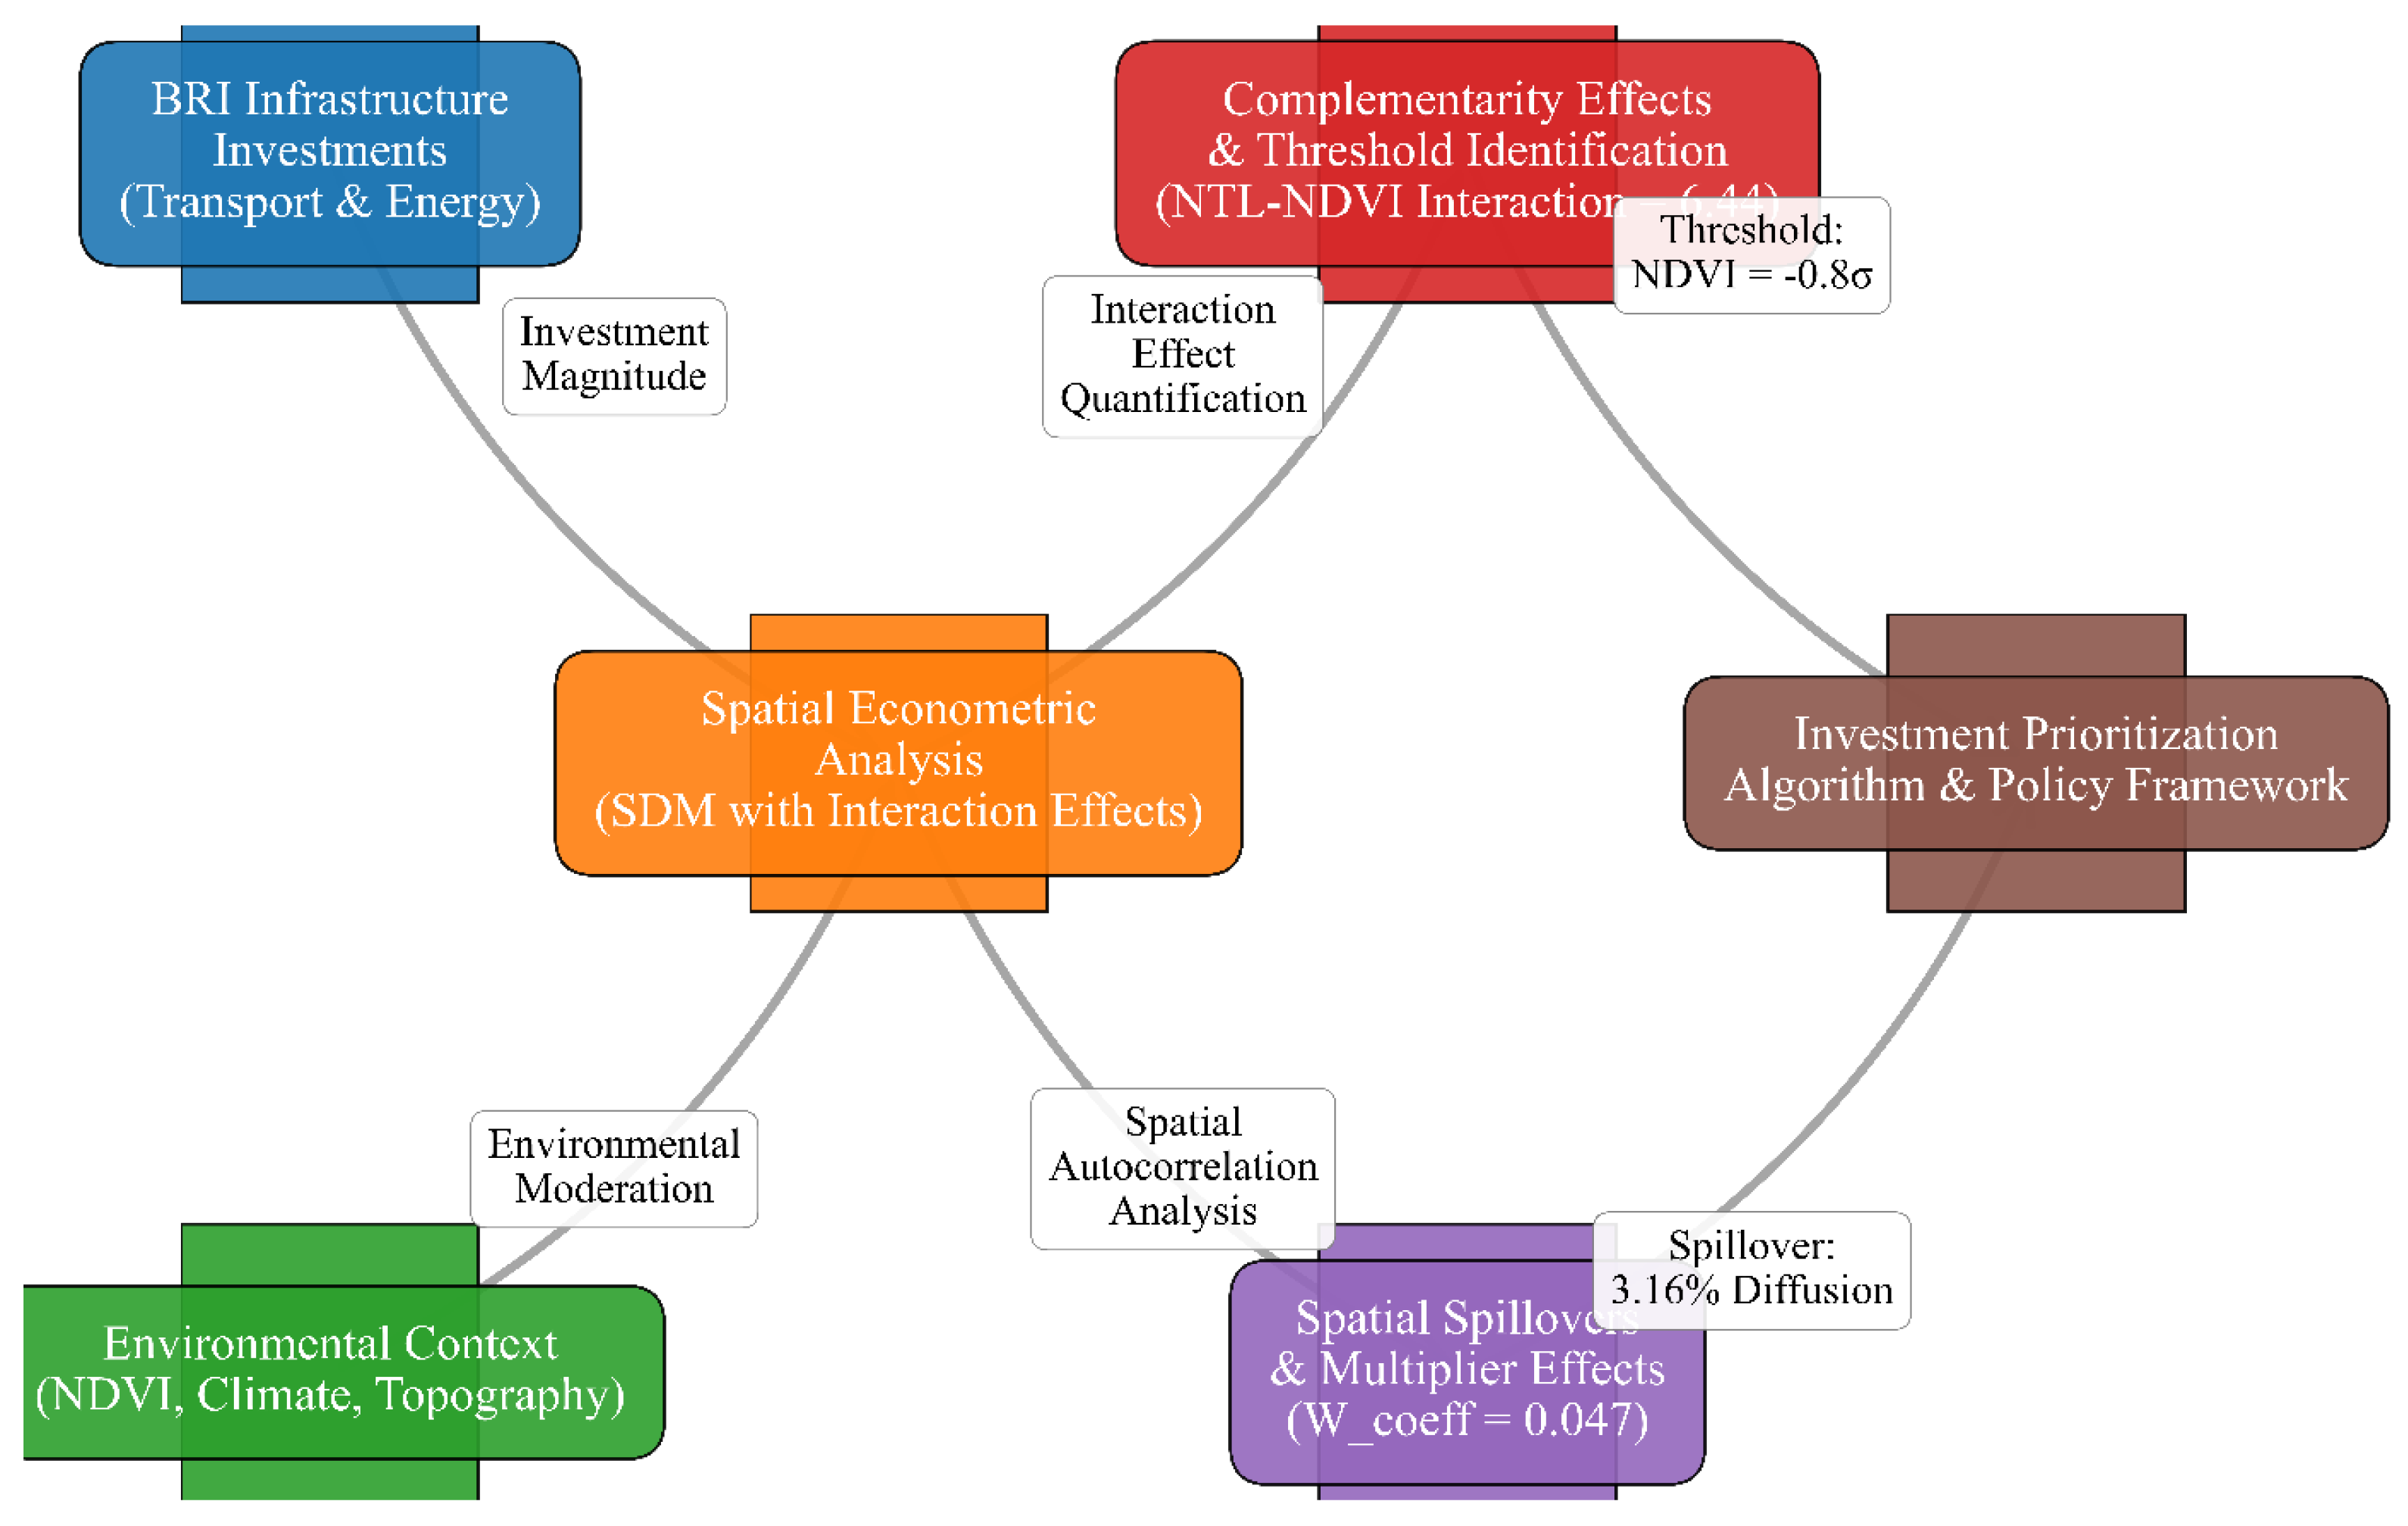
Figure 2.
Spatial domain of Tanzania’s BRI development corridors, showing (a) regional context, (b) the national network including SGR and major highways, and (c) corridor-level mapping highlighting infrastructure nodes and major hydrological features.
Figure 2.
Spatial domain of Tanzania’s BRI development corridors, showing (a) regional context, (b) the national network including SGR and major highways, and (c) corridor-level mapping highlighting infrastructure nodes and major hydrological features.
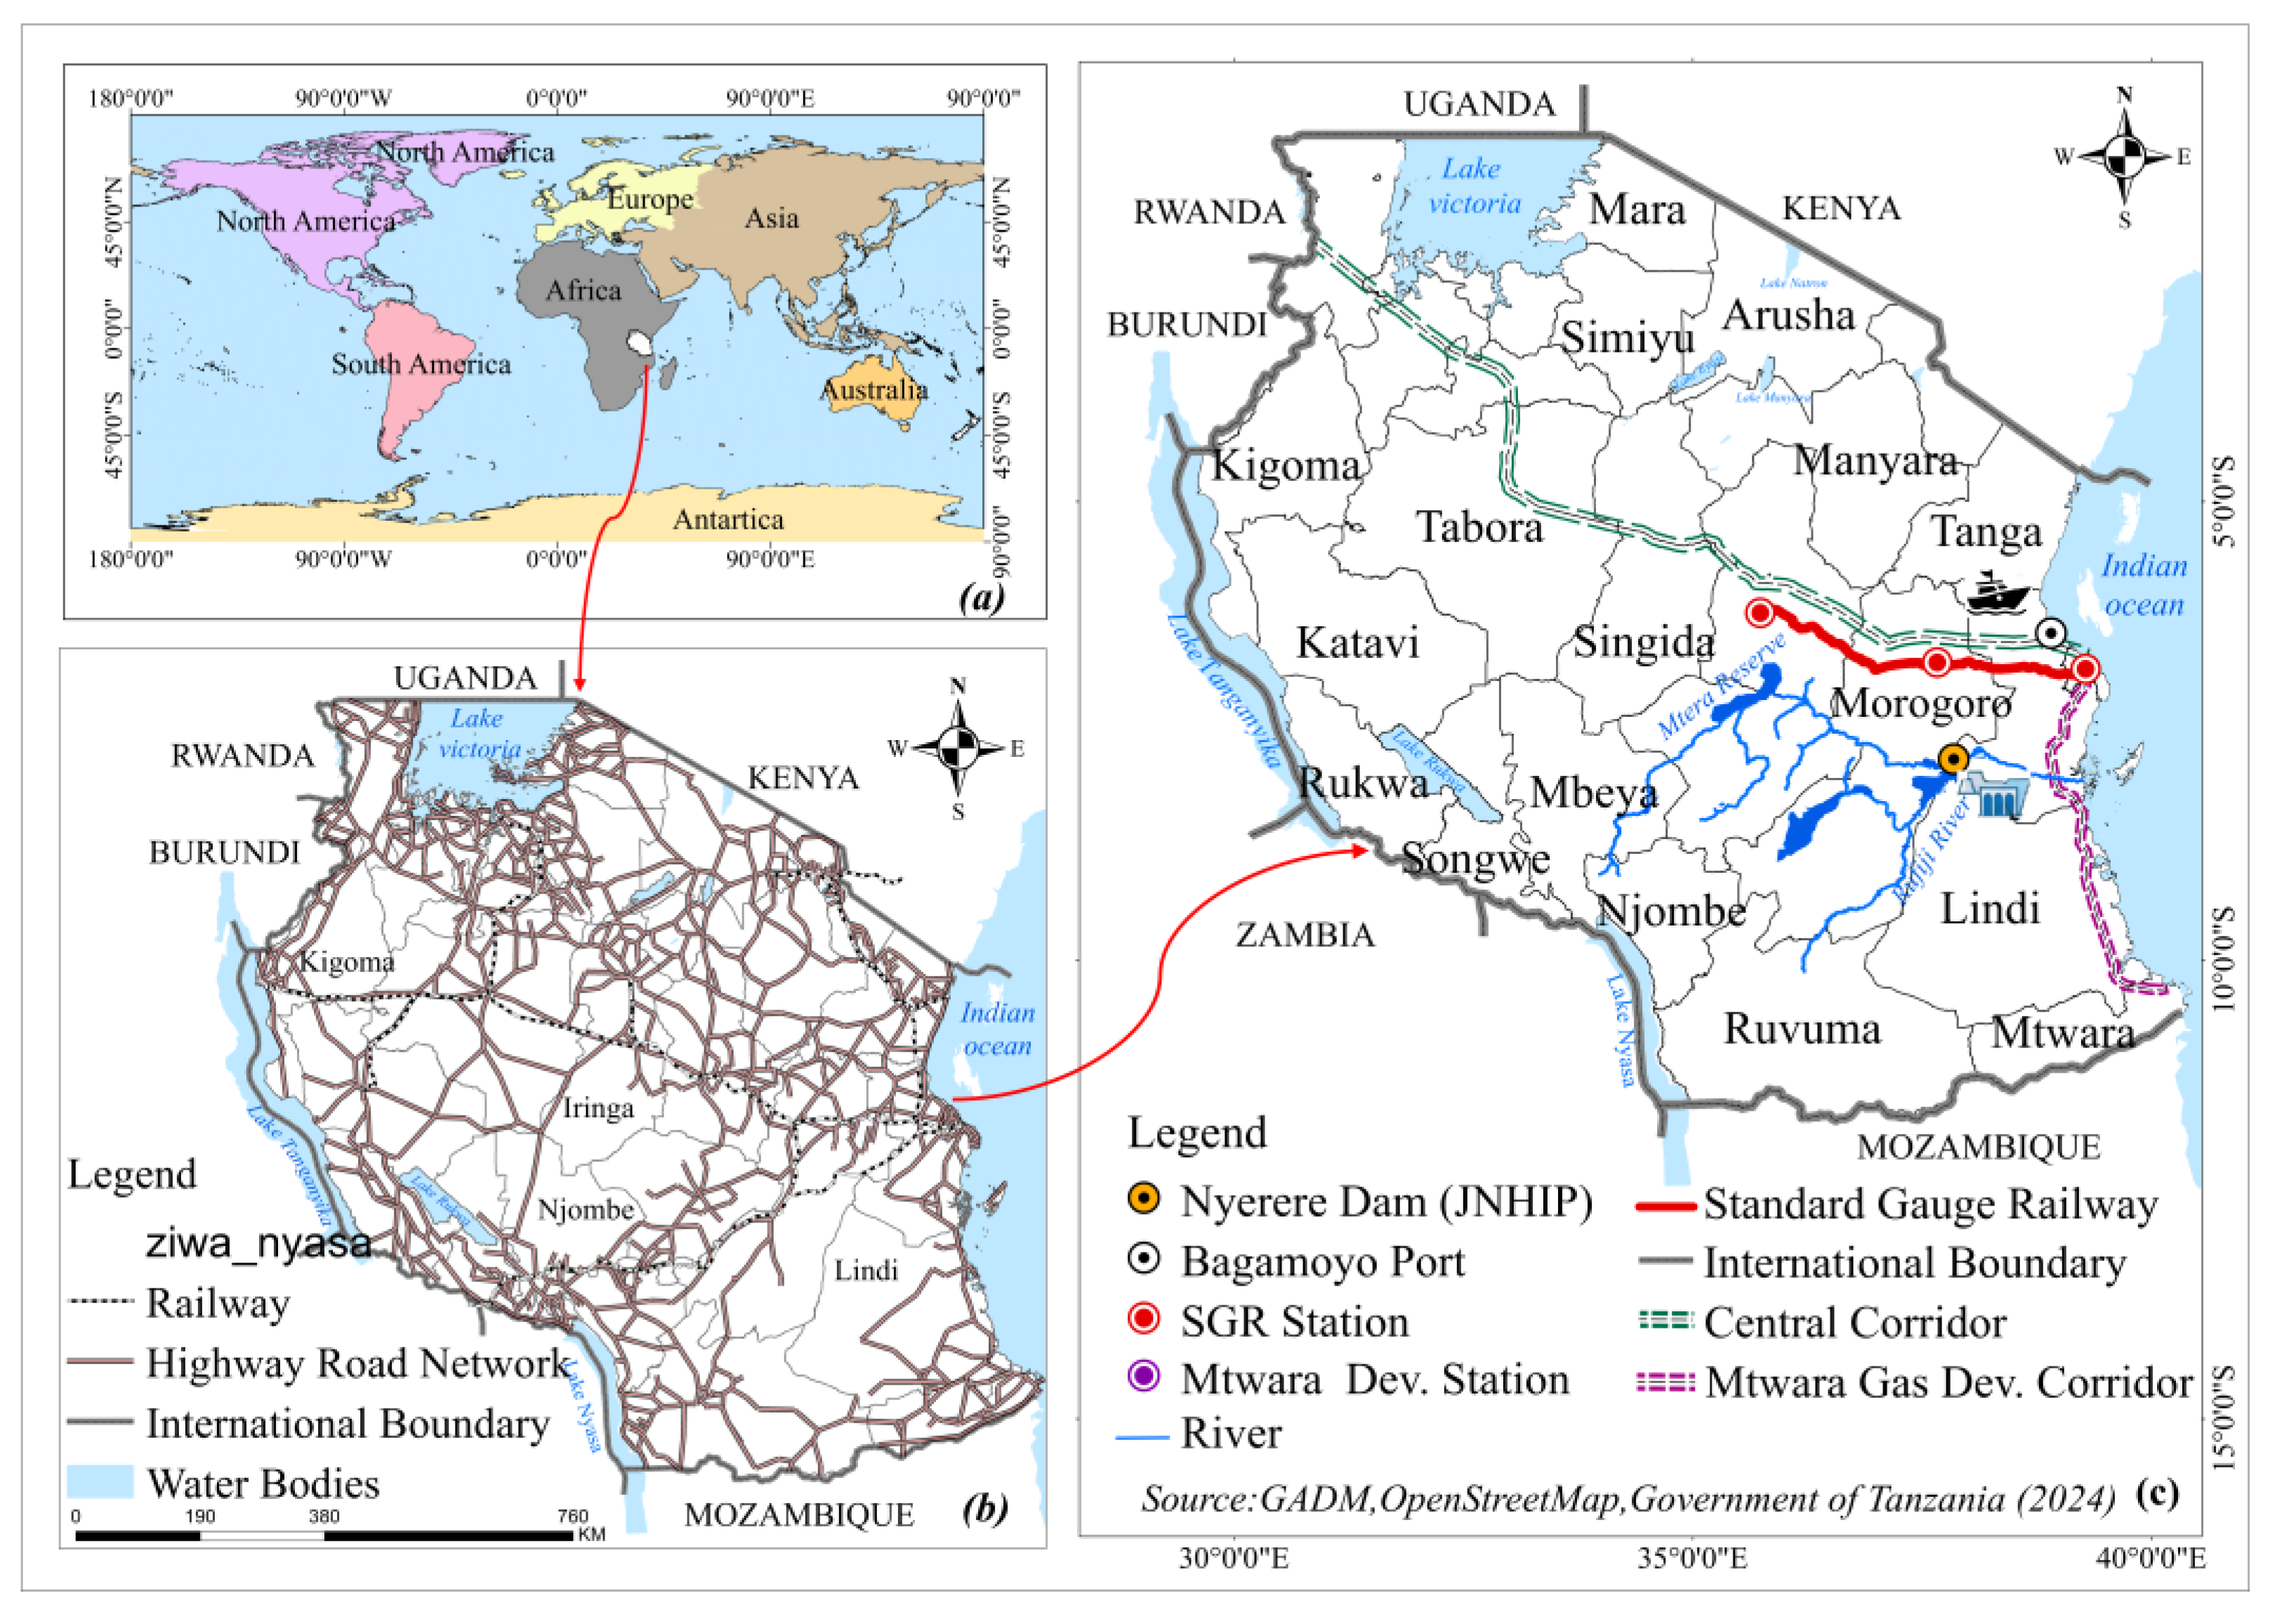
Figure 3.
Analytical workflow for spatial econometric assessment illustrating data integration, SDM specification, validation, and robustness testing.
Figure 3.
Analytical workflow for spatial econometric assessment illustrating data integration, SDM specification, validation, and robustness testing.
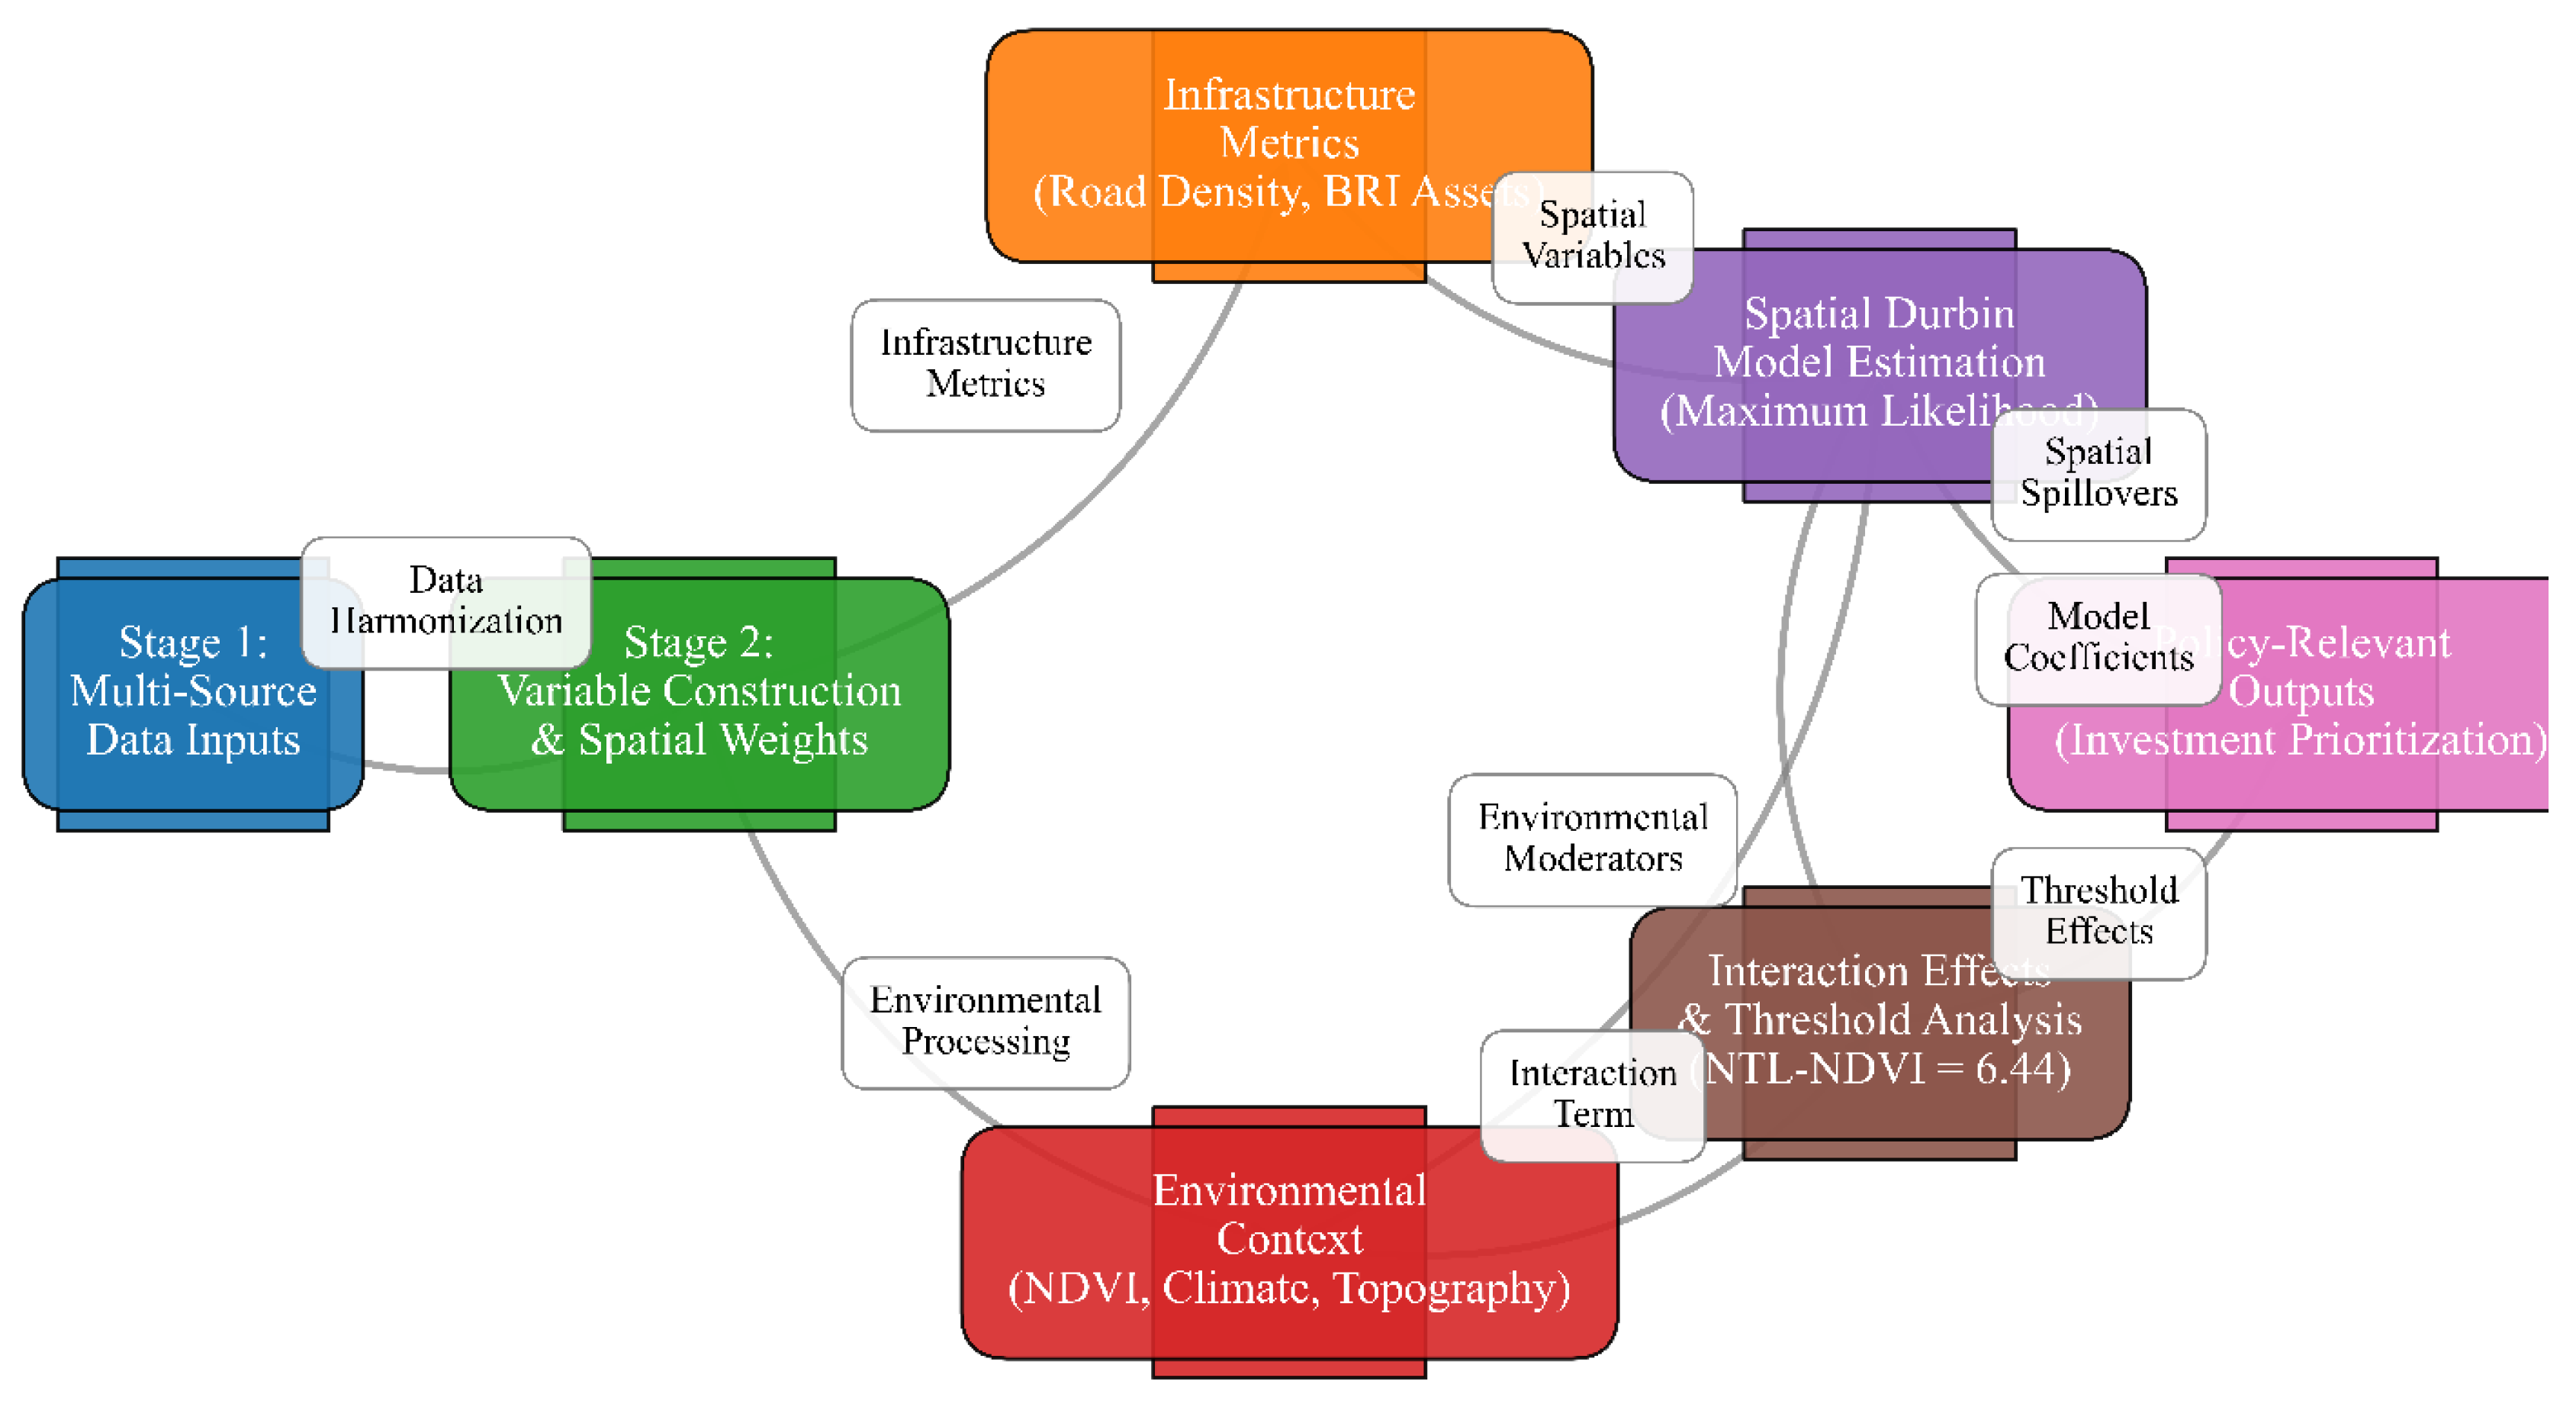
Figure 4.
Frequency Distribution of Night-Time Light (NTL) Intensity.
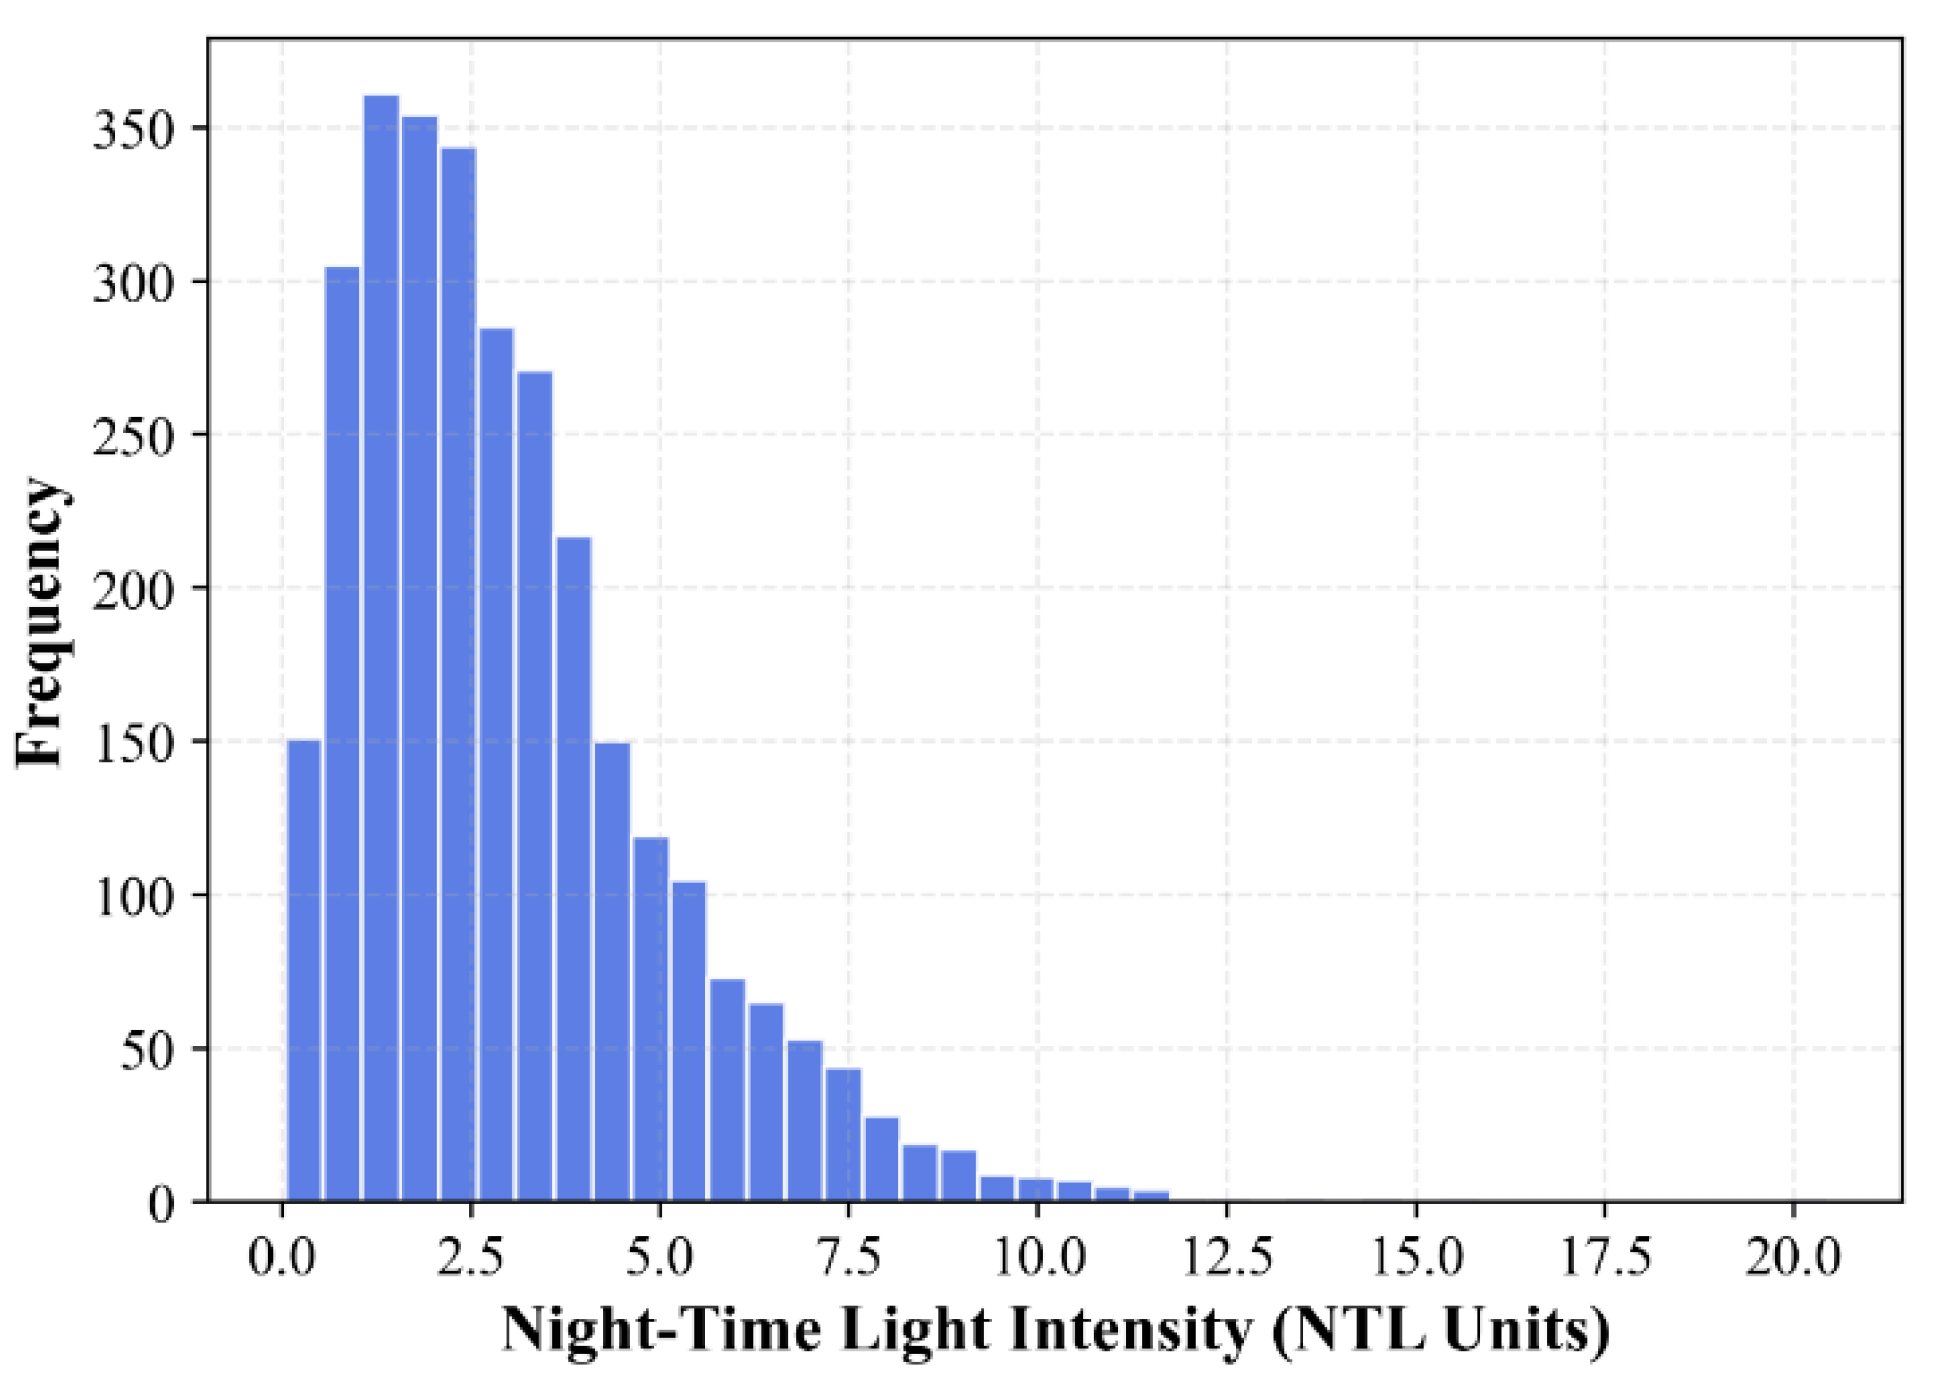
Figure 5.
Spatial Spillover Dynamics and Regional Integration Patterns. (a) LISA cluster map illustrating High–High (regional growth poles) and Low–Low clusters (economically isolated zones); (b) Corridor-Level Spillover Magnitudes (Standardized Indirect Effect).
Figure 5.
Spatial Spillover Dynamics and Regional Integration Patterns. (a) LISA cluster map illustrating High–High (regional growth poles) and Low–Low clusters (economically isolated zones); (b) Corridor-Level Spillover Magnitudes (Standardized Indirect Effect).
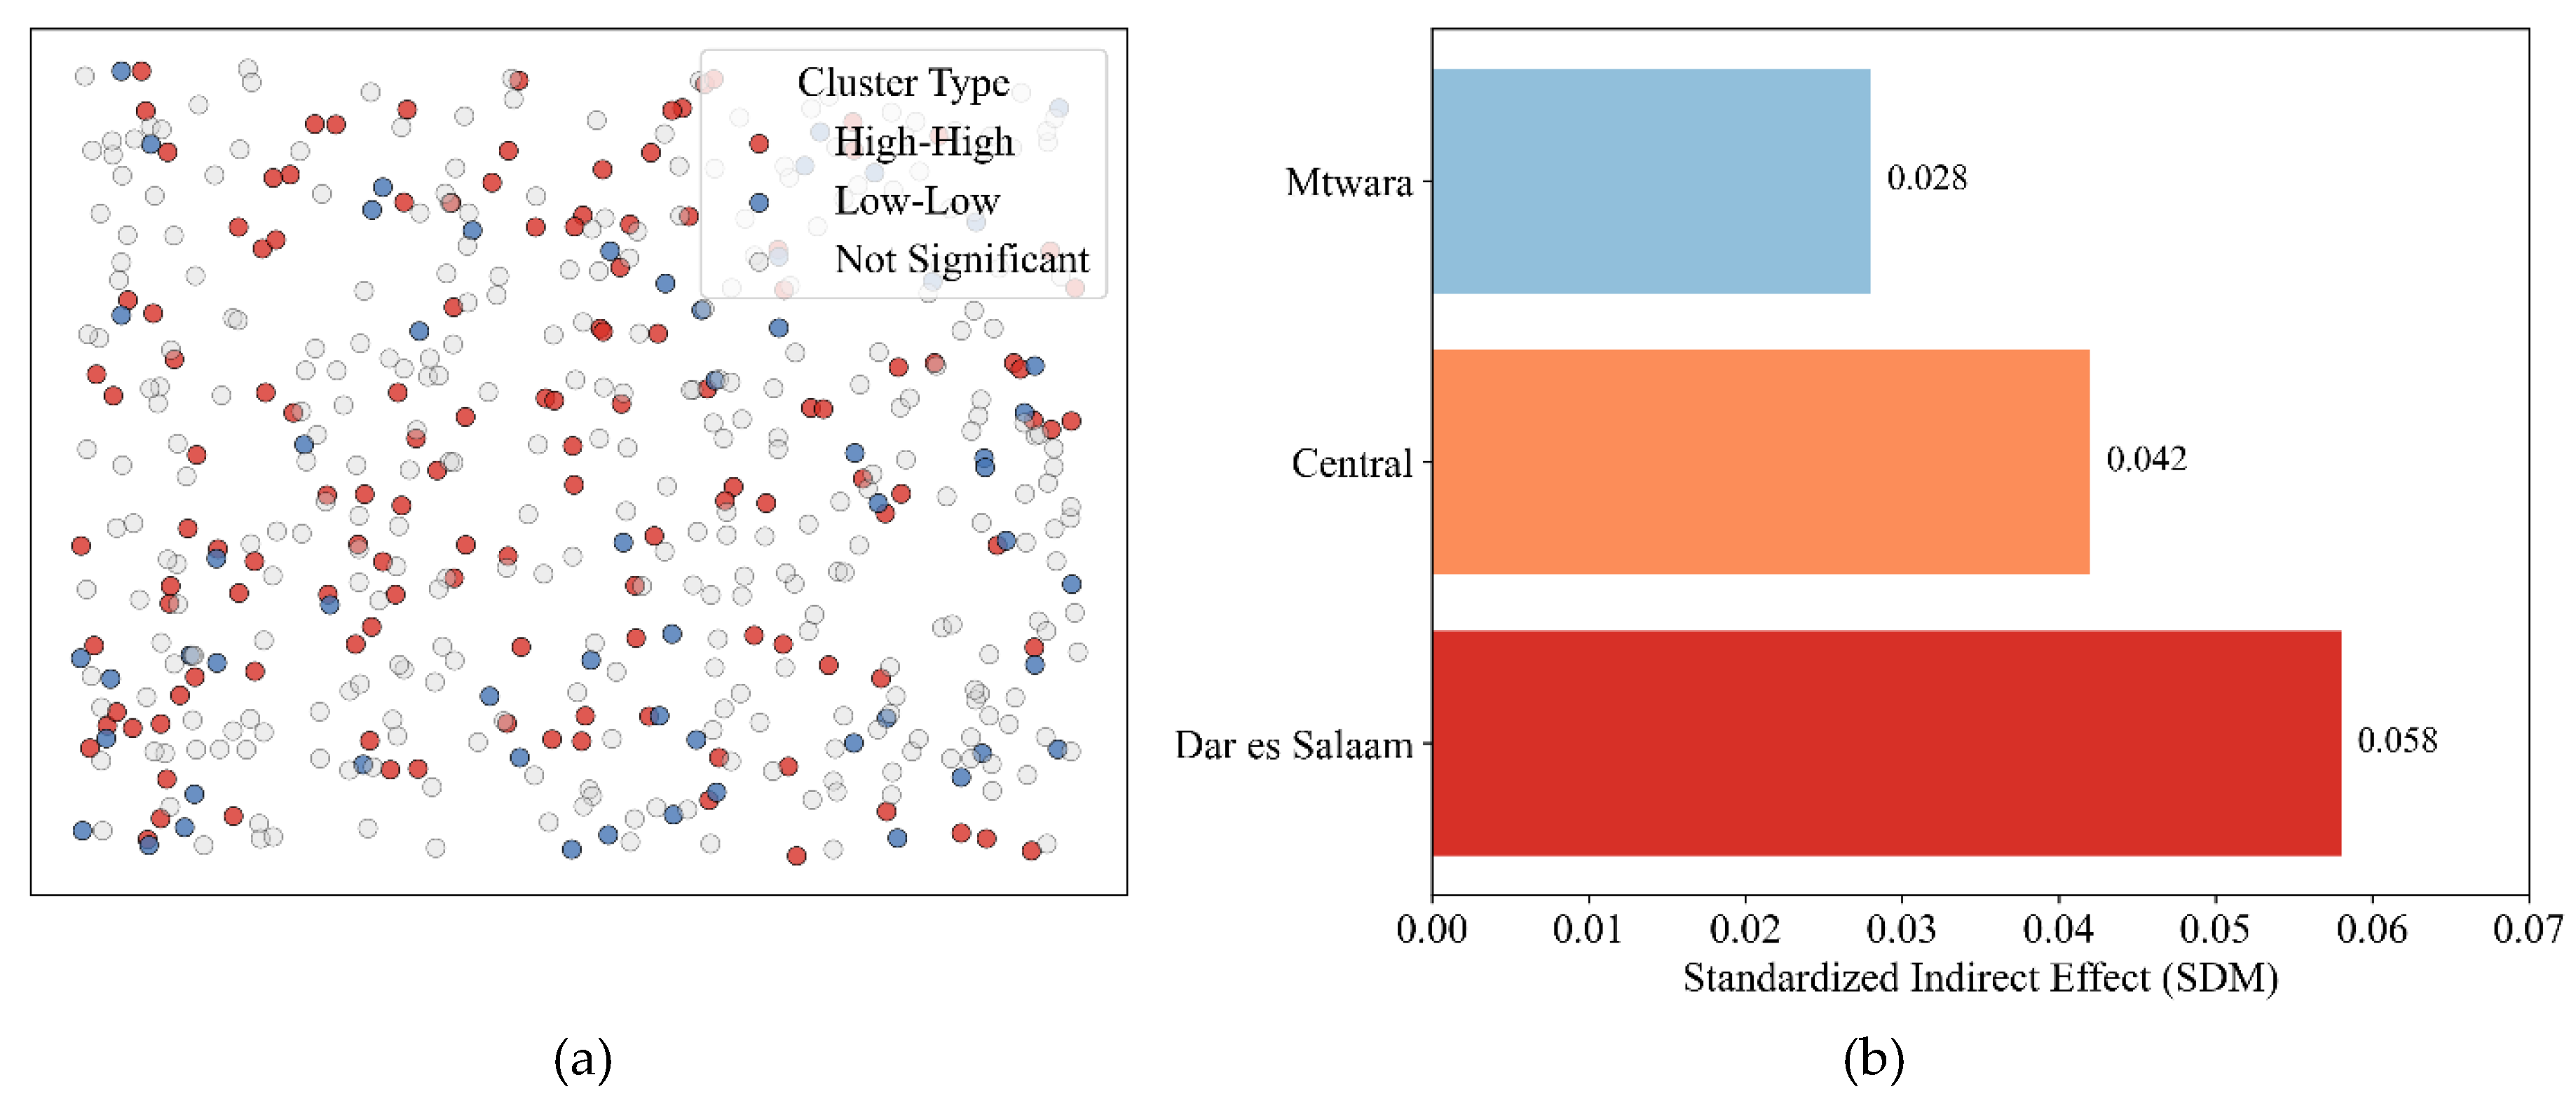
Figure 6.
Direct, Indirect, and Total Effects from the Spatial Durbin Model (SDM) Estimation.
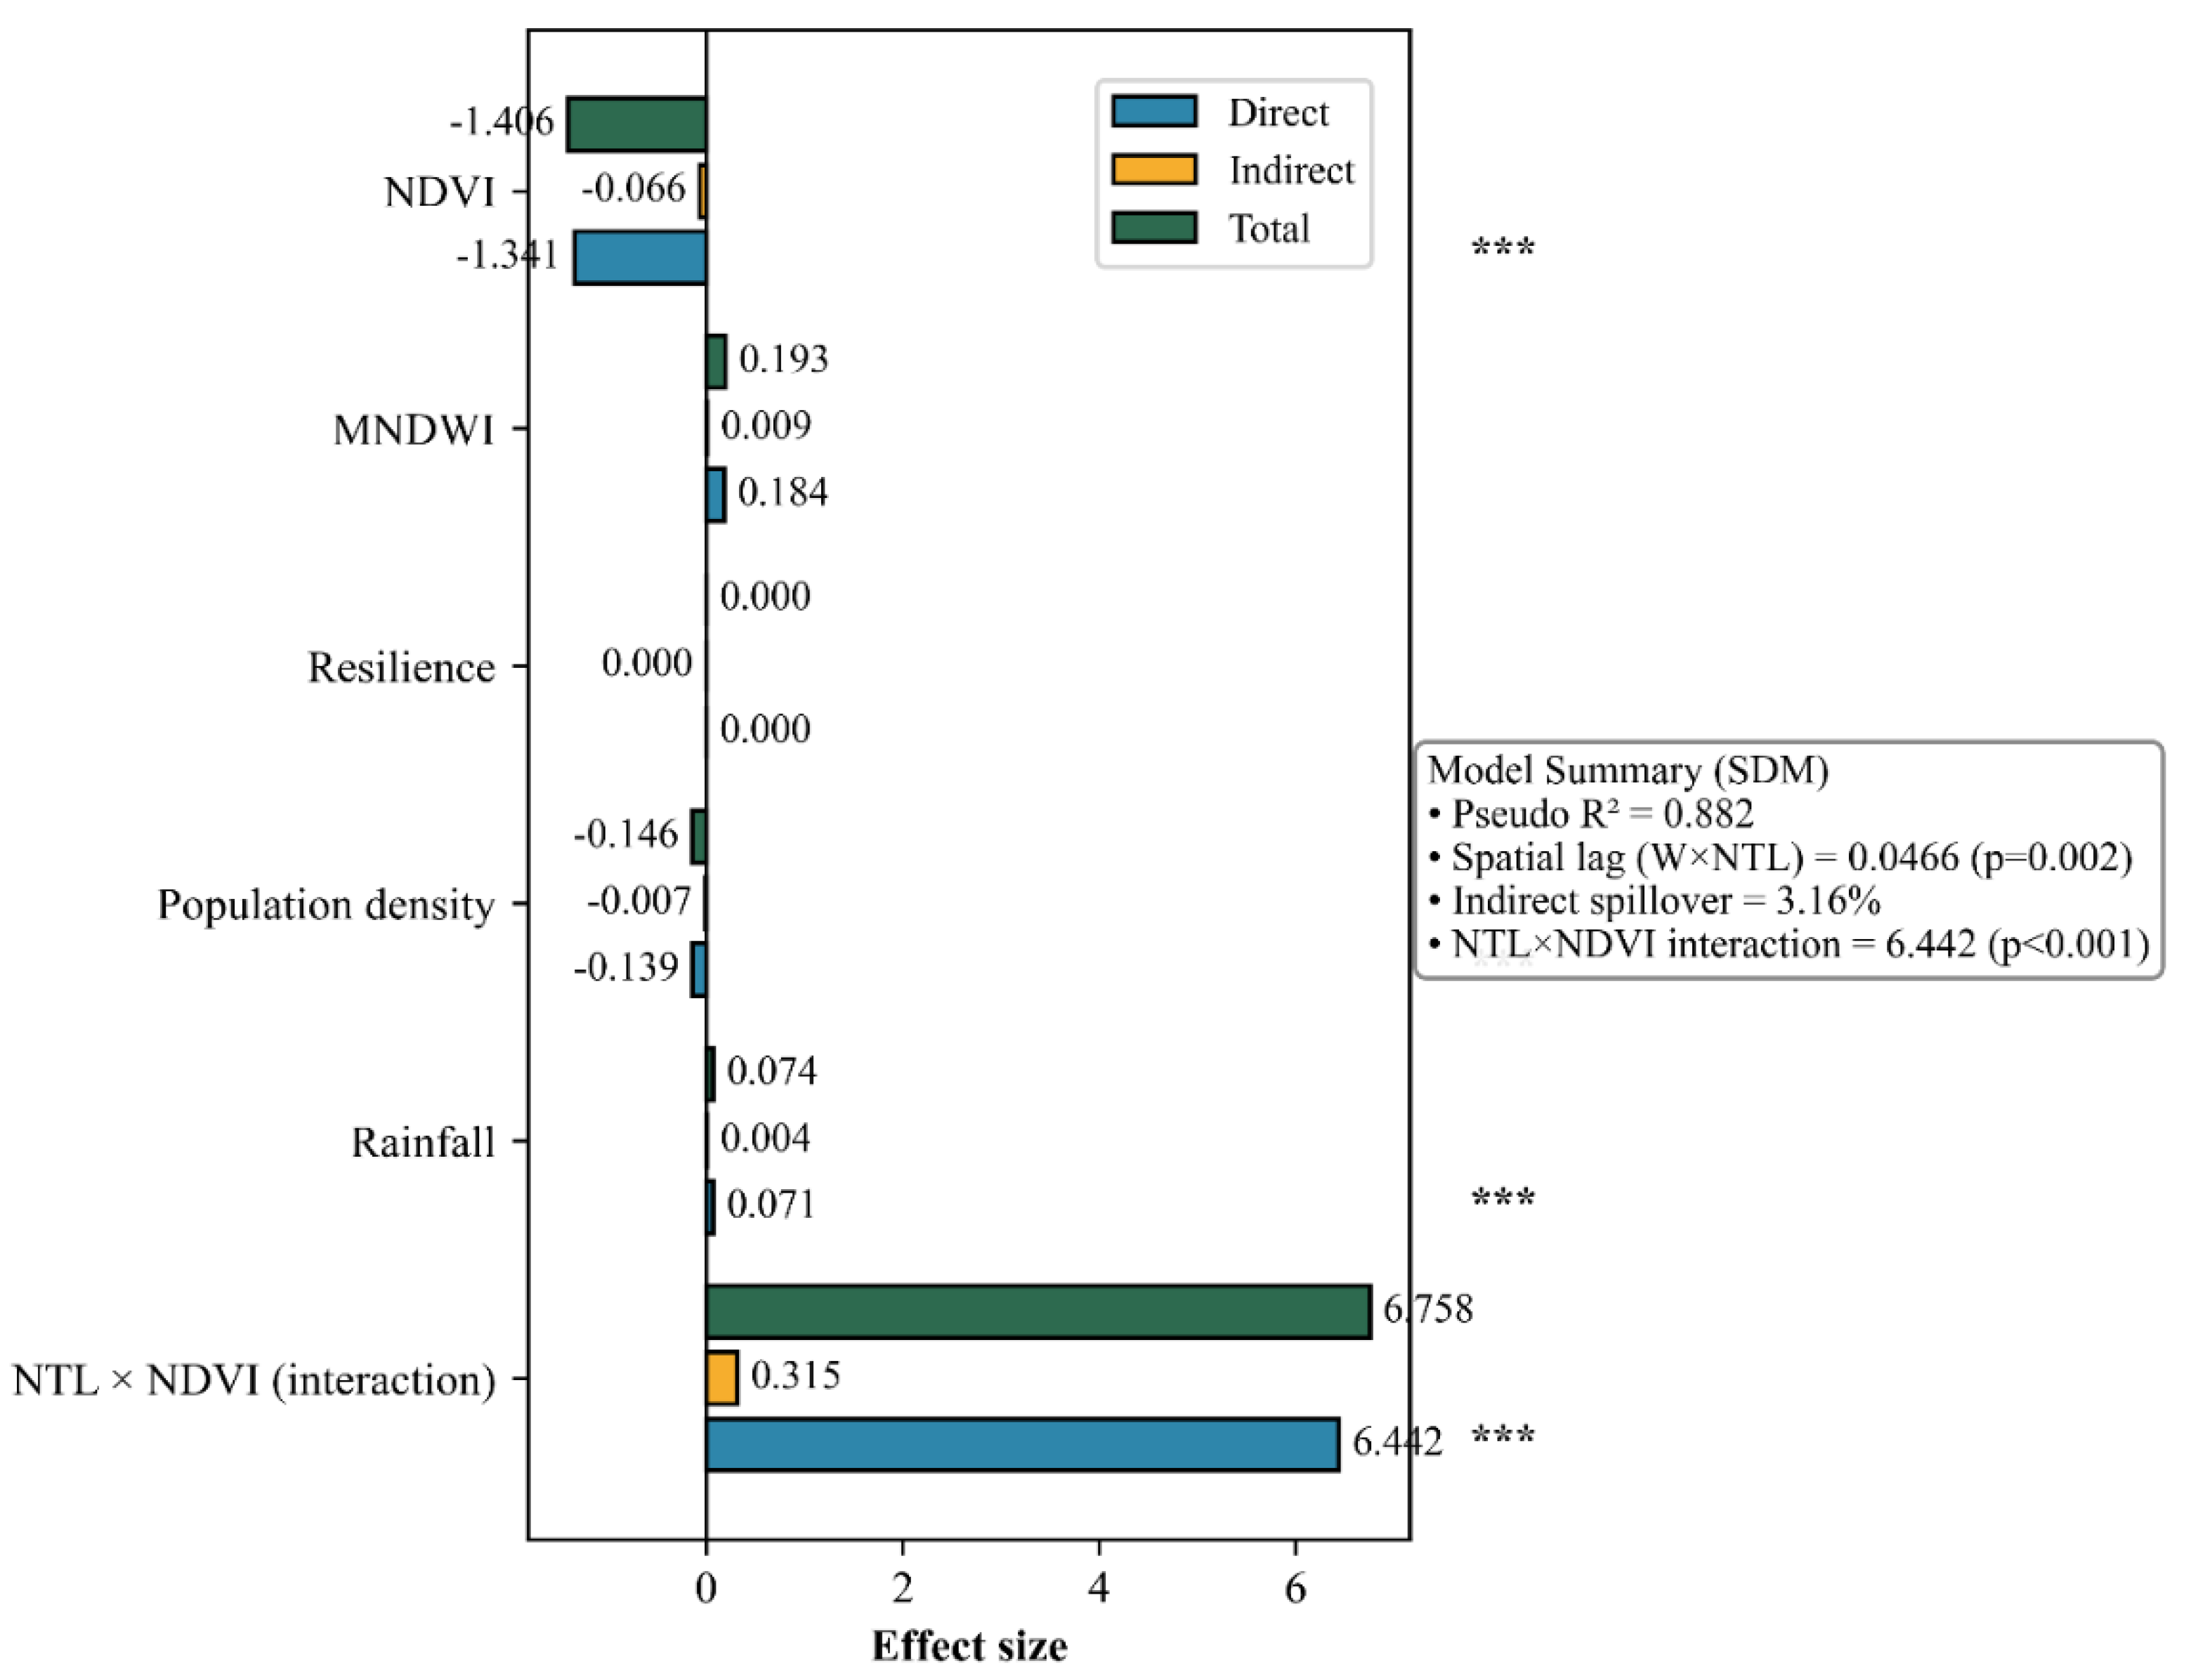
Figure 7.
Spatial Spillover Intensity Across BRI Corridors. A comparative illustration of the indirect spillover effects estimated using the Spatial Durbin Model (SDM).
Figure 7.
Spatial Spillover Intensity Across BRI Corridors. A comparative illustration of the indirect spillover effects estimated using the Spatial Durbin Model (SDM).
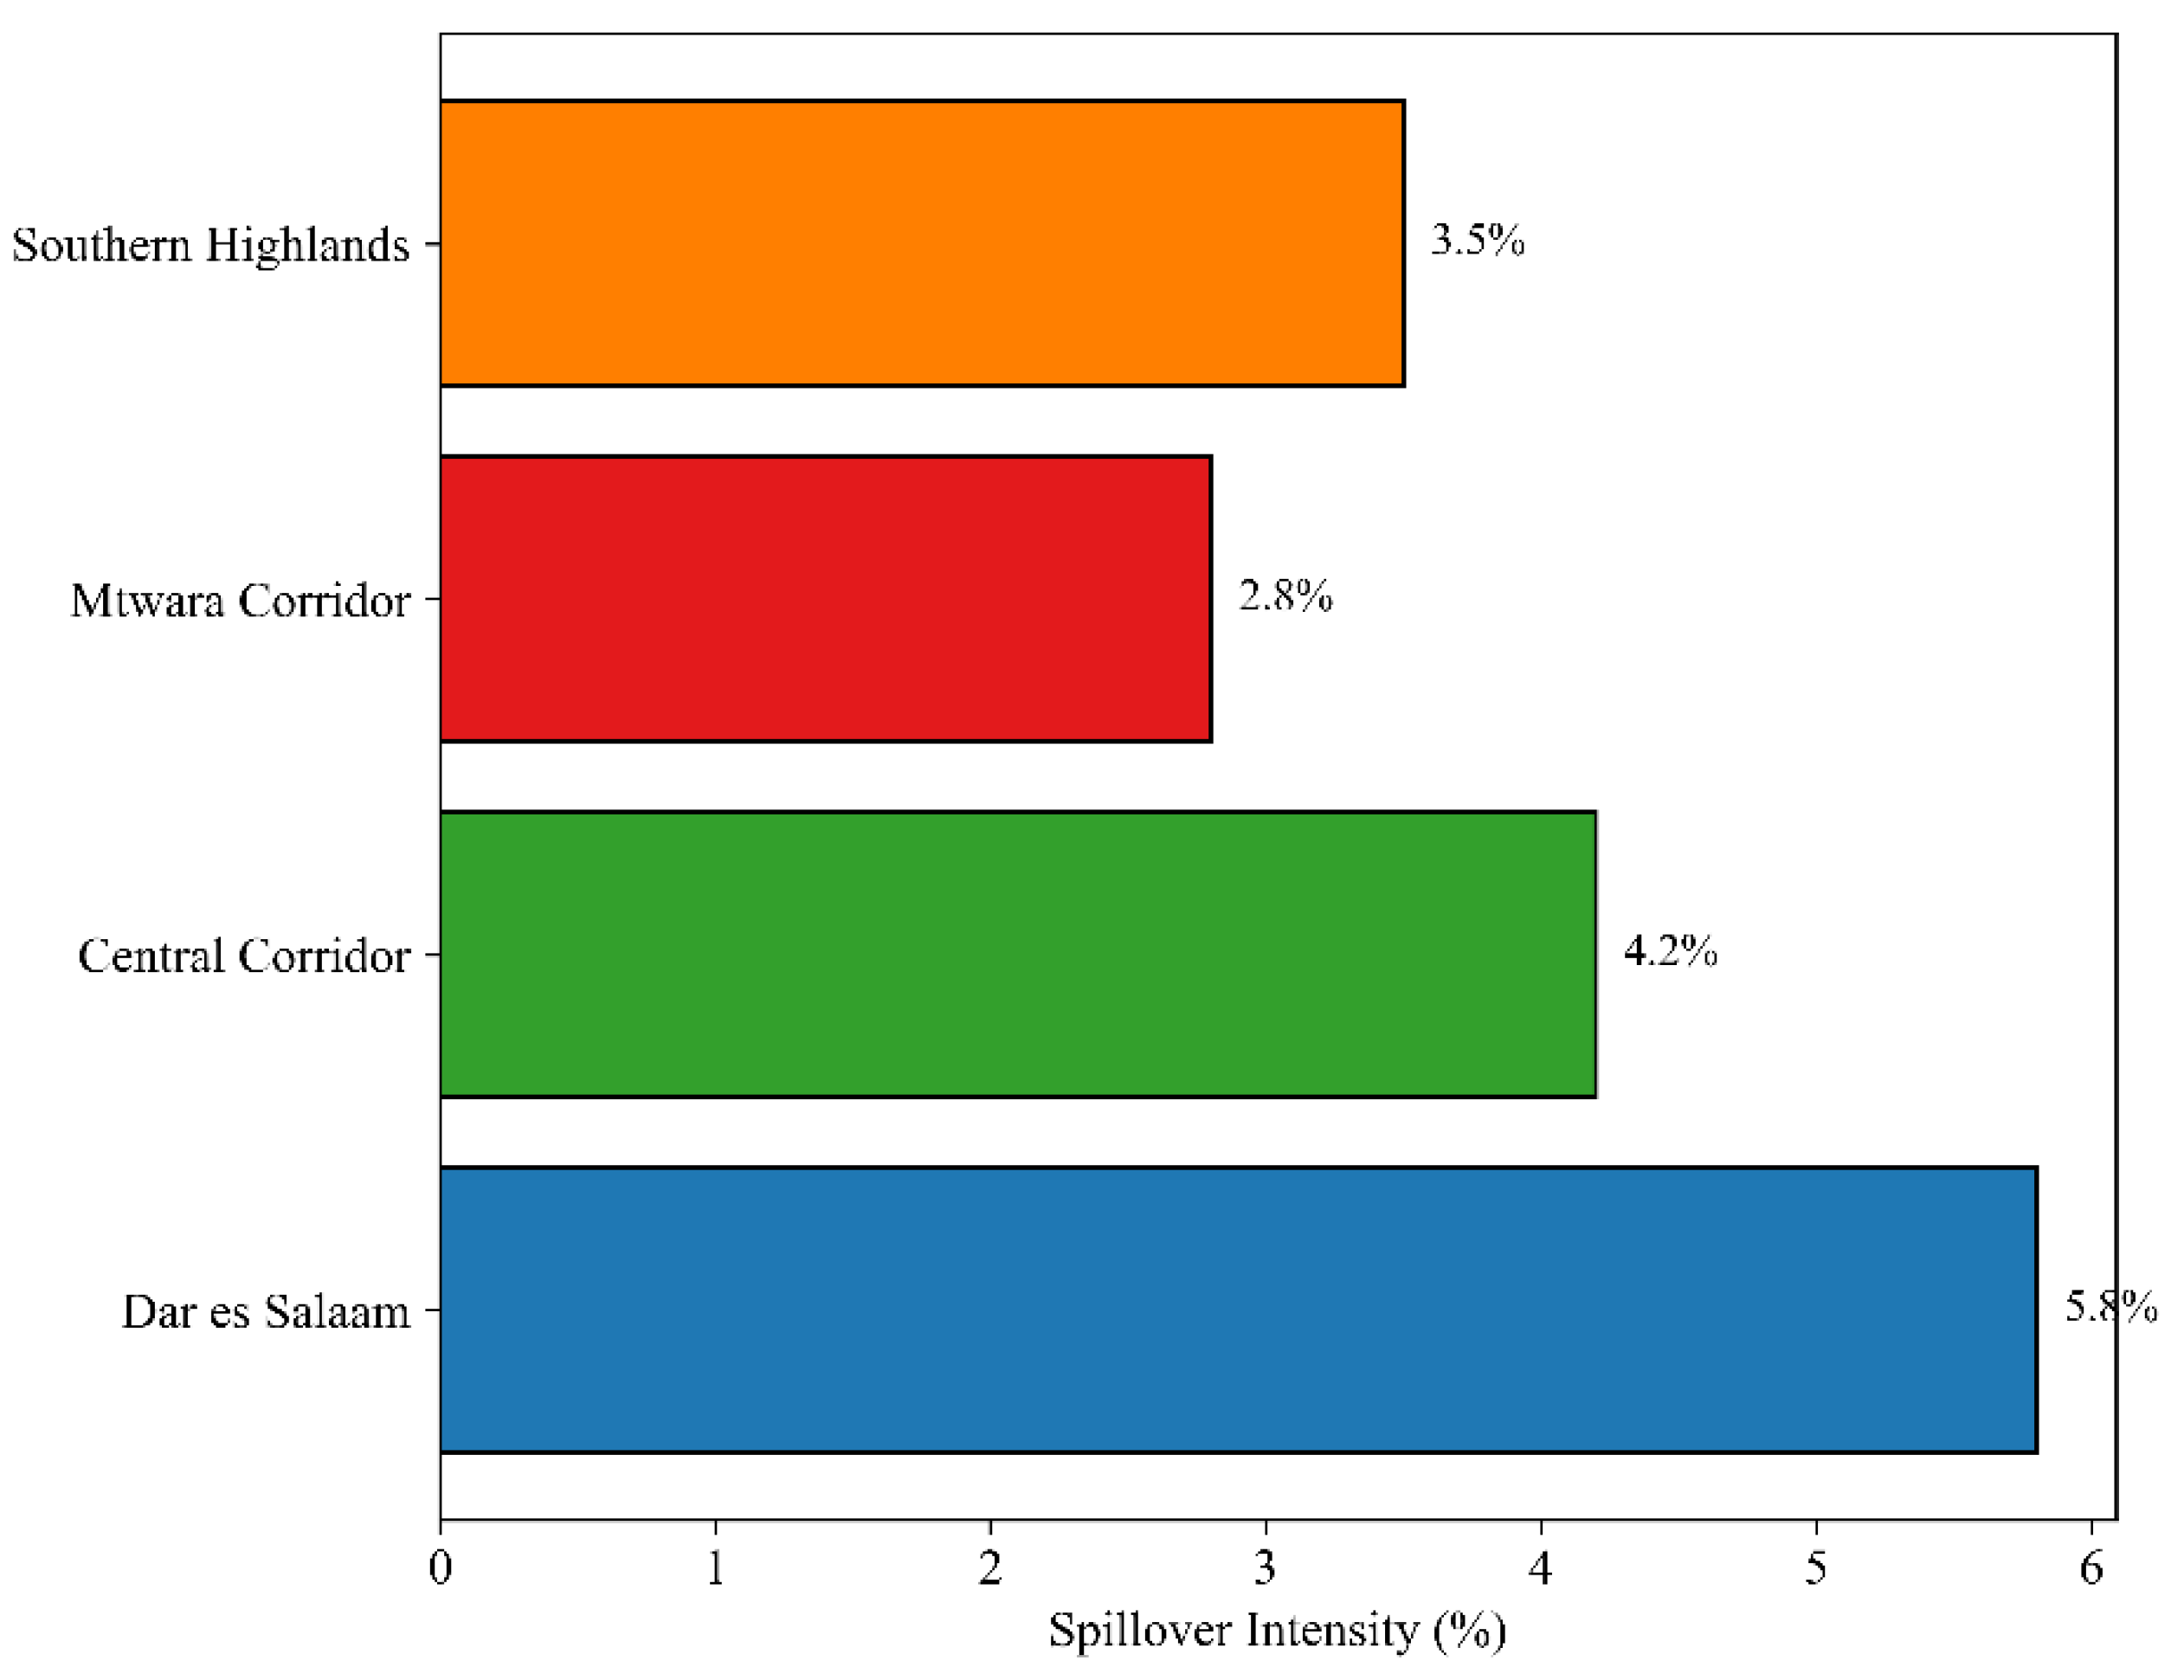
Figure 8.
Infrastructure Investment Returns Across NDVI Values. A critical threshold occurs at NDVI = -0.8σ. Below this value, infrastructure shows no significant economic returns. Above it, returns become strongly positive. This demonstrates environmental quality directly determines infrastructure effectiveness in Tanzania's BRI corridors.
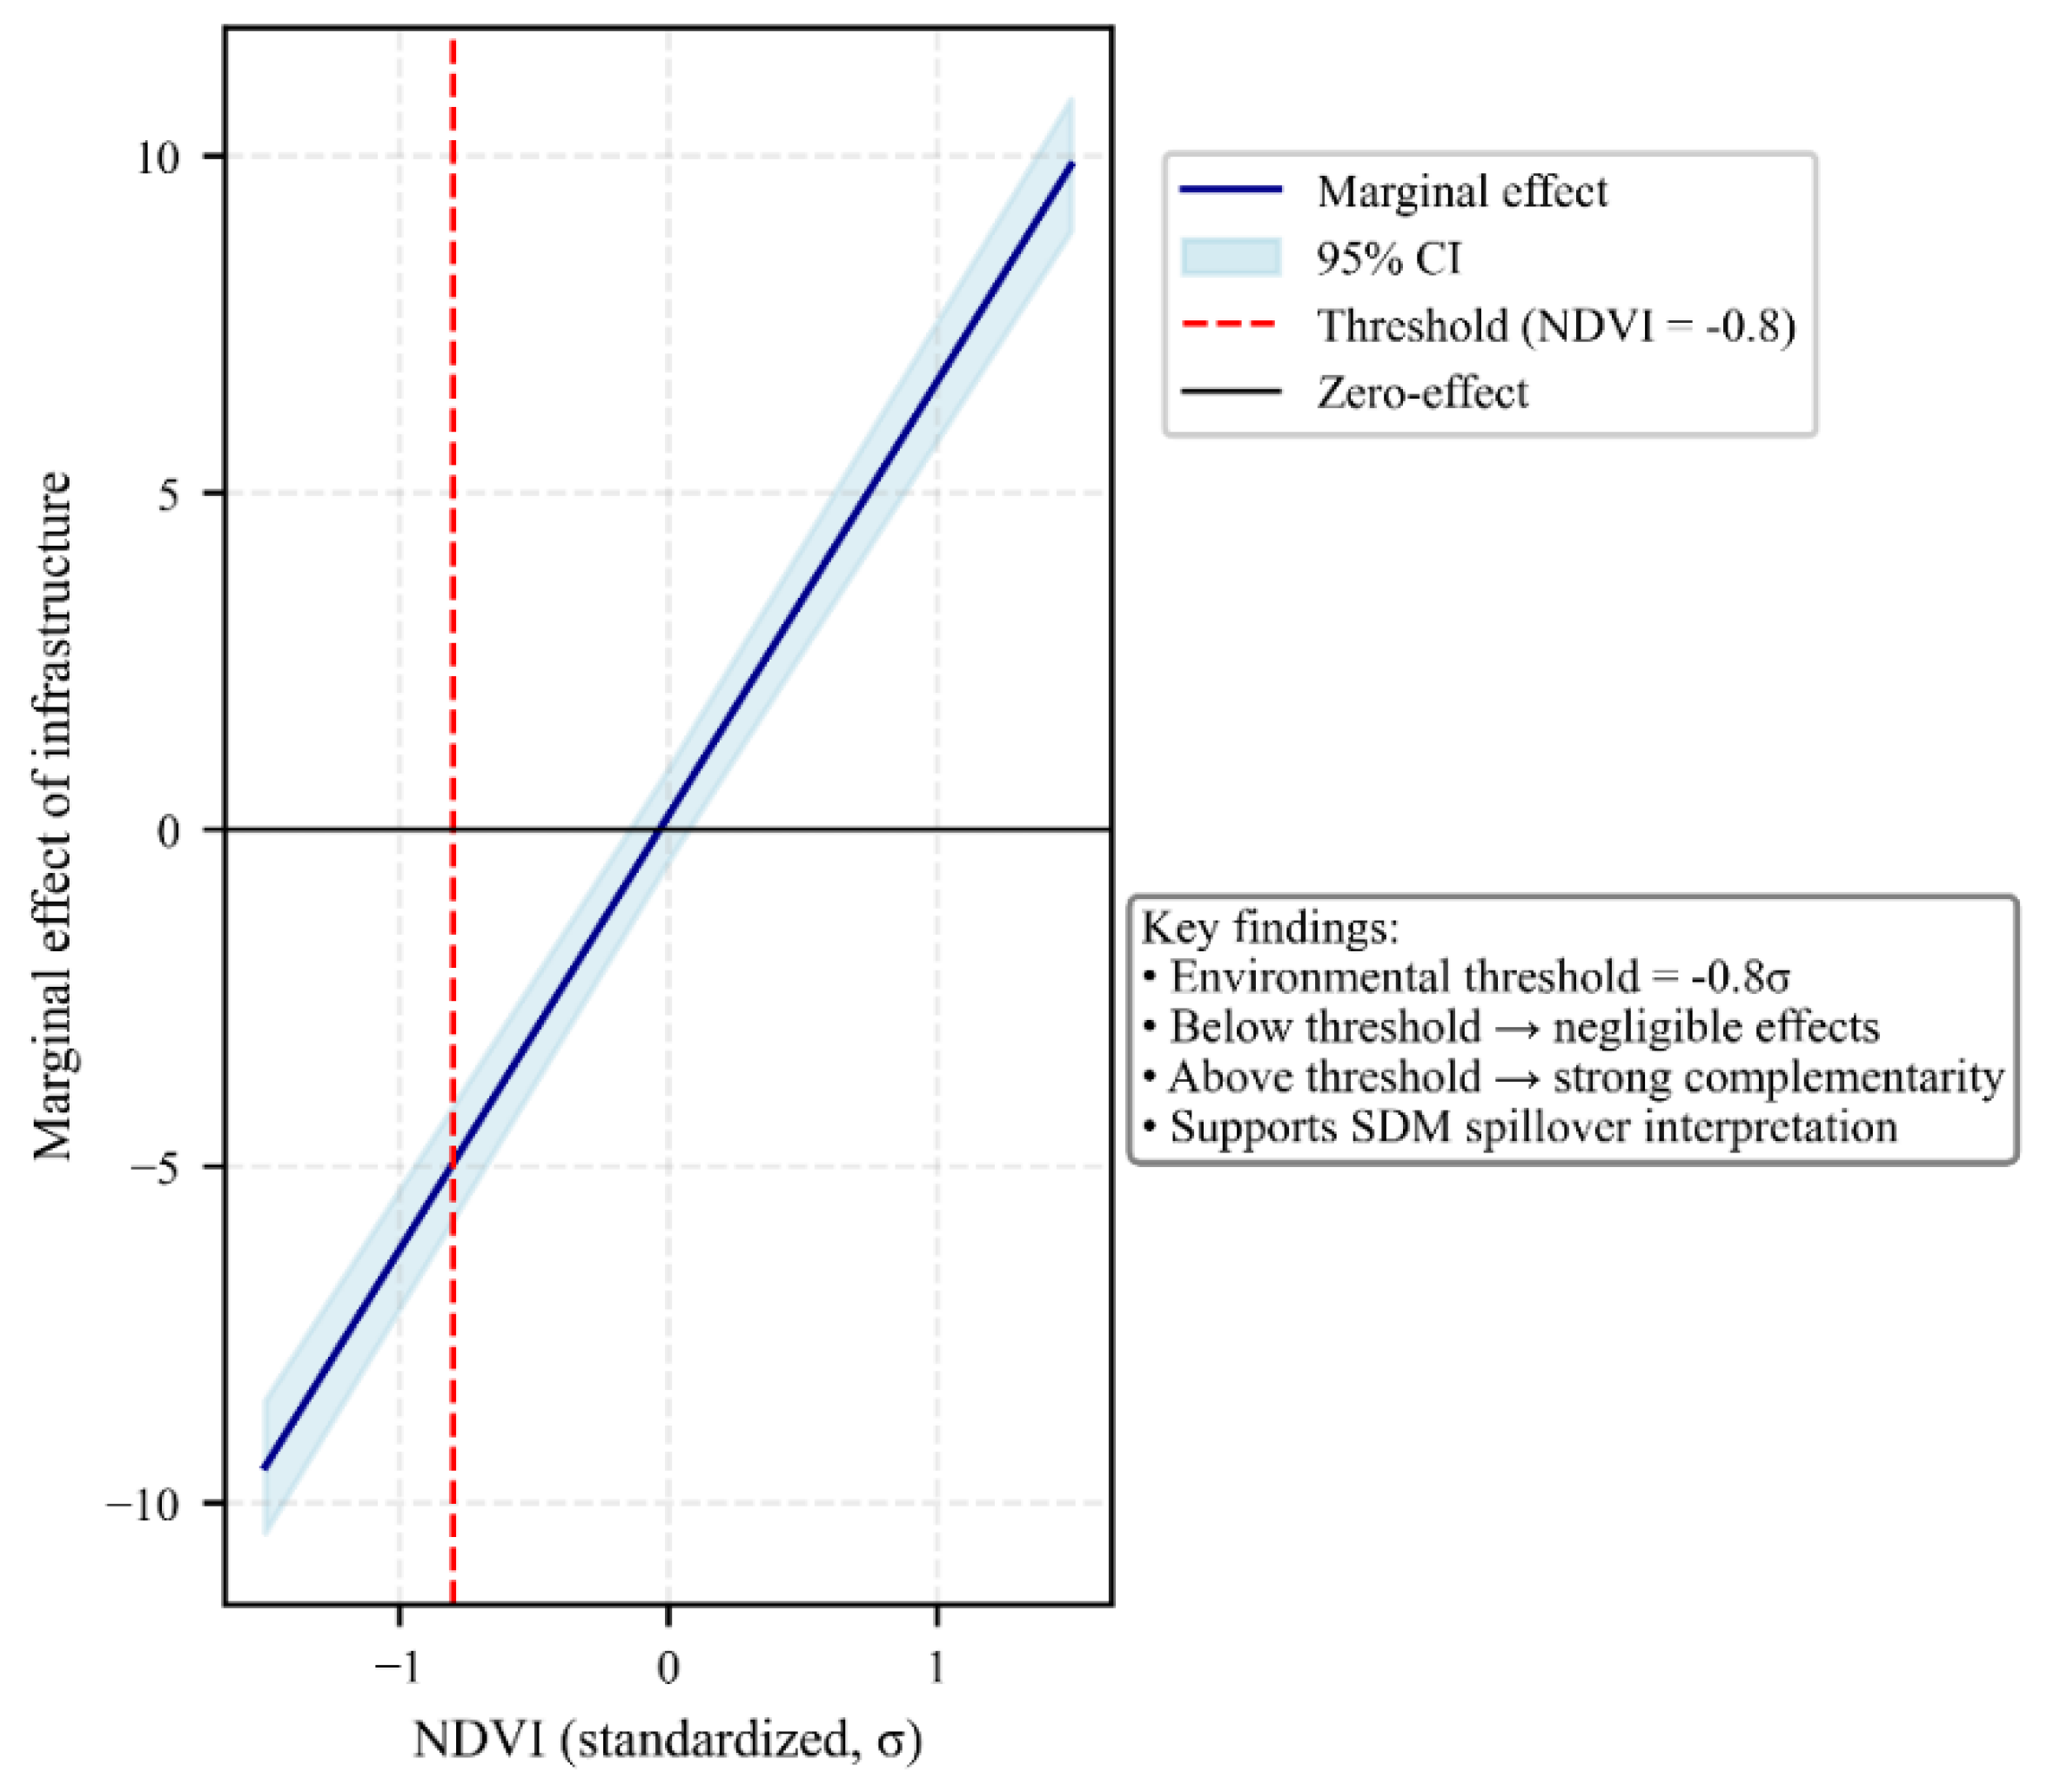
Figure 9.
BRI Investment Zone Classification and Share of Corridor Area. The classification framework, derived from the SDM and NDVI threshold analysis, guiding environmentally adaptive investment planning.
Figure 9.
BRI Investment Zone Classification and Share of Corridor Area. The classification framework, derived from the SDM and NDVI threshold analysis, guiding environmentally adaptive investment planning.
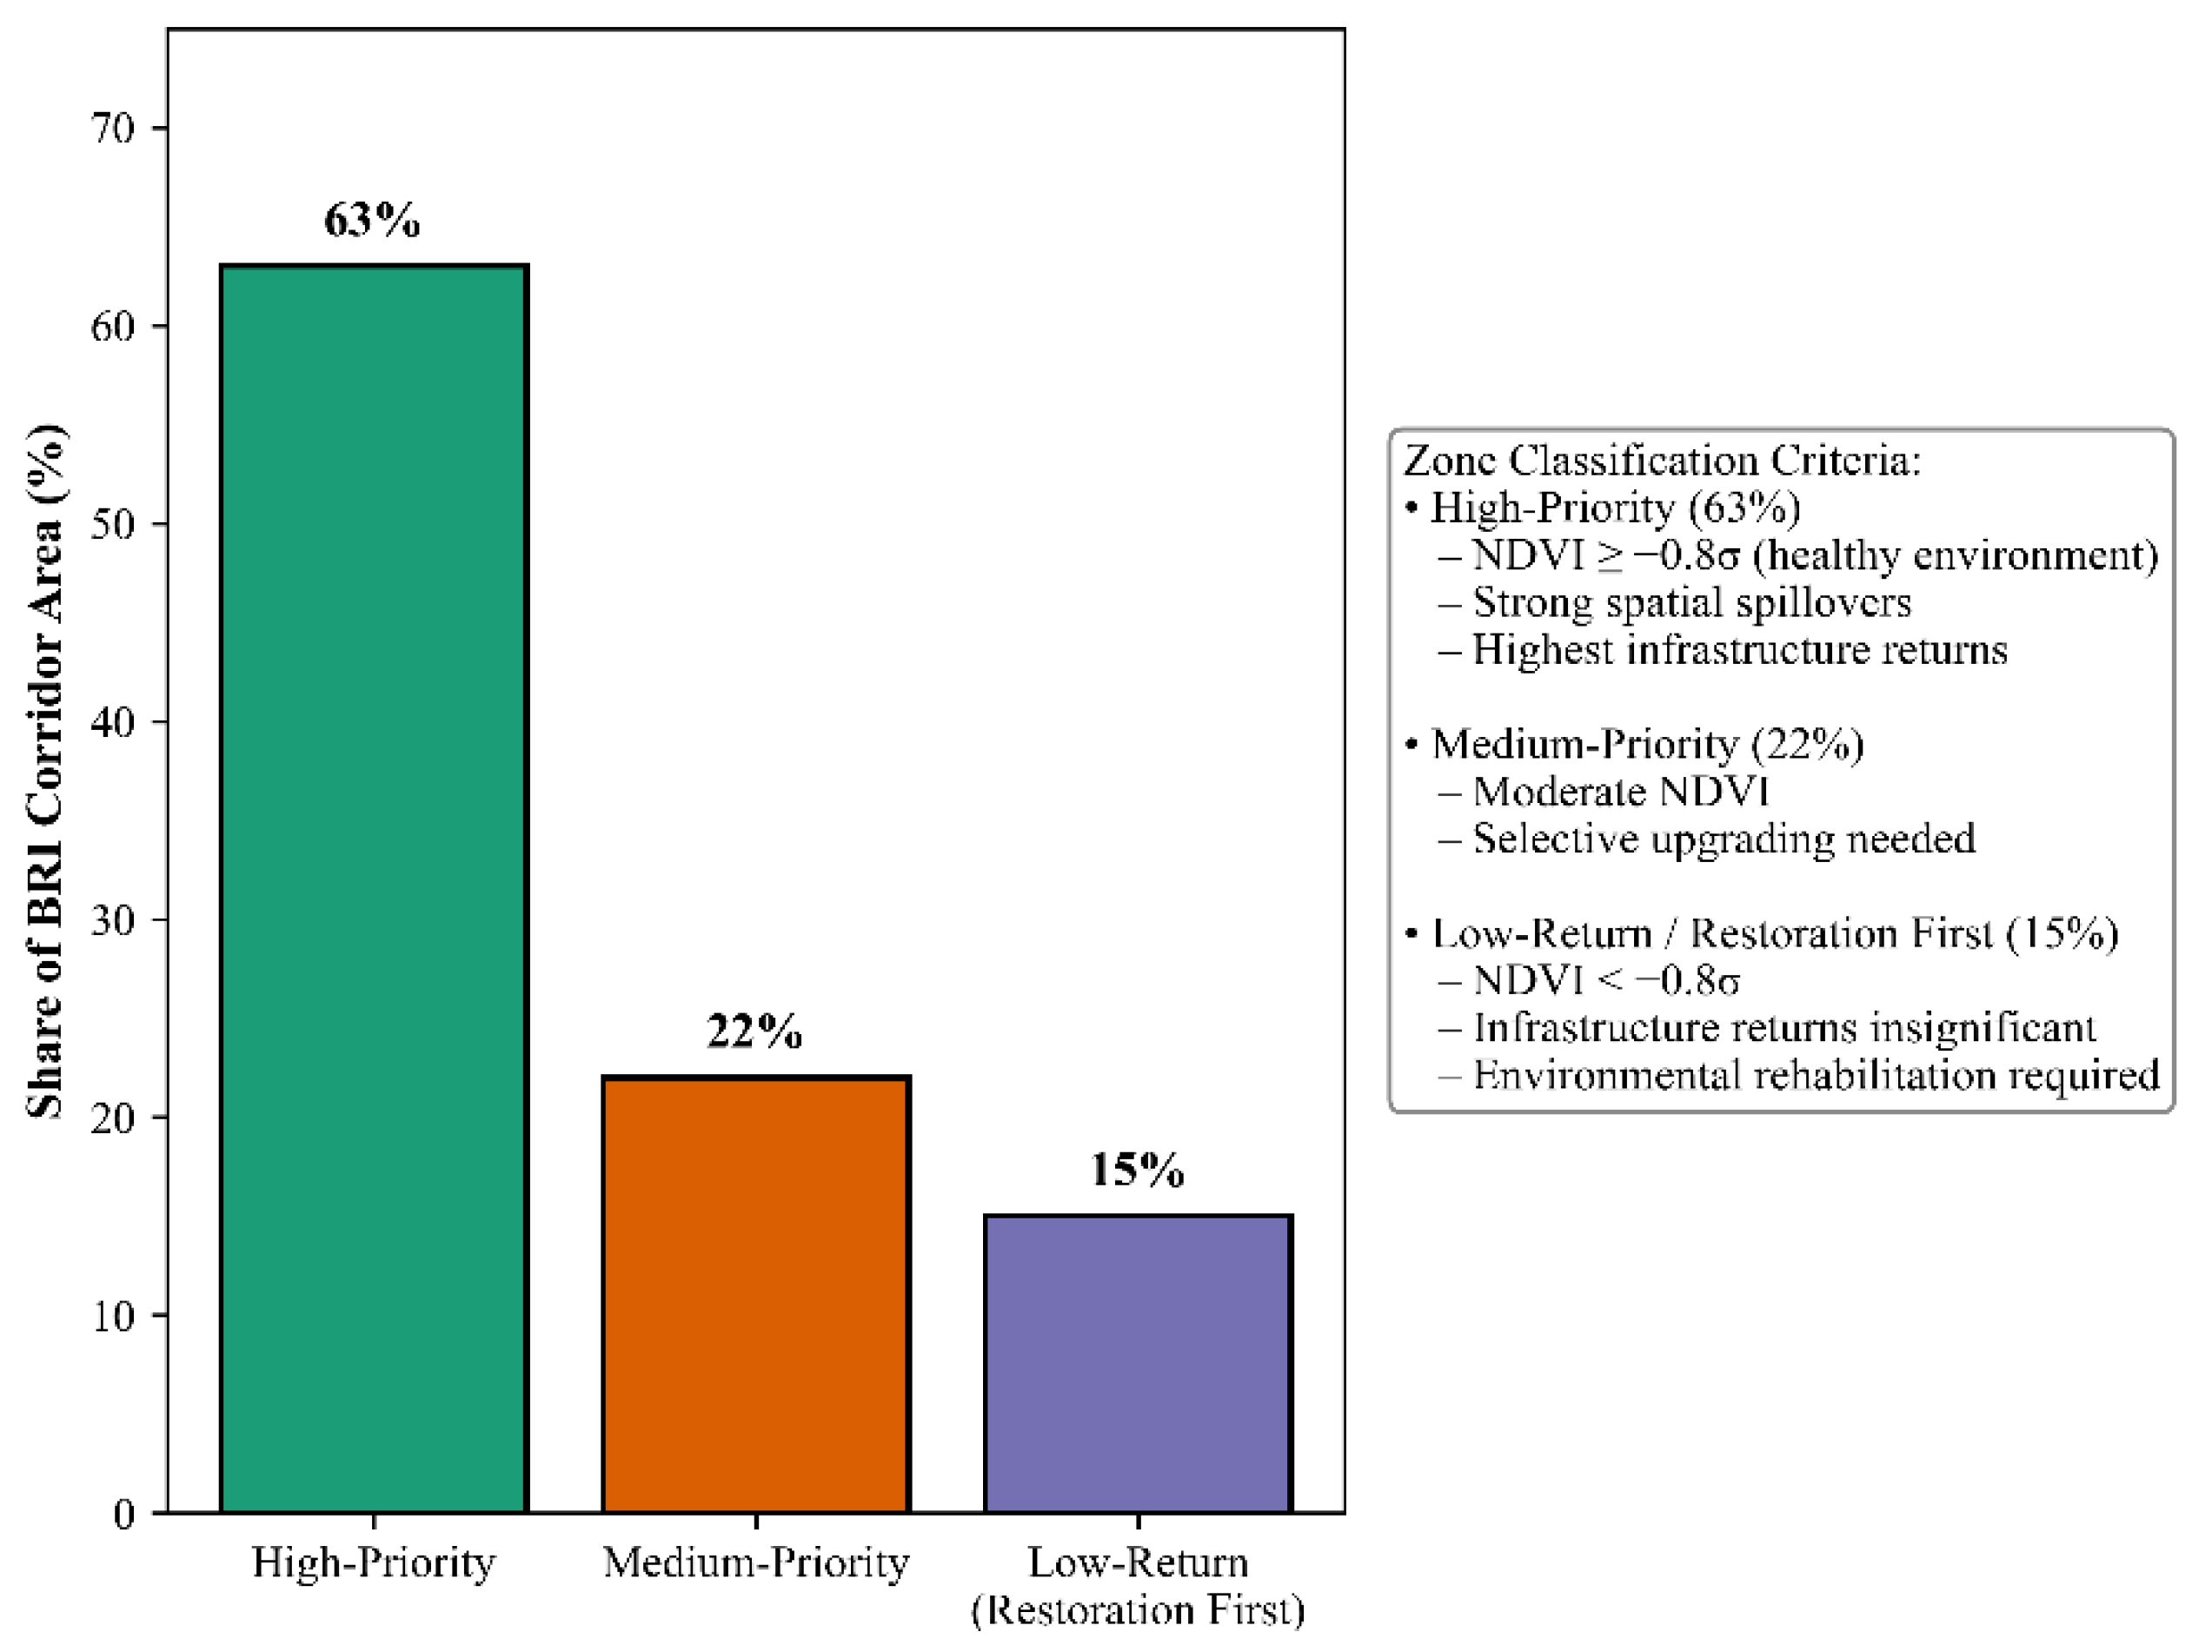

Table 1.
Methodological Synthesis: Spatial Econometric Framework for BRI Investment Analysis.
| Analytical Component | Operationalization in This Study | Theoretical Foundation | Key Supporting References |
|---|---|---|---|
| Spatial Econometric Specification | Spatial Durbin Model (SDM) with maximum likelihood estimation to capture direct and indirect (spillover) effects. | Spatial dependence theory and regional multiplier effects. | [6,7] |
| Infrastructure-Environment Interaction | NTL–NDVI interaction term with marginal effects analysis to identify environmental thresholds. | Environmental complementarity and natural capital as a productive asset. | [3,4] |
| Economic Return Measurement | Night-time lights (NTL) as a proxy for economic activity, accounting for spatial autocorrelation. | Agglomeration economies and the measurement of economic development from outer space. | [2,5] |
| Model Validation Framework | Diagnostics including pseudo R², Lagrange Multiplier (LM) tests, and robust standard errors. | Spatial econometric best practices and robustness checks for development analysis. | [1,7] |
| Policy Application | Investment prioritization algorithm based on statistically derived threshold effects and spillover patterns. | Optimal resource allocation and targeted investment in developing economies. | [1,4] |
Note: This table synthesizes the methodological shift from macro-level analysis to spatially explicit econometric modeling for development planning.
Table 2.
Variable Description and Data Sources.
| Variable | Description | Source | Temporal Resolution | Spatial Resolution |
|---|---|---|---|---|
| Economic Activity | VIIRS Night-time Lights (NTL), continuity-calibrated | NASA VIIRS | Annual (2010–2024) | 500 m |
| Infrastructure Density | Road network density + BRI project locations | OSM, BRI Database | Static (2024) | Vector |
| Environmental Conditions | NDVI, Climate Resilience, Rainfall, Topography | MODIS, WorldClim | Monthly (2010–2024) | 1 km |
| Socio-economic Factors | Population density, Urban expansion | WorldPop, Landsat | Annual (2010–2024) | 100 m |
Note: Integrated VIIRS-NTL, NDVI, and spatial modeling provide a consistent dataset for evaluating environmental thresholds in BRI corridors.
Table 3.
Direct, Indirect, and Total Effects from Spatial Durbin Model Estimation.
| ariable | Direct Effect | Indirect Effect | Total Effect |
|---|---|---|---|
| Infrastructure Density | 0.215** (0.032) | 0.315*** (0.045) | 0.530*** (0.068) |
| NDVI | -1.341*** (0.347) | -0.066 (0.041) | -1.407*** (0.352) |
| Infrastructure × NDVI | 6.442*** (0.091) | 0.315** (0.124) | 6.757*** (0.158) |
| Population Density | -0.139*** (0.039) | -0.007 (0.005) | -0.146*** (0.040) |
| Rainfall | 0.071*** (0.002) | 0.004* (0.002) | 0.075*** (0.002) |
Note: Standard errors in parentheses; *p < 0.05, **p < 0.01, ***p < 0.001. Direct effects represent impacts within the same spatial unit, indirect effects represent spillovers to neighboring units, and total effects represent the combined impact. The significant positive interaction term (Infrastructure × NDVI) confirms the complementarity hypothesis.
Table 4.
Spatial Durbin Model Estimation Results.
| Variable | Coefficient | Std. Error | z-Statistic | Probability | Direct Effect | Indirect Effect | Total Effect |
|---|---|---|---|---|---|---|---|
| CONSTANT | 0.5033 | 0.1702 | 2.958 | 0.003 | – | – | – |
| NDVI | –1.3408 | 0.3469 | –3.865 | 0.000 | –1.3408 | –0.0656 | –1.4064 |
| MNDWI | 0.1843 | 0.3168 | 0.582 | 0.561 | 0.1843 | 0.0090 | 0.1933 |
| Resilience | 0.00002 | 0.00005 | 0.459 | 0.646 | 0.0000 | 0.0000 | 0.0000 |
| Population Density | –0.1388 | 0.0389 | –3.566 | 0.000 | –0.1388 | –0.0068 | –0.1456 |
| Rainfall | 0.0708 | 0.0016 | 45.675 | 0.000 | 0.0708 | 0.0035 | 0.0743 |
| NTL–NDVI Interaction | 6.4424 | 0.0908 | 70.946 | 0.000 | 6.4424 | 0.3152 | 6.7576 |
| W_Economic_Activity | 0.0466 | 0.0148 | 3.157 | 0.002 | – | – | – |
Note: Maximum-likelihood results confirming the infrastructure–environment complementarity and significant spatial spillovers (Indirect Effect for NTL–NDVI Interaction = 0.3152).
Table 5.
BRI Investment Zone Classification.
| Zone Classification | Area (%) | Representative Districts | Key Characteristics |
|---|---|---|---|
| High-Priority | 63 | Dar es Salaam, Morogoro, Dodoma | High NDVI, strong spillovers, optimal returns |
| Medium-Priority | 22 | Tabora, Singida | Moderate NDVI, needs targeted investment |
| Low-Return (Restoration First) | 15 | Mtwara, Lindi | Low NDVI (< –0.8σ), insignificant returns, requires restoration |
Note: Classification framework derived from SDM results and NDVI threshold analysis, guiding environmentally adaptive investment planning.
Disclaimer/Publisher’s Note: The statements, opinions and data contained in all publications are solely those of the individual author(s) and contributor(s) and not of MDPI and/or the editor(s). MDPI and/or the editor(s) disclaim responsibility for any injury to people or property resulting from any ideas, methods, instructions or products referred to in the content. |
© 2025 by the authors. Licensee MDPI, Basel, Switzerland. This article is an open access article distributed under the terms and conditions of the Creative Commons Attribution (CC BY) license (http://creativecommons.org/licenses/by/4.0/).
Copyright: This open access article is published under a Creative Commons CC BY 4.0 license, which permit the free download, distribution, and reuse, provided that the author and preprint are cited in any reuse.


