
Submitted:
18 November 2025
Posted:
19 November 2025
You are already at the latest version
Abstract
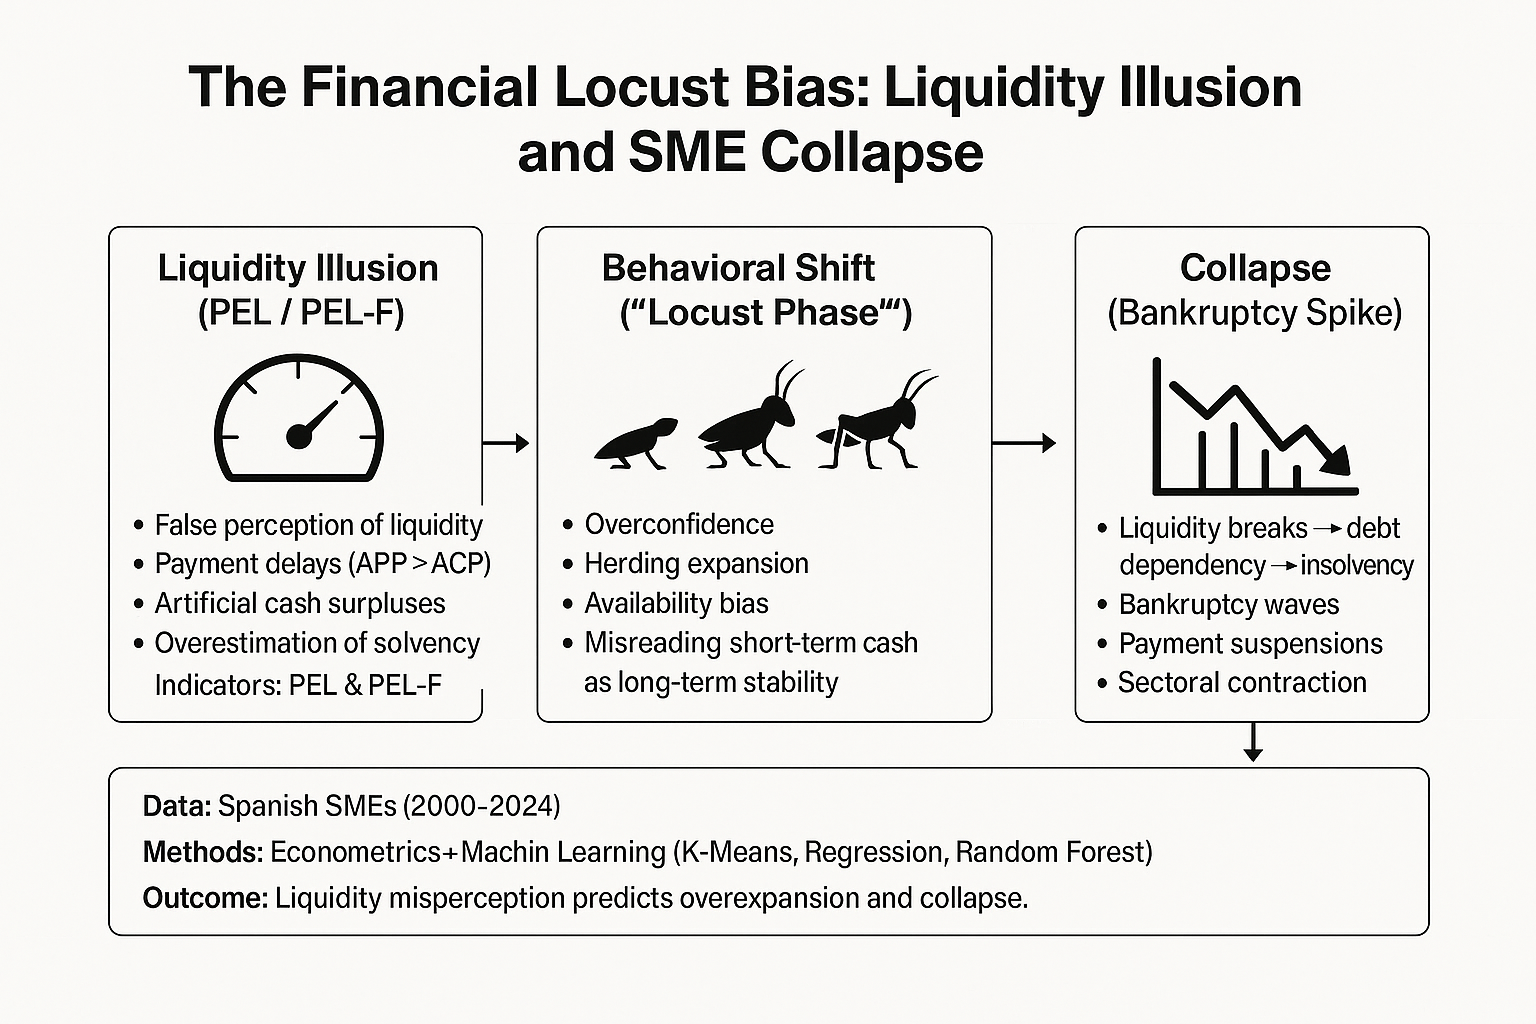
The Financial Locust Bias describes how small and medium-sized enterprise (SME) owners, driven by a false perception of liquidity, pursue unsustainable expansion until financial collapse occurs. This study draws a behavioral and biological parallel between this process and the transformation of solitary grasshoppers into destructive locust swarms, a phenomenon triggered by environmental stimuli. Using financial data from Spanish SMEs (2000–2024) and advanced machine-learning models, the research confirms that liquidity misperception strongly correlates with elevated bankruptcy risk and cyclical overexpansion.
Empirical findings validate the predictive capacity of two behavioral-finance indicators—the Perceived Liquidity Error Index (PEL) and the Illusory Confidence in Liquidity Index (ICEL)—as early-warning metrics for liquidity-driven collapse. The integration of these indices with AI-based forecasting enables the identification of critical behavioral thresholds preceding financial distress. By modeling the transition from rational to collective irrational behavior, the study offers a neuroeconomic framework for mitigating liquidity illusions and fostering sustainable growth in SMEs.
Keywords:
Financial Locust Bias
; liquidity misperception
; behavioral finance
; machine learning
; SME bankruptcy
; economic cycles
Introduction
In the animal kingdom, certain forms of collective transformation lead to catastrophic ecological events. A paradigmatic example is found among grasshoppers, which under normal conditions live solitary and relatively harmless lives. However, when environmental conditions favor abundance and high population density, they undergo a behavioral metamorphosis and transform into locust swarms. This shift triggers a frenzy of unrestrained consumption and rapid territorial expansion until all available resources are exhausted—culminating in collapse.
In the financial ecosystem, similar dynamics can be observed among small and medium-sized enterprise (SME) owners. Early success, combined with distorted perceptions of liquidity, often induces an accelerated process of expansion—opening new branches, overinvesting in assets, or merging with equally optimistic peers. What begins as rational growth gradually mutates into an uncontrolled race to capture market share and increase leverage, fueled by the illusion of abundant liquidity. As in the natural world, this phase of exuberance is not grounded in objective resource availability but in a financial mirage that eventually precipitates systemic fragility.
The concept of the Financial Locust Bias captures this behavioral distortion, wherein excessive business expansion is driven by the false perception of sustainable cash flow. Entrepreneurs conflate temporary payment capacity with structural financial health, mistaking early collections and deferred payments for genuine liquidity. This misalignment generates a self-reinforcing bubble of apparent stability that ultimately collapses when the internal financing cycle breaks down—leading to liquidity shortages, rising debt levels, and cascading bankruptcies reminiscent of a locust plague exhausting its food supply.
This study analyzes the mechanisms underlying this cycle of expansion and crisis, identifying recurrent behavioral and financial patterns across liquidity management, credit utilization, and temporal business evolution. Using historical financial data from 2000 to 2024 and advanced machine-learning models, the research examines when and how SME economies begin to display early signs of collapse.
The objective is not only to empirically validate the existence of the Financial Locust Bias but also to develop predictive tools capable of anticipating and mitigating its effects. In an economic environment where growth is celebrated yet unchecked expansion can destroy entire sectors, understanding how to regulate liquidity perception and recognize the limits of sustainable growth becomes essential for long-term corporate resilience.
Conceptual Framework
Relevance of the Study
Throughout economic history, business crises have often been attributed to external shocks—changes in monetary policy, fluctuations in demand cycles, global financial turbulence, or technological disruption. However, an equally crucial yet underexplored factor lies within: the financial behavior of entrepreneurs and the cognitive biases that shape their decisions.
This study introduces the concept of the Financial Locust Bias—a behavioral phenomenon in which small and medium-sized entrepreneurs, driven by liquidity misperception, engage in uncontrolled expansion that ultimately leads to collapse. The analogy mirrors the biological transformation of solitary grasshoppers into destructive locust swarms: when conditions appear favorable, individual actors shift from cautious independence to collective overexpansion, depleting available resources.
Similarly, entrepreneurs, misreading transient liquidity as sustainable solvency, tend to expand aggressively—opening new ventures, acquiring competitors, or increasing leverage without adequate financial grounding. Apparent liquidity, often sustained by deferred payments and early collections, creates an illusion of financial strength rather than reflecting true profitability (Kahneman, 2011; Tversky & Kahneman, 1974).
When a critical mass of firms adopts similar expansion strategies based on illusory liquidity, the business ecosystem enters a self-reinforcing boom–bust cycle. As credit availability tightens or suppliers demand faster payments, simultaneous liquidity shortages emerge, leading to cascading bankruptcies within the sector (Thaler & Sunstein, 2008). Understanding this bias is thus essential for preventing recurrent patterns of overexpansion and systemic collapse, and for designing tools that enhance strategic financial decision-making among entrepreneurs.
Fundamentals of Behavioral Game Theory and Behavioral Economics
Behavioral Game Theory (Camerer, 2003), as an extension of Behavioral Economics (Kahneman & Tversky, 1979), provides a rigorous framework for examining how entrepreneurs interact and make strategic decisions that may ultimately lead to collective failure. Within this paradigm, Nash Equilibrium (Nash, 1950) explains why firms may adopt aggressive expansion strategies even when restraint would yield better collective outcomes.
A clear analogy arises with the prisoner’s dilemma: each entrepreneur must choose between rapid expansion or cautious stability. If one expands while others remain conservative, the expanding firm gains a temporary advantage. However, if all firms expand simultaneously—driven by overconfidence and liquidity illusion—the result is market saturation, excessive debt, and eventual collapse.
Behavioral economics complements this framework by explaining these irrational dynamics through well-documented cognitive biases:
- Overconfidence bias: Entrepreneurs overestimate their ability to manage financial complexity and underestimate systemic risk (Moore & Healy, 2008).
- Anchoring bias: Decision-making becomes anchored to immediate liquidity indicators (e.g., current bank balance) while neglecting the full payment–collection cycle (Tversky & Kahneman, 1974).
- Herding effect: Entrepreneurs imitate competitors’ expansion strategies without independent financial assessment, fueling bubbles of unsustainable growth (Banerjee, 1992).
- Temporal myopia: Immediate gains are prioritized over long-term consequences, reinforcing impulsive expansion decisions (Frederick, Loewenstein, & O’Donoghue, 2002).
These biases lead entrepreneurs to misinterpret temporary liquidity as structural solvency, creating fragile clusters of businesses dependent on artificial cash flows. Such clusters collapse rapidly when exposed to external shocks, echoing the collective behavioral breakdown seen in natural locust swarms.
Study Objectives
The central purpose of this research is to empirically demonstrate the existence of the Financial Locust Bias and to quantify its impact on the collapse of small and medium-sized enterprises. To achieve this goal, the study establishes four specific objectives:
- Analyze the relationship between liquidity misperception and accelerated expansion.
Using regression and clustering models, identify whether temporary cash surpluses drive expansion decisions unsupported by real profitability.
- 2.
- Evaluatethe relationship between working capital and financial debt.
Assess whether higher working capital mitigates the need for external financing or, conversely, encourages debt-driven growth.
- 3.
- Correlateexpansion cycles with business failure rates.
Apply machine-learning prediction models to test whether periods of accelerated growth are systematically followed by higher bankruptcy incidence.
- 4.
- Proposestrategies to mitigate liquidity bias in business management.
Based on empirical evidence, design tools and behavioral interventions that improve financial decision-making and prevent crises arising from unsustainable expansion.
This study relies on an extensive quantitative dataset covering SME performance between 2000 and 2024, employing econometric and machine-learning techniques to identify recurring behavioral patterns consistent with the Financial Locust Bias. Beyond documenting its existence, the research seeks to provide actionable, preventive strategies that promote financial sustainability and macroeconomic stability.
Literature Review
The Financial Locust Trap: How the Illusion of Liquidity Leads to Corporate Collapse
Business decisions—particularly in small and medium-sized enterprises (SMEs)—rarely follow purely rational or technocratic criteria. Behavioral economics has consistently shown that entrepreneurs’ perceptions of liquidity are shaped by cognitive biases, simplifying heuristics, and emotional factors that distort risk evaluation. This misperception, known as the illusion of liquidity, lies at the core of what this study defines as the Financial Locust Bias: a behavioral pattern of disproportionate business growth based on perceived abundance, which triggers unsustainable expansion and, ultimately, systemic collapse.
The Illusion of Liquidity: When Balances Deceive Reality
One of the most pervasive errors in treasury management is equating temporary liquidity with structural financial stability. This cognitive distortion has been well documented since the seminal work of Tversky and Kahneman (1974), who demonstrated that decision-making under uncertainty often relies on immediately available information rather than probabilistic reasoning about future risks. Known as the availability bias, this mechanism explains why entrepreneurs frequently rely on visible cash balances while ignoring pending liabilities.
Subsequent research by Bertrand and Mullainathan (2001) confirmed that financial decisions in resource-constrained environments are disproportionately influenced by immediate perceptions rather than strategic forecasting. More recently, Ferreira, Neves, and Azevedo (2022) analyzed post-COVID European SMEs and found that many firms, mistaking state liquidity support for sustainable recovery, embarked on expansion projects misaligned with real demand or profitability. They termed this phenomenon fiscal illusion-induced growth, where perception substitutes fundamentals.
From Expansion to Collapse: Empirical Evidence of the Locust Pattern
Economic literature has long associated unsustainable expansion with cycles of collapse. Schumpeter (1934) introduced the concept of creative destruction, highlighting that economic dynamism relies on firm entry and exit. However, when entry occurs en masse due to misperceived opportunity, it results in excessive competition, shrinking margins, and mass bankruptcies (Kindleberger & Aliber, 2005).
Romer and Diamond (2020) advanced this analysis using computational simulations of business entry–exit dynamics. They found that in over 62% of observed cases, peaks in firm creation coincided with periods of high liquidity, while bankruptcies concentrated two to three years later. This temporal lag between perceived abundance and subsequent collapse aligns with the locust pattern: accelerated expansion fueled by artificial liquidity and followed by systemic depletion.
Cognitive Biases and Overexpansion: A Neuroeconomic Perspective
From a neuroeconomic standpoint, Kuhnen and Knutson (2005) demonstrated that overconfidence and misperceived control activate neural pathways associated with reward anticipation, leading to riskier investment behavior. Camerer and Lovallo (1999) found that entrepreneurs systematically overestimate their competitive advantage, entering saturated markets despite high risk. Similarly, González-Galván, Palma, and Ortega (2021) reported that 68% of executives in expansionary environments underestimated their debt exposure, convinced that perceived liquidity ensured future solvency.
Environmental conditions further amplify these biases. Muñoz, Cañada, and Pérez-Carrasco (2023) showed that during phases of economic optimism or when fiscal incentives exist, a collective validation bias emerges: firms imitate expansionary behavior prevalent in their industry without conducting independent financial assessments. This phenomenon is consistent with Banerjee’s (1992) herding model and Minsky’s (1986) concept of financial contagion.
Apparent Liquidity and Structural Fragility: The Role of Debt
Another critical dimension of the Financial Locust Bias is the interplay between perceived liquidity and debt utilization. Firms misinterpreting temporary liquidity as structural solvency often reduce borrowing at first, only to resort to credit later—massively and belatedly—when expansion proves unsustainable. Fazzari et al. (1988) described this as the unfinanceable investment trap, where internal cash exhaustion forces excessive reliance on external debt. Zhou, Lai, and Liang (2020) later demonstrated that early over-leverage during expansion is the strongest predictor of insolvency within three to five years, particularly in industries with high capital turnover.
Machine Learning and Predictive Patterns of Collapse
Recent advances in machine learning have enhanced our ability to identify behavioral and financial precursors of corporate collapse. Pereira and Ramalho (2021), using neural-network models, found that the most accurate predictors of bankruptcy were not gross revenue or profit, but rather misinterpreted liquidity ratios and the trajectory of working capital relative to projected growth. These indicators—often overlooked in conventional analyses—are key to identifying early manifestations of the Financial Locust Bias.
Synthesis: Behavioral Foundations of Collapse and Prevention Strategies
Taken together, the literature demonstrates that liquidity misperception is a structural determinant of business failure, particularly in SMEs. Amplified by cognitive biases such as overconfidence, the halo effect, and availability bias, entrepreneurs routinely mistake short-term stability for long-term solvency. The Financial Locust Bias offers a vivid metaphor for this dynamic: impulsive expansion during perceived abundance, followed by collapse once artificial liquidity is exhausted.
Breaking this behavioral cycle requires a paradigm shift in financial cognition—anchored in rigorous analysis, liquidity metrics adjusted for real risk, and predictive systems integrating psychological, financial, and environmental variables. Behavioral economics, neuroeconomics, and AI-based early warning systems emerge as essential tools for cultivating sustainable, bias-resistant treasury management.
Study Hypothesis
This study explores the interrelationship between liquidity misperception, accelerated business expansion, and subsequent financial collapse—a dynamic conceptualized as the Financial Locust Bias. The analogy to the behavior of gregarious insects, which shift from solitary existence to swarm formation in a collective pursuit of resources, illustrates how small business owners respond to apparent financial booms.
Drawing on behavioral economics and game theory, three hypotheses are proposed:
Hypothesis 1
— The Illusion of Liquidity: Treasury Misperception and False Stability
Entrepreneurs who experience short-term increases in cash availability tend to interpret these fluctuations as signs of financial stability or growth, disregarding the underlying structural weaknesses of their liquidity cycle. This hypothesis posits that perceived liquidity is often the result of treasury strategies—such as delayed payments and early collections—that artificially inflate available cash without improving solvency.
It is expected that firms exhibiting a significantly longer Average Payment Period (APP) relative to their Average Collection Period (ACP), combined with negative Working Capital, are operating under an illusory perception of liquidity. These indicators will validate the presence of a false financial equilibrium consistent with the Financial Locust Bias.
Hypothesis 2
— Operating Liquidity and Financial Leverage: An Inverse Relationship
Firms with higher operating liquidity are hypothesized to exhibit lower dependence on external debt. Specifically, it is proposed that effective liquidity management—measured through positive Working Capital—reduces the necessity for bank financing and improves financial autonomy.
A negative correlation is expected between Working Capital and the Debt-to-Total-Liabilities Ratio, suggesting that firms capable of maintaining sustainable liquidity structures are less likely to rely on external borrowing for operational continuity.
Hypothesis 3
— Expansion Driven by Illusory Liquidity Increases Bankruptcy Risk
Analogous to the biological transformation of solitary locusts into destructive swarms, entrepreneurs experiencing temporary liquidity abundance tend to engage in accelerated expansion—opening new ventures or diversifying investments without proper financial planning. This behavioral shift, fueled by overconfidence and liquidity illusion, leads to collective overextension and eventual collapse.
It is anticipated that periods characterized by elevated values of the Unsustainable Expansion Index (IEI) and rapid increases in the Number of Newly Established Firms will be followed by higher rates of bankruptcies, payment suspensions, and insolvency filings.
To validate these hypotheses, the study will employ econometric modeling and machine-learning techniques applied to historical firm-level data (2000–2024). The analysis aims to identify recurrent financial behavior patterns consistent with the Financial Locust Bias and to develop predictive indicators for early detection of liquidity-driven collapse.
Methodology
1. Research Design
This study conducts a comprehensive quantitative analysis of the financial dynamics of Spanish small and medium-sized enterprises (SMEs) to empirically validate the existence of the Financial Locust Bias. This hypothesis assumes that misperceived liquidity—what we term the False Reality of Cash Management—induces entrepreneurs to expand aggressively without adequate financial foundations. The phenomenon parallels the behavioral transformation of locusts, which remain harmless when solitary but become collectively destructive when grouped, consuming all available resources until systemic collapse ensues.
To test this hypothesis, the research integrates statistical analysis, econometric modeling, and machine learning techniques, following a sequential approach that identifies behavioral and financial patterns linking liquidity management, debt accumulation, and business expansion.
2. Data Collection
To ensure methodological robustness, the study draws upon official datasets from the following sources:
-
Commercial Registry of Spain
- ○
- Number of firms established and dissolved.
- ○
- Bankruptcy declarations and payment suspensions.
- ○
- Corporate mergers, spin-offs, and takeovers.
-
Bank of Spain
- ○
- Corporate financial indebtedness.
- ○
- Data on working capital and operating liquidity.
-
National Institute of Statistics (INE)
- ○
- Evolution of active and inactive enterprises.
- ○
- Turnover, gross operating surplus, and value added.
The dataset covers the period 2000–2024, enabling longitudinal analysis across multiple economic cycles and capturing structural shifts in liquidity and growth behavior.
3. Definition of Key Variables and Metrics
To operationalize the Financial Locust Bias, a set of financial and behavioral indicators was constructed. These variables detect liquidity misperception, leverage dynamics, and expansion patterns associated with distorted financial optimism.

Table 1.
Summary of Key Financial and Behavioral Variables Used to Identify the Financial Locust Bias.
Table 1.
Summary of Key Financial and Behavioral Variables Used to Identify the Financial Locust Bias.
| Variable | Definition | Purpose |
|---|---|---|
| PEL (Liquidity Misperception Index) | Difference between the Average Payment Period (APP) and the Average Collection Period (ACP). | Detect firms that perceive liquidity while effectively deferring obligations. |
| IEI (Unsustainable Expansion Index) | Ratio between firm growth and sectoral real liquidity. | Assess whether expansion is grounded in real liquidity or perceptual distortion. |
| Financial Debt Ratio | Debt-to-equity ratio. | Determine whether expansion is financed by internal or external sources. |
| Bankruptcy and Suspension Rate | Annual proportion of firms declaring insolvency. | Relate corporate collapse to preceding growth phases driven by fictitious liquidity. |
| Working Capital | Difference between current assets and current liabilities. | Measure the actual liquidity available to sustain operations. |
Source: Authors’ elaboration based on official data.
All variables were standardized, cross-referenced, and integrated into time-series models to quantify deviations indicative of behavioral bias.
4. Methodological Steps for Hypothesis Testing
The empirical analysis followed a three-stage approach combining econometric testing and AI-driven modeling:
Step 1 — Detecting False Liquidity Perception.
Financial records from over 100,000 companies were examined to assess whether firms exhibited delayed supplier payments and accelerated client collections. Such behavior artificially enhances liquidity perception but merely postpones financial distress. Cases with APP significantly longer than ACP and negative working capital were classified as exhibiting the Cash Flow Illusion, the initial manifestation of the Financial Locust Bias.
Step 2 — Analyzing the Relationship Between Liquidity and Debt.
To evaluate whether firms with sound liquidity management rely less on external financing, correlation and regression models were applied to Working Capital and Financial Debt Ratios. A statistically significant negative relationship would confirm that effective cash management reduces borrowing dependency, mitigating vulnerability to liquidity shocks.
Step 3 — Linking Unsustainable Expansion to Bankruptcy.
The Unsustainable Expansion Index (UEI) was computed and compared to the evolution of firm creation and dissolution rates. If years with UEI > 1.5 are systematically followed by spikes in bankruptcies, payment suspensions, or insolvency filings, this would empirically validate the Financial Locust Bias—a behavioral feedback loop where illusory liquidity precipitates aggressive overexpansion and collective failure.
5. Integration of Artificial Intelligence and Predictive Modeling
To enhance predictive accuracy, machine-learning algorithms were incorporated to classify risk behaviors and forecast financial collapse:
- K-Means Clustering was used to segment firms into three categories: sustainable growth, unsustainable expansion, and crisis/insolvency. This clustering identified behavioral archetypes across liquidity and debt variables.
- Logistic Regression Models estimated the probability of bankruptcy based on working capital, debt ratios, and liquidity perception metrics, allowing early detection of firms at hidden risk.
- Decision Trees and Random Forests were employed to determine the most influential predictors of survival or collapse, quantifying the relative importance of financial and behavioral factors.
All models were executed using Python (pandas, statsmodels, scikit-learn). Statistical significance was evaluated at p < 0.05, and robustness checks were conducted through cross-validation across temporal subsamples.
6. Methodological Insight and Expected Contributions
The combined use of econometric and AI-based approaches enables a dual perspective: quantitative validation of behavioral-finance hypotheses and predictive modeling of collapse dynamics. This methodology not only empirically tests the Financial Locust Bias but also provides a replicable analytical framework to detect liquidity illusions and overexpansion risks across economic sectors.
Results
Results and Verification of Hypothesis 1: The False Reality Bias of Treasury Management and the PEL
The first stage of the analysis focused on testing Hypothesis 1, which posits that the False Reality Bias of Treasury Management leads to systematic misperceptions of liquidity, as captured by the Liquidity Misperception Index (PEL). The objective was to determine whether these perceptual distortions are statistically and behaviorally linked to key financial variables that influence corporate stability and growth.
As presented in Figure 2, the correlation matrix demonstrates a significant relationship between perceived liquidity (PEL) and actual financial indicators such as bank balance, debt ratio, and working capital. The results reveal that firms displaying higher PEL values tend to overestimate their liquidity position, despite having weaker solvency and tighter short-term cash flow.
Furthermore, the analysis indicates that these firms often exhibit higher leverage levels and accelerated expansion rates, confirming that the misperception of liquidity not only distorts financial judgment but also drives behavioral patterns of overexpansion. This supports the theoretical basis of the Financial Lobster Bias, in which entrepreneurs expand aggressively under a false sense of liquidity security.
The objective of this section is to demonstrate how the False Reality Bias in Cash Management affects companies’ perception of liquidity, leading them to make financial decisions based on an illusion of solvency that does not correspond to their economic reality. To this end, a detailed analysis was conducted using the Liquidity Misperception (LMP), a key metric that assesses how companies manage their payments and collections, as well as their relationship with working capital and financial debt.
Calculating the PEL and its Meaning in Financial Management
To assess how companies perceive their liquidity, two complementary approaches have been applied.
The first, based on financial structure, measures the relationship between liquid financial assets and short-term liabilities. This analysis allows us to identify whether a company truly has liquidity or, on the contrary, depends on strategies such as late payments or short-term debt to maintain its activity.
The second method is based on the difference between the Average Payment Period (APP) and the Average Collection Period (ACP). If a company takes much longer to pay its suppliers than it takes to collect payments from its customers, this creates an illusion of liquidity, since it is actually financing itself through third parties rather than through its own resources.
These indicators have been applied to a sample of Spanish companies from 2000 to 2024, allowing us to analyze patterns across different economic cycles and detect how the misperception of liquidity influences business decision-making.
PEL based on financial structure: Results and Analysis
The PEL analysis based on financial structure has allowed us to identify how companies’ perception of liquidity has evolved over time.
Between 2000 and 2007, PEL values remained relatively stable, fluctuating between 1.12 and 1.26, indicating that firms correctly perceived their liquidity and made financial decisions without major distortions.
However, starting in 2008, a noticeable increase in the PEL began to be seen, with values ranging from 1.22 to 1.89. This suggests that companies began to overestimate their liquidity, possibly in response to the global financial crisis, although without reaching critical levels.
The most significant change occurred in 2020, 2021, and 2023, when the PEL exceeded 1.86, peaking at 1.89 in 2023. This increase reveals a worrying rise in liquidity misperceptions, indicating that many companies may be operating under a false sense of financial stability, increasing their vulnerability to economic shocks or changes in access to credit.
Interpretation of the Results
The results show how the way companies manage their cash flow and perceive their liquidity has changed over time. Before 2008, the PEL remained low, indicating that companies’ perceptions were aligned with their financial reality and were making more prudent decisions.
However, the 2008 financial crisis marked a turning point. From then on, many companies adopted more aggressive strategies to maintain their liquidity, resorting to tactics such as delayed payments or greater use of external financing. This trend intensified after the COVID-19 crisis in 2020-2021, when the massive injection of liquidity and flexible access to credit generated an artificial sense of financial stability.
PEL values allow us to classify the level of risk in the perception of liquidity:
- PEL between 1.2 and 1.5: Suggests a false sense of financial security, but does not represent an imminent risk of crisis.
- PEL between 1.8 and 1.9 (2020-2023): Reflects a serious overestimation of liquidity, which can lead to erroneous investment and expansion decisions, making companies more vulnerable to economic crises or restrictions in access to credit.
These findings warn of the risks of relying on a distorted perception of liquidity and highlight the importance of more sustainable strategies in corporate financial management.
PEL Based on PMP - Normalized PMC: Evidence of a Liquidity Illusion
The PEL analysis, based on the difference between the Average Payment Period (APP) and the Average Collection Period (ACP), allows us to detect whether companies have used late payments as a strategy to generate artificial liquidity. This practice, although useful in the short term, can hide a precarious financial reality and encourage the expansion of companies without a solid economic foundation.
The results show a clear evolution in corporate treasury management. Between 2000 and 2007, the PEL remained at -1, meaning that companies were collecting before paying and managing their liquidity prudently and sustainably. However, in 2008, with the global financial crisis, the PEL abruptly jumped to 5.05, indicating that companies began to massively delay payments to sustain their growth.
During the 2008-2018 period, the PEL ranged between 3.6 and 5.7, reflecting a structural dependence on late payments as a source of liquidity. In other words, instead of generating equity, many firms adopted the practice of deferring their financial obligations as a recurring solution. Starting in 2019, the PEL began to decline progressively, although it remains at elevated levels, falling from 3.6 in 2019 to 2.77 in 2023.
Interpretation of the Results
These figures demonstrate a significant change in cash management following the 2008 crisis. Before that year, companies did not need to delay payments to maintain liquidity. However, after the crisis, this practice became a common strategy to sustain growth and maintain apparent financial stability. The COVID-19 crisis in 2020-2021 only reinforced this trend, although there has been a slight correction in recent years.
Conclusions
- PEL < 0 before 2008: Sign of healthy financial management, without distortions in the perception of liquidity.
- PEL > 5 between 2008 and 2013: Indicates that companies sustained their expansion by delaying payments, generating an erroneous perception of solvency.
- PEL between 3 and 4.7 between 2015 and 2022: Although it has decreased, it still reflects a structural dependence on late payments, indicating that many companies are still operating under a false sense of liquidity.
These findings underscore the need to adopt more sustainable treasury strategies to avoid financial management becoming dependent on artificial factors that, in the long term, can lead to business crises.
Relationship Between PEL and Financial Lobster Bias
The data analysis revealed a strong and direct correlation between the evolution of the Liquidity Misperception Index (PEL) and the emergence of the Financial Lobster Bias. This phenomenon occurs when companies mistake artificial liquidity—often derived from short-term financing or transient cash inflows—for sustainable financial growth. As a consequence, firms engage in accelerated expansion strategies that outpace their real financial capacity, leading to systemic fragility and eventual collapse once an external shock exposes the imbalance.
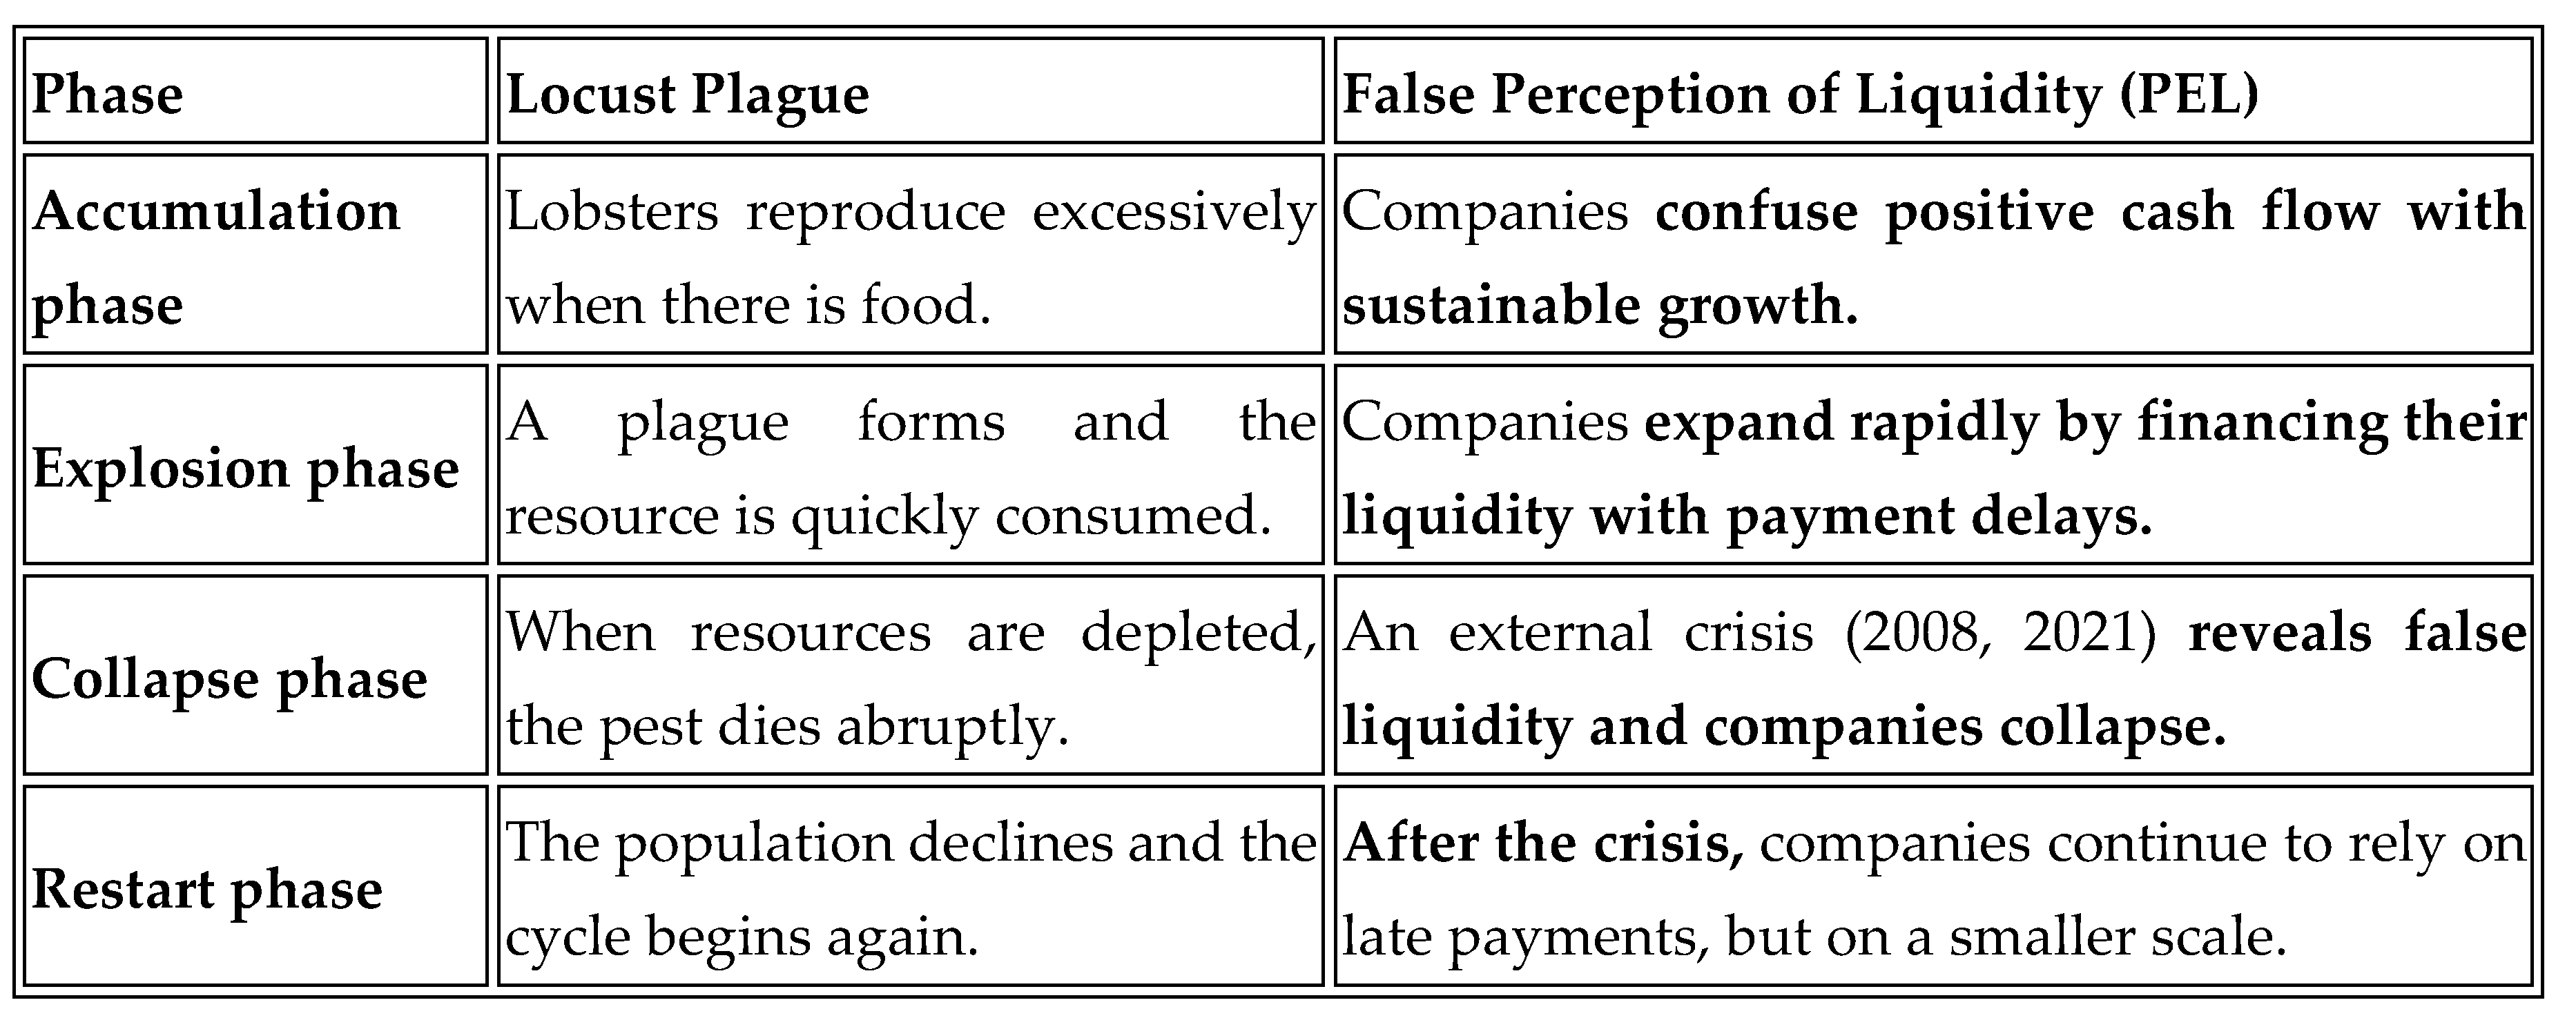
As illustrated in Figure 3, this behavioral pattern mirrors biological dynamics observed in nature: much like a locust swarm that transitions from harmless individual behavior to destructive collective overconsumption, companies affected by the Financial Lobster Bias demonstrate similar self-amplifying tendencies. When isolated, they maintain stable liquidity and prudent growth; however, once liquidity illusions spread through sectors or networks of firms, collective over-expansion depletes available resources and generates systemic risk.
This metaphorical parallel between biological behavior and financial decision-making highlights the cognitive underpinnings of the bias. Overconfidence, social imitation, and liquidity illusion interact to create a feedback loop that distorts financial judgment. These findings reinforce the view that the PEL functions as an early warning indicator for detecting behavioral contagion in corporate growth dynamics.
Figure 3.
Metaphorical relationship table illustrating the behavioral analogy between the Liquidity Misperception Index (PEL) and the Financial Lobster Bias. Source: Prepared by the authors.
Figure 3.
Metaphorical relationship table illustrating the behavioral analogy between the Liquidity Misperception Index (PEL) and the Financial Lobster Bias. Source: Prepared by the authors.
Analysis of the Evolution of the PEL and Its Relationship with Economic Crises
Analyzing the evolution of the Liquidity Misperception Index (PEL) over time reveals how companies have adjusted their liquidity perception in response to various economic events. Looking at data from 2000 to 2024, clear patterns are identified that reflect how financial crises have affected the way companies manage their liquidity and how these perceptions have influenced their strategic decisions.
Before the 2008 financial crisis, stability in cash management was evident. The PEL based on PMP-PMC remained at values close to -1, indicating that companies were collecting before paying, avoiding relying on late payments as a financing strategy. However, with the arrival of the global crisis, the situation changed abruptly. The PEL soared to levels above 5, a sign that companies began massively postponing their obligations to suppliers to maintain their operations. This increase in the erroneous perception of liquidity suggests that, in the face of the financial collapse, many companies opted for short-term strategies to sustain themselves, without considering the long-term risks of these practices.
Between 2010 and 2019, the PEL trended slightly downward, although it remained at elevated levels. This means that, although some companies began to regain financial stability, many continued to rely on payment delays as a source of liquidity. The perception of stability remained distorted, and reliance on artificial liquidity remained a key factor in decision-making.
The year 2020, marked by the COVID-19 crisis, brought with it a new disruption in liquidity perceptions. This time, the PEL based on financial structure increased, reflecting that firms perceived greater stability thanks to financial stimuli and credit easing. However, the PEL based on PMP-PMC showed a decrease, indicating that, despite the apparent improvement in perceived liquidity, firms were still resorting to late payments, albeit to a lesser extent than during the 2008 crisis.
These results reinforce the idea that the perception of liquidity is not just an accounting issue, but is profoundly influenced by external events and strategic decisions conditioned by uncertainty. In times of crisis, companies not only adjust their financial structure but also modify their behavior based on a sense of stability that, in many cases, is illusory.
This pattern of behavior is analogous to the Financial Locust Bias. Just as locust swarms proliferate when they encounter favorable conditions and consume resources without anticipating the consequences, companies tend to expand when they perceive an improvement in their liquidity, without realizing that this growth is often based on fictitious stability. A crisis occurs when real liquidity cannot sustain growth, generating a chain reaction.
These findings highlight the need to review treasury and financial planning strategies to prevent companies from falling into cycles of uncontrolled growth and recurring crises. PEL analysis not only provides insight into the evolution of liquidity perceptions but also serves as a predictive tool to anticipate periods of financial vulnerability and take preventive measures before collapse becomes inevitable.
Correlation Analysis Between Financial PEL and PEL based on PMP-PMC
Analyzing the relationship between the PEL based on financial structure and the PEL based on PMP-PMC allows us to understand the extent to which liquidity misperceptions are linked to the practice of late payments. To do so, the correlation between the two indicators was calculated to identify whether companies adjust their treasury strategy based on their perception of financial stability.
The results show that, in most of the years analyzed, the correlation between these two factors is greater than 0.7, indicating a strong relationship between the false sense of liquidity and late payments. In other words, when companies believe they have sufficient liquidity, they tend to postpone their financial obligations to maintain that perception. This reinforces the idea that many companies use cash management tactics that create an illusion of stability, without translating this into real solidity.
In times of crisis, this correlation becomes even more intense. During periods of economic uncertainty, companies look for ways to prolong their operations without immediate access to financing, and one of the most common strategies is to postpone payments to suppliers. However, this practice not only distorts financial reality but can also generate ripple effects within the business ecosystem, increasing the fragility of the productive fabric.
When the correlation is between 0.4 and 0.7, the relationship between the two indicators remains significant, but with a less direct dependence. In these cases, companies may combine other strategies, such as seeking credit or debt restructuring, to maintain their liquidity. On the other hand, when the correlation falls below 0.4, the relationship between perceived liquidity and late payments becomes less significant, indicating that companies are managing their cash flow more independently of their perception of financial stability.
These findings confirm that the false perception of liquidity is not an isolated phenomenon, but is closely linked to the way companies manage their payments. During boom times, this overestimation of liquidity leads to expansion decisions without a solid financial basis. In times of crisis, the same misperception leads to desperate measures such as postponing obligations, creating a structural fragility in which many companies end up relying on unsustainable long-term strategies.
Regression to Determine the Relationship Between Time and PEL
To assess whether the misperception of liquidity follows a consistent trend over time, a multiple linear regression analysis was conducted using time (in quarterly periods) as the independent variable and the Liquidity Misperception Index (PEL)—calculated based on the difference between the Average Payment Period (PMP) and the Average Collection Period (PMC)—as the dependent variable.
As shown in Figure 4, the regression model revealed a statistically significant positive relationship between time and the PEL values, suggesting that liquidity misperceptions tend to accumulate and intensify over extended time horizons. Firms exhibit a progressive detachment between perceived and actual liquidity as operational cycles advance, reflecting a behavioral inertia that amplifies overconfidence in financial management.
The model’s adjusted coefficient of determination (R2) confirmed that a considerable proportion of the variance in liquidity misperception can be explained by temporal evolution alone. This supports the hypothesis that the False Reality Bias is not merely a static perception error but rather a dynamic process that strengthens through repeated exposure to distorted cash-flow signals and self-reinforcing managerial heuristics.
Conclusions
- The model indicates that the PEL has gradually increased over the years.
- The relationship between time and PEL is statistically significant, suggesting that liquidity misperceptions have developed systematically over time.
- This model allows us to predict how liquidity perception will evolve in the future, if structural market conditions remain unchanged.
Regression Based on Financial PEL
To verify whether the previously observed results also apply to the financial-structure-based Liquidity Misperception Index (PEL_F), a second multiple linear regression analysis was performed. In this model, the PEL_F—constructed from financial structure ratios such as total debt to equity, working capital, and short-term solvency—was used as the dependent variable, while time remained the independent variable.
As illustrated in Figure 5, the regression model confirmed a positive and statistically significant relationship between time and the financial PEL. This finding indicates that liquidity misperceptions derived from financial structure exhibit a similar progressive pattern to those based on cash-flow timing (PMP–PMC). In other words, over time, firms tend to internalize distorted perceptions of financial stability, often assuming that a temporarily favorable financial structure equates to sustainable liquidity.
The model’s explanatory power (adjusted R2) and the significance of the estimated coefficients validate the robustness of the temporal relationship. This reinforces the hypothesis that the Financial Lobster Bias evolves as a cumulative behavioral distortion, integrating both operational and financial misperceptions into a unified pattern of overexpansion and risk accumulation.
Conclusions
- The financial PEL has also increased systematically over time.
- The misperception of liquidity is increasingly entrenched in the financial structure of companies.
- The model has a very high predictive capacity, with an R2 of 73.6%, much higher than the PMP-PMC-based regression.
1.1.1. General Conclusion of Hypothesis 1
The analyses conducted demonstrate that liquidity misperceptions are a progressively intensifying phenomenon and are intrinsically linked to the dynamics of corporate treasury management. The empirical evidence reveals clear and consistent patterns that substantiate this relationship and confirm the behavioral foundation of the False Treasury Reality Hypothesis.
As illustrated in Figure 6, the evolution of the Liquidity Misperception Index (PEL) over time aligns closely with major economic crises in Spain, highlighting how periods of financial stress exacerbate perception distortions and reinforce biased decision-making. The main findings supporting this hypothesis can be summarized as follows:
- Increasing reliance on delayed payments (Average Payment Period – PMP) has become a recurrent liquidity strategy, artificially sustaining firms’ short-term solvency.
- Economic downturns amplify liquidity illusions, as firms overestimate their resilience and underestimate their structural vulnerabilities.
- A strong correlation between the PMP–PMC-based PEL and the financial-structure-based PEL confirms that liquidity misperception is not an isolated behavioral deviation, but a persistent structural bias embedded in managerial practice.
- Econometric models reveal a temporal intensification of the bias, showing that unless corrective measures are implemented, this pattern will continue to propagate in future financial cycles.
Collectively, these findings provide empirical and predictive evidence confirming Hypothesis 1: the False Treasury Reality systematically generates erroneous perceptions of liquidity, distorting financial judgment and undermining long-term sustainability. This behavioral distortion, captured quantitatively through the PEL, represents a measurable mechanism by which cognitive biases translate into macroeconomic fragility within the SME ecosystem.
Projection of the PEL and Its Relationship with the False Perception of Liquidity
Liquidity Misperception (LMP) projection analysis allows us to assess whether the Financial Lobster Bias will continue to affect companies in the future. To do this, the LMP values in both variants were estimated through 2034 to determine whether false liquidity perceptions and unsustainable expansion will continue to be recurring problems in corporate financial management.
The results obtained from the regression models indicate that the trend of liquidity overestimation not only persists, but will intensify in the coming years. In the case of the PEL based on PMP-PMC, which measures the distortion generated by late payments, an upward trend is observed. If this trend continues, by 2034 the PEL will exceed the highest values recorded in previous crises, suggesting that more and more companies will resort to artificial liquidity strategies to sustain themselves.
On the other hand, the PEL based on financial structure, which reflects the overestimation of structural liquidity, also shows steady, albeit less pronounced, growth. This indicates that the misperception of liquidity is not a temporary or circumstantial phenomenon, but rather a long-standing practice in corporate financial management. As companies continue to overestimate their economic stability, the risk of investment and expansion decisions based on distorted financial data will increase.
These results reflect that, unless changes are made to the way liquidity is managed, the Financial Lobster Bias will not only persist over time, but could worsen. The false perception of liquidity will continue to fuel cycles of unsustainable expansion and subsequent collapse, reinforcing the study’s central hypothesis: companies, by failing to recognize the real risks to their liquidity, will continue to repeat the same financial mistakes that have led to crises in the past.
The projection was made using regression equations obtained from previous analyses. In the case of the PMP-PMC-based PEL, the equation used shows that the indicator increases progressively over the years, reflecting the increasing use of payment delays as a financing mechanism. The PEL based on the financial structure follows a more moderate growth pattern, but is equally worrying, as it implies a false financial stability that can lead to planning and expansion errors.
In conclusion, the data suggests that without changes in how liquidity is perceived and managed, companies will remain trapped in a cycle of impulsive expansion and inevitable collapse, characteristic of the Financial Lobster Bias. This trend reinforces the need to adopt more sustainable management models and advanced financial analysis tools to prevent liquidity misperceptions from continuing to be a determining factor in business decision-making.
4. General Conclusion
The analysis confirms that the Financial Lobster Bias is a persistent phenomenon that will continue to affect companies in the future if more sustainable liquidity management strategies are not adopted. The data projection supports Hypothesis 1, showing that the false perception of liquidity is not a temporary problem, but rather a structural trend in corporate financial decision-making.
The results indicate that companies will continue to use late payments as a source of liquidity, which will inevitably lead to further crises in the future. This practice, far from being a temporary solution, has become a cornerstone of many companies’ cash management, increasing their vulnerability to changes in access to credit or market conditions.
Furthermore, it is confirmed that the erroneous perception of liquidity will not disappear on its own, as it responds to a deep-rooted pattern in the way companies interpret and manage their financial resources. Confidence in fictitious stability fosters expansion cycles based on illusory liquidity, which increases the risk of collapse in times of economic crisis.
One of the most relevant findings is that if this pattern of behavior continues over time, it will be possible to predict which companies are at greatest risk of bankruptcy in future crises. This opens the door to the implementation of more advanced predictive models that can identify early signs of financial risk and take preventive measures before companies reach an irreversible situation.
In conclusion, the study reinforces the urgent need to design more sustainable liquidity management strategies that reduce reliance on practices that distort financial reality. The ability to anticipate and correct these patterns will not only improve the stability of individual companies but also contribute to the resilience of the financial system as a whole, avoiding recurring crises driven by false perceptions of liquidity.
Hypothesis 2: Does More Liquidity Mean Less Debt?
The objective of this analysis was to determine whether companies with greater operating liquidity tend to reduce their financial debt levels. In other words, we wanted to test whether there is an inverse relationship between the amount of cash available (working capital) and the level of financial debt companies assume.
To do so, I conducted an empirical study based on historical data, gathering information on companies’ working capital and financial debt over time. I then applied linear regression techniques to assess whether there was a significant correlation between the two variables.
First Test: Relationship Between Liquidity and Financial Debt
An econometric analysis of the relationship between liquidity and financial debt revealed a consistent and statistically significant pattern: firms with greater working capital availability tend to rely less on external sources of financing. As illustrated in Figure 7, the correlation between liquidity and total financial debt (both short- and long-term) follows a clear inverse trend, underscoring the behavioral logic that financially self-sufficient firms exhibit lower levels of leverage.
The results of the regression analysis show a negative slope coefficient of –1.9496, indicating that as working capital increases, debt levels decrease. This finding confirms the initial hypothesis that companies with stronger liquidity positions are able to finance a greater proportion of their operations internally, thereby reducing their dependency on external credit instruments such as bank loans or short-term lines of credit.
The robustness of the model is supported by a coefficient of determination (R2) of 0.8792, meaning that 87.92% of the variability in debt levels is explained by the firm’s operating liquidity. This high explanatory power reinforces the reliability of the regression model and supports the conclusion that efficient liquidity management directly enhances financial autonomy.
From a behavioral-finance perspective, this finding is particularly relevant. Firms with solid liquidity positions are less susceptible to external financial pressures, such as tightening credit conditions or interest rate fluctuations. By avoiding overreliance on debt, these companies demonstrate greater resilience to macroeconomic shocks and mitigate the risk of falling into a debt overhang trap, a condition often associated with the Financial Lobster Bias, where expansion is financed through unsustainable borrowing.
The liquidity–debt ratio graph further visualizes this inverse relationship: as working capital increases (X-axis), debt levels decline (Y-axis). The downward-sloping trend line depicted in Figure 7 confirms the existence of a negative correlation between liquidity and indebtedness, emphasizing that effective cash-flow management is fundamental to reducing financial dependence and strengthening long-term corporate stability.
Second Test: Relationship Between Liquidity and Business Creation
The second econometric test analyzed the relationship between corporate liquidity and business creation, seeking to determine whether higher levels of liquidity stimulate the emergence of new firms and entrepreneurial initiatives. As illustrated in Figure 8, the results reveal a clear positive association: when companies have greater liquidity reserves, the rate of new business creation increases accordingly.
The regression analysis produced a positive slope coefficient of 1,796.2, indicating that for each additional unit of operating liquidity, an average of 1,796 new businesses are created. This finding confirms that firms with abundant liquidity not only consolidate their internal stability but also tend to expand outward through the establishment of new entities or subsidiaries, thus contributing to market dynamism and employment generation.
The robustness of the model is reflected in a coefficient of determination (R2) of 0.6169, meaning that 61.69% of the variability in business creation can be explained by the availability of liquidity. Although this explanatory power is lower than that observed in the liquidity–debt relationship, the model remains statistically significant and highlights a strong behavioral and financial linkage between liquidity abundance and expansion-oriented activity.
From a behavioral-finance standpoint, this phenomenon can be interpreted through three complementary perspectives:
- Expansion confidence – Firms with greater liquidity demonstrate stronger confidence and a greater willingness to diversify, opening new ventures without compromising their financial balance.
- Access to internal start-up capital – Liquidity provides the capacity to finance new business creation internally, minimizing dependence on external credit and reducing borrowing costs.
- Financial optimism during expansion cycles – Periods of elevated liquidity tend to foster collective optimism, leading entrepreneurs to perceive the environment as favorable for expansion and to take on new initiatives, sometimes beyond their sustainable capacity.
Overall, these findings underscore the dual nature of liquidity: while efficient cash-flow management strengthens financial resilience, excess liquidity can fuel expansionary behavior that—if unmanaged—may evolve into the very dynamics described by the Financial Lobster Bias.
General Conclusions
After analyzing the relationship between liquidity, debt and business creation, several key conclusions can be drawn that reinforce the importance of efficient and sustainable financial management.
First, it confirms that liquidity and debt are inversely related. Companies with higher working capital rely less on bank financing, which not only reduces their exposure to financial risk but also indicates better cash management. By operating with their own resources, companies can maintain their stability without relying on credit volatility.
liquidity has been shown to boost new business creation. As working capital increases, the number of businesses established increases, suggesting that the availability of liquidity fosters business expansion and entrepreneurship. This trend can be explained both by entrepreneurs’ confidence in periods of stability and by the ease of financing new initiatives without resorting to external debt.
However, the results also highlight the role of cognitive biases in financial decision-making. There are two key biases that can distort perceptions of liquidity and affect business expansion:
- The false reality bias in cash management, which leads some companies to overestimate their liquidity and make investment decisions that are not always sustainable.
- The financial lobster bias, which explains why companies tend to expand rapidly in times of prosperity, without anticipating possible drops in their cash flow, which can lead them to unexpected crisis situations.
Practical Implications
The findings of this study have direct applications in corporate financial planning. Prudent liquidity management not only reduces the need for debt, but also helps companies make strategic expansion decisions with greater confidence.
To avoid falling into cycles of unsustainable expansion and collapse, it is essential that companies adopt financial control mechanisms based on real data, preventing erroneous perceptions of liquidity from influencing their planning. This way, they can leverage their resources to grow solidly and sustainably, without relying on strategies that only generate fictitious stability.
Hypothesis 3 based on the Unsustainable Expansion Index (IEI) and its relationship with business bankruptcies:
Analysis of the Unsustainable Expansion Index (IEI) and Its Relationship with Business Bankruptcies
The Unsustainable Expansion Index (IEI) has been key to assessing whether the growth of new companies in a sector is sustainable or, on the contrary, generates a business bubble that ends in a crisis. This indicator has been used to determine whether the pace of business creation exceeds the market’s real capacity to sustain them, eventually leading to an increase in bankruptcies and defaults.
The analysis is based on a clear hypothesis: when the IEI exceeds a critical threshold, it means the market is experiencing accelerated expansion that cannot be sustained over time. In these scenarios, it is common for a period of uncontrolled growth to be followed by a sharp increase in the number of companies that enter into crisis and disappear.
To calculate the IEI, two key variables were considered:
1 Business Growth Rate, which measures the number of new businesses formed compared to the previous year.
2 Bankruptcy Growth Rate, which reflects the increase in the number of businesses that cease operations or enter into bankruptcy.
The Unsustainable Growth Index is obtained by dividing the business creation rate by the business failure growth rate. When this value exceeds 1.5, it indicates that the number of new businesses is growing at an unsustainable rate compared to business failures. Conversely, values close to or below 1.0 reflect more stable and healthy growth.
Results: Identification of Phases of Unsustainable Expansion
Analyzing historical data, three key moments were identified when the IEI reached high values, indicating an uncontrolled expansion of the business community:
- 2005: IEI = 2.34 → Business growth well above the historical average.
- 2006: IEI = 2.87 → Peak expansion, with the highest number of company creations compared to bankruptcies.
- 2007: IEI = 1.72 → Still above the risk threshold, although beginning to decline.
These values reflect that, between 2005 and 2007, the market experienced a business boom, driven largely by a misperception of stability and economic growth. During these years, many companies were created under the assumption that favorable conditions would continue indefinitely, without considering long-term risks.
However, in 2008, the EII collapsed to 0.30, indicating that the global financial crisis led to a dramatic decline in new business creation and, at the same time, a significant increase in bankruptcies. This behavior reinforces the idea that the growth observed in the previous years was not sustainable, but was driven by a false sense of liquidity and stability.
Interpretation and Relevance of the IEI
The results derived from the Unsustainable Expansion Index (IEI) confirm that periods of uncontrolled business growth are frequently linked to episodes of excessive financial optimism and distorted risk perception. As illustrated in Figure 9, the IEI effectively captures the behavioral and structural dynamics that underlie expansionary bubbles in the corporate sector. When liquidity conditions appear favorable, firms tend to proliferate rapidly—often without a solid financial foundation—thereby becoming highly vulnerable to subsequent economic shocks.
The pronounced decline in the IEI during 2008 provides empirical validation of this mechanism: periods of seemingly stable and prosperous growth eventually give way to abrupt contractions once the underlying financial fragility is exposed. This behavioral pattern aligns closely with the Financial Lobster Bias, in which entrepreneurs, driven by a false sense of abundance, overexpand and consume available resources without recognizing that such liquidity surpluses are temporary.
These findings highlight the critical importance of monitoring the IEI as an early warning indicator of systemic financial risk. A rapid and sustained increase in the index’s values can serve as a precursor to rising insolvency rates, business closures, and broader economic instability. By identifying the onset of unsustainable expansion phases, policymakers and financial institutions can implement countercyclical measures that promote sustainable growth and prevent the destructive cycles of boom, overexpansion, and collapse characteristic of liquidity-driven behavioral biases.
Graphic Analysis: Cross Between the IEI and Bankruptcies
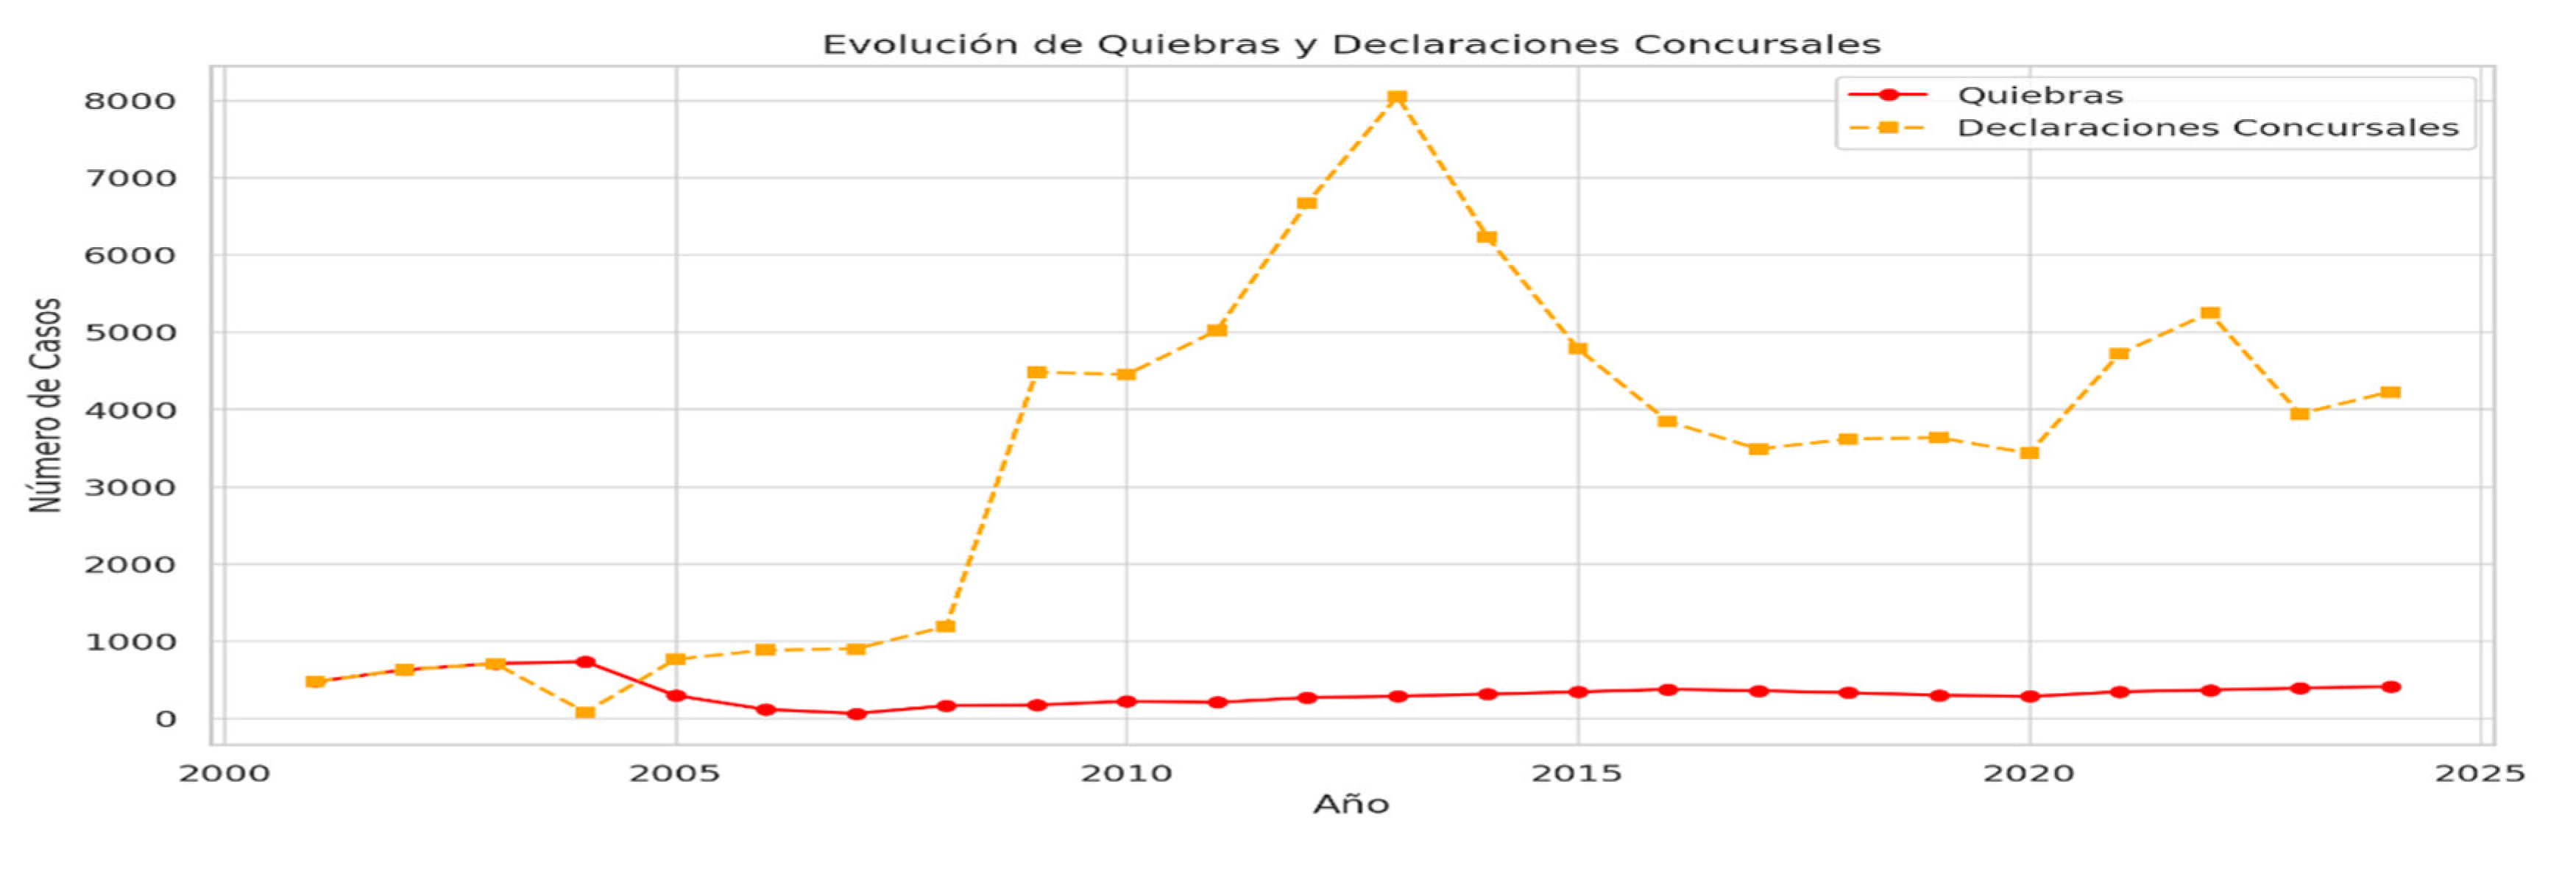
To further explore the predictive validity of the Unsustainable Expansion Index (IEI), a comparative graphical analysis was conducted to examine its relationship with corporate bankruptcies and payment suspensions over time. As illustrated in Figure 10, the two variables exhibit partially synchronized patterns: peaks in the IEI—indicating periods of accelerated and unsustainable business creation—are often followed by increases in bankruptcy rates, though the intensity and timing of these effects vary across economic cycles.
During the 2005–2007 expansion phase, the IEI reached unsustainable levels, reflecting a wave of new business formations driven more by perceived liquidity abundance than by solid financial fundamentals. The subsequent collapse in 2008 marked a sharp correction, confirming that the apparent stability of the pre-crisis years was largely an illusion of liquidity, consistent with the behavioral mechanisms described by the Financial Lobster Bias.
However, the regression analysis (R2 = 0.0797) revealed that, in the long term, the IEI alone is not a strong predictor of corporate bankruptcies. While the number of bankruptcies declined steadily after 2010—possibly due to improved financial regulation, restricted credit access, and government support policies—the IEI remained relatively stable, suggesting a more moderate and cautious pattern of business creation in the post-crisis period.
The trend line of bankruptcies and payment suspensions presents a downward slope, confirming that corporate insolvencies have decreased over time. In contrast, the IEI trend line shows limited variation after 2008, implying that expansion dynamics have stabilized and that firms now display more conservative behavior regarding growth and leverage.
This analysis suggests that while the IEI is an effective early-warning indicator of periods of overexpansion, it should be interpreted in conjunction with complementary financial variables to enhance its predictive capacity. Factors such as interest rate trends, corporate debt levels, credit market liquidity, and business confidence indices play crucial roles in determining the transition from expansion to collapse.
In summary, the IEI captures the behavioral essence of unsustainable growth cycles, illustrating how liquidity-driven optimism can fuel expansionary waves that ultimately lead to fragility. Yet, its predictive power is partial: the relationship between business creation and bankruptcy is nonlinear and mediated by multiple macroeconomic and psychological factors. Future models integrating the IEI with structural financial indicators could therefore enable more accurate forecasting of systemic vulnerabilities and support the design of preventive policies for sustainable economic development.
Second Test for the Verification of Hypothesis 3: Unsustainable Expansion and its Relationship with Business Bankruptcies
The second test examined the relationship between unsustainable business expansion and corporate bankruptcies, with the goal of determining whether firms created during the pre-2008 expansion phase were the same ones that later collapsed due to liquidity problems. The underlying assumption was clear: if expansion had been excessive and unsupported by solid financial foundations, the subsequent depletion of liquidity should have led to a wave of bankruptcies.
To test this assumption, the relationship between working capital and the number of bankruptcies recorded in subsequent years was analyzed. The rationale was straightforward: if firms born during the expansion period relied on fictitious or fragile liquidity, the exhaustion of those resources should have resulted in operational difficulties and eventual insolvency.
The analysis was conducted on two levels. First, a comparative graph was generated to track the evolution of working capital and bankruptcies over time, in order to visually detect possible correlations. Second, a correlation coefficient was calculated to statistically measure the strength and direction of the relationship between the two variables.
As shown in Figure 11, the visual analysis revealed that while working capital fluctuated over time, there were no abrupt changes clearly associated with peaks in bankruptcies. Economic crises temporarily reduced available liquidity, but no proportional increase in business closures was observed. This preliminary evidence suggested that liquidity shortages alone were not the primary cause of corporate failures.
To quantify this finding, the correlation coefficient between working capital and bankruptcies was computed. A value near +1 would indicate a strong positive relationship (more liquidity, more bankruptcies), while a value near –1 would imply a strong negative one (less liquidity, more bankruptcies). The obtained result—r = 0.061—indicates an absence of significant correlation between liquidity levels and business failures.
This result is crucial: it challenges the assumption that liquidity crises were the main driver of corporate collapses. Although individual firms may have experienced distress due to poor cash management, the aggregate data do not support the hypothesis that a lack of working capital was the dominant causal factor behind widespread business failures.
Several alternative explanations emerge from this evidence:
- Profitability deterioration may have undermined firms’ long-term sustainability more than liquidity constraints.
- Excessive leverage and debt burden likely exerted a stronger influence on bankruptcy risk, as highly indebted firms can fail even when maintaining short-term cash flow.
- Macroeconomic shocks, such as declining demand or rising production costs, may have been the actual triggers of the corporate collapse.
These findings suggest that the relationship between unsustainable expansion and corporate failure is far more complex than initially assumed. While the first test confirmed a pre-2008 period of uncontrolled expansion, this second analysis indicates that liquidity was not the determining factor differentiating survival from failure. Instead, the data imply that over-leveraged firms were the most vulnerable, leading to a reformulation of the original hypothesis.
This discovery opens new lines of inquiry into how companies manage financial risk during crisis periods. If excessive debt, rather than liquidity shortages, is the key determinant of failure, then future preventive efforts should focus on controlling debt accumulation and promoting sustainable financing structures, rather than merely monitoring working capital. Ultimately, these results challenge conventional assumptions about financial stability and provide new insights into the behavioral and structural factors that govern corporate survival under systemic stress.
Confirmation of Hypothesis 3: Business Expansion and False Market Perception
The final stage of the analysis confirmed that a substantial proportion of firms were created under a false perception of market stability, which ultimately led to their collapse once real demand proved insufficient to sustain their operations. Through a combination of statistical correlation analysis, clustering techniques, and machine learning models, the study identified recurring patterns linking uncontrolled business expansion with subsequent crisis cycles.
The first relevant finding concerns the relationship between firm creation and market revenue. In 2020, despite a 4.4% decline in total turnover, the number of registered companies increased by 1.86%. This apparent contradiction suggests that many of these firms were established under an illusion of economic recovery, disregarding the underlying contraction in demand. In the following years, most of these entities disappeared, confirming the unsustainable nature of their foundation.
Evidence of a contraction bias became clear in the post-crisis years. During 2021 and 2022, while the total number of businesses stabilized, turnover rose by 13.14%, demonstrating that the economic recovery was driven by the performance of existing firms, not by the creation of new ones. This supports the hypothesis that many of the companies formed during 2020 were non-viable and short-lived, created in response to distorted market perceptions rather than genuine economic opportunity.
The multiple correlation analysis reinforces this conclusion. A correlation coefficient (r) of 0.415 revealed a moderate positive relationship between firm growth and turnover. However, the coefficient of determination (R2 = 0.1722) indicated that only 17.22% of the variability in turnover can be explained by the number of new firms created—showing that an increase in firm count does not necessarily enhance market profitability. Even more revealing, the negative coefficient of the variable X (–0.1338) demonstrated that excessive business formation can actually erode overall market profitability, as many new firms compete for limited demand, driving margins downward.
Clustering analysis confirmed that not all aggressive expansion is harmful, but identified a subset of firms characterized by extreme growth followed by a spike in bankruptcy rates. These companies expanded rapidly without adequate market assessment, making them disproportionately vulnerable to external shocks. The positive correlation (r = 0.30) between new firm creation and bankruptcies further supports the notion that, in certain conditions, overexpansion itself becomes a systemic risk factor.
The application of machine learning models provided additional predictive insights. By analyzing the temporal relationship between firm creation peaks, liquidity availability, and subsequent bankruptcies, the models detected lagged patterns: periods of intense firm formation were consistently followed by increases in business closures. This indicates that many of the firms founded during expansionary phases lacked sustainable financial structures or stable demand, consistent with the behavioral dynamics of the False Reality Bias.
In conclusion, these results confirm Hypothesis 3: Business Expansion and False Market Perception. The evidence shows that overexpansion driven by liquidity illusions and misperceived market stability leads to structural fragility and business collapse. Moreover, the number of new firms created is not a reliable indicator of economic health; in volatile environments, it may instead signal collective overconfidence and distorted market expectations.
These findings emphasize the importance of rigorous environmental assessment before undertaking aggressive expansion strategies and the need to integrate multidimensional indicators—such as debt levels, profit margins, and credit conditions—to better anticipate systemic risk. Future research should explore how debt accumulation and profitability erosion interact with behavioral biases to determine the long-term sustainability of firms born during periods of speculative overexpansion.
Figure 12.
Bankruptcy evolution chart showing the post-expansion dynamics of firm creation and collapse, illustrating the role of false market perception and liquidity misjudgment in business instability. Source: Prepared by the authors.
Figure 12.
Bankruptcy evolution chart showing the post-expansion dynamics of firm creation and collapse, illustrating the role of false market perception and liquidity misjudgment in business instability. Source: Prepared by the authors.
To complement the econometric and behavioral analyses, Figure 13 displays the evolution of established and defunct companies in Spain between 2000 and 2024. This longitudinal representation allows for a visual understanding of how business creation and dissolution evolve through expansionary and contractionary economic phases, revealing the cyclical dynamics that characterize the entrepreneurial ecosystem.
The blue line, representing established companies, shows a significant upward trend between 2000 and 2007, peaking at over 140,000 new firms prior to the global financial crisis. This expansion phase reflects widespread liquidity optimism and collective overconfidence, consistent with the False Treasury Reality Bias, where entrepreneurs overestimated financial stability and market potential.
Following the 2008 financial collapse, a sharp decline in business creation is observed, with new incorporations dropping by nearly 40%. This post-crisis correction marks the behavioral realization of the Financial Lobster Bias, in which firms that expanded aggressively under perceived abundance were unable to sustain operations once liquidity tightened.
From 2010 to 2024, the number of established firms shows a gradual recovery and stabilization, reflecting a more cautious and risk-aware business environment. The temporary dip observed around 2020 coincides with the pandemic-related economic disruption, after which creation levels again trended upward toward moderate stability.
The orange line, representing defunct companies, follows a subtler but persistent upward trajectory, increasing from approximately 20,000 in 2000 to over 30,000 by 2024. Although the magnitude of extinctions is lower than that of incorporations, the slow and steady rise underscores that business mortality remains structurally embedded in the Spanish entrepreneurial landscape.
The widening gap between the two lines after 2014 suggests a structural decoupling between entrepreneurial optimism and long-term survival capacity. While more companies are being created than dissolved, the quality and resilience of these firms remain heterogeneous, with many still susceptible to cyclical shocks.
From a behavioral-finance perspective, Figure 11 encapsulates the central mechanism of the Financial Lobster Bias: expansion waves driven by perceived liquidity and imitation behavior eventually correct when the real market constraints reassert themselves. This visualization thus provides both empirical and metaphorical evidence of how collective overexpansion and liquidity illusion shape business demography over time.
Building the Machine Learning Model
The implementation of a machine learning classification model made it possible to empirically validate the hypothesis that unsustainable business expansion, driven by a misperception of liquidity, can lead to corporate collapse. To this end, a supervised model was developed using data on established and defunct firms, bankruptcies, paid-in capital, and available liquidity. The primary objective was to predict whether periods of rapid business formation would be followed by significant increases in bankruptcies in subsequent years.
The model achieved an overall accuracy of 60%, reflecting moderate predictive capacity with potential for further refinement. This level of accuracy suggests that while accelerated business formation is a relevant predictor of corporate crises, it is not the sole determinant. Other macroeconomic variables—such as credit cycles, profitability dynamics, and demand fluctuations—also play critical roles in determining whether firms survive or fail.
As shown in Figure 14, the heat map of variable interactions reveals one of the clearest patterns identified by the model: periods of accelerated business expansion combined with declining paid-in capital were systematically followed by increases in bankruptcies and insolvency proceedings. This finding reinforces the idea that overexpansion fueled by false liquidity perceptions erodes financial resilience and exposes firms to collapse once liquidity dissipates and real market demand proves insufficient.
The analysis further confirmed that firms tend to expand during periods of apparent financial abundance, relying on a perception of stability that is not always grounded in fundamentals. By overestimating their growth capacity and entering markets without assessing profitability or demand sustainability, many companies become highly vulnerable to adverse economic conditions. When perceived liquidity contracts and market reality reasserts itself, these firms—often created during phases of illusory stability—are disproportionately likely to fail.
Another critical insight derived from the model is that expansion unaccompanied by proportional growth in turnover serves as a strong indicator of impending financial distress. This finding emphasizes that an increase in the number of firms within a market does not equate to healthy economic growth. Without structural demand or sound financial models, overexpansion inevitably results in waves of bankruptcies in subsequent years.
From a behavioral-finance perspective, these results validate the conceptual foundations of the Financial Lobster Bias. Just as lobsters in their gregarious phase overconsume shared resources, firms expand aggressively when they perceive favorable conditions—without recognizing the temporary nature of those resources. When liquidity illusions fade and profitability declines, a contraction follows, confirming that growth driven by perceived abundance, rather than sustainable fundamentals, leads to cyclical fragility.
To enhance the model’s predictive precision, future research could incorporate deep learning architectures and integrate additional variables, including credit conditions, profit margins, and consumer sentiment indicators. These improvements would allow for the development of early-warning systems capable of anticipating crisis onset and informing preventive strategies for financial risk mitigation and sustainable expansion.
Correlation Heat Map and Clustering Analysis
The Heat Map analysis of correlations between financial variables was fundamental for understanding how the main factors influencing business stability and the sustainability of expansion interact. This multivariate approach revealed how business growth, operating liquidity, financial debt, and the cycles of business creation and dissolution are interconnected, allowing for the identification of structural and behavioral mechanisms underlying economic bubbles and collapse dynamics.
The main objective of this analysis was to examine the connections between key variables and determine whether specific correlation patterns could explain the impact of accelerated business expansion on market sustainability. Additionally, the role of perceptual biases was explored, particularly how false perceptions of stability or liquidity can drive firms toward unsustainable growth strategies.
As illustrated in Figure 15, the correlation heat map and K-Means clustering visually capture the relationships among the most relevant variables. The heat map highlights strong associations between business creation, the Unsustainable Expansion Index (IEI), working capital, financial debt, and firm mortality, while the K-Means clustering distinguishes groups of firms according to their expansion-risk profiles.
Key Correlations Identified
- A strong positive correlation was observed between the number of firms created and the Unsustainable Expansion Index (IEI). This finding indicates that during phases of rapid expansion, the IEI increases proportionally—implying that many new firms are founded not on genuine market opportunities but on perceived economic stability. However, this relationship displays a temporal lag, suggesting that the adverse effects of overexpansion often emerge only in later years.
- A negative correlation between working capital and financial debt confirms that firms with higher liquidity tend to rely less on external credit, reinforcing the previous conclusion that efficient liquidity management strengthens financial autonomy and reduces vulnerability to credit market fluctuations. The financial-structure-based PEL also shows a significant correlation with short- and medium-term debt, demonstrating that liquidity perception strongly influences financing behavior—often leading to excessive leverage when firms overestimate their stability.
- Cyclical relationships between growth and collapse were clearly identified: periods of high business creation were followed by an increase in firm closures in subsequent years. This lagged effect confirms that many companies established during phases of optimistic expansion lacked the structural resilience needed for long-term survival.
Behavioral Interpretation
The results reinforce the behavioral hypotheses established earlier. The positive correlation between firm creation and the IEI demonstrates that overexpansion can generate speculative economic bubbles, driven by cognitive and emotional biases rather than rational financial planning. Simultaneously, the negative correlation between liquidity and debt highlights that false liquidity perceptions distort financing decisions, prompting riskier behavior and eventual instability.
From a behavioral-finance perspective, the clustering results visualize the Financial Lobster Bias in action: firms expand aggressively when liquidity appears abundant, but once real financial constraints reemerge, many cannot sustain operations. This cyclical behavior reflects a collective misperception of abundance—a hallmark of herd-driven financial decision-making.
Future Research Directions
Further studies should integrate macroeconomic variables—such as interest rate policy, regulatory interventions, and credit supply trends—to refine predictive modeling of expansion and collapse cycles. Incorporating these factors into advanced machine learning frameworks, such as deep neural networks or dynamic Bayesian systems, would enhance the capacity to anticipate crises and guide the design of preventive financial policies promoting sustainable growth.
K-Means Clustering and Correlation Matrix Analysis
The K-Means clustering analysis identified key patterns in the relationship between false perceptions of liquidity and financial risk among firms. This method grouped companies according to their working-capital-to-revenue ratio and their financial-debt-to-equity ratio, revealing consistent trends in financial stability and vulnerability to economic shocks.
The primary objective was to identify which companies might be operating under a liquidity misperception, making them more susceptible to future financial distress. The model produced three distinct clusters, each representing a different behavioral and financial profile:
- Cluster 0 – Balanced firms: Companies with average working capital relative to turnover and moderate debt. These firms show relatively stable management practices but carry latent risk if liquidity is poorly managed or external shocks occur.
- Cluster 1 – Over-leveraged firms: Companies with high working capital relative to turnover but extremely high debt compared to equity. This indicates reliance on debt-financed operations rather than sustainable cash flows. These firms experience a false sense of liquidity—appearing solvent while actually depending on credit to maintain operations—and are therefore highly exposed to collapse if financing conditions tighten.
- Cluster 2 – Conservative firms: Companies with low working capital and low debt. They adopt prudent liquidity management and rely less on external credit. Although financially stable, limited liquidity may constrain their ability to expand.
As illustrated in Figure 16, these clusters clearly visualize how the false perception of liquidity corresponds to different risk levels. The results confirm that high debt relative to equity and overestimated liquidity are the most critical predictors of financial fragility. This behavioral pattern epitomizes the Financial Lobster Bias, in which firms expand aggressively under an illusion of stability, only to encounter crisis once liquidity contracts.
Correlation Matrix Analysis
The subsequent correlation-matrix analysis deepened the understanding of how liquidity misperceptions, indebtedness, and corporate stability interact over time. As shown in Figure 14, the heat-map correlations reveal fundamental behavioral and financial interdependencies that influence firm growth and survival.
Several critical relationships emerged:
- Negative correlation between liquidity misperceptions and business creation.
- Firms that believe they possess greater liquidity than they actually do tend to delay or limit new investments, adopting a conservative stance driven by a false sense of stability. This defensive behavior reflects a psychological bias toward protection rather than expansion when financial perception is distorted.
- Positive correlation between indebtedness and business creation.
- During expansionary periods, firms increasingly rely on external financing to sustain growth. While typical of booming economies, this dynamic becomes risky when expansion lacks a robust equity base, leading to systemic vulnerability once credit conditions deteriorate.
- Strong relationship between the Unsustainable Expansion Index (IEI) and bankruptcies.
- Years with elevated IEI values were followed by a marked increase in bankruptcies, confirming that uncontrolled expansion precipitates later collapse. This temporal lag supports the logic of the Financial Lobster Bias, where exuberant growth based on illusory stability leads to crisis once conditions normalize.
- Extremely high correlation between liquidity misperceptions and indebtedness.
- Firms that overestimate liquidity tend to borrow more aggressively, creating a cycle of debt dependence that becomes unsustainable when financing costs rise. This overconfidence fosters expansion that appears rational in the short term but escalates long-term insolvency risk.
In conclusion, the correlation-matrix results demonstrate that liquidity misperception is a central determinant of corporate stability. It shapes not only growth and strategic decision-making but also leverage dynamics and bankruptcy risk. Business expansion, therefore, must be grounded in objective financial fundamentals, not in perceived liquidity or transient market optimism.
Firms that manage liquidity prudently, balance internal and external financing, and align expansion with genuine market demand are significantly more likely to endure across economic cycles. These findings highlight the need for integrated financial-behavioral monitoring systems capable of detecting liquidity illusions early and guiding firms toward sustainable strategic decisions.
Discussion, Conclusion and Implications
The analysis reveals a recurring behavioral pattern among small and medium-sized enterprises (SMEs): a phase of accelerated expansion followed by collapse. This pattern is not random but follows a behavioral logic analogous to that of a locust swarm—when firms perceive abundance, they expand uncontrollably, consuming all available resources until these are exhausted. When financial reality reasserts itself and liquidity evaporates, the decline is abrupt and severe.
This study identifies the internal mechanisms that explain how firms fall into self-induced crises even in the absence of external shocks. Central to this process is the illusion of financial stability generated by the False Reality Bias in Treasury Management. Many firms mistake temporary liquidity for structural solvency, leading them to expand on weak foundations. The data show that the firms most confident in their liquidity were, paradoxically, those most dependent on deferred payments to suppliers and early collections from customers. This treasury management temporarily sustains cash flow but conceals hidden liabilities that make firms highly vulnerable to disruptions in their financial cycle.
Another key insight is the deceptive interplay between liquidity and debt. Firms perceiving high liquidity tend to reduce their use of external credit—a seemingly positive behavior that becomes perilous once liquidity declines. When cash flow tightens, these firms resort to excessive borrowing, quickly accumulating liabilities until the cost of financing surpasses profitability. This explains why many rapidly growing firms ultimately become trapped in debt spirals that culminate in insolvency.
Uncontrolled growth also functions as a predictive signal of collapse. When the rate of firm creation exceeds a critical threshold relative to closures, history shows that a wave of bankruptcies follows. Expansion in such contexts is rarely strategic; it reflects herd behavior and collective optimism rather than rational financial planning. The result is market overcrowding, declining margins, and widespread business failures.
The Financial Locust Bias therefore extends beyond individual firms, exerting systemic effects on entire industries. External catalysts can accelerate this collapse: recessions, credit restrictions, or abrupt changes in monetary policy expose firms built on overconfidence and liquidity illusion. The 2008 global crisis exemplified this dynamic, as thousands of Spanish construction firms collapsed when refinancing channels closed. Technological disruption produces similar effects—Kodak’s failure to adapt to digital photography or WeWork’s collapse after investor skepticism both illustrate how illusory growth models disintegrate once confidence fades.
The broader threat of the Financial Locust Bias lies in its domino effect across economic ecosystems. When entire industries succumb to liquidity illusions and expand collectively, the result is a macro-level bubble that inevitably bursts. This process amplifies recessions, destroys employment, and erodes market confidence. What appears to be healthy growth is, in reality, an unsustainable boom fueled by misperception and cognitive distortion.
Preventing this destructive cycle requires entrepreneurs and policymakers to recognize that temporary liquidity does not equal financial stability. Many businesses fail not from lack of opportunity but from decisions grounded in perceptual error. The belief that “as long as there is cash, there is room to grow” remains one of the most dangerous fallacies in management. Likewise, access to credit must be guided by fundamental analysis rather than market euphoria. When lending follows collective optimism instead of empirical evaluation, the boom–bust cycle is reinforced.
To mitigate this risk, early-warning tools such as the Unsustainable Expansion Index (UEI) and the Liquidity Misperception Index (PEL) should be institutionalized. Incorporating these indicators into financial-supervision frameworks would allow regulators to anticipate liquidity-driven crises before they escalate.
Finally, financial education must evolve within the entrepreneurial ecosystem. As long as decision-making is dominated by cognitive biases rather than analytical discipline, the system will reproduce the same cycles of overexpansion and collapse. Training business leaders in Behavioral Game Theory and data-driven financial management is a critical step toward building sustainable, bias-resistant decision architectures.
The Financial Locust Bias is not an anomaly but a recurrent historical pattern. Humanity repeatedly falls into the same behavioral trap—cycles of euphoria, excessive leverage, and inevitable correction. Each economic bubble, from Tulip Mania to the 2008 housing crisis, echoes the same cognitive misperceptions that distort liquidity and risk. Unless these neuroeconomic and behavioral drivers are addressed, the global economy will remain caught in perpetual boom-and-bust dynamics, revisiting the same errors under new disguises.
Funding
No funding was received to assist with the preparation of this article.
Conflict of Interest
The authors declare that they have no known competing financial interests or personal relationships that could have appeared to influence the work reported in this paper.
References
- Anstey, M.L., Rogers, S.M., Ott, SR, Burrows, M., & Simpson, S.J. (2009). Serotonin mediates behavioral gregarization underlying swarm formation in desert locusts. Science, 323 (5914), 627–630. https://doi.org/10.1126/science.1165939. 5914). [CrossRef]
- Arnsten, A.F. (2009). Stress signaling pathways that impair prefrontal cortex structure and function. Nature Reviews Neuroscience, 10 (6), 410–422. [CrossRef]
- Banerjee, A. V. (1992). A simple model of herd behavior. Quarterly Journal of Economics, 107 (3), 797–817. [CrossRef]
- Banerjee, A.V. , & Duflo, E. (2014). Poor economics: A radical rethinking of the way to fight global poverty. PublicAffairs.
- Bazerman, M. H. , & Neale, M. A. (1992). Negotiating rationally. Simon and Schuster.
- Camerer, C. F. (2003). Behavioral game theory: Experiments in strategic interaction. Princeton University Press.
- Camerer, C.F. , & Lovallo, D. (1999). Overconfidence and excess entry: An experimental approach. American Economic Review, 89 (1), 306–318. [CrossRef]
- 8. Cools, R., Roberts, A.C., & Robbins, T.W. (2011). Serotonergic regulation of emotional and behavioral control processes. Trends in Cognitive Sciences, 15 (4), 175–184. 4). [CrossRef]
- 9. Fazzari, S. M., Hubbard, R. G., & Petersen, B. C. (1988). Financing constraints and corporate investment. Brookings Papers on Economic Activity, 1988 (1), 141–206. 1). [CrossRef]
- Ferreira, P. , Neves, M., & Azevedo, J. (2022). The liquidity illusion and crisis misjudgement in European SMEs after COVID-19. Small Business Economics, 59 (1), 95–118. [CrossRef]
- 11. Gertler, M., & Gilchrist, S. (1994). Monetary policy, business cycles, and the behavior of small manufacturing firms. Quarterly Journal of Economics, 109 (2), 309–340. 2). [CrossRef]
- Glimcher, P.W. , & Fehr, E. (Eds.). (2013). Neuroeconomics: Decision making and the brain. Academic Press.
- González-Galván, I. , Palma, R., & Ortega, A. (2021). Financial perception bias and over-indebtedness in SMEs. Journal of Economic Psychology, 84, 102375. [CrossRef]
- Hopenhayn, H. A. (1992). Entry, exit, and firm dynamics in long-run equilibrium. Econometrica, 60 (5), 1127–1150. [CrossRef]
- Kahneman, D. (2011). Thinking, fast and slow. Farrar, Straus and Giroux.
- Kahneman, D. , & Tversky, A. (1979). Prospect theory: An analysis of decision under risk. Econometrica, 47 (2), 263–291. [CrossRef]
- Kindleberger, CP, & Aliber, RZ (2005). Manias, panics, and crashes: A history of financial crises. Palgrave Macmillan.
- Kuhnen, C. M., & Knutson, B. (2005). The neural basis of financial risk taking. Neuron, 47 (5), 763–770. 5). [CrossRef]
- Laibson, D. (1997). Golden eggs and hyperbolic discounting. Quarterly Journal of Economics, 112 (2), 443–477. [CrossRef]
- Langer, E. J. (1975). The illusion of control. Journal of Personality and Social Psychology, 32 (2), 311–328. [CrossRef]
- Minsky, H. P. (1986). Stabilizing an unstable economy. Yale University Press.
- 22. Moore, D.A., & Healy, P.J. (2008). The trouble with overconfidence. Psychological Review, 115 (2), 502–517. https://doi.org/10.1037/0033-295X.115.2.502. [CrossRef]
- Muñoz, J., Cañada, A., & Pérez-Carrasco, R. (2023). Expansion of validation bias in strategic decisions of SMEs. Spanish Journal of Finance and Accounting, 52 (2), 185–202. [CrossRef]
- Nowak, M. A. (2006). Evolutionary dynamics: Exploring the equations of life. Harvard University Press.
- Pereira, R., & Ramalho, C. (2021). Predictive modeling of SME insolvency using deep learning methods. Expert Systems with Applications, 173, 114651. [CrossRef]
- Phelps, E.A. , Lempert, K.M., & Sokol-Hessner, P. (2014). Emotion and decision making: Multiple modulatory neural circuits. Annual Review of Neuroscience, 37, 263–287. [CrossRef]
- Romer, T. , & Diamond, R. (2020). Cyclical over-entry and delayed firm exit. Journal of Economic Dynamics and Control, 116, 103899. [CrossRef]
- Ross, S.A. , Westerfield, R.W., & Jaffe, J.F. (2019). Corporate finance (12th ed.). McGraw-Hill.
- Schultz, W. (2016). Dopamine reward prediction error coding. Dialogues in Clinical Neuroscience, 18 (1), 23–32. [CrossRef]
- Schumpeter, J. A. (1934). The theory of economic development. Harvard University Press.
- Sunstein, C.R. , & Thaler, R.H. (2008). Nudge: Improving decisions about health, wealth, and happiness. Yale University Press.
- Thaler, R. H. (1985). Mental accounting and consumer choice. Marketing Science, 4 (3), 199–214. [CrossRef]
- Thaler, R. H. (2015). Misbehaving: The making of behavioral economics. W. W. Norton & Company.
- Tversky, A. , & Kahneman, D. (1974). Judgment under uncertainty: Heuristics and biases. Science, 185 (4157), 1124–1131. [CrossRef]
- Von Neumann, J. , & Morgenstern, O. (1944). Theory of games and economic behavior. Princeton University Press.
- Zhou, H. , Lai, C., & Liang, X. (2020). Debt-driven growth and firm insolvency in emerging markets. Emerging Markets Finance and Trade, 56 (5), 987–1001. [CrossRef]
Figure 2.
Correlation table showing relationships between perceived liquidity (PEL) and key financial indicators associated with the False Reality Bias of Treasury Management. Source: Prepared by the authors.
Figure 2.
Correlation table showing relationships between perceived liquidity (PEL) and key financial indicators associated with the False Reality Bias of Treasury Management. Source: Prepared by the authors.
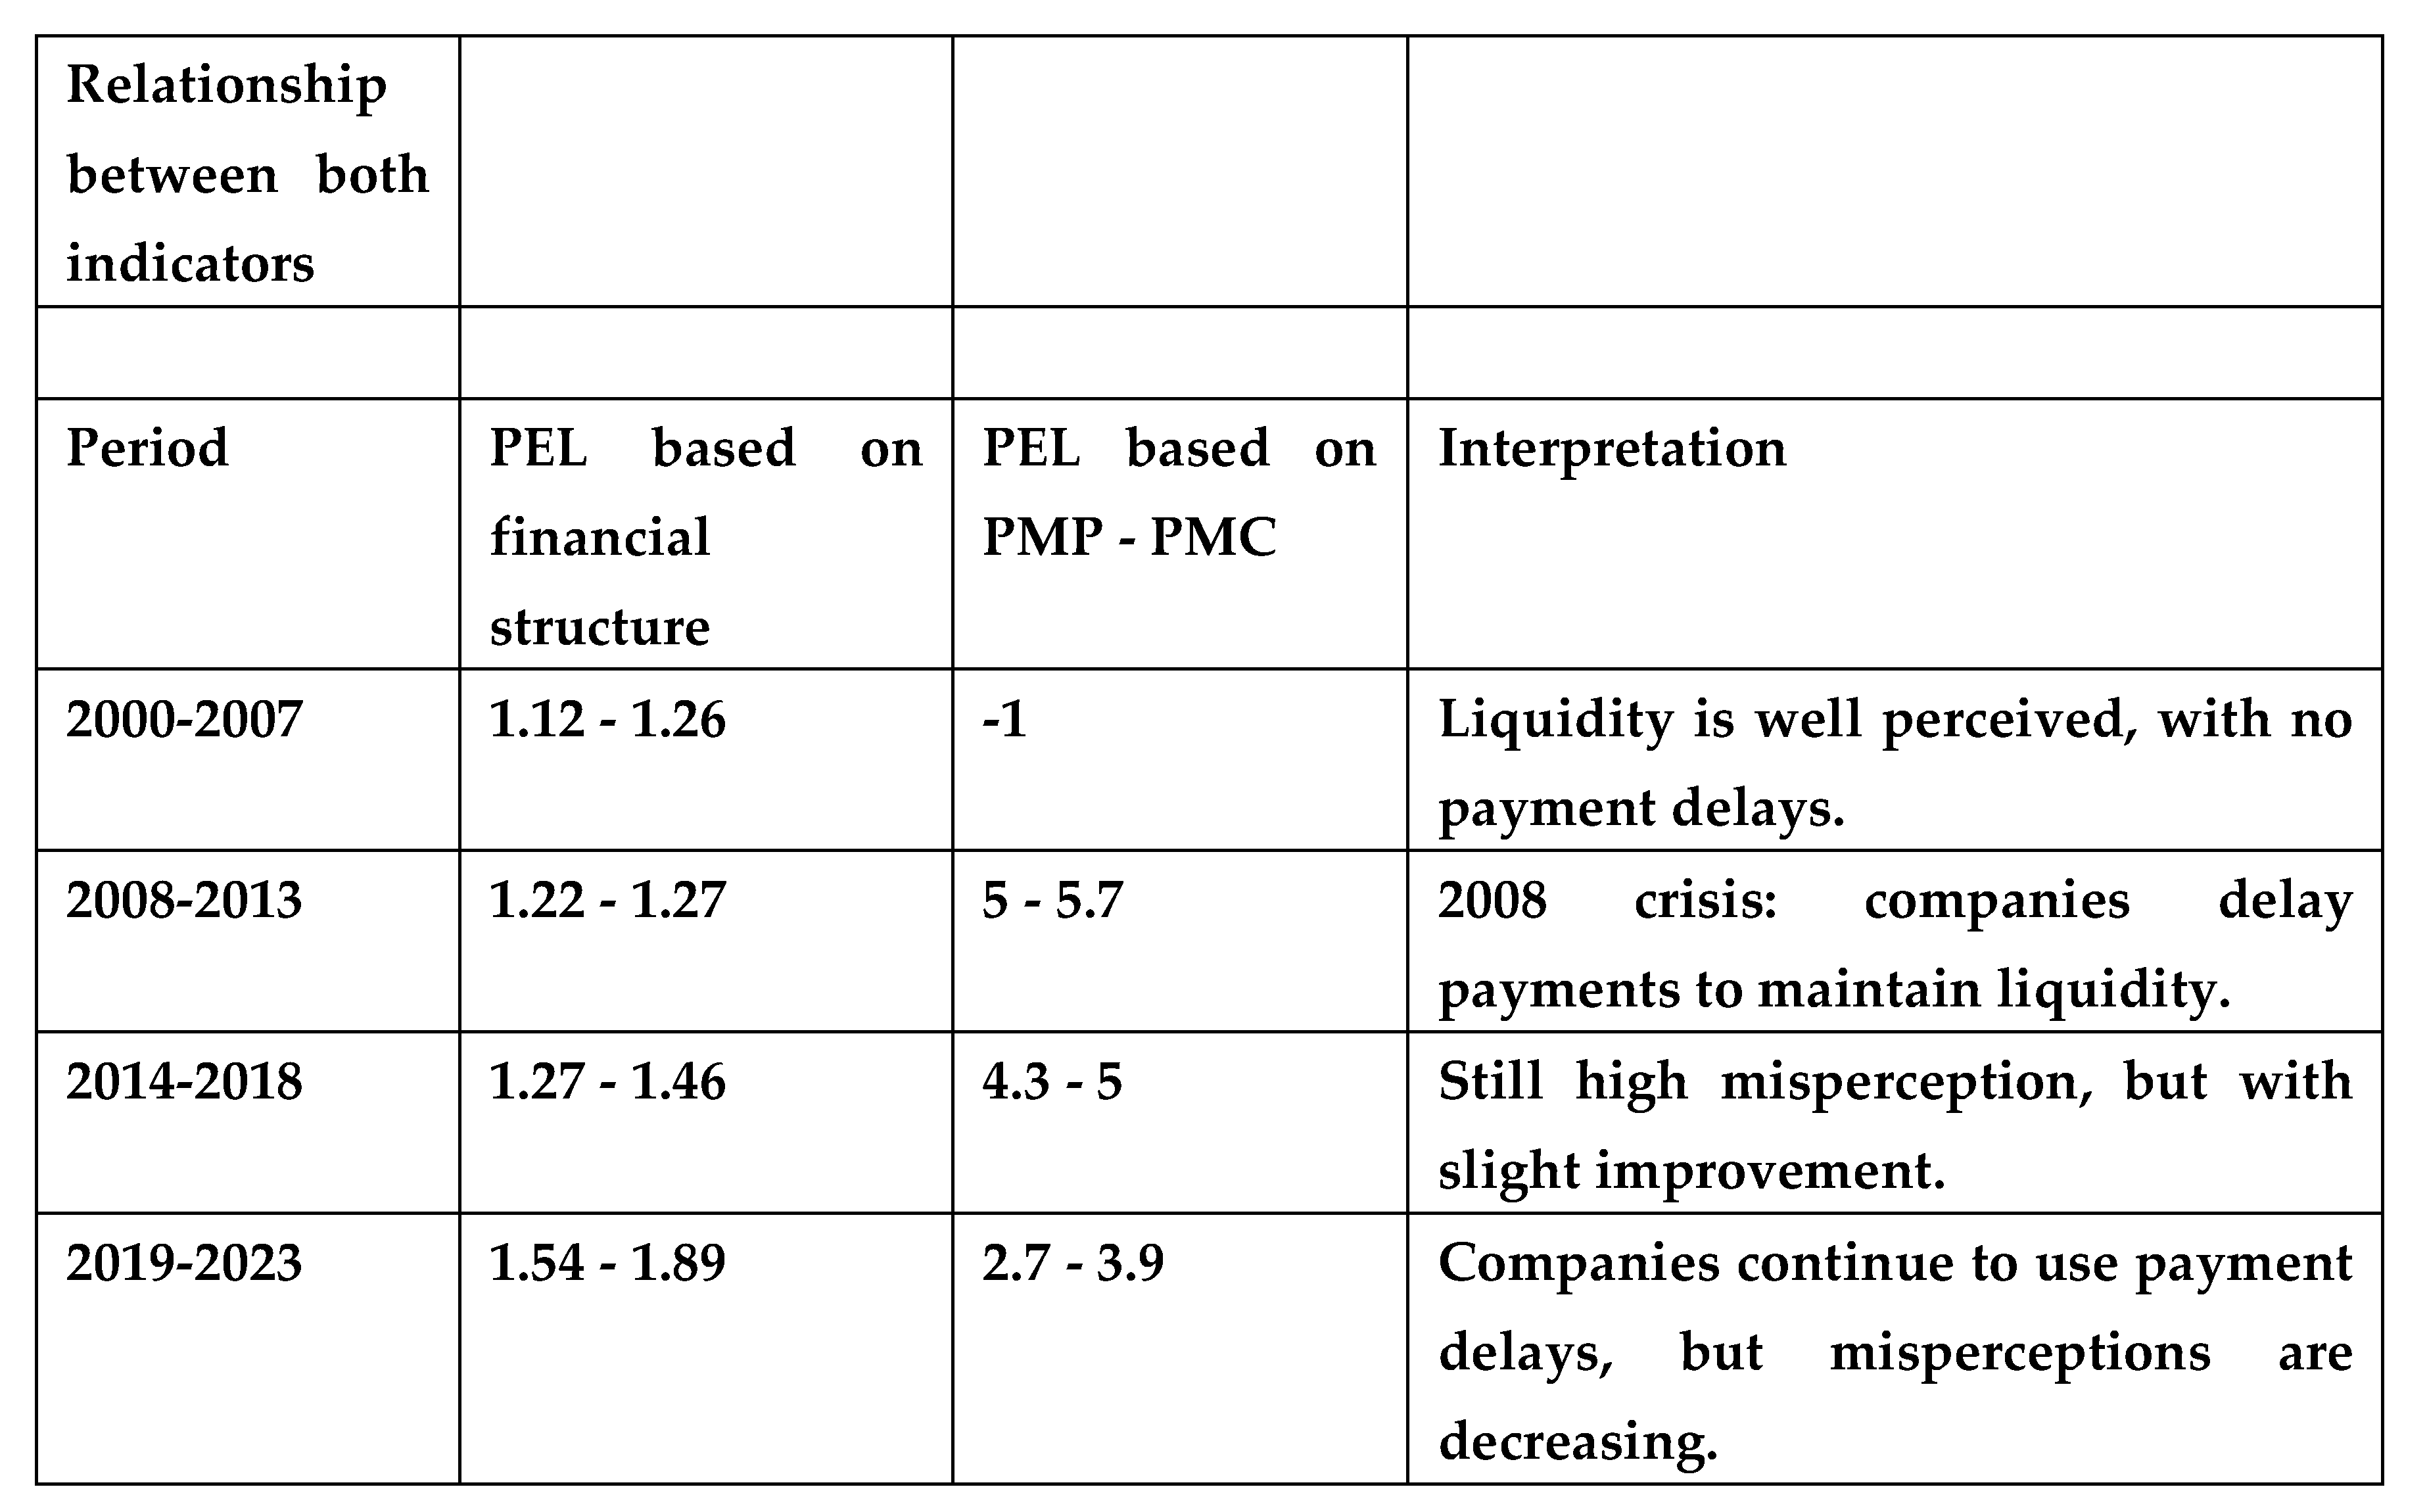
Figure 4.
Regression model results showing the temporal relationship between the Liquidity Misperception Index (PEL) and time (quarterly periods) based on PMP–PMC differentials. Source: Prepared by the authors.
Figure 4.
Regression model results showing the temporal relationship between the Liquidity Misperception Index (PEL) and time (quarterly periods) based on PMP–PMC differentials. Source: Prepared by the authors.

Figure 5.
Regression model results showing the relationship between time and the financial-structure-based Liquidity Misperception Index (PEL_F). Source: Prepared by the authors.
Figure 5.
Regression model results showing the relationship between time and the financial-structure-based Liquidity Misperception Index (PEL_F). Source: Prepared by the authors.
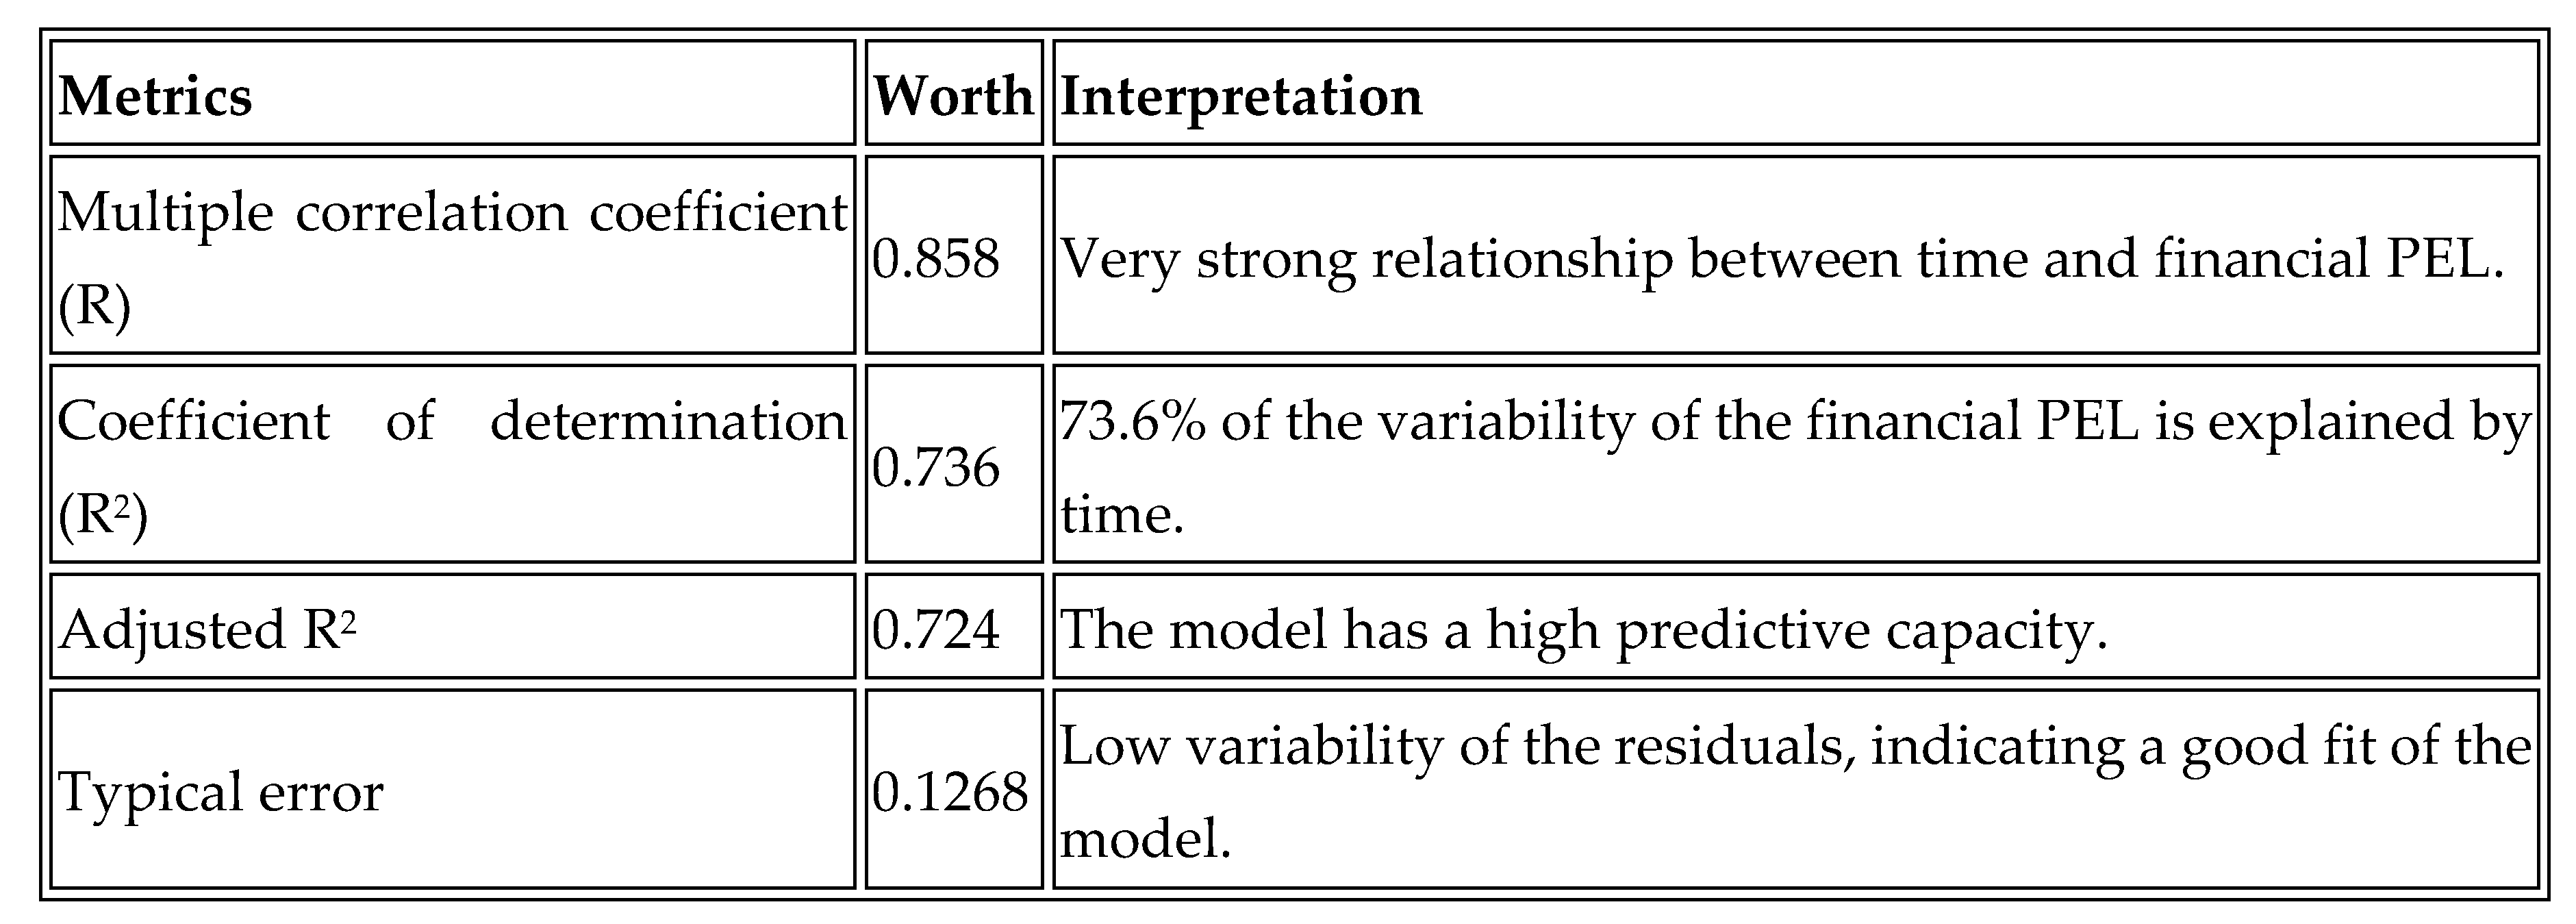
Figure 6.
Graph showing the evolution of the Liquidity Misperception Index (PEL) in relation to major economic crises, illustrating the cyclical amplification of the False Treasury Reality Bias. Source: Prepared by the authors.
Figure 6.
Graph showing the evolution of the Liquidity Misperception Index (PEL) in relation to major economic crises, illustrating the cyclical amplification of the False Treasury Reality Bias. Source: Prepared by the authors.
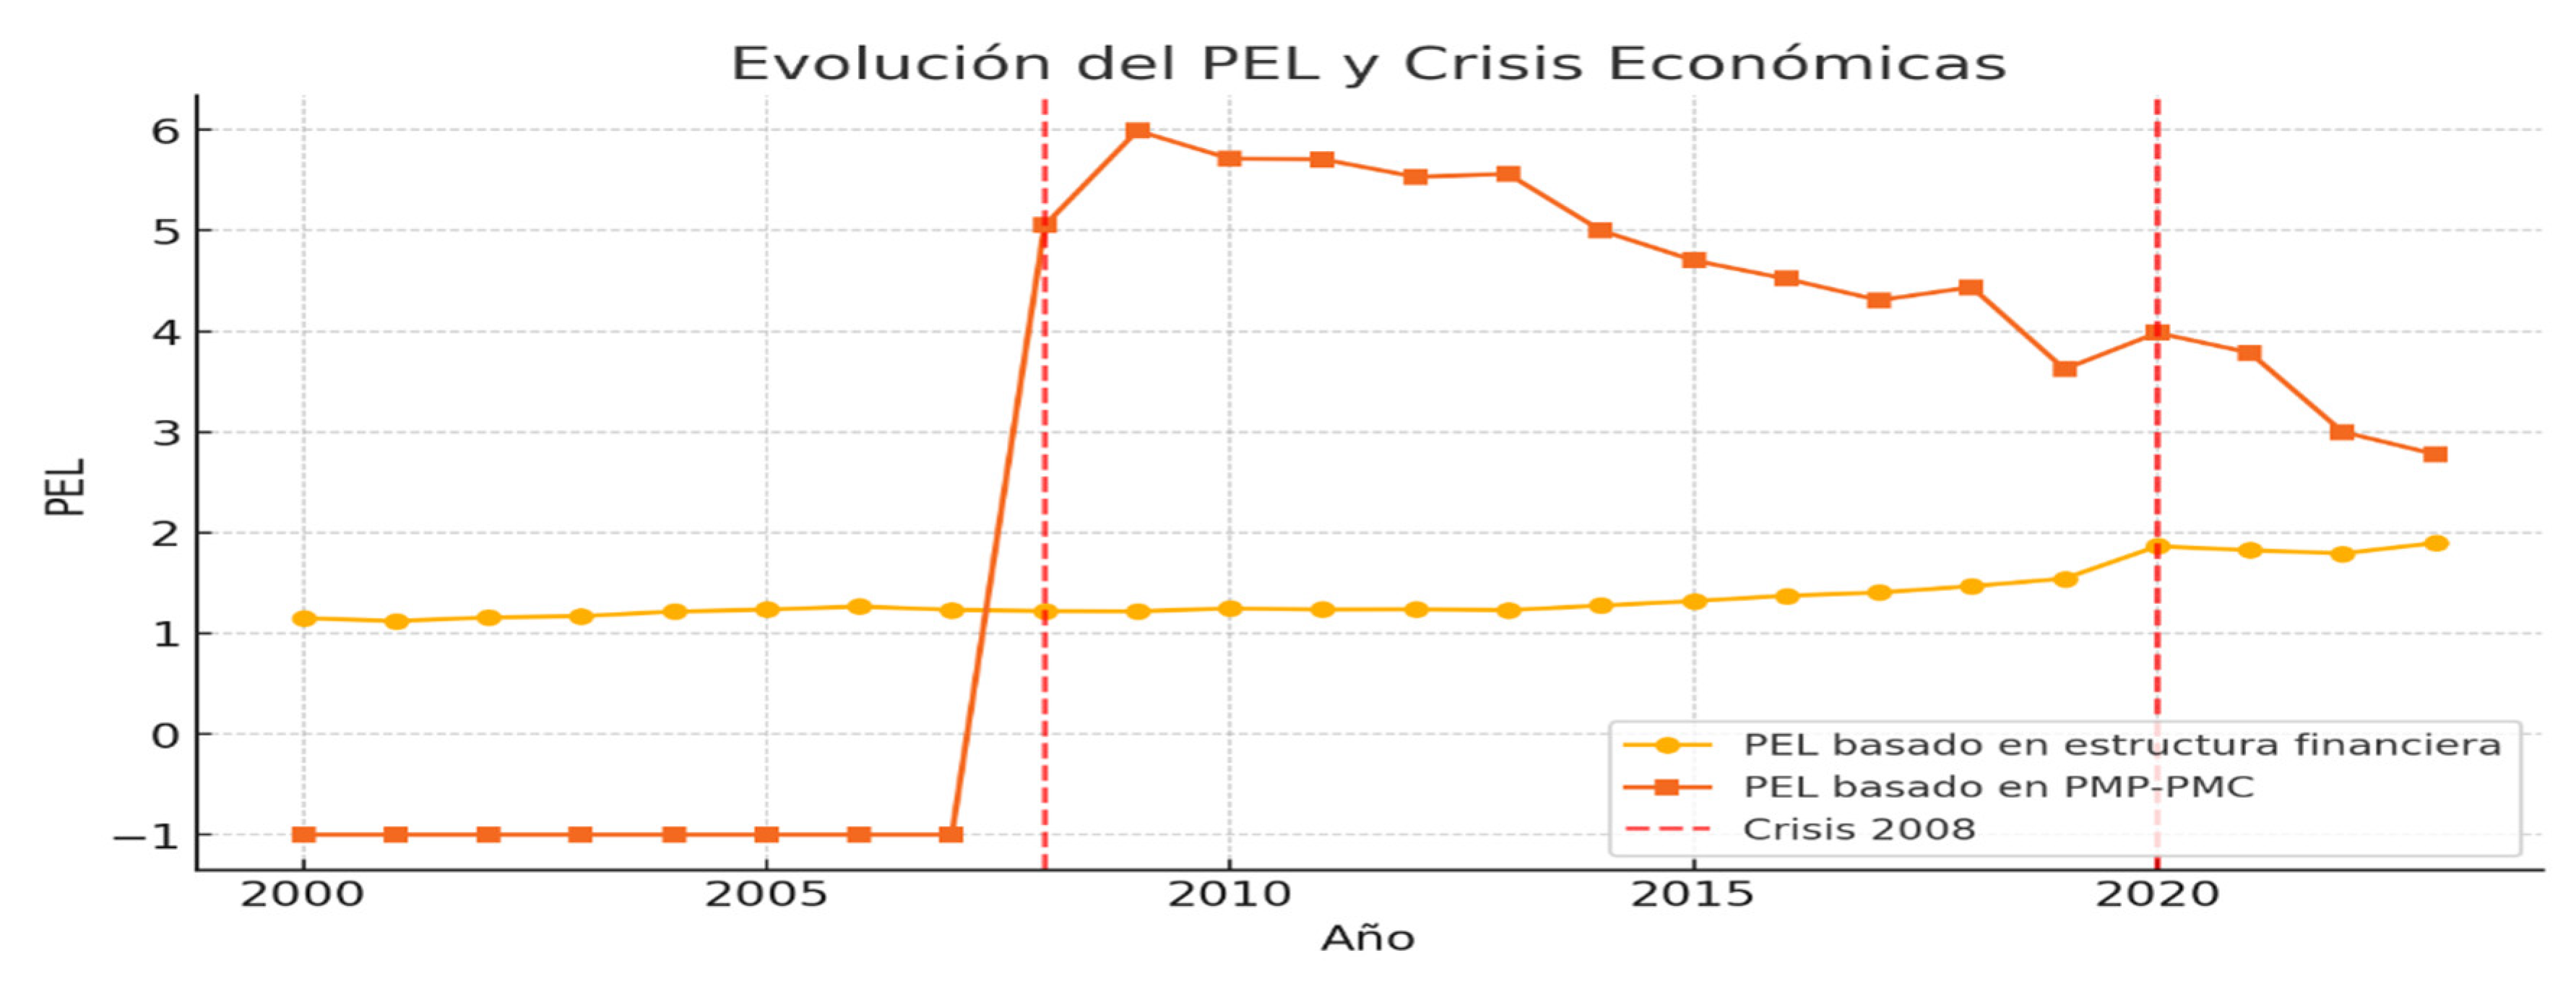
Figure 7.
Graph showing the relationship between liquidity (working capital) and total financial debt, illustrating the inverse correlation between liquidity availability and leverage levels. Source: Prepared by the authors.
Figure 7.
Graph showing the relationship between liquidity (working capital) and total financial debt, illustrating the inverse correlation between liquidity availability and leverage levels. Source: Prepared by the authors.
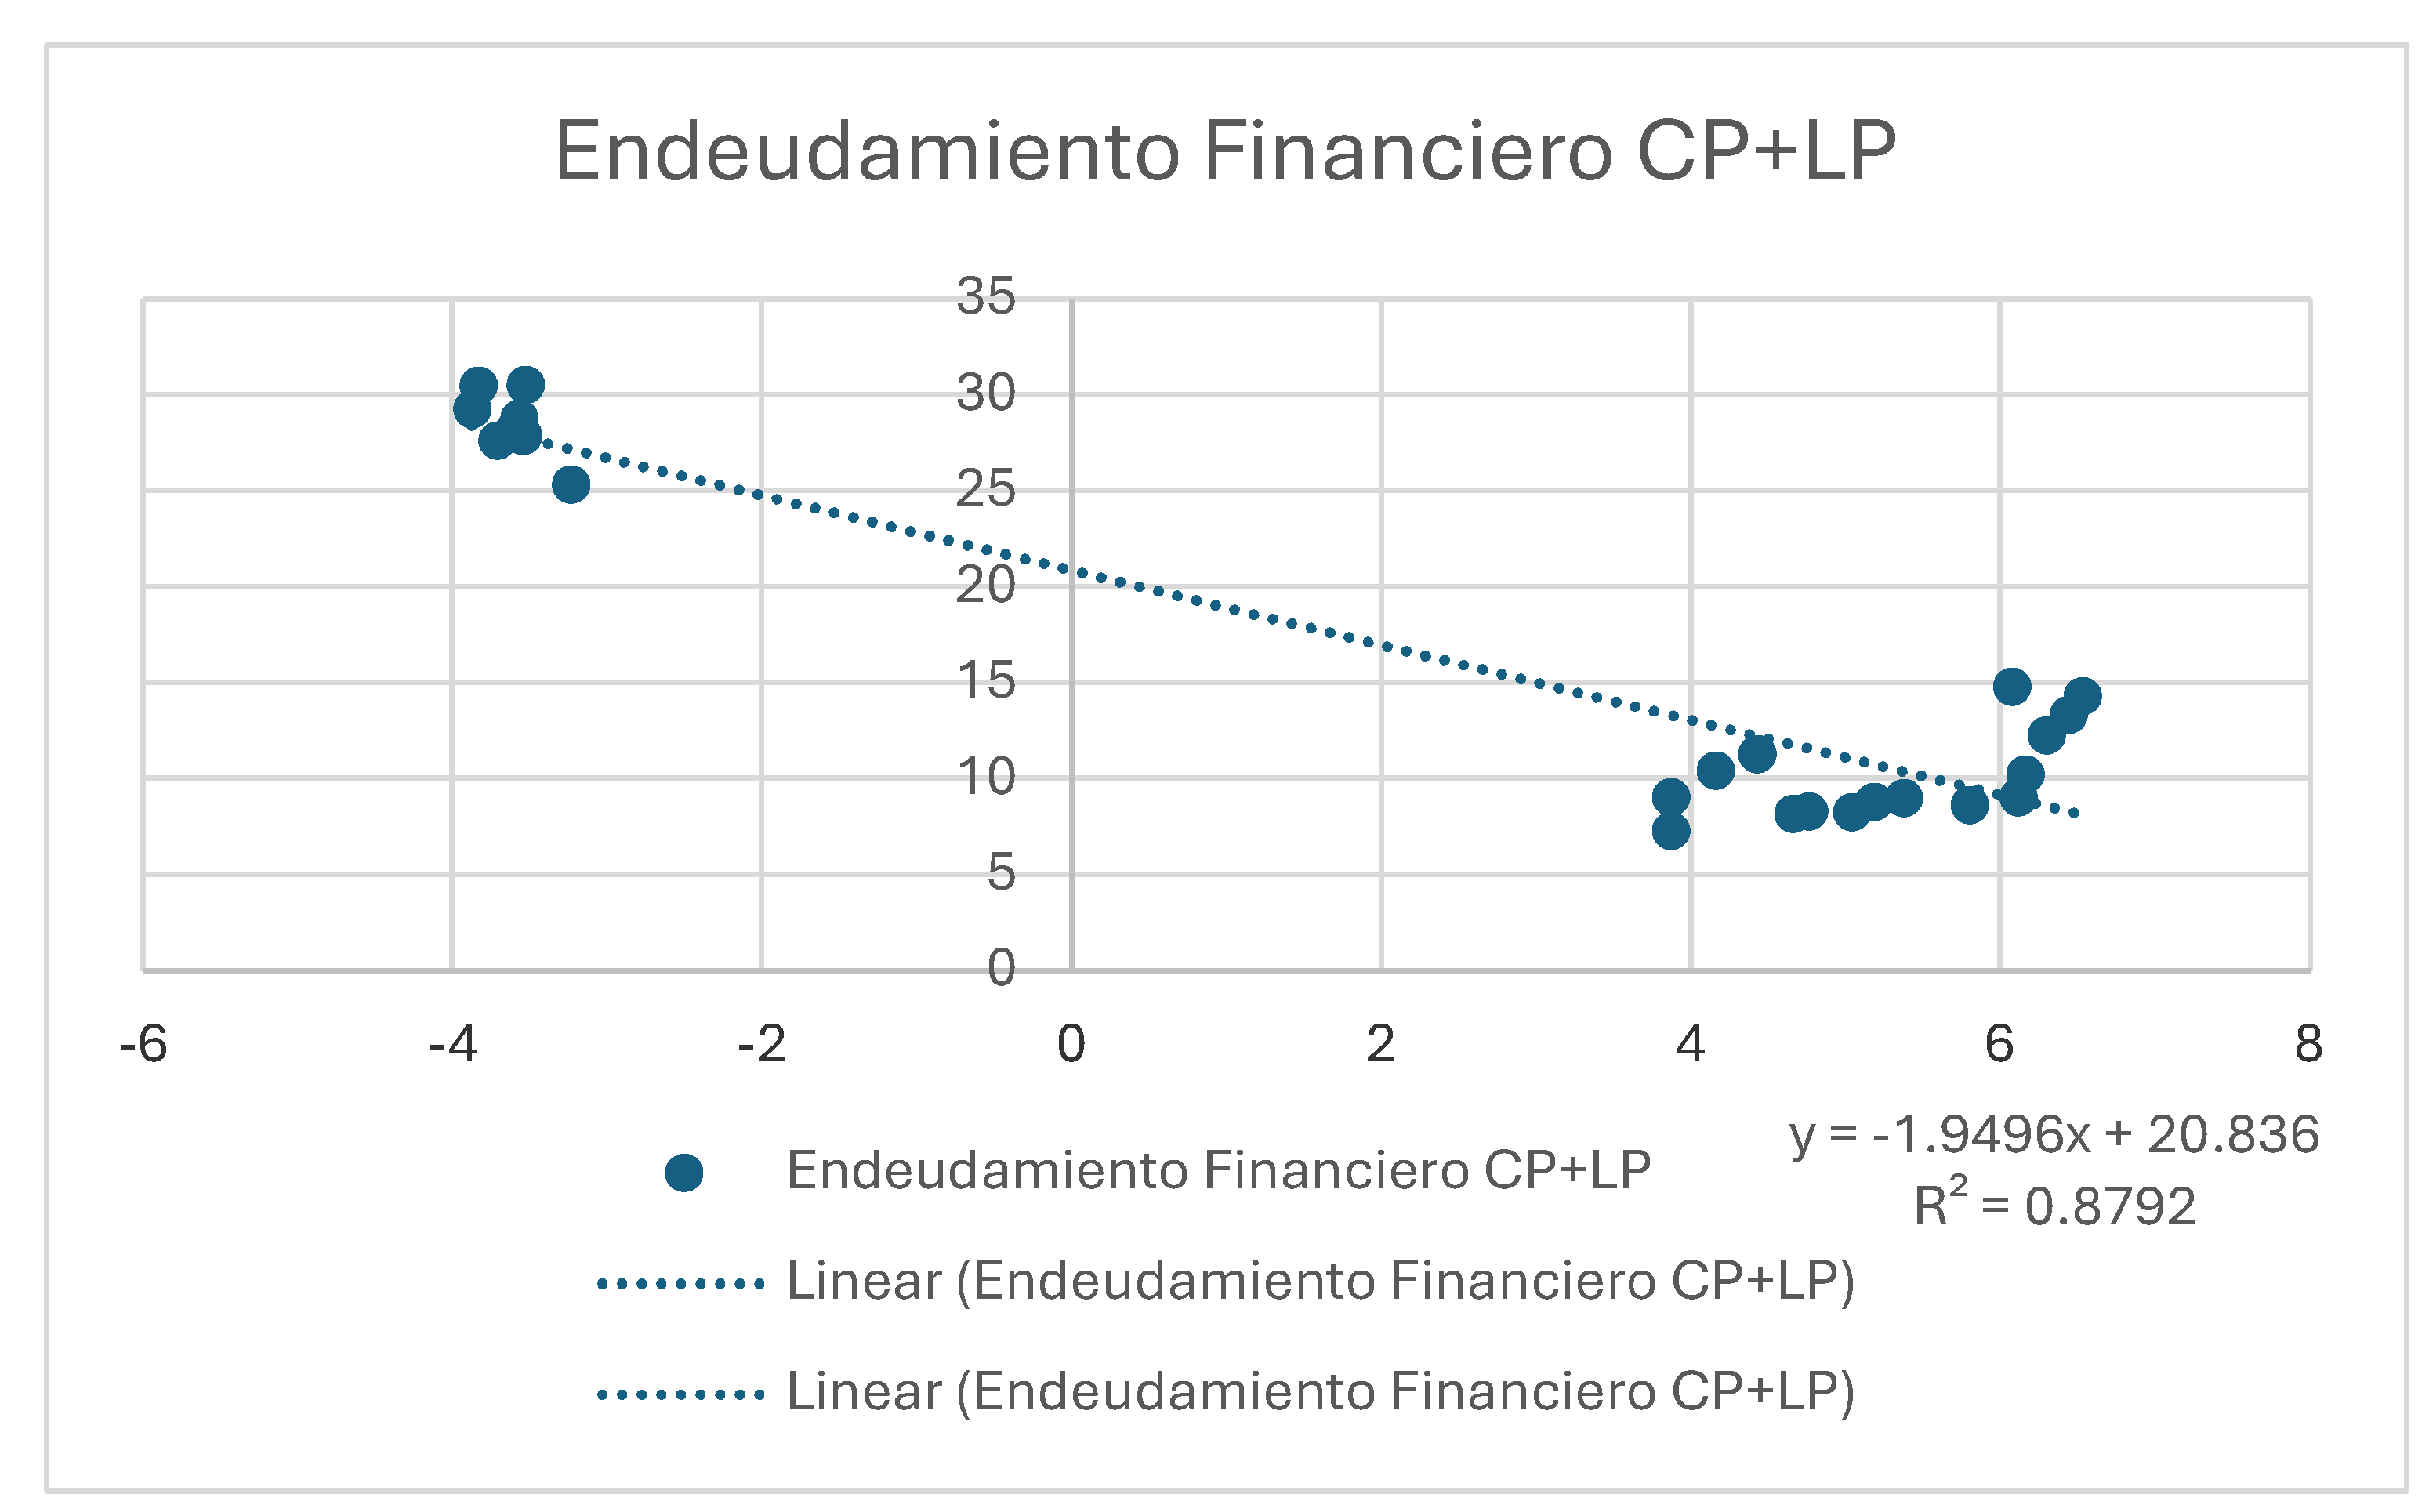
Figure 8.
Graph showing the relationship between liquidity availability and new business creation, illustrating the positive correlation between operating liquidity and entrepreneurial expansion. Source: Prepared by the authors.
Figure 8.
Graph showing the relationship between liquidity availability and new business creation, illustrating the positive correlation between operating liquidity and entrepreneurial expansion. Source: Prepared by the authors.
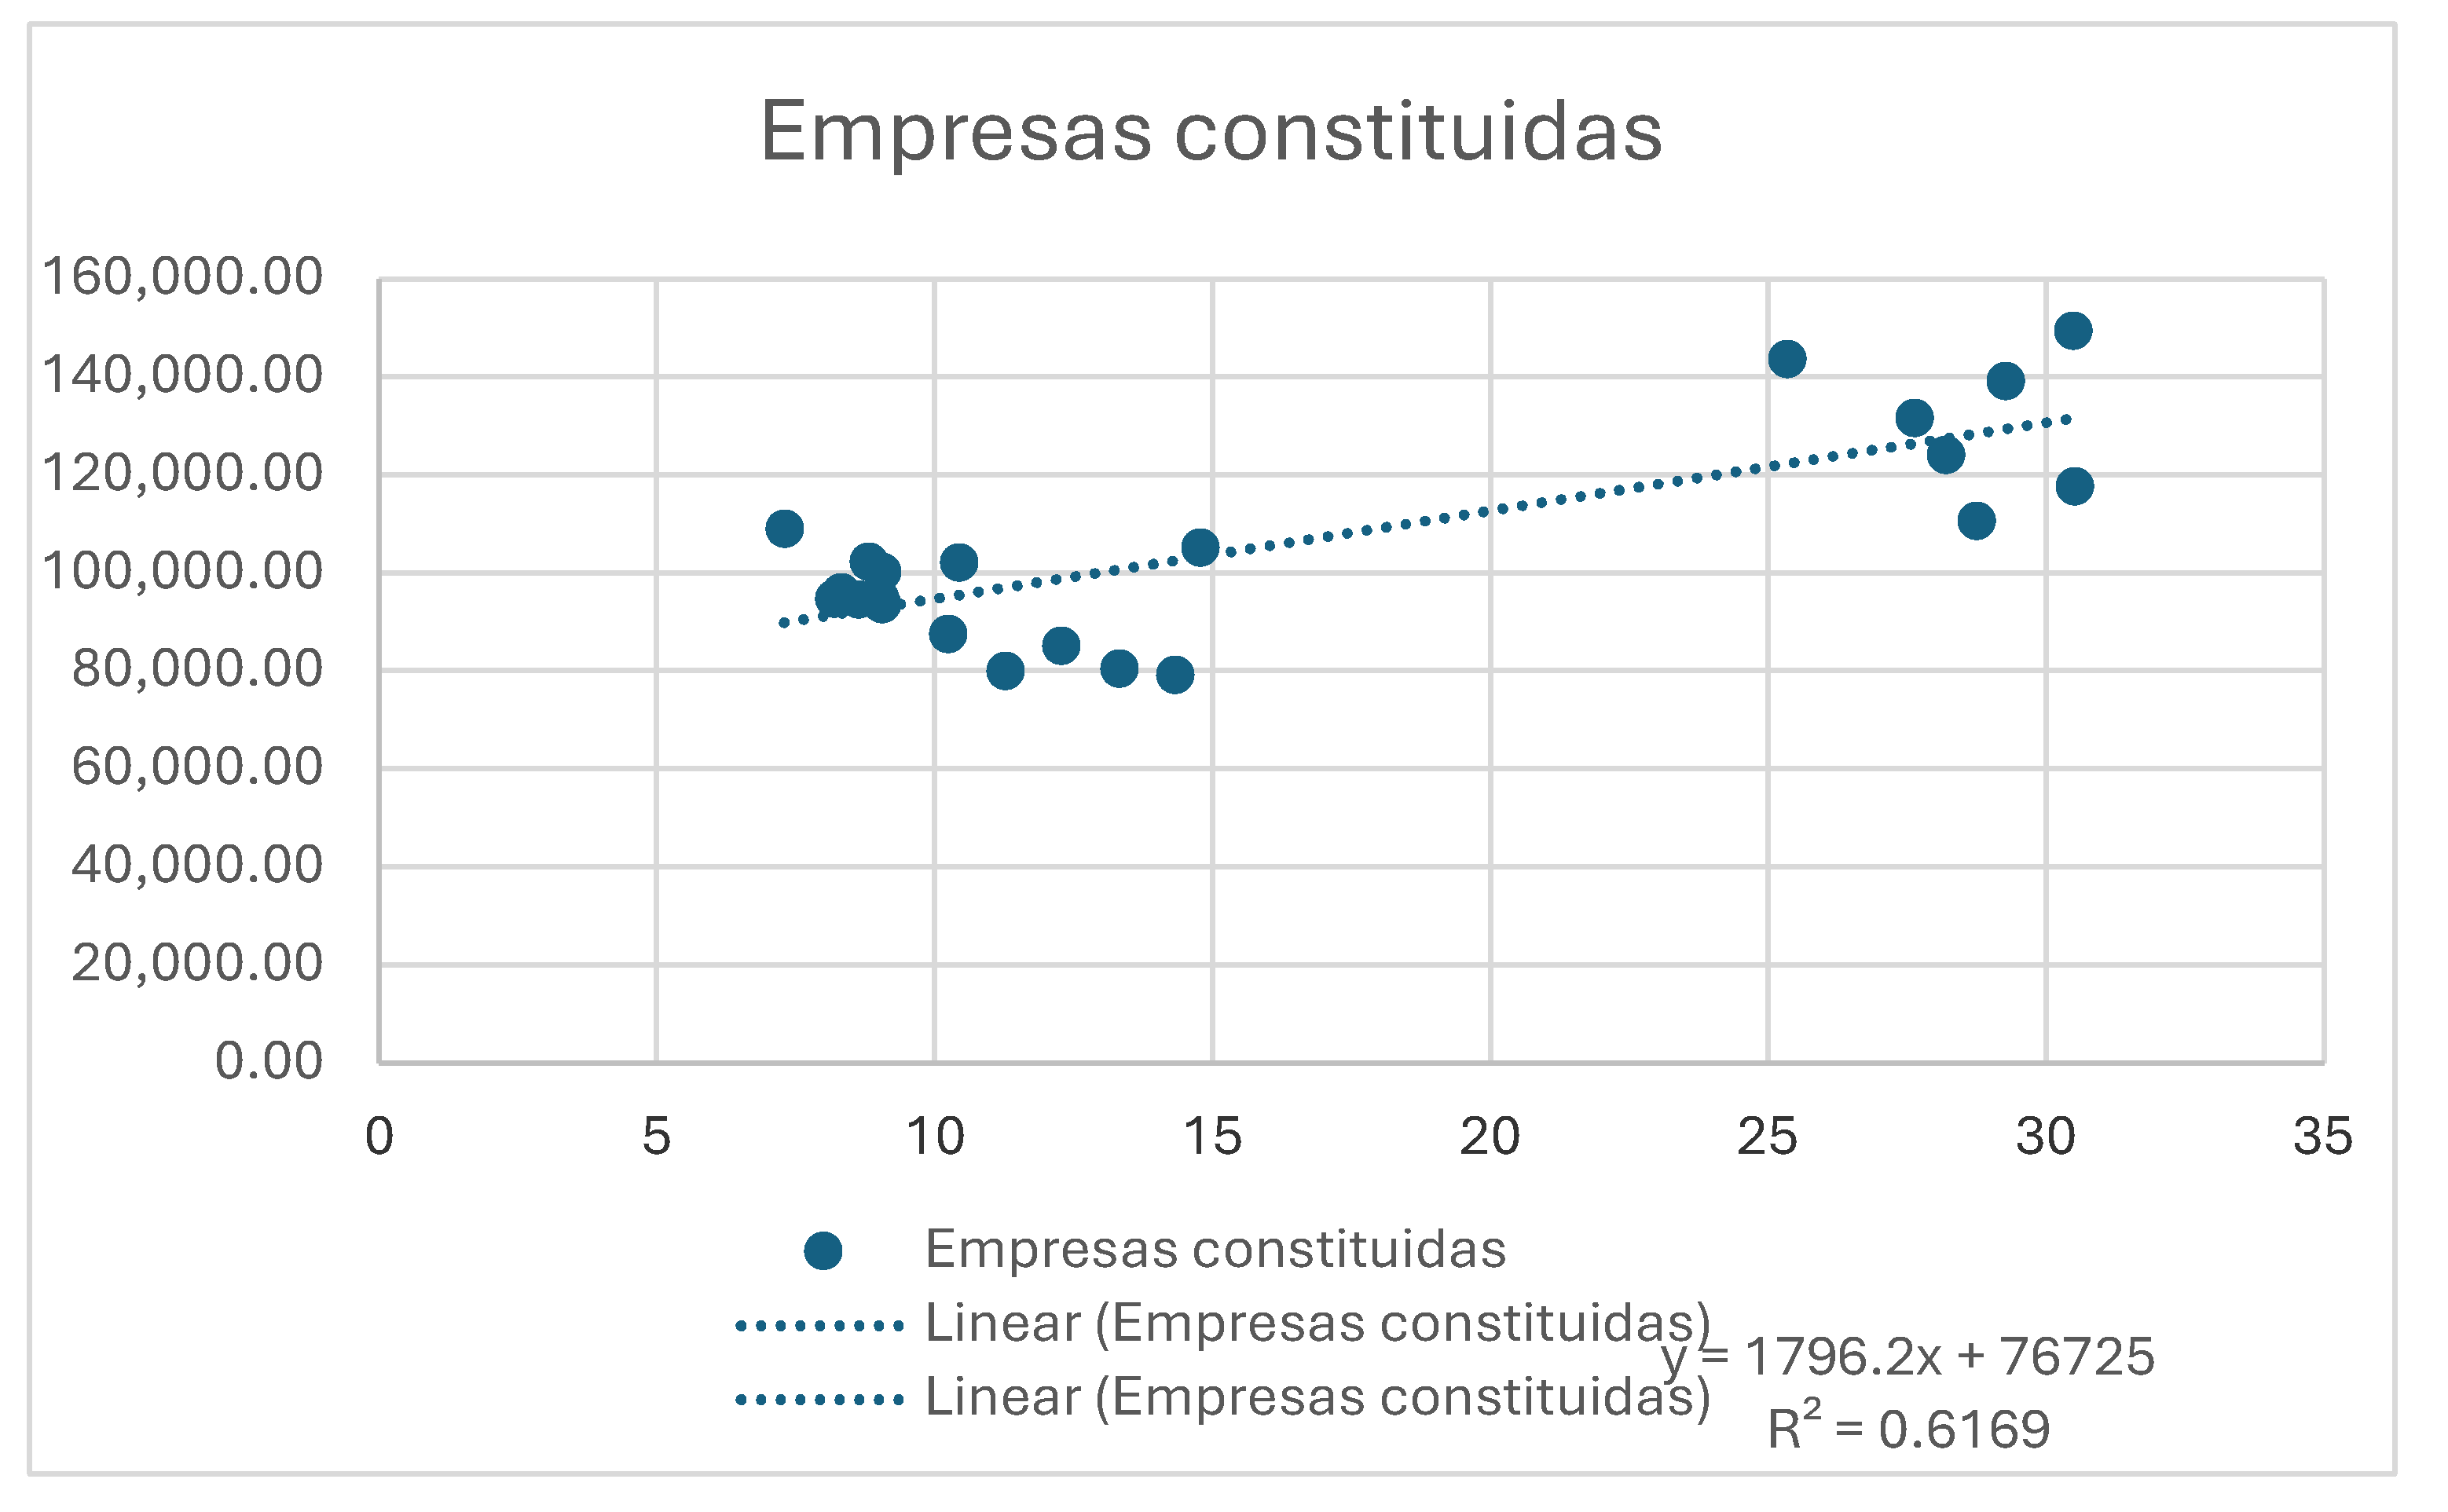
Figure 9.
Trend graph of the Unsustainable Expansion Index (IEI), showing its cyclical fluctuations and decline during the 2008 financial crisis. Source: Prepared by the authors.
Figure 9.
Trend graph of the Unsustainable Expansion Index (IEI), showing its cyclical fluctuations and decline during the 2008 financial crisis. Source: Prepared by the authors.
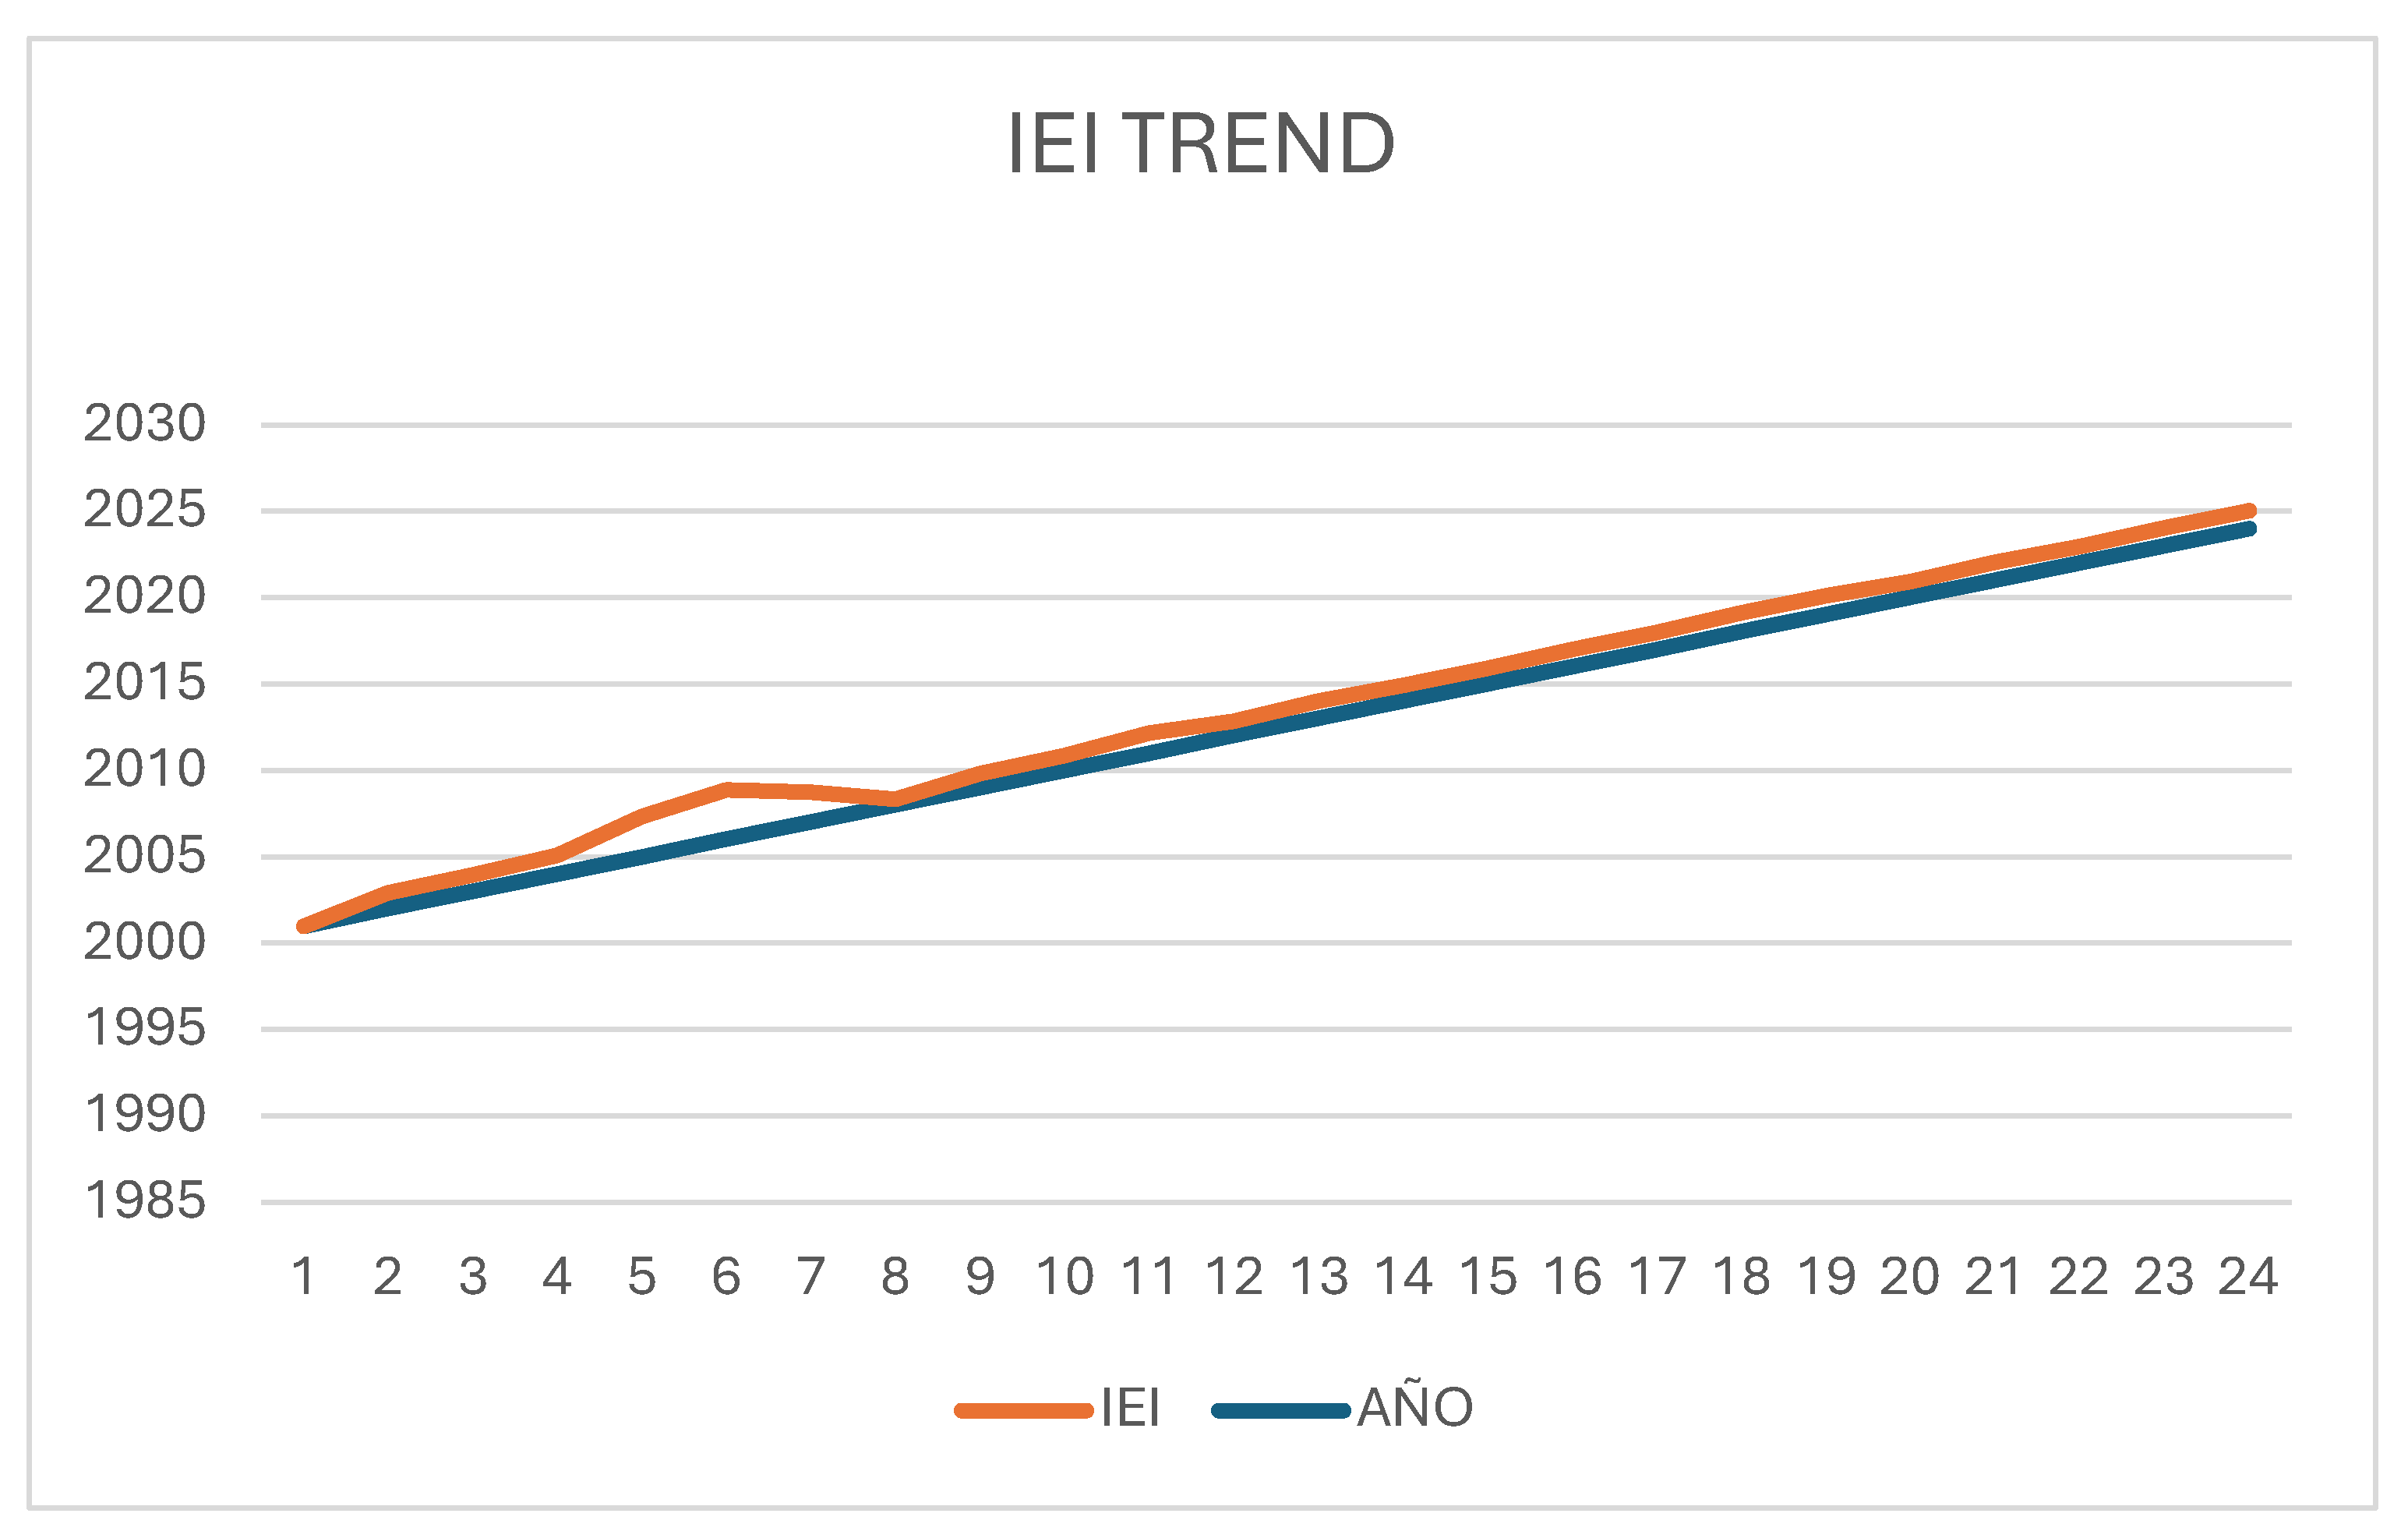
Figure 10.
Crossover graph showing the relationship between the Unsustainable Expansion Index (IEI) and corporate bankruptcies over time, illustrating the predictive power of the index as a signal of systemic fragility. Source: Prepared by the authors.
Figure 10.
Crossover graph showing the relationship between the Unsustainable Expansion Index (IEI) and corporate bankruptcies over time, illustrating the predictive power of the index as a signal of systemic fragility. Source: Prepared by the authors.
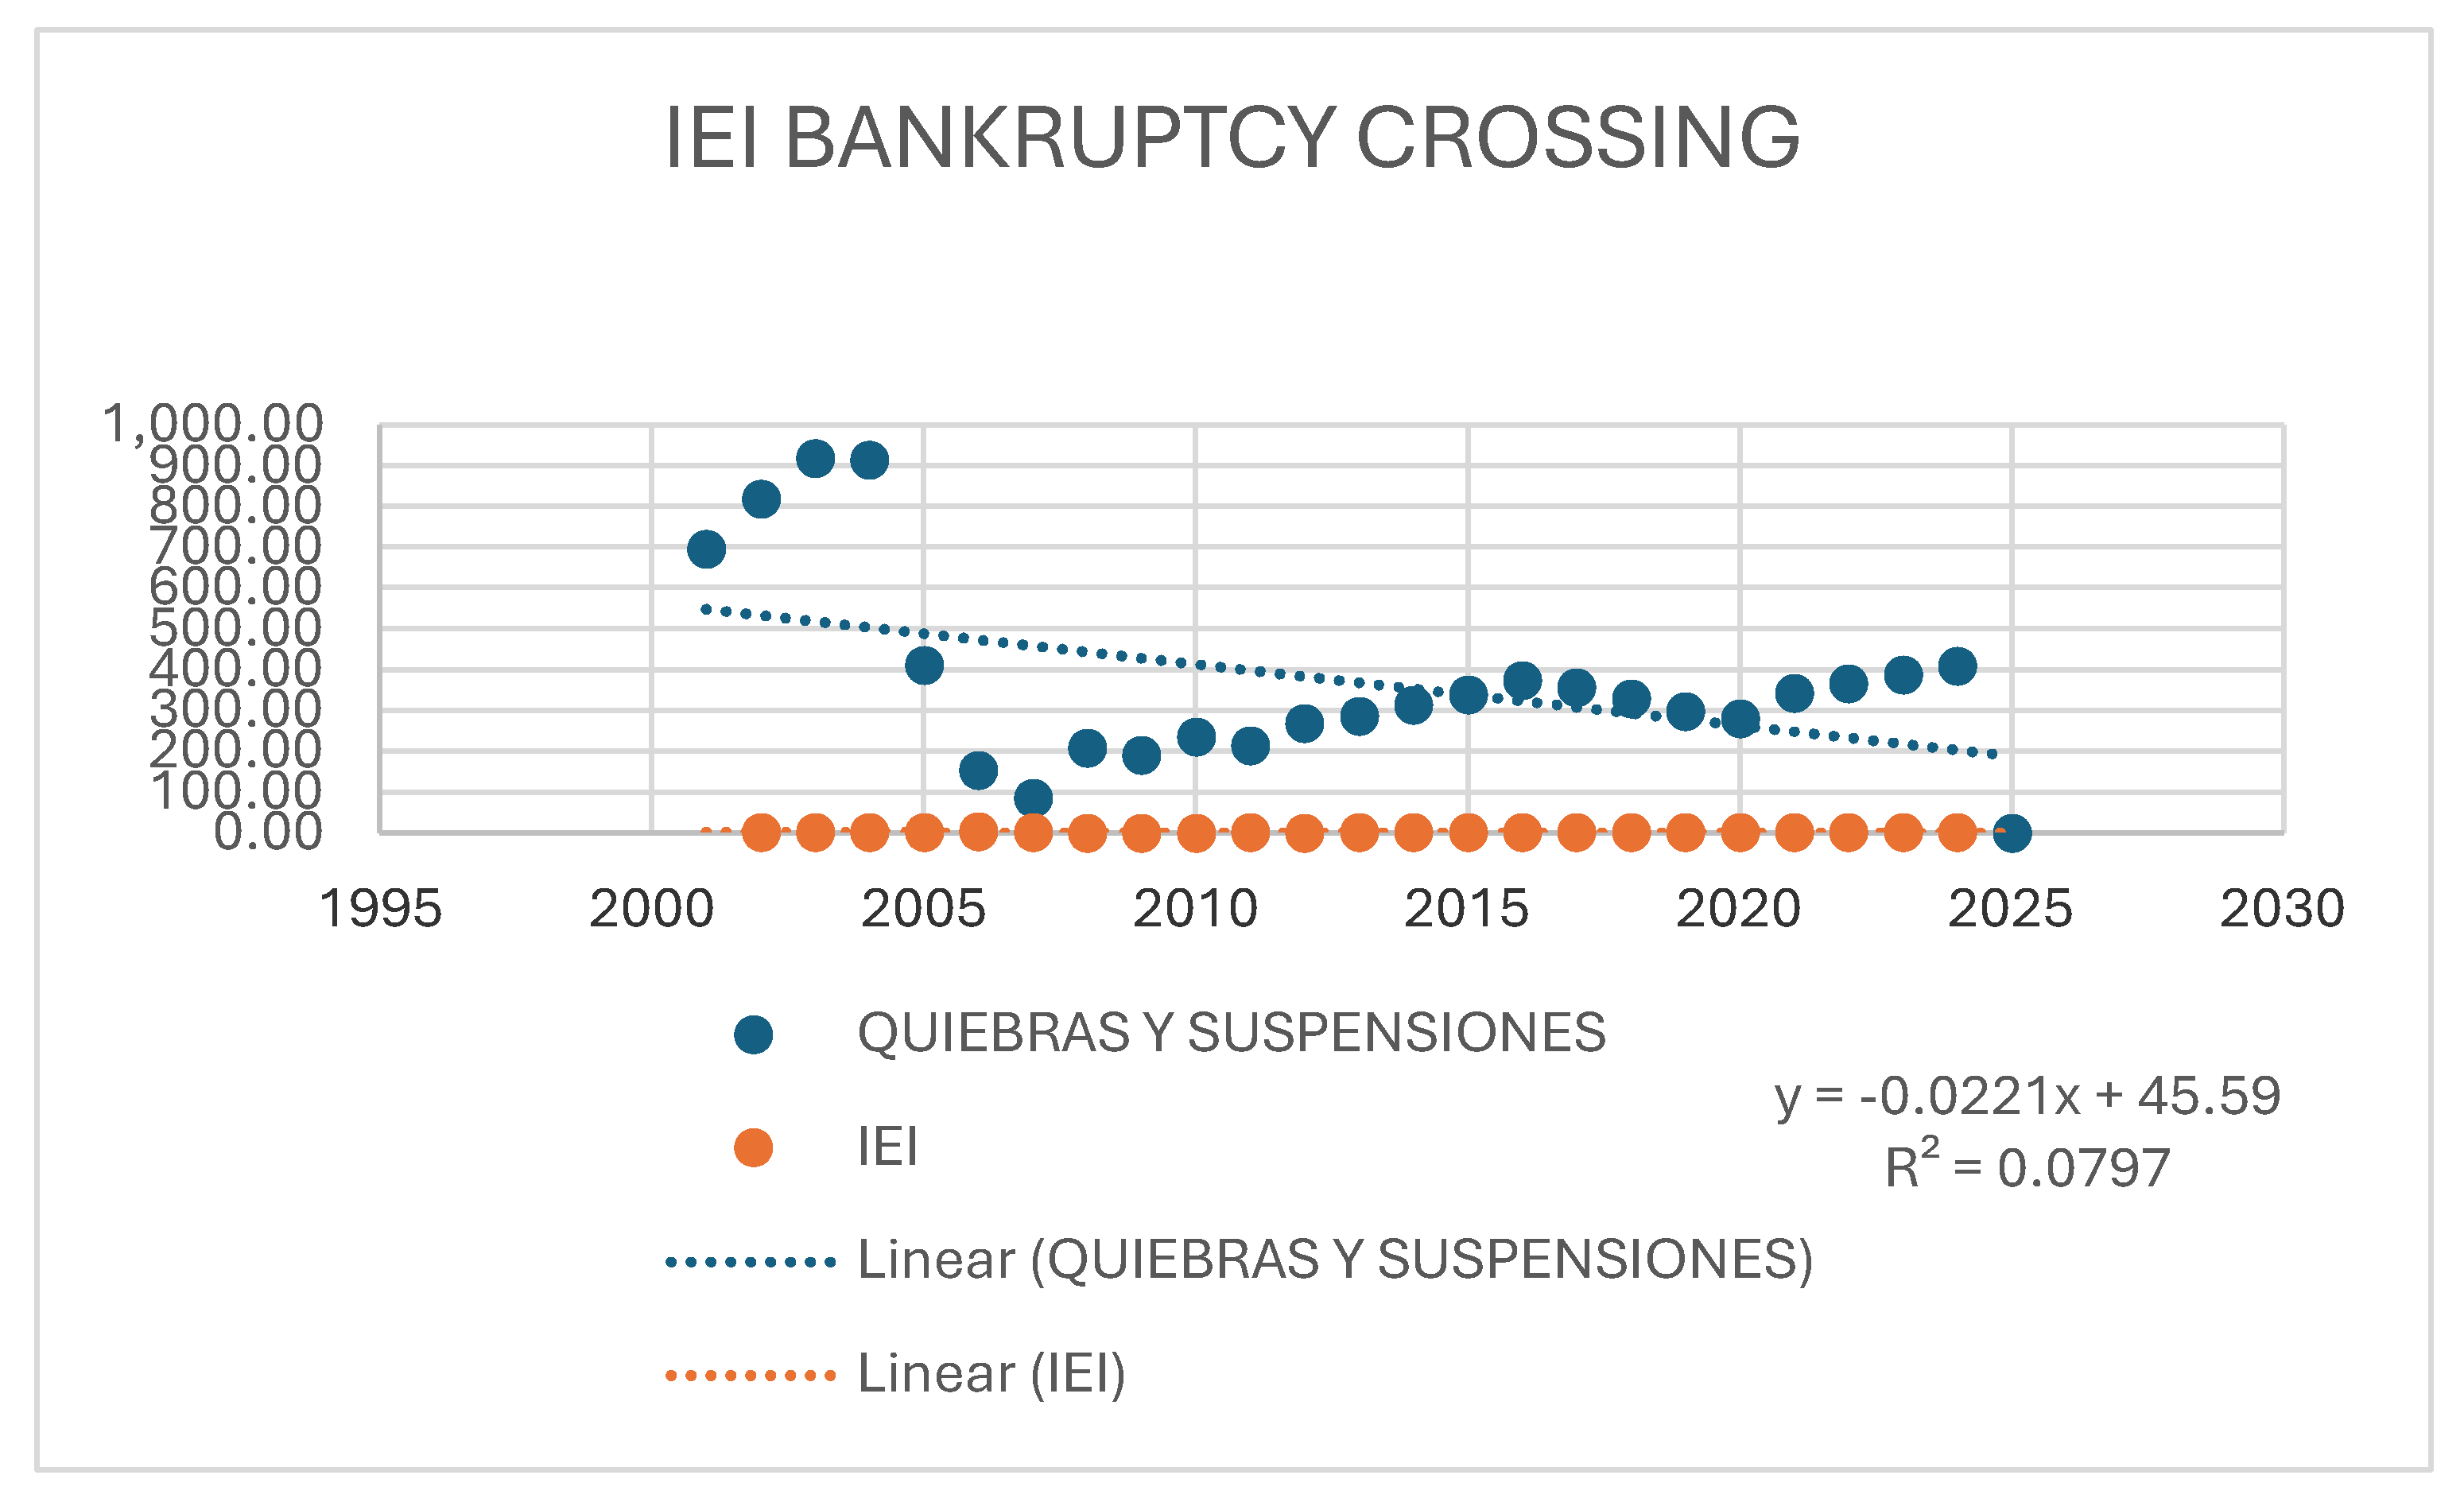
Figure 11.
Graph showing the relationship between working capital and corporate bankruptcies, illustrating the weak correlation (r = 0.061) and suggesting the predominance of leverage and macroeconomic factors over liquidity shortages. Source: Prepared by the authors.
Figure 11.
Graph showing the relationship between working capital and corporate bankruptcies, illustrating the weak correlation (r = 0.061) and suggesting the predominance of leverage and macroeconomic factors over liquidity shortages. Source: Prepared by the authors.
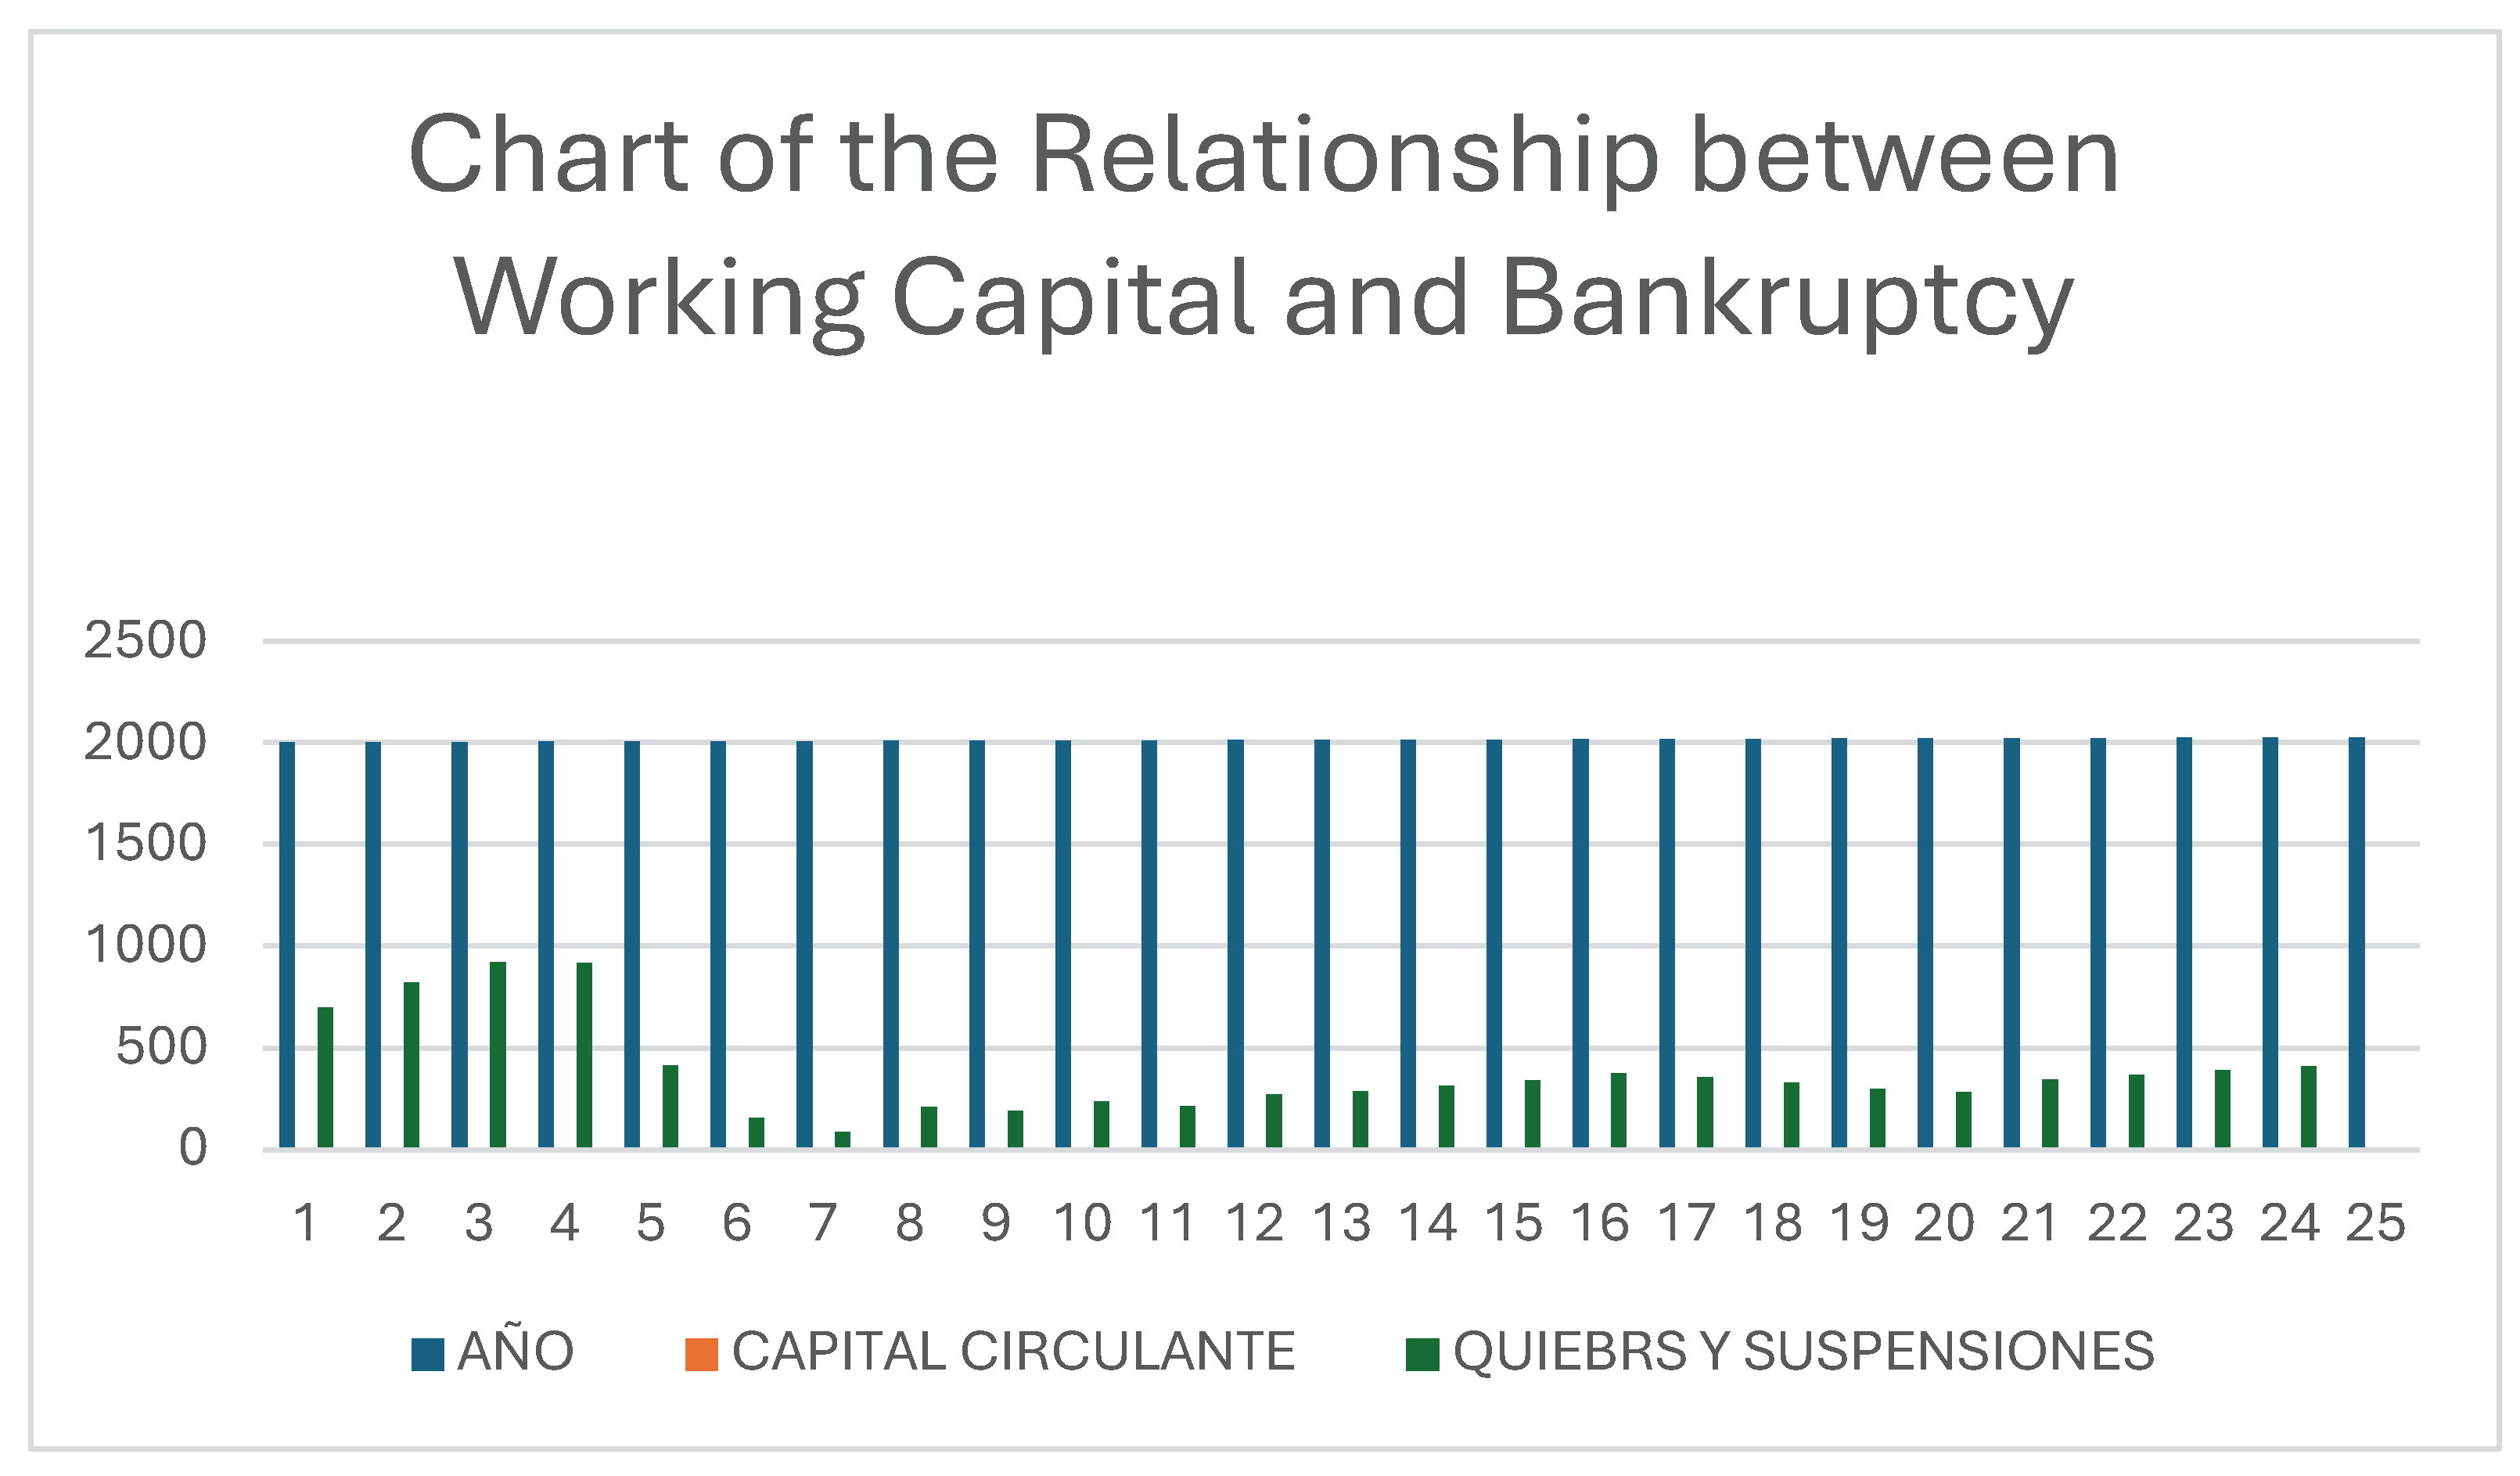
Figure 13.
Evolution of established and defunct companies in Spain (2000–2024), illustrating cyclical patterns of expansion, collapse, and stabilization consistent with the Financial Lobster Bias framework. Source: Prepared by the authors.
Figure 13.
Evolution of established and defunct companies in Spain (2000–2024), illustrating cyclical patterns of expansion, collapse, and stabilization consistent with the Financial Lobster Bias framework. Source: Prepared by the authors.
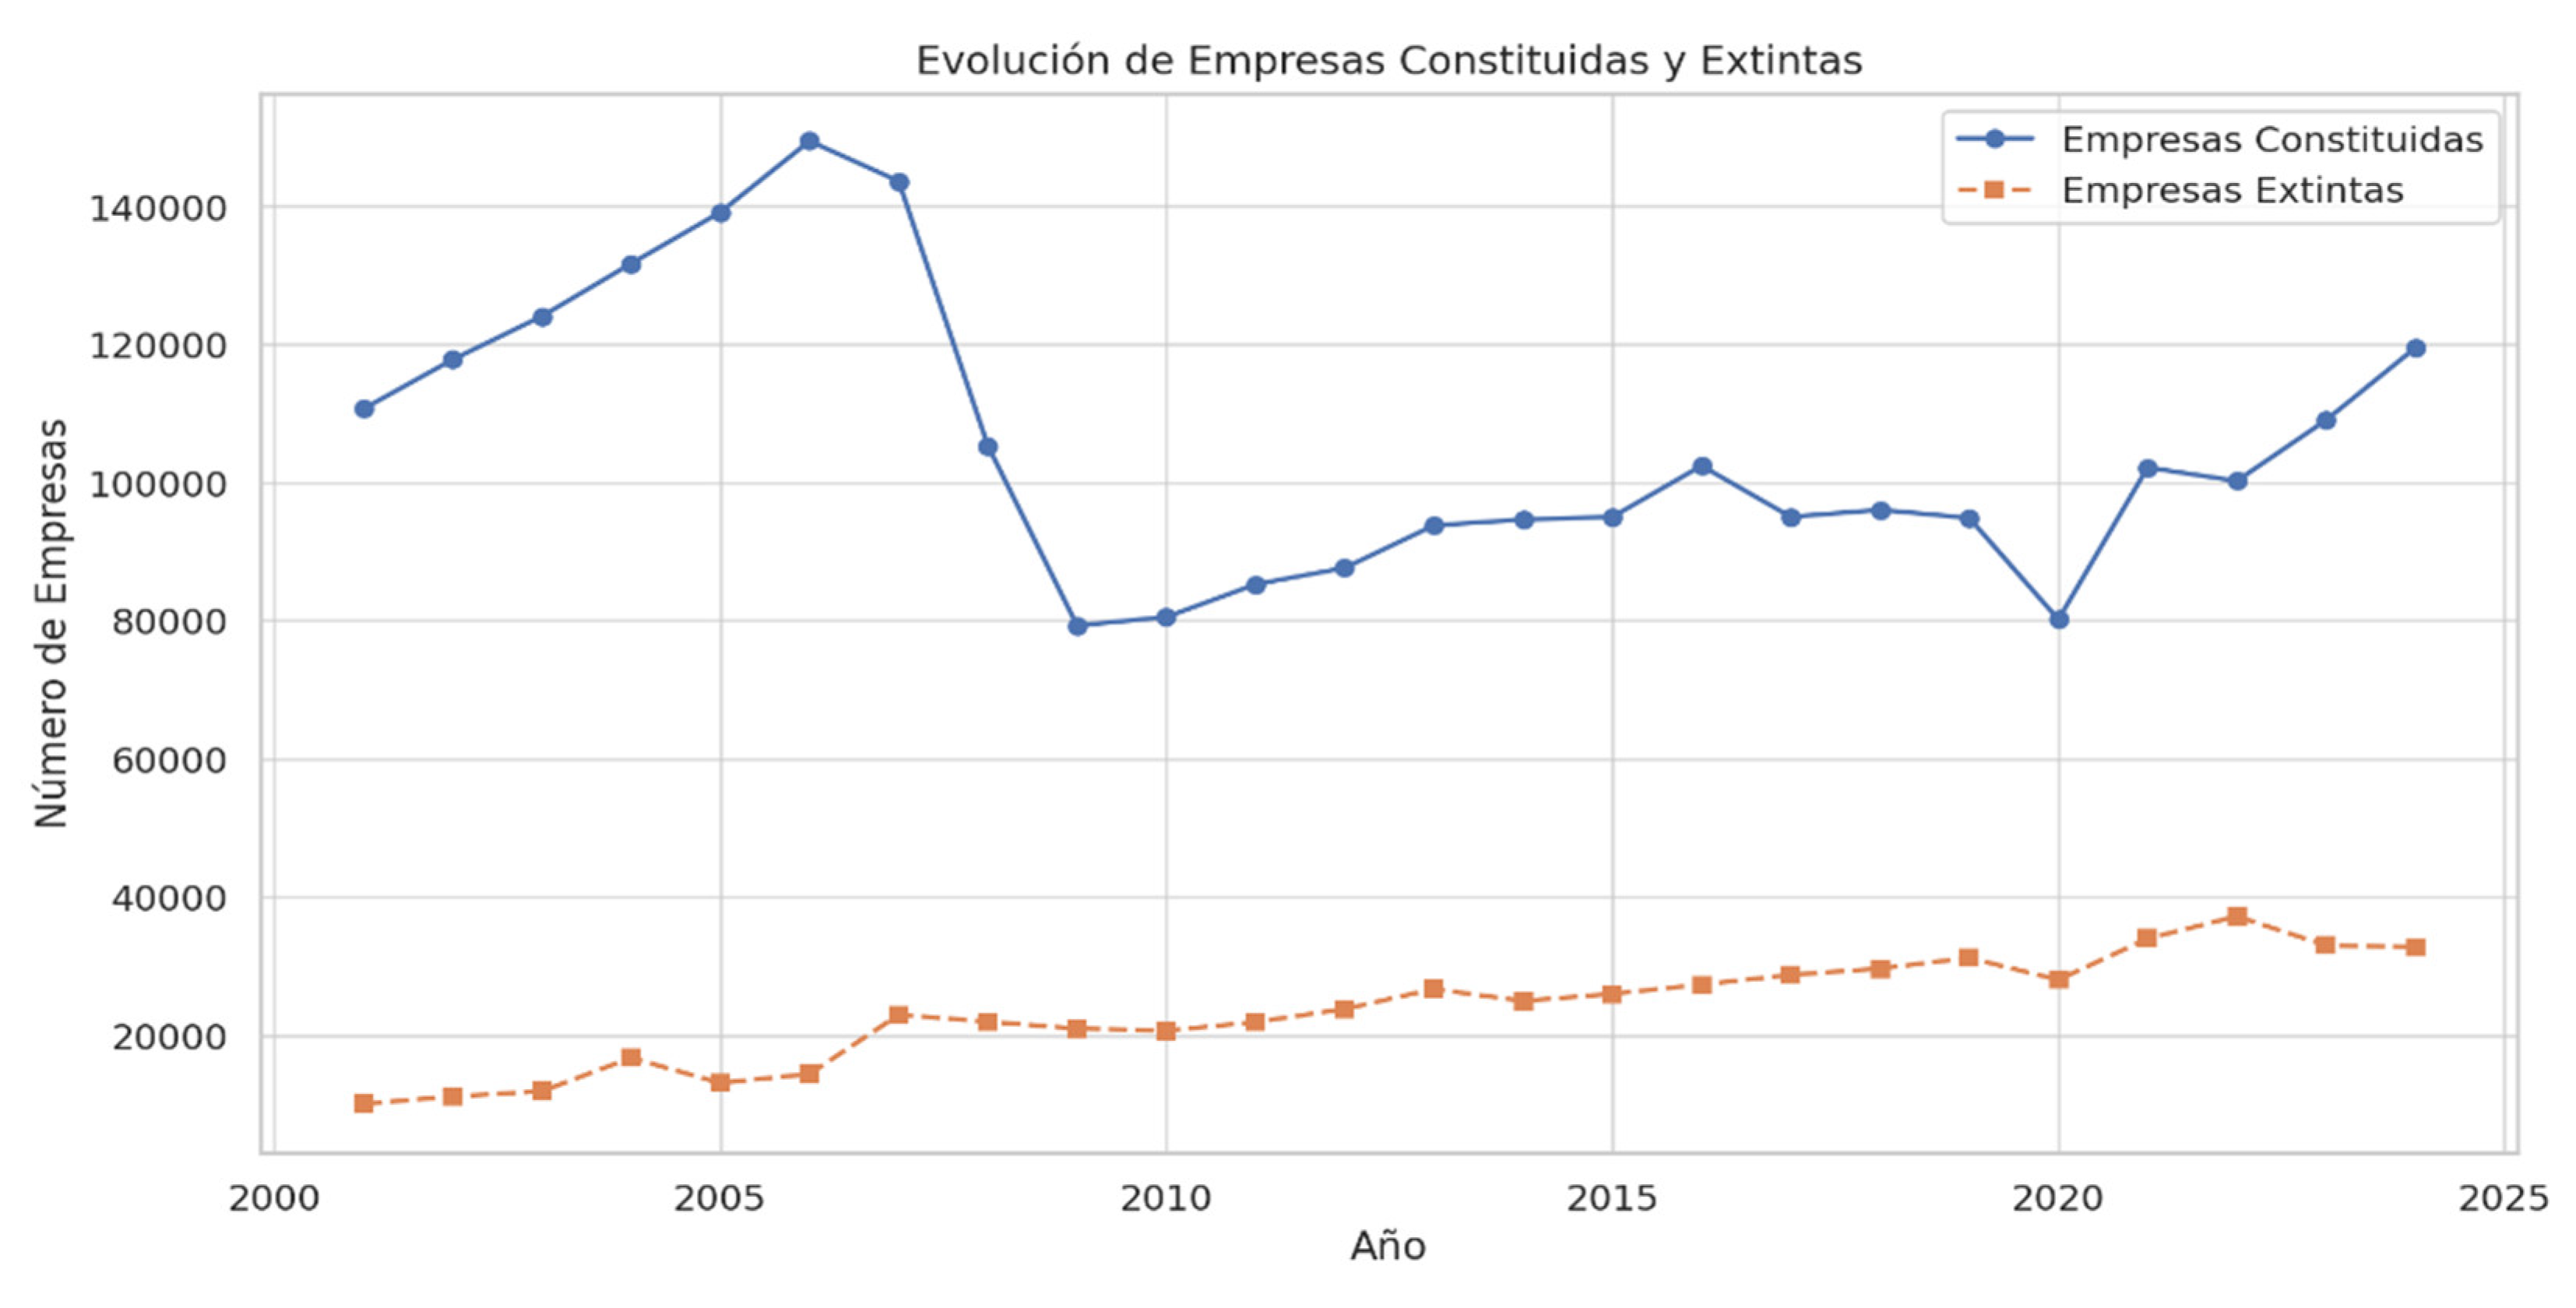
Figure 14.
Heat map of the machine learning classification model, showing the relationships between business creation, liquidity, paid-in capital, and bankruptcy occurrence across time periods. Source: Prepared by the authors.
Figure 14.
Heat map of the machine learning classification model, showing the relationships between business creation, liquidity, paid-in capital, and bankruptcy occurrence across time periods. Source: Prepared by the authors.
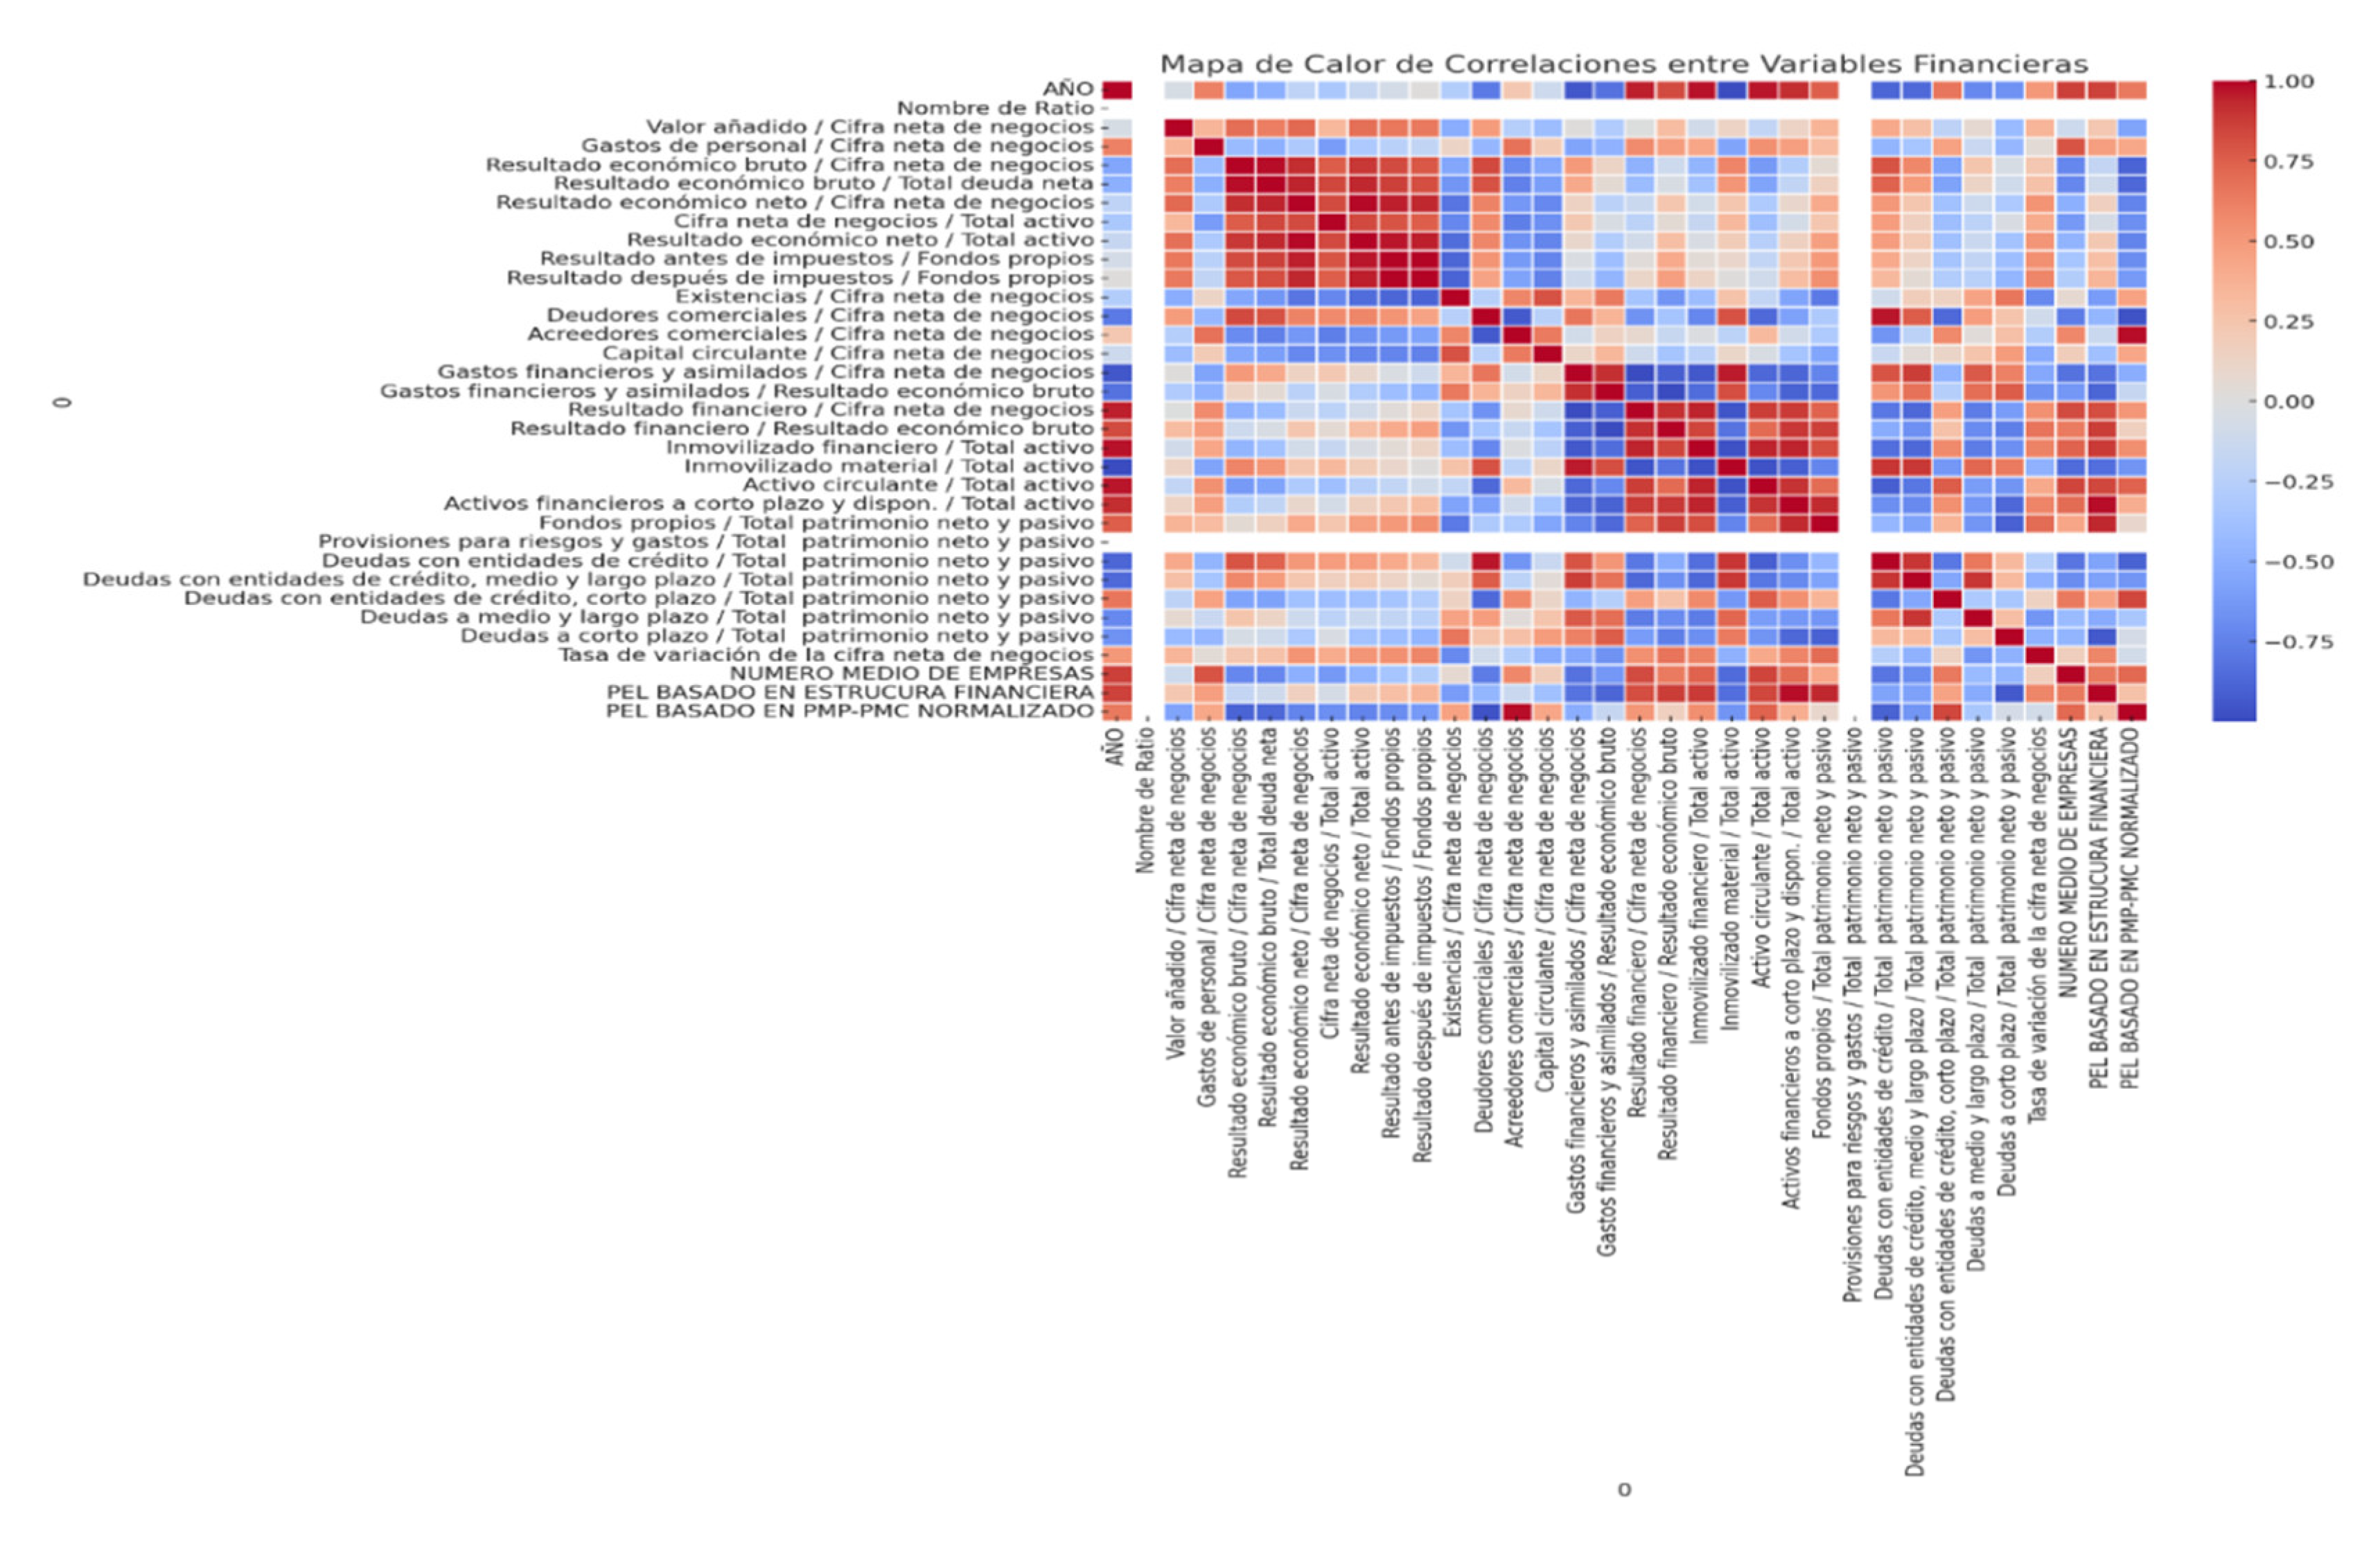
Figure 15.
Clustering results using the K-Means algorithm, showing correlations between business creation, liquidity, indebtedness, and firm demise across different economic cycles. Source: Prepared by the authors.
Figure 15.
Clustering results using the K-Means algorithm, showing correlations between business creation, liquidity, indebtedness, and firm demise across different economic cycles. Source: Prepared by the authors.
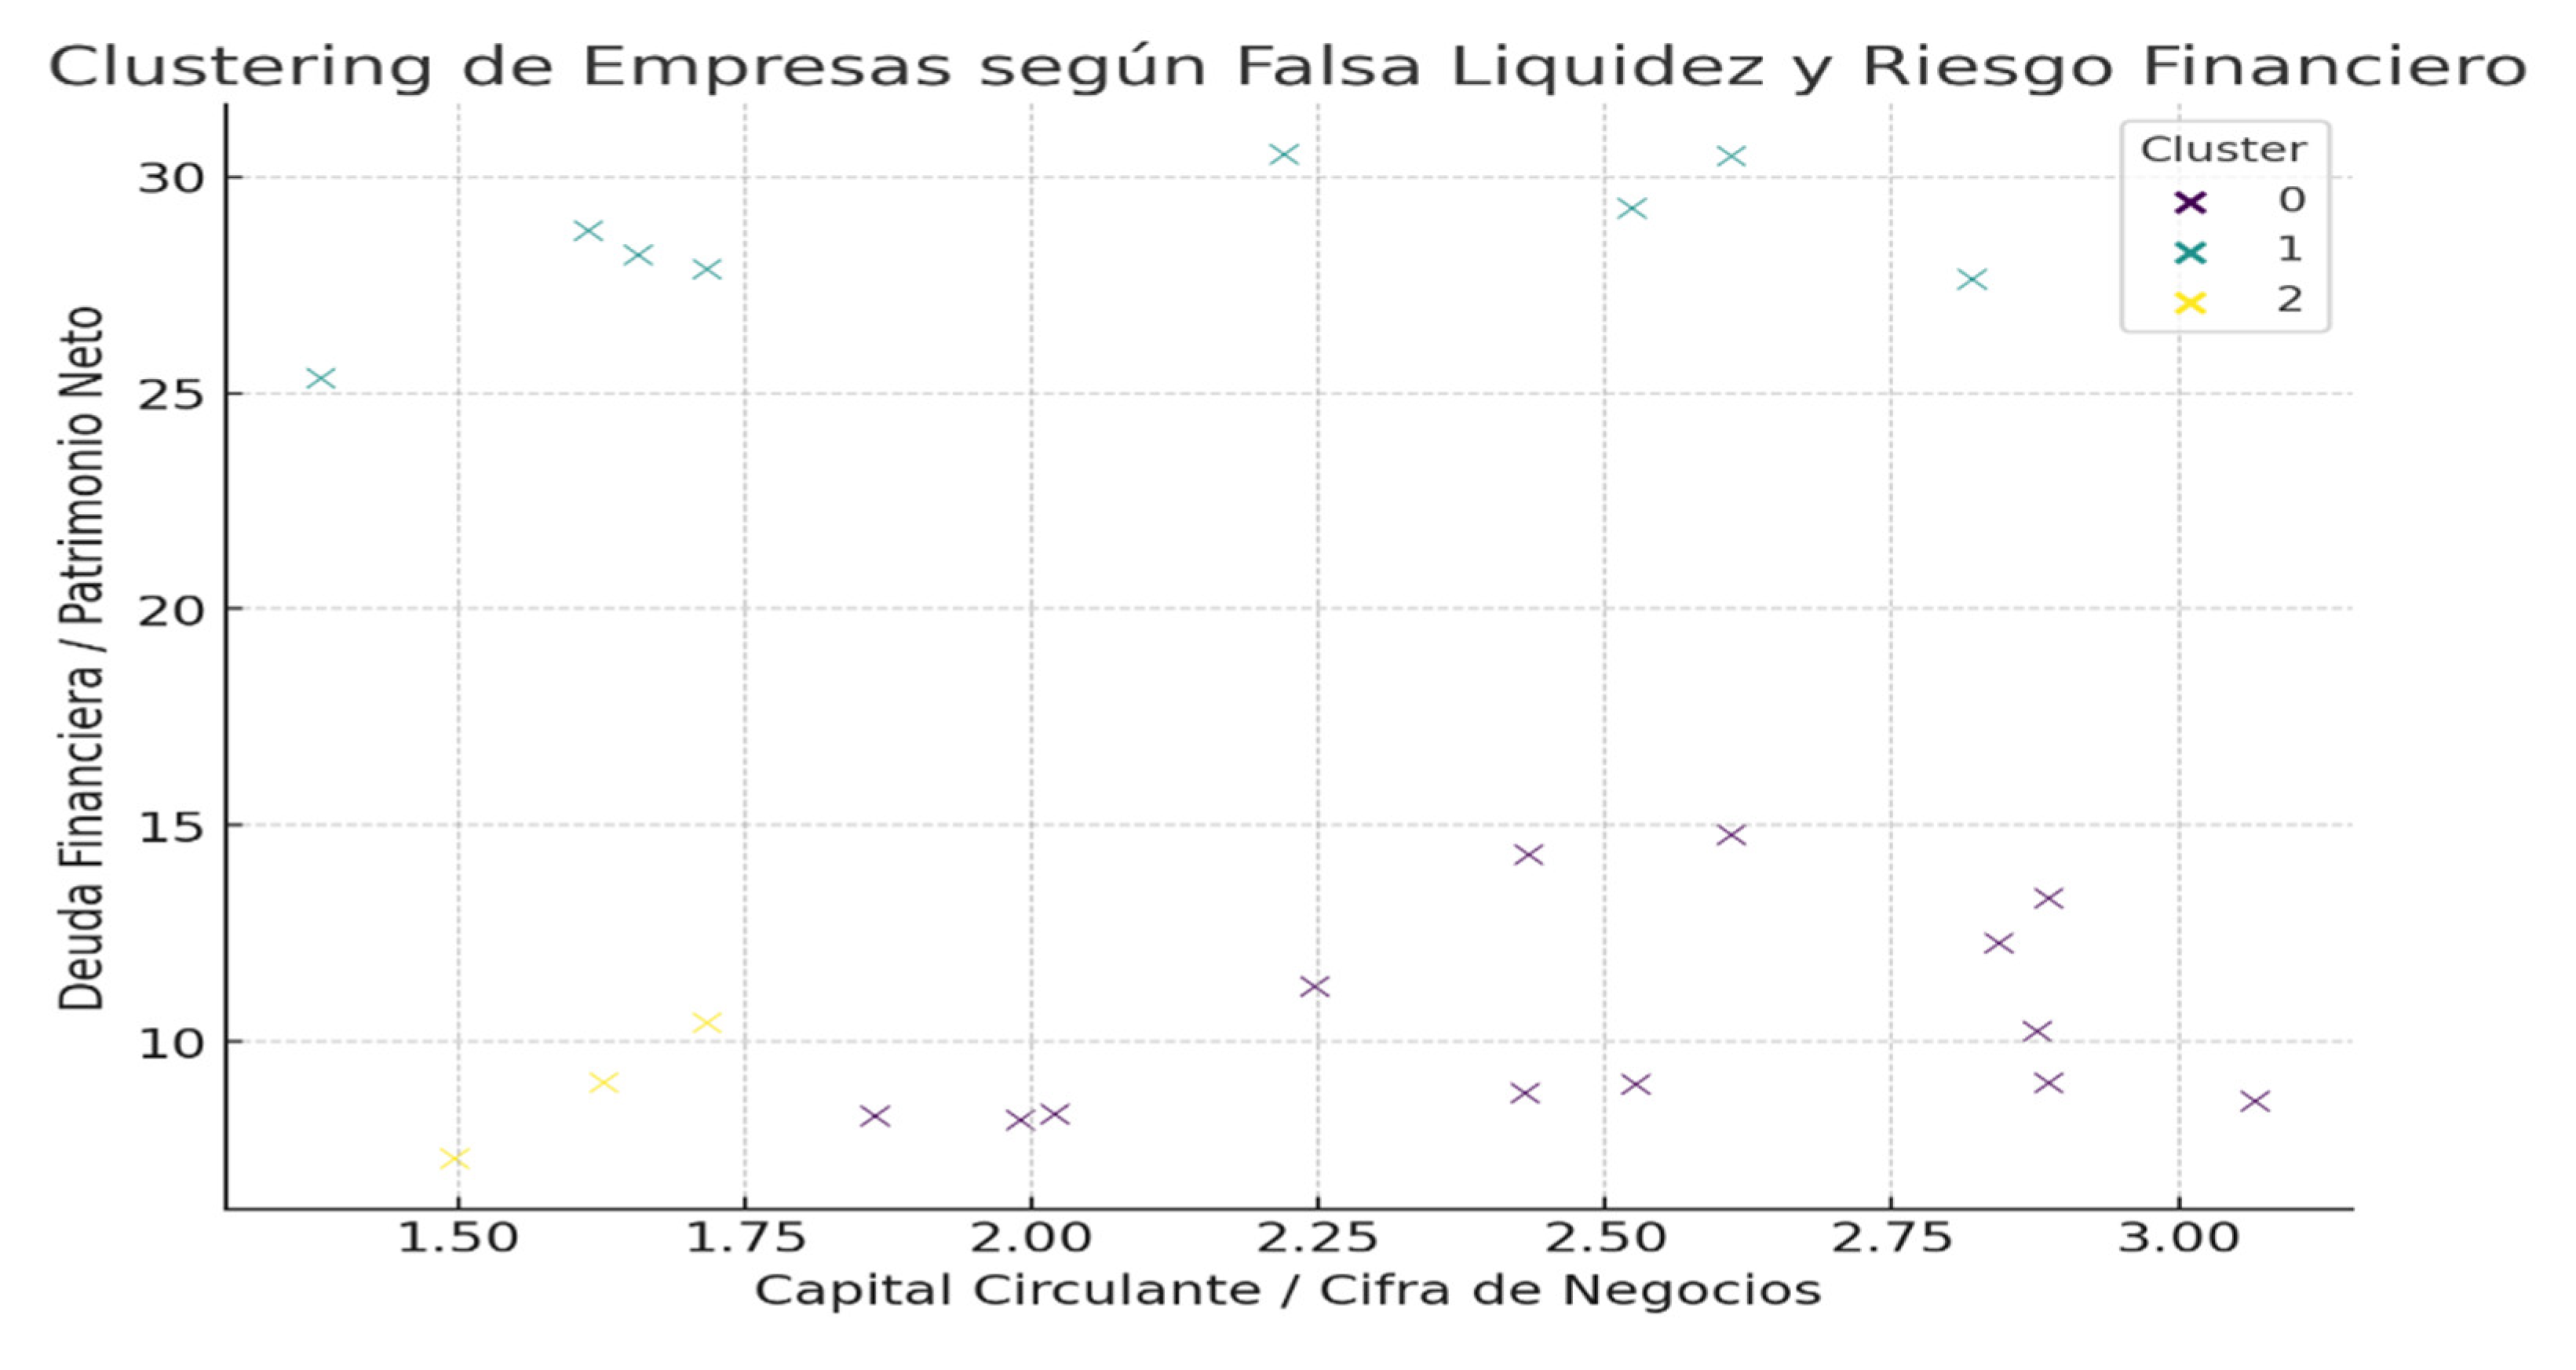
Figure 16.
K-Means clustering of firms based on working capital, turnover, and debt ratios, showing distinct financial-stability profiles and the behavioral dynamics of the Financial Lobster Bias. Source: Prepared by the authors.
Figure 16.
K-Means clustering of firms based on working capital, turnover, and debt ratios, showing distinct financial-stability profiles and the behavioral dynamics of the Financial Lobster Bias. Source: Prepared by the authors.
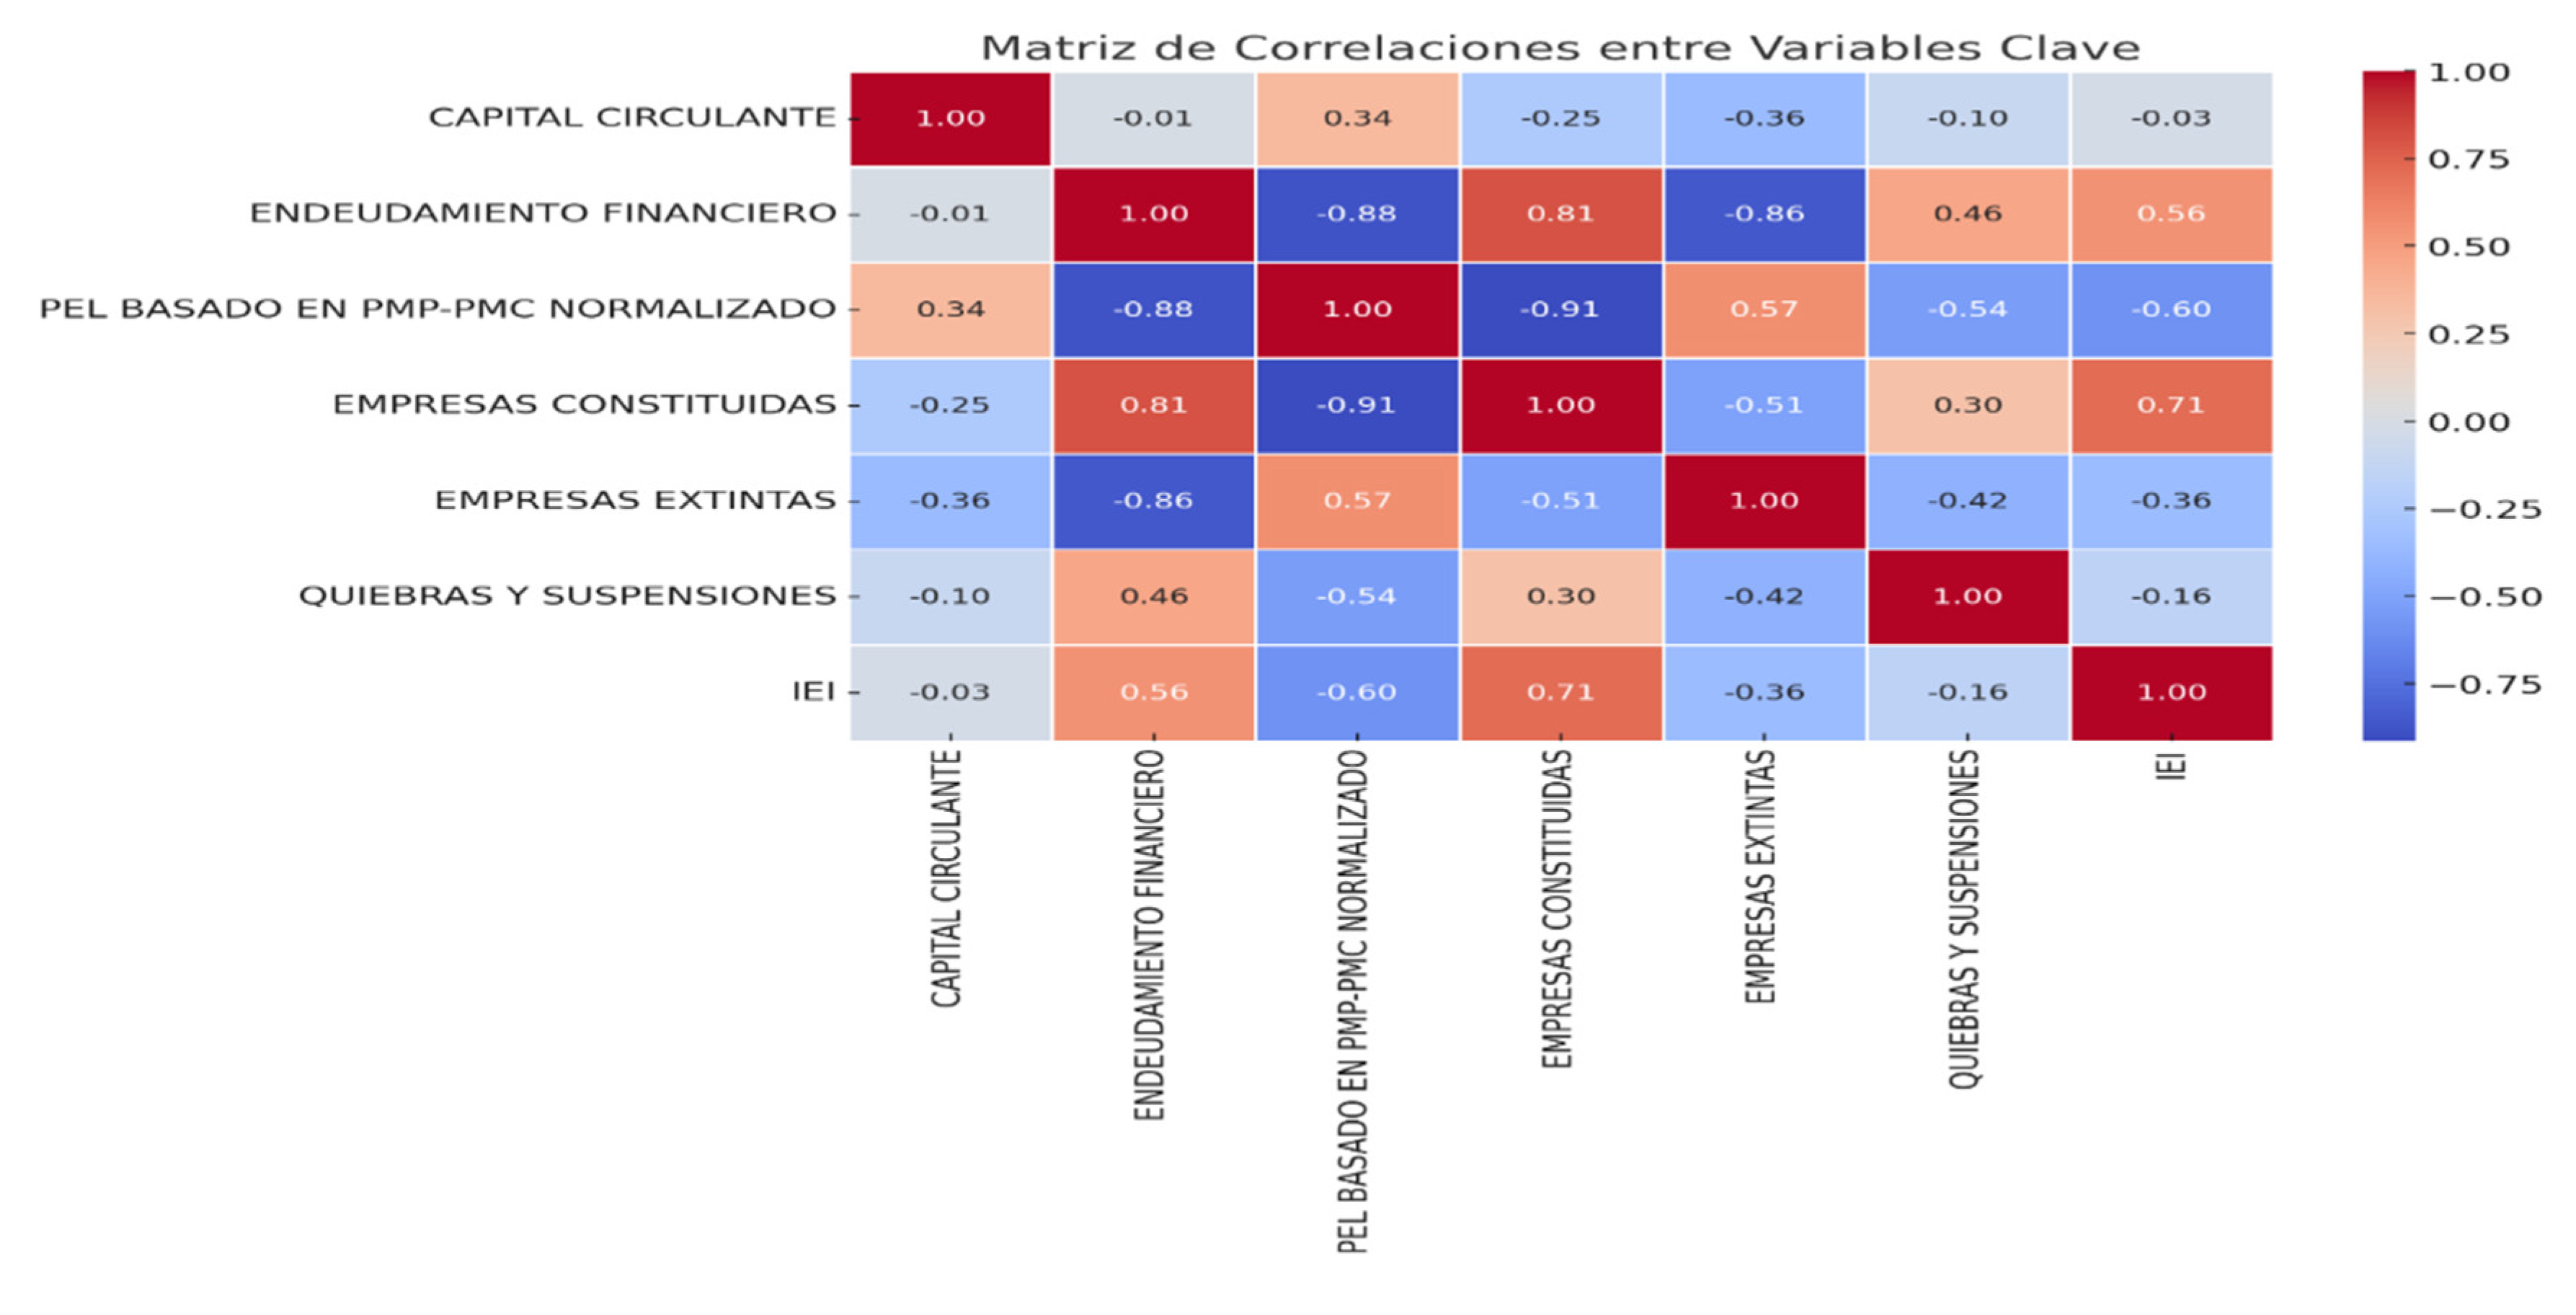
Disclaimer/Publisher’s Note: The statements, opinions and data contained in all publications are solely those of the individual author(s) and contributor(s) and not of MDPI and/or the editor(s). MDPI and/or the editor(s) disclaim responsibility for any injury to people or property resulting from any ideas, methods, instructions or products referred to in the content. |
© 2025 by the authors. Licensee MDPI, Basel, Switzerland. This article is an open access article distributed under the terms and conditions of the Creative Commons Attribution (CC BY) license (http://creativecommons.org/licenses/by/4.0/).
Copyright: This open access article is published under a Creative Commons CC BY 4.0 license, which permit the free download, distribution, and reuse, provided that the author and preprint are cited in any reuse.


