Preprint
Article

This version is not peer-reviewed.

Biochemical, Physiological and Productivity Responses of Sweet Corn Genotypes Under Organic and Chemical Fertilization

Submitted:

18 November 2025

Posted:

19 November 2025

You are already at the latest version

Abstract

Sweet corn (Zea mays var. saccharata) is a widely spread crop that is highly valued for its sweet taste and high nutrient content. Over the past decade, there has been an exponential increase in the area devoted to sweet corn for grain production, attributed to both its nutritional qualities and economic value. In this context, we aimed to evaluate the impact of three genotypes (Deliciosul de Bacau, Royalty F1, and Hardy F1) and two fertilization types (chemical and organic) plus an unfertilized control, on yield, biometrical, biochemical, and quality indicators at an experimental station during 2022–2023. The results revealed significant influences of cultivar, fertilization method, and the interaction between these two experimental factors on most of the analysed indicators. Regardless of the fertilization type, the genotype Hardy F1 showed higher levels of photosynthetic activity, polyphenols and sucrose, leading to greater yield than that of Deliciosul de Bacau. The latter genotype and Royalty F1 displayed the highest chlorophyll A, chlorophyll B, and lycopene contents in the grain. The results of the present research emphasize the importance of adopting and monitoring sustainable agricultural practices to enhance both the production and quality of sweet corn, particularly referring to the nutritional value, and address the growing demand for organically cultivated products within the current context of climate change.

Keywords: 
;  ;  ;  ;  ;  

1. Introduction

Sweet corn (Zea mays var. saccharata) is a crop of significant economic and nutritional importance that is widely cultivated globally because of its unique taste and versatility in human diets. It is rich in compounds with antioxidant effects, such as glutathione and linoleic acid [1]. Field grown corn is primarily used for industrial processing, harvested at the milk stage when its sugar content peaks, resulting in a sweeter taste and softer texture, making it suitable also to be consumed fresh, in addition to canned or frozen, as a staple food in diets worldwide, particularly in North and South America, Europe, and, increasingly, some areas in Asia [2].
Corn is the most widely cultivated crop globally, followed by other essential crops such as rice and wheat. In 2024/2025, the global corn production exceeded 1.2 billion tons [3], reflecting its critical role in food security [4], industrial applications, and biofuel production [5,6]. Sweet corn, a type of common corn, plays a significant role in the overall market due to increasing consumer demand for nutritious and convenient vegetables [7,8].
Sweet corn is highly valued for its high carbohydrate content, primarily in the form of sugars and starch, which provide immediate and slow-releasing energy upon consumption, respectively [9,10,11]. In addition to these energy-yielding primary metabolites, sweet corn contains significant amounts of dietary fibre (2–3 g per 100 g), supporting a healthy microbiome, contributing to overall digestive health [12]. This trait makes sweet corn an attractive food choice for people with metabolic conditions like diabetes or prediabetes, where keeping glucose levels steady is important [13]. Furthermore, previous studies suggest that these bioactive compounds may play a role in improving lipid metabolism and insulin sensitivity, offering potential benefits in preventing and managing metabolic syndromes, such as type 2 diabetes [14]. Sweet corn is an excellent source of vitamin C, an essential nutrient that acts as a powerful antioxidant, protecting cells from oxidative stress and supporting immune function [15]. It also provides significant amounts of B-complex vitamins, including thiamine (B1), niacin (B3), and folate (B9), which are indispensable for energy metabolism, red blood cell formation, and maintaining neurological health [16,17]. From a mineral perspective, sweet corn supplies magnesium, potassium, and phosphorus, each of which plays a vital role in cardiovascular health, muscle contraction, and bone health maintenance [18].
In addition to its fundamental nutritional components, sweet corn is recognized for its high content of bioactive compounds, particularly carotenoids and polyphenols. These compounds exhibit strong antioxidant and anti-inflammatory properties, making sweet corn a functional food with the potential to reduce the risk of chronic diseases [19]. Carotenoids, such as lutein and zeaxanthin, are well known for their oxidative role, particularly in terms of eye health, where they help reduce the risk of degeneration [20]. The polyphenols present in sweet corn further contribute to its antioxidant capacity, help neutralize free radicals and reduce inflammation, precursor to many chronic conditions, including cardiovascular diseases and certain types of cancer [14,21]. The exceptional quality of sweet corn kernels is influenced by various technological factors, including variety, fertilization, and controlled irrigation [22,23].
The cultivation of sweet corn has experienced significant expansion in Romania, driven by consumer demand for fresh, high-quality products and the introduction of more resilient cultivars adapted to diverse climatic conditions [24,25]. The growing popularity of sustainable farming methods in Romania reflects current global trends, as consumers and farmers have become increasingly aware of the health and environmental benefits associated with organic products [26]. A key difference between organic and conventional agricultural systems is their impact on the nutritional composition within and among species and varieties. Several studies suggest that organic crops, including sweet corn, often contain relatively high levels of antioxidants and other bioactive compounds, which are believed to result from the intensified activation of natural defence mechanisms in plants in the absence of synthetic pesticides [27,28].
The absence of chemical fertilizers in organic farming also leads to slower yet more sustainable nutrient absorption [29], which can promote the accumulation of valuable secondary metabolites such as polyphenols and carotenoid pigments [30,31,32,33]. Conventional agriculture, although often associated with relatively high yields, is frequently criticised for its potential to degrade soil quality over time due to the excessive use of chemical inputs, which can sometimes compromise the quality of final products [34,35]. This has raised concerns about the long-term sustainability of conventional farming, particularly in the context of global climate change and trends in soil degradation [29,36].
Given the above considerations, this study focuses on the quantitative and nutritional evaluation of three sweet corn varieties cultivated under organic and conventional farming, compared with an unfertilized control. Thus, this study will provide valuable insights for optimizing sweet corn production in both conventional and organic farming systems.

2. Materials and Methods

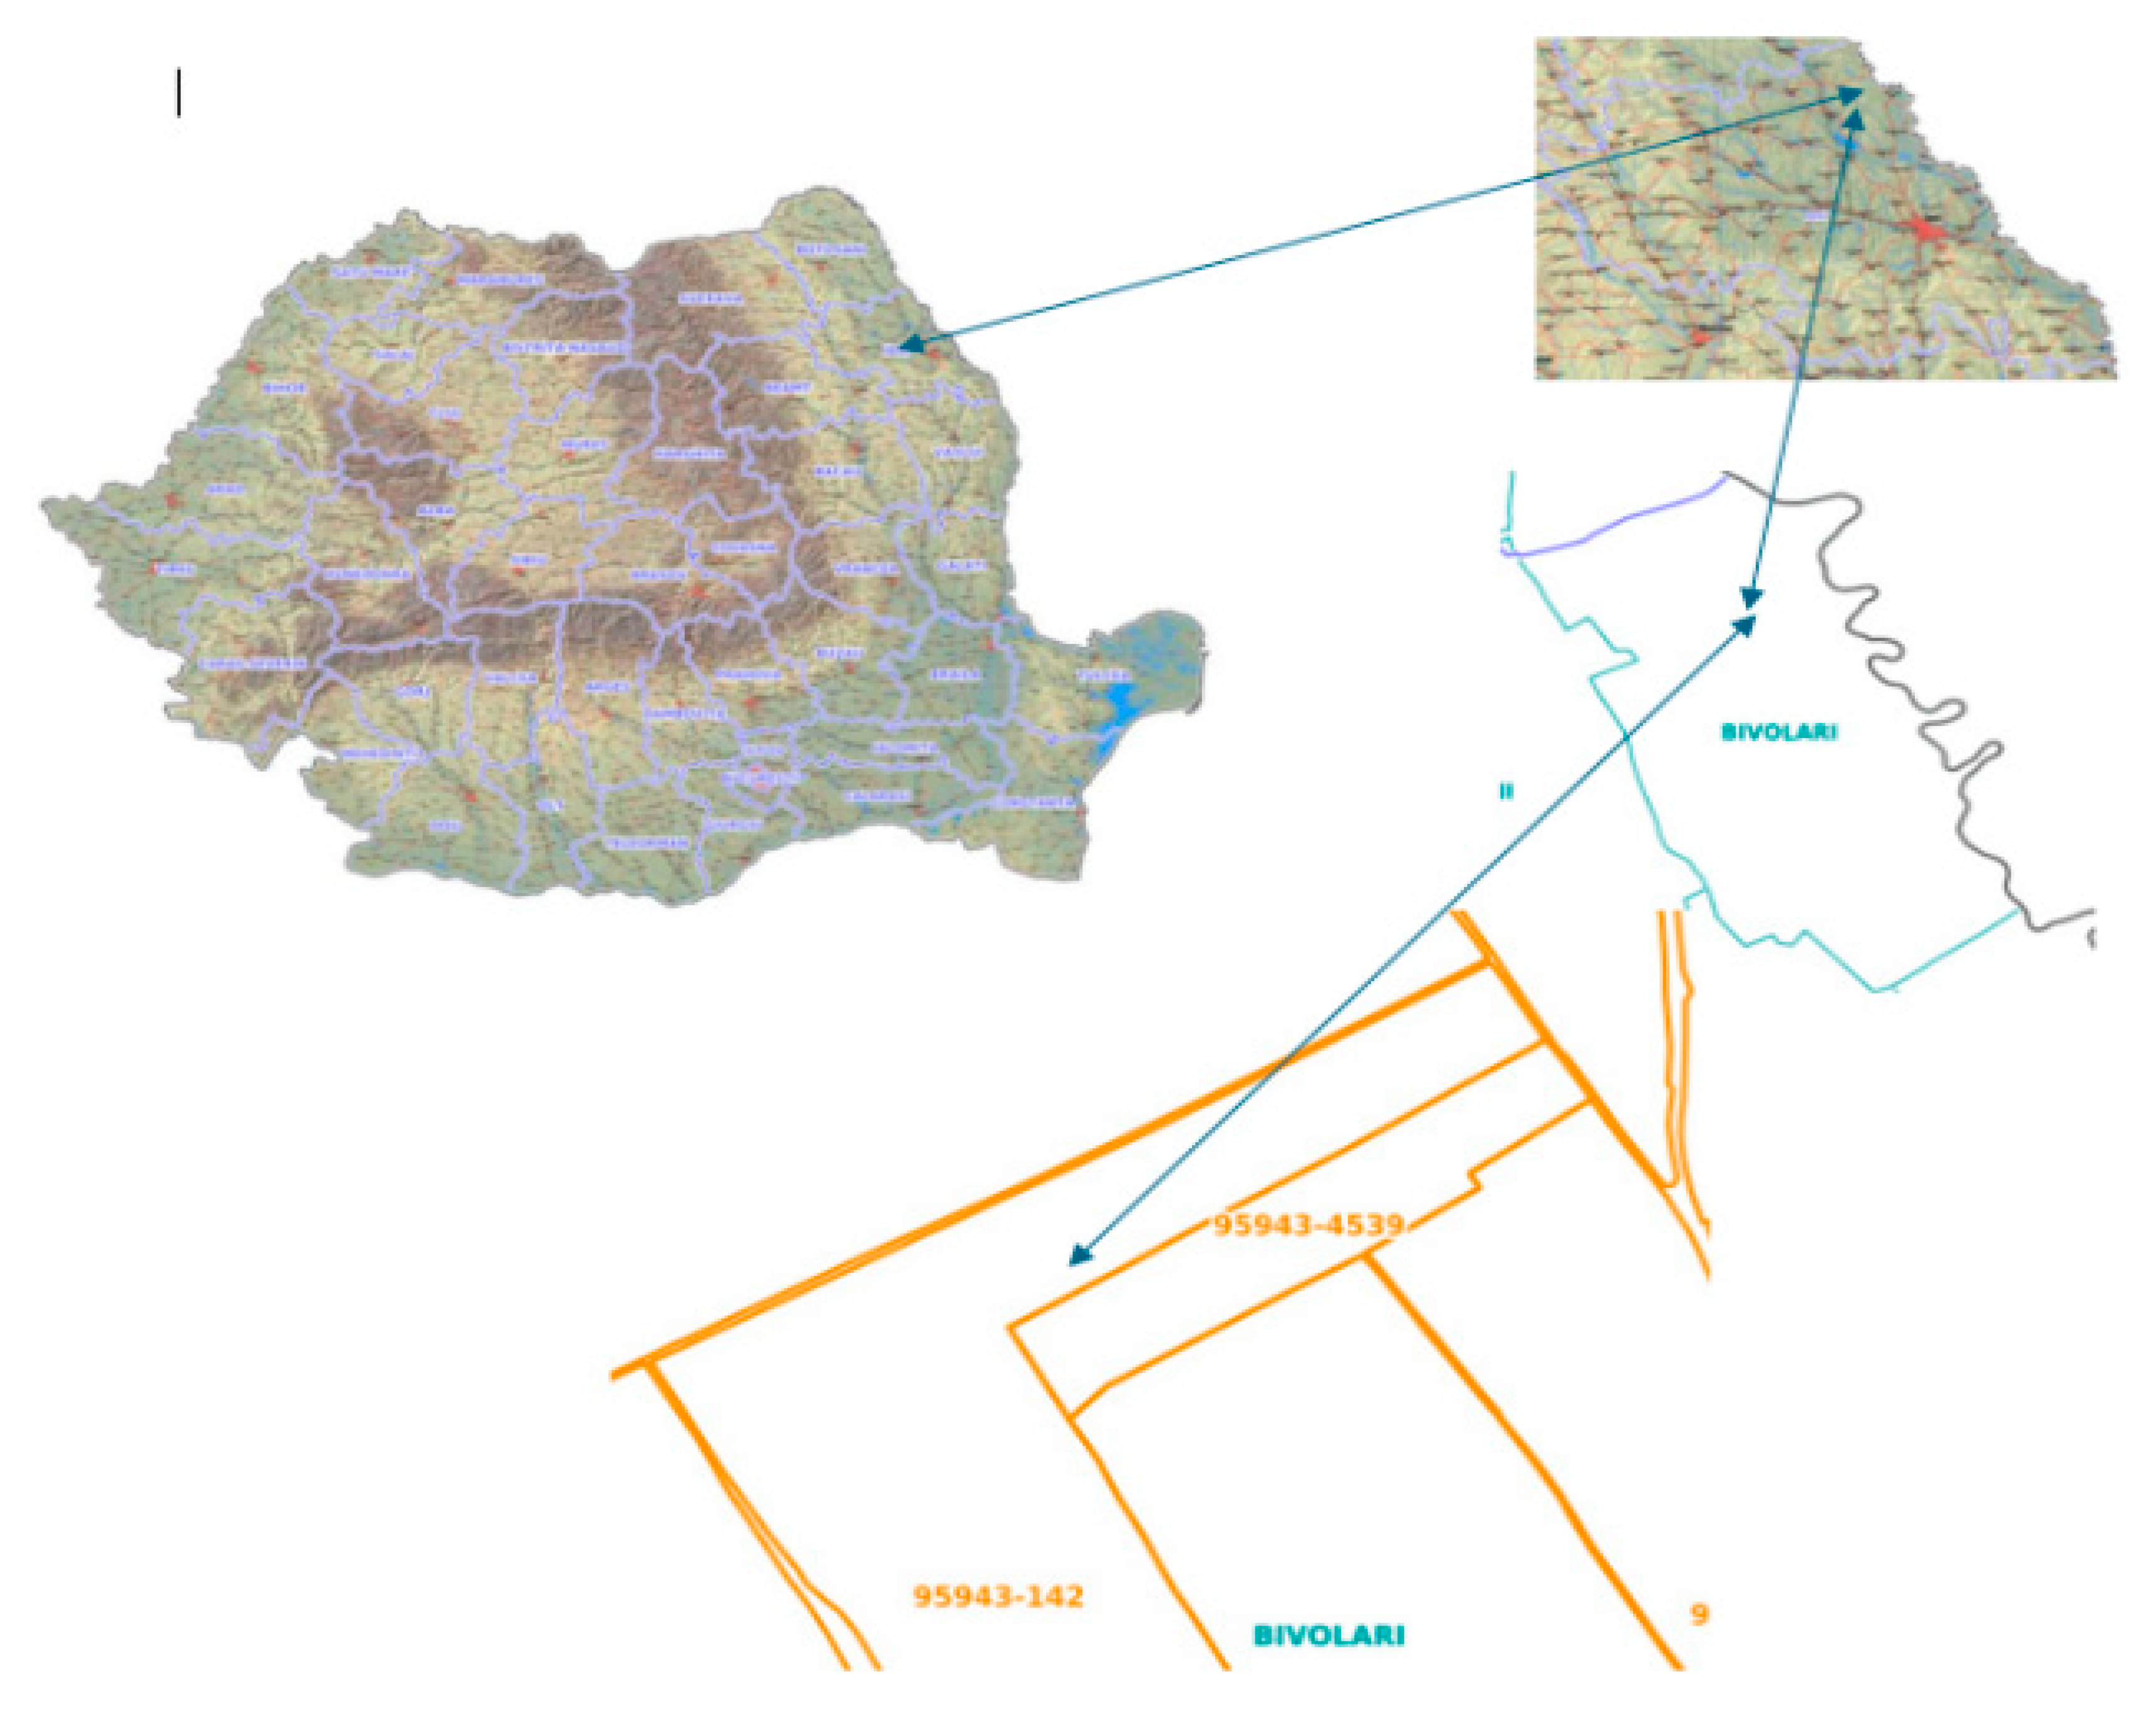
2.1. Location and Experimental Conditions

Research was carried out at the Semtop Farm experimental station, covering 8,600 m2 (47°34′34″N, 27°22′24″E, 152 m elevation) during 2022–2023 (Figure 1). The soil used for the experiment is cambic chernozem, with the following adequate characteristics for efficient nutrient absorption and optimal plant development [37]: pH of 7.10, electrical conductivity (EC) of 497 µS/cm, CaCO₃ content of 0.64%, organic matter (OM) content of 2.98%, total nitrogen (N) content of 2.95 g/kg, phosphorus (P) content of 54.28 mg/kg, potassium (K) content of 287 mg/kg, sodium (Na) content of 49.23 mg/kg, sulphur (S) content of 17.89 mg/kg, and zinc (Zn) content of 0.28 mg/kg.
The data presented in Table 1 indicate that during the vegetation period (April–August), the average temperature ranged from 11.5°C in April to 33.6°C in August, as means of the two research years; the precipitations differed between 2022 (220 mm) and 2023 (280 mm).

2.2. Biological Material and Experimental Design

The experimental protocol was based on the factorial combination between three varieties (Royalty F1, Hardy F1 and Deliciosul de Bacau - DBc) and two fertilization types (organic and conventional) plus an untreated control, using a split-plot design with three replicates.
The sweet corn varieties used in this study were selected not only for their adaptation to local climate conditions but also for their variability in biochemical composition and different reactions to agricultural practices. Owing to the climatic conditions in the experimental years, two irrigations were applied by sprinkling with a total volume of 250 m3·ha−1.
The fertilization was carried out applying both organic and conventional methods. In the case of organic fertilization, products such as Naturcomplet G (400 kg/ha) and Pleniflor (3 L/ha) were supplied, which are known for stimulating soil health and accumulating essential nutrients naturally [38,39]. Naturcomplet G is a certified organic soil improver containing 1.5% nitrogen (N), 5% potassium oxide (K2O), 35% organic matter (OM), 30% humic acids, and 5% fulvic acids. Iron content (Fe) is 1%, the carbon-to-nitrogen (C/N) ratio is 20.3, and the electrical conductivity (EC) is 2.5 dS/m.
The chemical fertilization consisted of NPK 16:16:16 (200 kg/ha), KSC I (100 kg/ha, 14 N, 40 P2O5, 5 K2O), and Cropmax (2 L/ha), which provide a quick supply of nitrogen, phosphorus, and potassium, essential for rapid plant growth [40,41].

2.3. Harvesting and Sample Preparation

Sweet corn samples were harvested at commercial maturity, stage 73—75 according to the BBCH scale, thus ensuring the consistency of the data obtained [42]. After harvesting, the samples were lyophilized via an ECO EVO freeze dryer (Tred Technology S.R.L.), which preserved the bioactive compounds and prevented their degradation. Then, each freeze-dried sample was ground and stored at -80°C until subsequent biochemical analyses were performed [43].

2.4. Analytical Methods

The antioxidant activity was evaluated via two methods, the ABTS test and the DPPH test, according to the methods of Ordóñez-Díaz et al. [43]. ABTS measures the antioxidant capacity by reducing free radicals, and the values are expressed in Trolox equivalents (TE). In the DPPH test, the capacity of the samples to neutralize free radicals was similarly expressed in μmol TE per g dry mass [44].
The total polyphenol content was determined via the Folin‒Ciocalteu reagent according to the methods described by Slinkard and Singleton [45]. This measurement allowed the quantification of polyols by spectrophotometric absorption at 765 nm, the result being expressed in mg Gallic acid equivalents (GAE) per g dry weight [44].

2.5. Chlorophyll and Carotenoid Pigments

Chlorophyll and carotenoid pigments were measured using spectrophotometric methods as described by Nagata and Yamashita [46]. The contents of chlorophyll A, chlorophyll B, lycopene, and β-carotene were determined by measuring the absorbance at wavelengths specific to each pigment.

2.6. Sugar Analysis

Sweet corn samples were extracted following the method described by Moreno-Ortega et al. [44]. A total of 0.5 g of sample was mixed with 1 mL of a 20:80 (v/v) ethanol: deionized water solution and homogenized for 2 minutes, followed by sonication and centrifugation. The process was repeated twice using the residue. The supernatants were then frozen at −80°C until analysis. The identification and quantification of glucose, fructose, and sucrose in the sweet corn samples were performed using an HPLC-RID system (PerkinElmer, Waltham, MA, USA) equipped with a 250 × 4.6 mm i.d. Luna 5 μm NH₂ column (Phenomenex). Sugars were identified by comparing their retention times with those of pure reference standards, and quantification was achieved via calibration curves for fructose (0.3–50.0 mg/mL), glucose, and sucrose (0.3–10.0 mg/mL).

2.7. Statistical Analysis

The data obtained were statistically analysed via ANOVA, upon checking their normality and the homogeneity of variance by the Shapiro‒Wilk and Levene’s test, respectively, and the mean separation was performed using the Duncan test at p ≤ 0.05, using the SPSS v26 software package (IBM Corp, Armonk, NY, USA).
To gain a comprehensive understanding of the quality dynamics of sweet corn cultivars under the different fertilizers, Principal Component Analysis (PCA) and Pearson correlation analysis were applied using the free trial of OriginPro 2024b. These methods enable an in-depth examination of patterns and relationships within the data from multiple perspectives and provide a robust framework for analysing and interpreting the complex interactions in sweet corn quality under varied fertilization systems [47].

3. Results and Discussion

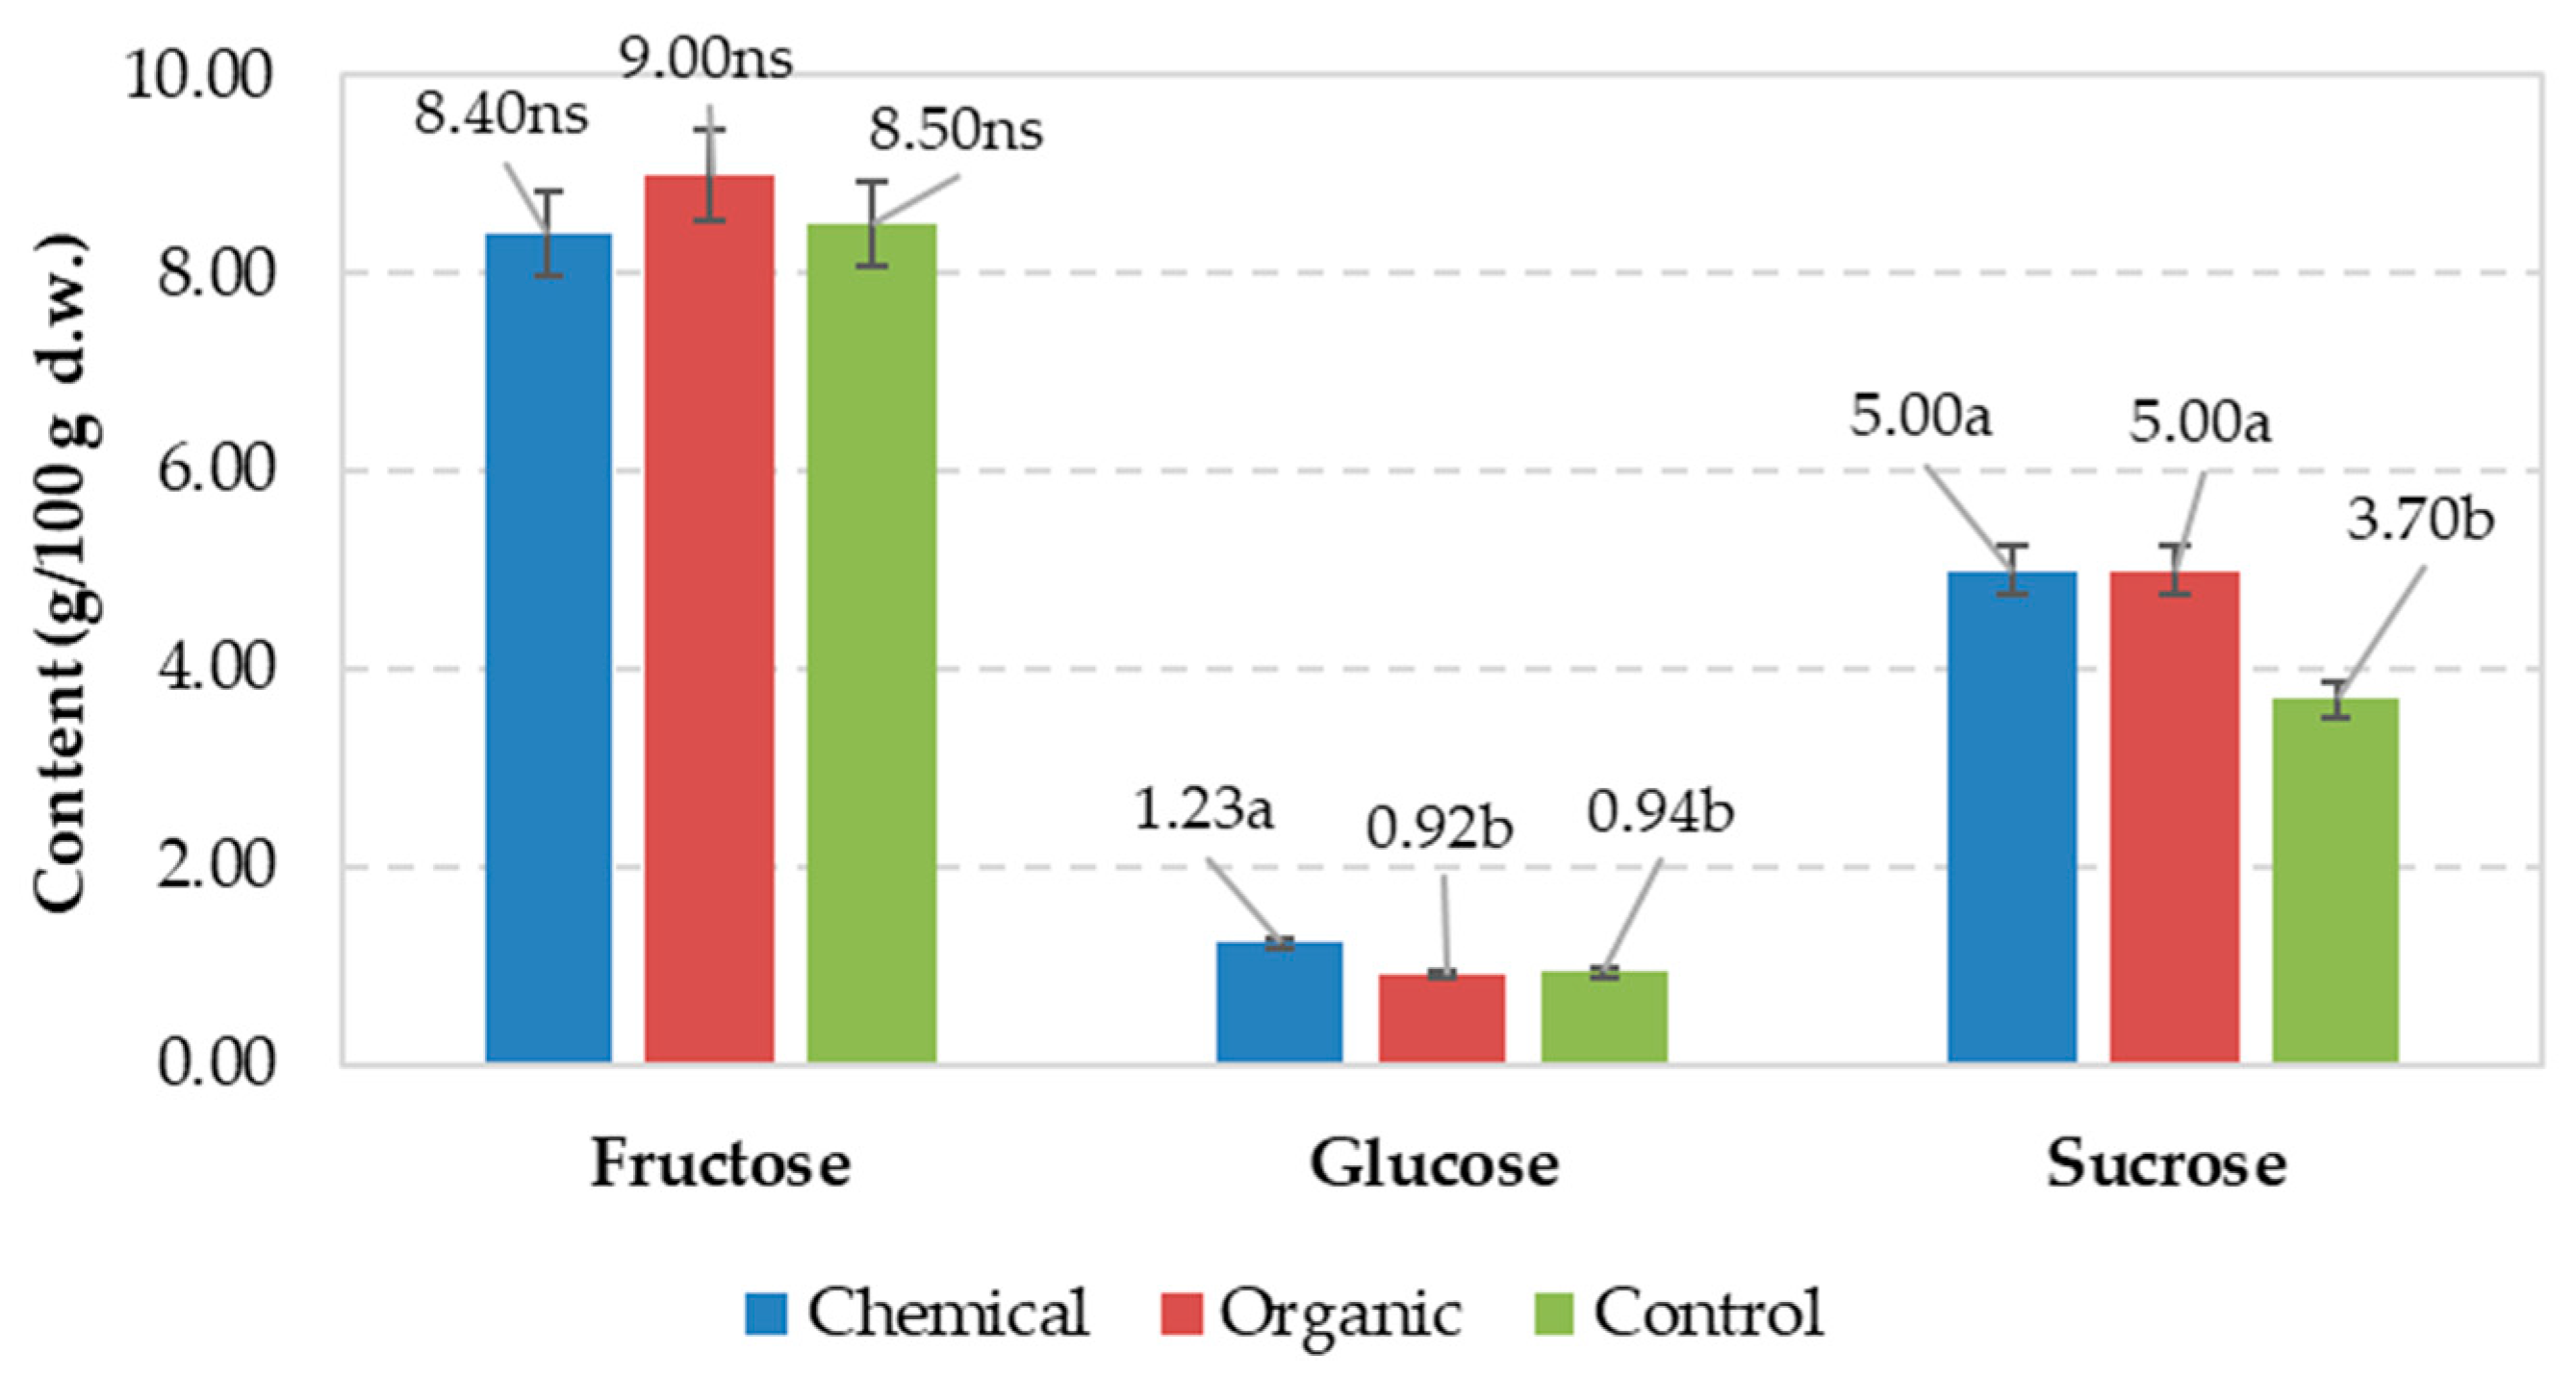
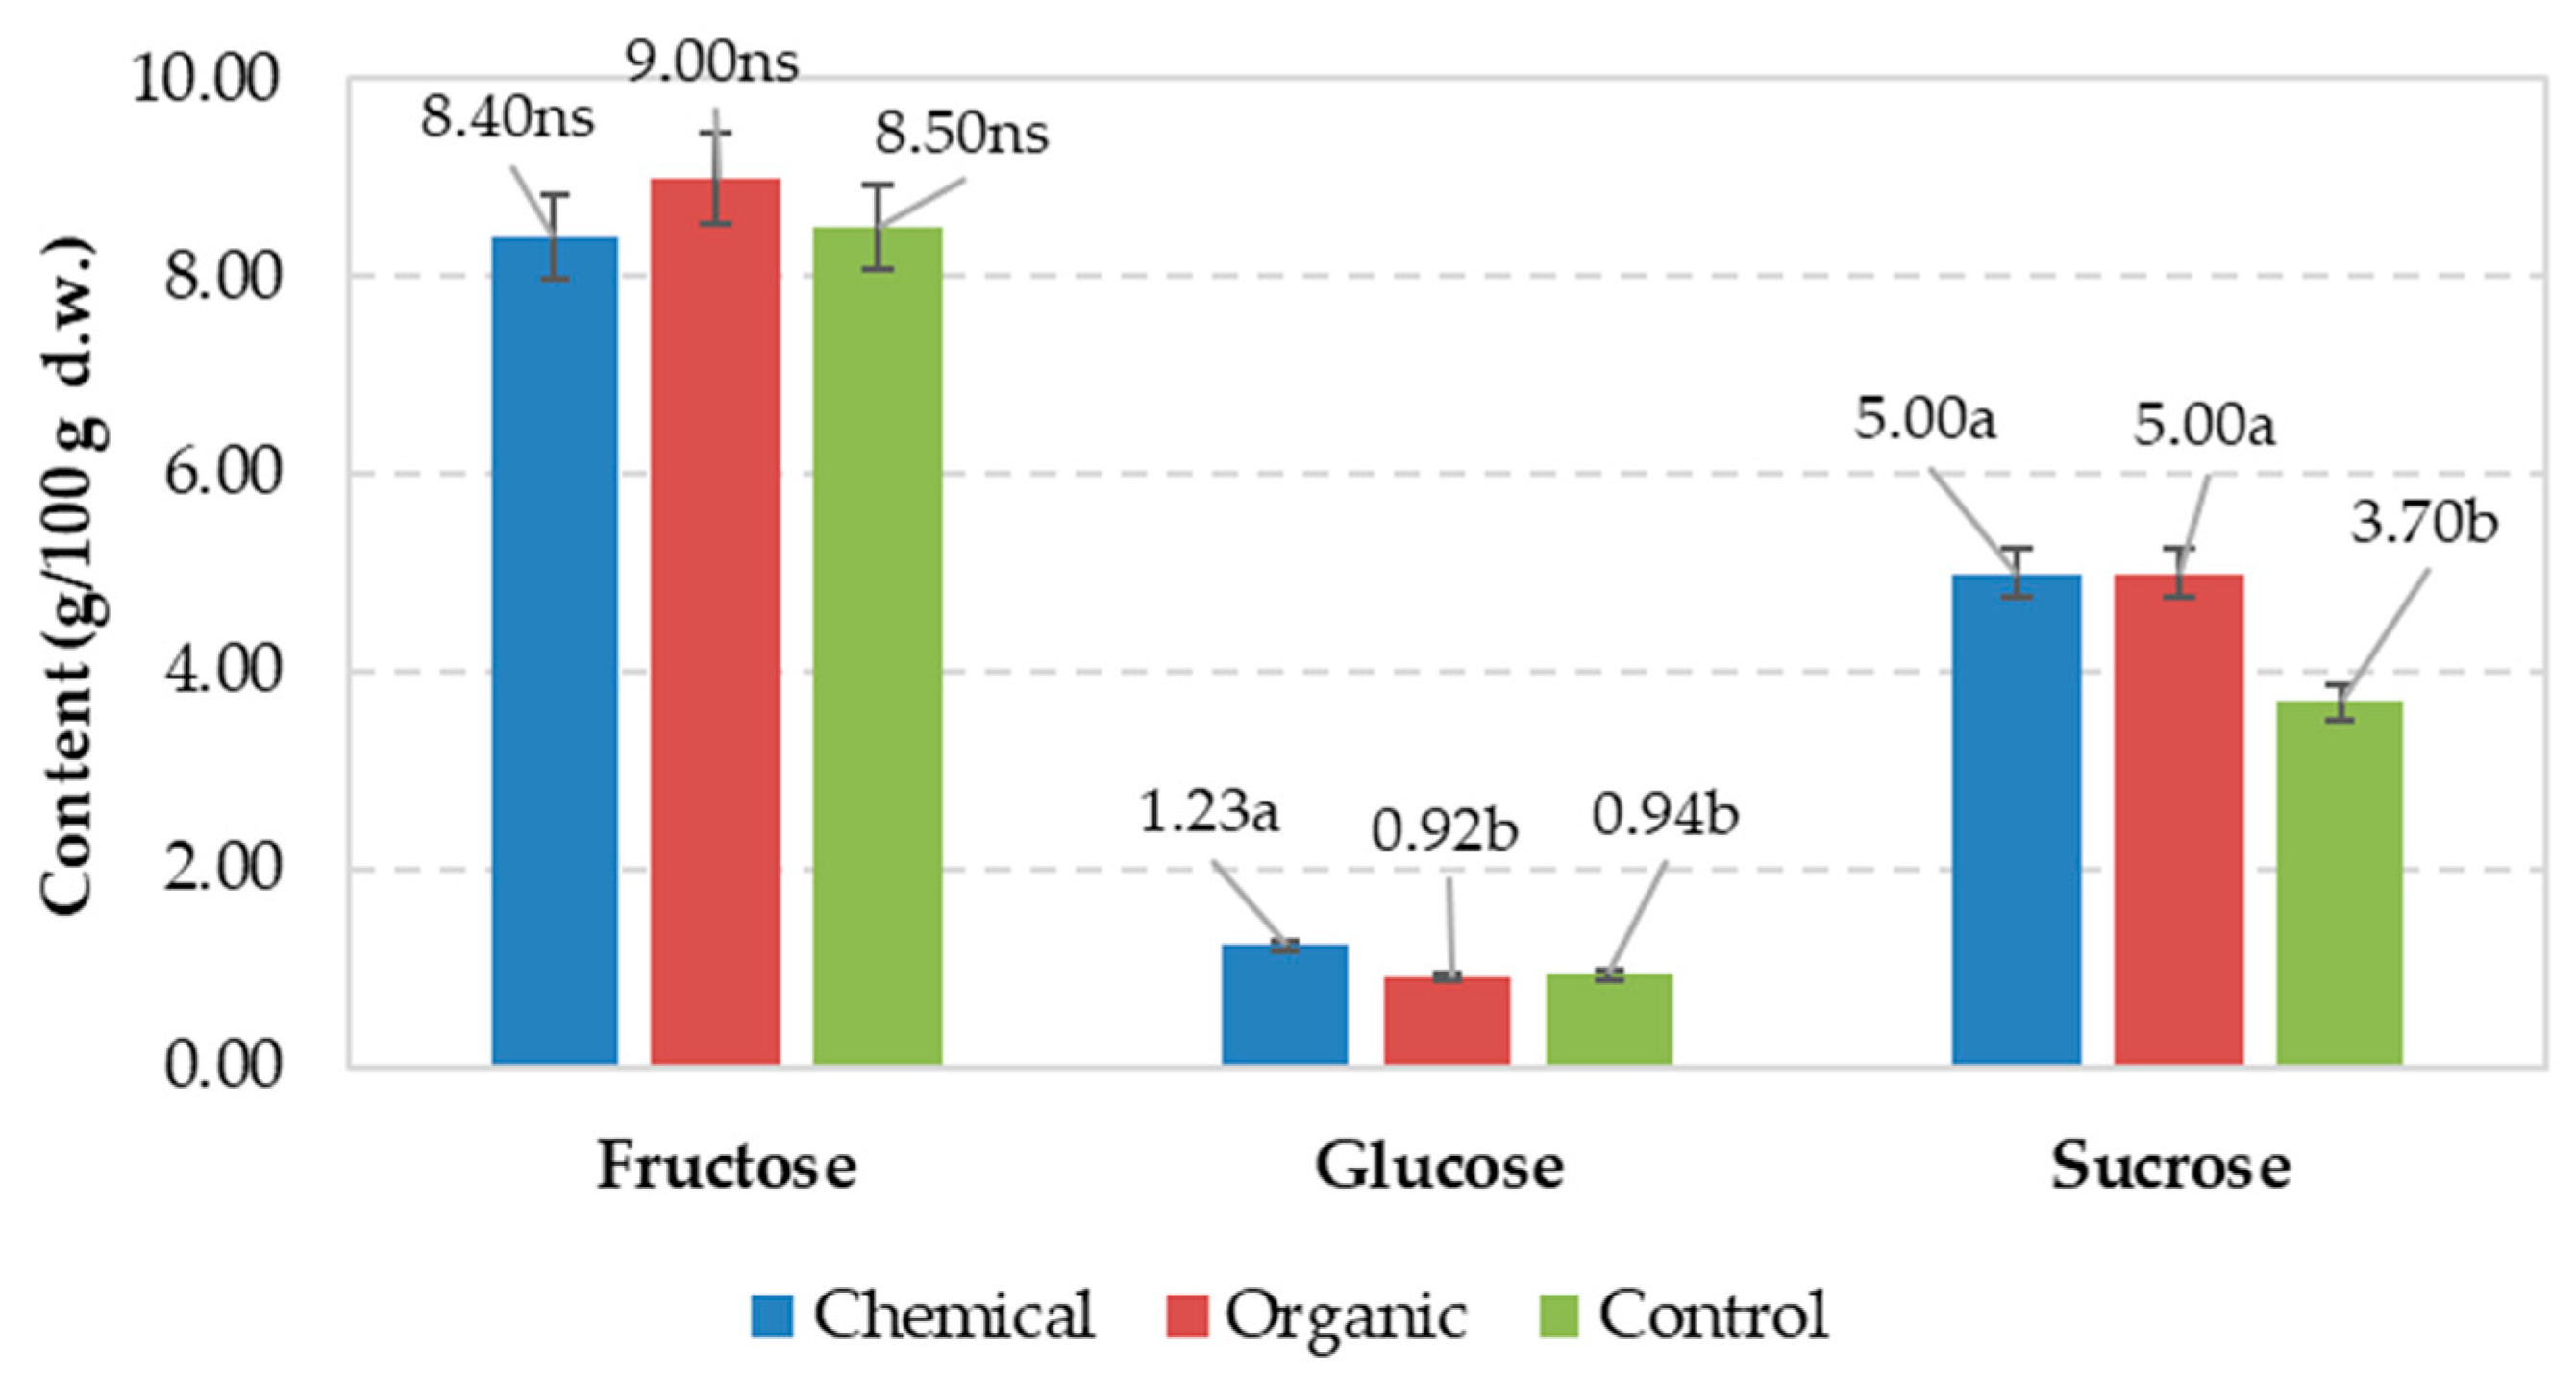
3.1. Influence of Cultivar and Fertilization Regime on Yield and Quality Characteristics

The main effects of variety and fertilization regime on yield, biometrical, biochemical and quality parameters of sweet corn are presented in Table 2. The data revealed no significant effect of cultivar on the chlorophyll content index, number of stalks, or number of ears per plant. These findings suggest that the F1 hybrids developed in the USA adapt well to Romanian production conditions, regardless of the year of cultivation. However, plant height and ear insertion on the plant significantly differed between cultivars, with a positive correlation between these two factors. The tallest plants and the greatest number of ear insertions were observed in the local cultivar DBc. Concerning ear weight, the hybrid cultivars, especially the Hardy F1 cultivar, demonstrated superior performance, with an increase of 24.4% compared with DBc. Similarly, for the number of kernel rows per ear, Hardy F1 also outperformed the other methods, with statistically significant differences noted at p ≤ 0.05.
The morphological indicators examined, such as plant height, ear insertion, number of stalks, and ear weight, showed no significant differences between the fertilization treatments.
The highest chlorophyll content index in leaves was recorded under chemical fertilization, followed by organic nutrition, with an increase of 16.4% compared with that of the unfertilized control. Additionally, the lowest average number of kernel rows was observed in the control group, with an 11.9% difference compared with the chemically fertilized treatment.
The results regarding the influence of sweet corn variety and fertilization regime on production parameters are presented in Table 3. Cultivar did not significantly affect rachis weight, dry matter, and humidity, regardless of genotype or cultivation year. Data of ear length indicate better stability for hybrid cultivars, greater kernel weight, and significantly increased production. For example, the difference in kernel weight ranged from 95.9 g to 146.6 g, representing an increase by 52.9% of the highest value compared to the lowest. The yield values varied widely, from 7628 kg/ha for DBc to 13995 kg/ha for Hardy F1 (+ 82.2%).
These results emphasize the good performance of Hardy F1, which demonstrated significantly lower production costs and higher efficiency due to its biological value. Furthermore, the study confirms that morphological parameters, including rachis weight, kernel weight, ear length, and yield capacity, are primarily determined by the plant genotype. These characteristics are inherited through the genetic makeup of the cultivar and are less influenced by external factors such as environmental conditions or cultivation practices. Similar findings have been reported in studies conducted by Islam et al. [48], Mahato et al. [49], Subaedah et al. [50] or by Niji et al. [51].
With respect to the effects of fertilization on production indicators, no statistically significant differences were observed for most indicators, except for yield which was increased by 57.6% by the chemical fertilization, compared to the untreated control, with statistically significant differences also between chemical and organic fertilization.
Multiple studies have highlighted the evident positive effects of chemical fertilization on the morphological parameters of sweet corn, compared to organic and biological fertilization. For instance, Laskari et al. [52] reported that chemical fertilization stimulated more the plant height, leaf area index, leaf greenness index (SPAD) and silage yield in the Pioneer 1291 and Dekalb 6777 maize hybrids, compared to the cattle manure. Similarly, chemical fertilization led to greater improvements in plant height, number of leaves per plant, leaf area, stem diameter, plant biomass, and chlorophyll content index in Zea mays var. saccharata L., compared to poultry manure [53]. According to Jiang et al. [54], the notable positive effect of chemical fertilization on the biometrical and physiological parameters of sweet corn, compared to organic fertilization, is primarily due to the immediate availability of nitrogen, phosphorus and potassium in chemical fertilizers. The organic fertilizers must first be transformed and decomposed before they can be absorbed by plants. Therefore, as nitrogen, phosphorus and potassium are essential for the healthy growth and development of plants, their availability in relation to the plant’s immediate needs is a crucial factor for maintaining the optimal growth, productivity, and overall plant status. Nitrogen is particularly effective in promoting cell elongation and division, leading to taller plants and stronger stems, while also playing a direct role in chlorophyll synthesis, which is vital for photosynthesis and biomass production [55]. Phosphorus is essential for enhancing root growth and branching, improving plant anchorage and nutrient uptake. A phosphorus deficiency can hinder the absorption of critical nutrients like nitrogen, potassium, and calcium, leading to shorter, thicker stems instead of elongated ones [56]. Additionally, phosphorus and potassium are crucial for energy transfer and the movement of carbohydrates during the grain-filling process [57].
The effects of the sweet corn cultivar and fertilization regime on the antioxidant capacity, TPC, chlorophyll and carotenoid pigments, and tannins are shown in Table 4. Data on the influence of cultivar on antioxidant capacity and chlorophyll and carotenoid pigments highlight differences between the three varieties used. The data indicate the absence of β-carotene and statistically insignificant differences in antioxidant capacity between the varieties, regardless of the method used.
The highest content of TPC was recorded in Hardy F1, with a 24.7% difference compared with that in Royalty F1.
Concerning chlorophyll pigments, a higher content of chlorophyll b than a was observed in all varieties, by up to 60%. For the two pigments, a higher content was noted in DBc, attributed to its better adaptation to environmental conditions as a local cultivar. Lycopene content fluctuated depending on the variety, with higher levels recorded in the Royalty F1 and DBc groups, by up to 118%. Tannin content also differed between varieties, with the highest levels found in Hardy F1 compared with the other two genotypes.
The β-carotene content was under the detectable threshold corresponding to the fertilization treatments and no significant effect was also observed on the TPC. The antioxidant activity, as determined by both methods, was greater in the fertilized samples than in the control samples, like the chlorophyll pigment content in the kernels. The lycopene content varied widely, ranging from 1.35 mg/100 g d.w. in the unfertilized control to 2.16 mg/100 g d.w. in the organically fertilized (+ 60%). Additionally, the tannin content was up to 67% greater in both fertilized treatments compared to the control.
The obtained concentration of β-carotene below the detection limit was also found by Păcurar et al. [58] in Estival and Deliciul Verii sweet corn hybrids. In contrast, hybrids like Prima, Jubilee, and Delicios showed detectable β-carotene levels ranging from 0.21 to 1.00 µg/100 g. Song et al. [59] investigated the carotenoid composition of two sweet corn varieties, “Jingtian 3” and “Jingtian 5”, revealing that the predominant carotenoids were represented by lutein (ranging from 4.70 to 9.80 μg/g d.w.), zeaxanthin (0.83 to 10.86 μg/g d.w.), and all-trans-α-cryptoxanthin (1.8 to 6.4 μg/g d.w.). In comparison, β-carotene, expressed as all-trans-β-carotene, was found in lower concentrations, ranging from 0.12 μg/g d.w. to 0.71 μg/g d.w., which highlights that genetics plays a significant role in determining the nutritional profile of crops.
Although β-carotene was below the detection limit in the kernels of the analyzed sweet corn varieties, lycopene, which is a lipophilic carotenoid compound, was detected in relatively high concentrations, if compared with the levels found in lycopene-rich food such as tomato, guavas, bell peppers, grapefruit, and apricots [33,34,60]. For instance, Rusu et al. [34] reported contents of 9.0 and 10.2 mg/100 g d.w. of lycopene in Cristal and Siriana tomato cultivars, while Pavlović et al. [61] reported a content between 4.2 and 6.1 mg/100 g in dried tomato samples.
The obtained concentrations of TPC in the tested sweet corn varieties are consistent with previous findings. Ledenčan et al. [62] reported values ranging from 1.59 mg GAE/g d.w. to 2.86 mg GAE/g d.w. in five su1 sweet corn hybrids, while Cai et al. [63] recorded levels between 0.91 mg GAE/g d.w. and 1.58 mg GAE/g d.w. in corn grains from 23 cultivars. Zhang et al. [64] noted that the TPC content in fresh kernels of eight sweet corn varieties ranged from 38.01 mg GAE/100 g to 57.04 mg GAE/100 g, emphasizing the lower phenolic content in fresh biomass. Further supporting this, Das et al. [65] demonstrated that TPC levels in fresh biomass are not only lower but also influenced by the fertilization regime. Their study reported phenolic levels of 55.1 mg/100 g under vermicompost treatment, compared to 51.4 mg/100 g with chemical fertilization and 40.6 mg/100 g in the absence of fertilization. Furthermore, the study conducted by Hu et al. [66] revealed that phenolic content is higher in mature sweet corn stalks compared to those harvested at an earlier stage. For example, the YT16 sweet corn hybrid exhibited a phenolic content of 74.7 mg GAE/100 g FW when harvested 10 days after pollination, which increased to 124.7 mg GAE/100 g FW when harvested 30 days after pollination.
The ABTS and DPPH values detected in the sweet corn varieties are consistent with the findings of Cai et al. [63] and Bae et al. [67], who also reported that ABTS values were higher than those of DPPH, aligning with the trend observed in this analysis. Furthermore, similar to our findings, Dragičević et al. [68] reported a higher DPPH radical scavenging activity in maize genotypes under chemical fertilization compared to organic and unfertilized regimes.
The content of tannins determined in the tested sweet corn varieties, compared to those reported by Feregrino-Pérez et al. [69] in Mexican native maize (1.16 – 4.99 mg/100g) and by Elemosho et al. [70] in Striga-resistant yellow-orange maize hybrids (2.1-7.3%), are significantly lower. This lower tannin content makes the tested sweet corn varieties more enjoyable and versatile for both culinary and feed applications.
The effects of sweet corn cultivar and fertilization regime on sugar compounds are shown in Figure 2 and Figure 3. The data concerning the influence of the cultivar on the sugars content and quality highlight differences between the three varieties used. The fructose content increased from 7.00 g/100 g d.w. in the cultivar Hardy F1 to 10.00 g/100 g d.w. in the Royalty F1, which have the same genetic origin. This finding highlights the genetic characteristics of the fructose content of Royalty F1, compared with that of Hardy F1.
Small differences were recorded between the treatments referring to the glucose content, with the highest values for cultivar Royalty F1, whereas the latter and DBc hybrids showed up to 97% higher values of sucrose content than Hardy F1.
Considering the results obtained in this study, along with those reported by Ledenčan et al. [62], it can be concluded that the sugar content in sweet corn is influenced by genetics of the sweet corn variety. Furthermore, Ledenčan et al. [62] highlighted that the harvest date plays a significant role in determining sugar content. In corn harvested 17 days after pollination, the sugar content in the five su1 sweet corn hybrids tested ranged from 16.5 to 21.3 mg/g d.w. in 2018 and from 18.8 to 28.7 mg/g d.w. in 2019. In contrast, corn harvested 25 days after pollination had a sugar content ranging from 7.5 to 15.5 mg/g in 2018 and from 9.4 to 11.5 mg/g in 2019.
Both fructose and sucrose were positively influenced by organic fertilization (Figure 3), whereas the chemical treatment resulted in higher overall glucose and sucrose contents than the unfertilized control.
Das et al. [65] reported a total sugar content of 13.5% in sweet corn control sample, closely aligning with the 13.1% recorded in our study. However, unlike our findings, i.e., 14.6% under chemical fertilization and 14.9% under organic fertilization, they detected the highest sugar content under chemical fertilization (19.56%), followed by a combination of 50% vermicompost and 50% Soligro (Ascophyllum nodosum) granular (19.33%), and vermicompost alone (15.13%). Ragheb [71] reported that the highest sugar content in sweet corn was observed under the fertilization with chicken manure (10.29-10.85%), followed by cattle manure (8.80-9.05%) and mineral fertilizer (7.30-7.80%).

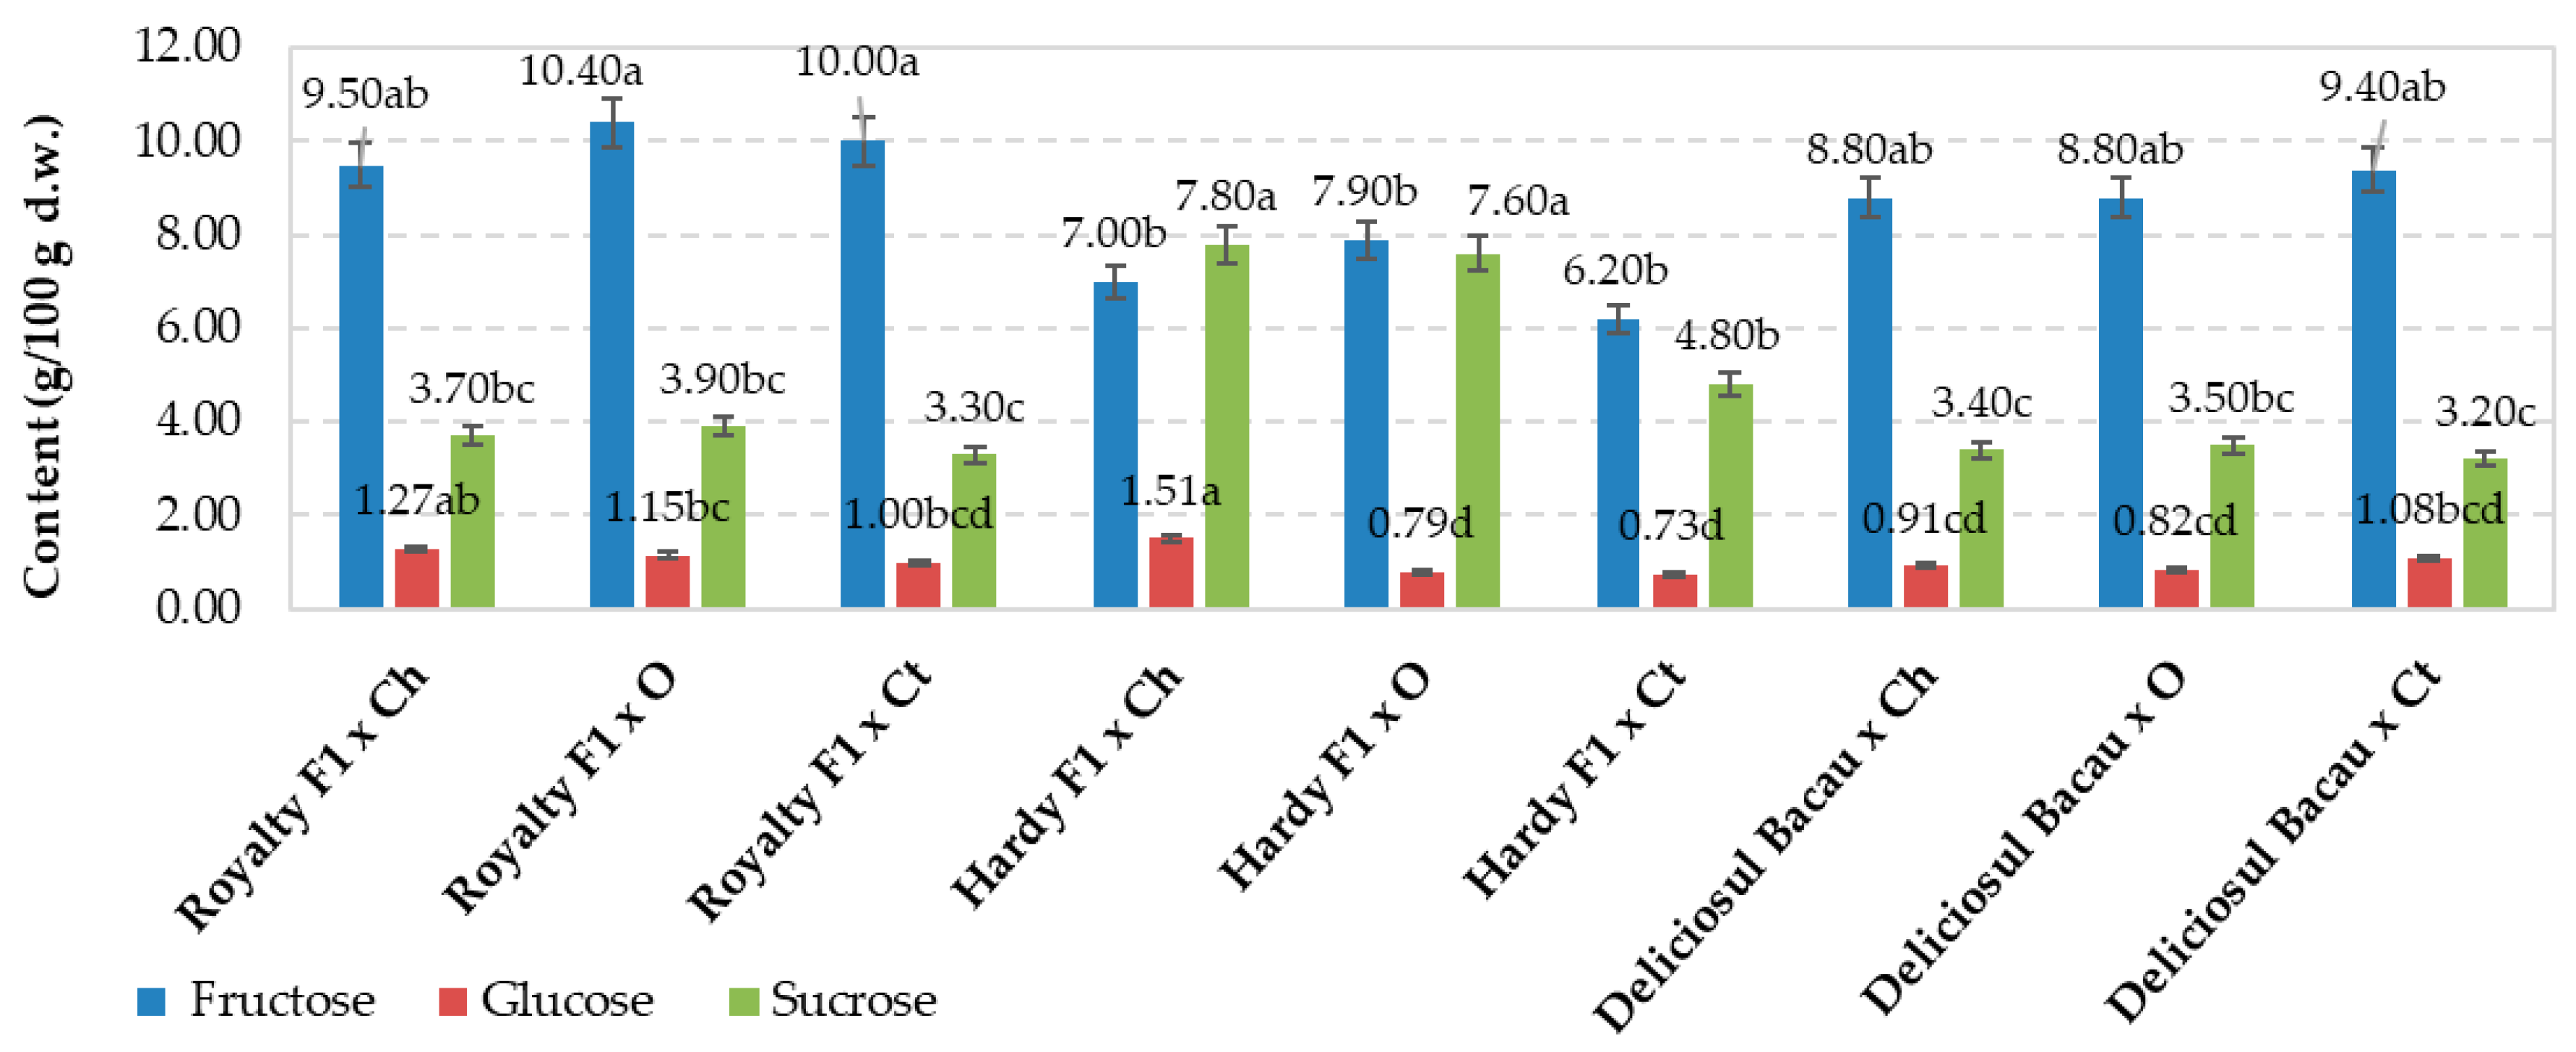
3.2. Interactions Between Variety and Fertilization Regime on Yield, Biometrical, Biochemical and Quality of Sweet Corn

The results of the interaction of sweet corn variety and fertilizer on biometrical and physiological parameters are presented in Table 5. In this respect, no significant differences were found regarding the number of stems per plant. The chlorophyll index values ranged from 30.3 in the unfertilized cultivar RoyaltyF1 to 39.9 under the chemically fertilized Hardy F1 hybrid, which is positively correlated with the number of ears per plant, ear weight and number of kernel rows per ear, and led to greater yield; no significant differences were recorded upon the organic fertilization. The plant height varied between 176.5 cm for organically fertilized Hardy F1 and 238.4 cm (+ 35.1%) for unfertilized Royalty. Rather high values of plant height were found in the unfertilized control, regardless of the cultivar, which indicates a stimulation of cell elongation to the detriment of reproduction in sweet corn plants, as confirmed by the negative correlation with the yield indicators. Ear insertion on the plant is an important characteristic, especially for harvesting, because it greatly facilitates the technological process. The lowest ear insertion was found in the cultivar Hardy regardless of fertilization, which highlights the genetic influence, with values varying between 51.6 cm and 64.9 cm, whereas the highest values, up to 96.2 cm, were recorded in the organically fertilized DBc.
The lowest number of ears per plant (1.3) were generally recorded in Hardy and DBc without fertilization, whereas the highest (2.1, +61.5%) was observed in Hardy under chemical fertilization.
Ear weight varied significantly depending on the cultivar and the fertilization regime. The average mean ear weight ranged from 171.2 g in the unfertilized control to 263.7 g (+ 54%) under fertilization in the hybrid Royalty. In the Hardy hybrid, significantly higher values were recorded in the unfertilized control, with a negative correlation with the number of ears per plant.
The number of kernel rows per ear was significantly influenced by the two experimental factors, with differences up to 46.3%.
The interaction between sweet corn variety and fertilization regime was significant on all yield parameters (Table 6).
The ear length varied between 19.1 cm for the cultivar DBc and 22.1 cm for Royalty under the chemical fertilization (+ 15.83%).
The rachis weight ranged from 78.4 g for the hybrid Royalty F1 to 106.4 g for the Hardy F1, in the unfertilized plants. The weight of grains per ear is essential for productivity, as it significantly influences the final production, especially since these varieties are intended for fresh grain consumption at the milk-wax stage. The kernel weight ranged from 88.1 g per ear for the variety DBc to 161.2 g per ear for the Royalty under the chemical fertilization (+ 83%). Both the mentioned parameters are primarily influenced by the genetic factor.
The yield varied greatly, from 6,853 kg/ha for the unfertilized DBc to 17,510 kg/ha for the chemically fertilized Hardy F1 (+ 255%). The interaction between variety and fertilization regime was also significant on yield, with the hybrid Royalty showing differences by 86.6% between chemical fertilization and the control and 61.2% between chemical and organic fertilization.
The dry matter content of sweet corn kernels varied significantly, from 19.4% in the organically fertilized Hardy F1 to 30.2% in chemically fertilized RUE. Interestingly, the unfertilized Hardy F1 also reached a high dry matter content of 30.0%. Notably, in Royalty and DBc the chemical fertilization elicited a higher dry matter content than the organic one, which is not common to most species.
The interaction between sweet corn variety and fertilization regime was significant on the antioxidant activity and pigment content (Table 7). In this respect, the total content of polyphenolic compounds varied from 1.37 mg/g in the unfertilized control to 2.88 mg/g in the chemically fertilized hybrid Hardy F1. Significant differences in the TPC were observed between all the cultivars, depending on the type of fertilization applied.
The antioxidant activity was measured using two methods, ABTS and DPPH. In the case of ABTS, no significant interactions were recorded, with the values varying from 1.45 μM TE/g dw in the organically fertilized to 1.93 μM TE/g dw in the chemically fertilized DBc (+ 33.1%); higher average values were recorded for both chemically fertilized hybrids. The antioxidant capacity determined by DPPH ranged from 0.98 μM TE/g dw for the unfertilized Hardy F1 to 1.67 μM TE/g dw for the chemically fertilized Royalty F1, with no significant correlation between TPC and AA.
Chlorophyll A varied from 1.3 mg/100 g d.w. for the hybrid Hardy F1 to 7.6 mg/100 g d.w. for Royalty, under the organic fertilization, whereas the highest value for DBc was recorded in the two years with the chemical fertilization (5.5 mg/100 g d.w.).
The lowest value of chlorophyll B (2.0 mg/100 g d.w.) was recorded for Hardy F1 and the highest for Royalty, under the organic fertilization, whereas DBc showed the highest values with the chemical fertilization (8.7 mg/100 g d.w.).
The effects of the interactions between the two experimental factors resulted in the variation of lycopene from 0.56 mg/100 g d.w. in Hardy F1 to 3.96 mg/100 g dw in Royalty, with the organic fertilization, with significant differences compared to the other treatments.
The tannin content increased from 0.075 mg CE/100 g d.w. in the unfertilized Royalty cultivar to 0.225 mg CE/100 g d.w. in the organically fertilized Hardy.
The effects of the interaction between sweet corn variety and fertilization regime on sugar contents are shown in Figure 4. The latter parameter varied from 11.7% in the case of the unfertilized cultivar Hardy F1 to 16.3% (+ 39.1%) for the same organically fertilized variety. In hybrid Royalty, the organic fertilization resulted in an increase in the total sugar content by up to 15.5%, compared with that of the unfertilized variety. In the local variety DBc, no significant differences were found compared with the other two variants. In terms of sugar quality, the highest values were found for fructose, ranging from 6.20 g/100 g d.w. for the unfertilized Hardy F1 to 10.4 g/100 g d.w. for the organically fertilized Hardy F1. Large differences in sucrose were found between the experimental treatments, varying between 3.20 g/100 g d.w. in the unfertilized DBc and 7.9 g/100 g d.w. in the organically fertilized Hardy F1; no significant differences were detected between Royalty and DBc, regardless of fertilization.
Among sugars, glucose presented the lowest values, varying between 0.73 g/100 g d.w. in the unfertilized hybrid Hardy F1 and 1.51 g/100 g d.w. in the same chemically fertilized hybrid; in the case of the Royalty hybrid, the chemical fertilization resulted in higher values of glucose content. We can state that the organic fertilization favoured the fructose, whereas the chemical fertilization resulted in a higher content of glucose content. No significant effects of fertilization were recorded on sucrose, regardless of the cultivar.
The data obtained showed that DBc and Royalty F1 are two sweet corn varieties with significantly higher fructose content compared to glucose and sucrose, regardless of the fertilization regime, similarly to previous reports [62].

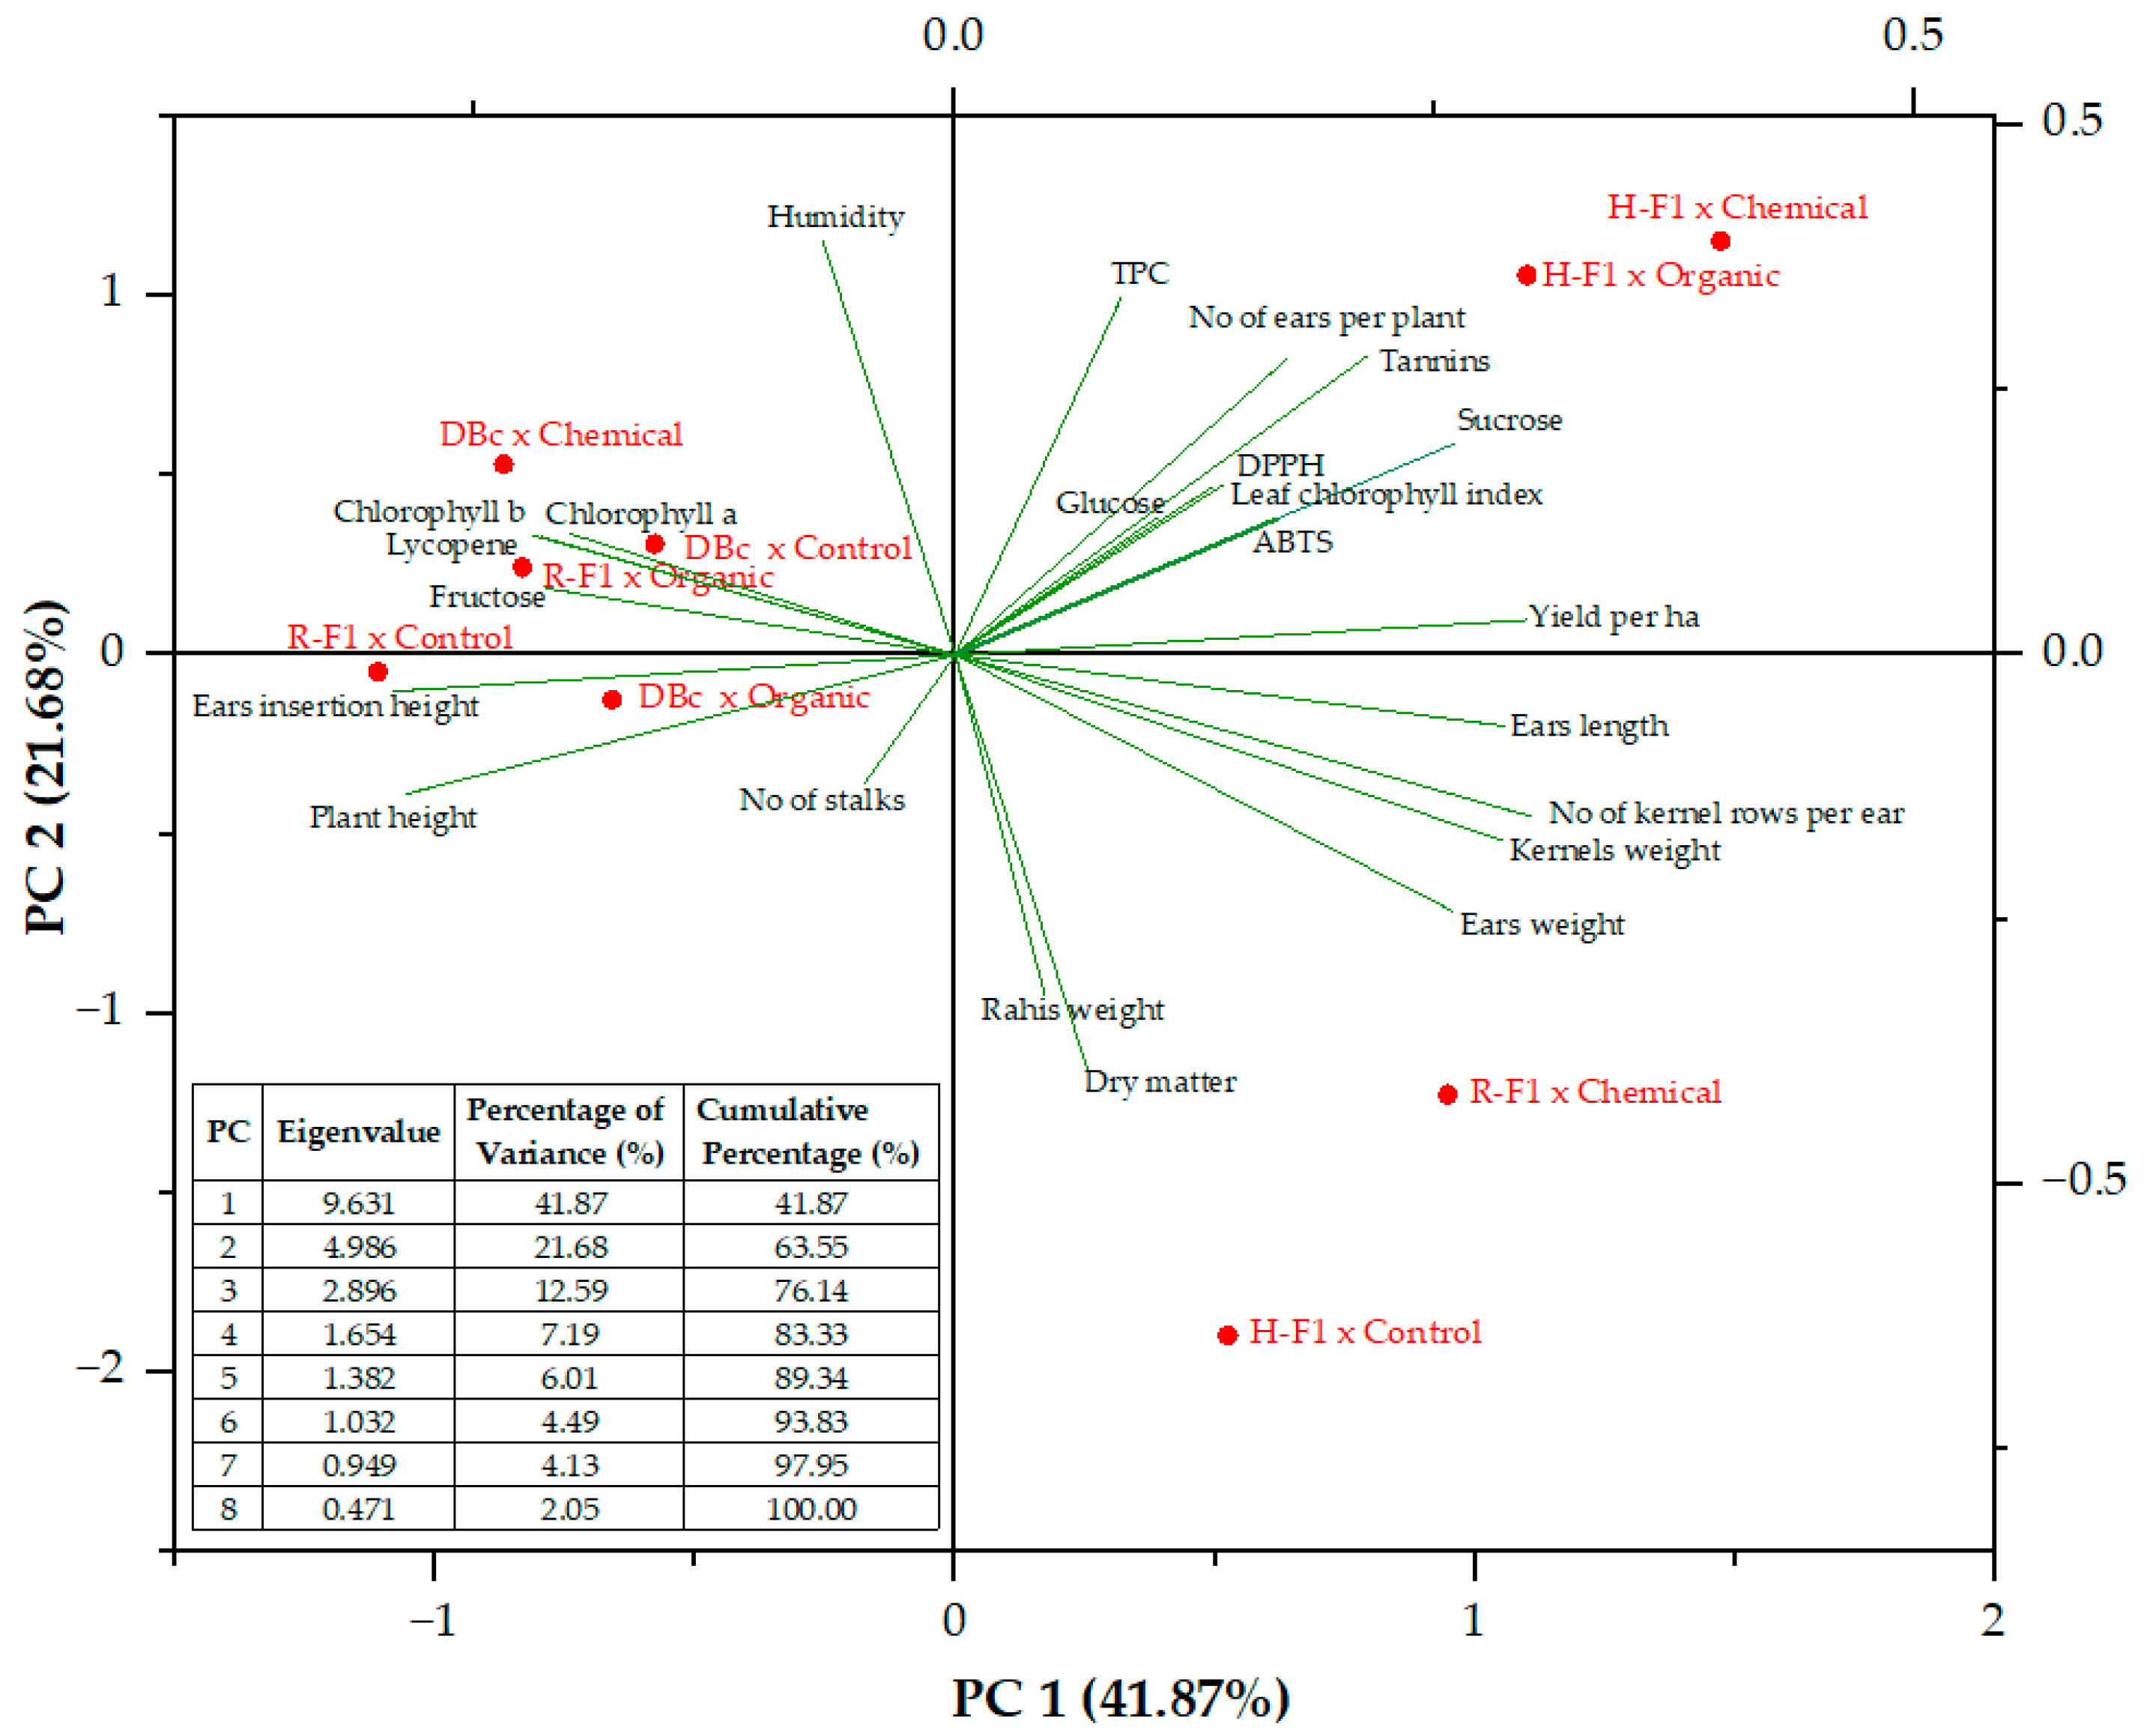
3.3. Dimensionality Reduction and Exploratory Causal Statistical Analysis of Data

To comprehensively analyse the quality of sweet corn under different fertilization systems, principal component analysis (PCA) was applied to simplify complex datasets related to the biochemical, physiological and productivity responses of sweet corn genotypes. PCA provided valuable information on the responses of Royalty F1, Hardy F1, and DBc genotypes under organic, chemical, and unfertilized regimes, allowing to compare growth and nutritional outcomes effectively. In addition, Pearson correlation analysis was used to gain a deeper understanding of the relationships between different traits and to explore how these traits collectively respond to different fertilization strategies. In this study, PCA and Pearson correlation coefficient methods were used to analyse the entire dataset and specific subsets, which were distinguished by fertilization type and sweet corn genotype. Each method was applied to examine patterns and relationships within the data from multiple perspectives, thus facilitating a comprehensive understanding of the underlying dynamics.
PCA was applied to the entire dataset (Figure 5), regardless of the fertilization type or sweet corn species, allowing for an overview of the relationships between variables and an identification of the principal components that explain most of the variability in the data. The results of this analysis revealed that out of the 8 independent principal component axes identified, only 6 presented eigenvalues greater than 1, indicating that these 6 components are significant in explaining the dataset’s structure. Together, these 6 components account for 93.83% of the total variability. However, PC1 and PC2 have the highest eigenvalues, 9.631 and 4.986, respectively, and explain 63.55% of the total variability, meaning that they capture most of the information contained in the dataset.
The data presented in Table 8 highlight several significant positive contributors to PC1, with eigenvalues exceeding 0.2. These contributors include traits such as ear weight (0.2595), the number of kernel rows per ear (0.3007), ear length (0.2860), kernel weight (0.2858), yield per hectare (0.2981), tannins (0.2147), and sucrose content in kernels (0.2608). These traits are likely related to the productivity and nutritional quality of sweet corn, suggesting that PC1 may represent a dimension focused on these aspects. In contrast, the negative contributors to PC1 were plant height (-0.2857), ear insertion height (-0.2927), kernel chlorophyll A content (-0.2012), kernel chlorophyll B content (-0.2199), kernel lycopene content (-0.2153), and kernel fructose content (-0.2127). The negative loading values indicate that these traits vary inversely with the yield and quality traits represented by the positive contributors to PC1. This inverse relationship suggests that higher values of plant height and ear insertion height are associated with lower values of kernel yield and quality. For PC2, the significant positive contributors included the number of ears per plant (0.2790), moisture (0.3911), total phenolic content (TPC) (0.3378), tannins (0.2823), and sucrose (0.2000). In contrast, the most significant negative contributors to PC2 were ear weight (-0.2424), rachis weight (-0.3222), and dry matter (-0.3911).
The biplot of PCA applied to the entire dataset shows that the combination of Hardy F1 × Organic is positioned close to sucrose, tannins, and TPC, suggesting a potential association with higher values of these traits. Hardy F1 × Chemical is placed close to the yield and number of ears per plant. Moreover, Deliciosul de Bacau × Chemical is located near chlorophyll A, chlorophyll B, and lycopene contents in kernels, indicating a possible link with these traits as well. The traits of Deliciosul de Bacau × Organic and Deliciosul de Bacau × Chemical are positioned on the left side of the plot, indicating that these samples have characteristics that are negatively correlated with the main factors driving PC1. Deliciosul de Bacau × Organic and Royalty F1 × Control may be associated with higher plant height and ear insertion height, as they are closer to these vectors. Conversely, they are likely associated with lower values for variables such as yield per ha, ear weight, and kernel weight, which are positioned on the positive (right) side of PC1.
By integrating PCA with Pearson correlation analysis, our approach not only highlights the individual effects of genotype and fertilization type on sweet corn quality but also reveals the interdependencies among agro-morphological, physiological, and nutritional traits. The data presented in Figure 6 indicate a strong positive correlation between plant height and ear insertion height, suggesting that as the height of the corn plant increases, the height at which the ear is positioned on the plant also tends to increase proportionally.
This plot indicates a significant negative relationship between plant height growth and several key traits, including the leaf chlorophyll index (r = -0.77), number of ears per plant (r = -0.82), ear weight/length ratio (r = -0.75/-0.91), number of kernels per ear (r = -0.87), kernel weight (r = -0.83), and yield per hectare (r = -0.95). In addition, there were negative correlations with the total phenolic compound (TPC) content (r = -0.58), ABTS (r = -0.87), DPPH (r = -0.75), tannin (r = -0.91), glucose (r = -0.54), and sucrose content in the kernels (r = -0.98). These negative associations between plant height and these traits may arise from a trade-off in resource allocation. It is well established that taller plants tend to expend more energy and resources to maintain structural stability and reach greater heights, potentially limiting the nutrients and energy available for chlorophyll production, reproductive structures, and seed development. As a result, the lower levels of sugars, phenolic compounds, and antioxidants found in the kernels of taller plants could reflect a shift in focus away from kernel quality and nutrient storage, instead favouring structural and vegetative growth. Furthermore, a strong negative correlation was identified between ear insertion height and various factors, including the number of ears per plant, ear weight, and length, as well as the number of grains per ear, grain weight, and yield per hectare. This correlation also applies to the contents of TPC, ABTS, DPPH, tannins, glucose, and sucrose in the kernels (Figure 6). The correlations found between morphological parameters in this study were also reported by Stansluos et al. [68], who found a positive correlation between plant height and ear insertion height, and a negative correlation with the number of ears per plant/the yield.
Furthermore, plants with smaller ear sizes, lower ear weight-to-length ratios, and fewer rows of kernels per ear tended to present higher levels of chlorophyll A, chlorophyll B, lycopene, and fructose. Furthermore, the content of these compounds in the kernels is negatively correlated with the levels of TPC, ABTS, DPPH, tannins, and sucrose. However, TPC content and antioxidant activity as measured by ABTS and DPPH assays, show a positive correlation, a relationship also observed by Cruz et al. [72] in a super-sweet corn hybrid. Thus, the strong correlation is a natural consequence of the chemical properties of polyphenols and the assay mechanisms that directly measure their antioxidant potential [73]. A positive correlation between tannins content and ABTS scavenging activity was also established by Feregrino-Pérez et al. [69] in Mexican native maize. The positive correlation reflects the direct role of tannins as efficient radical scavengers due to their phenolic nature, which aligns well with the mechanism of the ABTS assay [74].
The PCA and Pearson correlation analysis of subsets of data distinguished by the fertilization system and sweet corn genotype highlighted several important associations. According to the data presented in Figure S1(a), royalty F1 has different associations depending on the fertilization method used. Under organic fertilization, Royalty F1 is associated with relatively high levels of lycopene, chlorophyll A and b, total phenolic content (TPC), and fructose. In contrast, when chemical fertilization is applied, F1 is associated with traits such as DPPH and ABTS antioxidant activity, the leaf chlorophyll index, dry matter content, kernel weight, ear weight, yield per hectare, and the number of kernel rows per ear. In the no fertilized system, the Royalty F1 variety presented the greatest plant height, ear insertion height, and ear moisture levels. The Hardy F1 plants treated with chemical fertilizers presented relatively high levels of chlorophyll A and b, lycopene, leaf chlorophyll index, total phenolic content (TPC), DPPH antioxidant activity, glucose, ear length, yield per hectare, and number of ears per plant. In contrast, Hardy F1 plants grown via organic methods are more closely associated with higher levels of tannins, humidity, ABTS antioxidant capacity, and fructose. Additionally, the Hardy F1 plants grown under control conditions are positioned in the opposite quadrant of most of these traits, indicating that fewer traits are enhanced under these conditions than under organic or chemical fertilization (Figure S2(a)). Figure S3(a) reveals that Deliciosul de Bacau cultivated under organic fertilization is positioned positively along both PC1 and PC2, indicating associations with variables such as the number of kernel rows per ear, ear weight, and DPPH levels. Under chemical fertilization, Deliciosul de Bacau is positively positioned along PC1 but close to the origin of PC2, which is correlated with variables such as the number of stalks, tannins, and ABTS content. In a no-fertilised regime, Deliciosul de Bacau is closely associated with humidity, TPC, fructose, and glucose content.
Considering the effects of the cultivation system, the PCA results presented in Figures S4(a), S5(a), and S6(a) show that, under both the organic and chemical fertilization systems, the Hardy F1 variety had the greatest number of ears per plant. In the non-fertilized system, the Royalty F1 variety presented the greatest number of ears per plant. However, regardless of the fertilization system used for cultivating Hardy F1 sweet corn, the highest yield per ha was achieved. With respect to the nutritional quality of sweet corn kernels, the Hardy F1 variety presented the highest levels of tannins and TPC when grown with both chemical and organic fertilization. In contrast, the DBc genotype exhibited the highest values of tannins and TPC when grown without fertilization. The highest levels of chlorophyll A, chlorophyll B, and lycopene in kernels were detected under chemical fertilization in DBc, whereas Royalty F1 presented the highest levels under organic fertilization and no fertilization.
The Pearson correlation diagrams presented in Figures S1(b), S2(b), and S3(b) show that the relationships between some of the considered traits depended on the sweet corn genotype. For example, plant height and the number of stalks are strongly positively correlated for Deliciosul de Bacau (r = 0.67) and Hardy F1 (r = 0.64), whereas for Royalty F1, the correlation between the two traits is very low (r = 0.031). Additionally, an increase in plant height has a strongly negative impact on the number of ears per plant and yield for the Royalty F1 and Hardy F1 genotypes. In contrast, for Deliciosul de Bacau, plant height was positively correlated with these traits. However, regardless of the sweet corn genotype, there was a significant negative correlation between plant height and ear length or a weak to strong positive correlation with chlorophyll A, chlorophyll B, and lycopene contents in kernels. The Pearson correlation diagrams presented in Figures S4(b), S5(b), and S6(b) indicate that, in the control and organic fertilization systems, plant height and the number of stalks are strongly positively correlated. In contrast, in the chemical fertilization system, a very low negative correlation was observed between these two traits (r = -0.035). Furthermore, the relationships between plant height and ear weight, the number of kernel rows per ear, ear length, kernel weight, and yield per hectare revealed strong negative correlations. Regardless of the sweet corn genotype, plant height was significantly positively correlated with the levels of chlorophyll A, chlorophyll B, lycopene, and fructose in the kernels. The results of the PCA and Pearson correlation analyses indicate that certain parameters analysed in this study are predominantly influenced by genetic predisposition. This conclusion aligns with findings reported by Mesarović et al. [75], further emphasizing the role of genetics in determining key traits in sweet corn.

4. Conclusions

Our findings highlight the significant influence of the Hardy F1 hybrid on yield and antioxidant capacity and the significant correlation between the contents of glucose and sucrose with chlorophyll. Notably, the local variety DBc fertilized chemically or organically responded better to the presence of chlorophyll pigments or lycopene, which denotes a better adaptation to climatic conditions but lower productivity. We can also state that the organically fertilized DBc is associated with taller plants and ear insertion and is negatively associated with a lower ear and grain weight.
Our data demonstrate that each variety of sweet corn, depending on the destination of the grains, must be fertilized appropriately, thus positively responding to both the conventional and organic cultivation systems, under similar climatic conditions in the two research years.
Based on the data presented above, concerning the improvement of performances of the cultivars used, in terms of yield, biometrical, physiological, biochemical and qualitative indicators, appropriate solutions for obtaining and managing the sweet corn product depending on the destination.
The data obtained, particularly regarding the nutritional quality of corn grain, open new research perspectives that should also focus on the content and quality of carbohydrates under the influence of agronomic and environmental factors.

Supplementary Materials

The following supporting information can be downloaded at: Preprints.org, Figure S1. (a) Bi-plot of PCA analysis and (b) Pearson correlation diagram of the agro-morphological, physiological and nutritional quality traits of the Royalty F1 cultivated in organic, chemical, and non-fertilization systems; Figure S2. (a) Bi-plot of PCA analysis and (b) Pearson correlation diagram of the agro-morphological, physiological and nutritional quality traits of the Hardy F1 cultivated in organic, chemical, and non-fertilization systems; Figure S3. (a) Bi-plot of PCA analysis and (b) Pearson correlation diagram of the agro-morphological, physiological and nutritional quality traits of the Deliciosul de Bacau cultivated in organic, chemical, and non-fertilization systems; Figure S4. (a) Bi-plot of PCA analysis and (b) Pearson correlation diagram of the agro-morphological, physiological and nutritional quality traits of the Royalty F1, Hardy F1, and Deliciosul de Bacau sweet corn genotypes cultivated in non-fertilization systems; Figure S5. (a) Bi-plot of PCA analysis and (b) Pearson correlation diagram of the agro-morphological, physiological and nutritional quality traits of the Royalty F1, Hardy F1, and Deliciosul de Bacau sweet corn genotypes cultivated in chemical-fertilization systems; Figure S6. (a) Bi-plot of PCA analysis and (b) Pearson correlation diagram of the agro-morphological, physiological and nutritional quality traits of the Royalty F1, Hardy F1, and Deliciosul de Bacau sweet corn genotypes cultivated in organic-fertilization systems.

Author Contributions

Conceptualization, V.S. and P.-L.N.; methodology, P.-L.N., J.L.O.-D., M.S.P., J.M.M.-R. and V.S.; validation, V.S., G.C., M.R., J.M.M.-R. and O.-R.R.; formal analysis, V.S. and M.R.; investigation, P.-L.N., G.R., S.M.A.E., J.L.O.-D., M.S.P., and O.-R.R.; data curation, P.-L.N., V.S., O.-R.R., G.R., G.C. and J.M.M.-R.; writing—original draft preparation, V.S., R.M., O.-R.R. and S.M.A.E.; writing—review and editing, V.S., J.M.M.-R. and R.M.; visualization, V.S., R.M. and O.-R.R.; supervision, J.M.M.-R. and V.S.; funding acquisition, V.S. All authors have read and agreed to the published version of the manuscript.

Funding

This research received no external funding.

Data Availability Statement

Data are contained within the article.

Acknowledgments

During the preparation of this work the author(s) used Curie and Grammarly in order to improve the readability and language of the manuscript. After using this tool/service, the authors reviewed and edited the content as needed and took full responsibility for the content of the published article.

Conflicts of Interest

The authors declare that they have no known competing financial interests or personal relationships that could have appeared to influence the work reported in this paper.

References

  1. Castillo-Gironés, S.; Masztalerz, K.; Lech, K.; Issa-Issa, H.; Figiel, A.; Carbonell-Barrachina, A.A. Impact of osmotic dehydration and different drying methods on the texture and sensory characteristic of sweet corn kernels. Journal of Food Processing and Preservation 2021, 45, e15383. [Google Scholar] [CrossRef]
  2. Baranowska, A. The nutritional value and health benefits of sweet corn kernels (Zea mays ssp. saccharata). Health Prob Civil. 2023, 17, 408–416. [Google Scholar] [CrossRef]
  3. Grain Production Worldwide by Type 2024/25. Available online: https://www.statista.com/statistics/263977/world-grain-production-by-type/?srsltid=AfmBOooal7aBJTuXX495-p2vDyNnNqdXcAYLkSh0DNRNnH1KvpGipVdq (accessed on 18 November 2025).
  4. Tanumihardjo, S.A.; McCulley, L.; Roh, R.; Lopez-Ridaura, S.; Palacios-Rojas, N.; Gunaratna, N.S. Maize Agro-Food systems to ensure food and nutrition security in reference to the sustainable development goals. Global Food Security 2020, 25, 100327. [Google Scholar] [CrossRef]
  5. Erenstein, O.; Jaleta, M.; Sonder, K.; Mottaleb, K.; Prasanna, B.M. Global Maize production, consumption and trade: Trends and R&D implications. Food Sec. 2022, 14, 1295–1319. [Google Scholar] [CrossRef]
  6. Padhan, S.R.; Jat, S.L.; Mishra, P.; Darjee, S.; Saini, S.; Padhan, S.R.; Radheshyam; Ranjan, S.; Padhan, S.R.; Jat, S.L.; et al. Corn for Biofuel: Status, Prospects and Implications. In New Prospects of Maize; IntechOpen, 2023 ISBN 978-1-83768-632-2.
  7. Soare, R.; Dinu, M. Effect of biofertilizers on quality of sweet corn. Scientific Papers. Series B, Horticulture 2023, LXVII, 696–702. [Google Scholar]
  8. Sidahmed, H.; Vad, A.; Nagy, J. Advances in sweet corn (Zea mays L. saccharata) research from 2010 to 2025: Genetics, agronomy, and sustainable production. Agronomy 2025, 15, 1260. [Google Scholar] [CrossRef]
  9. Budak, F.; Aydemir, S.K. Grain yield and nutritional values of sweet corn (Zea mays var. saccharata) in produced with good agricultural practices. Nutri Food Sci Int J. 2018, 7, 555710. [Google Scholar]
  10. Mishra, U.; Tyagi, S.; Gadag, R.; Elayaraja, K.; Pathak, H. Analysis of water soluble and insoluble polysaccharides in kernels of different corns (Zea mays L.). Current Science 2016, 111, 1522–1524. [Google Scholar] [CrossRef]
  11. Becerra-Sanchez, F.; Taylor, G. Reducing post-harvest losses and improving quality in sweet corn (Zea mays L.): Challenges and solutions for less food waste and improved food security. Food and Energy Security 2021, 10, e277. [Google Scholar] [CrossRef]
  12. Canatoy, R.C.; Daquiado, N.P. Fertilization influence on biomass yield and nutrient uptake of sweet corn in potentially hardsetting soil under no tillage. Bull Natl Res Cent 2021, 45, 61. [Google Scholar] [CrossRef]
  13. Alahmari, L.A. Dietary fiber influence on overall health, with an emphasis on cvd, diabetes, obesity, colon cancer, and inflammation. Front Nutr 2024, 11, 1510564. [Google Scholar] [CrossRef]
  14. Guilherme, R.; Reboredo, F.; Guerra, M.; Ressurreição, S.; Alvarenga, N. Elemental composition and some nutritional parameters of sweet pepper from organic and conventional agriculture. Plants 2020, 9, 863. [Google Scholar] [CrossRef]
  15. Cuevas, F.J.; Pradas, I.; Ruiz-Moreno, M.J.; Arroyo, F.T.; Perez-Romero, L.F.; Montenegro, J.C.; Moreno-Rojas, J.M. Effect of organic and conventional management on bio-functional quality of thirteen plum cultivars (Prunus salicina Lindl.). PLoS ONE 2015, 10, e0136596. [Google Scholar] [CrossRef]
  16. Cummings, J.H.; Beatty, E.R.; Kingman, S.M.; Bingham, S.A.; Englyst, H.N. Digestion and physiological properties of resistant starch in the human large bowel. Br J Nutr 1996, 75, 733–747. [Google Scholar] [CrossRef]
  17. Kumar, D.; Jhariya, A.N. Nutritional, medicinal and economical importance of corn: A mini review. Res. J. Pharmaceutical Sci 2013, 2, 7–8. [Google Scholar]
  18. Dragomir, V.; Brumă, I.S.; Butu, A.; Petcu, V.; Tanasă, L.; Horhocea, D. An overview of global maize market compared to romanian production. RAR 2022, 39, 535–544. [Google Scholar] [CrossRef]
  19. Ertek, A.; Kara, B. Yield and quality of sweet corn under deficit irrigation. Agricultural Water Management 2013, 129, 138–144. [Google Scholar] [CrossRef]
  20. Mrowicka, M.; Mrowicki, J.; Kucharska, E.; Majsterek, I. Lutein and zeaxanthin and their roles in age-related macular degeneration—neurodegenerative disease. Nutrients 2022, 14, 827. [Google Scholar] [CrossRef]
  21. Lillioja, S.; Neal, A.L.; Tapsell, L.; Jacobs, D., Jr. Whole grains, type 2 diabetes, coronary heart disease, and hypertension: Links to the aleurone preferred over indigestible fiber. BioFactors 2013, 39, 242–258. [Google Scholar] [CrossRef]
  22. Hou, P.-F.; Chang, Y.-T.; Lai, J.-M.; Chou, K.-L.; Tai, S.-F.; Tseng, K.-C.; Chow, C.-N.; Jeng, S.-L.; Huang, H.-J.; Chang, W.-C. Long-term effects of fertilizers with regional climate variability on yield trends of sweet corn. Sustainability 2020, 12, 3528. [Google Scholar] [CrossRef]
  23. Revilla, P.; Anibas, C.M.; Tracy, W.F. Sweet corn research around the world 2015–2020. Agronomy 2021, 11, 534. [Google Scholar] [CrossRef]
  24. Hutuliac, R.; Precupeanu, C.; Vasilachi, I.C.; Cojocaru, A.; Rosca, M.; Stoleru, V. Response of sweet corn varieties to plant density and tiller removal: Preliminary studies. JALSE 2024, 57, 233–248. [Google Scholar] [CrossRef]
  25. Apahidean, A.I.; Hoza, G.; Dinu, M.; Soare, R.; Mitre, V.; Sima, R.; Buta, E.; Rózsa, S. Qualitative changes occurred at several sweet corn (Zea mays convar. saccharata var. rugosa) cultivars in different agrotechnical conditions. Acta Hortic. 2024, 91–98. [Google Scholar] [CrossRef]
  26. Jiang, Y.; Wang, T. Phytosterols in cereal by-products. J Americ Oil Chem Soc 2005, 82, 439–444. [Google Scholar] [CrossRef]
  27. Hayat, Z.; Khalil, S.; Iqbal, A.; Islam, B.; Shah, W.; Ahmad, A.; Arif, M.; Sajjad, M.; Shah, F. Growth attributes of sweet corn under different planting regimes. Fresenius Environmental Bulletin 2018, 27, 6945–6951. [Google Scholar]
  28. Corrêa Pereira, R.; Angelis-Pereira, M. Effect of organic versus conventional agricultural systems on bioactive compounds of fruits and vegetables: An integrative review. Cadernos de Ciência & Tecnologia 2022, 39, 27072. [Google Scholar] [CrossRef]
  29. Gamage, A.; Gangahagedara, R.; Gamage, J.; Jayasinghe, N.; Kodikara, N.; Suraweera, P.; Merah, O. Role of organic farming for achieving sustainability in agriculture. Farming System 2023, 1, 100005. [Google Scholar] [CrossRef]
  30. Ibrahim, M.H.; Jaafar, H.Z.E.; Karimi, E.; Ghasemzadeh, A. Impact of organic and inorganic fertilizers application on the phytochemical and antioxidant activity of Kacip Fatimah (Labisia pumila Benth). Molecules 2013, 18, 10973–10988. [Google Scholar] [CrossRef]
  31. Zapałowska, A.; Jarecki, W. The impact of using different types of compost on the growth and yield of corn. Sustainability 2024, 16, 511. [Google Scholar] [CrossRef]
  32. Baghdadi, A.; Halim, R.A.; Ghasemzadeh, A.; Ramlan, M.F.; Sakimin, S.Z. Impact of organic and inorganic fertilizers on the yield and quality of silage corn intercropped with soybean. PeerJ 2018, 6, e5280. [Google Scholar] [CrossRef]
  33. Stoleru, V.; Mangalagiu, I.; Amăriucăi-Mantu, D.; Teliban, G.-C.; Cojocaru, A.; Rusu, O.-R.; Burducea, M.; Mihalache, G.; Rosca, M.; Caruso, G.; et al. Enhancing the nutritional value of sweet pepper through sustainable fertilization management. Front. Nutr. 2023, 10. [Google Scholar] [CrossRef]
  34. Rusu, O.-R.; Mangalagiu, I.; Amăriucăi-Mantu, D.; Teliban, G.-C.; Cojocaru, A.; Burducea, M.; Mihalache, G.; Roșca, M.; Caruso, G.; Sekara, A.; et al. Interaction effects of cultivars and nutrition on quality and yield of tomato. Horticulturae 2023, 9, 541. [Google Scholar] [CrossRef]
  35. Ali, W.; Nadeem, M.; Ashiq, W.; Zaeem, M.; Gilani, S.S.M.; Rajabi-Khamseh, S.; Pham, T.H.; Kavanagh, V.; Thomas, R.; Cheema, M. The effects of organic and inorganic phosphorus amendments on the biochemical attributes and active microbial population of agriculture podzols following silage corn cultivation in boreal climate. Sci Rep 2019, 9, 17297. [Google Scholar] [CrossRef]
  36. Sharma, P.; Sharma, P.; Thakur, N. Sustainable farming practices and soil health: A pathway to achieving SDGs and future prospects. Discov Sustain 2024, 5, 250. [Google Scholar] [CrossRef]
  37. Muñoz-Redondo, J.M.; Montenegro, J.C.; Moreno-Rojas, J.M. Using nitrogen stable isotopes to authenticate organically and conventionally grown vegetables: A new tracking framework. Agronomy 2022, 13, 131. [Google Scholar] [CrossRef]
  38. Álvarez-Iglesias, L.; Puig, C.G.; Revilla, P.; Reigosa, M.J.; Pedrol, N. Faba bean as green manure for field weed control in maize. Weed Research 2018, 58, 437–449. [Google Scholar] [CrossRef]
  39. Castellanos-Rozo, J.; Galvis-López, J.; Manjarres, E.; Merchán-Castellanos, N. Biosolids as fertilizer in the tomato crop. Revista de la Facultad de Agronomía de la Universidad del Zulia 2022, 39, e223931. [Google Scholar] [CrossRef]
  40. Marta, A.E.; Slabu, C.; Mihaela Covasa, M.; Motrescu, I.; Jitareanu, C.D. Comparative analysis of the influence of different biostimulators on the germination and sprouting behaviour of four wheat varieties. JALSE 2023, 55/2022, 377–390. [Google Scholar] [CrossRef]
  41. Chețan, F.; Rusu, T.; Chețan, C.; Șimon, A.; Vălean, A.-M.; Ceclan, A.O.; Bărdaș, M.; Tărău, A. Application of unconventional tillage systems to maize cultivation and measures for rational use of agricultural lands. Land 2023, 12, 2046. [Google Scholar] [CrossRef]
  42. Grzanka, M.; Smoleń, S.; Skoczylas, Ł.; Grzanka, D. Synthesis of organic iodine compounds in sweetcorn under the influence of exogenous foliar application of iodine and vanadium. Molecules 2022, 27, 1822. [Google Scholar] [CrossRef]
  43. Ordóñez-Díaz, J.L.; Hervalejo, A.; Pereira-Caro, G.; Muñoz-Redondo, J.M.; Romero-Rodríguez, E.; Arenas-Arenas, F.J.; Moreno-Rojas, J.M. Effect of Rootstock and harvesting period on the bioactive compounds and antioxidant activity of two orange cultivars (‘Salustiana’ and ‘Sanguinelli’) widely used in juice industry. Processes 2020, 8, 1212. [Google Scholar] [CrossRef]
  44. Moreno-Ortega, A.; Pereira-Caro, G.; Luis Ordóñez, J.; Manuel Muñoz-Redondo, J.; Moreno-Rojas, R.; Pérez-Aparicio, J.; Manuel Moreno-Rojas, J. Changes in the antioxidant activity and metabolite profile of three onion varieties during the elaboration of ‘black onion. ’ Food Chemistry 2020, 311, 125958. [Google Scholar] [CrossRef]
  45. Slinkard, K.; Singleton, V.L. Total phenol analysis: Automation and comparison with manual methods. Am J Enol Vitic. 1977, 28, 49–55. [Google Scholar] [CrossRef]
  46. Nagata, M.; Yamashita, I. Simple method for simultaneous determination of chlorophyll and carotenoids in tomato fruit. J. Japan. Soc. Food Sci. Technol. 1992, 39, 925–928. [Google Scholar] [CrossRef]
  47. Cojocaru, A.; Carbune, R.-V.; Teliban, G.-C.; Stan, T.; Mihalache, G.; Rosca, M.; Rusu, O.-R.; Butnariu, M.; Stoleru, V. Physiological, morphological and chemical changes in pea seeds under different storage conditions. Sci Rep 2024, 14, 28191. [Google Scholar] [CrossRef]
  48. Islam, S.; Ferdausi, A.; Sweety, A.Y.; Das, A.; Ferdoush, A.; Haque, M.A. Morphological characterization and genetic diversity analyses of plant traits contributed to grain yield in maize (Zea mays L.). J biosci agric res 2020, 25, 2047–2059. [Google Scholar] [CrossRef]
  49. Mahato, A.; Shahi, J.P.; Singh, P.K.; Kumar, M. Genetic Diversity of sweet corn inbreds using agro-morphological traits and microsatellite markers. 3 Biotech 2018, 8, 332. [Google Scholar] [CrossRef]
  50. Subaedah, S.; Edy, E.; Mariana, K. Growth, yield, and sugar content of different varieties of sweet corn and harvest time. International Journal of Agronomy 2021, 2021, 1–7. [Google Scholar] [CrossRef]
  51. Niji, M.S.; Ravekisavan, R.; Ganesan, K.N.; Thiyagarajan, C. Genetic variability, heritability and character association studies in sweet corn (Zea mays L. saccharata). Electronic Journal of Plant Breeding 2018, 9, 1038. [Google Scholar] [CrossRef]
  52. Laskari, M.; Menexes, G.C.; Kalfas, I.; Gatzolis, I.; Dordas, C. Effects of fertilization on morphological and physiological characteristics and environmental cost of maize (Zea mays L.). Sustainability 2022, 14, 8866. [Google Scholar] [CrossRef]
  53. Abdullah, H.O.; Al-Obaidy, K.S. Response of sweet corn (Zea mays saccharata L.) to different levels of organic and inorganic fertilizer. IOP Conf. Ser.: Earth Environ. Sci. 2023, 1252, 012065. [Google Scholar] [CrossRef]
  54. Jiang, M.; Dong, C.; Bian, W.; Zhang, W.; Wang, Y. Effects of different fertilization practices on maize yield, soil nutrients, soil moisture, and water use efficiency in Northern China based on a meta-analysis. Sci Rep 2024, 14, 6480. [Google Scholar] [CrossRef]
  55. Muhammad, I.; Yang, L.; Ahmad, S.; Farooq, S.; Al-Ghamdi, A.A.; Khan, A.; Zeeshan, M.; Elshikh, M.S.; Abbasi, A.M.; Zhou, X.-B. Nitrogen fertilizer modulates plant growth, chlorophyll pigments and enzymatic activities under different irrigation regimes. Agronomy 2022, 12, 845. [Google Scholar] [CrossRef]
  56. Khan, F.; Siddique, A.B.; Shabala, S.; Zhou, M.; Zhao, C. Phosphorus plays key roles in regulating plants’ physiological responses to abiotic stresses. Plants (Basel) 2023, 12, 2861. [Google Scholar] [CrossRef] [PubMed]
  57. Sun, Y.; Han, Y.; Xu, Z.; Zhang, J.; Shen, J.; Cheng, L. Phosphorus partitioning contribute to phosphorus use efficiency during grain filling in Zea mays. Front. Plant Sci. 2023, 14. [Google Scholar] [CrossRef] [PubMed]
  58. Păcurar, L.; Apahidean, M.; Has, V.; Apahidean, A. Morpho-productive and chemical composition of local and foreign sweet corn hybrids grown in the conditions of Transylvania Plateau. Bulletin of University of Agricultural Sciences and Veterinary Medicine Cluj-Napoca. Horticulture 2017, 74, 168. [Google Scholar] [CrossRef]
  59. Song, J.; Li, D.; He, M.; Chen, J.; Liu, C. Comparison of carotenoid composition in immature and mature grains of corn (Zea mays L.) varieties. International Journal of Food Properties 2016, 19, 351–358. [Google Scholar] [CrossRef]
  60. Khan, U.M.; Sevindik, M.; Zarrabi, A.; Nami, M.; Ozdemir, B.; Kaplan, D.N.; Selamoglu, Z.; Hasan, M.; Kumar, M.; Alshehri, M.M.; et al. Lycopene: Food sources, biological activities, and human health benefits. Oxid Med Cell Longev 2021, 2021, 2713511. [Google Scholar] [CrossRef]
  61. Pavlović, R.; Mladenović, J.; Pavlović, N.; Zdravković, M.; Josic, D.; Zdravković, J. Antioxidant Nutritional quality and the effect of thermal treatments on selected processing tomato lines. Acta scientiarum Polonorum. Hortorum cultus = Ogrodnictwo 2017, 16, 119–128. [Google Scholar] [CrossRef]
  62. Ledenčan, T.; Horvat, D.; Špoljarić Marković, S.; Svečnjak, Z.; Jambrović, A.; Šimić, D. Effect of Harvest date on kernel quality and antioxidant activity in su1 sweet corn genotypes. Agronomy 2022, 12, 1224. [Google Scholar] [CrossRef]
  63. Cai, S.; Mao, Y.; Gu, Y.; Huang, B.; He, Z.; Zeng, M.; Wang, Z.; Chen, Q.; Tang, M.; Chen, J. Carotenoid and phenolic compositions and antioxidant activity of 23 cultivars of corn grain and corn husk extract. Foods 2024, 13, 3375. [Google Scholar] [CrossRef]
  64. Zhang, R.; Huang, L.; Deng, Y.; Chi, J.; Zhang, Y.; Wei, Z.; Zhang, M. Phenolic content and antioxidant activity of eight representative sweet corn varieties grown in South China. International Journal of Food Properties 2017, 20, 3043–3055. [Google Scholar] [CrossRef]
  65. Das, A.; Murmu, K.; Mitra, B.; Bandopadhyay, P.; Kundu, R.; Roy, M.; Alfarraj, S.; Ansari, M.J.; Brestic, M.; Hossain, A. Various organic nutrient sources in combinations with inorganic fertilizers influence the yield and quality of sweet corn (Zea Mays L. Saccharata) in new alluvial soils of West Bengal, India. Phyton 2024, 93, 763–776. [Google Scholar] [CrossRef]
  66. Hu, X.; Liu, H.; Yu, Y.; Li, G.; Qi, X.; Li, Y.; Li, T.; Guo, X.; Liu, R.H. Accumulation of phenolics, antioxidant and antiproliferative activity of sweet corn (Zea mays L.) during kernel maturation. International Journal of Food Science & Technology 2021, 56, 2462–2470. [Google Scholar] [CrossRef]
  67. Bae, H.-H.; Yi, G.; Go, Y.S.; Ha, J.Y.; Choi, Y.; Son, J.-H.; Shin, S.; Jung, T.-W.; Lee, S. Measuring antioxidant activity in yellow corn (Zea mays L.) inbreds from three different geographic regions. Applied Biological Chemistry 2021, 64, 56. [Google Scholar] [CrossRef]
  68. Dragičević, V.; Brankov, M.; Stoiljković, M.; Tolimir, M.; Kanatas, P.; Travlos, I.; Simić, M. Kernel color and fertilization as factors of enhanced maize quality. Front. Plant Sci. 2022, 13. [Google Scholar] [CrossRef] [PubMed]
  69. Feregrino-Pérez, A.A.; Mercado-Luna, A.; Murillo-Cárdenas, C.A.; González-Santos, R.; Chávez-Servín, J.L.; Vargas-Madriz, A.F.; Luna-Sánchez, E. Polyphenolic compounds and antioxidant capacity in native maize of the Sierra Gorda of Querétaro. Agronomy 2024, 14, 142. [Google Scholar] [CrossRef]
  70. Elemosho, A.O.; Irondi, E.A.; Alamu, E.O.; Ajani, E.O.; Maziya-Dixon, B.; Menkir, A. Characterization of striga-resistant yellow-orange maize hybrids for bioactive, carbohydrate, and pasting properties. Front. Sustain. Food Syst. 2020, 4. [Google Scholar] [CrossRef]
  71. Ragheb, E.E. Sweet Corn as affected by foliar application with amino – and humic acids under different fertilizer sources. Egypt. J. Hort. 2016, 43, 441–456. [Google Scholar] [CrossRef]
  72. Leandro da Cruz, L.; Gonçalves, G.M.B.; de Lima Glória, L.; de Faria Pereira, S.M.; de Almeida Carlos, C.; Vivas, M.; Pereira, M.G.; Barros de Oliveira, D. Phenolic compounds, carotenoids, and antioxidant activity in a super-sweet corn hybrid. Pesq. agropec. bras. 2022, 57, e02663. [Google Scholar] [CrossRef]
  73. Lorenzo, C.D.; Badea, M.; Colombo, F.; Orgiu, F.; Frigerio, G.; Pastor, R.F.; Restani, P. Antioxidant Activity of wine assessed by different in vitro methods. BIO Web Conf. 2017, 9, 04008. [Google Scholar] [CrossRef]
  74. Gülçin, İ.; Huyut, Z.; Elmastaş, M.; Aboul-Enein, H.Y. Radical scavenging and antioxidant activity of tannic acid. Arabian Journal of Chemistry 2010, 3, 43–53. [Google Scholar] [CrossRef]
  75. Mesarović, J.; Srdić, J.; Mladenović-Drinić, S.; Dragičević, V.; Simić, M.; Brankov, M.; Milojković-Opsenica, D. Evaluation of the nutritional profile of sweet maize after herbicide and foliar fertilizer application. Journal of Cereal Science 2019, 87, 132–137. [Google Scholar] [CrossRef]
Figure 1. Localization of experimental site.
Preprints 185716 g001
Figure 2. Effect of sweet corn variety on sugars compounds. Values associated with the same lower-case letters are not significantly different at p ≤ 0.05 according to Duncan’s test.
Preprints 185716 g002
Figure 3. Effect of fertilization type on sugar compounds. Values associated with the same lower-case letters are not significantly different at p ≤ 0.05 according to Duncan’s test.
Preprints 185716 g003
Figure 4. Effect of sweet corn variety and fertilization type on sugar compounds. Ch-Chemical, O-organic, Ct-Control. Values associated with the same lower-case letters are not significantly different at p ≤ 0.05 according to Duncan’s test.
Preprints 185716 g004
Figure 5. Biplot of PCA applied to the entire dataset collected from the cultivation of the Royalty F1 (R-F1), Hardy F1 (H-F1), and Deliciosul de Bacau (DBc) sweet corn genotypes in organic, chemical, and unfertilized regime.
Preprints 185716 g005
Figure 6. Pearson correlation diagram of the yield, biometrical, biochemical and nutritional quality traits of the Royalty F1, Hardy F1, and Deliciosul de Bacau sweet corn genotypes cultivated in organic, chemical, and unfertilized regime.
Preprints 185716 g006
Table 1. Climatic conditions during 2022–2023.
Temperature (0C) 2022 Months
Jan Feb Mar Apr May June July Aug Sept Oct Nov Dec
Min −7.0 −5.5 −2 4.0 5.2 14 12.2 18 5 0.2 −1.4 −7.6
Max 5 16.8 14.5 18.2 25.4 29.2 30.8 33.0 27.0 26.8 16.3 10.7
Average −5.5 −2.4 2 10.8 12.4 18.5 22.2 24.4 20.2 13.7 9 5.5
Precipitation (mm) 21 19 44 67 30 66 42 15 102 44 54 12
Temperature (0C) 2023 months
Jan Feb Mar Apr May June July Aug Sept Oct Nov Dec
Min −5 −3 0 6.0 −2.2 12 11.2 13.7 1.2 6 −5 −4.6
Max 1 14 19 16 18.7 28 35.2 34.1 30.9 26 19.2 15.1
Average 0.5 5.1 7.8 12.1 13.4 20.9 23.5 25.1 21.1 14.7 8 3.1
Precipitation (mm) 29 28 34 47 54 82.8 69.8 14.4 32.2 54.4 45.4 13
Table 2. Effects of sweet corn variety and fertilization type on morphological and physiological parameters.
Factors Chlorophyll Index Plant Height (cm) Ears Insertion (cm) No of Stalks No of Ears per Plant Ears Weight (g) No of Kernel Rows per Ear
Variety
Royalty F1 31.4 ± 1.0 220.2 ± 7.2 a 79.4 ± 8.5 a 1.8 ± 0.2 1.6 ± 0.2 211.7 ± 8.5 ab 14.3 ± 0.3 b
Hardy F1 34.9 ± 1.0 189.6 ± 9.6 b 57.7 ± 2.7 b 1.5 ± 0.1 1.8 ± 0.2 239.2 ± 12.4 a 16.9 ± 0.4 a
DBc 33.9 ± 2.0 227.5 ± 7.3 a 91.0 ± 3.2 a 1.5 ± 0.1 1.5 ± 0.1 192.3 ± 1.9 b 13.3 ± 0.2 b
Signification for p≤0.05 ns * * ns ns * *
Fertilizer
Chemical 36.2 ± 0.8 a 207.8 ± 10.8 73.0 ± 4.1 1.7 ± 0.1 1.9 ± 0.1 226.9 ± 5.9 15.9 ± 0.3 a
Organic 32.9 ± 0.4 ab 205.4 ± 10.9 75.2 ± 4.4 1.4 ± 0.3 1.6 ± 0.2 205.3 ± 3.9 14.4 ± 0.2 b
Control 31.1 ± 1.7 b 224.1 ± 2.5 79.8 ± 5.5 1.6 ± 0.3 1.4 ± 0.1 210.9 ± 15.5 14.2 ± 0.4 b
Signification for p≤0.05 * ns ns ns ns ns *
Within each column: ns- non-significant; * - significant differences; Values associated with the same lower-case letters are not significantly different at p ≤ 0.05 according to Duncan’s test. DBc – Deliciosul de Bacau.
Table 3. Effects of sweet corn variety and fertilization type on yield parameters.
Treatment Ears Length (cm) Rahis Weight (g) Kernels Weight (g) Dry Matter (%) Yield per ha (kg)
Royalty F1 20.96 ± 0.23 a 90.05 ± 3.39 121.65 ± 5.15 b 25.77 ± 1.44 10,828 ± 731 b
Hardy F1 21.6 ± 0.41 a 92.66 ± 4.20 146.56 ± 8.40 a 23.85 ± 1.33 13,995 ± 527 a
DBc 19.78 ± 0.03 b 96.45 ± 1.71 95.87 ± 3.47 c 21.89 ± 1.22 7,682± 593 c
Signification for p≤0.05 * ns * ns *
Chemical 21.09 ± 0.31 92.81 ± 3.00 134.15 ± 2.89 25.14 ± 1.40 13,717 ± 961 a
Organic 20.86 ± 0.08 92.88 ± 4.97 112.44 ± 4.23 22.14 ± 1.23 10,083 ± 667 b
Control 20.40 ± 0.20 93.46 ± 6.42 117.48 ± 9.75 24.23 ± 1.35 8,705 ± 95 b
Signification for p≤0.05 ns ns ns ns *
Within each column: ns- non-significant; * - significant differences; values associated with the same lower-case letters are not significantly different at p ≤ 0.05 according to Duncan’s test. DBc – Deliciosul de Bacau.
Table 4. Effects of sweet corn variety and fertilization type on antioxidant compounds, chlorophyll and carotenoid pigments, and tannins.
Factors TPC
(mg/g dw)
ABTS
(μM TE/g dw)
DPPH
(μM TE/g dw)
A Chlorophyll
(mg/100 g dw)
B Chlorophyll
(mg/100 g dw)
Lycopene
(mg/100 g dw)
β-Carotene (mg/100 g dw) Tannins
(mg CE/100 g dw)
Variety
Royalty F1 1.78b 1.70 1.34 4.2a 6.3a 2.14a nd 0.113b
Hardy F1 2.22a 1.80 1.34 2.2b 3.3b 0.98b nd 0.168a
DBc 2.05ab 1.71 1.43 4.0a 6.4a 2.08a nd 0.131b
Signification for p ≤ 0.05 * ns ns * * * ns *
Fertilizer
Chemical 1.99 1.88a 1.52a 3.4b 5.3b 1.70b nd 0.162a
Organic 2.12 1.68b 1.44a 4.2a 6.4a 2.16a nd 0.152a
Control 1.94 1.65b 1.16b 2.7c 4.3c 1.35c nd 0.097b
Signification for p ≤ 0.05 ns * * * * * ns *
Within each column: ns- non-significant; * - significant differences; Values associated with the same lower-case letters are not significantly different at p ≤ 0.05 according to Duncan’s test. DBc – Deliciosul de Bacau.
Table 5. Effects of sweet corn variety and fertilization type interactions on morphological and physiological parameters.
Treatment Leaf Chlorophyll Index Plant Height (cm) Ears Inserts (cm) No of Stalks No of Ears per Plant Ears Weight (g) No of Kernel Rows per Ear
RF1 × Chemical 32.8 ± 3.2 ab 209.3 ± 14.1 abc 69.1 ± 13.4 bcd 1.9 ± 0.2 1.7 ± 0.2 ab 263.7 ± 20.9 a 17.7 ± 0.3 a
RF1 × Organic 31.2 ± 1.34 ab 212.9 ± 19.3 abc 77.9 ± 4.4 abc 1.7 ± 0.4 1.5 ± 0.3 ab 200.2 ± 8.1 bc 13.0 ± 0.6 b
RF1 × Control 30.33± 3.0 b 238.4 ± 5.4 a 91.0 ± 9.0 a 1.9 ± 0.2 1.6 ± 0.2 ab 171.2 ± 18.2 c 12.1 ± 0.5 b
HF1 × Chemical 39.9 ± 3.2 a 183.7 ± 11.1 bc 56.5 ± 3.7 cd 1.6 ± 0.1 2.1 ± 0.3 a 239.6 ± 9.5 ab 17.0 ± 0.3 a
HF1 × Organic 32.3 ± 2.7 ab 176.5 ± 7.7 c 51.6 ± 4.5 d 1.3 ± 0.2 1.9 ± 0.1 ab 214.8 ± 18.5 bc 16.4 ± 0.8 a
HF1 × Control 32.4 ± 2.5 ab 208.5 ± 10.6 abc 64.9 ± 1.1 bcd 1.5 ± 0.2 1.3 ± 0.1 b 263.2 ± 18.5 a 17.5 ± 0.9 a
DBc × Chemical 36.0 ± 3.9 ab 230.6 ± 8.1 ab 93.4 ± 5.1 a 1.6 ± 0.3 1.8 ± 0.1 ab 177.5 ± 6.3 c 12.9 ± 0.6 b
DBc × Organic 35.1 ± 1.2 ab 226.7 ± 26.3 ab 96.2 ± 4.7 a 1.3 ± 0.2 1.5 ± 0.2 ab 201.1 ± 4.5 bc 13.9 ± 0.7 b
DBc × Control 30.6 ± 1.9 b 225.3 ± 15.1 ab 83.4 ± 7.1 ab 1.5 ± 0.4 1.3 ± 0.3 b 198.3 ± 13.9 bc 13.1 ± 0.6 b
Signification for p≤0.05 * * * ns * * *
Within each column: ns- non-significant; * - significant differences; Values associated with the same lower-case letters are not significantly different at p ≤ 0.05 according to Duncan’s test. DBc – Deliciosul de Bacau, HF1 - Hardy F1, RF1 - Royalty F1
Table 6. Effects of the interaction of sweet corn variety and fertilization type on yield parameters.
Treatment Ears Length (cm) Rahis Weight (g) Kernels Weight (g) Yield per ha (kg) Dry Matter (%)
Royalty F1 × Chemical 22.10 ± 0.69 a 102.58 ± 4.88 ab 161.16 ± 16.39 a 15,064 ± 692 ab 30.24 ± 1.69 a
Royalty F1 × Organic 20.61 ± 0.41 abcd 89.16 ± 3.33 abc 110.98 ± 5.97 bc 9,345 ± 1,953 cd 24.92 ± 1.39 b
Royalty F1 × Control 20.16 ± 0.62 bcd 78.40 ± 11.12 c 92.81 ± 7.17 c 8,073 ± 395 d 22.16 ± 1.23 bc
Hardy F1 × Chemical 22.08 ± 0.41 a 86.38 ± 5.39 abc 153.22 ± 5.71 a 17,510 ± 2,767 a 22.16 ± 1.24 bc
Hardy F1 × Organic 21.55 ± 0.54 ab 85.19 ± 4.09 bc 129.59 ± 16.36 ab 13,288 ± 977 bc 19.36 ± 1.08 c
Hardy F1 × Control 21.19 ± 0.44 abc 106.40 ± 6.66 a 156.87 ± 12.24 a 11,187 ± 824 bcd 30.03 ± 1.67 a
DBc × Chemical 19.08 ± 0.36 d 89.48 ± 1.60 abc 88.07 ± 5.96 c 8,576 ± 444 d 23.03 ± 1.28 bc
DBc × Organic 20.41 ± 0.41 bcd 104.31 ± 9.06 ab 96.76 ± 5.80 bc 7,616 ± 1,055 d 22.14 ± 1.23 bc
DBc × Control 19.87 ± 0.35 cd 95.57 ± 2.50 abc 102.77 ± 11.99 bc 6,853 ± 705.7 d 20.49 ± 1.14 bc
Signification for p≤0.05 * * * * *
Within each column: ns- non-significant; * - significant differences; Values associated with the same lower-case letters are not significantly different at p ≤ 0.05 according to Duncan’s test. DBc – Deliciosul de Bacau.
Table 7. Effects of the interaction of variety and fertilization type on the contents of antioxidant compounds, chlorophyll and carotenoid pigments and tannins.
Treatment TPC
(mg GAE/g dw)
ABTS
(μM TE/g dw)
DPPH
(μM TE/g dw)
A Chlorophyll
(mg/100 g dw)
B Chlorophyll
(mg/100 g dw)
Lycopene
(mg/100 g dw)
β-Carotene
(mg/100 g dw)
Tannins
(mg CE/100 g dw)
RF1 × Chemical 1.50c 1.89 1.67a 1.6 fg 2.5ef 0.77f nd 0.147bc
RF1 × Organic 2.14abc 1.69 1.36abc 7.6a 11.2a 3.96a nd 0.118cde
RF1 × Control 1.72bc 1.54 1.01bc 3.3cd 5.3cd 1.69cd nd 0.075e
HF1 × Chemical 2.88a 1.83 1.62a 3.2cd 4.6d 1.45cd nd 0.190ab
HF1 × Organic 2.41ab 1.91 1.43abc 1.3 g 2.0f 0.56f nd 0.225a
HF1 × Control 1.37c 1.66 0.98c 2.1ef 3.2e 0.93ef nd 0.089de
DBc × Chemical 1.58c 1.93 1.28abc 5.5b 8.7b 2.87b nd 0.150bc
DBc × Organic 1.83bc 1.45 1.54ab 3.7c 6.0c 1.95c nd 0.114cde
DBc × Control 2.74a 1.75 1.48abc 2.7de 4.5d 1.43de nd 0.129cd
Signification for p≤0.05 * ns * * * * ns *
Within each column: ns- non-significant; * - significant differences; values associated with the same lower-case letters are not significantly different at p ≤ 0.05 according to Duncan’s test. DBc – Deliciosul de Bacau, HF1 - Hardy F1, RF1 - Royalty F1.
Table 8. Eigenvalues of the correlation matrix showing the affinity of different PCs against the yield, biometrical, biochemical and nutritional quality traits of the sweet corn genotypes under different fertilization systems.
Traits PC1 PC2 PC3 PC4 PC5 PC6 PC7 PC8
Plant height -0.2857 -0.1313 0.0310 -0.0807 0.1075 0.2282 -0.1864 -0.1568
No of stalks -0.0472 -0.1216 0.4247 -0.4449 -0.1356 0.0837 -0.1389 -0.0936
Leaf chlorophyll index 0.1399 0.1606 0.1470 0.4242 0.0363 0.3429 -0.4530 -0.1007
Ears insertion height -0.2927 -0.0344 0.0186 0.0560 0.1882 0.2735 -0.1934 0.0512
No of ears per plant 0.1724 0.2790 0.1696 -0.0208 -0.1805 0.3561 -0.1612 0.2952
Ears weight 0.2595 -0.2424 0.0700 0.0953 0.0954 -0.1111 0.0324 -0.0831
No of kernel rows per ear 0.3007 -0.1528 -0.0017 0.0775 0.0005 0.0280 0.0256 0.0526
Ears length 0.2860 -0.0670 0.0980 -0.0997 0.0590 -0.2480 -0.0975 0.3804
Rahis weight 0.0469 -0.3222 -0.0804 0.3486 0.4053 0.0536 0.1069 -0.0378
Kernels weight 0.2858 -0.1755 0.1076 -0.0044 -0.0230 -0.1459 0.0023 -0.0853
Dry matter 0.0688 -0.3911 0.2401 0.0762 -0.0739 0.0327 0.0825 -0.0081
Humidity -0.0688 0.3911 -0.2401 -0.0762 0.0739 -0.0327 -0.0825 0.0081
Yield per ha 0.2981 0.0331 0.1961 -0.0305 -0.0813 0.0367 -0.1029 0.1048
TPC 0.0866 0.3378 -0.0403 -0.0565 0.2550 -0.4044 -0.0483 -0.4328
ABTS 0.1677 0.1289 0.1490 -0.0644 -0.1158 0.3973 0.5668 -0.4342
DPPH 0.1346 0.1596 0.1645 0.0622 0.6399 0.1113 0.1194 0.2144
Chlorophyll A -0.2012 0.1149 0.3182 0.3189 -0.1346 -0.2051 0.1172 0.0485
Chlorophyll B -0.2199 0.1131 0.2958 0.3128 -0.1130 -0.1576 0.1105 0.0349
Lycopene -0.2153 0.1116 0.3057 0.3022 -0.1025 -0.1861 0.1364 0.0620
Tannins 0.2147 0.2823 -0.0252 0.0476 0.0463 0.1936 0.3342 0.1089
Fructose -0.2127 0.0628 0.2240 -0.3374 0.2457 -0.0408 0.2507 0.3749
Glucose 0.1052 0.1290 0.4371 -0.1674 0.2449 -0.1242 -0.2594 -0.3198
Sucrose 0.2608 0.2000 -0.0816 0.0823 -0.2325 -0.1721 -0.0791 0.0926
Disclaimer/Publisher’s Note: The statements, opinions and data contained in all publications are solely those of the individual author(s) and contributor(s) and not of MDPI and/or the editor(s). MDPI and/or the editor(s) disclaim responsibility for any injury to people or property resulting from any ideas, methods, instructions or products referred to in the content.
Copyright: This open access article is published under a Creative Commons CC BY 4.0 license, which permit the free download, distribution, and reuse, provided that the author and preprint are cited in any reuse.
Prerpints.org logo

Preprints.org is a free preprint server supported by MDPI in Basel, Switzerland.

Subscribe

Disclaimer

Terms of Use

Privacy Policy

Privacy Settings

© 2025 MDPI (Basel, Switzerland) unless otherwise stated