Preprint
Article

This version is not peer-reviewed.

Prognostic Value of the RVFWLS/PASP Ratio in Pulmonary Arterial Hypertension

Submitted:

17 November 2025

Posted:

18 November 2025

You are already at the latest version

Abstract

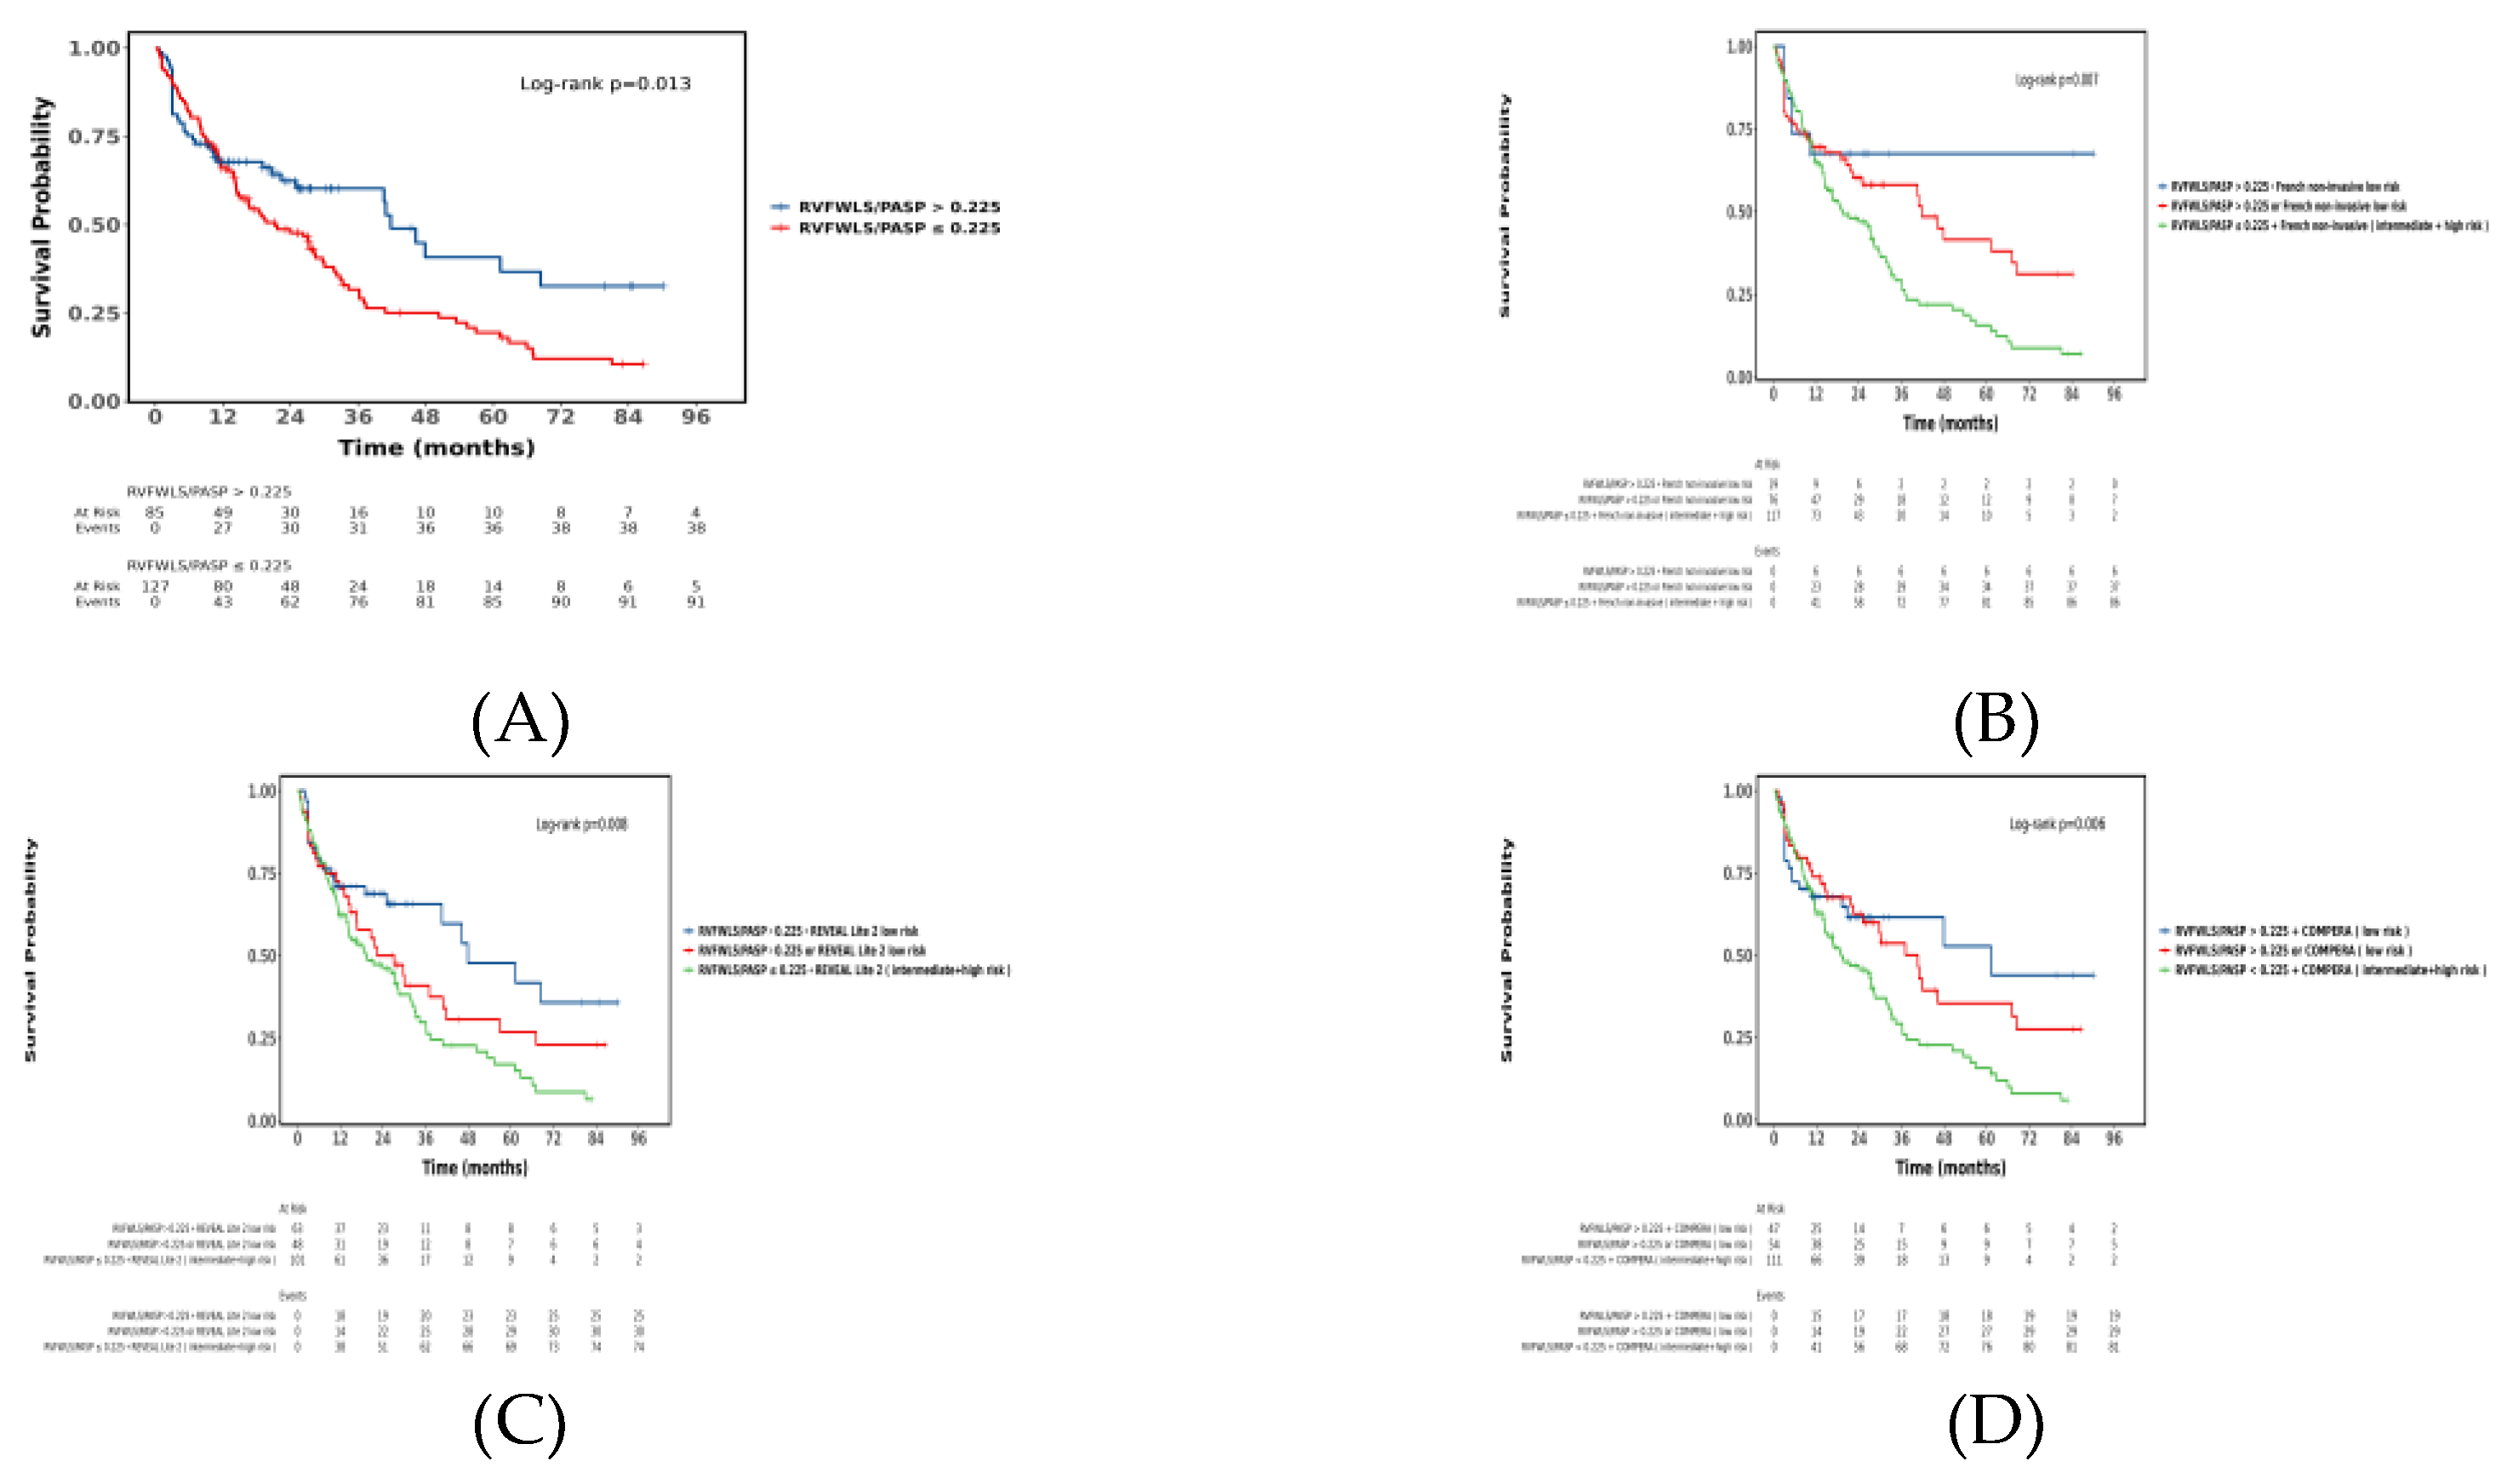
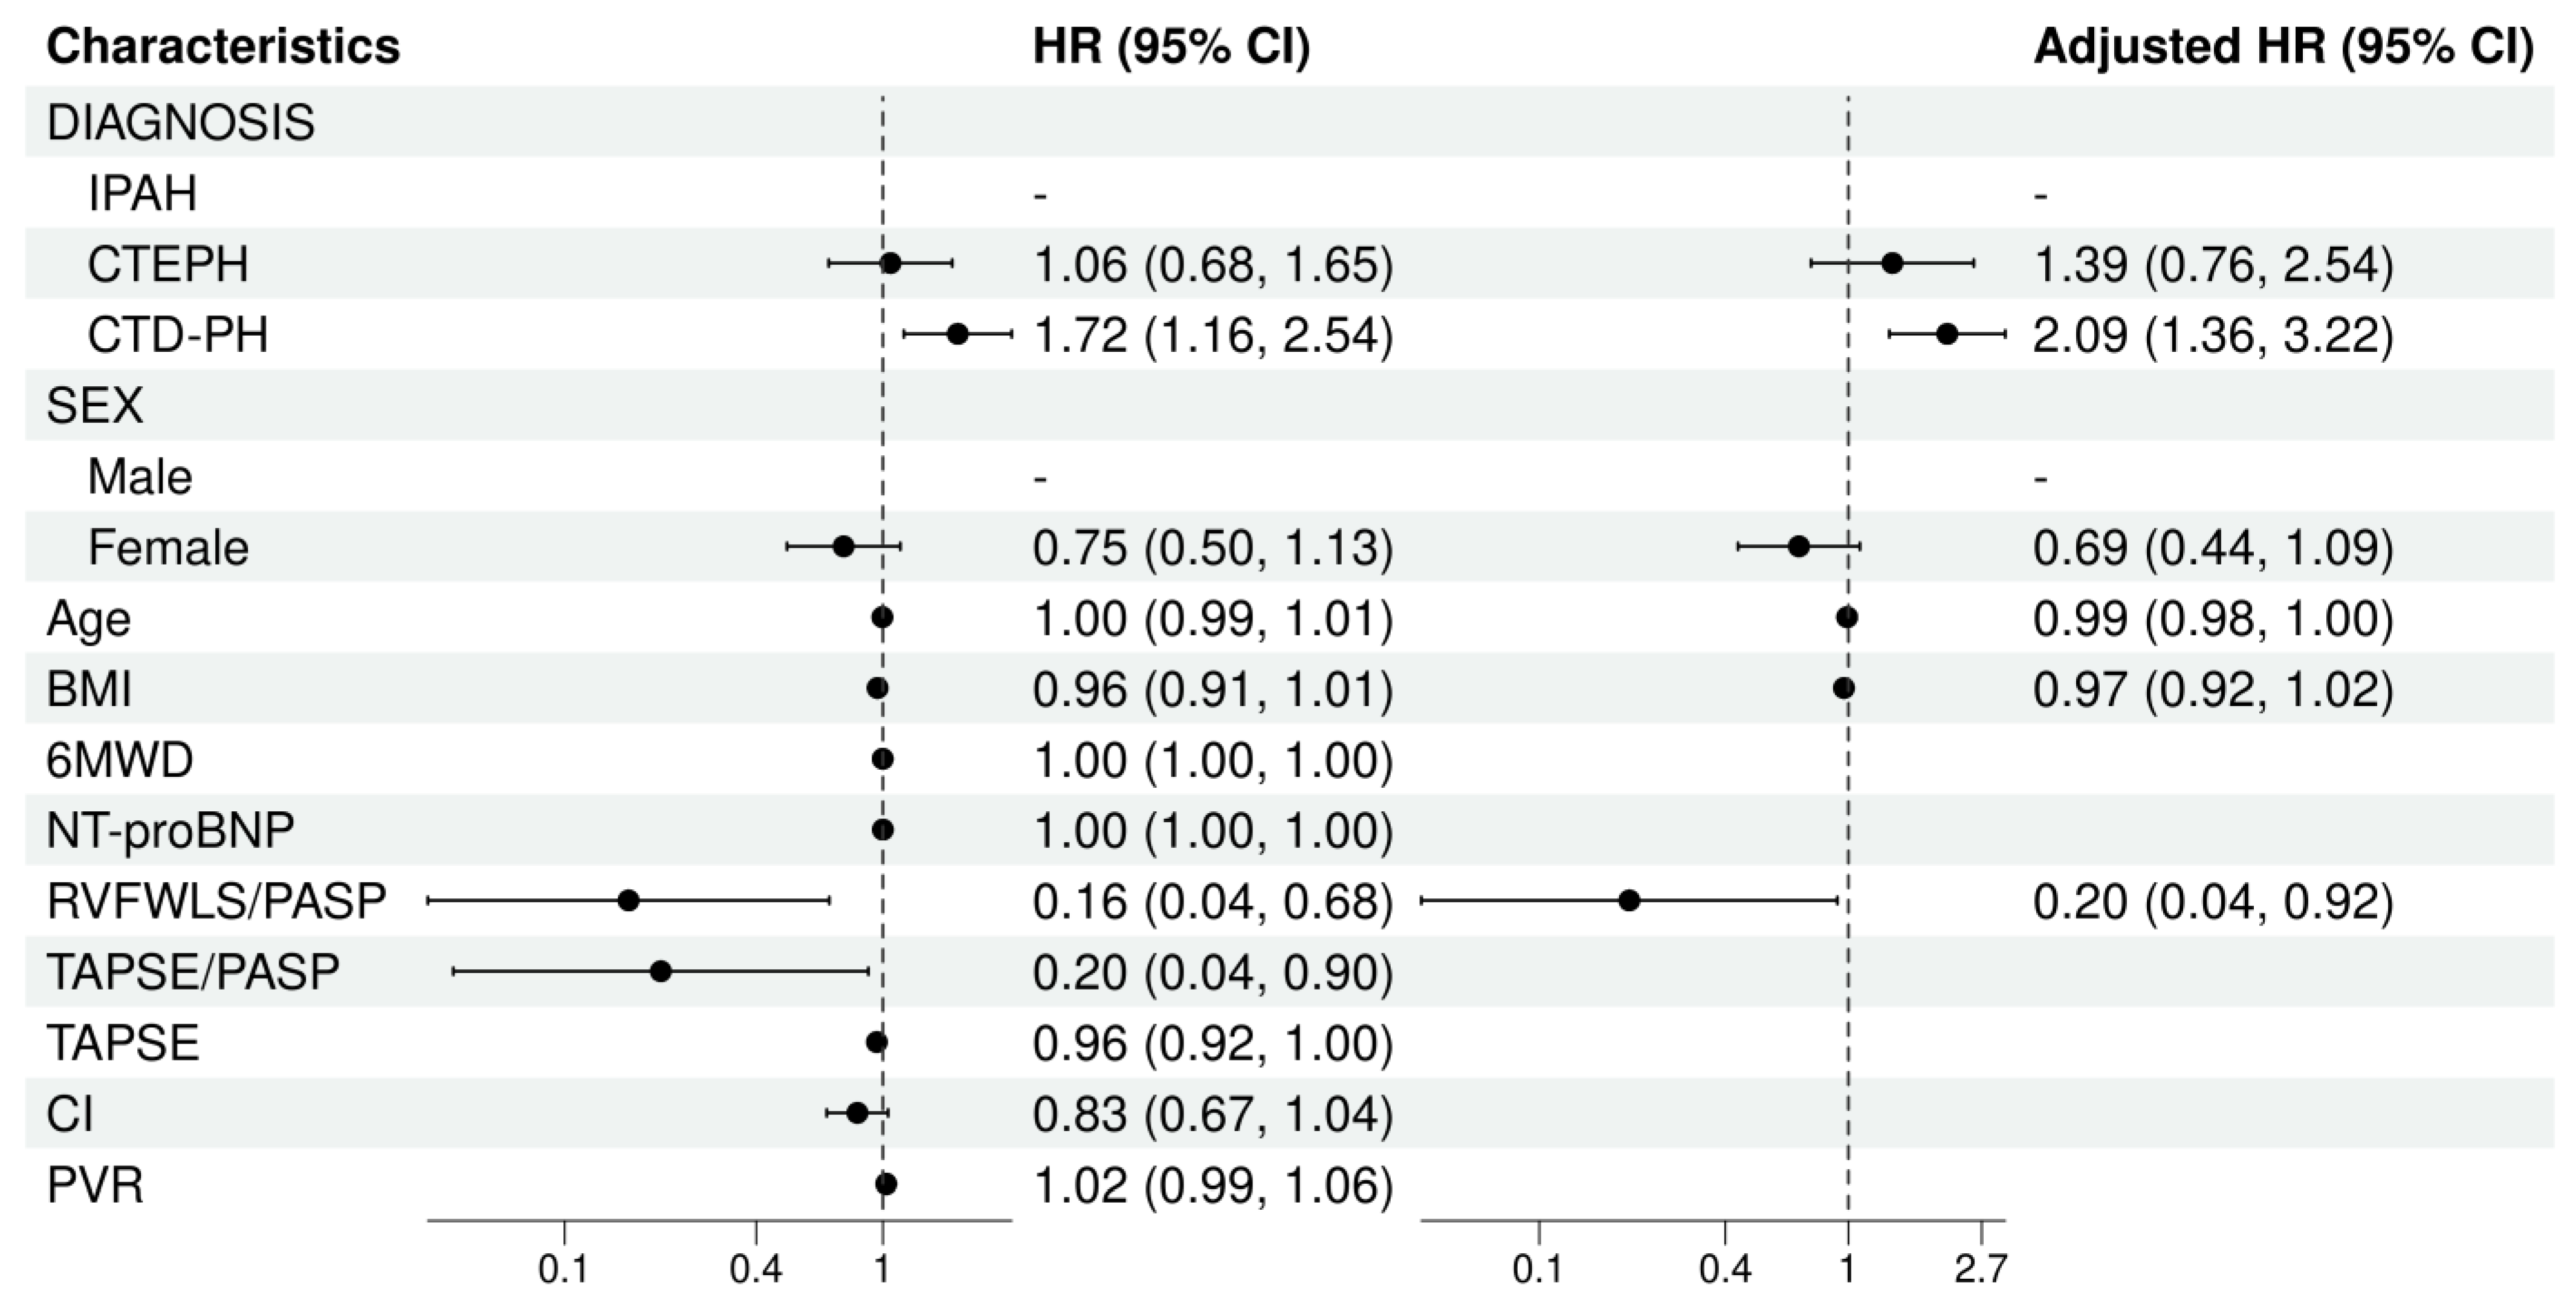
Background: The Right Ventricular Free Wall Longitudinal Strain/Pulmonary Arterial Systolic Pressure (RVFWLS/PASP) ratio is a novel echocardiographic parameter for assessing right ventricular–pulmonary artery (RV-PA) coupling. Its prognostic role in patients with pulmonary arterial hypertension (PAH) remains poorly defined. This study aimed to explore the prognostic value of RVFWLS/PASP in PAH. Methods: A retrospective cohort study was conducted involving patients with PAH at Shanghai Pulmonary Hospital and Nanyang Second People's Hospital from December 2009 to October 2024.The RVFWLS/PASP ratio is calculated, where the numerator (RVFWLS) is derived using speckle tracking echocardiography, and the denominator (PASP) is estimated based on the tricuspid regurgitation velocity. The primary endpoint was event-free survival, with events defined as all-cause mortality, lung transplantation, rehospitalization for right heart failure, or escalation of targeted therapy due to clinical deterioration. Cox regression analysis was used to identify and validate RVFWLS/PASP characteristics in patients with different outcomes. Kaplan-Meier survival analysis was employed to evaluate the additive value of RVFWLS/PASP to previously established risk models. Results: A total of 216 adult PAH patients were enrolled. The median follow-up time was 31 months. The survival rate of patients in the lower RVFWLS/PASP group was significantly worse than those in the higher RVFWLS/PASP group (Log-rank P <0.05). Multivariate Cox regression demonstrated that after adjusting for other prognostic factors,RVFWLS/PASP ratio (HR = 0.20, 95% CI: 0.04-0.92, p = 0.039) and CTD-PH diagnosis (HR = 2.09, 95% CI: 1.36-3.22, p < 0.001) remained independent predictors of adverse clinical events. RVFWLS/PASP enabled further risk stratification of patients classified as low-risk by established models. Conclusion: The echocardiographic parameter RVFWLS/PASP serves as an independent determinant of long-term prognosis in patients with PAH, indicating that improved RV-PA coupling is significantly associated with better clinical outcomes. RVFWLS/PASP provides incremental value for risk stratification and may demonstrate heterogeneous utility across different clinical subgroups.

Keywords: 
;  ;  ;  ;  

1. Introduction

Pulmonary hypertension (PH) is a progressive disease involving both the pulmonary vasculature and the heart. Right ventricular (RV) function is a key determinant of patient symptoms and outcomes[1,2,3]. Given that right heart failure in PH results from increased cardiac afterload, right ventricle - pulmonary artery (RV-PA) coupling provides a more comprehensive framework for understanding RV function[4]. As pulmonary vascular resistance rises, a coupled RV responds by enhancing contractility to match the afterload, thereby preserving RV function. In contrast, a decoupled RV exhibits reduced contractility and fails to adapt to the elevated afterload[5,6]. Monitoring the level of RV-PA coupling can help predict clinical deterioration in PH, even when patients appear clinically stable.
Echocardiography serves as an essential non-invasive tool for evaluating RV function in patients with PH. Since conventional parameters for assessing RV function are often influenced by afterload, ratios incorporating pulmonary arterial systolic pressure (PASP) may hold greater clinical significance. As a currently widely used parameter of RV-PA coupling, the tricuspid annular plane systolic excursion to PASP ratio (TAPSE/PASP) is recommended for assessing disease severity and risk stratification in all PH patients[7]. However, this parameter is not only limited by angle dependency but also exhibits variable prognostic value across different etiological subtypes. In contrast, the RV free wall longitudinal strain to PASP ratio (RVFWLS/PASP), derived from speckle-tracking echocardiography, directly quantifies RV myocardial deformation in an angle-independent manner, providing a more comprehensive characterization of RV function[2,8].
In this study, we aimed to compare the performance of RVFWLS/PASP with other RV parameters and develop an optimized prognostic model to identify risk profiles in patients with PAH. We hypothesized that RVFWLS/PASP, when combined with PH diagnostic categories, could construct a novel predictive model, while simultaneously providing incremental value to conventional prognostic scores.

2. Materials and Methods

2.1. Study Population and Design

This observational cohort study consecutively enrolled patients with confirmed diagnoses of idiopathic pulmonary arterial hypertension (IPAH), connective tissue disease-associated pulmonary hypertension (CTD-PH), and chronic thromboembolic pulmonary hypertension (CTEPH) from Shanghai Pulmonary Hospital and Nanyang Second People's Hospital between December 2009 and October 2024. All enrolled patients provided written informed consent. The study adhered to the ethical principles of the Declaration of Helsinki and was approved by the institutional ethics review board.
Inclusion criteria required patients to be ≥18 years at diagnosis and meet the 2022 ESC/ERS guideline criteria for PH confirmed by right heart catheterization (RHC): for IPAH, resting mPAP ≥20 mmHg with PAWP ≤15 mmHg and PVR >2 WU without other known causes; for CTD-PH, mPAP ≥20 mmHg with PAWP ≤15 mmHg and PVR >2 WU with confirmed CTD after excluding other comorbidities; for CTEPH, resting mPAP ≥20 mmHg with PVR >2 WU plus confirmed diagnosis based on pulmonary embolism history and imaging evidence. Exclusion criteria included: (1) missing echocardiographic coupling data, (2) unavailable RHC data, (3) incomplete follow-up information.
The primary endpoint was event-free survival, defined as freedom from all-cause mortality, lung transplantation, rehospitalization due to right heart failure, or escalation of targeted therapy resulting from clinical deterioration. Patients were followed for event-free survival via outpatient visits or telephone contact until May 2025. Follow-up duration was calculated from the date of enrollment until either the occurrence of death or the study cutoff date. Patients who could not be reached through any of the specified methods were considered lost to follow-up, with censoring applied at the date of last contact.

2.2. Baseline Data Collection

Baseline data were collected for all enrolled patients by reviewing electronic medical records, including demographic characteristics (age, sex), World Health Organization functional class (WHO-FC), 6-minute walking distance (6MWD), and N-terminal pro-brain natriuretic peptide (NT-proBNP). Cardiac output and related pulmonary hemodynamic parameters were measured using a Swan-Ganz catheter equipped with a triple-lumen balloon via the thermodilution method [9,10].

2.3. Echocardiographic Measurements and Definitions

Baseline echocardiographic measurements were performed within 24-48 hours after RHC using commercially available equipment (Vivid 7, GE Healthcare) in standard views, with all data reviewed by at least two echocardiography specialists. Measurements were obtained from the average of three consecutive cardiac cycles according to the American Society of Echocardiography guidelines[11]. RV morphological parameters included RV mid-diameter (RVMD), left ventricular eccentricity index (LV-EId)[12], and right atrial area, while conventional RV functional parameters comprised lateral tricuspid annular systolic velocity (S’), tricuspid annular plane systolic excursion (TAPSE), , pulmonary arterial systolic pressure (PASP), left ventricular ejection fraction (LVEF), Left ventricular end-diastolic diameter (LVEDD) and tricuspid regurgitation.The continuous-wave Doppler signal of tricuspid regurgitation corresponded to the RV-RA pressure gradient, with PASP calculated as the sum of estimated right atrial pressure and the peak RV-RA pressure gradient derived from the tricuspid regurgitation peak velocity using the modified Bernoulli equation.
RV-PA coupling was noninvasively assessed using the RVFWLS/PASP ratio, RVGLS/PASP ratio, and TAPSE/PASP ratio[13,14]. RV global longitudinal strain (RVGLS) was calculated as the average of six RV segments (basal, mid, and apical segments of both the free wall and septum), whereas RV free wall longitudinal strain (RVFWLS) was derived from the average of three RV free wall segments (basal, mid, and apical segments). Both RVFWLS and RVGLS were expressed as absolute values rather than negative values to avoid confusion[15]. TAPSE was measured by M-mode echocardiography with the cursor optimally aligned along the direction of the lateral tricuspid annulus in the apical four-chamber view.

2.4. Risk Assessment Models

The COMPERA 2.0 four-strata model was applied as described by Boucly et al.[16], utilizing WHO-FC, 6MWD, and NT-proBNP levels for evaluation. Each variable was assigned a score, and the average was calculated by dividing the sum of all scores by the number of variables, then rounded to the next integer to determine the risk stratum. The French Pulmonary Hypertension Risk Score[17] determined risk stratification by calculating the number of variables achieving low-risk criteria. The REVEAL Lite 2 risk model was implemented according to Benza et al.[18], integrating NT-proBNP, 6MWD, WHO-FC, and estimated glomerular filtration rate for comprehensive assessment.

2.5. Statistical Analysis

Continuous variables following normal distribution were presented as mean ± standard deviation, while those with non-normal distribution were described using median (interquartile range). Categorical variables were expressed as frequencies and percentages. Group comparisons for normally distributed continuous variables were performed using Welch's t-test or ANOVA, and non-normally distributed continuous variables were compared with Wilcoxon rank-sum test or Kruskal-Wallis test. Categorical variables were compared between groups using Fisher's exact test when expected frequencies were below 5; otherwise, the chi-square test was applied. The Spearman correlation coefficient was used to assess relationships between RVFWLS/PASP levels and hemodynamic or laboratory variables.
Univariate Cox proportional hazards analysis was employed to evaluate the prognostic value of each variable for event-free survival. Multivariate models were developed to compare the prognostic capacity of RVFWLS/PASP levels against other significant parameters identified in univariate analysis. The optimal cutoff value of RVFWLS/PASP for predicting adverse events was determined by generating receiver operating characteristic (ROC) curves. Survival analysis was conducted using the Kaplan-Meier method with comparisons by log-rank test. A two-sided p-value < 0.05 was considered statistically significant for all analyses. All computations were performed using R software (version 4.2.2) and SPSS 27.0 (Statistical Package for the Social Sciences, Chicago, IL, USA).

3. Results

This section may be divided by subheadings. It should provide a concise and precise description of the experimental results, their interpretation, as well as the experimental conclusions that can be drawn.

3.1. Baseline Characteristics

A total of 216 patients with PH were included in this study (Table 1). The cohort comprised 88 (40.7%) with IPAH, 65 (30.1%) with CTEPH, and 63 (29.2%) with CTD-PH. Among all participants, 170 (78.7%) were male, 99 (50.5%) were in WHO Functional Class III, demonstrating impaired exercise capacity and severe hemodynamic profiles of PH. Baseline echocardiography revealed significant RV-PA uncoupling, reduced RV systolic function, and chamber dilation. Most patients presented with mild to moderate tricuspid regurgitation.

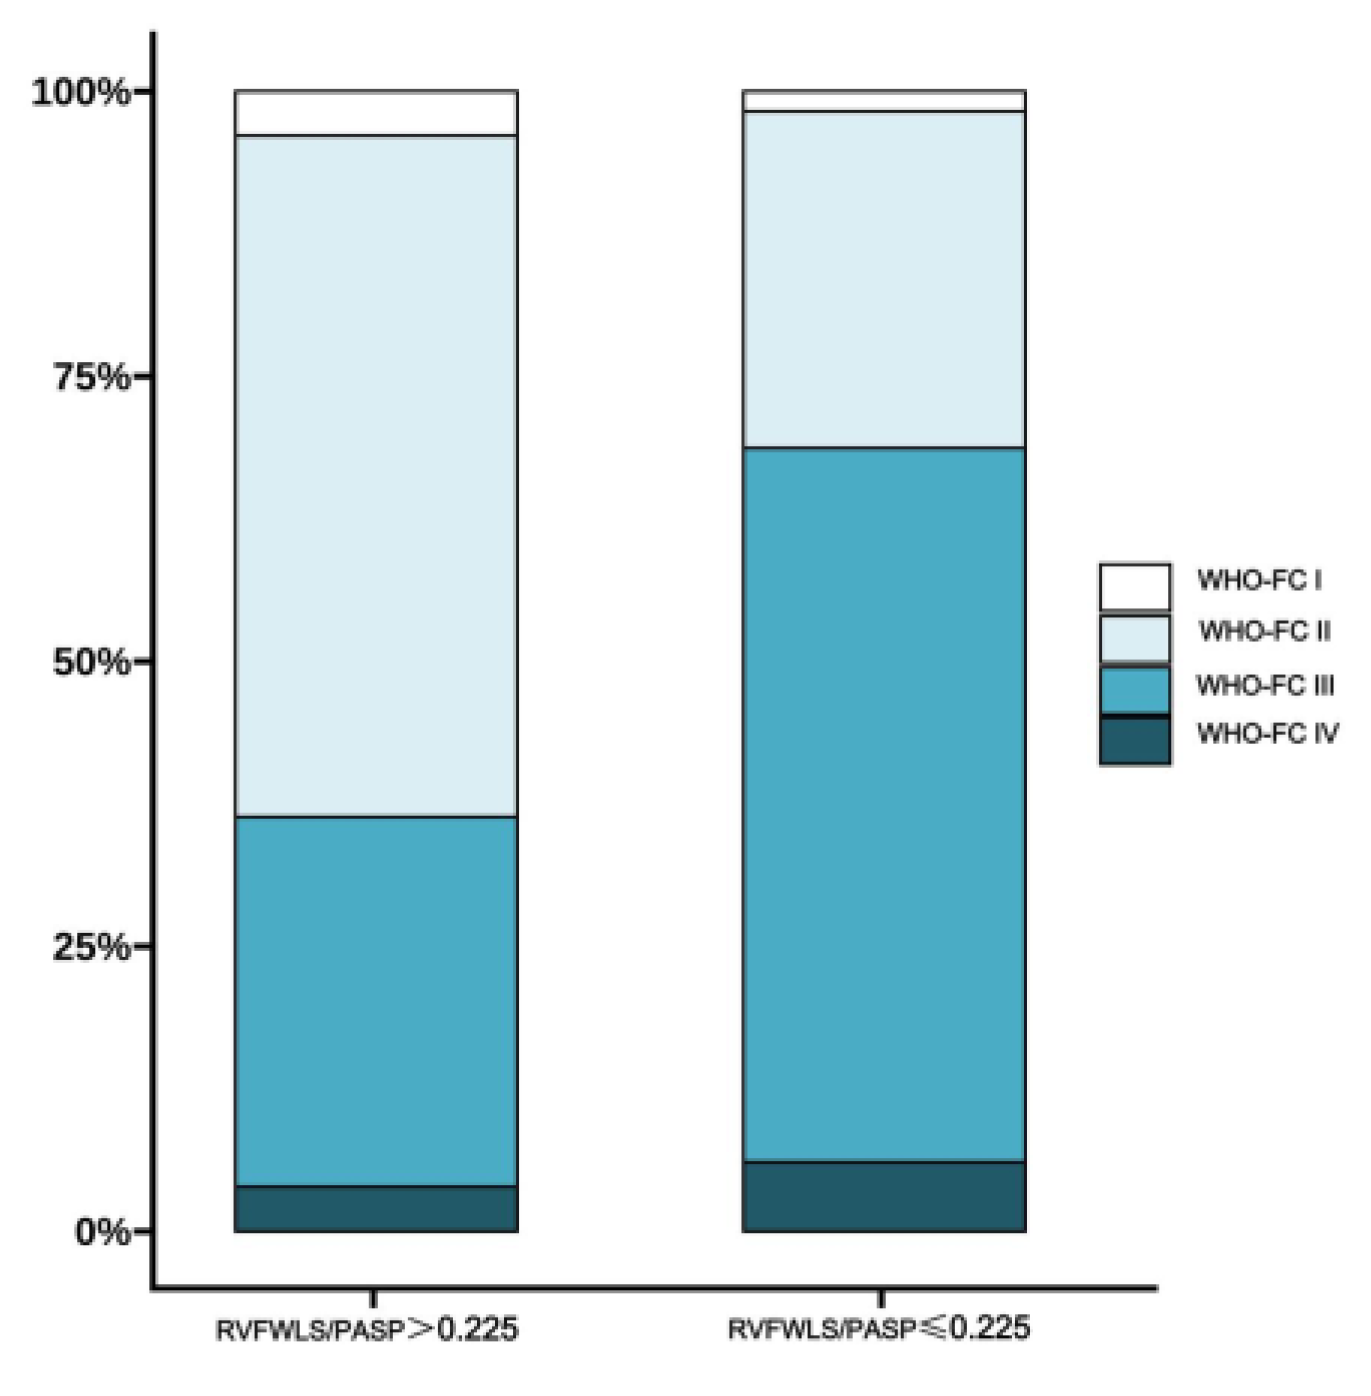
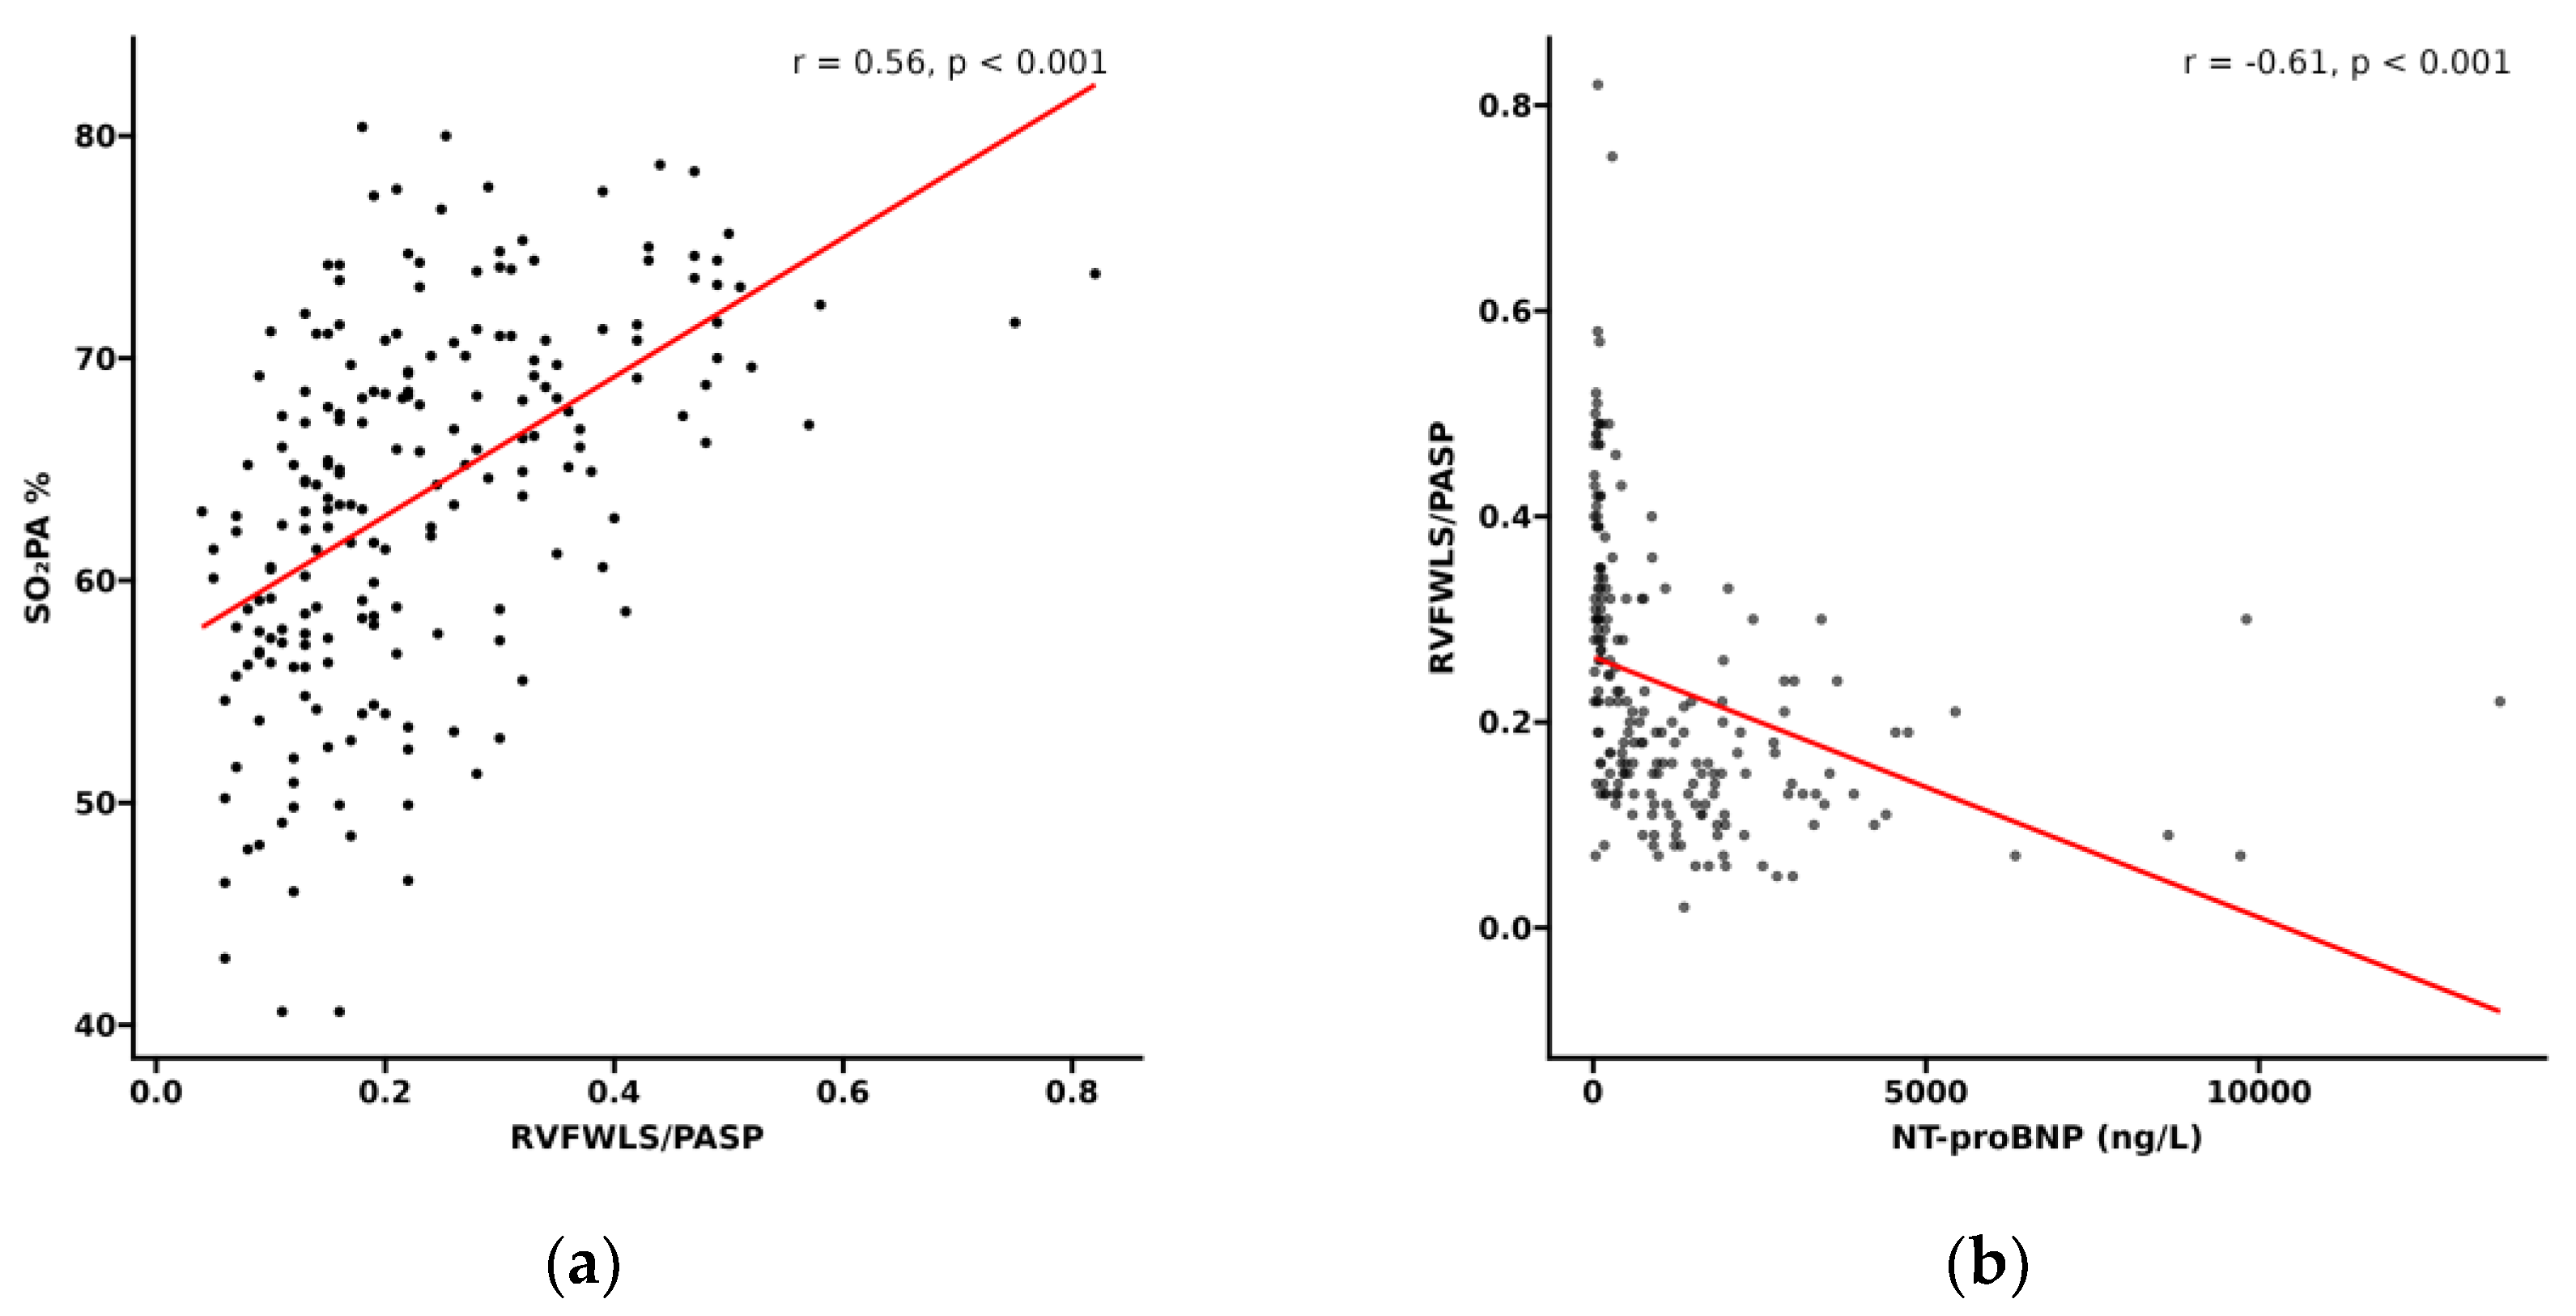
3.2. Relationship Between RVFWLS/PASP and Functional Status in PH Patients

Based on ROC analysis, 127 patients (60%) were classified into the low RVFWLS/PASP group (≤0.225) and 85 into the high RVFWLS/PASP group (>0.225) (Table 2). Compared to the high-ratio group, patients with low RVFWLS/PASP demonstrated significantly impaired exercise capacity and right ventricular function, reflected in reduced 6MWD (363 m vs. 445 m, p < 0.001), elevated NT-proBNP (1206 pg/mL vs. 113 pg/mL, p < 0.001), and consistently poorer echocardiographic parameters including RVGLS/PASP (0.13 vs. 0.30), TAPSE/PASP (0.20 vs. 0.35), TAPSE (16 mm vs. 19 mm), and FAC (19% vs. 31%) (all p < 0.001). The low-ratio group also exhibited more severe tricuspid regurgitation and right heart dilation, with larger RA area (20 cm² vs. 16 cm²), higher LV-EId (1.37 vs. 1.07), and smaller LVEDD (3.70 cm vs. 4.26 cm) despite higher LVEF (77% vs. 73%, p = 0.002). Hemodynamically, these patients had elevated mean pulmonary arterial pressure (mPAP) (53 mmHg vs. 40 mmHg) and pulmonary vascular resistance (PVR) (11.4 WU vs. 6.3 WU), alongside reduced cardiac index (2.50 vs. 3.17 L/min/m²) and pulmonary artery oxygen saturation (61% vs. 69%) (all p < 0.001). No significant differences were found in diagnostic subtype, sex, age, or BMI between groups. (Figure 1) It illustrates predominant WHO FC III distribution in the low-ratio group (62.6%) versus WHO FC II predominance in the high-ratio group (59.7%), while correlation analysis (Figure 2) shows RVFWLS/PASP significantly correlated with NT-proBNP (r = -0.61) and pulmonary artery oxygen saturation (r = 0.56) (both p < 0.001).

3.3. Follow-up Results

135 patients (62.5%) experienced disease progression during the 31-month follow-up period(Table 3) . Compared to the remaining 81 patients, the progression group had a significantly higher proportion of CTD-PH (40.0% vs. 11.1%, p < 0.001) and more severe baseline impairments, including markedly elevated NT-proBNP levels (median 903 vs. 241 pg/mL, p < 0.001), significantly reduced RV-PA coupling parameters (RVFWLS/PASP: 0.18 vs. 0.26; RVGLS/PASP: 0.16 vs. 0.23; TAPSE/PASP: 0.23 vs. 0.28; all p < 0.001), higher LV-EId (1.30 vs. 1.14, p < 0.001), smaller LVEDD (3.83 ± 0.69 vs. 4.09 ± 0.74 cm, p = 0.011), elevated mPAP (49 ± 13 vs. 45 ± 14 mmHg, p = 0.033), increased PVR (9.9 vs. 8.0 Wood units, p = 0.012), and lower pulmonary capillary wedge pressure (6.0 vs. 8.0 mmHg, p = 0.020).

3.4. Association Between RVFWLS/PASP and Long-term Outcomes in PAH

As shown in the survival curves (Figure 3A), patients with high RVFWLS/PASP achieved significantly better long-term survival compared to those with low RVFWLS/PASP (log-rank p = 0.01). The cumulative survival rates at 1, 3, and 5 years were 68%, 60%, and 41% in the high RVFWLS/PASP group, versus 66%, 32%, and 20% in the low RVFWLS/PASP group, respectively.
Cox regression models were used to evaluate the predictive value of RVFWLS/PASP for adverse outcomes. Univariate analysis (Figure 4) identified RVFWLS/PASP, CTD-PH subtype, NT-proBNP, and TAPSE/PASP as significant prognostic indicators (all p < 0.05). Each 1-unit increase in RVFWLS/PASP was associated with an 84% reduction in the risk of adverse events (HR = 0.16, 95% CI: 0.04-0.68, p = 0.013). Variables with p < 0.05 in the univariate Cox analysis were subsequently included in the multivariate model. After adjustment, both RVFWLS/PASP and CTD-PH subtype remained independent predictors. Each 1-unit increase in RVFWLS/PASP corresponded to an 80% decrease in adverse event risk (HR = 0.20, 95% CI: 0.04-0.92, p = 0.039), while CTD-PH subtype was associated with a significantly increased risk (HR = 2.09, 95% CI: 1.36-3.22, p < 0.001).

3.5. Incremental Value of RVFWLS/PASP in Predicting All-Cause Mortality

Upon integrating RVFWLS/PASP as a binary variable into three established risk models (French non-invasive, REVEAL Lite 2, and COMPERA 2.0) for Kaplan-Meier survival analysis, the results consistently demonstrated a stratified prognostic pattern. Across all models, patients who simultaneously met the criteria for high RVFWLS/PASP and the respective model's low-risk category exhibited the most favorable prognosis. In contrast, those with both low RVFWLS/PASP and intermediate-to-high risk according to the respective model had the poorest outcomes. Patients meeting only one of these two criteria consistently showed intermediate survival.
Specifically, in the French non-invasive model (Figure 3B), the best combination group (high RVFWLS/PASP + low-risk) had 1-, 3-, and 5-year survival rates all at 67.5%, whereas the worst combination group (low RVFWLS/PASP + intermediate-high risk) showed rates of 64.8%, 29.2%, and 15.7%, respectively. In the REVEAL Lite 2 model (Figure 3C), the best combination group (high RVFWLS/PASP + low-risk) achieved survival rates of 71%, 66%, and 48% at 1, 3, and 5 years, respectively, while the worst combination group (low RVFWLS/PASP + intermediate-high risk) had rates of 62.3%, 29.8%, and 17.1%. Under the COMPERA 2.0 model (Figure 3D), the best combination group (high RVFWLS/PASP + low-risk) demonstrated survival rates of 67.9%, 61.6%, and 52.8%, and the worst combination group (low RVFWLS/PASP + non-low risk) showed rates of 62.8%, 29.2%, and 15.7% for the same time points. Across all models, the group meeting only one criterion consistently exhibited intermediate survival rates, with specific values varying slightly between models.

4. Discussion

Echocardiographic assessment of RV-PA coupling serves as a robust predictor of adverse outcomes in PH. RVFWLS/PASP derived from two-dimensional speckle-tracking echocardiography, enables monitoring of RV free wall deformation and represents a more sensitive indicator for evaluating RV function. Our study yielded four principal findings: (1) RVFWLS/PASP emerged as a strong independent predictor of adverse outcomes; (2) RVFWLS/PASP remained statistically significant in multivariate models incorporating CTD-PH diagnostic category, whereas RVGLS/PASP and TAPSE/PASP did not; (3) RVFWLS/PASP provided significant incremental predictive value to established prognostic scores including the French noninvasive low-risk criteria, REVEAL Lite 2, and COMPERA 2.0; and (4) RVFWLS/PASP ≤ 0.225 was identified as a potential cutoff for predicting adverse events.
The rationale for investigating RVFWLS/PASP lies in the biological significance of RVFWLS as a sensitive measure of RV function, providing precise quantification of myocardial fiber deformation. Under pathological conditions, reduced RVFWLS reflects exhaustion of RV contractile reserve, a change that often precedes abnormalities in conventional functional parameters such as TAPSE and FAC[19]. By correcting for afterload using PASP, the RV function is uncoupled from the influence of pulmonary pressure, providing a more precise representation of RV-PA coupling status[20]. A study by Ancona et al. found that significantly reduced RVFWLS/PASP ratios in patients with severe tricuspid regurgitation were strongly associated with baseline clinical right heart failure (p = 0.03)[21]. Consequently, we established 0.225 as the prognostic cutoff for RVFWLS/PASP through ROC analysis. This threshold effectively discriminated survival rates, with 1-, 3-, and 5-year survival rates of 65.9%, 31.7%, and 19.5% for RVFWLS/PASP ≤ 0.225 versus 67.8%, 60.3%, and 40.8% for RVFWLS/PASP > 0.225. This cutoff represents the tipping point of exhausted RV contractile reserve. Below this threshold, patients exhibited significantly reduced exercise capacity and cardiac index, alongside elevated mean pulmonary arterial pressure and pulmonary vascular resistance, indicating inadequate compensation of RV longitudinal contraction for increased pulmonary arterial pressure and manifest mechanical inefficiency[22]. However, existing evidence demonstrates threshold variability of RVFWLS/PASP across PH subtypes[23], necessitating future studies with detailed subgroup analyses for each PH category.
Previous research indicated that RVFWLS did not demonstrate significant advantages over other parameters in Group 1 PH patients[24]. However, our multivariate Cox regression analysis identified CTD-PH diagnostic category (HR = 2.09, 95% CI: 1.36-3.22, p < 0.001) and RVFWLS/PASP ratio (HR = 0.20, 95% CI: 0.04-0.92, p = 0.039) as significant independent predictors. Notably, despite also incorporating CTD-PH diagnosis, TAPSE/PASP and RVGLS/PASP ratios failed to demonstrate independent prognostic value. This underscores the superior capability of RVFWLS/PASP in providing independent prognostic information compared to TAPSE/PASP and RVGLS/PASP ratios. This advantage may stem from the unique "double-hit" mechanism in CTD-PAH: patients experience both pressure overload common to PAH and direct damage from systemic autoimmunity and inflammation[25]. This dual injury preferentially causes fibrosis in the RV free wall, characterized by cardiomyocyte hypertrophy, collagen proliferation, and structural remodeling[26]. RVGLS represents global average strain, potentially diluted by relatively preserved septal strain, while TAPSE fails to capture contraction in mid and apical free wall segments—regions particularly vulnerable to dysfunction under pressure overload. Consequently, in heterogeneous PAH populations, especially those including CTD-PH prone to free wall involvement, RVFWLS/PASP more specifically and sensitively reflects RV function-afterload uncoupling directly associated with prognosis than RVGLS/PASP or TAPSE/PASP.
Although RVFWLS/PASP demonstrates strong predictive potential for PH[27], it has not yet been incorporated into risk stratification frameworks. Existing risk models such as the French PH registry permit use of three noninvasive variables (WHO FC, 6MWD, and BNP/NT-proBNP) to define low-risk status. However, whether adding other noninvasive modalities like echocardiography could further enhance prognostic utility remains unclear. Similarly, COMPERA and REVEAL Lite 2.0 scores primarily rely on clinical and functional assessments while lacking direct evaluation of cardiac structure and function. Recently, Monica et al. reported that RVFWLS/PASP could differentiate between moderate and severe RV dysfunction, thereby refining risk assessment[28]. Notably, in our study, RVFWLS/PASP enabled further stratification of low-risk patients as classified by the French noninvasive, COMPERA, and REVEAL Lite 2.0 scores. Among patients deemed low-risk by conventional models, those with high RVFWLS/PASP exhibited superior 1-, 3-, and 5-year survival compared to low RVFWLS/PASP patients. Therefore, our findings suggest that integrating echocardiographic RVFWLS/PASP with the French noninvasive criteria, COMPERA, and REVEAL Lite 2.0 scores would yield superior predictive models for adverse outcomes in PH patients.

Study Limitations

This study has several limitations. First, its retrospective design and moderate sample size may introduce potential selection bias. Second, variations in treatment strategies during follow-up could have influenced outcomes. Additionally, the applicability of the French noninvasive low-risk criteria, COMPERA, and REVEAL Lite 2.0 scores in non-Group 1 pulmonary hypertension patients remains controversial[29]. Finally, the quantification of RV function by echocardiography is inherently limited by inter-observer variability.

5. Conclusions

In summary, our study demonstrates that RVFWLS/PASP serves as an independent predictor of long-term prognosis in adults with PH. The prognostic utility of RVFWLS/PASP varies across clinical classifications, showing particular advantage in patients with CTD-PH. Furthermore, RVFWLS/PASP provides incremental predictive value to existing prognostic scoring models, highlighting the importance of assessing right ventricle–pulmonary artery coupling in PH risk stratification. External validation in independent, larger, multicenter prospective cohorts is warranted in the future.

Author Contributions

H.B. prepared an initial draft of the manuscript. H.B. and Q.Z. were major contributors to the collection, interpretation, and analysis of information. H.B., Q.Z., F.J., L.W., Y.H., H.Q., C.L., P.G. and K.L. were responsible for the acquisition of patient data and played an important role in the management of follow-up. Q.Z. and X.D. provided constructive comments and suggestions, and revised the manuscript for important intellectual content. X.D. was the architect of the study and gave final approval for the manuscript submitted. All authors contributed to editorial changes in the manuscript. All authors have participated sufficiently in the work and agreed to be accountable for all aspects of the work. All authors have read and agreed to the published version of the manuscript.

Funding

This work was supported by a grant from the Henan Province Medical Science and Technology Research Program (LHGJ20240772) and the Nanyang City Science and Technology Program (24JCQY056).

Institutional Review Board Statement

The study was approved by the medical ethics committee of Nanyang Second General Hospital and strictly adhered to the Declaration of Helsinki. (protocol code 2024-LY053-01, approval date: 7 May 2024).

Informed Consent Statement

Informed consent was obtained from all subjects involved in the study.

Data Availability Statement

The datasets used and/or analyzed during the study are available from the corresponding author upon reasonable request.

Conflicts of Interest

The authors report no conflicts of interest in this work.

References

  1. Van Wolferen, S.A.; Marcus, J.T.; Boonstra, A.; Marques, K.M.; Bronzwaer, J.G.F.; Spreeuwenberg, M.D.; Postmus, P.; Vonk-Noordegraaf, A. Prognostic value of right ventricular mass, volume, and function in idiopathic pulmonary arterial hypertension. Eur. Heart J. 2007, 28, 1250–1257. [Google Scholar] [CrossRef] [PubMed]
  2. Sachdev, A.; Villarraga, H.R.; Frantz, R.P.; McGoon, M.D.; Hsiao, J.-F.; Maalouf, J.F.; Ammash, N.M.; McCully, R.B.; Miller, F.A.; Pellikka, P.A.; et al. Right ventricular strain for prediction of survival in patients with pulmonary arterial hypertension. Chest 2011, 139, 1299–1309. [Google Scholar] [CrossRef]
  3. Raymond, R.J.; Hinderliter, A.L.; Willis, P.W.; Ralph, D.; Caldwell, E.J.; Williams, W.; A Ettinger, N.; Hill, N.S.; Summer, W.R.; de Boisblanc, B.; et al. Echocardiographic predictors of adverse outcomes in primary pulmonary hypertension. JACC 2002, 39, 1214–1219. [Google Scholar] [CrossRef] [PubMed]
  4. Noordegraaf, A.V.; Chin, K.M.; Haddad, F.; Hassoun, P.M.; Hemnes, A.R.; Hopkins, S.R.; Kawut, S.M.; Langleben, D.; Lumens, J.; Naeije, R. Pathophysiology of the right ventricle and of the pulmonary circulation in pulmonary hypertension: an update. Eur. Respir. J. 2019, 53, 1801900. [Google Scholar] [CrossRef] [PubMed]
  5. Tunariu, N.; Gibbs, S.J.; Win, Z.; Gin-Sing, W.; Graham, A.; Gishen, P.; Al-Nahhas, A. Ventilation-perfusion scintigraphy is more sensitive than multidetector CTPA in detecting chronic thromboembolic pulmonary disease as a treatable cause of pulmonary hypertension. J. Nucl. Med. 2007, 48, 680–684. [Google Scholar] [CrossRef]
  6. Hoey, E.T.D.; Mirsadraee, S.; Pepke-Zaba, J.; Jenkins, D.P.; Gopalan, D.; Screaton, N.J. Dual-energy CT angiography for assessment of regional pulmonary perfusion in patients with chronic thromboembolic pulmonary hypertension: initial experience. Am. J. Roentgenol. 2011, 196, 524–532. [Google Scholar] [CrossRef]
  7. Humbert, M.; Kovacs, G.; Hoeper, M.M.; Badagliacca, R.; Berger, R.M.; Brida, M.; Carlsen, J.; Coats, A.J.; Escribano-Subias, P.; Ferrari, P.; et al. 2022 ESC/ERS Guidelines for the diagnosis and treatment of pulmonary hypertension. Eur. Respir. J. 2023, 61, 2200879. [Google Scholar] [CrossRef]
  8. Stolfo, D.; Albani, S.; Biondi, F.; De Luca, A.; Barbati, G.; Howard, L.; Giudice, F.L.; Tsampasian, V.; Pasanisi, E.M.; Airò, E.; et al. Global Right Heart Assessment with Speckle-Tracking Imaging Improves the Risk Prediction of a Validated Scoring System in Pulmonary Arterial Hypertension. J. Am. Soc. Echocardiogr. 2020, 33, 1334–1344.e2. [Google Scholar] [CrossRef]
  9. Galiè, N.; Hoeper, M.M.; Humbert, M.; Torbicki, A.; Vachiery, J.-L.; Barbera, J.A.; Beghetti, M.; Corris, P.; Gaine, S.; Gibbs, J.S.; et al. Guidelines for the diagnosis and treatment of pulmonary hypertension: The Task Force for the Diagnosis and Treatment of Pulmonary Hypertension of the European Society of Cardiology (ESC) and the European Respiratory Society (ERS), endorsed by the International Society of Heart and Lung Transplantation (ISHLT). Eur. Hear. J. 2009, 30, 2493–2537. [Google Scholar] [CrossRef]
  10. Galié, N.; Humbert, M.; Vachiéry, J.-L.; Gibbs, S.; Lang, I.; Torbicki, A.; Simonneau, G.; Peacock, A.; Noordegraaf, A.V.; Beghetti, M.; et al. 2015 ESC/ERS Guidelines for the diagnosis and treatment of pulmonary hypertension: The Joint Task Force for the Diagnosis and Treatment of Pulmonary Hypertension of the European Society of Cardiology (ESC) and the European Respiratory Society (ERS): Endorsed by: Association for European Paediatric and Congenital Cardiology (AEPC), International Society for Heart and Lung Transplantation (ISHLT). Eur. Respir. J. 2015, 46, 903–975. [Google Scholar] [CrossRef]
  11. Rudski, L.G.; Lai, W.W.; Afilalo, J.; Hua, L.; Handschumacher, M.D.; Chandrasekaran, K.; Solomon, S.D.; Louie, E.K.; Schiller, N.B. Guidelines for the echocardiographic assessment of the right heart in adults: a report from the American Society of Echocardiography endorsed by the European Association of Echocardiography, a registered branch of the European Society of Cardiology, and the Canadian Society of Echocardiography. J. Am. Soc. Echocardiogr. 2010, 23, 685–713. [Google Scholar] [CrossRef]
  12. Raymond, R.J.; Hinderliter, A.L.; Willis, P.W.; Ralph, D.; Caldwell, E.J.; Williams, W.; A Ettinger, N.; Hill, N.S.; Summer, W.R.; de Boisblanc, B.; et al. Echocardiographic predictors of adverse outcomes in primary pulmonary hypertension. JACC 2002, 39, 1214–1219. [Google Scholar] [CrossRef]
  13. Fortuni, F.; Butcher, S.C.; Dietz, M.F.; van der Bijl, P.; Prihadi, E.A.; De Ferrari, G.M.; Marsan, N.A.; Bax, J.J.; Delgado, V. Right Ventricular–Pulmonary Arterial Coupling in Secondary Tricuspid Regurgitation. Am. J. Cardiol. 2021, 148, 138–145. [Google Scholar] [CrossRef]
  14. Ünlü, S.; Bézy, S.; Cvijic, M.; Duchenne, J.; Delcroix, M.; Voigt, J.-U. Right ventricular strain related to pulmonary artery pressure predicts clinical outcome in patients with pulmonary arterial hypertension. Eur. Hear. J. - Cardiovasc. Imaging 2022, 24, 635–642. [Google Scholar] [CrossRef] [PubMed]
  15. Muraru, D.; Onciul, S.; Peluso, D.; Soriani, N.; Cucchini, U.; Aruta, P.; Romeo, G.; Cavalli, G.; Iliceto, S.; Badano, L.P. Sex- and Method-Specific Reference Values for Right Ventricular Strain by 2-Dimensional Speckle-Tracking Echocardiography. Circ. Cardiovasc. Imaging 2016, 9, e003866. [Google Scholar] [CrossRef] [PubMed]
  16. Boucly, A.; Weatherald, J.; Savale, L.; de Groote, P.; Cottin, V.; Prévot, G.; Chaouat, A.; Picard, F.; Horeau-Langlard, D.; Bourdin, A.; et al. External validation of a refined four-stratum risk assessment score from the French pulmonary hypertension registry. Eur. Respir. J. 2022, 59, 2102419. [Google Scholar] [CrossRef] [PubMed]
  17. Boucly, A.; Weatherald, J.; Savale, L.; Jaïs, X.; Cottin, V.; Prevot, G.; Picard, F.; de Groote, P.; Jevnikar, M.; Bergot, E.; et al. Risk assessment, prognosis and guideline implementation in pulmonary arterial hypertension. Eur. Respir. J. 2017, 50, 1700889. [Google Scholar] [CrossRef] [PubMed]
  18. Benza, R.L.; Kanwar, M.K.; Raina, A.; Scott, J.V.; Zhao, C.L.; Selej, M.; Elliott, C.G.; Farber, H.W. Development and Validation of an Abridged Version of the REVEAL 2.0 Risk Score Calculator, REVEAL Lite 2, for Use in Patients With Pulmonary Arterial Hypertension. Chest 2021, 159, 337–346. [Google Scholar] [CrossRef]
  19. Hinojar, R.; Zamorano, J.L.; Gómez, A.G.; García-Martin, A.; Monteagudo, J.M.; Lunar, I.G.; Recalde, A.S.; Fernández-Golfín, C. Prognostic Impact of Right Ventricular Strain in Isolated Severe Tricuspid Regurgitation. J. Am. Soc. Echocardiogr. 2023, 36, 615–623. [Google Scholar] [CrossRef]
  20. Hădăreanu, C.-D.; Hădăreanu, D.-R.; Toader, D.-M.; Iovănescu, M.-L.; Florescu, C.; Raicea, V.-C.; Donoiu, I. Prognostic value of the ratio between right ventricular free wall longitudinal strain and systolic pulmonary artery pressure in patients with heart failure with reduced ejection fraction and ventricular secondary mitral regurgitation. Front. Cardiovasc. Med. 2025, 12, 1611772. [Google Scholar] [CrossRef]
  21. Ancona, F.; Margonato, D.; Menzà, G.; Bellettini, M.; Melillo, F.; Stella, S.; Capogrosso, C.; Ingallina, G.; Biondi, F.; Boccellino, A.; et al. Ratio between right ventricular longitudinal strain and pulmonary arterial systolic pressure: A novel prognostic parameter in patients with severe tricuspid regurgitation. Int. J. Cardiol. 2023, 384, 55–61. [Google Scholar] [CrossRef]
  22. Jani, V.P.; Strom, J.B.; Gami, A.; Beussink-Nelson, L.; Patel, R.; Michos, E.D.; Shah, S.J.; Freed, B.H.; Mukherjee, M. Optimal Method for Assessing Right Ventricular to Pulmonary Arterial Coupling in Older Healthy Adults: The Multi-Ethnic Study of Atherosclerosis. Am. J. Cardiol. 2024, 222, 11–19. [Google Scholar] [CrossRef]
  23. Zhang, Y.; Li, Y.; Lin, Y.; Xie, M.; Zhang, L.; Sun, W.; Deng, W.; Zhao, R.; Shi, J.; Li, W.; et al. Association of Glycemic Control With Right Ventricular Function Assessed by Two-Dimensional Speckle-Tracking and Three-Dimensional Echocardiography in Type 2 Diabetes Mellitus. J. Am. Soc. Echocardiogr. 2024, 37, 1156–1166. [Google Scholar] [CrossRef]
  24. Nabeshima, Y.; Kitano, T.; Node, K.; Takeuchi, M. Prognostic value of right ventricular free-wall longitudinal strain in patients with pulmonary hypertension: systematic review and meta-analyses. Open Hear. 2024, 11, e002561. [Google Scholar] [CrossRef] [PubMed]
  25. Zanatta, E.; Polito, P.; Famoso, G.; Larosa, M.; De Zorzi, E.; Scarpieri, E.; Cozzi, F.; Doria, A. Pulmonary arterial hypertension in connective tissue disorders: Pathophysiology and treatment. Exp. Biol. Med. 2019, 244, 120–131. [Google Scholar] [CrossRef]
  26. Avazmohammadi, R.; Mendiola, E.A.; Li, D.S.; Vanderslice, P.; Dixon, R.A.F.; Sacks, M.S. Interactions Between Structural Remodeling and Hypertrophy in the Right Ventricle in Response to Pulmonary Arterial Hypertension. J. Biomech. Eng. 2019, 141, 0910161–09101613. [Google Scholar] [CrossRef]
  27. Mukherjee, M.; Mathai, S.C.; Jellis, C.; Freed, B.H.; Yanek, L.R.; Agoglia, H.; Chiu, C.; Jani, V.P.; Simpson, C.E.; Brittain, E.L.; et al. Defining Echocardiographic Degrees of Right Heart Size and Function in Pulmonary Vascular Disease From the PVDOMICS Study. Circ. Cardiovasc. Imaging 2024, 17. [Google Scholar] [CrossRef]
  28. Mukherjee, M.; Jani, V.P.; Osgueritchian, R.; Mombeini, H.; Abidov, A.; Beck, G.; Erzurum, S.; Frantz, R.P.; Hassoun, P.M.; Hemnes, A.R.; et al. Echocardiographic Parameters and Risk Prediction in Pulmonary Arterial Hypertension: Insights From the Redefining Pulmonary Hypertension Through Pulmonary Vascular Disease Phenomics Network. Chest 2025, 168, 502–519. [Google Scholar] [CrossRef] [PubMed]
  29. Reddy, Y.N.; Dubrock, H.; Hassoun, P.M.; Hemnes, A.; Horn, E.; Leopold, J.A.; Rischard, F.; Rosenzweig, E.B.; Hill, N.S.; Erzurum, S.C.; et al. Non-invasive prediction of pulmonary vascular disease-related exercise intolerance and survival in non-group 1 pulmonary hypertension. Eur. J. Hear. Fail. 2024, 26, 2323–2336. [Google Scholar] [CrossRef] [PubMed]
Figure 1. WHO FC in different RVFWLS/PASP group.
Preprints 185478 g001
Figure 2. Correlation Analysis Between RVFWLS/PASP and Right Heart Function: (a) Correlation Between RVFWLS/PASP and SO2PA; (b) Correlation Between RVFWLS/PASP and NT-proBNP.
Preprints 185478 g002
Figure 3. Survival curve of patients with pulmonary hypertension : (A) Survival in Patients With PAH According to RVFWLS/PASP; (B), (C) and (D) Incremental Prognostic Value of RVFWLS/PASP Beyond the Conventional Risk Model. French non-invasive, French Non-Invasive Risk Score for Pulmonary Arterial Hypertension; REVEAL=Registry to EValuate Early And Long-term pulmonary arterial hypertension; COMPERA=Comparative, Prospective Registry of Newly Initiated Therapies for Pulmonary Hypertension.
Preprints 185478 g003
Figure 4. Forest Plot of Univariate and Multivariable Hazard Ratios.IPAH, idiopathic pulmonary arterial hypertension;CTEPH,chronic thromboembolic pulmonary hypertension;CTD-PH,connective tissue disease-associated pulmonary hypertension;BMI, body mass index; 6MWD, 6 minute walking distance; NT proBNP, N-terminal pro-B-type natriuretic peptide; RVFWLS/PASP,the RV free wall longitudinal strain to PASP ratio;TAPSE/PASP,the tricuspid annular plane systolic excursion to PASP ratio; TAPSE, tricuspid anular plane systolic excursion; PVR, pulmonary vascular resistance;CI, cardiac index.
Preprints 185478 g004
Table 1. Patient demographics and baseline characteristics.
Characteristic N = 216
Diagnosis, n (%)
IPAH 88 (40.7%)
CTEPH 65 (30.1%)
CTD-PH 63 (29.2%)
SEX, n (%)
Male 46 (21.3%)
Female 170 (78.7%)
Age,years 45 (32, 61)
BMI, kg/m2 22.5 ± 3.5
WHO-FC, n (%)
Class I 5 (2.6%)
Class II 82 (41.8%)
Class III 99 (50.5%)
Class IV 10 (5.1%)
6MWD, m 405 (320, 470)
NT-proBNP, ng/L 508 (113, 1,630)
RVFWLS/PASP 0.19 (0.13, 0.31)
TAPSE/PASP 0.25 (0.18, 0.34)
RVGLS/PASP 0.18 (0.12, 0.28)
TR Severity, n (%)
Trace 25 (12.8%)
Mild 82 (42.3%)
Moderate 38 (19.6%)
Severe 49 (25.3%)
TAPSE,mm 17.0 (15.0, 20.0)
FAC, % 23 (16, 32)
RA area, cm2 18 (14, 22)
RVMD, cm 3.40 (2.90, 4.00)
LV-EId 1.24 (1.08, 1.46)
LVEDD, cm 3.92 ± 0.72
LVEF,% 75 (68, 82)
E/e' 6.43 (4.80, 8.22)
mPAP, mmHg 47 ± 14
PAWP, mmHg 7.0 (4.0, 10.0)
PVR, Woods units 9.2 (6.3, 13.4)
CI, L/min/m2 2.80 (2.23, 3.29)
Data are presented as mean ±standard deviation, median (range) or number (percentage).IPAH, idiopathic pulmonary arterial hypertension;CTEPH,chronic thromboembolic pulmonary hypertension;CTD-PH,connective tissue disease-associated pulmonary hypertension;BMI, body mass index;WHO-FC, World Health Organization functional class; 6MWD, 6 minute walking distance; NT proBNP, N-terminal pro-B-type natriuretic peptide; RVFWLS/PASP,the RV free wall longitudinal strain to PASP ratio;TAPSE/PASP,the tricuspid annular plane systolic excursion to PASP ratio;RVGLS/PASP ,the RV global longitudinal strain to PASP ratio;TR Severity,Tricuspid Regurgitation Severity; TAPSE, tricuspid anular plane systolic excursion;FAC, RV fractional area change;RA area, right atrium area;RVMD, right ventricular mid diameter; LV-EId, left ventricular end-diastolic eccentricity index;LVEDD,left ventricular end-diastolic diameter; LVEF, left ventricular ejection fraction;E/e',Ratio of early diastolic mitral inflow velocity to early diastolic mitral annular tissue velocity;mPAP, mean pulmonary arterial pressure;PAWP, pulmonary arterial wedge pressure;PVR, pulmonary vascular resistance;CI, cardiac index.
Table 2. Baseline Characteristics Stratified by RVFWLS / PASP Ratio.
Characteristic RVFWLS/PASP
>0.225
N = 85
RVFWLS/PASP
≤0.225
N = 127
p-value
Diagnosis, n (%) 0.639
IPAH 32 (37.6%) 55 (43.3%)
CTEPH 28 (32.9%) 35 (27.6%)
CTD-PH 25 (29.4%) 37 (29.1%)
SEX, n (%) 0.242
Male 15 (17.6%) 31 (24.4%)
Female 70 (82.4%) 96 (75.6%)
Age,years 43 (34, 60) 45 (31, 62) 0.733
BMI, kg/m2 22.9 ± 3.3 22.2 ± 3.7 0.174
WHO-FC, n (%) <0.001
Class I 3 (3.9%) 2 (1.7%)
Class II 46 (59.7%) 34 (29.6%)
Class III 25 (32.5%) 72 (62.6%)
Class IV 3 (3.9%) 7 (6.1%)
6MWD, m 445 (400, 510) 363 (275, 435) <0.001
NT-proBNP, ng/L 113 (70, 342) 1,206 (508, 1,973) <0.001
RVFWLS/PASP 0.33 (0.28, 0.42) 0.14 (0.11, 0.18) <0.001
RVGLS/PASP 0.30 (0.26, 0.40) 0.13 (0.10, 0.16) <0.001
TAPSE/PASP 0.35 (0.28, 0.45) 0.20 (0.16, 0.25) <0.001
TR Severity, n (%) <0.001
None 2 (2.7%) 1 (0.8%)
Trace 15 (20.5%) 7 (5.9%)
Mild 39 (53.4%) 40 (33.9%)
Moderate 10 (13.7%) 28 (23.7%)
Severe 7 (9.6%) 42 (35.6%)
TAPSE,mm 19.0 (17.0, 21.0) 16.0 (14.0, 18.4) <0.001
FAC, % 31 (21, 39) 19 (14, 26) <0.001
RA area, cm2 16 (11, 18) 20 (16, 24) <0.001
RVMD, cm 3.05 (2.50, 3.60) 3.70 (3.30, 4.20) <0.001
LV-EId 1.07 (1.00, 1.21) 1.37 (1.21, 1.56) <0.001
LVEDD, cm 4.26 ± 0.63 3.70 ± 0.67 <0.001
LVEF,% 73 (68, 77) 77 (71, 84) 0.002
E/e' 6.24 (4.65, 7.59) 6.60 (5.00, 8.60) 0.190
mPAP, mmHg 40 ± 11 53 ± 13 <0.001
PAWP, mmHg 7.5 (4.0, 10.0) 6.0 (4.0, 9.0) 0.231
PVR, Woods units 6.3 (4.6, 8.7) 11.4 (8.5, 16.4) <0.001
CI, L/min/m2 3.17 (2.74, 3.62) 2.50 (1.97, 2.97) <0.001
Data are presented as mean ± standard deviation, median (range) or number (percentage).IPAH, idiopathic pulmonary arterial hypertension;CTEPH,chronic thromboembolic pulmonary hypertension;CTD-PH,connective tissue disease-associated pulmonary hypertension;BMI, body mass index;WHO-FC, World Health Organization functional class; 6MWD, 6 minute walking distance; NT proBNP, N-terminal pro-B-type natriuretic peptide; RVFWLS/PASP,the RV free wall longitudinal strain to PASP ratio;TAPSE/PASP,the tricuspid annular plane systolic excursion to PASP ratio;RVGLS/PASP ,the RV global longitudinal strain to PASP ratio;TR Severity,Tricuspid Regurgitation Severity; TAPSE, tricuspid anular plane systolic excursion;FAC,RV fractional area change;RA area, right atrium area;RVMD, right ventricular mid diameter; LV-EId, left ventricular end-diastolic eccentricity index;LVEDD,left ventricular end-diastolic diameter; LVEF, left ventricular ejection fraction;E/e',Ratio of early diastolic mitral inflow velocity to early diastolic mitral annular tissue velocity;mPAP, mean pulmonary arterial pressure;PAWP, pulmonary arterial wedge pressure;PVR, pulmonary vascular resistance;CI, cardiac index.
Table 3. Baseline Characteristics According to Status of Clinical Deterioration During Follow-up.
Characteristic Non-Deterioration Group
N = 81
Deterioration Group
N = 135
p-value
Diagnosis, n (%) <0.001
IPAH 39 (48.1%) 49 (36.3%)
CTEPH 33 (40.7%) 32 (23.7%)
CTD-PH 9 (11.1%) 54 (40.0%)
SEX, n (%) 0.668
Male 16 (19.8%) 30 (22.2%)
Female 65 (80.2%) 105 (77.8%)
Age,years 48 (34, 68) 43 (32, 58) 0.027
BMI, kg/m2 22.8 ± 3.1 22.3 ± 3.7 0.268
WHO-FC, n (%) 0.833
Class I 2 (2.7%) 3 (2.5%)
Class II 32 (42.7%) 50 (41.3%)
Class III 36 (48.0%) 63 (52.1%)
Class IV 5 (6.7%) 5 (4.1%)
6MWD, m 410 (325, 475) 396 (320, 465) 0.600
NT-proBNP, ng/L 241 (78, 888) 903 (220, 1,949) <0.001
RVFWLS/PASP 0.26 (0.15, 0.35) 0.18 (0.12, 0.26) <0.001
RVGLS/PASP 0.23 (0.14, 0.34) 0.16 (0.11, 0.23) <0.001
TAPSE/PASP 0.28 (0.21, 0.37) 0.23 (0.17, 0.31) <0.001
TR Severity, n (%) 0.292
None 1 (1.4%) 2 (1.7%)
Trace 10 (13.5%) 12 (10.0%)
Mild 37 (50.0%) 45 (37.5%)
Moderate 11 (14.9%) 27 (22.5%)
Severe 15 (20.3%) 34 (28.3%)
TAPSE,mm 18.0 (16.0, 20.0) 17.0 (14.0, 19.8) 0.024
FAC, % 25 (17, 35) 22 (15, 31) 0.051
RA area, cm2 17 (13, 21) 18 (15, 24) 0.034
RVMD, cm 3.40 (2.70, 3.90) 3.50 (3.10, 4.10) 0.122
LV-EId 1.14 (1.00, 1.37) 1.30 (1.13, 1.50) <0.001
LVEDD, cm 4.09 ± 0.74 3.83 ± 0.69 0.011
LVEF,% 72 (66, 81) 76 (71, 82) 0.044
E/e' 6.90 (4.50, 9.10) 6.27 (4.91, 8.00) 0.403
mPAP, mmHg 45 ± 14 49 ± 13 0.033
PAWP, mmHg 8.0 (5.0, 11.0) 6.0 (4.0, 9.0) 0.020
PVR, Woods units 8.0 (5.4, 11.4) 9.9 (6.9, 13.7) 0.012
CI, L/min/m2 2.87 (2.39, 3.39) 2.67 (2.20, 3.23) 0.210
Data are presented as mean ± standard deviation, median (range) or number (percentage).IPAH, idiopathic pulmonary arterial hypertension;CTEPH,chronic thromboembolic pulmonary hypertension;CTD-PH,connective tissue disease-associated pulmonary hypertension;BMI, body mass index;WHO-FC, World Health Organization functional class; 6MWD, 6 minute walking distance; NT proBNP, N-terminal pro-B-type natriuretic peptide; RVFWLS/PASP,the RV free wall longitudinal strain to PASP ratio;TAPSE/PASP,the tricuspid annular plane systolic excursion to PASP ratio;RVGLS/PASP ,the RV global longitudinal strain to PASP ratio;TR Severity,Tricuspid Regurgitation Severity; TAPSE, tricuspid anular plane systolic excursion;FAC,RV fractional area change;RA area, right atrium area;RVMD, right ventricular mid diameter; LV-EId, left ventricular end-diastolic eccentricity index;LVEDD,left ventricular end-diastolic diameter; LVEF, left ventricular ejection fraction;E/e',Ratio of early diastolic mitral inflow velocity to early diastolic mitral annular tissue velocity;mPAP, mean pulmonary arterial pressure;PAWP, pulmonary arterial wedge pressure;PVR, pulmonary vascular resistance;CI, cardiac index.
Disclaimer/Publisher’s Note: The statements, opinions and data contained in all publications are solely those of the individual author(s) and contributor(s) and not of MDPI and/or the editor(s). MDPI and/or the editor(s) disclaim responsibility for any injury to people or property resulting from any ideas, methods, instructions or products referred to in the content.
Copyright: This open access article is published under a Creative Commons CC BY 4.0 license, which permit the free download, distribution, and reuse, provided that the author and preprint are cited in any reuse.
Prerpints.org logo

Preprints.org is a free preprint server supported by MDPI in Basel, Switzerland.

Subscribe

Disclaimer

Terms of Use

Privacy Policy

Privacy Settings

© 2025 MDPI (Basel, Switzerland) unless otherwise stated