
Submitted:
17 November 2025
Posted:
18 November 2025
You are already at the latest version
Abstract
Background: While anti-shock therapy provided early after hemorrhage may be beneficial, the problem of delivery of potential therapeutics to ischemic tissue has not been well-appreciated. Polydatin (PD) and 5-aminoimidazole-4-carboxamide 1-β-D-ribonucleoside (AICAR) alleviate mitochondrial dysfunction and acute renal injury (AKI) following resuscitation, but it is unclear whether PD or AICAR are still effective before resuscitation when drug delivery can be still impeded. Because a low volume of polyethylene glycol (PEG) improves tissue perfusion in rats following hemorrhagic shock, we hypothesized that either PD or AICAR, when administered in combination with PEG, will be more effective on restoring hemodynamic function and mitochondrial function than when either drug is administered without PEG.
Methods: Rats were randomized into 6 treatment groups (n=8/group): saline, PEG, PD, PD+PEG, AICAR, and AICAR+PEG. Extremity trauma was induced in anesthetized rats followed by pressure-controlled hemorrhage (mean arterial pressure (MAP) = 55 mmHg) for 45 minutes, at which point treatment was administered without fluid resuscitation. MAP, renal blood flow (RBF) and oxygen delivery (DO2), glomerular filtration rate (GFR), and sodium and potassium reabsorption were measured. Two hours after treatment, rats were euthanized to measure renal mitochondrial function.
Results: Hemorrhage caused hyperlactatemia and decreased RBF, DO2, GFR, and urine flow; PEG, PD+PEG, and AICAR+PEG similarly improved these parameters, but neither PD nor AICAR alone showed any hemodynamic effects. However, preserved renal mitochondrial respiratory activities were only observed in PD+PEG and AICAR+PEG but not in PD, AICAR, or PEG alone groups. In addition, PD+PEG but not PD alone inhibited the tubular mitochondrial activity during shock as indicated by decreased renal sodium and potassium reabsorption.
Conclusion: During hemorrhagic shock, PD or AICAR demonstrated preservation of mitochondrial function only when co-administered with PEG to alleviate tissue ischemia. This finding suggests a potential pharmacologic strategy to improve tissue delivery of therapeutics when resuscitation is limited.
Keywords:
shock
; ischemia
; delivery
; renal injury
; mitochondria
1. Introduction
Most battlefield mortality following hemorrhage occurs in pre-hospital environments, with one quarter of deaths deemed potentially preventable [1]. Research on anti-shock treatments to be administered at the point of injury or during pre-hospital transportation has been emphasized for situations when timely or sufficient resuscitation is unavailable [2]. However, without sufficient resuscitation, decreases in tissue perfusion pressure may impair drug delivery and distribution and thus limit the positive effects of potential anti-shock drug candidates. We have previously shown that a low volume injection of polyethylene glycol (PEG) rapidly improves renal blood flow and capillary perfusion following hemorrhagic shock [3]. We therefore hypothesized that such acute hemodynamic effects may favor rapid drug delivery and distribution to ischemic tissue.
Mitochondria are vulnerable during hemorrhagic shock [4]. Resveratrol and 5-aminoimidazole-4-carboxamide 1-β-D-ribonucleoside (AICAR) have been well recognized for their beneficial effects on mitochondrial function and related antioxidative and anti-inflammatory properties [5,6]. Polydatin (PD) is a naturally abundant glycosylated precursor of resveratrol with higher metabolic stability and solubility than resveratrol [7,8,9], making it a superior candidate for anti-shock therapy. Many studies have shown that either PD or AICAR can improve mitochondrial function and biogenesis [10,11] and reduce cellular/organ damage and mortality when applied as adjuncts to resuscitation following hemorrhagic shock [12,13,14,15]. However, it is unclear whether PD or AICAR have any beneficial effects if applied without resuscitation, as might be the case in austere environments with limited resuscitation fluid availability and resultant impairment in drug delivery. Therefore, the goals of this study were to determine whether 1) these potential anti-shock drugs become less effective if resuscitation is absent; and 2) anti-shock effects of these drugs can be amplified if tissue perfusion is improved by applying PEG as an adjunct treatment. We hypothesized that, without resuscitation, the effectiveness of either PD or AICAR on mitochondrial function, metabolism, and systemic outcomes following hemorrhagic shock will be improved if PEG is simultaneously applied as an adjunct to improve tissue perfusion. A previously established rat model of prolonged hemorrhagic shock was used to address this hypothesis [3]. Because hemorrhage induces profound vasoconstriction and, presumably, impaired drug delivery in the kidney, we measured renal hemodynamics and mitochondrial function as indices for therapeutic effects.
2. Methods
2.1. Animals
Research was conducted in compliance with the Animal Welfare Act, the implementing Animal Welfare regulations, and the principles of the Guide for the Care and Use of Laboratory Animals. The Institutional Animal Care and Use Committee approved all research conducted in this study. The facility where this research was conducted is fully accredited by the AAALAC.
Male Sprague-Dawley rats (13-15 weeks old) were acquired from Charles River Laboratories International, Inc., and were allowed to acclimatize to the facility for at least 3 days. Rats were housed two to three per cage at 22°C, exposed to a 12-hour light/dark cycle, and fed standard rat chow (LabDiet, St. Louis, MO) with food and water both provided ad libitum.
Because the original study was focused on renal injury, creatinine levels were chosen as the outcome measure for the initial power analysis. The a priori power analysis indicated that n=12 per group was required. Subsequent analyses at n=8 demonstrated statistical differences in creatinine and other variables. Hence, sample sizes of 8 were evaluated to minimize animal use.
A total of 48 rats were randomized into 6 groups (n=8/group) based on treatment: saline (vehicle), PEG, PD, PD+PEG, AICAR, and AICAR+PEG. The hemodynamic and blood gas data for the PEG and saline groups were previously published [3]. The current study used the same experimental protocol to build upon these findings to investigate the anti-shock effects of PD, AICAR, and their combination with PEG. The statistically identical data among the 6 groups prior to injections suggests repeatability and reliability of the experimental model. Rats were excluded from the experiment if catheters failed. Investigators were not blinded to treatment group during the data collection or analysis.
2.2. Surgical Preparation
Rats were anesthetized with Inactin (thiobutabarbital sodium, IP, 100 mg/kg), and rectal temperature was maintained between 37°C to 38°C via a heating pad and a red-light lamp. Buprenorphine SR (~1.2 mg/kg SC) was administered before surgery. The trachea was intubated (PE 240 polyethylene catheter) allowing the rat to spontaneous breath room air. The left femoral and carotid arteries were catheterized for hemorrhage and measurement of mean arterial pressure (MAP) (LabView-Based, Data Acquisition System, National Instruments, Austin, TX), respectively. The left femoral vein was cannulated for continuous infusion of 0.9% saline with 1% bovine serum albumin (5 μL/g body weight per hour), and for intravenous injection of fluorescein-isothiocyanate-(FITC)-sinistrin, PEG, PD, AICAR, PD+PEG, AICAR+PEG, or saline vehicle.
The bladder was catheterized to continuously collect urine and record urine flow (urine volume/min). A perivascular ultrasonic transit time flow probe (0.7PSB, Transonic Systems Inc, Ithaca, NY) was placed around the left renal artery to measure renal blood flow (RBF). The abdominal incision was closed after surgery. An optical device (NIC-Kidney, Mannheim Pharma & Diagnostics, Germany) was attached to the skin to record excretion kinetics of FITC-sinistrin after an injection (10 mg/kg) via the femoral vein, enabling calculation of glomerular filtration rate (GFR) [16].
2.3. Experimental Protocol
The experimental timeline is presented in Figure 1.
2.3.1. Extremity Trauma
Approximately 45 minutes following surgical preparation, extremity trauma was performed on the left hindlimb as previously described [17,18]. In brief, soft tissue injury was induced via clamping the retrofemoral tissue groups for 30 seconds with an angled Kelly clamp. Fibula fracture was then conducted with a 15-gauge needle, which penetrated the skin and fascia between the tibia and fibula (at the middle from the knee to the calcaneus bone). Using the tibia as a fulcrum, the needle was twisted to apply sufficient pressure on the fibula to cause it to break.
2.3.2. Hemorrhagic Shock
Five minutes after accomplishment of extremity trauma, blood was withdrawn from the femoral catheter at 0.5 mL/min (with a dual direction pump) into a 10-mL syringe (< 50 USP Units/ml heparin) until MAP reached 55 mmHg, which took 13 minutes on average. FITC-sinistrin was then injected intravenously to start GFR recording (until the end of the experiment). MAP was maintained for 45 minutes by withdrawal of blood or infusion of shed blood (0.5 mL/min).
2.3.3. Treatment
After 45 minutes of hemorrhagic shock with MAP maintained at 55 mmHg, rats were injected with either 0.9% saline (vehicle), 7.5% PEG, PD (0.150 mg/100 g body weight), AICAR (5 mg/100 g body weight), PD+PEG, or AICAR+PEG. PD, AICAR, and PEG were each dissolved in 0.9% saline and the total volume injected in all treatment groups was 0.3 ml/100 g body weight. The total blood volume (ml) in a healthy rat was estimated as 6.77 ml/100 g [19]. The peak circulating concentration of PD after intravenous injection in the hemorrhaged rats should be higher than (0.15 mg ÷ 6.77 ml)/390.9 molecular weight x 106= 60 μM due to blood loss. A similar concentration of PD was shown to improve mitochondrial function, alleviate oxidative stress, and decrease apoptosis following ischemia reperfusion injury in both in vitro and in vivo studies [20,21,22]. AICAR even at intravenous doses of 3-4 mg/100 g was shown to alleviate oxygen debt and renal injury following hemorrhage in animal studies [23,24].
2.3.4. Hemodynamics and Blood and Urine Assays
MAP, RBF, and GFR were continuously recorded for 2 hours after treatment. Arterial blood samples (~0.2 ml) were collected at baseline, after 45 minutes of shock, and every 30 minutes after PEG, PD, AICAR, PD+PEG, AICAR+PEG, or saline treatment (Figure 1). After each blood sample, the sample volume was immediately replaced with shed blood. Blood gases, electrolytes, hematocrit (HCT), hemoglobin (Hb), creatinine, and blood urea nitrogen (BUN) were measured using an i-STAT Handheld Blood Analyzer (Abbott Point of Care Inc. Princeton, NJ). Plasma fatty acid levels were measured in AICAR and AICAR+PEG groups (ELISA, Abcam, Waltham, MA) at baseline, after 45 minutes of shock, and 30 minutes after treatment. Urine was continuously collected during the 45-min shock and the 2-hour observation periods after treatment, with fresh microcentrifuge tubes used for each period. Urinary sodium and potassium concentrations were measured using Easylyte analyzers (Medica Corporation, Bedford, MA). At the end of the experiment, the optical device for GFR recording was read and analyzed using MediBeacon Studio V2 software (Mannheim Pharma & Diagnostics, Germany). Kidneys were collected immediately after euthanasia (Fatal-Plus) at the end of the experiment or immediately after death if this occurred during the experiment. Kidneys were stored in liquid nitrogen for later analysis of mitochondrial respiratory function [25].
The following calculations were performed:
- Arterial oxygen content (CaO2) = ([hemoglobin] × 1.36 x SaO2) + (0.0031 × PaO2), where SaO2 is arterial oxygen saturation, PaO2 is arterial oxygen partial pressure
- Renal oxygen delivery (DO2) = CaO2 x RBF
- Sodium or potassium filtration rate = Plasma [Na+] or [K+] x GFR
- Sodium or potassium excretion rate = Urinary [Na+] or [K+] x urinary flow
2.3.5. Mitochondrial Oxygen Consumption Rate (OCR)
Measurement of OCR in frozen tissue has been demonstrated in a previous study [25]. Because mitochondrial complexes I and III are susceptible to damage from freeze-thaw cycles [25], we only measured the OCR of complexes II and IV. Note that membrane potential is not maintained under such preparation, and thus ATP generation was not measured. In brief, frozen kidneys were thawed in ice-cold MAS buffer (70 mM sucrose, 220 mM mannitol, 5 mM KH2PO4, 5 mM MgCl2, 1 mM EGTA, 2 mM HEPES pH 7.4) and the renal pelvis was removed. Cortex and medulla were minced, homogenized, and centrifuged at 1,000 g for 10 minutes at 4°C. The supernatant was collected and centrifuged at 14,000 g for 10 minutes at 4°C to collect the mitochondria-enriched fraction [25]. Mitochondrial homogenates (50 µl of 80 µg/ml protein concentration, final concentration 4 µg) were loaded into an Agilent Seahorse XFe24 microplate (Seahorse Bioscience, MA). Substrate and inhibitor injections were given as follows: Port A, 5 mM succinate + 2 μM rotenone; Port B, 2 μM rotenone + 4 μM antimycin A; Port C, 0.5 mM N,N,N′,N′-tetramethyl-p-phenylenediamine (TMPD) + 1 mM ascorbic acid; Port D, 50 mM azide. Complex II and IV-dependent respiration was calculated using the difference between the substrate-induced OCR measured before and after adding inhibitors. Each sample was analyzed in quadruplicate, and each measurement was conducted twice. Wave software (Agilent, CA) was used to export OCR rates normalized by protein [25].
2.4. Statistical Analysis
Survival was compared among saline, PEG, PD, and PD+PEG groups or among saline, PEG, AICAR, AICAR+PEG groups using SAS version 9.4 (SAS Institute Inc., Cary, NC) with a Tukey-Kramer multiple comparisons adjustment for the logrank test. Remaining data were analyzed using Prism 9.2.0 (GraphPad Software, Boston, MA). Blood volume losses, GFR, OCR, urinary flow, and filtered and excreted sodium or potassium rate were compared among groups using one-way ANOVA with Šídák's multiple comparisons. Due to the minimal urinary flow in saline, PD, and AICAR groups, all urine measurements were only compared among PEG, PD+PEG, and AICAR+PEG groups (Supplemental Table S1). The OCR of non-hemorrhaged animals and the saline (hemorrhage) group was compared using unpaired t-tests. All other data following hemorrhage or injections were analyzed using repeated measures with mixed-effects models and Geisser-Greenhouse corrections. Multiple comparisons were adjusted using Tukey’s statistical hypothesis test. Data are presented as mean ± SE, and significance was evaluated with α < 0.05.
3. Results
Blood loss was similar among groups (Figure 1, P ≥ 0.14). Baseline MAP, heart rate (HR), and their responses during hemorrhage (from 0 min to 45 min) did not differ among groups (Figure 2). Saline or PD injection failed to affect MAP or HR, which decreased in those groups until mortality. AICAR transiently increased MAP compared to the saline group (t = 55 min and t = 60 min, P ≤ 0.009) but had no effect on HR. PEG, PD+PEG, and AICAR+PEG rapidly increased MAP (P < 0.001 vs. saline from t = 50 min to t = 90 min, P ≤ 0.005 vs. saline at t = 105 min). HR also increased following PEG, PD+PEG, or AICAR+PEG compared to HR in the saline group (P ≤ 0.03 vs. saline from t = 75 min to t=105 min). Because of high mortality in the saline group, comparisons versus saline were not possible beyond 105 min. No differences in MAP or HR were observed among PEG, PD+PEG, and AICAR+PEG groups after hemorrhage or injections.
Hemorrhagic shock for 45 min similarly increased plasma creatinine, BUN, potassium, and lactate, and decreased pH, HCT, Hb, and calcium among all groups (P < 0.05, 45 min vs baseline values, Table 1). Neither PD nor AICAR affected these parameters compared to saline. A further increase in creatinine was observed in AICAR+PEG (P = 0.04 vs. 45 min) but not in PEG and PD+PEG groups (P = 0.01 vs. saline at t = 105). None of the treatments affected BUN or calcium levels, which did not differ among groups at time points wherein comparisons were possible. Compared to the saline group, significant decreases in lactate were found following PEG and PD+PEG treatment (P ≤ 0.001 at 75 min and P = 0.003 at 105 min) but not AICAR+PEG treatment (P = 0.75 at 75 min and P = 0.052 at 105 min). Potassium levels were decreased in all drug groups compared to saline (P ≤ 0.03 at 75 min and P ≤ 0.01 at 105 min). In addition, pH was increased in PEG and PD+PEG at 75 min (P ≤ 0.04) and was increased in all groups at 105 min (P ≤ 0.02) compared to the saline group. HCT and Hb increased after saline injection (P =0.01, 105 min vs. 45 min), while PEG, PD+PEG, or AICAR+PEG injections similarly decreased HCT and Hb levels (P< 0.001 vs. 45 min; P < 0.001, PEG, PD+PEG, or AICAR+PEG vs. saline). Circulating free fatty acids were not different between groups at baseline or 45 minutes after hemorrhage (Supplemental Figure 1). Free fatty acids, however, decreased 30 minutes after AICAR+PEG treatment (P < 0.01 vs. baseline) but not after AICAR alone.
Hemorrhagic shock (at t = 45 min) similarly decreased RBF and renal DO2 in all groups (Figure 3). Saline, PD or AICAR alone failed to further affect RBF or renal DO2. Compared with pretreatment levels (45 min) and with saline, PEG, PD+PEG, and AICAR+PEG rapidly and similarly increased RBF (P ≤0.04 vs. saline at t = 50 min, P ≤ 0.003 vs. saline from t = 55 min to t=105 min). Renal DO2 for PEG, PD+PEG, and AICAR+PEG were also increased compared to saline (P < 0.001 at t = 75 min and 105 min). GFR was improved following PEG, PD+PEG, or AICAR+PEG treatment (P < 0.001 vs saline); neither PD nor AICAR alone affected GFR (Figure 3C).
There was little to no urine collected in saline, PD, and AICAR groups following hemorrhage, urinary flow and sodium or potassium excretion/filtration were therefore only compared among PEG, PD+PEG, and AICAR+PEG groups (Supplemental Table S1). Across the 2 hr observation period, no differences were observed among groups in urinary flow (P = 0.68) or filtered sodium (P = 0.411) and potassium levels (P = 0.95). Compared to PEG, AICAR+PEG did not change sodium (PEG: 27.8 ± 7.0 nM/min; AICAR+PEG: 67.4 ± 11.6 nM/min; P = 0.60) or potassium excretion (PEG: 350.3 ± 131.9 nM/min; AICAR+PEG: 200.0 ± 39.3 nM/min; P = 0.56). However, PD+PEG enhanced sodium excretion (PD+PEG: 169.3 ± 34.4 nM/min; P = 0.005 vs. PEG, P = 0.03 vs. AICAR+PEG) and potassium excretion (PD+PEG: 723.2 ± 95.2 nM/min; P = 0.03 vs. PEG, P =0.002 vs. AICAR+PEG).
Complex II and complex IV initiated OCR were both impaired in the hemorrhage (saline) group compared to non-hemorrhaged group (supplemental Figure 2, an additional 6 non-hemorrhaged animals were used as sham control). Compared with saline, PD, AICAR, or PEG alone did not affect complex II (P ≥ 0.16) or IV-mediated OCR (P ≥ 0.27) (Figure 4). Compared to saline, both PD+PEG and AICAR+PEG improved complex II (P ≤ 0.01) and complex IV-induced OCR (P ≤ 0.007). Compared with PD, PD+PEG improved OCR of both complexes (P<0.001). Compared with AICAR, AICAR+PEG increased OCR of both complexes (P≤0.03) as well. Compared to PEG, AICAR + PEG increased (P ≤ 0.03) OCR of both complexes, but PD+PEG did not (P > 0.54).
In the saline group, the first fatality occurred at t = 75 min with 100% mortality observed by t=120 min (Figure 5; PD and AICAR survival data are presented separately as curves overlapped). PEG significantly increased survival with only 1 of 8 rats dying at t=148 min (P = 0.003). Neither PD (P = 0.98) nor AICAR (P = 0.86) alone altered the survival probability compared to saline. None of the animals receiving PD+PEG died (P < 0.001 vs saline). However, AICAR+PEG did not improve survival compared with saline (P = 0.07).
4. Discussion
There are two major findings in this study. First, without resuscitation, neither PD nor AICAR showed any effects following hemorrhagic shock. Second, specific effects of PD or AICAR on mitochondrial and/or metabolic activity were not observed until co-administration of PEG, which improved blood flow and thereby increased drug delivery to ischemic tissues.
Impaired renal mitochondrial OCR with acute kidney injury and 100% mortality were observed in the saline group within 2 hours of hemorrhagic shock. Hypoxia can rapidly suppress electron transport chain function, dehydrogenase enzymes, and ATP generation [26]. Without resuscitation, persistent hypoxia during shock causes electron leak, redox imbalance, and impaired membrane potential, which eventually cause apoptosis and organ injury [27,28]. For instance, hemorrhagic shock for 45 minutes impaired mitochondrial oxygen consumption, Krebs cycle activity, and ATP production in fresh splenocytes [29]. A full resuscitation that had been delayed for 45 minutes failed to restore mitochondrial function [29], suggesting that early treatment for mitochondrial protection is important when resuscitation is unavailable. In fact, when compared with injured patients whose mitochondrial function is preserved, similarly injured patients exhibiting mitochondrial damage were more prone to organ failure [30,31].
Due to their beneficial effects on mitochondrial function and biogenesis [10,11], PD and AICAR have been applied as adjuncts to resuscitation following hemorrhagic shock, which preserved mitochondrial function and alleviated reperfusion injury [12,13,14,15]. Notably, a potential challenge to early treatment without full resuscitation is impaired drug delivery and distribution. In our study, neither PD nor AICAR without resuscitative fluid improved mitochondrial function unless PEG was co-administered to elicit an increase in tissue perfusion. Note that the temporary increase in RBF induced by PEG alone failed to improve renal mitochondrial function. Therefore, sustained ischemia impedes not only blood and oxygen delivery to tissues but also delivery of therapeutic compounds such as antishock candidate drugs, antibiotics, and analgesics, thereby decreasing their efficacy. Low volume of PEG may therefore be essential to ensure full therapeutic effects of treatments that are given in resource-limited environments lacking the ability for full resuscitation.
Suppressing mitochondrial respiration is a critical approach to decrease hypoxia-induced cell death and increase tissue tolerance to prolonged hypoxia [32]. PD can decrease mitochondrial oxygen consumption by inhibiting F0F1-ATPase/ATP synthase [33,34], which may re-establish oxygenation balance (oxygen delivery vs. oxygen consumption), alleviate hypoxia-induced electron leaks and succinate accumulation, and thus preserve mitochondrial function upon resuscitation [12,13,35]. In the current study, the mitochondrial protecting effect of PD was revealed but only with PEG to temporarily increase renal perfusion. Kidney tubules have high mitochondrial density [36] with function intimately related to regulation of sodium and potassium reabsorption [37]. The inhibitory effect of PD+PEG on mitochondrial activity was echoed by the markedly inhibited sodium and potassium reabsorption.
Mitochondrial function was also improved in the AICAR+PEG group while sodium and potassium uptakes were not affected, suggesting that mechanisms other than mitochondrial inhibition of reabsorption play a major role. For example, succinate accumulation at complex II during prolonged hypoxia contributes to increased mitochondrial reactive oxygen species and injury [38]. AICAR can alleviate succinate accumulation by inhibiting the purine nucleotide cycle [39]. Additionally, AICAR directly enhances mitochondrial biogenesis and capacity [10] and elicits anti-inflammatory and antioxidant properties that can indirectly improve mitochondrial function [40]. However, our data suggest that the protective effect of AICAR on mitochondria depends on sufficient tissue perfusion/delivery.
AICAR is also known as an activator of adenosine monophosphate protein kinase (AMPK) and may stimulate ATP generation in response to decreased ATP/ADP or ATP/AMP ratio [41]. Moreover, AICAR can directly accelerate fatty acid transport into mitochondria [41,42]. Therefore, it was proposed that AICAR may slow ATP depletion due to lipid oxidation, despite impaired insulin signaling during traumatic shock [43,44]. In fact, we found that free fatty acid levels were significantly decreased 30 minutes after the AICAR treatment (Supplemental Figure S1). Again, such an effect was only detected when AICAR was combined with PEG.
Our data do not support an AICAR-induced improvement in oxygenation balance under shock conditions as PD does. While PD+PEG markedly reduced oxygen debt (lactate levels, Table 1), AICAR+PEG failed to elicit the same beneficial effects despite the similarly improved MAP, RBF, and renal oxygen delivery. It is possible that AICAR-stimulated lipid oxidation might elevate oxygen consumption and thus exacerbate global hypoxia during shock, as indicated by increased lactate and mortality in the AICAR+PEG group. Huang et al. also showed that acute AICAR treatment during hemorrhagic shock increased lactate accumulation in rabbits [45]. Notably, without resuscitation, enhanced fuel consumption induced by AICAR is likely limited to vital organs due to peripheral tissue ischemia. However, if PEG enhances AICAR delivery to peripheral tissues, a global increase in oxygen consumption may occur, which may instead exacerbate hypoxia (in vital organs) and the risk of mortality.
PD+PEG and AICAR+PEG did not cause additional improvements in GFR over that produced by PEG alone because the AKI in our model is primarily “prerenal” and the GFR could be fully recovered by restoring MAP with resuscitation [24]. The suppressed renal mitochondrial function present in our model was likely associated with ischemia-induced cell stunning instead of cell apoptosis that can cause intrarenal injury and a further decrease in GFR [46]. Creatinine and BUN levels were only slightly decreased despite the markedly improved GFR, as the clearance rate of creatinine and BUN (up to several hours) is too slow to reflect the effect of acute treatments on renal function. The elimination half-life of FITC-sinistrin, however, can be less than 20 minutes [16], making it a more accurate and dynamic technique to assess renal function. Notably, renal oxygen delivery was markedly increased in PEG or PEG cocktail groups despite the further decreased Hb levels. While decades of work on therapeutic interventions for hemorrhagic shock have focused on improving oxygen carrying ability, our results again suggest that future research targeting pharmacological-based improvements in tissue perfusion and oxygenation balance might be more productive.
5. Limitations
We didn’t collect blood samples from these groups for the measurement of fatty acid levels. Nevertheless, the stimulating effect of AICAR+PEG on metabolism may also be echoed by the increased lactate levels despite improved hemodynamics.
6. Conclusion, Perspective, and Future Studies
Early treatment applied under shock conditions without sufficient resuscitation resulted in less-than-optimal effects due to reduced delivery of the therapeutic to ischemic tissues. This finding warrants renewed research efforts as it may have a profound impact for clinical practice. This study presents a strategy to enhance delivery by adding PEG as an adjunct to treatments given under shock conditions, which may be an essential step to ensure therapeutic effects during tissue ischemia. Our data also suggest that early anti-shock treatment should focus on the balance between hemodynamic support and metabolism/oxygenation requirements. Further work is needed to understand the effects of PD+PEG cocktail on metabolism and oxygen homeostasis and any impact on coagulation function following hemorrhagic shock of longer duration.
Supplementary Materials
The following supporting information can be downloaded at the website of this paper posted on Preprints.org.
Author Contributions
LX conception and design of research; ASC, CAK, KSM, and LX performed experiments, recorded data, and performed statistics; LEG performed survival analysis statistics. LX interpreted results and drafted manuscript; HGK, KLR, KSM, SML, and MAM edited and revised manuscript.
Funding
This study was funded by US Army Medical Research and Development Command.
Acknowledgments
We thank Mrs. Tiffany Heard and Dr. Evan Ross for their technical help. .
DoD disclaimer
The views expressed in this article are those of the author(s) and do not reflect the official policy or position of the U.S. Army Medical Department, Department of the Army, DoD, or the U.S. Government.
ORISE Disclaimer
This research was supported in part by an appointment to the Research Participation Program at the US Army Institute of Surgical Research administered by the Oak Ridge Institute for Science and Education through an interagency agreement between the US Department of Energy and USAISR.
References
- Hinojosa-Laborde C, Hudson IL, Ross E, Xiang L, Ryan KL. Pathophysiology of Hemorrhage as It Relates to the Warfighter. Physiology (Bethesda). 2022;37(3):141-153.
- Army Futures Command Concept for Medical 2028. https://api.army.mil/e2/c/downloads/2022/04/25/ac4ef855/medical-concept-2028-final-unclas.pdf. 03-04-2022.
- Xiang L, Calderon AS, Ryan KL, Klemcke HG, Mdaki KS, Hudson IL, et al. CAN POLYETHYLENE GLYCOL-20K REPLACE ALBUMIN FOR PREHOSPITAL TREATMENT OF HEMORRHAGIC SHOCK WHEN FULL RESUSCITATION IS UNAVAILABLE? Shock. 2023;59(5):725-733.
- Cannon JW. Hemorrhagic Shock. N Engl J Med. 2018 Jan 25;378(4):370-379.
- Xia N, Daiber A, Förstermann U, Li H. Antioxidant effects of resveratrol in the cardiovascular system. Br J Pharmacol. 2017;174(12):1633-1646.
- Zhang GZ, Deng YJ, Xie QQ, Ren EH, Ma ZJ, He XG, Gao YC, Kang XW. Sirtuins and intervertebral disc degeneration: Roles in inflammation, oxidative stress, and mitochondrial function. Clin Chim Acta. 2020; 508:33-42.
- Zhao G, Yang L, Zhong W, Hu Y, Tan Y, Ren Z, et al. Polydatin, A Glycoside of Resveratrol, Is Better Than Resveratrol in Alleviating Non-alcoholic Fatty Liver Disease in Mice Fed a High-Fructose Diet. Front Nutr. 2022; 9:857879.
- Karami A, Fakhri S, Kooshki L, Khan H. Polydatin: Pharmacological Mechanisms, Therapeutic Targets, Biological Activities, and Health Benefits. Molecules. 2022;27(19):6474.
- Koç TY, Doğan S, Karadayı M. Potential Using of Resveratrol and Its Derivatives in Medicine. Eurasian J Med. 2024;56(2):136-141.
- Hinkle JS, Rivera CN, Vaughan RA. AICAR stimulates mitochondrial biogenesis and BCAA catabolic enzyme expression in C2C12 myotubes. Biochimie. 2022;195:77-85.
- Bheereddy P, Yerra VG, Kalvala AK, Sherkhane B, Kumar A. SIRT1 Activation by Polydatin Alleviates Oxidative Damage and Elevates Mitochondrial Biogenesis in Experimental Diabetic Neuropathy. Cell Mol Neurobiol. 2021;41(7):1563-1577.
- Wang H, Guan Y, Karamercan MA, Ye L, Bhatti T, Becker LB, et al. Resveratrol Rescues Kidney Mitochondrial Function Following Hemorrhagic Shock. Shock. 2015;44(2):173-80.
- Li P, Wang X, Zhao M, Song R, Zhao KS. Polydatin protects hepatocytes against mitochondrial injury in acute severe hemorrhagic shock via SIRT1-SOD2 pathway. Expert Opin Ther Targets. 2015;19(7):997-1010.
- Powell RD, Swet JH, Kennedy KL, Huynh TT, McKillop IH, Evans SL. Resveratrol attenuates hypoxic injury in a primary hepatocyte model of hemorrhagic shock and resuscitation. J Trauma Acute Care Surg. 2014;76(2):409-17.
- Zeng Z, Chen Z, Xu S, Zhang Q, Wang X, Gao Y, et al. Polydatin Protecting Kidneys against Hemorrhagic Shock-Induced Mitochondrial Dysfunction via SIRT1 Activation and p53 Deacetylation. Oxid Med Cell Longev. 2016;2016:1737185.
- Mullins TP, Tan WS, Carter DA, Gallo LA. Validation of non-invasive transcutaneous measurement for glomerular filtration rate in lean and obese C57BL/6J mice. Nephrology (Carlton). 2020;25(7):575-581.
- Xiang L, Calderon AS, Klemcke HG, Hudson IL, Hinojosa-Laborde C, et al. Extremity trauma exacerbates acute kidney injury following prolonged hemorrhagic hypotension. J Trauma Acute Care Surg. 2021;91(2S Suppl 2):S113-S123.
- Xiang L, Calderon AS, Klemcke HG, Hinojosa-Laborde C, Becerra SC, Ryan KL. A novel animal model to study delayed resuscitation following traumatic hemorrhage. J Appl Physiol (1985). 2022;133(4):814-821.
- Lee HB, Blaufox MD. Blood volume in the rat. J Nucl Med. 1985;26(1):72-6.
- Reyna-Bolaños I, Solís-García EP, Vargas-Vargas MA, Peña-Montes DJ, Saavedra-Molina A, Cortés-Rojo C, et al. Polydatin Prevents Electron Transport Chain Dysfunction and ROS Overproduction Paralleled by an Improvement in Lipid Peroxidation and Cardiolipin Levels in Iron-Overloaded Rat Liver Mitochondria. Int J Mol Sci. 2024;25(20):11104.
- Liu Y, Xie F, Lu C, Zhou Z, Li S, Zhong J, et al. Polydatin inhibited TNF-α-induced apoptosis of skeletal muscle cells through AKT-mediated p38 MAPK and NF-κB pathways. Gen Physiol Biophys. 2023;42(6):521-529.
- Zhan J, Li X, Luo D, Yan W, Hou Y, Hou Y, et al. Polydatin Attenuates OGD/R-Induced Neuronal Injury and Spinal Cord Ischemia/Reperfusion Injury by Protecting Mitochondrial Function via Nrf2/ARE Signaling Pathway. Oxid Med Cell Longev. 2021;2021:6687212.
- Huang Y, Ratz PH, Miner AS, Locke VA, Chen G, Chen Y, et al. AICAR Administration Attenuates Hemorrhagic Hyperglycemia and Lowers Oxygen Debt in Anesthetized Male Rabbits. Front Physiol. 2017;8:692.
- Idrovo JP, Yang WL, Matsuda A, Nicastro J, Coppa GF, Wang P. Post-treatment with the combination of 5-aminoimidazole-4-carboxyamide ribonucleoside and carnitine improves renal function after ischemia/reperfusion injury. Shock. 2012;37(1):39-46.
- Acin-Perez R, Benador IY, Petcherski A, Veliova M, Benavides GA, Lagarrigue S, et al. A novel approach to measure mitochondrial respiration in frozen biological samples. EMBO J. 2020;39(13):e104073.
- Kuzmiak-Glancy S, Glancy B, Kay MW. Ischemic damage to every segment of the oxidative phosphorylation cascade elevates ETC driving force and ROS production in cardiac mitochondria. Am J Physiol Heart Circ Physiol. 2022;323(3):H499-H512.
- Su L, Zhang J, Gomez H, Kellum JA, Peng Z. Mitochondria ROS and mitophagy in acute kidney injury. Autophagy. 2023;19(2):401-414.
- Okoye CN, Koren SA, Wojtovich AP. Mitochondrial complex I ROS production and redox signaling in hypoxia. Redox Biol. 2023;67:102926.
- Warren M, Subramani K, Schwartz R, Raju R. Mitochondrial dysfunction in rat splenocytes following hemorrhagic shock. Biochim Biophys Acta Mol Basis Dis. 2017;1863(10 Pt B):2526-2533.
- Singh RD, Croatt AJ, Ackerman AW, Grande JP, Trushina E, Salisbury JL, et al. Prominent Mitochondrial Injury as an Early Event in Heme Protein-Induced Acute Kidney Injury. Kidney360. 2022;3(10):1672-1682.
- Cairns CB, Moore FA, Haenel JB, Gallea BL, Ortner JP, Rose SJ, et al. Evidence for early supply independent mitochondrial dysfunction in patients developing multiple organ failure after trauma. J Trauma. 1997;42(3):532-6.
- Yao Q, Khan MP, Merceron C, LaGory EL, Tata Z, Mangiavini L, et al. Suppressing Mitochondrial Respiration Is Critical for Hypoxia Tolerance in the Fetal Growth Plate. Dev Cell. 2019;49(5):748-763.e7.
- Zheng J, Ramirez VD. Inhibition of mitochondrial proton F0F1-ATPase/ATP synthase by polyphenolic phytochemicals. Br J Pharmacol. 2000;130(5):1115-23.
- Zhang LX, Li CX, Kakar MU, Khan MS, Wu PF, Amir RM, et al. Resveratrol (RV): A pharmacological review and call for further research. Biomed Pharmacother. 2021;143:112164.
- Mori MP, Penjweini R, Knutson JR, Wang PY, Hwang PM. Mitochondria and oxygen homeostasis. FEBS J. 2022;289(22):6959-6968.
- Doke T, Susztak K. The multifaceted role of kidney tubule mitochondrial dysfunction in kidney disease development. Trends Cell Biol. 2022;32(10):841-853.
- Gronow G, Skrezek C, Kossmann H. Correlation between mitochondrial respiratory dysfunction and Na+-reabsorption in the reoxygenated rat kidney. Adv Exp Med Biol. 1986;200:515-22.
- Zhang M, Cheng Y, Zhai Y, Cui Y, Zhang W, Sun H, et al. Attenuated succinate accumulation relieves neuronal injury induced by hypoxia in neonatal mice. Cell Death Discov. 2022;8(1):138.
- Zhang Y, Zhang M, Zhu W, Yu J, Wang Q, Zhang J, et al. Succinate accumulation induces mitochondrial reactive oxygen species generation and promotes status epilepticus in the kainic acid rat model. Redox Biol. 2020;28:101365.
- Golubitzky A, Dan P, Weissman S, Link G, Wikstrom JD, Saada A. Screening for active small molecules in mitochondrial complex I deficient patient's fibroblasts, reveals AICAR as the most beneficial compound. PLoS One. 2011;6(10):e26883.
- Kong L, Zhang H, Lu C, Shi K, Huang H, Zheng Y, et al. AICAR, an AMP-Activated Protein Kinase Activator, Ameliorates Acute Pancreatitis-Associated Liver Injury Partially Through Nrf2-Mediated Antioxidant Effects and Inhibition of NLRP3 Inflammasome Activation. Front Pharmacol. 2021;12:724514.
- Dagher Z, Ruderman N, Tornheim K, Ido Y. Acute regulation of fatty acid oxidation and amp-activated protein kinase in human umbilical vein endothelial cells. Circ Res. 2001;88(12):1276-82.
- Clemmer JS, Xiang L, Lu S, Mittwede PN, Hester RL. β2-adrenergic regulation of stress hyperglycemia following hemorrhage in the obese Zucker rat. Physiol Rep. 2014;2(12):e12215.
- Korkmaz N, Kesikburun S, Atar MÖ, Sabuncu T. Insulin resistance and related factors in patients with moderate and severe traumatic brain injury. Ir J Med Sci. 2023;192(3):1177-1182.
- Huang Y, Ratz PH, Miner AS, Locke VA, Chen G, Chen Y, et al. AICAR Administration Attenuates Hemorrhagic Hyperglycemia and Lowers Oxygen Debt in Anesthetized Male Rabbits. Front Physiol. 2017;8:692.
- Kalogeris T, Baines CP, Krenz M, Korthuis RJ. Cell biology of ischemia/reperfusion injury. Int Rev Cell Mol Biol. 2012;298:229-317.
Figure 1.
The timeline for the entire experimental design and the volume loss for hemorrhagic shock. Blood loss did not differ among treatment groups (P ≥ 0.14; n=8/group). Data are depicted as mean ± SE. PEG, polyethylene glycol-20K; PD, Polydatin; AICAR, 5-aminoimidazole-4-carboxamide 1-β-D-ribonucleoside; BAS, baseline; MAP, mean arterial pressure; HR, heart rate; RBF, renal blood flow; GFR, glomerular filtration rate. Blood samples were obtained at 30 min intervals after treatment administration.
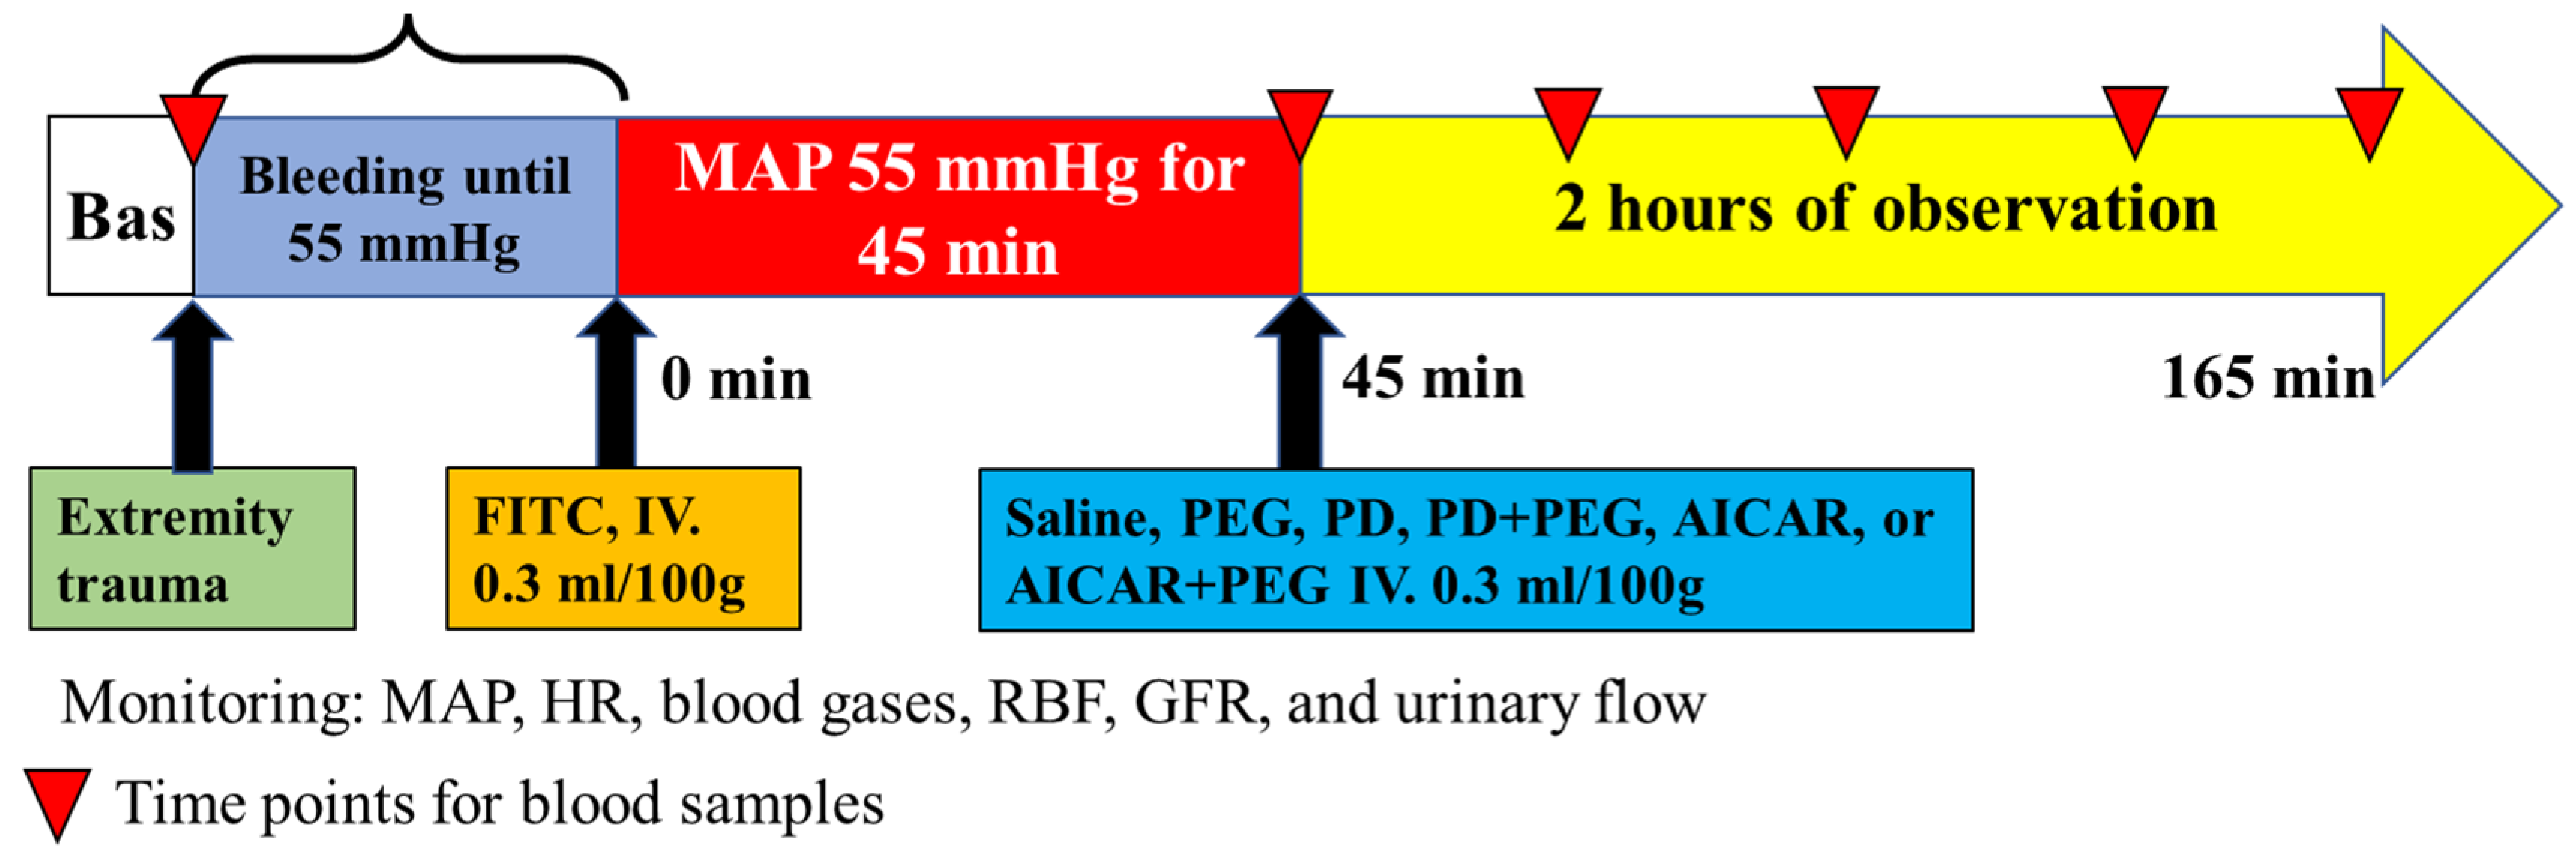
Figure 2.
Mean arterial blood pressure (MAP, Panel A) and heart rate (Panel B) in saline, PEG, PD, PD+PEG, AICAR, and AICAR+PEG groups (started with n = 8 for each group). Surviving animal numbers at each time point in each group are shown in the table in Figure 1. The data from saline and PEG groups were adapted from our previous study (3). Data are depicted as mean ± SE. Data are not shown if n < 3. (Panel A: * P < 0.01 vs. saline; # P < 0.02 vs. t = 45 min, Panel B: * P ≤ 0.03 vs. saline; PEG, Polyethylene glycol-20K; PD, Polydatin; AICAR, 5-aminoimidazole-4-carboxamide 1-β-D-ribonucleoside). .
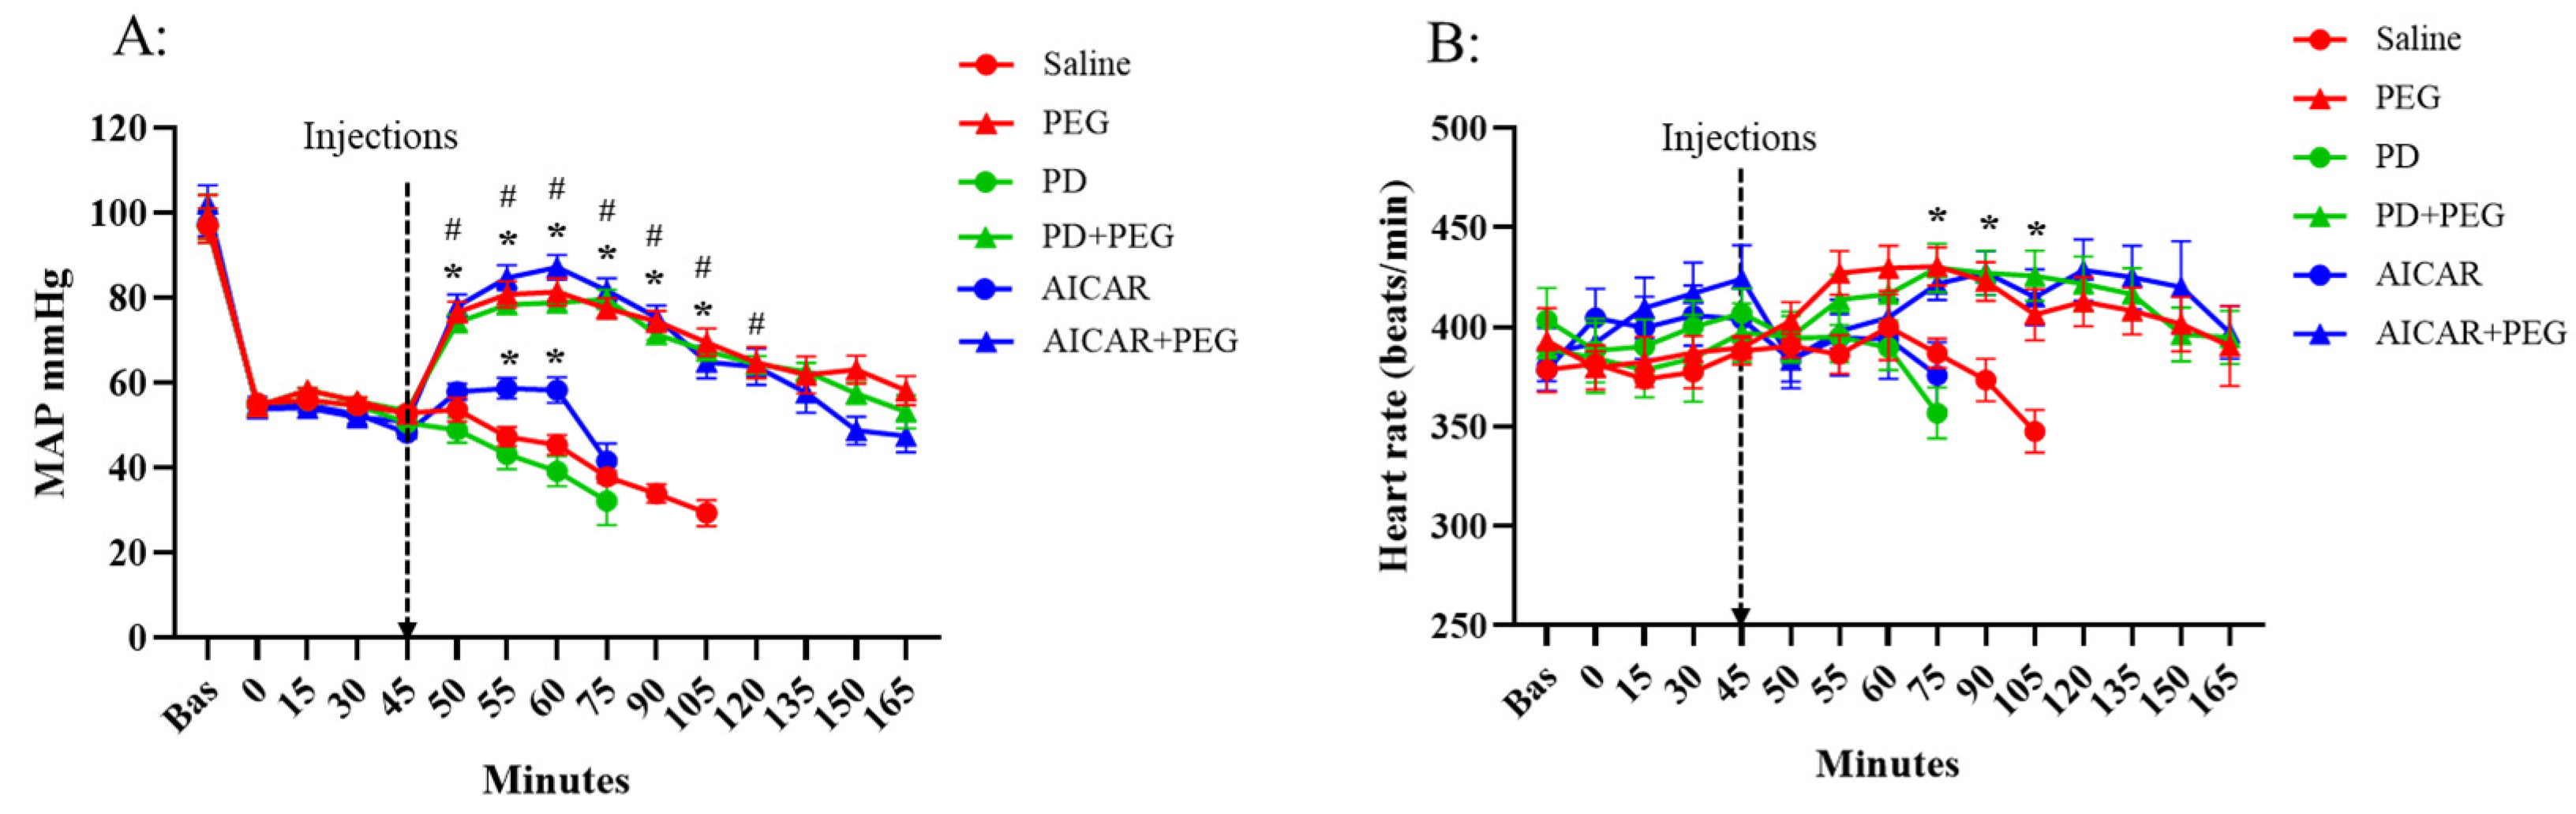
Figure 3.
Renal blood flow (RBF, Panel A), renal oxygen delivery (Panel B) and GFR (Panel C) in saline, PEG, PD, PD+PEG, AICAR, and AICAR+PEG groups. Data are depicted as mean ± SE. Data are not shown if n < 3. (Panel A: * P ≤ 0.04 vs. saline, # P < 0.04 vs. t = 45 min; Panel B: * P < 0.01 vs. saline for PEG, PD+PEG, and AICAR+PEG, # P < 0.01 vs. t = 45 min for PEG, PD+PEG, and AICAR+PEG; & P < 0.01 vs. t = 45 min for PEG and PD+PEG PEG; Panel C: * P < 0.01 vs. saline; Polyethylene glycol-20K; PD, Polydatin; AICAR, 5-aminoimidazole-4-carboxamide 1-β-D-ribonucleoside). .
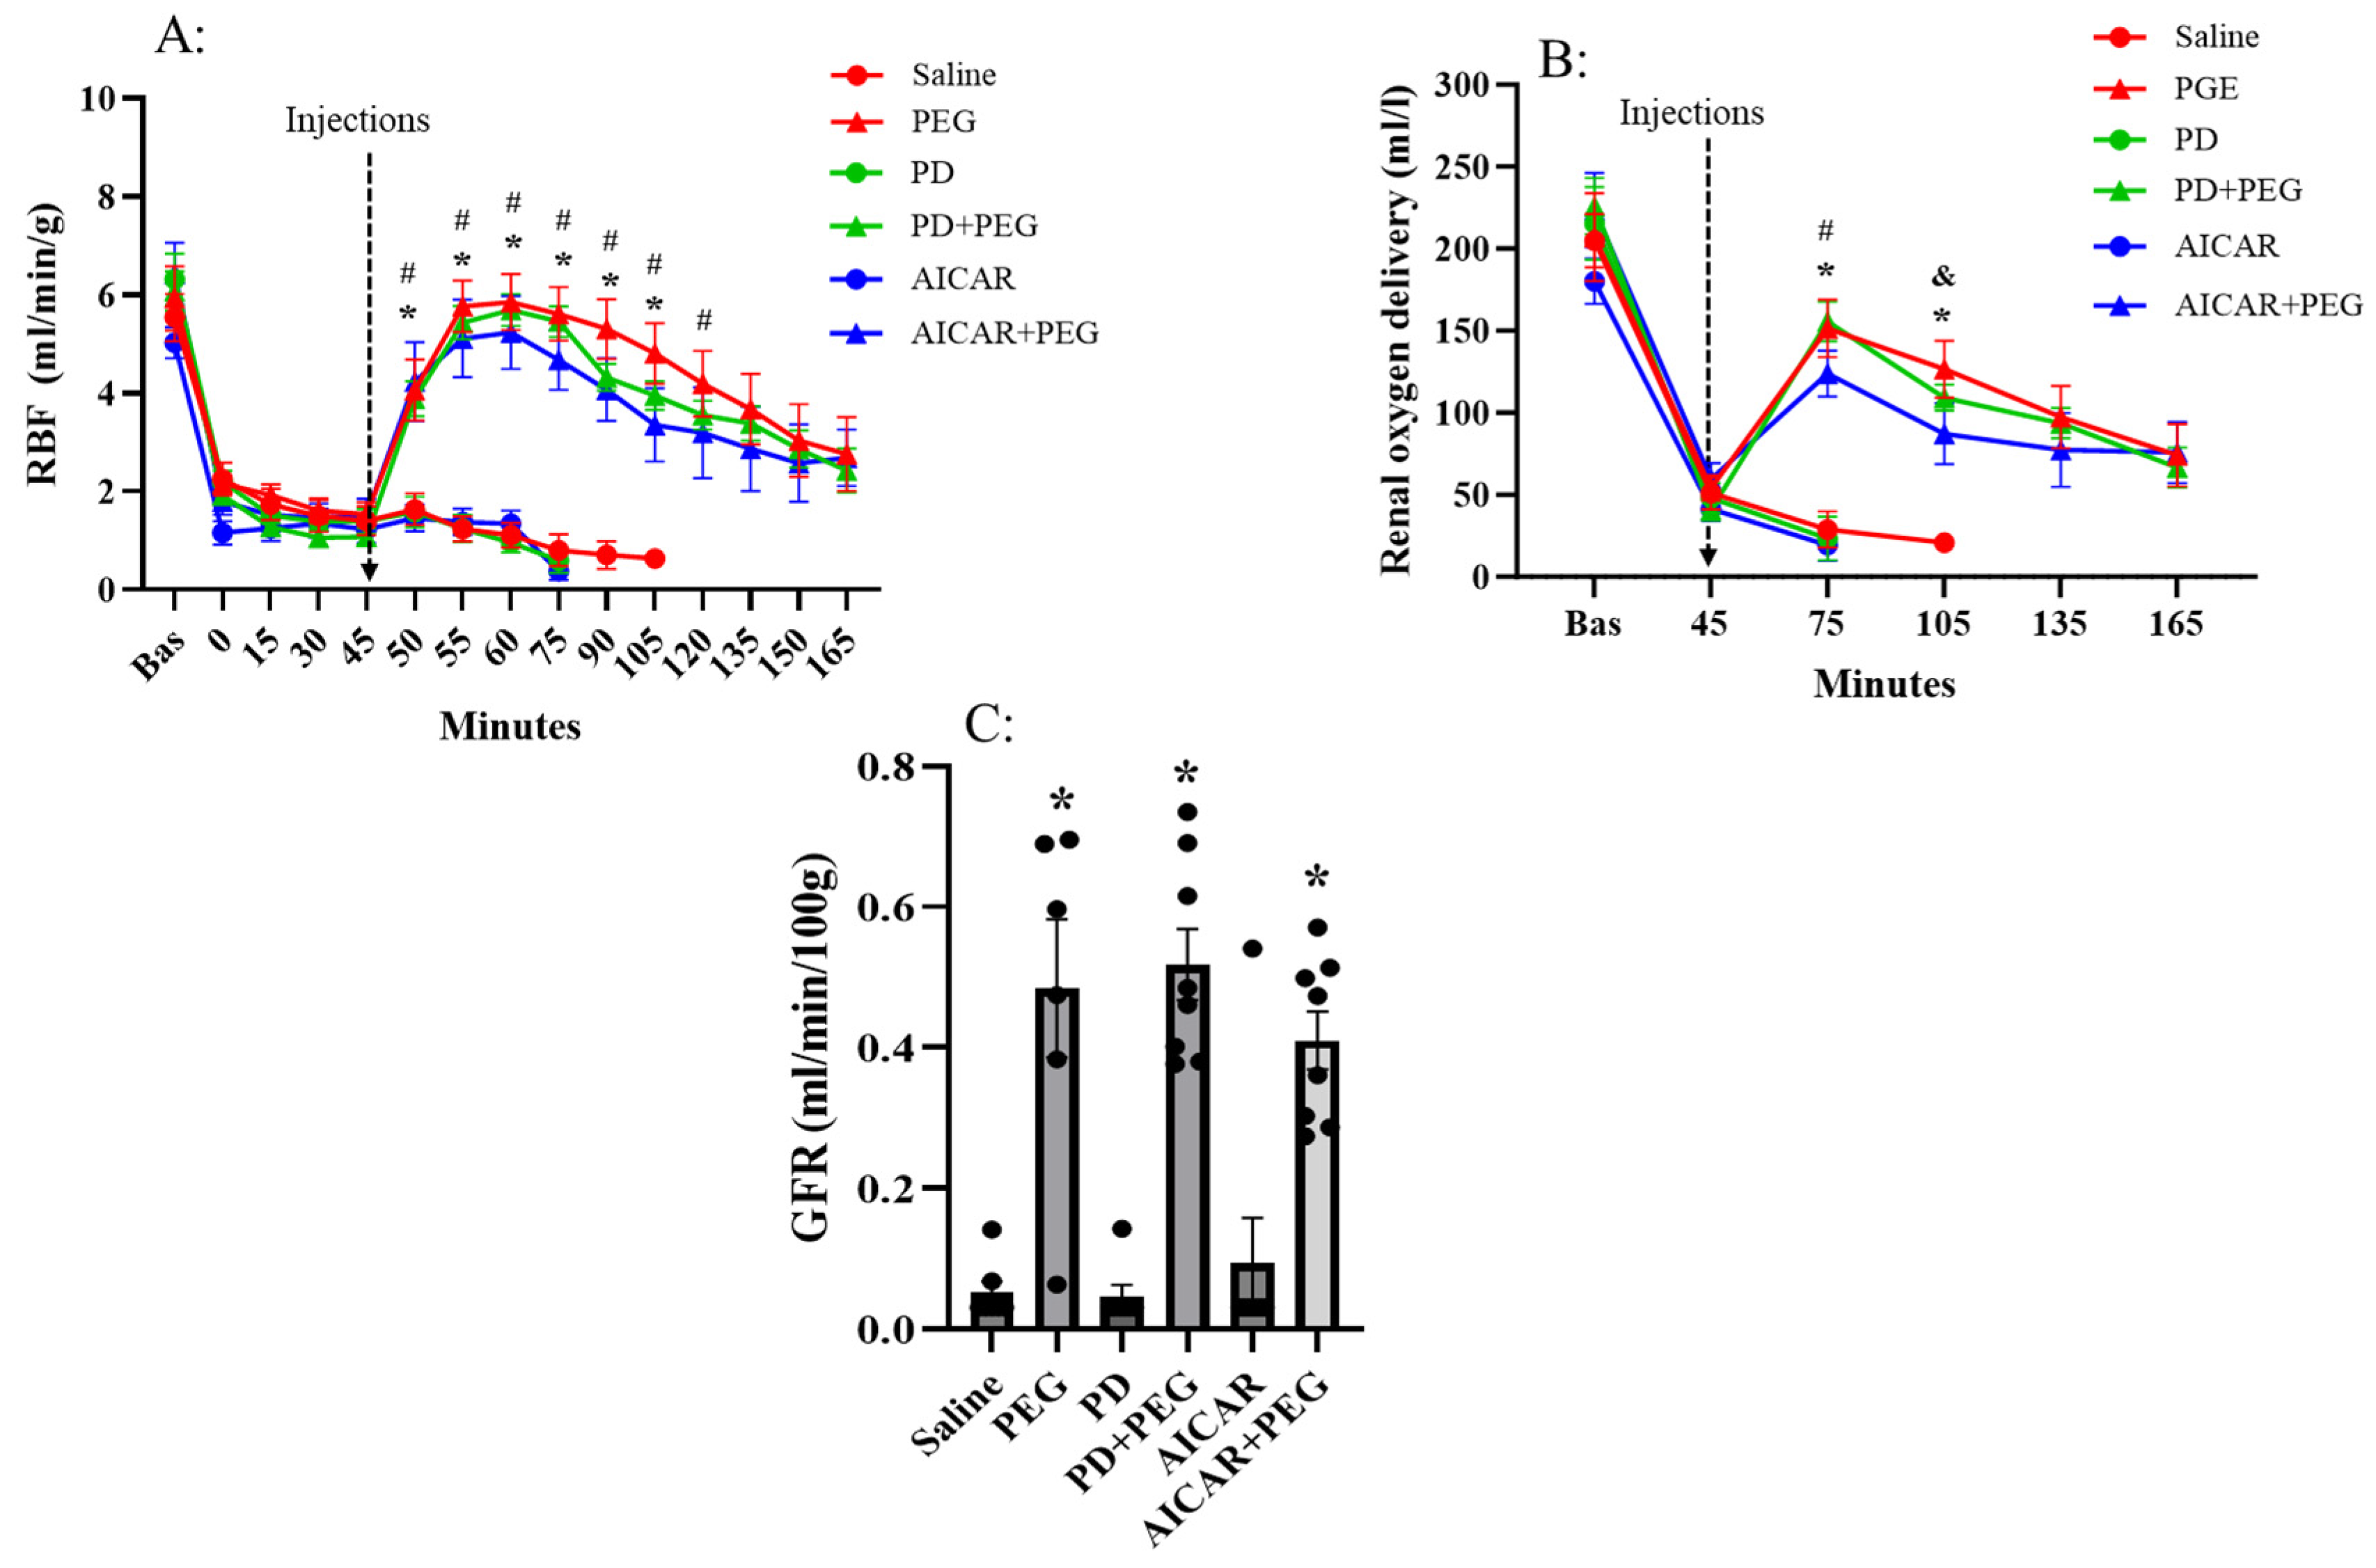
Figure 4.
Complexes II (Panel A) and IV (Panel B) dependent respiratory capacity in saline, PEG, PD, PD+PEG, AICAR, and AICAR+PEG groups (n=8 for each group. *P ≤ 0.01 vs. saline, PD, and AICAR; # P ≤ 0.03 AICAR+ PEG vs. PEG; PEG, Polyethylene glycol-20K; PD, Polydatin; AICAR, 5-aminoimidazole-4-carboxamide 1-β-D-ribonucleoside; OCR, oxygen consumption rate).
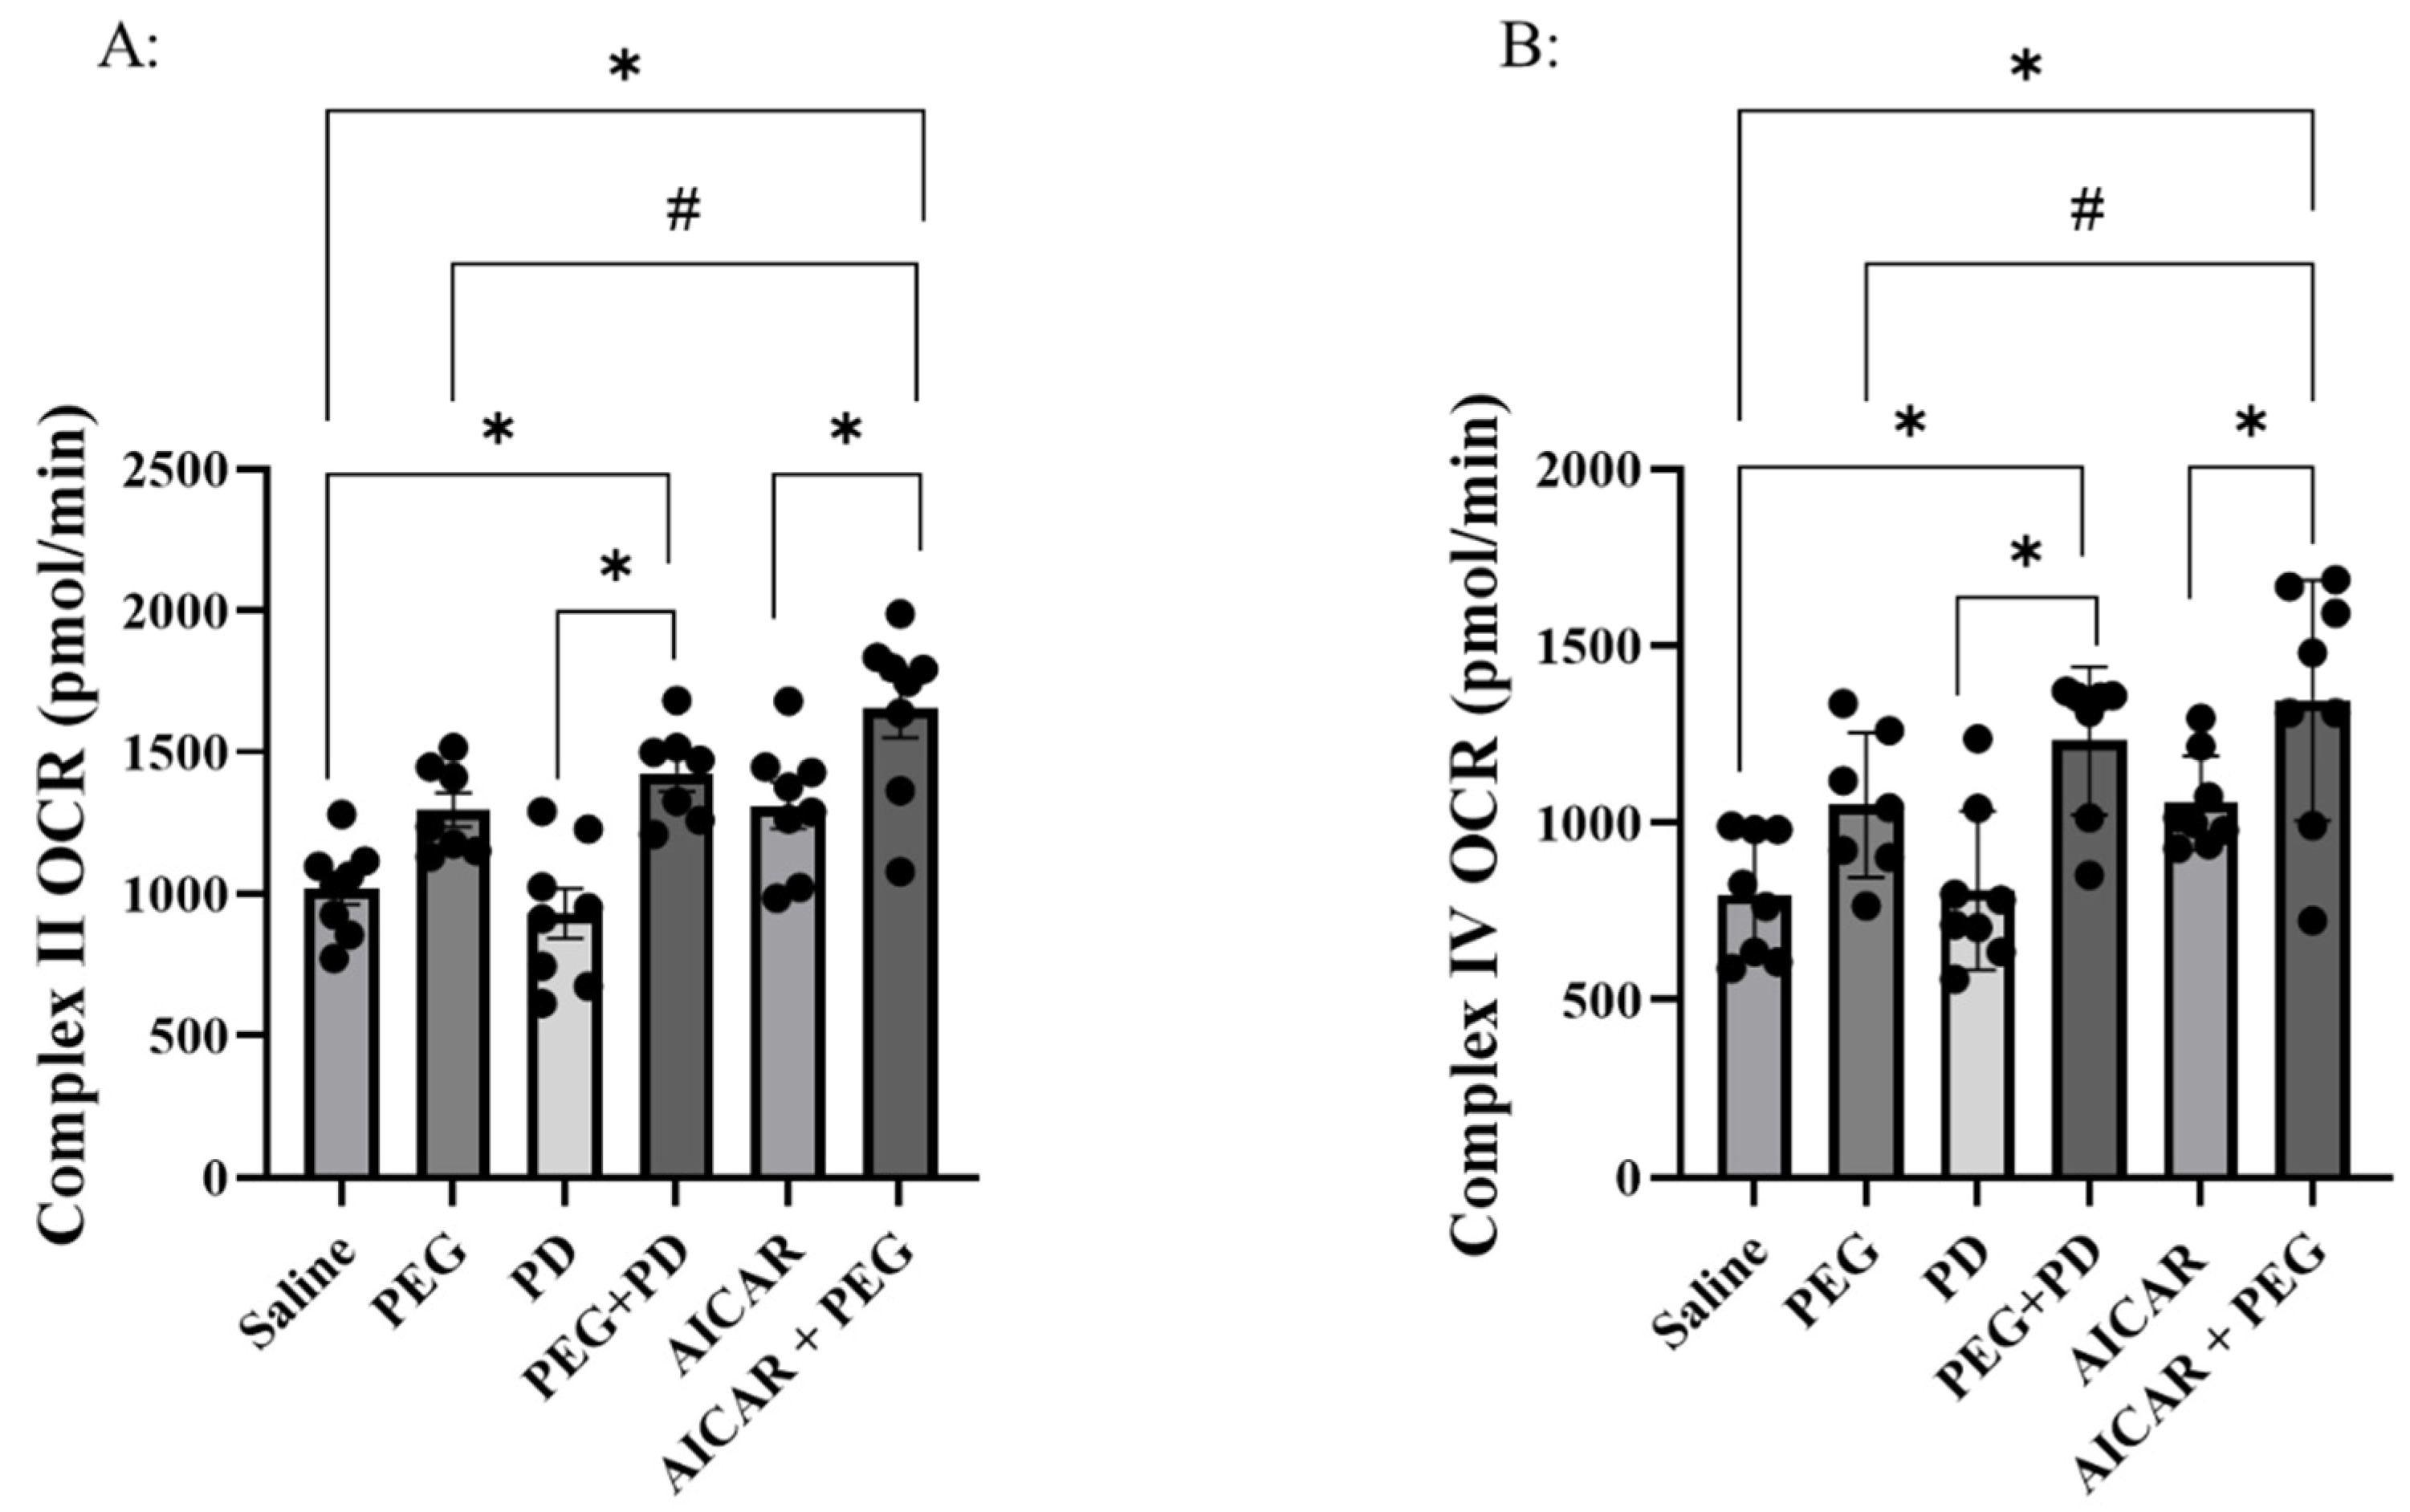
Figure 5.
Panel A: Probability of survival in saline, PEG, PD, and PD+PEG groups. Significant differences occurred for PEG or PD+PEG vs. saline (*P < 0.001). Panel B: Probability of survival in saline, PEG, AICAR and AICAR+PEG groups (P = 0.07 AICAR+PEG vs. Saline). The surviving animal numbers at each time point following hemorrhage and injections are shown in the Table.
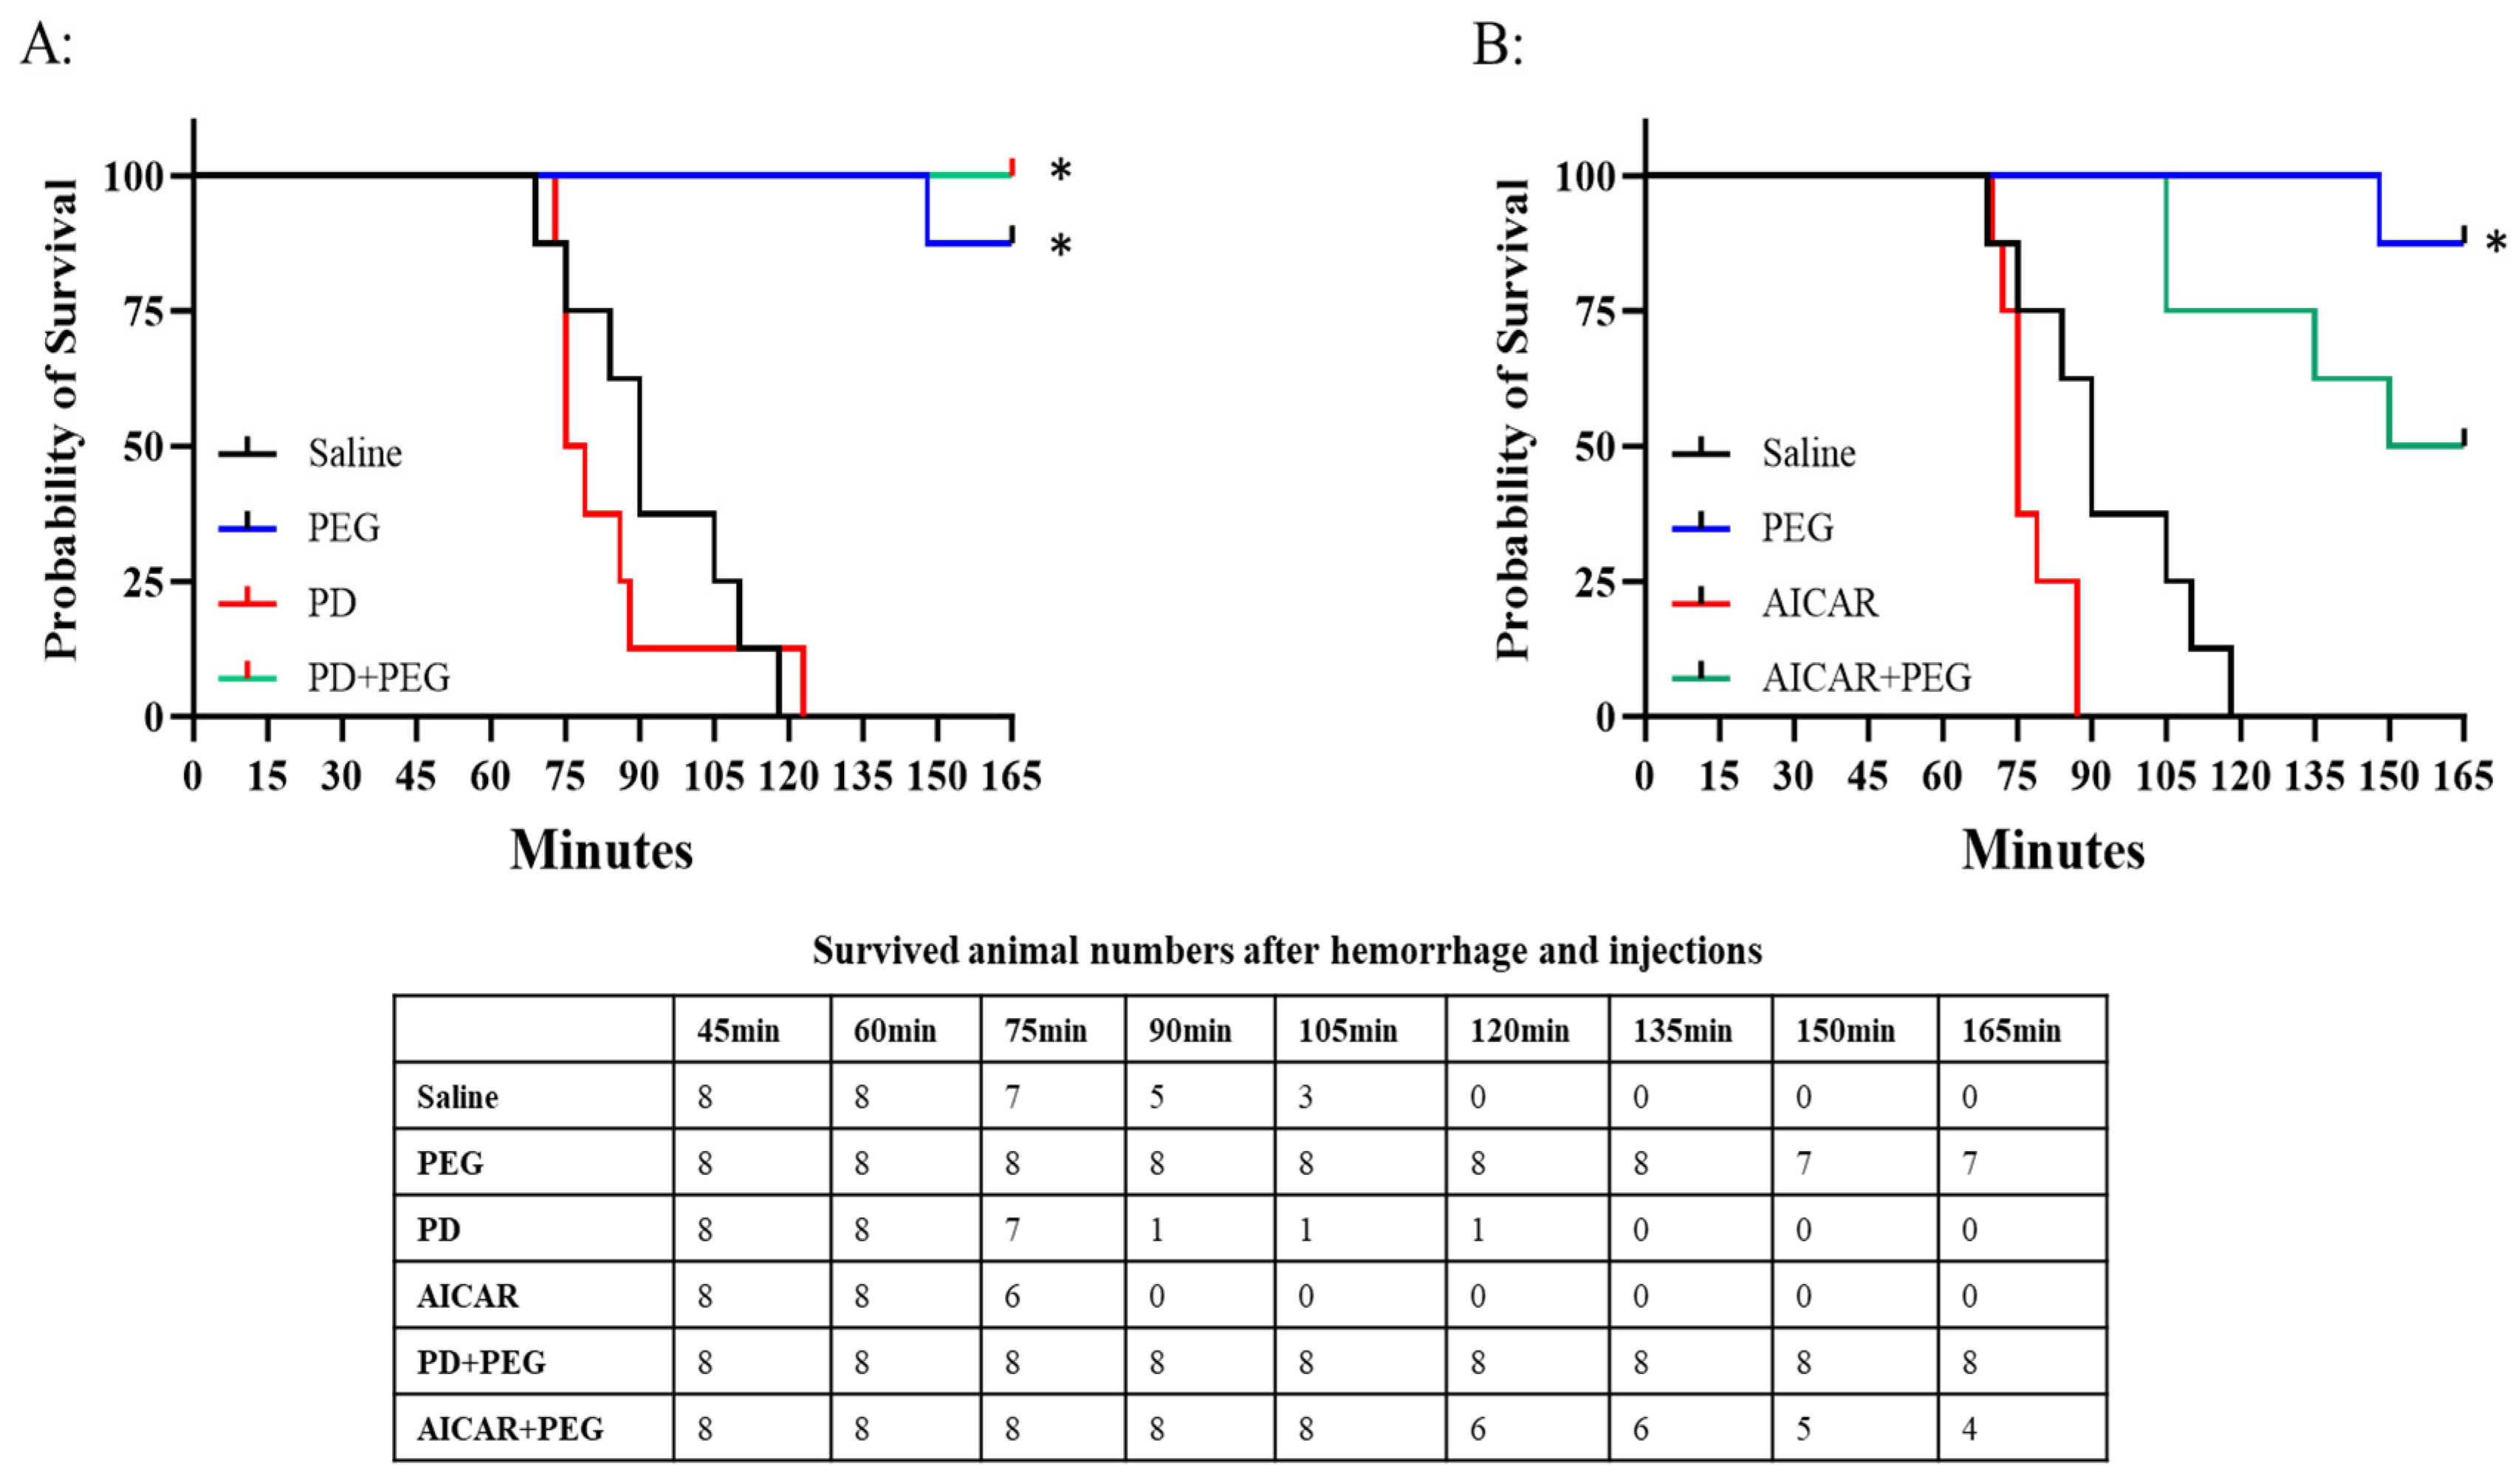

Table 1.
Blood sample measurement at baseline (Bas), 45 min (right before injections), 75min, 135, and 165 min after hemorrhage in saline, PEG, PD, PD+PEG, AICAR, and AICAR+PEG groups. .
Table 1.
Blood sample measurement at baseline (Bas), 45 min (right before injections), 75min, 135, and 165 min after hemorrhage in saline, PEG, PD, PD+PEG, AICAR, and AICAR+PEG groups. .
| Groups | Bas | 45 min | 75 min | 105 min | 135 min | 165 min | |
| Creatinine (mg/dL) | Saline | 0.44 ± 0.09 | 0.84 ± 0.09b | 1.03 ± 0.18 a | 1.18 ± 0.22 a | ----------- | ----------- |
| PEG | 0.39 ± 0.08 | 0.83 ± 0.13b | 0.84 ± 0.21 | 0.90 ± 0.24 | 1.04 ± 0.30 a | 1.23 ± 0.35a | |
| PD | 0.33 ± 0.07 | 0.80 ± 0.05b | 0.96 ± 0.09 a | ----------- | ----------- | ----------- | |
| PD + PEG | 0.40 ± 0.11 | 0.80 ± 0.11b | 0.84 ± 0.16 | 0.90 ± 0.17 c | 1.03 ± 0.17 a | 1.24 ± 0.22a | |
| AICAR | 0.36 ± 0.14 | 0.88 ± 0.20b | 1.07 ± 0.24 a | ----------- | ----------- | ----------- | |
| AICAR+ PEG | 0.40 ± 0.14 | 0.89 ± 0.12b | 0.99 ± 0.16 a | 1.10 ± 0.24a | 1.25 ± 0.28 a | 1.50 ± 0.32 a | |
| BUN (mg/dL) | Saline | 22.25 ± 5.20 | 26.00 ± 5.45b | 28.75 ± 6.14 a | 31.80 ± 8.56 a | ----------- | ----------- |
| PEG | 19.38 ± 3.93 | 24.13 ± 3.60b | 24.75 ± 4.53 | 28.25 ± 5.06 a | 32.38 ± 6.07 a | 36.75 ± 6.69 a | |
| PD | 18.38 ± 3.58 | 22.50 ± 3.78b | 25.75 ± 4.20 a | ----------- | ----------- | ----------- | |
| PD + PEG | 21.25 ± 4.40 | 25.88 ± 4.82b | 25.63 ± 3.96 | 29.50 ± 4.84 a | 33.75 ± 4.53 a | 38.50 ± 4.69 a | |
| AICAR | 20.13 ± 3.91 | 24.75 ± 4.89 a | 27.29 ± 4.07 a | ----------- | ----------- | ----------- | |
| AICAR+ PEG | 19.13 ± 5.62 | 24.25 ± 5.34 a | 25.00 ± 5.29 | 29.00 ± 5.90 a | 34.17 ± 7.08 a | 37.50 ± 7.77 a | |
| Lactate (mM) | Saline | 1.33 ± 0.33 | 6.48 ± 1.17b | 7.89 ± 1.85 a | 10.28 ± 2.49 a | ----------- | ----------- |
| PEG | 1.19 ± 0.21 | 6.52 ± 1.78b | 3.14 ± 1.28ac | 2.50 ± 1.10ac | 3.04 ± 1.66 a | 4.03 ± 2.35 a | |
| PD | 1.09 ± 0.32 | 7.09 ± 1.59 b | 9.89 ± 3.02 a | ----------- | ----------- | ----------- | |
| PD + PEG | 1.01 ± 0.39 | 6.97 ± 1.41b | 3.62 ± 1.67ac | 2.40 ± 1.14ac | 2.59 ± 1.21a | 3.37 ± 1.86 a | |
| AICAR | 1.33 ± 0.40 | 7.34 ± 2.61b | 10.59 ± 3.06 a | ----------- | ----------- | ----------- | |
| AICAR+ PEG | 1.36 ± 0.49 | 7.37 ± 1.78b | 6.92 ± 2.73 | 5.92 ± 3.35 | 4.62 ± 2.08 | 4.12 ± 1.60 a | |
| pH | Saline | 7.41 ± 0.05 | 7.37 ± 0.03b | 7.27 ± 0.14 | 7.15 ± 0. 09 a | ----------- | ----------- |
| PEG | 7.42 ± 0.07 | 7.37 ±0.07b | 7.46 ± 0.07ac | 7.47 ± 0.08ac | 7.44 ± 0.10 a | 7.39 ±0.16 | |
| PD | 7.40 ± 0.04 | 7.32 ± 0.06b | 7.13 ± 0.14a | ----------- | ----------- | ----------- | |
| PD + PEG | 7.41 ± 0.05 | 7.33 ± 0.06b | 7.42 ± 0.04 ac | 7.44 ± 0.04 ac | 7.42 ± 0.04a | 7.38 ± 0.06 | |
| AICAR | 7.40 ± 0.03 | 7.27 ± 0.03b | 7.11 ± 0.09a | ----------- | ----------- | ----------- | |
| AICAR+ PEG | 7.41 ± 0.04 | 7.31 ± 0.06b | 7.35 ± 0.07a | 7.35 ± 0.12 c | 7.38 ± 0.05 | 7.39 ± 0.03 | |
| Potassium (mM) | Saline | 4.69 ± 0.60 | 5.20 ± 0.42 b | 7.06 ± 1.15 a | 8.80 ± 0.45 a | ----------- | ----------- |
| PEG | 4.46 ± 0.45 | 5.19 ± 0.57 b | 4.79 ± 0.52 ac | 5.44 ± 0.86 c | 5.76 ± 1.03 | 6.78 ± 1.77 | |
| PD | 4.44 ± 0.24 | 5.20 ± 0.46 b | 7.79 ± 1.63 a | ----------- | ----------- | ----------- | |
| PD + PEG | 4.25 ± 0.21 | 5.10 ± 0.42 b | 4.61 ± 0.30 ac | 5.11 ± 0.43 c | 5.40 ± 0.70 | 6.16 ± 1.29 | |
| AICAR | 4.53 ± 0.38 | 6.08 ± 0.72 b | 8.43 ± 0.92 a | ----------- | ----------- | ----------- | |
| AICAR+ PEG | 4.58 ± 0.66 | 5.86 ± 1.06 b | 5.56 ± 0.85c | 6.93 ± 1.32 c | 6.85 ± 0.68 | 7.03 ± 0.54 | |
|
Ionized calcium (mM) |
Saline | 1.31 ± 0.06 | 1.20 ± 0.10 b | 1.12 ± 0.11 | 1.08 ± 0.08 a | ----------- | ----------- |
| PEG | 1.29 ± 0.08 | 1.22 ± 0.05 b | 1.12 ± 0.07 a | 1.09 ± 0.09 a | 1.09 ± 0.10 a | 1.06 ± 0.09 a | |
| PD | 1.31 ± 0.06 | 1.25 ± 0.06 b | 1.19 ± 0.07 | ----------- | ----------- | ----------- | |
| PD + PEG | 1.31 ± 0.05 | 1.25 ± 0.05 b | 1.17 ± 0.04 a | 1.15 ± 0.05 a | 1.15 ± 0.07 a | 1.12 ± 0.09 a | |
| AICAR | 1.32 ± 0.04 | 1.23 ± 0.05 b | 1.21 ± 0.07 | ----------- | ----------- | ----------- | |
| AICAR+ PEG | 1.32 ± 0.05 | 1.23 ± 0.06 b | 1.16 ± 0.09 | 1.11 ± 0.12 a | 1.09 ± 0.08 a | 1.03 ± 0.09 a | |
| Hematocrit (%HCT) | Saline | 45.75 ±5.57 | 36.13 ± 4.52 b | 37.38 ± 4.63 | 42.80 ± 3.19 a | ----------- | ----------- |
| PEG | 45.00 ± 2.27 | 34.75 ± 1.83 b | 24.38 ± 2.50 ac | 24.00 ± 2.14 ac | 25.00 ± 1.93 a | 26.13 ± 3.18 a | |
| PD | 43.75 ± 2.43 | 33.63 ± 1.06 b | 36.25 ± 2.87 | ----------- | ----------- | ----------- | |
| PD + PEG | 44.50 ± 2.27 | 34.38 ± 2.62 b | 24.75 ± 1.83 ac | 24.00 ± 1.51 ac | 24.13 ± 1.36 a | 24.88 ± 2.10 a | |
| AICAR | 46.00 ± 2.14 | 37.25 ± 2.12 b | 40.29 ± 3.04 | ----------- | ----------- | ----------- | |
| AICAR+ PEG | 45.50 ± 2.83 | 35.63 ± 3.50 b | 26.63 ± 2.45 ac | 28.00 ± 2.67 ac | 27.67 ± 1.86 a | 27.00 ± 2.16 a | |
|
Hemoglobin (g/dL) |
Saline | 15.56 ±1.88 | 12.26 ± 1.54 b | 12.70 ± 1.59 | 14.56 ± 1.09 a | ----------- | ----------- |
| PEG | 15.29 ± 0.78 | 11.81 ± 0.61 b | 8.28 ± 0.85 ac | 8.16 ± 0.73 ac | 8.50 ± 0.65 a | 8.88 ± 1.09 a | |
| PD | 14.88 ± 0.82 | 11.44 ± 0.37 b | 12.33 ± 0.96 | ----------- | ----------- | ----------- | |
| PD + PEG | 15.13 ± 0.78 | 11.69 ± 0.87 b | 8.41 ± 0.63 ac | 8.15 ± 0.50 ac | 8.19 ± 0.45 a | 8.46 ± 0.72 a | |
| AICAR | 15.64 ± 0.73 | 12.66 ± 0.71 b | 13.71 ± 1.04 | ----------- | ----------- | ----------- | |
| AICAR+ PEG | 15.48 ± 0.98 | 12.13 ± 1.19 b | 9.06 ± 0.82 ac | 9.51 ± 0.92 ac | 9.42 ± 0.63 a | 9.20 ± 0.73 a |
Data are depicted as mean ± SE. Started with n = 8 for each group. Data are not shown if n < 3 due to mortality. The survived animal numbers at each time point following hemorrhage and injections are shown in Figure 1. (a, P < 0.05 vs. 45min; b, P < 0.01 vs. Bas; c, P < 0.05 vs. saline). .
Disclaimer/Publisher’s Note: The statements, opinions and data contained in all publications are solely those of the individual author(s) and contributor(s) and not of MDPI and/or the editor(s). MDPI and/or the editor(s) disclaim responsibility for any injury to people or property resulting from any ideas, methods, instructions or products referred to in the content. |
© 2025 by the authors. Licensee MDPI, Basel, Switzerland. This article is an open access article distributed under the terms and conditions of the Creative Commons Attribution (CC BY) license (http://creativecommons.org/licenses/by/4.0/).
Copyright: This open access article is published under a Creative Commons CC BY 4.0 license, which permit the free download, distribution, and reuse, provided that the author and preprint are cited in any reuse.


