Submitted:
14 November 2025
Posted:
18 November 2025
You are already at the latest version
Abstract
Reactive oxygen species (ROS)-induced aberrant oncogenic signaling has been proposed to mediate the progression and development of pleural mesothelioma (PM). Here we demonstrate how ROS initiates oncogenic signaling especially in the context of cell migration and immune evasion via YB-1 phosphorylation in mesothelial and PM cell models. Xanthine (X) and xanthine oxidase (XO)-generated ROS exposure led to increased migration and more elongated cell shape in mesothelial and PM cells in live cell videomicroscopy analyses. These effects were associated with enhanced phosphorylation of ERK, AKT and YB-1, alongside elevated gene expression of PD-L1 and PD-L2, which were analysed with immunoblotting and quantitative real-time RT-PCR, respectively. Pharmacological inhibition of AKT (ipatasertib), MEK (trametinib) or RSK (BI-D1870) resulted in reversal of ROS-induced effects, with the strongest effects observed upon inhibition of YB-1 phosphorylation by BI-D1870. The results suggest that ROS exposure has a strong impact on cell migration and immune evasion not only in PM cells but also in mesothelial cells, from which PM arises. Interfering with ROS responsive kinase pathways, particularly YB-1 phosphorylation, could counteract pro-migratory and immune evasive effects in PM.
Keywords:
pleural mesothelioma
; ROS
; cell migration
; cell signalling
; immune checkpoint proteins
1. Introduction
Pleural mesothelioma (PM) is a devastating malignancy arising from the mesothelial cells lining the pleural surfaces of the lungs and chest wall [1]. The median survival time of patients is little more than one year and has not seen major improvements in the last decade, despite the addition of immunotherapy and, more recently, chemo-immunotherapy to the therapeutic arsenal [2,3]. In the majority of cases, PM is caused by the inhalation of asbestos fibres, which penetrate the lung epithelium and are deposited in the pleural space where they can persist for a prolonged period, leading to chronic inflammation and tissue damage [1]. An essential factor in PM pathogenesis is attributed to reactive oxygen species (ROS) which are generated at iron-containing fibre surfaces via the Fenton reaction and by macrophages in their failed attempts to digest the fibres, a process that has been described as frustrated phagocytosis [4,5]. While many countries have enacted bans or severe restrictions on the use of asbestos, its mining and use continue in several others. Even in countries with strict asbestos regulations, exposure can still occur during demolition and renovation work of older buildings or as a consequence of disasters such as the collapse of the World Trade Center in New York City in 2001. Moreover, similar ROS-generating and carcinogenic mechanisms to those of asbestos have been experimentally demonstrated for carbon nanotubes, which are increasingly being used in a wide range of applications, including batteries and pharmaceutical products [6]. ROS are important contributors to DNA damage, which leads to mutations in exposed cells [7]. The overall mutational burden of PM is relatively low, however, and primarily involves mutations and deletions in tumour suppressor genes such as BAP1 (BRCA1-associated protein 1), methylthioadenosine phosphorylase (MTAP), CDKN2A (cyclin-dependent kinase inhibitor 2A), and TP53 [8]. ROS can also directly affect the activation of cellular signal transduction pathways, and the resulting alterations of cell behaviour may influence PM development and progression [5]. Despite this, surprisingly little research has been conducted to investigate the effects of ROS on the behaviour and cell signalling mechanisms of PM cells and of mesothelial cells, from which PM develops.
Here we demonstrate the effects of ROS exposure on mesothelial and PM cells. We show that ROS can induce changes in cell morphology and promote increased cell migration of both mesothelial and PM cells. ROS exposure leads to the activation of the MAPK (mitogen activated protein kinase) and AKT (protein kinase B) pathway, and to increased phosphorylation of the oncoprotein YB-1 (Y-box binding protein 1) via RSK (p90 ribosomal S6 kinase). Importantly, ROS exposure upregulates the expression of PD-L1 and PD-L2 (programmed death ligand 1 and 2) in both mesothelial and PM cells, which can be inhibited by blocking RSK-mediated YB-1 phosphorylation. Our data suggest that chronic inflammation-induced ROS could drive PM development not only by causing mutations, but also by promoting the transition to a more motile and immune evasive phenotype.
2. Material and Methods
2.1. Cell Culture
The human PM cell line MSTO-211H and the non-malignant human mesothelial cell line Met5A were obtained from the American Type Culture Collection (ATCC, Rockville, MD, USA). The SPC212 PM cell line was provided by Prof. R. Stahel (University of Zurich, Switzerland). NP2i is an immortalized form of the NP2 primary mesothelial cells. Establishment of NP2, immortalization with hTERT and comparison of the immortalized cells with their primary cell counterparts have been previously described [9]. Cells were cultured in RPMI-1640 medium supplemented with 10% fetal bovine serum (FBS) in a humidified incubator at 37 °C and 5% CO2. Cells were authenticated as described and regularly checked for Mycoplasma infection [9,10,11]. Unless stated otherwise, 5 x 10⁵ cells per well were seeded for experiments into 6[9–11-well plates 24 h before the start of the experiment to achieve a confluence of 70-80%.
2.2. Chemicals and Reagents
Xanthine (X) and xanthine oxidase (XO) were purchased from Sigma-Aldrich (St. Louis, MO, USA). The ROS detecting reagent DCFDA (2´,7´-dichlorodihydrofluorescein diacetate, Cellular ROS Assay Kit, Cat. No. ab113851) was obtained from Abcam (Cambridge, UK). Primary antibodies against ERK1/2 (Cat. No. 4695S), phospho-ERK1/2 (Cat.No.9101), AKT (Cat. No. 4691), phospho-AKT (Cat. No. 4060), phospho-YB-1 (Cat. No. 2900, C34A2), and GAPDH (Cat. No. 5174) were purchased from Cell Signaling Technology (Danvers, MA, USA). Anti-YB-1 antibody (Cat. No. ab12148) was purchased from Abcam (Cambridge, UK). HRP-conjugated rabbit secondary antibody (Cat. No. P0448) was obtained from Dako (Agilent Technologies, Santa Clara, CA, USA). The RSK inhibitor BI-D1870 (Cat. No. sc-397022A) was from Santa Cruz Biotechnology (Dallas, TX, USA), the MEK inhibitor trametinib (Cat. No. HY-10999), and the AKT inhibitor ipatasertib (Cat. No. HY-15186) were purchased from MedChemExpress (Monmouth Junction, NJ, USA). Clarity Western ECL substrate was from Bio-Rad (Cat. No. 170-5060, CA, USA).
2.3. ROS Generation
Xanthine (X) was dissolved in 1 M NaOH at a concentration of 10 mg/ml. Xanthine oxidase (XO, 7 U/mg) was dissolved in 50 mM Tris-HCl at a concentration of 50 U/ml corresponding to 10 mg/ml. To generate ROS, different concentrations of xanthine and xanthine oxidase (X/XO) were mixed in growth medium and immediately added to the cells at the indicated concentrations [12,13,14]. The vehicle containing only the solvents of X and XO was used as a negative control.
2.4. ROS Measurement
X/XO-generated ROS exposure in mesothelial and mesothelioma cells was measured using the DCFDA/H2DCFDA - Cellular ROS Assay Kit following the manufacturer’s protocol (Abcam, Cambridge, UK; Cat. No. ab113851). NP2i, Met5A, MSTO-211H and SPC212 cells were seeded into 96-well plates (Greiner Bio-One Cat. No. REF 655090) at a density of 2.5 x 10⁴ cells per well and allowed to adhere overnight. DCFDA solution (20 µM) was prepared by diluting the 20 mM DCFDA stock solution in 10% FBS-supplemented reaction buffer. The culture medium was removed, and the cells were washed with reaction buffer. Subsequently, 100 µl of 20 µM DCFDA solution was added to each well. Plates were covered with aluminium foil and incubated at 37°C for 45 minutes. After the incubation period, the DCFDA solution was removed, the cells were washed with 100 µl reaction buffer and medium without phenol red was added to each well. Then cells were treated with vehicle, different concentrations of X/XO or with tert-butyl hydroperoxide (TBHP), which was used as a positive control at a final concentration of 250 µM. The treated cells were incubated for 4 h. After treatment, fluorescence intensity was measured immediately using a microplate reader (Tecan Austria GmbH, Groedig Austria) at excitation/emission wavelengths of 485/535 nm. ROS levels were expressed as fluorescence intensity.
2.5. Cytotoxicity Detection
NP2i, Met5A, MSTO-211H and SPC212 cells were seeded in 24-well plates at a density of 105 cells per well to reach 70% confluence. To detect a potential cytotoxic effect of ROS exposure, cells were treated with X/XO at different concentrations for 24 h. On the next day, the cell culture supernatant was incubated with a dual-staining solution containing propidium iodide (PI) and Hoechst 33342 at final concentrations of 2 µg/ml and 5 µg/ml, respectively, for 1 h at 37 °C. Hoechst 33342 stained the nuclei of all cells for the assessment of nuclear morphology changes, whereas PI selectively labelled membrane-compromised (non-viable) cells. Fluorescent images were captured using a Nikon Eclipse Ti inverted fluorescence microscope and Nikon DS-Fi1c camera (Nikon Instrument Inc., Japan).
2.6. Inhibition of Signal Transduction Pathways
Pharmacological inhibitors of AKT (ipatasertib), MEK (trametinib) and RSK (BI-D1870) were dissolved in DMSO as 10 mM stocks. Cells were treated with either solvent (DMSO) or ipatasertib, trametinib or BI-D1870 at a final concentration of 10 μM each together with X/XO (20/2 µg/ml) for 24 h. Subsequent analyses were performed as described below.
2.7. Videomicroscopy and Analysis of Cell Migration
Cells were seeded in 6-well plates and on the next day treated with vehicle or X/XO with or without pathway inhibitors at the indicated concentrations for 24 h. Videos were generated using an IncuCyte S3 live cell analysis system (Sartorius AG, GÖttingen, Germany). Images were taken every 30 minutes for 24 h. Cell migration was determined by manually tracking at least 30 individual cells using Fiji/Image-J to obtain x-y coordinates for each cell at all specific time points as described previously [10]. For further analysis of migratory behaviour, such as visualization of individual cell trajectories, origin plots were generated with the DiPer tool for cell migration analysis in Microsoft Excel [15].
2.8. Cell Shape Analysis
For cell shape analysis, images were acquired using the IncuCyte S3 live cell imaging microscopy system (Sartorius AG, GÖttingen, Germany) over a 24 h treatment period. The treatment was performed using either the vehicle or X/XO with or without pathway inhibitors at the indicated concentrations. Images were analysed using Fiji/Image J by measuring cell shape parameters, including area, aspect ratio and circularity. Individual cell outlines were drawn using the freehand selection tool and the data were transferred to ROI manager. At least 30 individual cells per condition were analysed, and aspect ratios, circularity values, or circularity versus area plots are shown.
2.9. Protein Isolation and Immunoblotting
Cells were seeded in 6-well plates and left to adhere overnight. Then media were replaced with 1 ml fresh RPMI-1640 supplemented with 10% FBS and treated as indicated for 24 h. Cells were then harvested in lysis buffer II (150 mM NaCl, 50 mM HEPES, 10% glycerol, 1 mM EDTA, 0.5 mM Na3VO4, 10 mM NaF, 1% Triton X-100, and 1.5 mM MgCl2) containing protease inhibitor cocktail (Roche, Cat. No. 11697498001). Proteins were quantified using the BCA protein quantification assay (Bio-Rad Cat. No. 5000006). Immunoblotting was done as recently described [16]. After quantification, 10 µg of protein per lane was separated by SDS-PAGE and transferred onto PVDF membranes (Amersham Hybond-P 0.45 μm, Cytiva, Cat. No 1060023, MA USA) at 4oC and 18 V, overnight. The membranes were washed with 1x TBST and blocked for 1 h at room temperature in 3% BSA solution in TBST. PVDF membranes were then incubated overnight at 4oC with the respective primary antibodies (ERK 1:1000, pERK 1:1000, AKT 1:000, p-AKT 1:1000, YB-1 1:1000, pYB-1 1:500, and GAPDH 1:4000). The next day, the membranes were washed with 1 x TBST and incubated at room temperature with HRP-coupled secondary antibodies (1:10000) in BSA/TBST solution. Signals were developed using Biorad Clarity Western ECL Substrate and luminescent signals were recorded on CL-XPousure film (Thermo Scientific, Cat. No. 34089, Waltham, MA, USA). The bands were quantified using the Fiji/image J gel analysis function.
2.10. RNA Isolation and qRT-PCR
Total RNA was isolated from vehicle and X/XO treated cells using the InnuPREP Micro RNA kit (InnuScreen GmbH, Berlin, Germany) and reverse transcribed with MLV-reverse transcriptase, (Thermo Fisher Scientific, Waltham, MA, USA) according to the manufacturer´s protocol. Quantitative real-time reverse transcription (qRT)-PCR was performed for immune checkpoint genes (PD-L1/2, PVR, TNFRSF9 and VISTA) on a CFX96 Thermocycler (BioRad, Hercules, CA, USA) using iTaq universal SYBR Green Supermix (Cat. # 1725124 BioRad, USA) as described previously [10]. Primers for the immune checkpoint genes were designed with Clone Manager 9 (Scientific & Educational Software, Cary, NC, USA) or adopted from OriGene Technologies (Rockville, MD, USA). Primer sequences are listed in Supplementary Table S1. Differential gene expression levels normalized to the housekeeping gene GAPDH were calculated as 2-ΔΔCt compared to the respective control.
2.11. Statistical Analysis
All experiments were performed independently in triplicate repeats and samples were statistically analysed and plotted using GraphPad Prism (GraphPad Software, Boston, MA, USA). The data is presented as mean ± standard deviation (SD) unless stated otherwise. Comparisons between treatment conditions were performed using one-way ANOVA with Dennett’s test for multiple comparison correction. Significance is indicated as ns (not significant) p > 0.05, * p < 0.05, ** p < 0.01, *** p < 0.001, and **** p < 0.0001.
3. Results
3.1. Treatment with Xanthine and Xanthine Oxidase Induces ROS Exposure of Mesothelial and PM Cells
To subject two mesothelial (NP2i and Met5A) and two PM (MSTO-211H and SPC212) cell lines to ROS, we simultaneously co-treated them with increasing concentrations of xanthine (X) and xanthine oxidase (XO). XO catalyses the oxidation of xanthine to uric acid and, thereby generates superoxide anion and hydrogen peroxide, which has previously been used as a model for subjecting cells to oxidative stress [12,13,14]. X/XO treatment resulted in a dose-dependent increase of intracellular ROS levels detected by 2´,7-dichlorofluoerscin (DCF) fluorescence after 4 h in both types of cell models (Figure 1A-1D). The lowest concentration of 1 µg/ml X and 0.1 µg/ml XO and the highest concentration of 20 µg/ml X and 2 µg/ml XO were selected for further analysis. Neither concentration resulted in cytotoxicity when analysed by double staining with Hoechst 33342 and propidium iodide after 24 h (Figure 1E and F, Supplementary Figure S1A and 1B).
3.2. ROS Increases Cell Migration and Alters Cell Shape
During the experiments, we observed a change in cell morphology in response to ROS induction, and consequently analysed the impact of ROS on cell shape and cell migration. The results showed a significant increase in average migrated distances in all cell models 24 h after treatment with the higher concentration of 20 µg/ml X and 2 µg/ml XO (Figure 2A-2E, Supplementary Figure S2A-2C). This increased cell motility was accompanied by notable changes in cell morphology. Cells generally became more elongated, reflected in higher aspect ratios (longer diameter/shorter diameter) (Figure 2F-2I), less circular, and more spread out (indicated by a larger area) (Figure 2J, Supplementary Figure S3A-3C).
3.3. ROS Treatment Leads to Phosphorylation of ERK, AKT and YB-1
To identify signalling pathways that could mediate the ROS-induced cellular response, we analysed the MAPK and the phosphatidyl inositol 3-kinase (PI3K)/AKT pathways, two key cellular signalling pathways previously implicated in tumorigenesis and cell migration [17,18]. In agreement with the cell migration data, treatment with the higher concentration of X/XO resulted in an increased phosphorylation of ERK and AKT after 24 h of treatment. Expression levels of total ERK and total AKT remained unchanged compared to the housekeeping gene GAPDH. This effect was observed in both mesothelial cell lines (Figure 3A and 3B, Supplementary Figure S4A and 4B) as well as in the PM cells (Figure 3C and 3D, Supplementary Figure S4C and 4D). Since we had previously established YB-1 and its phosphorylation at serine 102 (pYB-1) as relevant factors in PM cell migration [10,19], we also analysed the expression of YB-1 and pYB-1. While YB-1 expression showed no change in response to the treatment, YB-1 serine 102 phosphorylation was increased by X/XO treatment at the higher concentration but not at the lower concentration in all investigated models (Figure 3A-3D, Supplementary Figure S4A-4D).
3.4. Inhibition of Signaling Pathways Can Reverse ROS-Induced Stimulation of Cell Migration and Cell Shape Changes
Having observed that ROS exposure results in increased cell migration and enhanced signalling through several pathways, we next explored whether inhibitors of the respective pathways would reverse these changes. We selected ipatasertib, a clinically investigated inhibitor of AKT [20], trametinib, a clinically approved inhibitor of MEK [21] and BI-D1870, an inhibitor of RSK, previously demonstrated by others and us to inhibit YB-1 phosphorylation [19,22]. Ipatasertib showed a relatively weak effect in NP2i and SPC212 cells and no significant effect in the other two cell models with respect to cell migration (Figure 4A-4D). Trametinib showed a strong repression of cell migration in three of the four cell models (all except Met5A), whereas BI-D1870 strongly inhibited cell migration in all four cell models (Figure 4A-4D). Similar effects were observed when the circularity of cells was investigated, except that the ipatasertib effect was significant only in NP2i and trametinib and BI-D1870 were both effective in all cell models (Figure 4E-4H).
3.5. Trametinib and BI-D1870 Lead to a Strong Reduction of YB-1 Phosphorylation
Next, we investigated the effect of the inhibitors on the respective signalling pathways. Notably, ipatasertib led to a strong increase in AKT phosphorylation in all cell models (Figure 5A-5D, Supplementary Figure S5A-5D). This effect likely resulted from reduced phosphatase accessibility induced by binding of the ATP mimetic inhibitor and was previously reported for ipatasertib and other AKT inhibitors [23,24]. Ipatasertib also showed a slight decrease in pYB-1 levels in all cell models, in line with the notion that AKT contributes to phosphorylation of YB-1 at the serine 102 position [25], which we have recently confirmed for PM cells [19]. On pERK levels, ipatasertib had either no or a slight increasing effect. In contrast, Trametinib showed a complete inhibition of ERK phosphorylation and, in addition, a strong inhibition of pYB-1 levels in all cell models in agreement with its role as MEK inhibitor [21] and the notion that RSK activity is controlled by ERK [26] (Figure 5A-5D, Supplementary Figure S5A-5D). An increasing effect of trametinib on pAKT was seen only in NP2i but not in other models. The RSK inhibitor BI-D1870 had the strongest inhibiting effect on pYB-1 levels, and a weaker inhibiting effect on pAKT levels in all cell models but an increasing effect on pERK levels in three out of four models (all except NP2i) (Figure 5A-5D, Supplementary Figure S5A-5D).
3.6. ROS Treatment Increases the Expression of PD-L1 and PD-L2 but Not of TNFRSF9, PVR or VISTA
Since expression of immune checkpoint proteins (ICPs) has been linked to cancer development, prognosis and therapy response, we next investigated the impact of ROS on the expression of several ICPs relevant to PM [27]. We analysed the expression levels of PD-L1, PD-L2, PVR, TNFRSF9 and VISTA after 24 h of ROS treatment by qRT-PCR. A striking effect was observed for PDL-1, which was up to 4-fold increased in both mesothelial and PM cell models at the higher X/XO concentration (Figure 6A-6D). Similarly, PD-L2 was significantly upregulated in both mesothelial and PM cells. The other ICPs showed less consistent effects with PVR upregulated only in SPC212 but downregulated in NP2i after the higher X/XO concentration and TNFRSF9 and VISTA not significantly affected in any of the models (Figure 6A-6D).
3.7. PDL-1 and PDL-2 Expression Is Reduced by Trametinib and BI-D1870
Finally, we investigated the effect of signal pathway inhibition on PD-L1 and PD-L2 expression under ROS treatment (Figure 6E-6H). Ipatasertib showed a tendency to further increase both PD-L1 and PD-L2 expression in all models except NP2i. Trametinib and BI-D1870, in contrast, showed a tendency to reduce both PD-L1 and PD-L2 levels in the two PM cell models and one of the mesothelial cell models (NP2i).
4. Discussion
Since the realization that development of PM is closely linked to asbestos exposure [28], it has become increasingly evident that chronic inflammation and the associated exposure of mesothelial cells to ROS play important roles in the pathophysiological process [4,29]. ROS exposure is known for inducing DNA damage and thereby increasing mutation rates [29]. High doses of ROS are also cytotoxic, resulting in cell death and subsequent regenerative growth that can accelerate the conversion of damaged DNA into mutations. In fact, a number of recurring mutations, mostly in tumour suppressor genes have been described in PM [30] and ROS exposure is likely to contribute to these mutations. The overall mutational burden of PM, however, is relatively low when compared to other cancers, especially lung cancer [31]. Activating mutations in oncogenes such as RAS or EGFR, for instance, which are known to drive cell proliferation and migration, are frequently found in lung cancer [32], but are rarely observed in PM. Previous studies have shown that the tumour microenvironment, in particular cancer-associated fibroblasts (CAFs), contribute to the promotion of growth and migration of PM cells [33,34]. Here we show that ROS are another source of migration-stimulating signals not only for PM cells but also for the mesothelial cells from which PM develops. ROS-mediated stimulation of cell migration has previously been shown in other cell types, e.g. prostate cancer cells [35]. In addition, ROS plays an important role in cell migration during wound healing [36]. A recent paper has linked nanoplastics-induced stimulation of cell migration in cultured non-malignant lung cells (BEAS-2B) to increased ROS levels [37].
Stimulation of migration by ROS in our study was associated with the activation of key cell signalling pathways. Activation of the MAP-kinase pathway as well as the PI3K/AKT pathway by ROS is well documented in various cell types [38], but the role of YB-1 phosphorylation in this context has received less attention. Our group has previously identified YB-1 as a relevant player in cell migration in PM cells via its ability to post-transcriptionally regulate Snail expression [10]. In addition, we have demonstrated that PM cell migration can be reduced by inhibiting YB-1 phosphorylation at the serine 102 position [19]. Furthermore, it has also been demonstrated that YB-1 expression is upregulated in PM cells compared to normal mesothelial cells in vitro and in tissue sections [19,39]. In the current study, we show that ROS exposure did not increase YB-1 expression in either mesothelial or PM cells and thus ROS does not seem to contribute to the upregulation of YB-1 in PM. Nevertheless, a strong stimulation of YB-1 phosphorylation at serine 102 in response to ROS exposure was seen in the mesothelial and the PM cells. RSK, which itself is phosphorylated by ERK and PI3K, has been shown to mediate YB-1 phosphorylation at serine 102 [40]. Therefore, we used an RSK inhibitor to block YB-1 phosphorylation. Our data clearly demonstrate that YB-1 is phosphorylated in response to ROS exposure, and that inhibition of kinases upstream of YB-1 reduced both YB-1 phosphorylation and ROS-induced effects. However, RSK targets other than YB-1 [26] may also be required to mediate the effects observed with the RSK inhibitor.
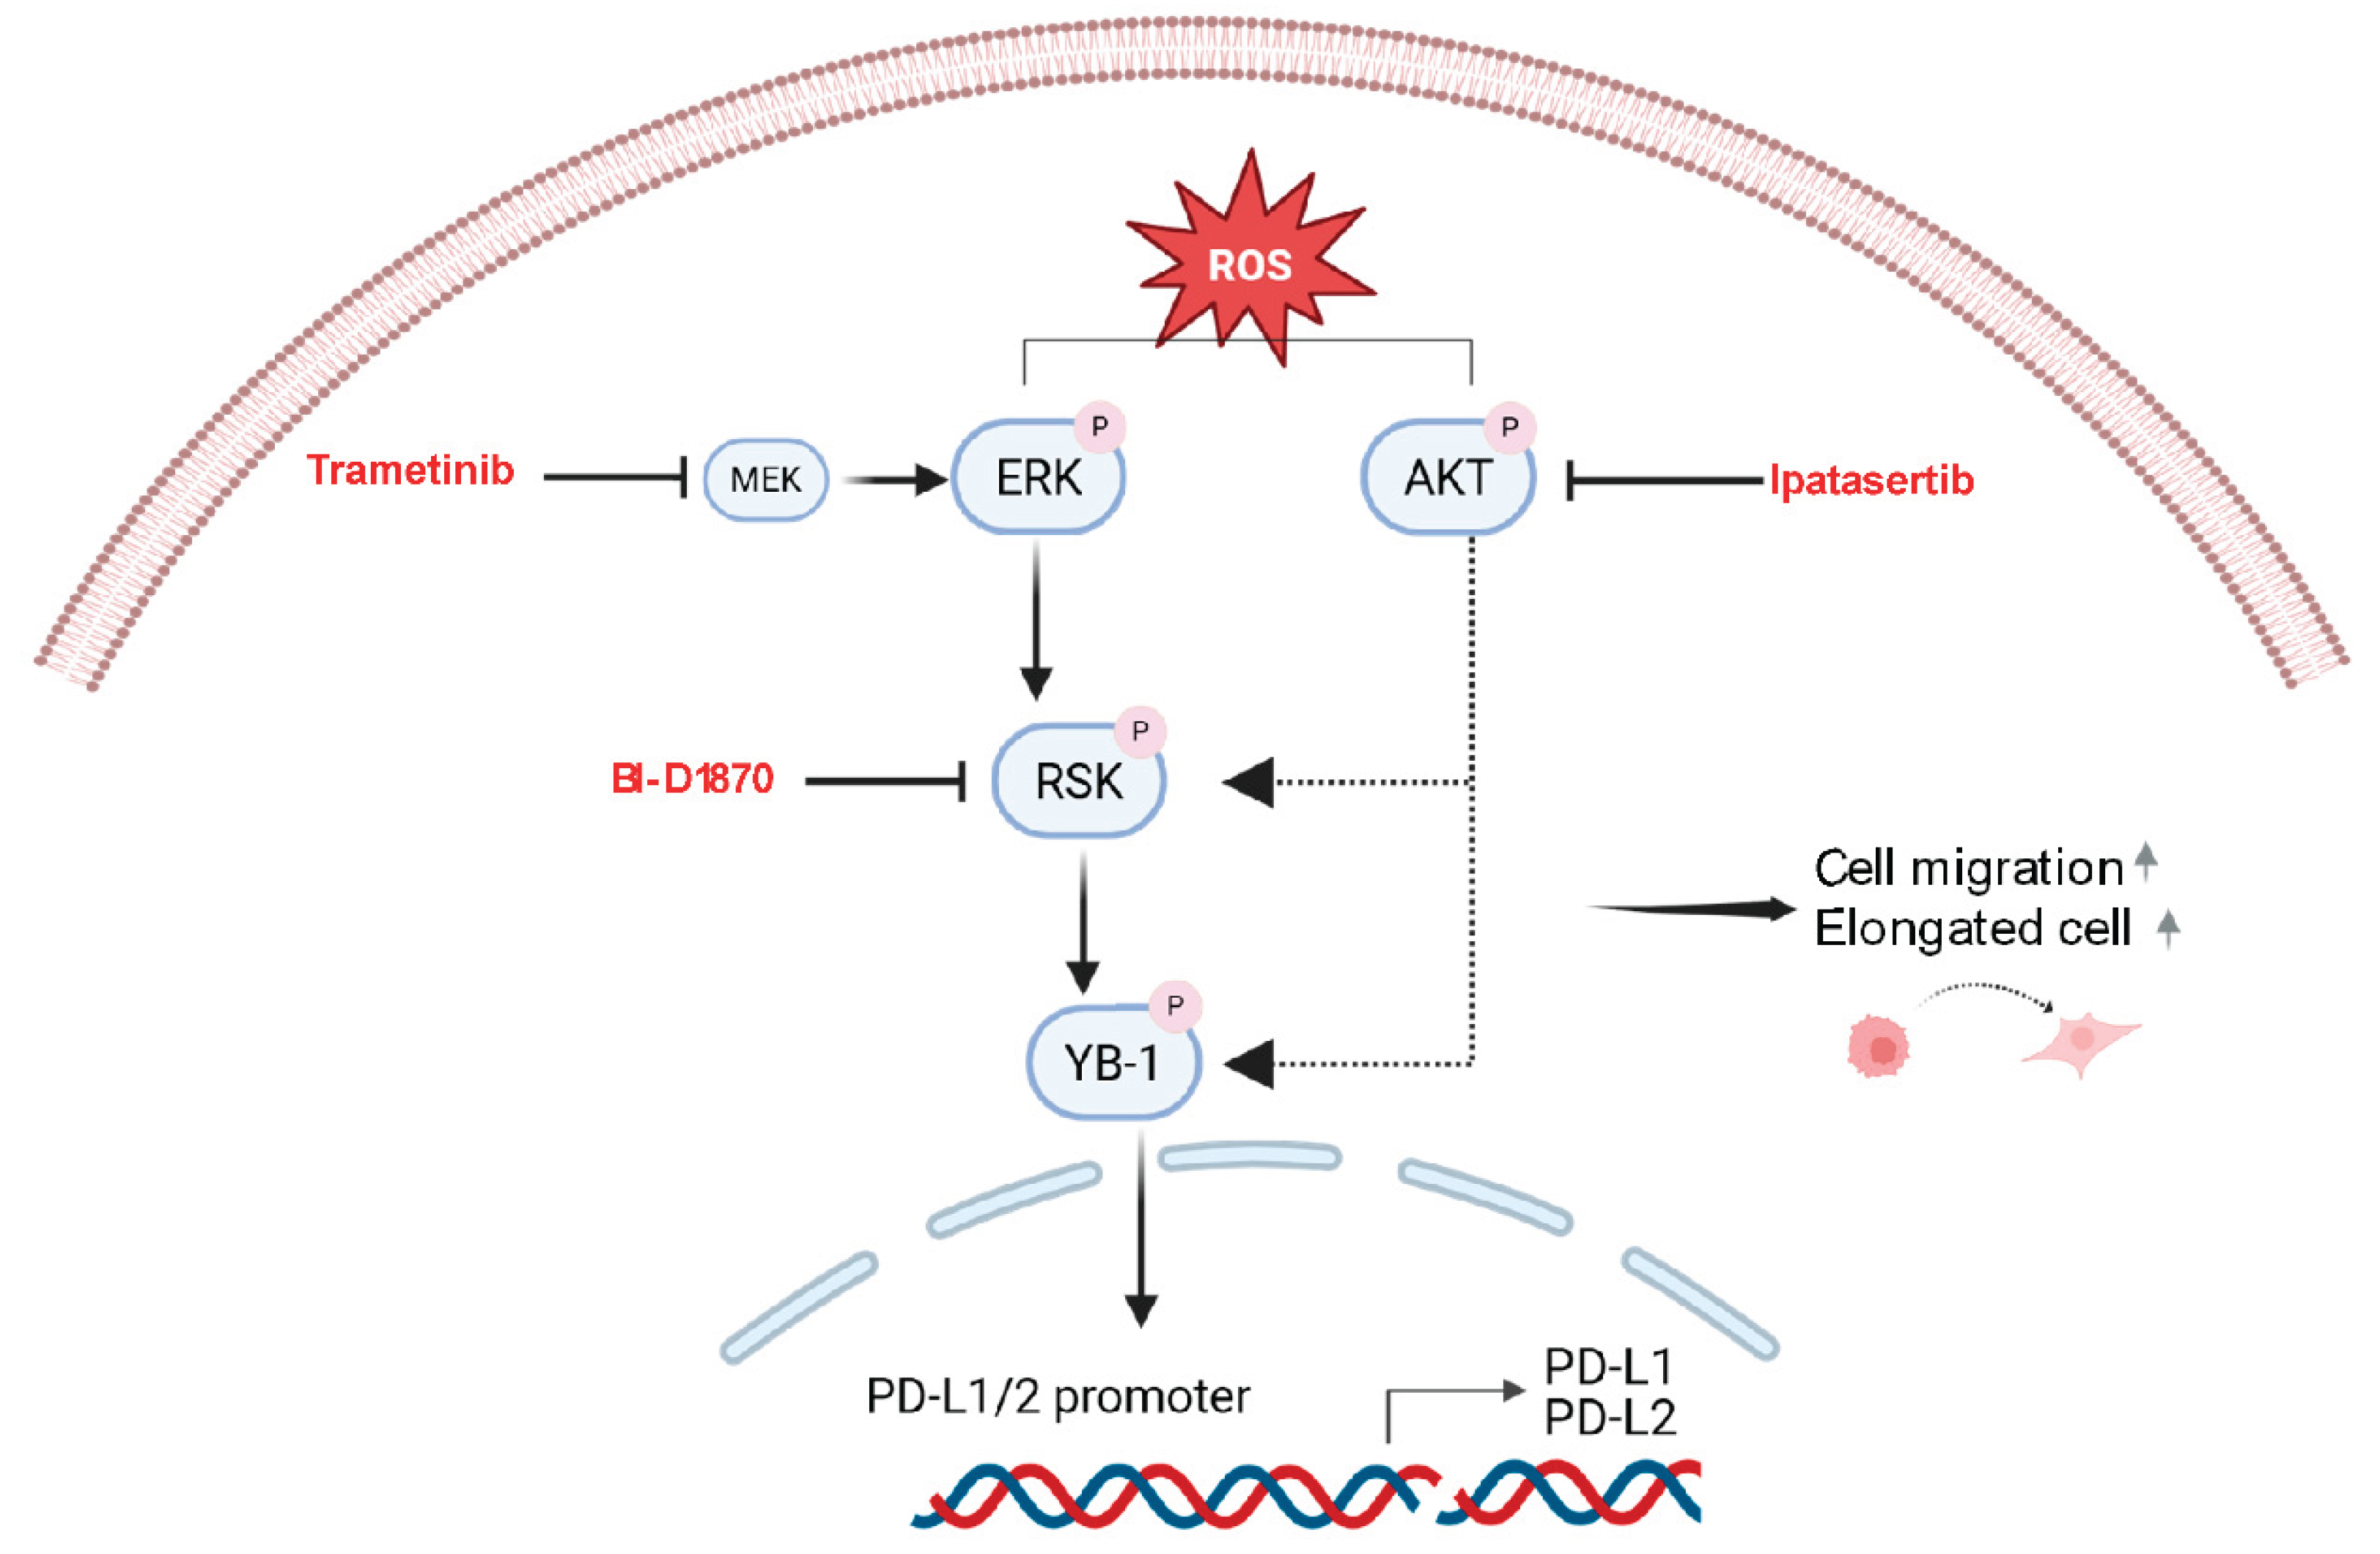
Immune checkpoint proteins, especially PD-L1, have emerged as key therapeutic targets in various malignancies, including PM [41,42]. Expression of PD-L1 by tumour cells has been recognized as an important contributor to immune evasion during cancer development [41,43]. Our data suggest that the upregulation of PD-L1 and its related protein, PD-L2, may already begin at an early stage of mesothelioma development when mesothelial cells are exposed to increased ROS levels. While differences in the regulation of expression have been described for PD-L1 and PD-L2 in macrophages and other cell types [44,45], both ligands showed a remarkable similarity in their regulation in our models. Interferon gamma is considered one of the most prominent inducers of PD-L1 expression in many cell types [43,46]. In PM cells, our group has previously described upregulation of PD-L1 also by FGF2 or EGF via the MAPK pathway [47]. The impact of ROS on PD-L1 expression appears to be context dependent, as both upregulation and downregulation have been reported [48]. In lung adenocarcinoma cell lines, for instance, it was demonstrated that iron-mediated oxidative stress increased PD-L1 expression in a c-Myc-dependent manner [49]. In contrast, elevated generation of mitochondrial ROS has resulted in downregulation of PD-L1 via ubiquitination and subsequent degradation [50]. To the best of our knowledge, the impact of ROS exposure on PD-L1 expression in mesothelial cells has not been described previously. While our data show no evidence of YB-1 upregulation by ROS exposure, the increased phosphorylation at serine 102 has been previously shown by others and us to result in increased presence of YB-1 in the cell nucleus in different cell types [19,51,52]. Importantly, several reports have established that YB-1 can upregulate PD-L1 expression via transcriptional activation [53,54,55]. Thus, our data are consistent with a model, in which ROS leads to MAPK/RSK pathway- and, to a lesser degree, PI3K pathway-mediated phosphorylation of YB-1 in PM cells. Subsequently, it is also proposed that this mechanistic regulation via ROS induces PD-L1 transcription by YB-1 in the nucleus as depicted in schematic form in Figure 7.
The mechanistic link between ROS, MAPK/PI3K/RSK signalling, YB-1 phosphorylation and PD-L1 expression may be important for both therapeutic and preventive settings in PM. Importantly, reducing PD-L1 expression through blocking upstream signalling with kinase inhibitors could lead to enhanced antitumor immune responses in PM patients. In this respect, it has recently been shown for lung cancer that downregulating PD-L1 expression by the ability of CDKL1 to reduce the binding of YB-1 to the PD-L1 promoter enhanced the efficacy of radioimmunotherapy [54]. In preventive settings, blocking immune evasive signals may hold promise for slowing or preventing the development of PM. Kinase inhibitors, such as trametinib or BI-D1870 may be problematic for long-term preventive administration due to side effects. However, healthier diets rich in antioxidants could be envisioned to reduce ROS exposure of mesothelial cells and potentially reduce their PD-L1 expression and its immune evasive capabilities.
In summary, we demonstrate that ROS exposure in mesothelial and PM cells can contribute to enhanced cell migration and PD-L1 upregulation. Our data provide a clear rationale for further exploring the link between ROS exposure, signalling pathway activation and immune checkpoint protein expression during PM development.
Supplementary Materials
The following supporting information can be downloaded at the website of this paper posted on Preprints.org.
Acknowledgments
We thank Barbara Peter-Vörösmarty and Georg Schröckenfuchs for technical assistance and help with immunoblotting and cell culture, respectively. We also thank our colleagues from the group of Gergely Szakacs for their valuable support during this study.
Author Contributions
M. Hashim: Conceptualization, Data curation, Formal analysis, Funding acquisition, Investigation, Methodology, Project administration, Validation, Visualization, Writing – original draft, Writing - review & editing. D. G. Timelthaler, Kirchhofer, B.I. Kudlacek, B. Mosleh, K. Sinn: Formal analysis, Investigation, Methodology, Writing - review & editing. E. M. Awad, M.A. Hoda, B. Grasl-Kraupp, B. Dome, W. Berger: Resources, Supervision, Validation, Writing - review & editing. G. Krupitza, K. Schelch: Conceptualization, Funding acquisition, Methodology, Resources, Supervision, Writing - review & editing. M. Grusch: Conceptualization, Funding acquisition, Project administration, Resources, Supervision, Validation, Visualization, writing – original draft, Writing - review & editing.
Data availability
The data generated in this study are available within the article and its supplementary material file.
Competing Interests
All authors declare no direct competing interest for this work.
Funding information
M.H. was funded by the Higher Education Commission of Pakistan (HRD/OSS-III/2022/HEC) and Austria’s Agency for Education and Internationalization (OeAD). M.G. was supported by the City of Vienna Fund for Innovative Interdisciplinary Cancer Research (No. 21132). K.Sc. was supported by the Austrian Science Fund (FWF No. T 1062-B33) and the City of Vienna Fund for Innovative Interdisciplinary Cancer Research. B.D. was supported by the Austrian Science Fund (FWF I4677), the “BIOSMALL” EU HORIZON-MSCA-2022-SE-01 project, and by the Hungarian National Research, Development, and Innovation Office (2020-1.1.6-JÖVŐ, TKP2021-EGA-33).
Abbreviations
The following abbreviations are used in this manuscript
| ROS | Reactive oxygen species |
| PD-L1 | Programmed death ligand 1 |
| PM | Pleural mesothelioma |
| BAP1 | BRCA1-associated protein 1 |
| MTAP | Methylthioadenosine phosphorylase |
| CDKN2A | Cyclin-dependent kinase inhibitor 2A |
| TP53 | Tumor protein 53 |
| MAPK | Mitogen activated protein kinase |
| AKT | Protein kinase B |
| YB-1 | Y-box binding protein 1 |
| RSK | p90 ribosomal S6 kinase |
| X | Xanthine |
| XO | Xanthine oxidase |
| CAFs | Cancer Associated fibroblasts |
| FGF2 | Fibroblasts growth factor 2 |
| EGF | Epidermal growth factor |
| NP2i | Immortalized hTERT transduced primary mesothelial cells |
References
- Hiriart, E.; Deepe, R.; Wessels, A. Mesothelium and Malignant Mesothelioma. J Dev Biol 2019, 7. [CrossRef]
- Nowak, A.K.; Jackson, A.; Sidhu, C. Management of Advanced Pleural Mesothelioma-At the Crossroads. JCO Oncol Pract 2022, 18, 116-124. [CrossRef]
- Chu, Q.; Perrone, F.; Greillier, L.; Tu, W.; Piccirillo, M.C.; Grosso, F.; Lo Russo, G.; Florescu, M.; Mencoboni, M.; Morabito, A.; Cecere, F.L.; Ceresoli, G.L.; Dawe, D.E.; Zucali, P.A.; Pagano, M.; Goffin, J.R.; Sanchez, M.L.; Gridelli, C.; Zalcman, G.; Quantin, X.; Westeel, V.; Gargiulo, P.; Delfanti, S.; Tu, D.; Lee, C.W.; Leighl, N.; Sederias, J.; Brown-Walker, P.; Luo, Y.; Lantuejoul, S.; Tsao, M.S.; Scherpereel, A.; Bradbury, P.; Laurie, S.A.; Seymour, L. Pembrolizumab plus chemotherapy versus chemotherapy in untreated advanced pleural mesothelioma in Canada, Italy, and France: a phase 3, open-label, randomised controlled trial. Lancet 2023, 402, 2295-2306. [CrossRef]
- Gualtieri, A.F. Journey to the centre of the lung. The perspective of a mineralogist on the carcinogenic effects of mineral fibres in the lungs. J Hazard Mater 2023, 442, 130077. [CrossRef]
- Benedetti, S.; Nuvoli, B.; Catalani, S.; Galati, R. Reactive oxygen species a double-edged sword for mesothelioma. Oncotarget 2015, 6, 16848-16865. [CrossRef]
- Barbarino, M.; Giordano, A. Assessment of the Carcinogenicity of Carbon Nanotubes in the Respiratory System. Cancers (Basel) 2021, 13. [CrossRef]
- Juan, C.A.; Perez de la Lastra, J.M.; Plou, F.J.; Perez-Lebena, E. The Chemistry of Reactive Oxygen Species (ROS) Revisited: Outlining Their Role in Biological Macromolecules (DNA, Lipids and Proteins) and Induced Pathologies. Int J Mol Sci 2021, 22. [CrossRef]
- Hiltbrunner, S.; Fleischmann, Z.; Sokol, E.S.; Zoche, M.; Felley-Bosco, E.; Curioni-Fontecedro, A. Genomic landscape of pleural and peritoneal mesothelioma tumours. Br J Cancer 2022, 127, 1997-2005. [CrossRef]
- Ries, A.; Slany, A.; Pirker, C.; Mader, J.C.; Mejri, D.; Mohr, T.; Schelch, K.; Flehberger, D.; Maach, N.; Hashim, M.; Hoda, M.A.; Dome, B.; Krupitza, G.; Berger, W.; Gerner, C.; Holzmann, K.; Grusch, M. Primary and hTERT-Transduced Mesothelioma-Associated Fibroblasts but Not Primary or hTERT-Transduced Mesothelial Cells Stimulate Growth of Human Mesothelioma Cells. Cells 2023, 12. [CrossRef]
- Schelch, K.; Eder, S.; Zitta, B.; Phimmachanh, M.; Johnson, T.G.; Emminger, D.; Wenninger-Weinzierl, A.; Sturtzel, C.; Poplimont, H.; Ries, A.; Hoetzenecker, K.; Hoda, M.A.; Berger, W.; Distel, M.; Dome, B.; Reid, G.; Grusch, M. YB-1 regulates mesothelioma cell migration via snail but not EGFR, MMP1, EPHA5 or PARK2. Mol Oncol 2024, 18, 815-831. [CrossRef]
- Pirker, C.; Bilecz, A.; Grusch, M.; Mohr, T.; Heidenreich, B.; Laszlo, V.; Stockhammer, P.; Lotsch-Gojo, D.; Gojo, J.; Gabler, L.; Spiegl-Kreinecker, S.; Dome, B.; Steindl, A.; Klikovits, T.; Hoda, M.A.; Jakopovic, M.; Samarzija, M.; Mohorcic, K.; Kern, I.; Kiesel, B.; Brcic, L.; Oberndorfer, F.; Mullauer, L.; Klepetko, W.; Schmidt, W.M.; Kumar, R.; Hegedus, B.; Berger, W. Telomerase Reverse Transcriptase Promoter Mutations Identify a Genomically Defined and Highly Aggressive Human Pleural Mesothelioma Subgroup. Clin Cancer Res 2020, 26, 3819-3830. [CrossRef]
- Aitken, R.J.; Buckingham, D.; Harkiss, D. Use of a xanthine oxidase free radical generating system to investigate the cytotoxic effects of reactive oxygen species on human spermatozoa. J Reprod Fertil 1993, 97, 441-450. [CrossRef]
- Cerutti, P.; Larsson, R.; Krupitza, G.; Muehlematter, D.; Crawford, D.; Amstad, P. Pathophysiological mechanisms of active oxygen. Mutat Res 1989, 214, 81-88. [CrossRef]
- Hagedorn, M.; McCarthy, M.; Carter, V.L.; Meyers, S.A. Oxidative stress in zebrafish (Danio rerio) sperm. PLoS One 2012, 7, e39397. [CrossRef]
- Gorelik, R.; Gautreau, A. Quantitative and unbiased analysis of directional persistence in cell migration. Nat Protoc 2014, 9, 1931-1943. [CrossRef]
- Schelch, K.; Emminger, D.; Zitta, B.; Johnson, T.G.; Kopatz, V.; Eder, S.; Ries, A.; Stefanelli, A.; Heffeter, P.; Hoda, M.A.; Hoetzenecker, K.; Dome, B.; Berger, W.; Reid, G.; Grusch, M. Targeting YB-1 via entinostat enhances cisplatin sensitivity of pleural mesothelioma in vitro and in vivo. Cancer Lett 2023, 574, 216395. [CrossRef]
- Huang, C.; Jacobson, K.; Schaller, M.D. MAP kinases and cell migration. J Cell Sci 2004, 117, 4619-4628. [CrossRef]
- Tsai, P.J.; Lai, Y.H.; Manne, R.K.; Tsai, Y.S.; Sarbassov, D.; Lin, H.K. Akt: a key transducer in cancer. J Biomed Sci 2022, 29, 76. [CrossRef]
- Schelch, K.; Maach, N.; Hashim, M.; Zitta, B.; Kirchhofer, D.; Timelthaler, G.; Solta, A.; Emminger, D.; Kopatz, V.; Hoda, M.A.; Berger, W.; Aigner, C.; Dome, B.; Reid, G.; Grusch, M. Inhibition of YB-1 phosphorylation enhances cisplatin activity and disrupts cell division in pleural mesothelioma. Br J Cancer 2025. [CrossRef]
- Sweeney, C.; Bracarda, S.; Sternberg, C.N.; Chi, K.N.; Olmos, D.; Sandhu, S.; Massard, C.; Matsubara, N.; Alekseev, B.; Parnis, F.; Atduev, V.; Buchschacher, G.L., Jr.; Gafanov, R.; Corrales, L.; Borre, M.; Stroyakovskiy, D.; Alves, G.V.; Bournakis, E.; Puente, J.; Harle-Yge, M.L.; Gallo, J.; Chen, G.; Hanover, J.; Wongchenko, M.J.; Garcia, J.; de Bono, J.S. Ipatasertib plus abiraterone and prednisolone in metastatic castration-resistant prostate cancer (IPATential150): a multicentre, randomised, double-blind, phase 3 trial. Lancet 2021, 398, 131-142. [CrossRef]
- Zeiser, R.; Andrlova, H.; Meiss, F. Trametinib (GSK1120212). Recent Results Cancer Res 2018, 211, 91-100. [CrossRef]
- Stratford, A.L.; Reipas, K.; Hu, K.; Fotovati, A.; Brough, R.; Frankum, J.; Takhar, M.; Watson, P.; Ashworth, A.; Lord, C.J.; Lasham, A.; Print, C.G.; Dunn, S.E. Targeting p90 ribosomal S6 kinase eliminates tumor-initiating cells by inactivating Y-box binding protein-1 in triple-negative breast cancers. Stem Cells 2012, 30, 1338-1348. [CrossRef]
- Lin, K.; Lin, J.; Wu, W.I.; Ballard, J.; Lee, B.B.; Gloor, S.L.; Vigers, G.P.; Morales, T.H.; Friedman, L.S.; Skelton, N.; Brandhuber, B.J. An ATP-site on-off switch that restricts phosphatase accessibility of Akt. Sci Signal 2012, 5, ra37. [CrossRef]
- O'Donnell, J.; Zhao, Z.; Buckingham, L.; Hao, T.; Suo, H.; Zhang, X.; Fan, Y.; John, C.; Deng, B.; Shen, X.; Sun, W.; Secord, A.A.; Zhou, C.; Bae-Jump, V.L. Ipatasertib exhibits anti-tumorigenic effects and enhances sensitivity to paclitaxel in endometrial cancer in vitro and in vivo. Int J Oncol 2023, 63. [CrossRef]
- Sutherland, B.W.; Kucab, J.; Wu, J.; Lee, C.; Cheang, M.C.; Yorida, E.; Turbin, D.; Dedhar, S.; Nelson, C.; Pollak, M.; Leighton Grimes, H.; Miller, K.; Badve, S.; Huntsman, D.; Blake-Gilks, C.; Chen, M.; Pallen, C.J.; Dunn, S.E. Akt phosphorylates the Y-box binding protein 1 at Ser102 located in the cold shock domain and affects the anchorage-independent growth of breast cancer cells. Oncogene 2005, 24, 4281-4292. [CrossRef]
- Wright, E.B.; Lannigan, D.A. Therapeutic targeting of p90 ribosomal S6 kinase. Front Cell Dev Biol 2023, 11, 1297292. [CrossRef]
- Gray, S.G. Emerging avenues in immunotherapy for the management of malignant pleural mesothelioma. BMC Pulm Med 2021, 21, 148. [CrossRef]
- Wagner, J.C.; Sleggs, C.A.; Marchand, P. Diffuse pleural mesothelioma and asbestos exposure in the North Western Cape Province. Br J Ind Med 1960, 17, 260-271. [CrossRef]
- Shukla, A.; Gulumian, M.; Hei, T.K.; Kamp, D.; Rahman, Q.; Mossman, B.T. Multiple roles of oxidants in the pathogenesis of asbestos-induced diseases. Free Radic Biol Med 2003, 34, 1117-1129. [CrossRef]
- Bueno, R.; Stawiski, E.W.; Goldstein, L.D.; Durinck, S.; De Rienzo, A.; Modrusan, Z.; Gnad, F.; Nguyen, T.T.; Jaiswal, B.S.; Chirieac, L.R.; Sciaranghella, D.; Dao, N.; Gustafson, C.E.; Munir, K.J.; Hackney, J.A.; Chaudhuri, A.; Gupta, R.; Guillory, J.; Toy, K.; Ha, C.; Chen, Y.J.; Stinson, J.; Chaudhuri, S.; Zhang, N.; Wu, T.D.; Sugarbaker, D.J.; de Sauvage, F.J.; Richards, W.G.; Seshagiri, S. Comprehensive genomic analysis of malignant pleural mesothelioma identifies recurrent mutations, gene fusions and splicing alterations. Nat Genet 2016, 48, 407-416. [CrossRef]
- Chalmers, Z.R.; Connelly, C.F.; Fabrizio, D.; Gay, L.; Ali, S.M.; Ennis, R.; Schrock, A.; Campbell, B.; Shlien, A.; Chmielecki, J.; Huang, F.; He, Y.; Sun, J.; Tabori, U.; Kennedy, M.; Lieber, D.S.; Roels, S.; White, J.; Otto, G.A.; Ross, J.S.; Garraway, L.; Miller, V.A.; Stephens, P.J.; Frampton, G.M. Analysis of 100,000 human cancer genomes reveals the landscape of tumor mutational burden. Genome Med 2017, 9, 34. [CrossRef]
- Chapman, A.M.; Sun, K.Y.; Ruestow, P.; Cowan, D.M.; Madl, A.K. Lung cancer mutation profile of EGFR, ALK, and KRAS: Meta-analysis and comparison of never and ever smokers. Lung Cancer 2016, 102, 122-134. [CrossRef]
- Ries, A.; Flehberger, D.; Slany, A.; Pirker, C.; Mader, J.C.; Mohr, T.; Schelch, K.; Sinn, K.; Mosleh, B.; Hoda, M.A.; Dome, B.; Dolznig, H.; Krupitza, G.; Mullauer, L.; Gerner, C.; Berger, W.; Grusch, M. Mesothelioma-associated fibroblasts enhance proliferation and migration of pleural mesothelioma cells via c-Met/PI3K and WNT signaling but do not protect against cisplatin. J Exp Clin Cancer Res 2023, 42, 27. [CrossRef]
- Chrisochoidou, Y.; Roy, R.; Farahmand, P.; Gonzalez, G.; Doig, J.; Krasny, L.; Rimmer, E.F.; Willis, A.E.; MacFarlane, M.; Huang, P.H.; Carragher, N.O.; Munro, A.F.; Murphy, D.J.; Veselkov, K.; Seckl, M.J.; Moffatt, M.F.; Cookson, W.O.C.; Pardo, O.E. Crosstalk with lung fibroblasts shapes the growth and therapeutic response of mesothelioma cells. Cell Death Dis 2023, 14, 725. [CrossRef]
- Qi, P.; Zhao, J.; Zhang, H.; Liu, X.; You, Q.; Niu, J.; Ye, X.; Li, F. TRPM2 channels mediate ROS-induced actin remodeling and cell migration of prostate cancer cells. BMC Cancer 2025, 25, 956. [CrossRef]
- Hunt, M.; Torres, M.; Bachar-Wikstrom, E.; Wikstrom, J.D. Cellular and molecular roles of reactive oxygen species in wound healing. Commun Biol 2024, 7, 1534. [CrossRef]
- Ernhofer, B.; Spittler, A.; Ferk, F.; Misik, M.; Zylka, M.M.; Glatt, L.; Boettiger, K.; Solta, A.; Kirchhofer, D.; Timelthaler, G.; Megyesfalvi, Z.; Kopatz, V.; Kovar, H.; Knasmueller, S.; Aigner, C.; Kenner, L.; Dome, B.; Schelch, K. Small Particles, Big Problems: Polystyrene nanoparticles induce DNA damage, oxidative stress, migration, and mitogenic pathways predominantly in non-malignant lung cells. J Hazard Mater 2025, 495, 139129. [CrossRef]
- Zhang, J.; Wang, X.; Vikash, V.; Ye, Q.; Wu, D.; Liu, Y.; Dong, W. ROS and ROS-Mediated Cellular Signaling. Oxid Med Cell Longev 2016, 2016, 4350965. [CrossRef]
- Johnson, T.G.; Schelch, K.; Cheng, Y.Y.; Williams, M.; Sarun, K.H.; Kirschner, M.B.; Kao, S.; Linton, A.; Klebe, S.; McCaughan, B.C.; Lin, R.C.Y.; Pirker, C.; Berger, W.; Lasham, A.; van Zandwijk, N.; Reid, G. Dysregulated Expression of the MicroRNA miR-137 and Its Target YBX1 Contribute to the Invasive Characteristics of Malignant Pleural Mesothelioma. J Thorac Oncol 2018, 13, 258-272. [CrossRef]
- Stratford, A.L.; Fry, C.J.; Desilets, C.; Davies, A.H.; Cho, Y.Y.; Li, Y.; Dong, Z.; Berquin, I.M.; Roux, P.P.; Dunn, S.E. Y-box binding protein-1 serine 102 is a downstream target of p90 ribosomal S6 kinase in basal-like breast cancer cells. Breast Cancer Res 2008, 10, R99. [CrossRef]
- Jiang, Y.; Chen, M.; Nie, H.; Yuan, Y. PD-1 and PD-L1 in cancer immunotherapy: clinical implications and future considerations. Hum Vaccin Immunother 2019, 15, 1111-1122. [CrossRef]
- Calabro, L.; Bronte, G.; Grosso, F.; Cerbone, L.; Delmonte, A.; Nicolini, F.; Mazza, M.; Di Giacomo, A.M.; Covre, A.; Lofiego, M.F.; Crino, L.; Maio, M. Immunotherapy of mesothelioma: the evolving change of a long-standing therapeutic dream. Front Immunol 2023, 14, 1333661. [CrossRef]
- Lin, X.; Kang, K.; Chen, P.; Zeng, Z.; Li, G.; Xiong, W.; Yi, M.; Xiang, B. Regulatory mechanisms of PD-1/PD-L1 in cancers. Mol Cancer 2024, 23, 108. [CrossRef]
- Loke, P.; Allison, J.P. PD-L1 and PD-L2 are differentially regulated by Th1 and Th2 cells. Proc Natl Acad Sci U S A 2003, 100, 5336-5341. [CrossRef]
- Keir, M.E.; Butte, M.J.; Freeman, G.J.; Sharpe, A.H. PD-1 and its ligands in tolerance and immunity. Annu Rev Immunol 2008, 26, 677-704. [CrossRef]
- Chen, S.; Crabill, G.A.; Pritchard, T.S.; McMiller, T.L.; Wei, P.; Pardoll, D.M.; Pan, F.; Topalian, S.L. Mechanisms regulating PD-L1 expression on tumor and immune cells. J Immunother Cancer 2019, 7, 305. [CrossRef]
- Schelch, K.; Wagner, C.; Hager, S.; Pirker, C.; Siess, K.; Lang, E.; Lin, R.; Kirschner, M.B.; Mohr, T.; Brcic, L.; Marian, B.; Holzmann, K.; Grasl-Kraupp, B.; Krupitza, G.; Laszlo, V.; Klikovits, T.; Dome, B.; Hegedus, B.; Garay, T.; Reid, G.; van Zandwijk, N.; Klepetko, W.; Berger, W.; Grusch, M.; Hoda, M.A. FGF2 and EGF induce epithelial-mesenchymal transition in malignant pleural mesothelioma cells via a MAPKinase/MMP1 signal. Carcinogenesis 2018, 39, 534-545. [CrossRef]
- Bailly, C. Regulation of PD-L1 expression on cancer cells with ROS-modulating drugs. Life Sci 2020, 246, 117403. [CrossRef]
- Battaglia, A.M.; Sacco, A.; Aversa, I.; Santamaria, G.; Palmieri, C.; Botta, C.; De Stefano, R.; Bitetto, M.; Petriaggi, L.; Giorgio, E.; Faniello, C.M.; Costanzo, F.; Biamonte, F. Iron-mediated oxidative stress induces PD-L1 expression via activation of c-Myc in lung adenocarcinoma. Front Cell Dev Biol 2023, 11, 1208485. [CrossRef]
- Liu, J.; Zhang, R.; Bao, Y.; Chen, Y.; Zheng, W.; Yuan, J.; Zhang, Z.; Chen, P.; Ji, M.; Cheng, Y.; Hou, P.; Dang, D.; Ding, D.; Chen, C. Highly Efficient and Universal Degradation of PD-L1 via Mitochondrial Oxidative Stress Evoked by Cationic AIE-Active Photosensitizers for Cancer Immunotherapy. Advanced Functional Materials 2025, 35. [CrossRef]
- Kretov, D.A.; Mordovkina, D.A.; Eliseeva, I.A.; Lyabin, D.N.; Polyakov, D.N.; Joshi, V.; Desforges, B.; Hamon, L.; Lavrik, O.I.; Pastre, D.; Curmi, P.A.; Ovchinnikov, L.P. Inhibition of Transcription Induces Phosphorylation of YB-1 at Ser102 and Its Accumulation in the Nucleus. Cells 2019, 9. [CrossRef]
- Gieseler-Halbach, S.; Meltendorf, S.; Pierau, M.; Weinert, S.; Heidel, F.H.; Fischer, T.; Handschuh, J.; Braun-Dullaeus, R.C.; Schrappe, M.; Lindquist, J.A.; Mertens, P.R.; Thomas, U.; Brunner-Weinzierl, M.C. RSK-mediated nuclear accumulation of the cold-shock Y-box protein-1 controls proliferation of T cells and T-ALL blasts. Cell Death Differ 2017, 24, 371-383. [CrossRef]
- Tao, Z.; Ruan, H.; Sun, L.; Kuang, D.; Song, Y.; Wang, Q.; Wang, T.; Hao, Y.; Chen, K. Targeting the YB-1/PD-L1 Axis to Enhance Chemotherapy and Antitumor Immunity. Cancer Immunol Res 2019, 7, 1135-1147. [CrossRef]
- Li, Z.; Xue, H.; Li, J.; Zheng, Z.; Liu, Z.; Dong, X.; Wang, H.; Chen, J.; Xu, S. CDKL1 potentiates the antitumor efficacy of radioimmunotherapy by binding to transcription factor YBX1 and blocking PD-L1 expression in lung cancer. J Exp Clin Cancer Res 2024, 43, 89. [CrossRef]
- Ru, J.; Lu, J.; Ge, J.; Ding, B.; Su, R.; Jiang, Y.; Sun, Y.; Ma, J.; Li, Y.; Sun, J.; Xu, G.; Tong, R.; Zheng, S.; Yang, B.; Wu, J. IRGM is a novel regulator of PD-L1 via promoting S6K1-mediated phosphorylation of YBX1 in hepatocellular carcinoma. Cancer Lett 2024, 581, 216495. [CrossRef]
Figure 1.
Treatment with xanthine and xanthine oxidase leads to generation of reactive oxygen species in mesothelial and mesothelioma cells. Bar graphs depicting DCF fluorescence intensity (arbitrary units) for mesothelial cells (A, B), and for pleural mesothelioma (C, D) cell lines after treatment with xanthine/xanthine oxidase (X/XO) at the indicated concentrations compared to vehicle (V) and positive control (TBHP, 250 µM). Data were analysed by one-way ANOVA followed by Dunnett’s test. Significance is indicated as ns p > 0.05, * p < 0.05, ** p < 0.01, *** p < 0.001, and **** p < 0.0001, treated versus vehicle. Error bars represent ± SD. Double staining with Hoechst 33342 and propidium iodide (PI) of mesothelial cells (E) and pleural mesothelioma cells (F) treated with vehicle (V) or 1/0.1 µg/ml and 20/2 µg/ml X/XO for 24 h. Hoechst 33342 (blue) shows the nuclear morphology, propidium iodide (PI, red) labels dead cells that have lost membrane integrity. Scale bar = 50 µm.
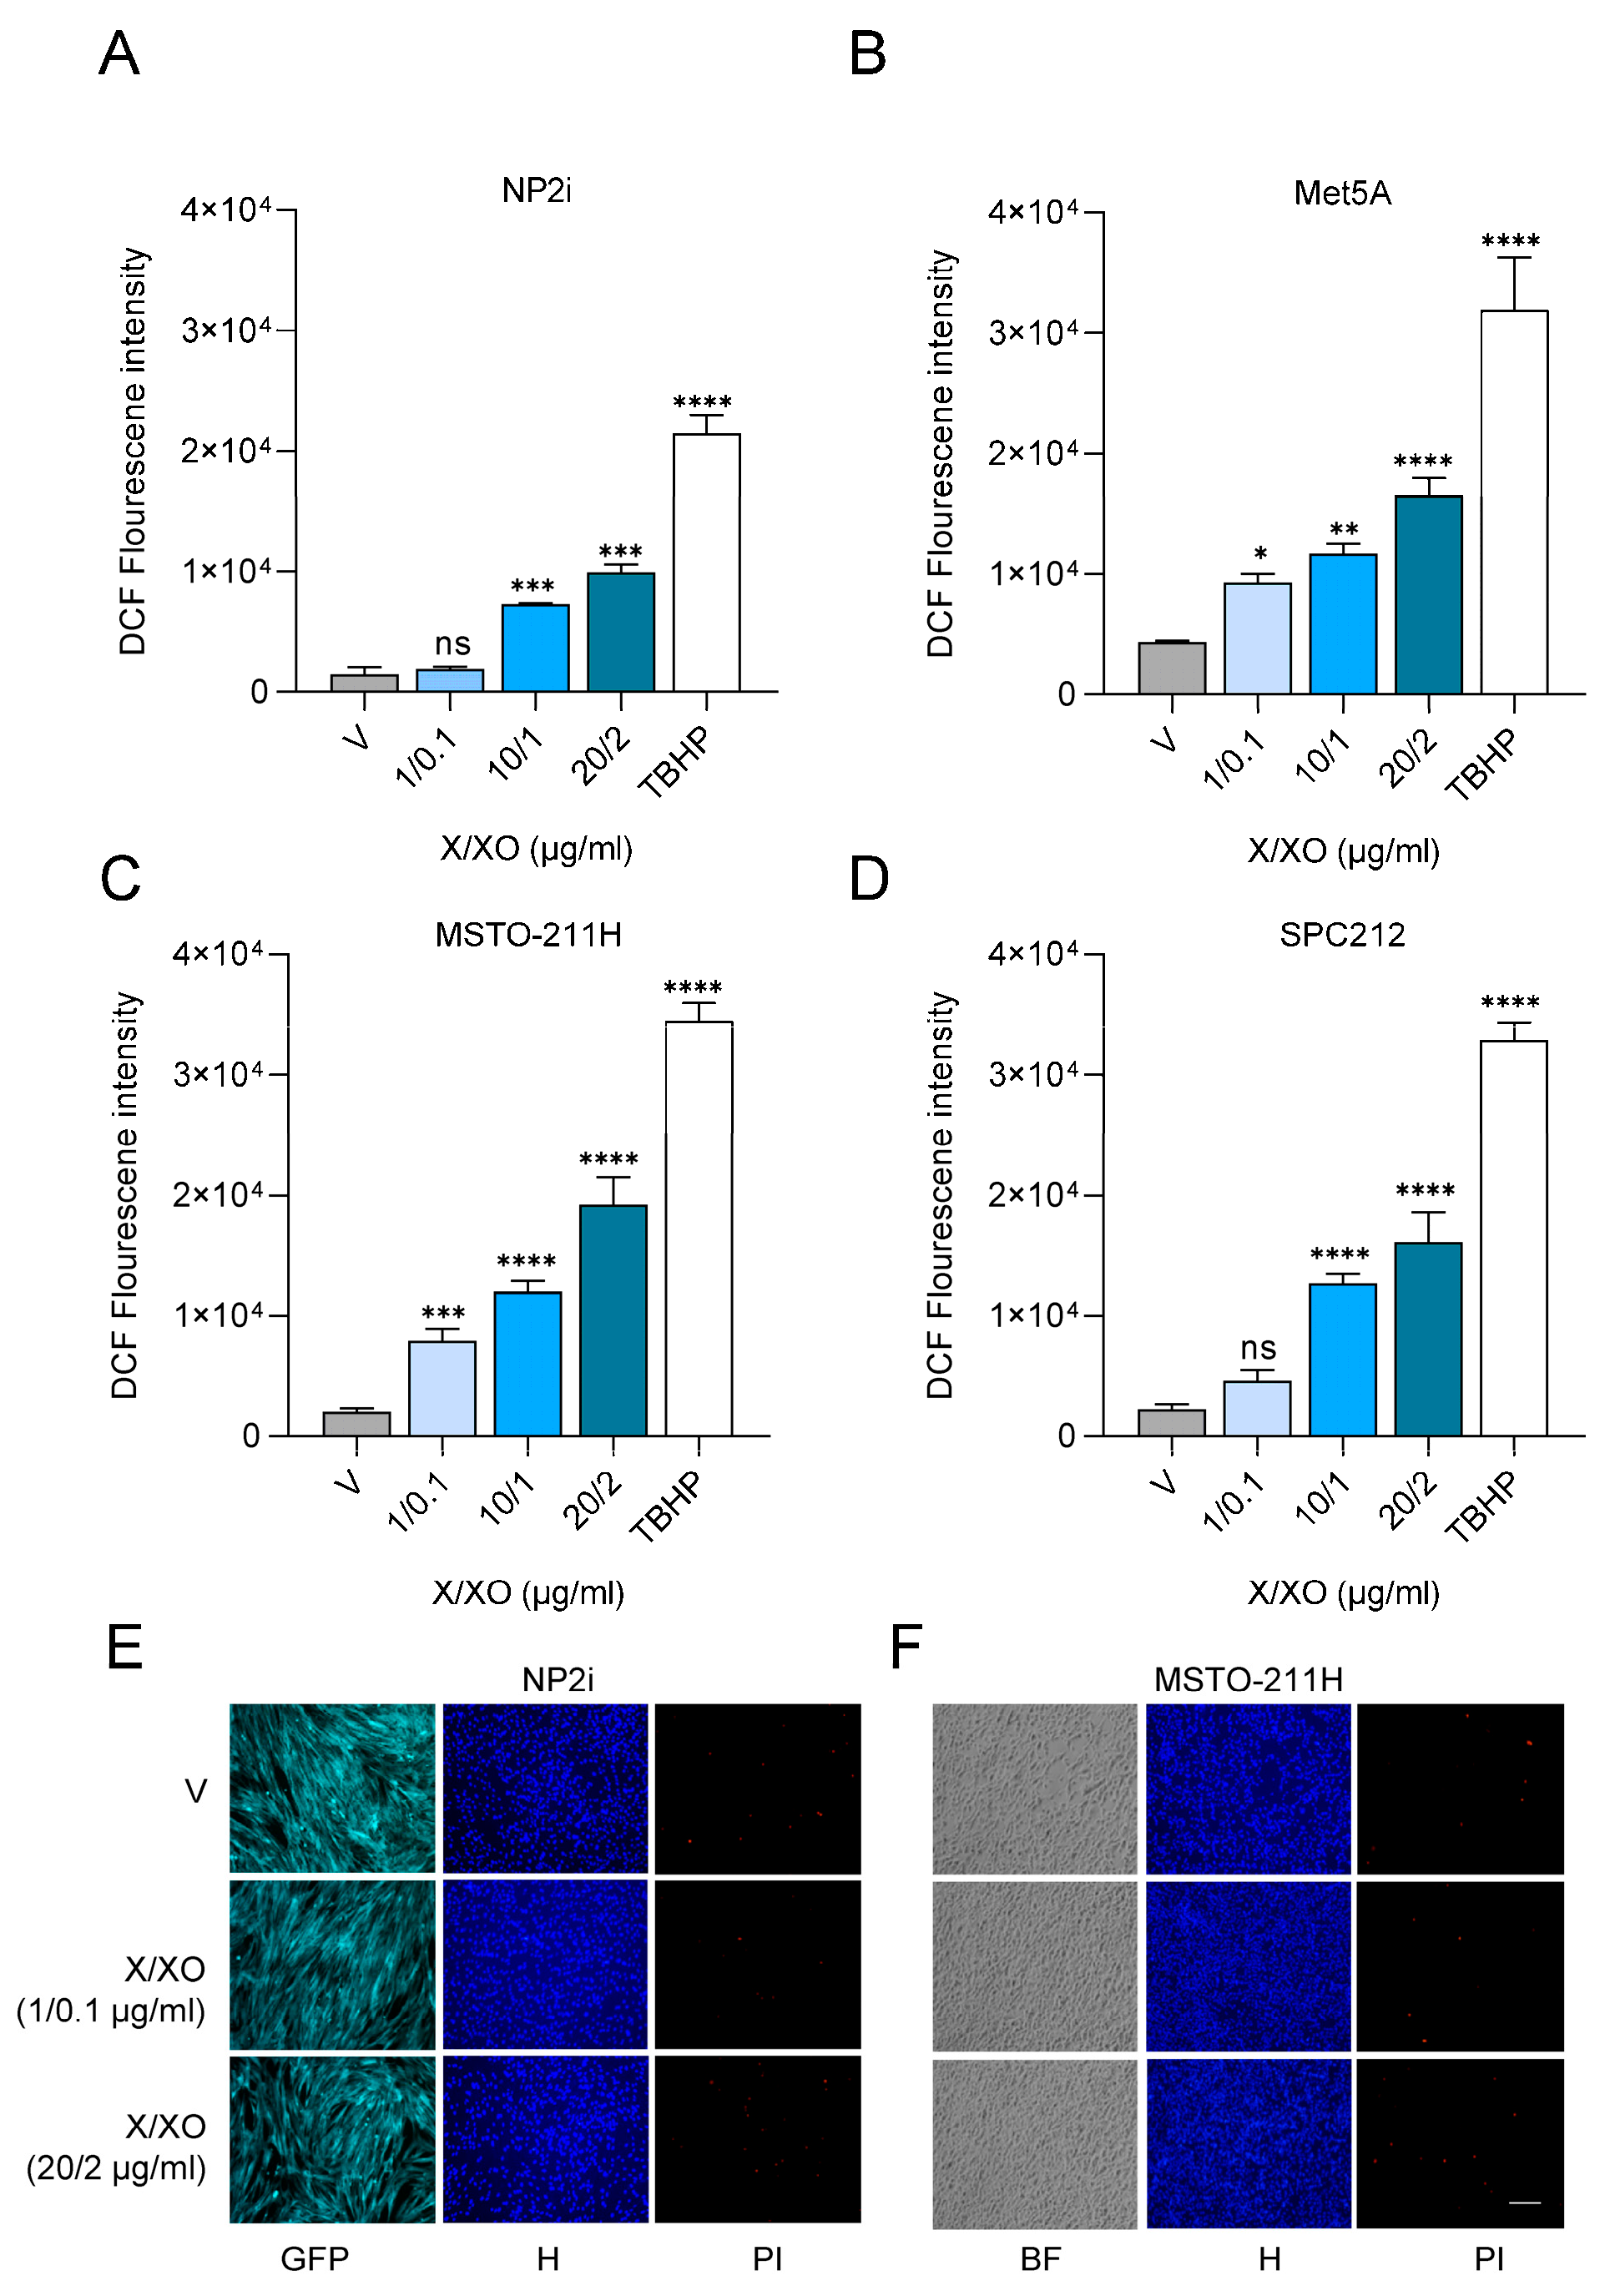
Figure 2.
ROS induction increases cell migration and alters cell shape. Videomicroscopy was performed for mesothelial (A, B) and pleural mesothelioma (C, D) cells under treatment with xanthine/xanthine oxidase (X/XO) or vehicle (V) at the indicated concentrations for 24 h. Migrated distances were assessed by manual cell tracking using image J. Bars represent the mean migrated distance of at least 30 cells, each dot represents one individual cell. Single origin plots of representative individual cell tracks are shown for NP2i (E). Aspect ratios (longer diameter/shorter diameter) of mesothelial (F, G) and pleural mesothelioma (H, I) were calculated from images taken after 24 h of treatment with X/XO or vehicle. Area and circularity under the same treatment as above are shown for NP2i (J). Data were analysed by one-way ANOVA followed by Dunnett’s test. Significance is indicated as ns p > 0.05, * p < 0.05, and **** p < 0.0001, treated versus vehicle. Error bars represent ± SD.
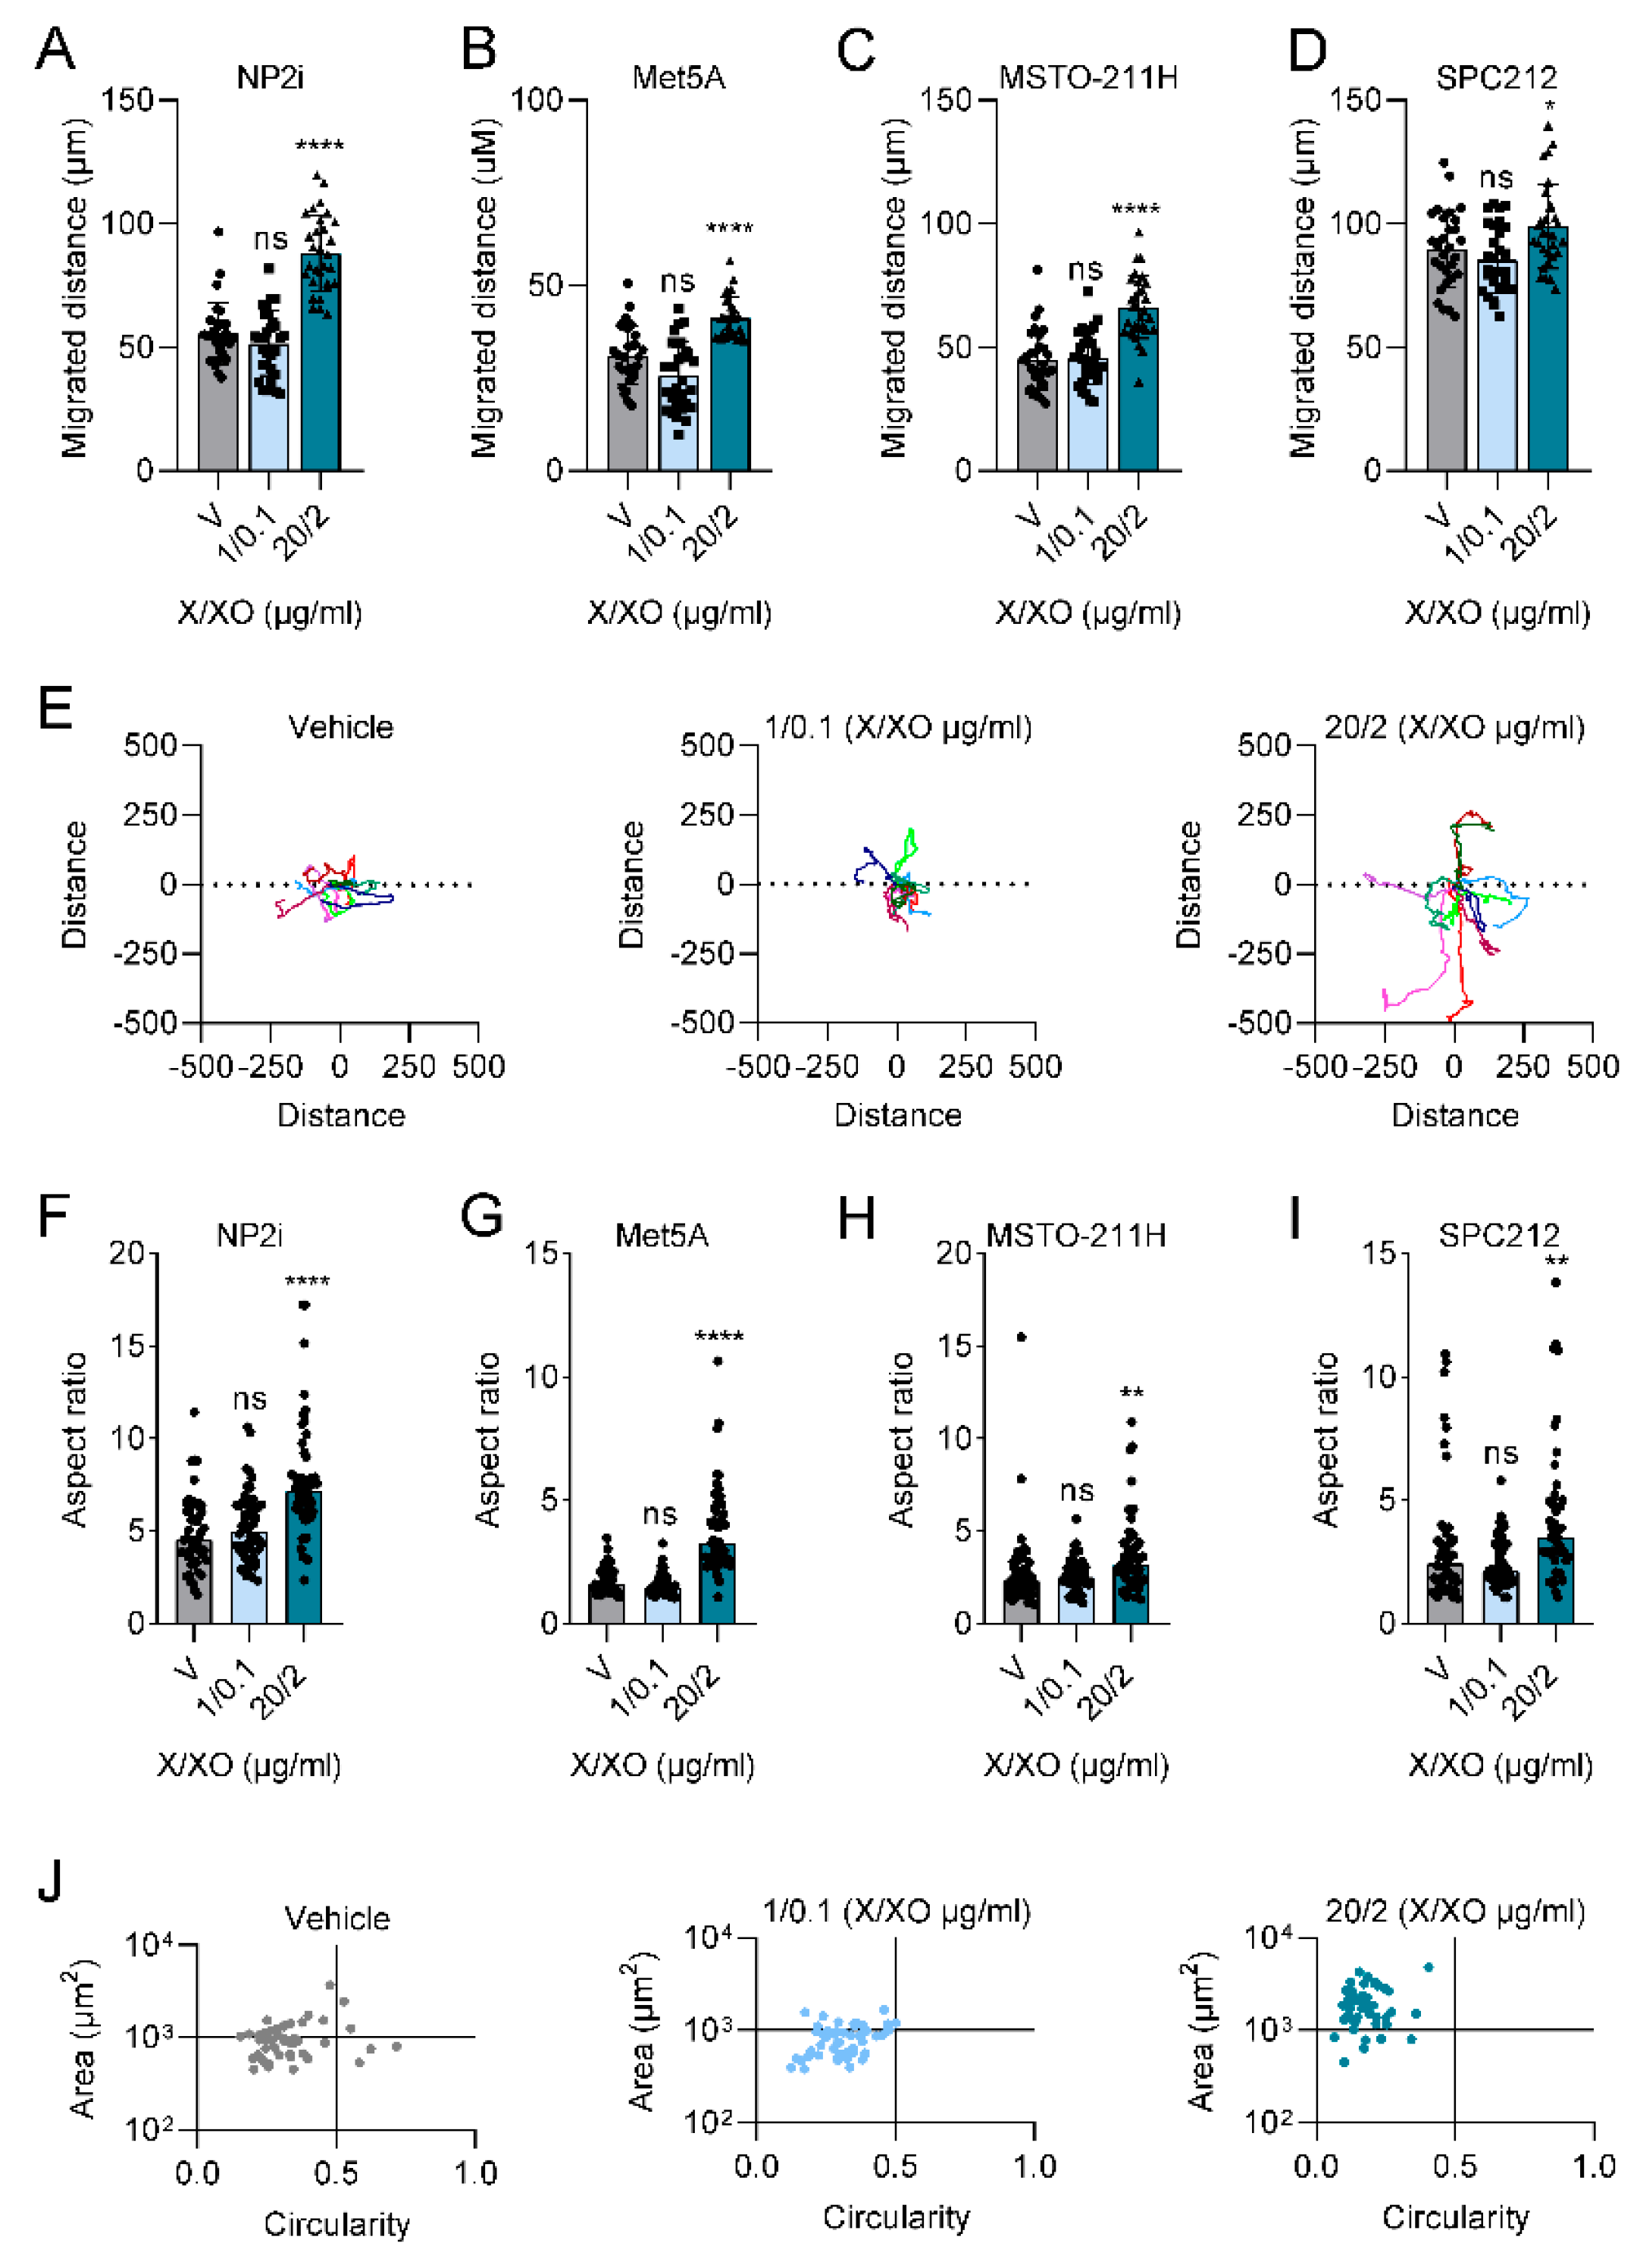
Figure 3.
ROS treatment leads to phosphorylation of ERK, AKT and YB-1. Representative examples (A, C) and quantification (B, D) of Western blots of phopsphorylated (p) and total ERK, AKT and YB-1 after treatment for 24 h with the indicated concentrations of xanthine/xanthine oxidase (X/XO, µg/ml) or vehicle (V). The housekeeping gene GAPDH was used as control for equal sample loading. Quantification data are shown as phosphorylated to total protein ratios normalized to vehicle treated samples set as 1.
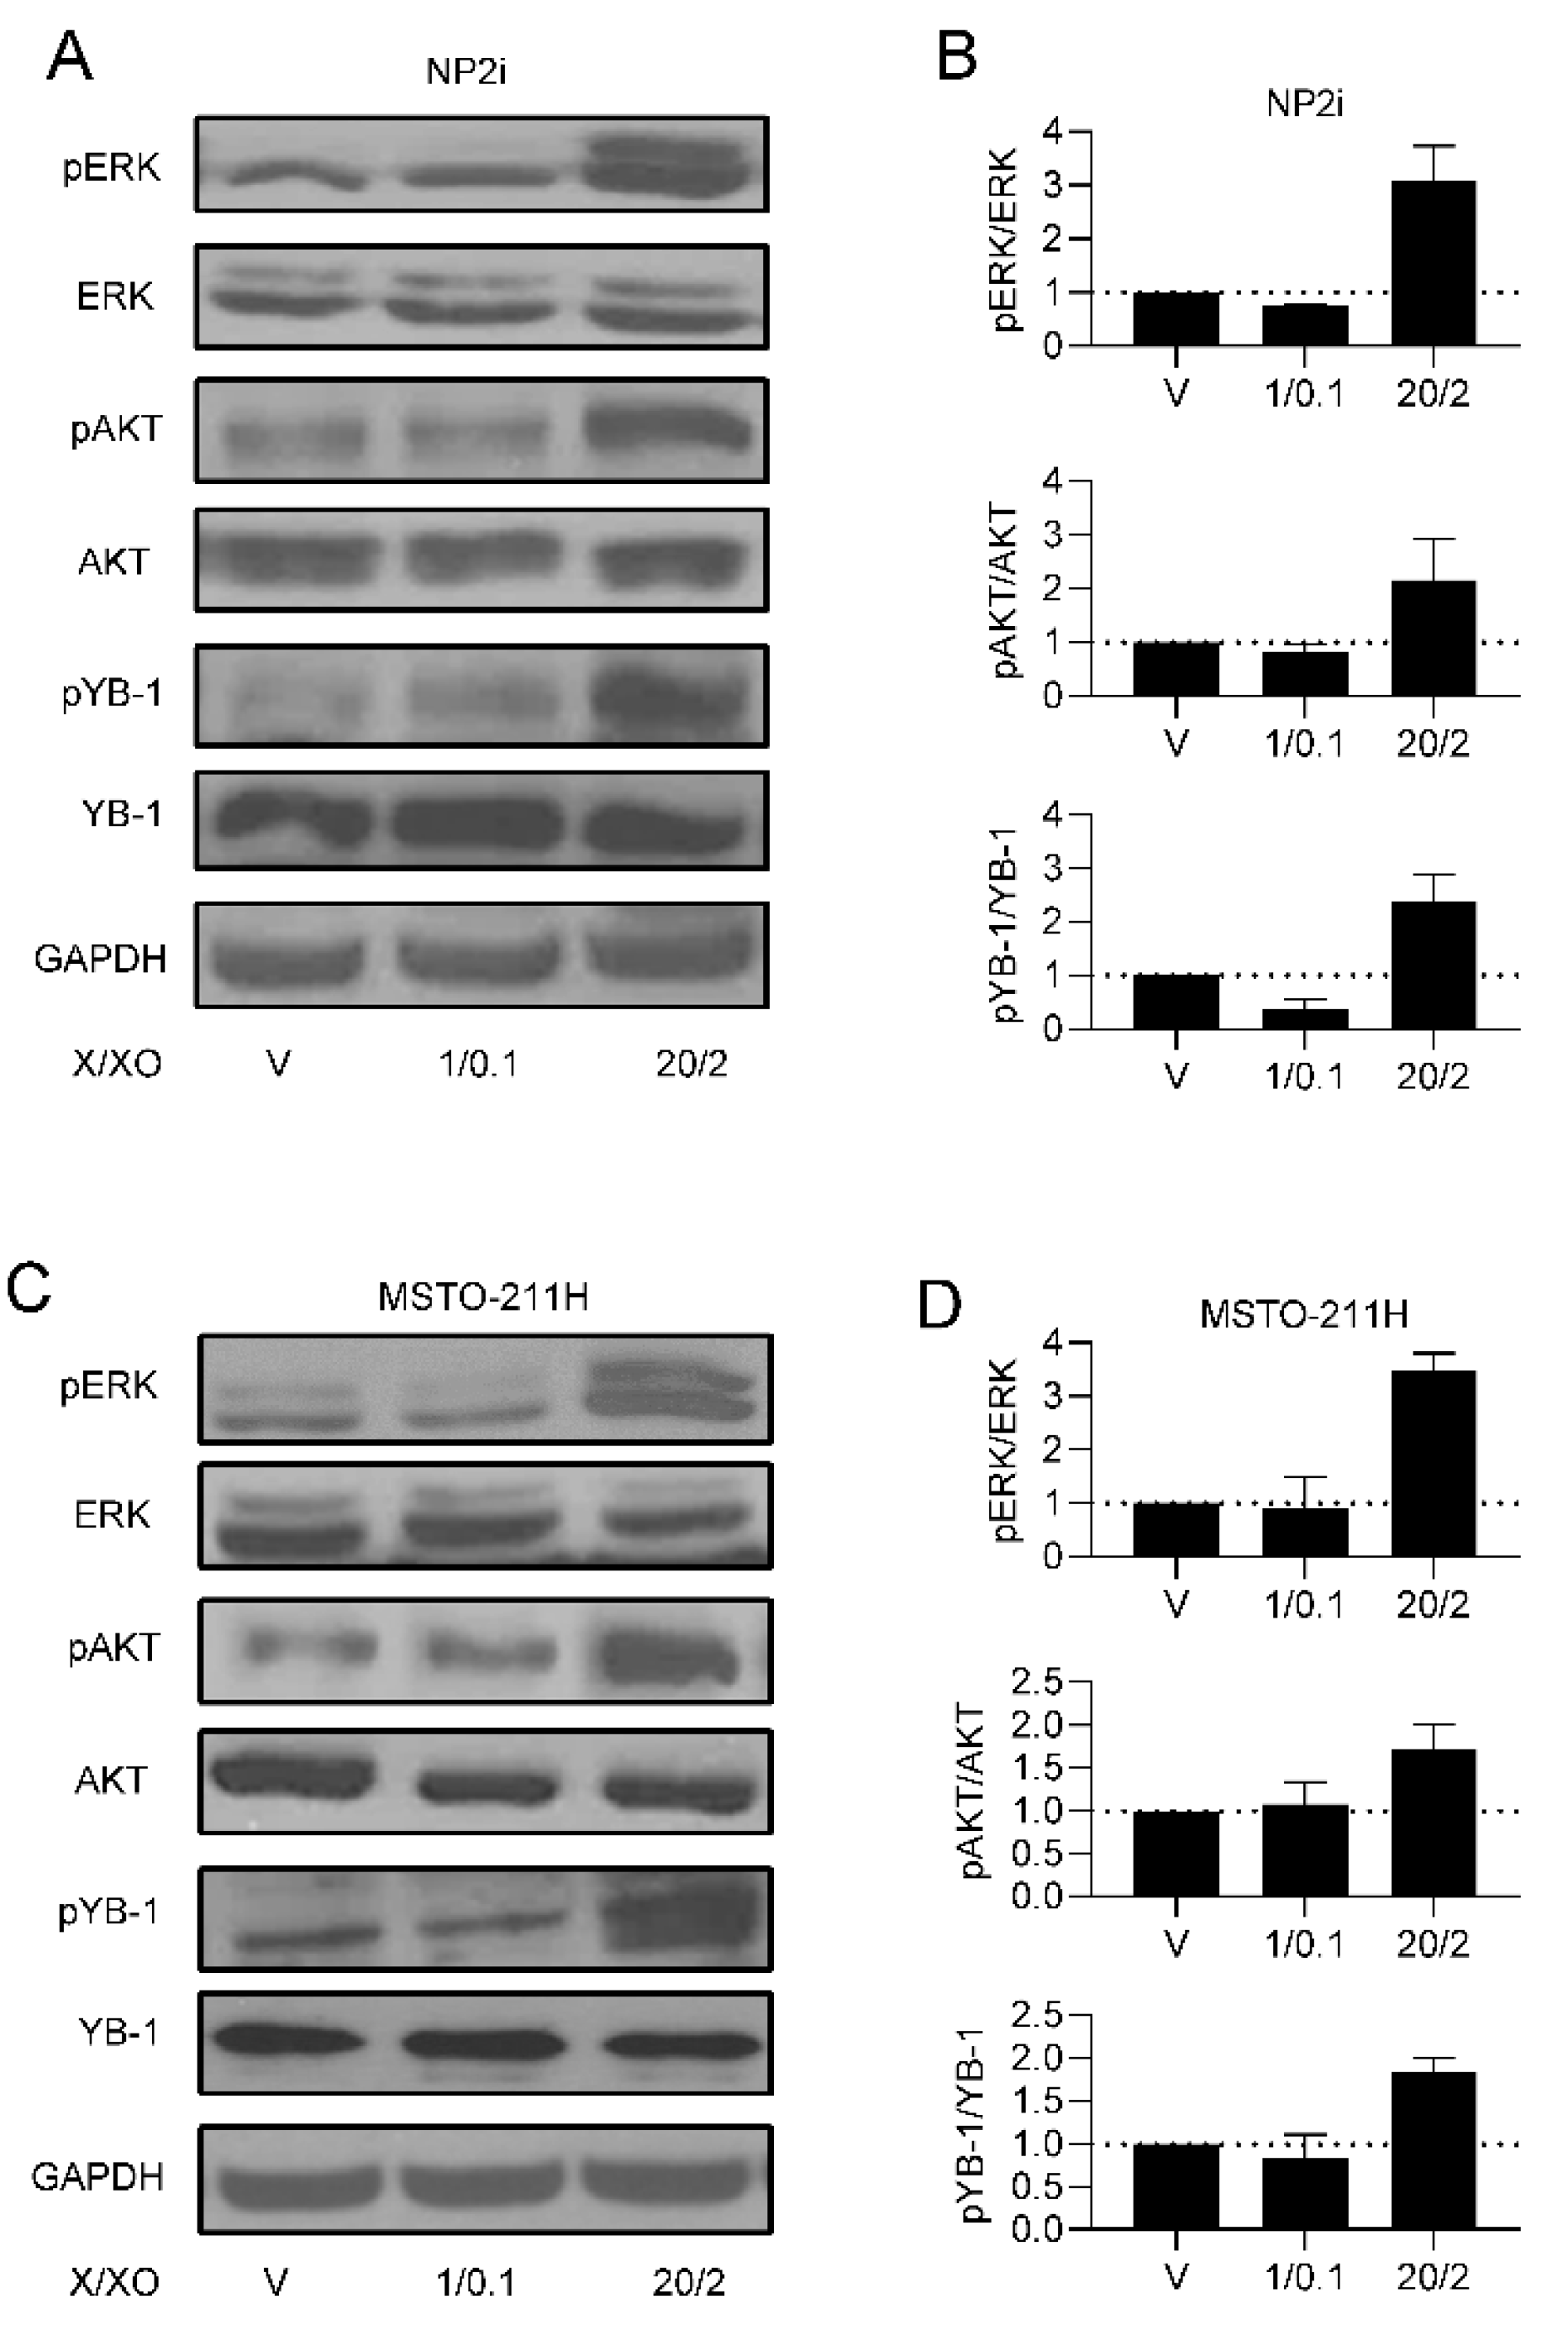
Figure 4.
Pathway inhibitors reverse ROS-induced changes of cell migration and cell shape. Mesothelial (A, B) and pleural mesothelioma (C, D) cells were treated with xanthine/xanthine oxidase (X/XO, 2/20 µg/ml) or vehicle (V) plus where indicated with DMSO (D), ipatasertib (IPA, 10 µM), trametinib (TRA, 10 µM) or BI-D1870 (BI, 10 µM) for 24 h. Migrated distances of at least 30 cells were calculated from videomicroscopy data by manual tracking with Image J and are shown as means (bars) and individual values of each cell (dots). Circularity of mesothelial cells (E, F) and pleural mesothelioma cells (G, H) treated as above for 24 h were calculated from microscopy images analysed with image J and data are shown as violin plots. Data were analysed by one-way ANOVA followed by Dunnett’s test. Significance is indicated as ns p > 0.05, * p < 0.05, ** p < 0.01, *** p < 0.001, and **** p < 0.0001, compared to DMSO control (D).
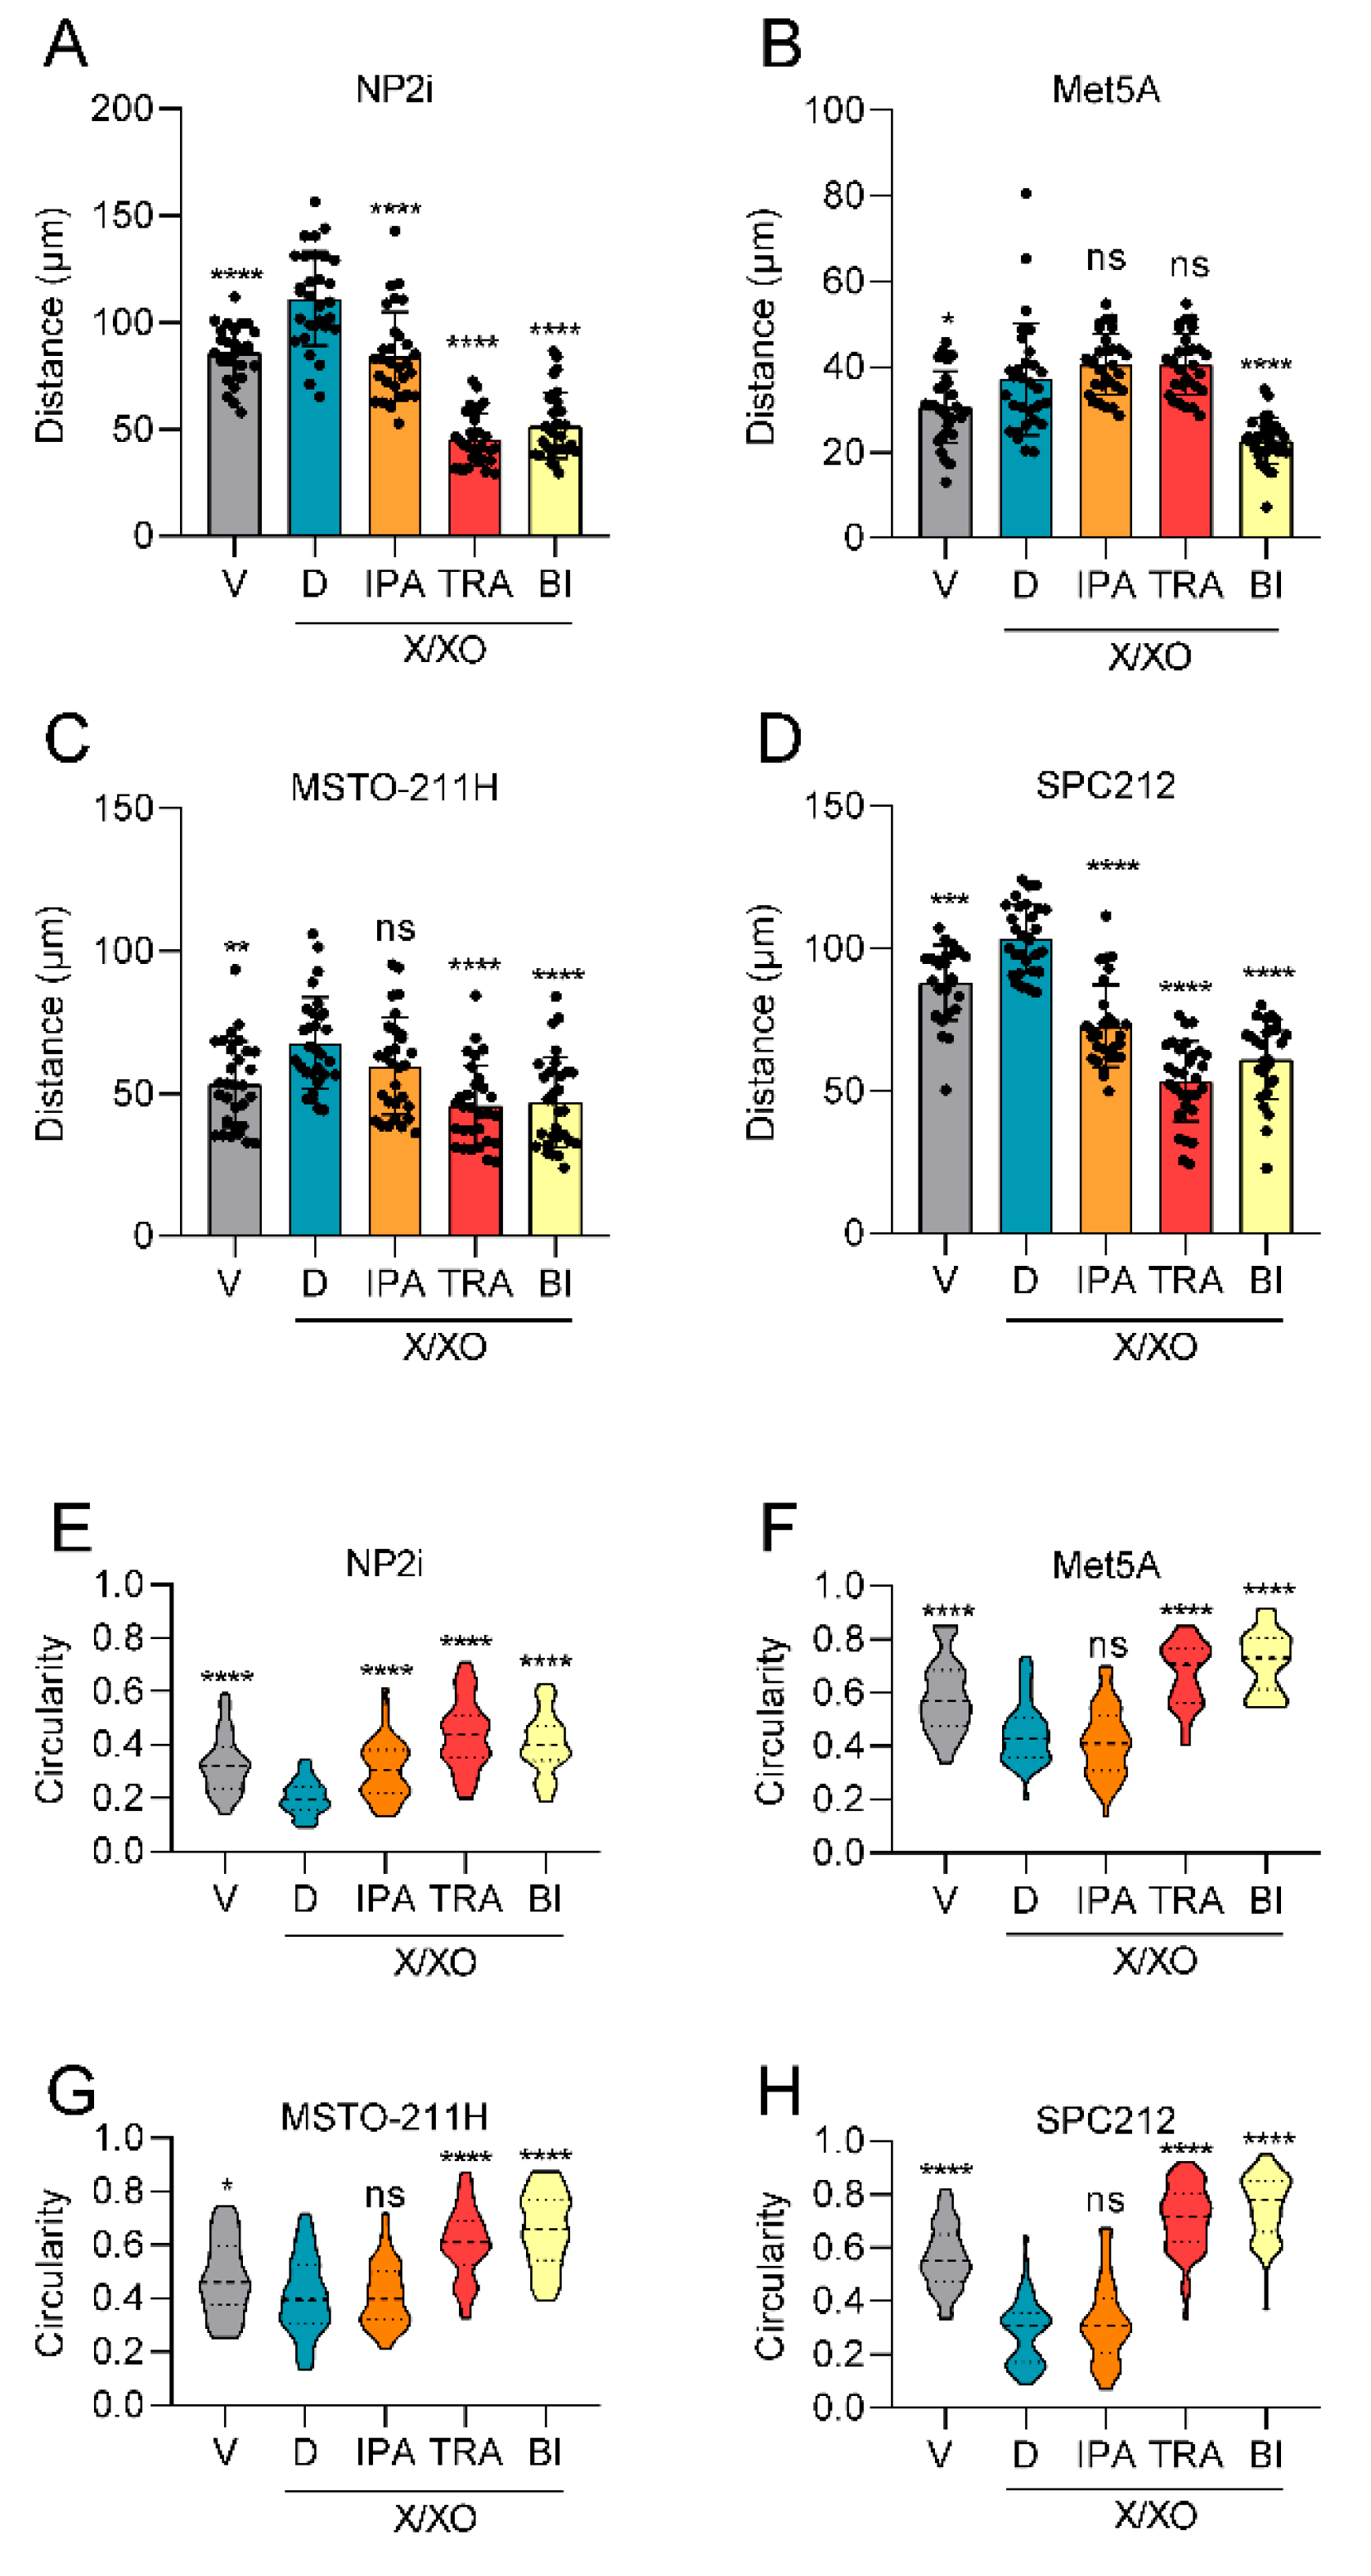
Figure 5.
Effect of pathway inhibitors on ROS-induced phosphorylation of ERK, AKT and YB-1. Representative examples (A, C) and quantification (B, D) of Western blots of phopsphorylated (p) and total ERK, AKT and YB-1 after treatment for 24 h with xanthine/xanthine oxidase (X/XO, 2/20 µg/ml) or vehicle (V) plus where indicated with DMSO (D), ipatasertib (IPA, 10 µM), trametinib (TRA, 10 µM) or BI-D1870 (BI, 10 µM) for 24 h. Lanes labelled as N represent cells treated with X/XO only. The housekeeping gene GAPDH was used as control for equal sample loading. Quantification data are shown as phopsphorylated to total protein ratios normalized to DMSO (D) samples set as 1.
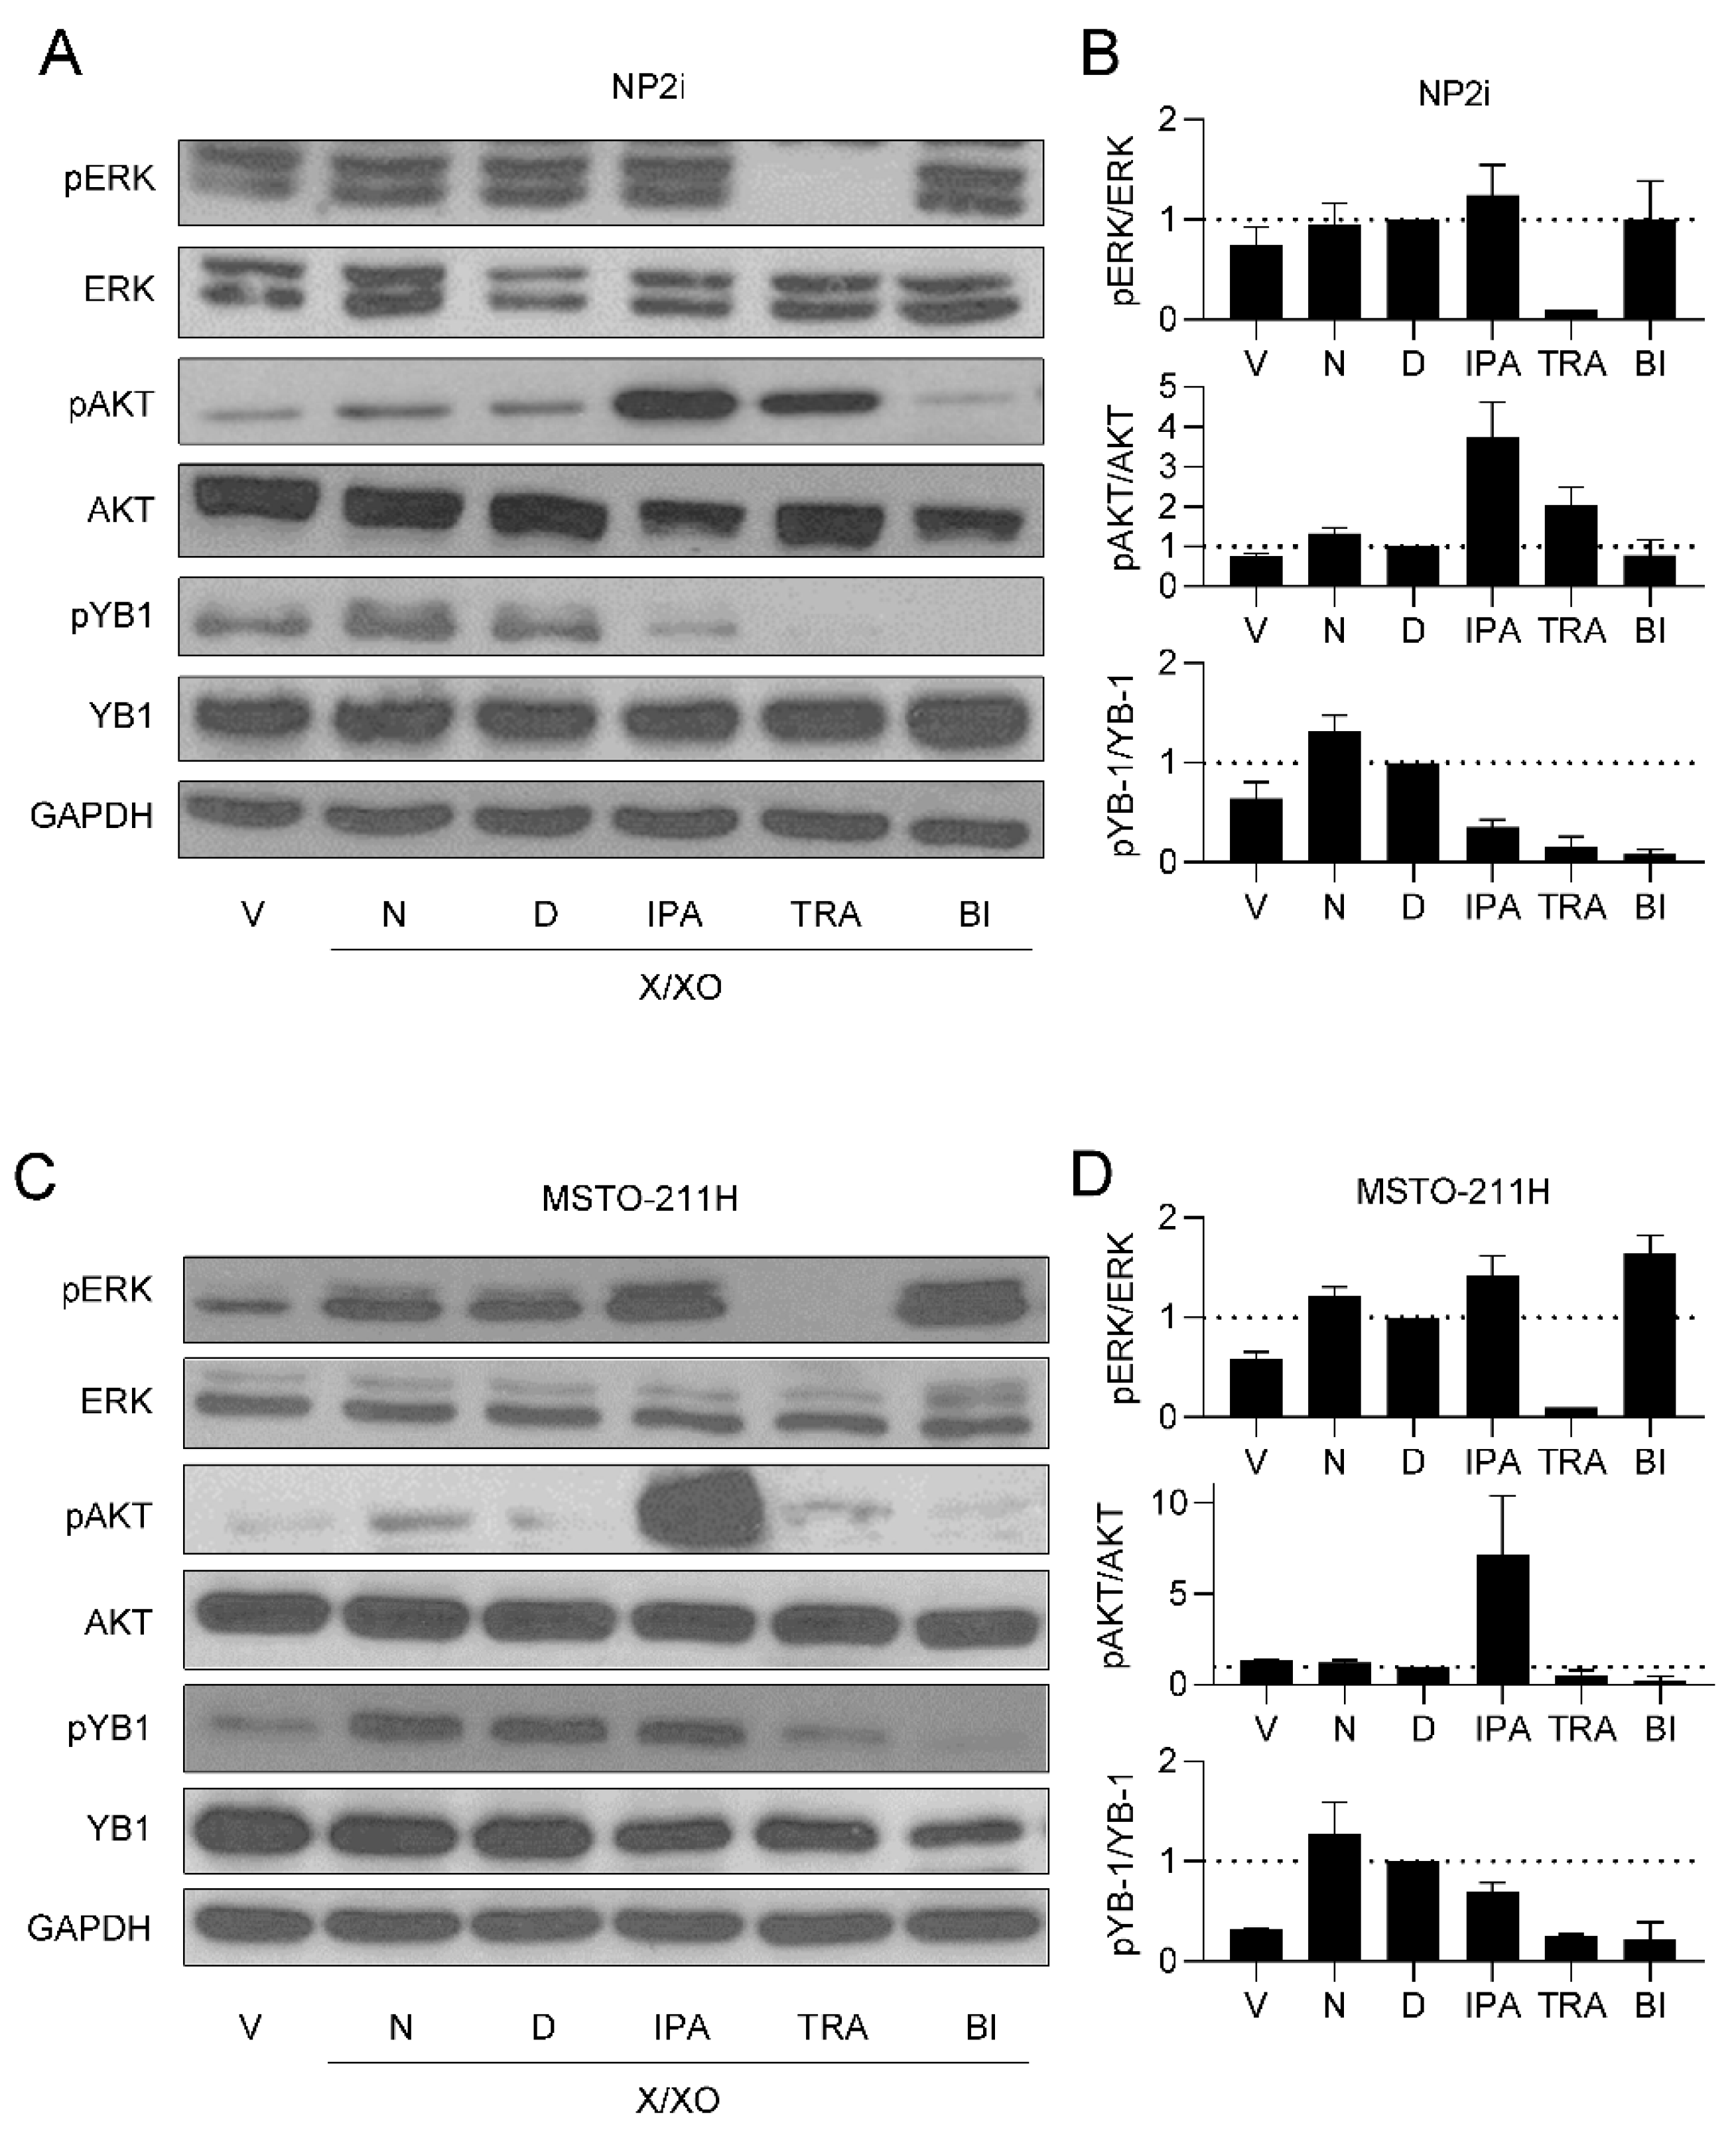
Figure 6.
Expression of PD-L1 and PD-L2 is increased by ROS and partially decreased by pathway inhibitors. Mesothelial (A, B) and pleural mesothelioma (C, D) cells were treated with xanthine/xanthine oxidase (X/XO) at 1/0.1 and 20/2 µg/ml or vehicle and gene expression levels of the immune checkpoint proteins PD-L1, PDL-2, TNFRSF9 (SF9), PVR and VISTA were determined by qRT-PCR and normalized to the housekeeping gene GAPDH. Bars represent fold expression values compared to vehicle treated cells set as 1 and shown as horizontal line. Mesothelial (E, F) and pleural mesothelioma (G, H) cells were treated with 20/2 µg/ml X/XO plus either DMSO, ipatasertib (IPA, 10 µM), trametinib (TRA, 10 µM) or BI-D1870 (BI, 10 µM) for 24 h. Gene expression levels of the immune checkpoint proteins PD-L1 and PDL-2 were determined by qRT-PCR and normalized to the housekeeping gene GAPDH. Bars represent fold expression values compared to X/XO plus DMSO treated cells set as 1 and shown as horizontal line. Data were analysed by one-way ANOVA followed by Dunnett’s test. Significance is indicated as ns p > 0.05, * p < 0.05, ** p < 0.01, *** p < 0.001, and **** p < 0.0001, X/XO versus vehicle in A-D and inhibitor treated versus DMSO in E-H.
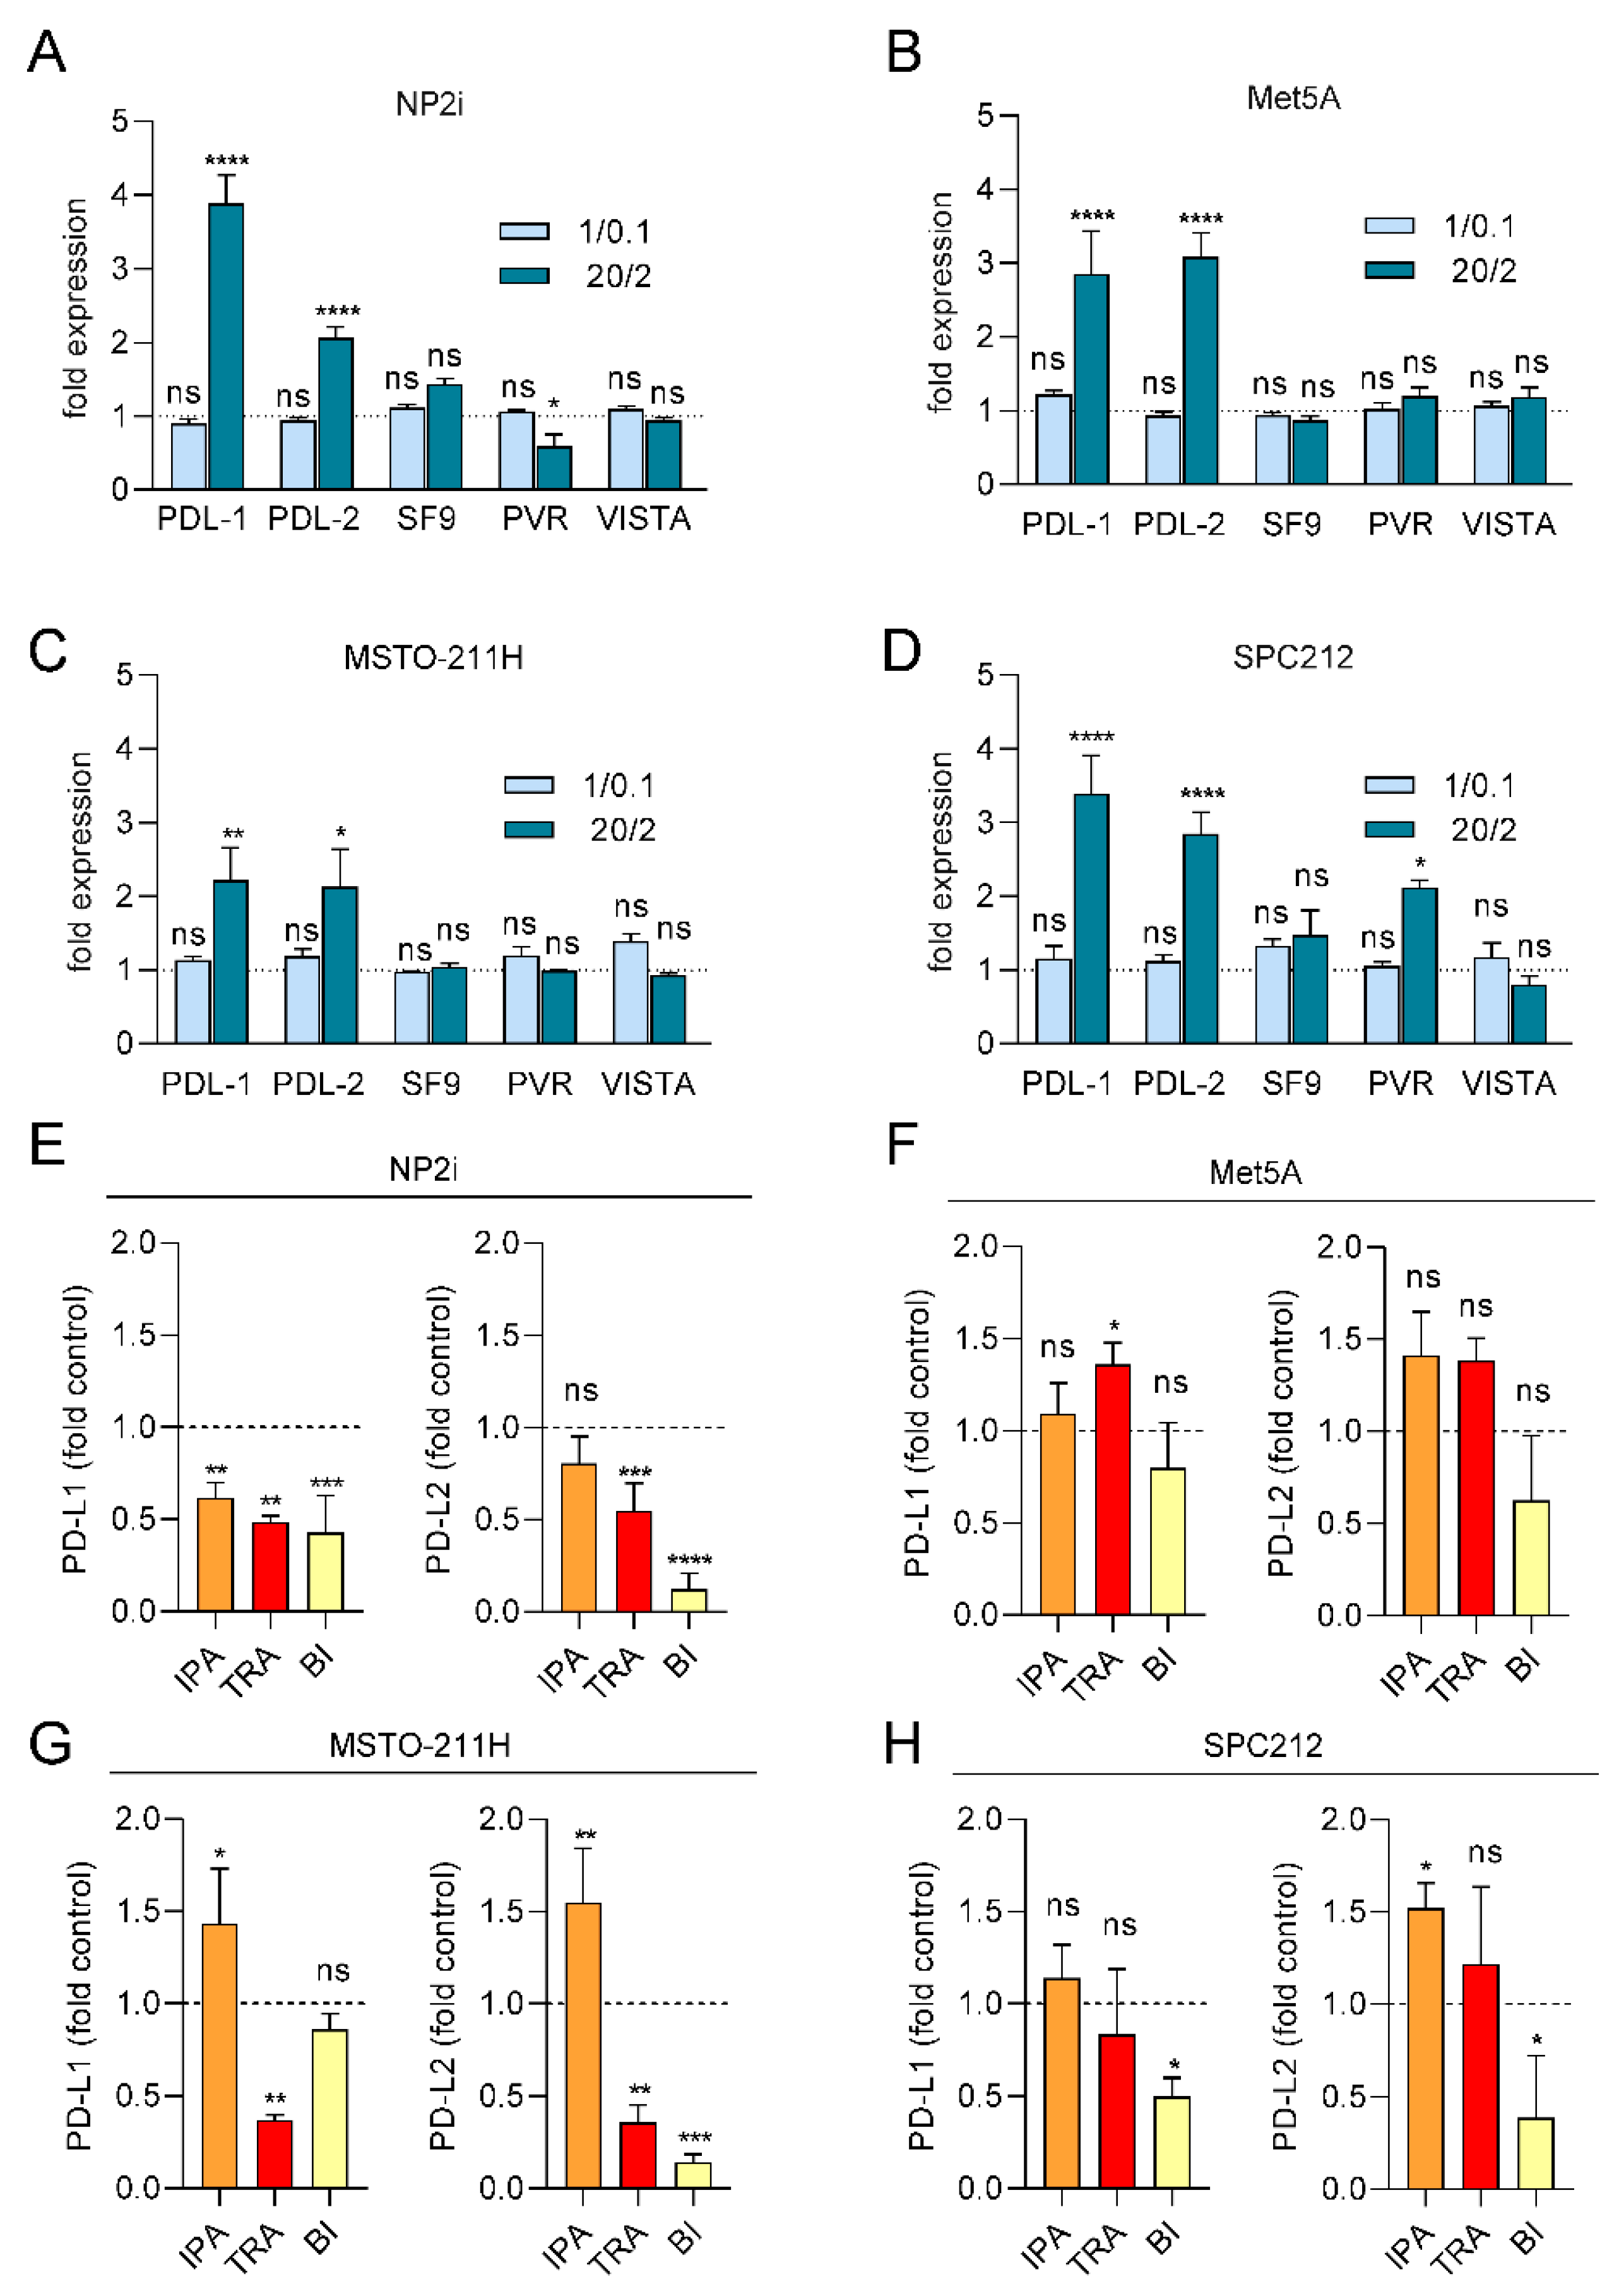
Figure 7.
Proposed schematic model of ROS-induced effects in PM. ROS induces activation of the MAPK and PI3KAKT signaling pathways. These pathways lead to phosphorylation of YB-1 and result in increased cell migration and an elongated cell morphology. Phosphorylated YB-1 translocates to the cell nucleus, binds to the promoters of PD-L1 and PD-L2 and increases their expression. Trametinib, ipatasertib and BI-D1870 block or reduce YB-1 phosphorylation and reverse ROS-induced effects in mesothelial and PM cells. Image created with Biorender.
Disclaimer/Publisher’s Note: The statements, opinions and data contained in all publications are solely those of the individual author(s) and contributor(s) and not of MDPI and/or the editor(s). MDPI and/or the editor(s) disclaim responsibility for any injury to people or property resulting from any ideas, methods, instructions or products referred to in the content. |
© 2025 by the authors. Licensee MDPI, Basel, Switzerland. This article is an open access article distributed under the terms and conditions of the Creative Commons Attribution (CC BY) license (http://creativecommons.org/licenses/by/4.0/).
Copyright: This open access article is published under a Creative Commons CC BY 4.0 license, which permit the free download, distribution, and reuse, provided that the author and preprint are cited in any reuse.


