
Submitted:
14 November 2025
Posted:
18 November 2025
You are already at the latest version
Abstract
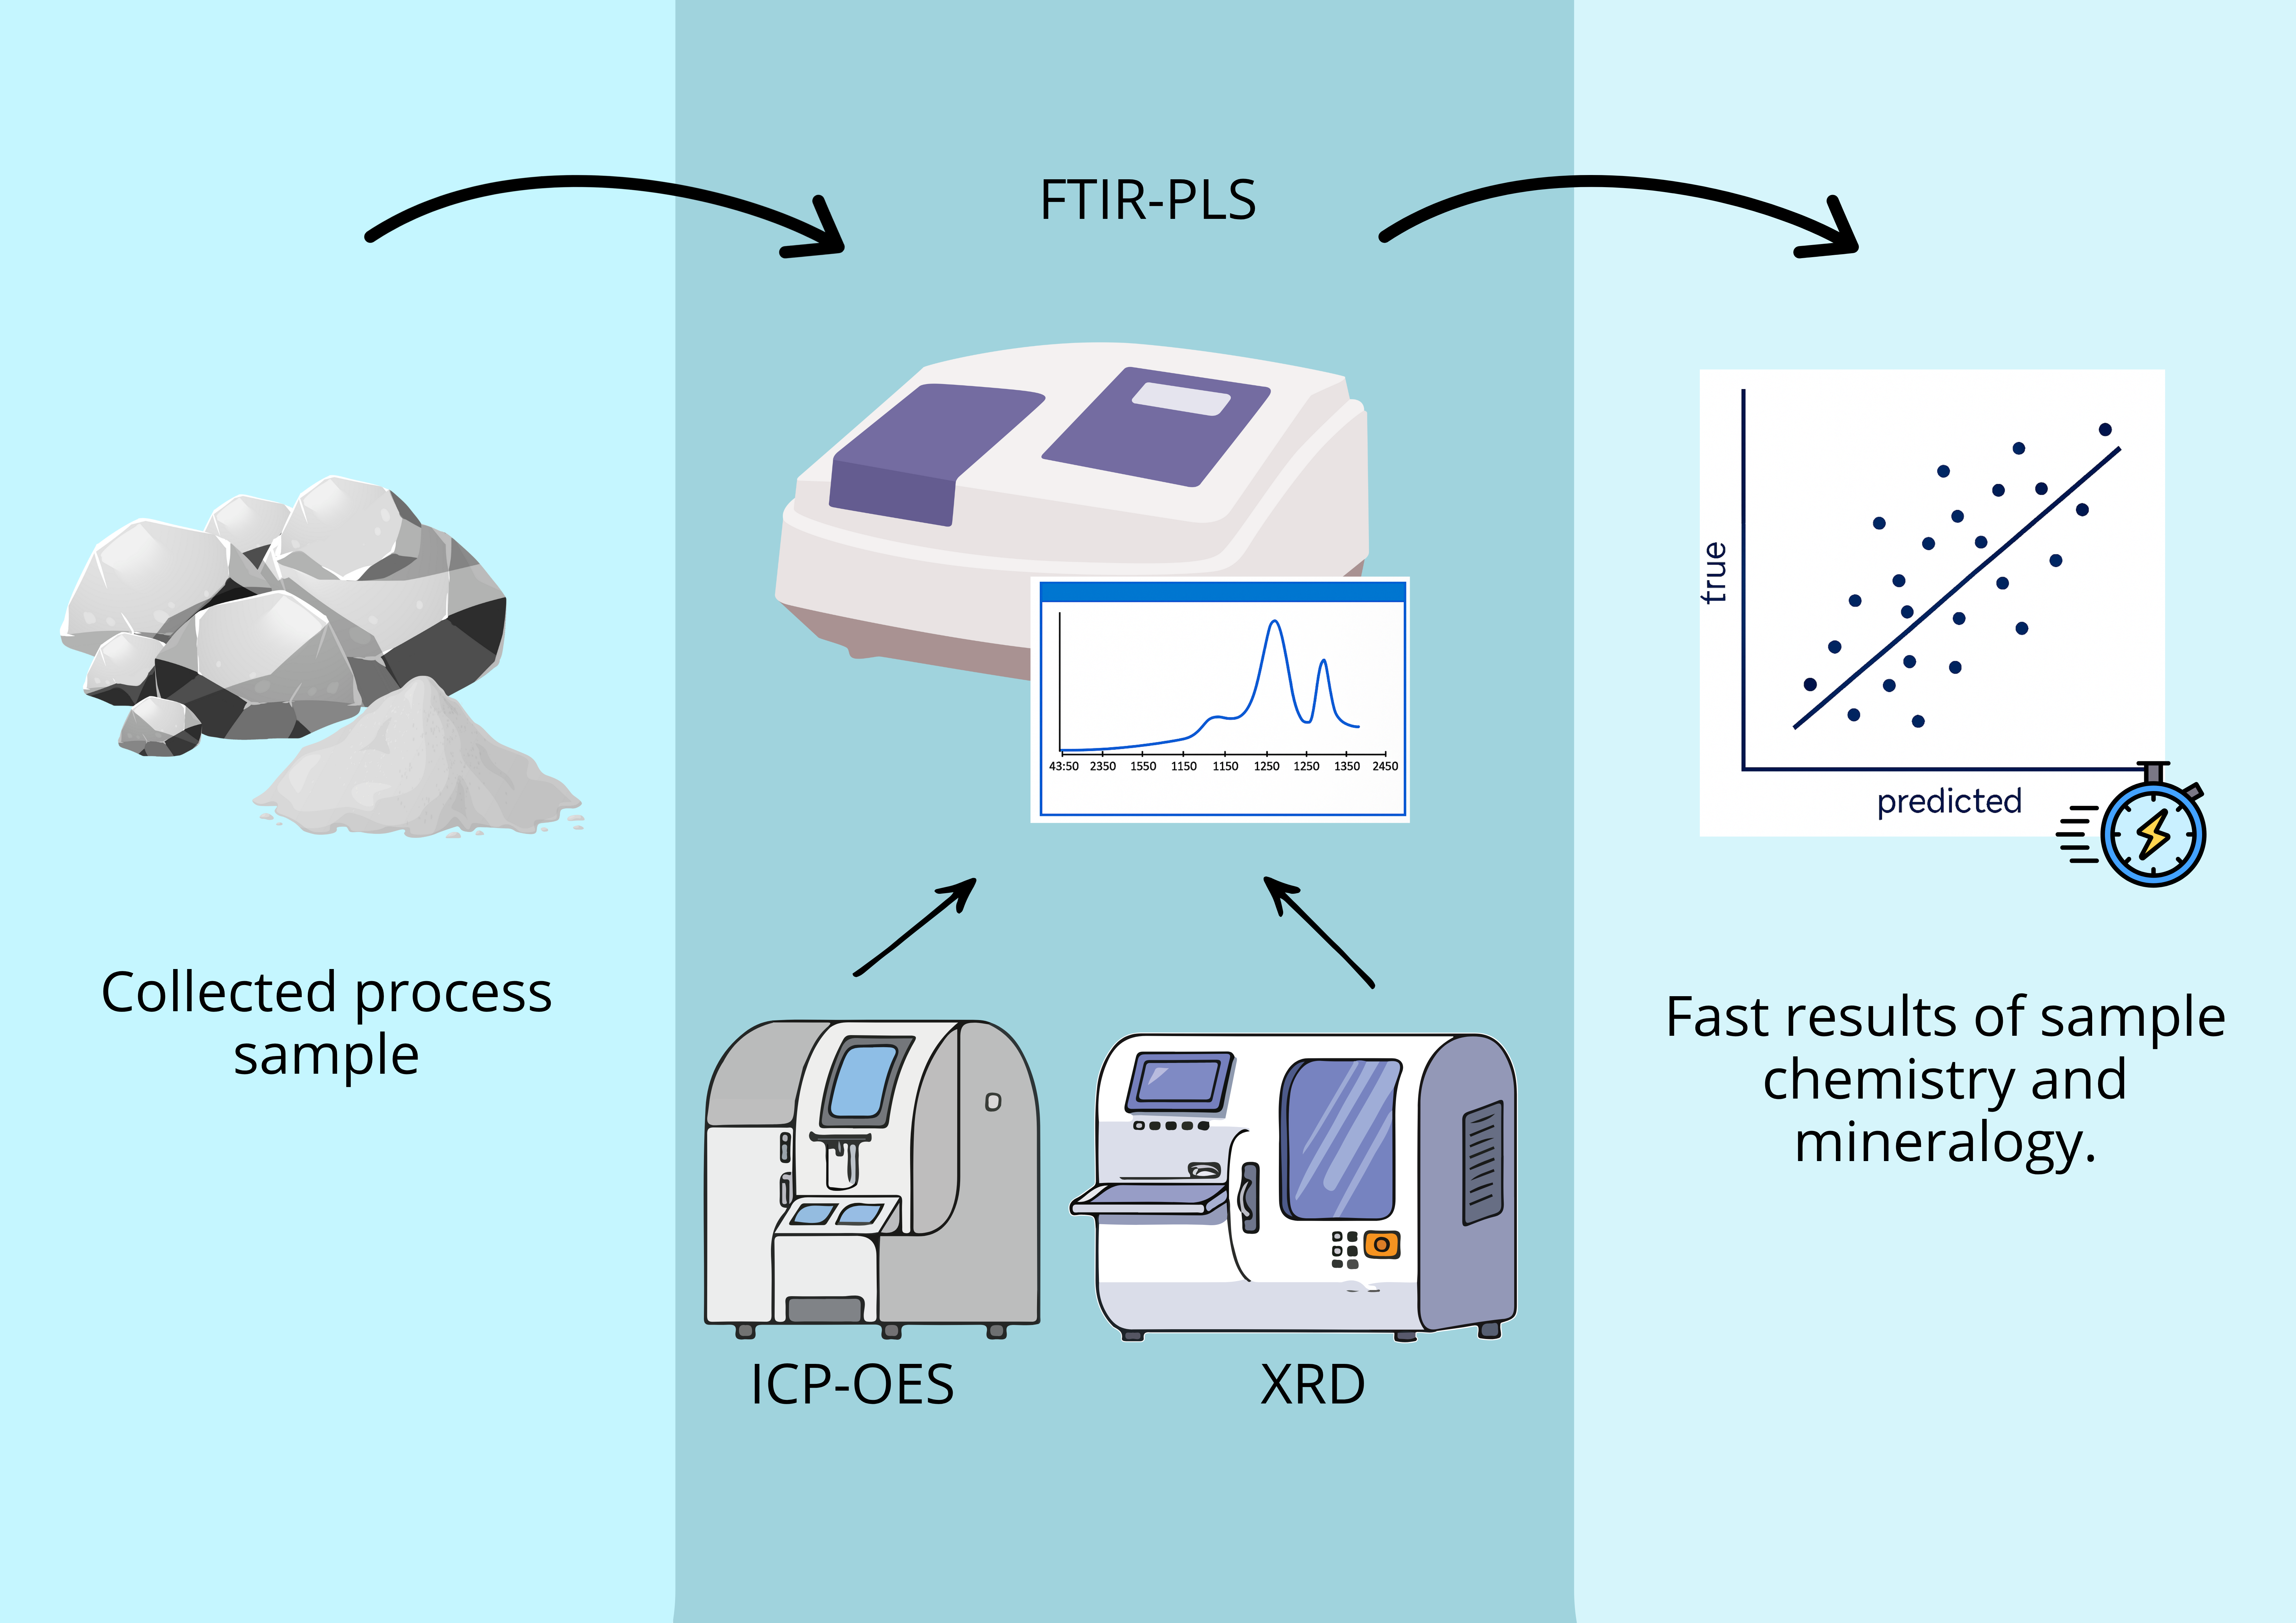
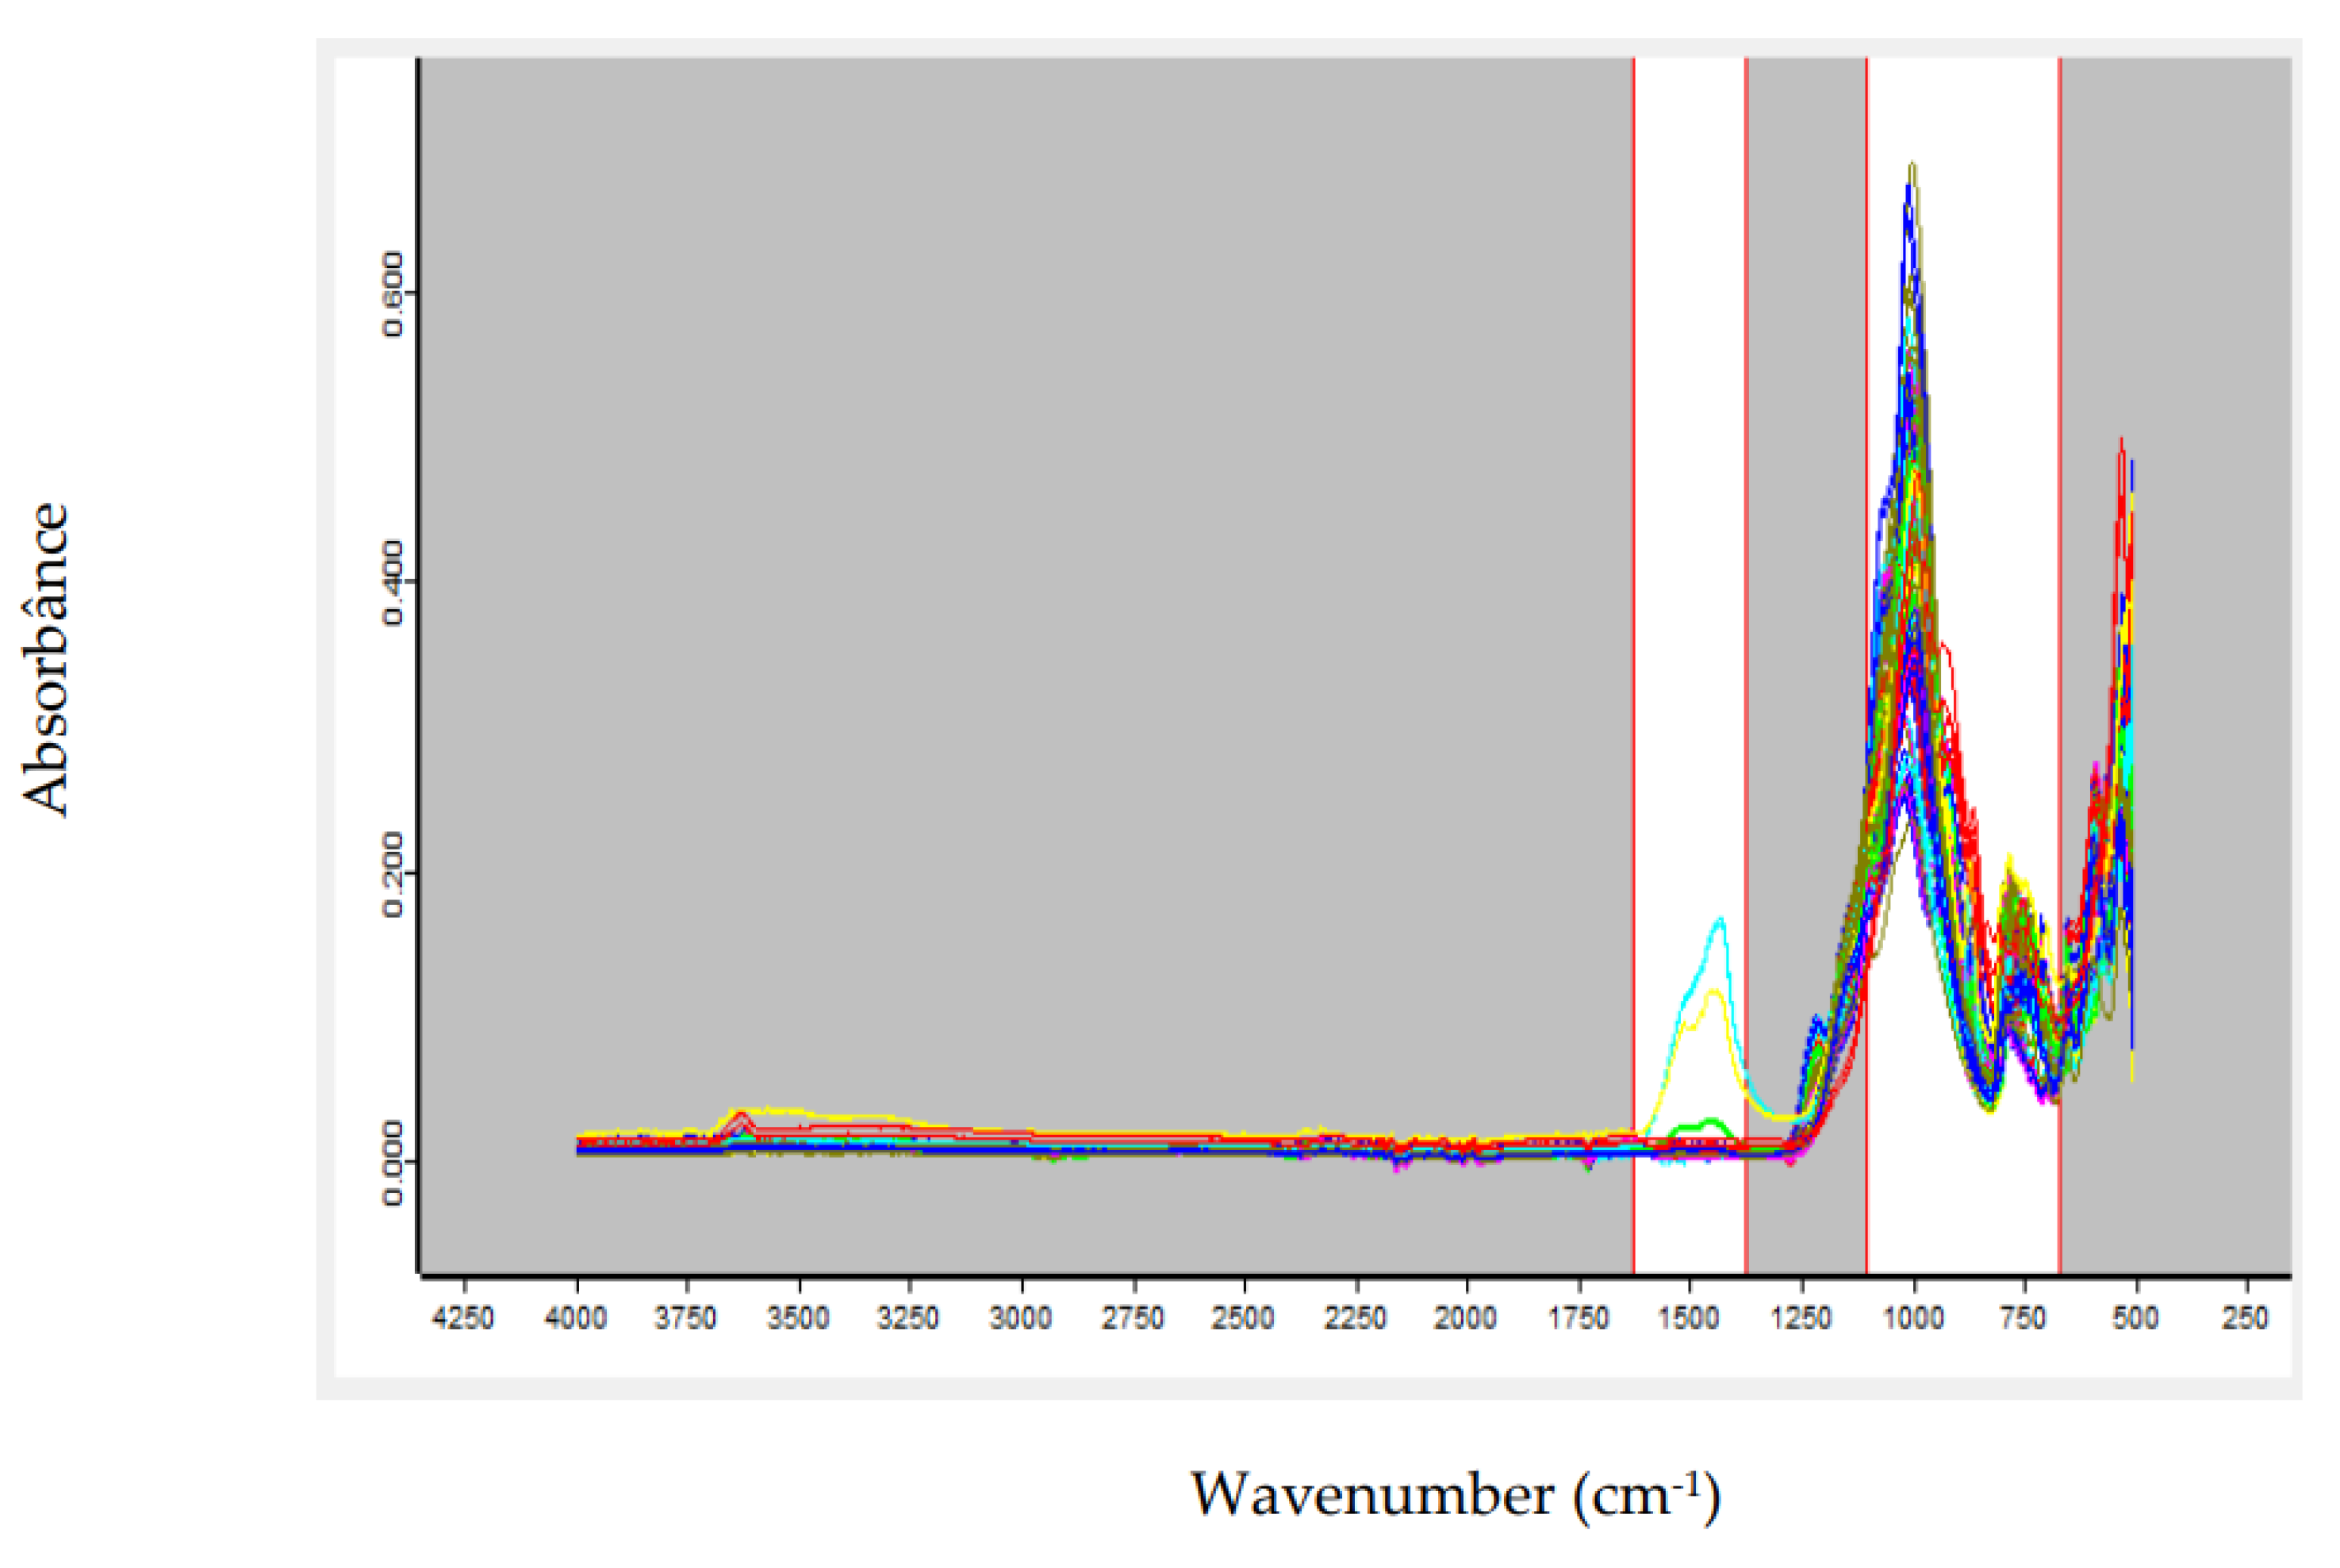
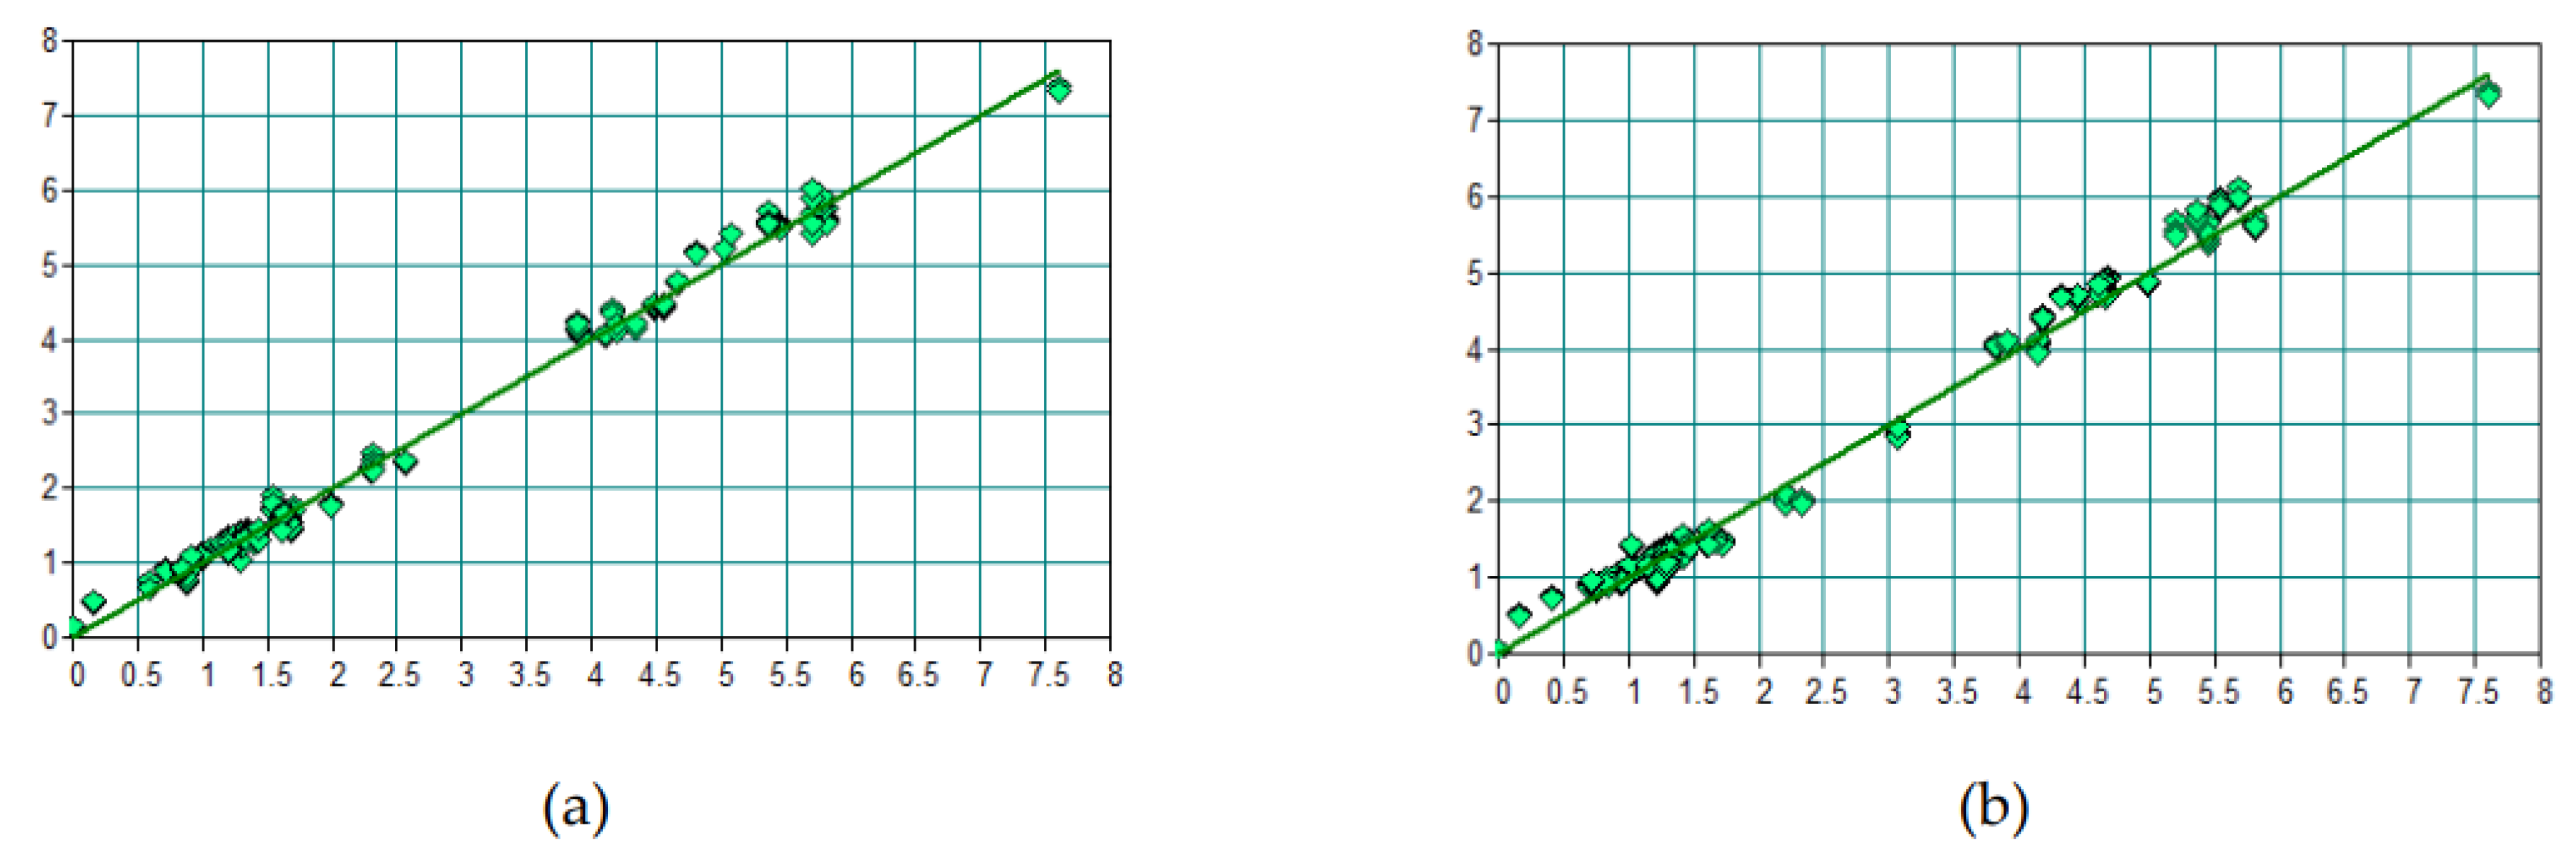
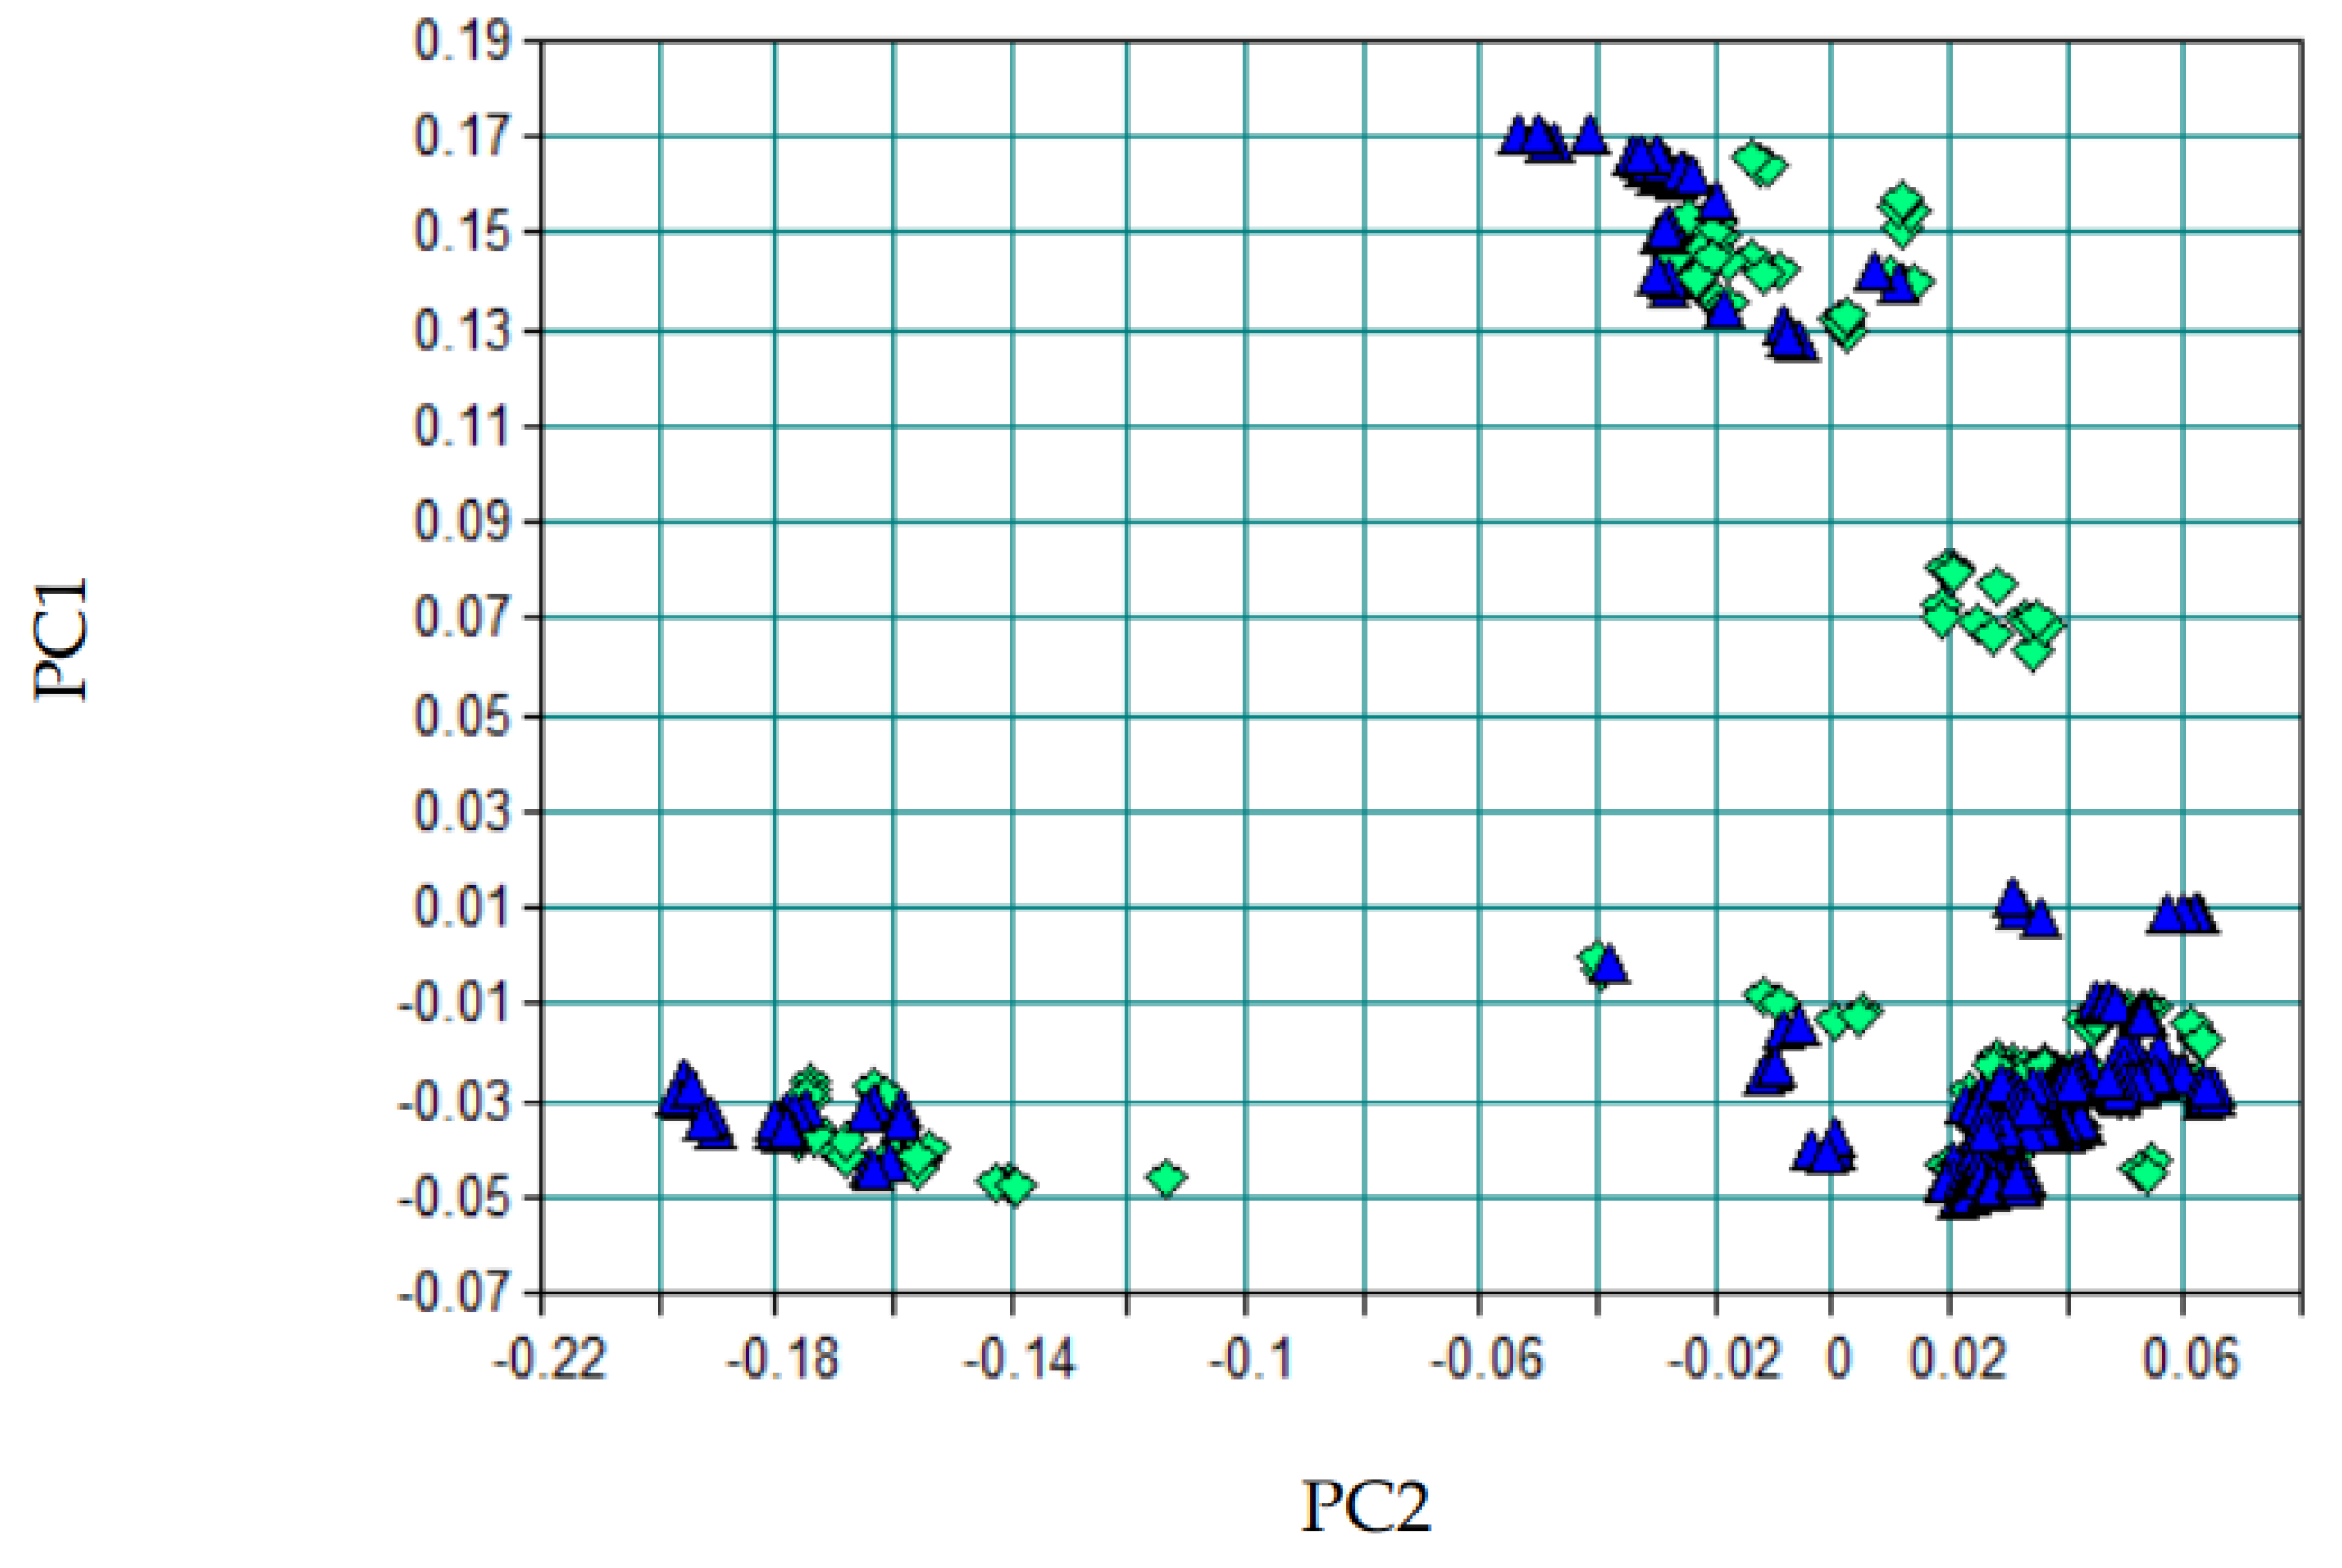
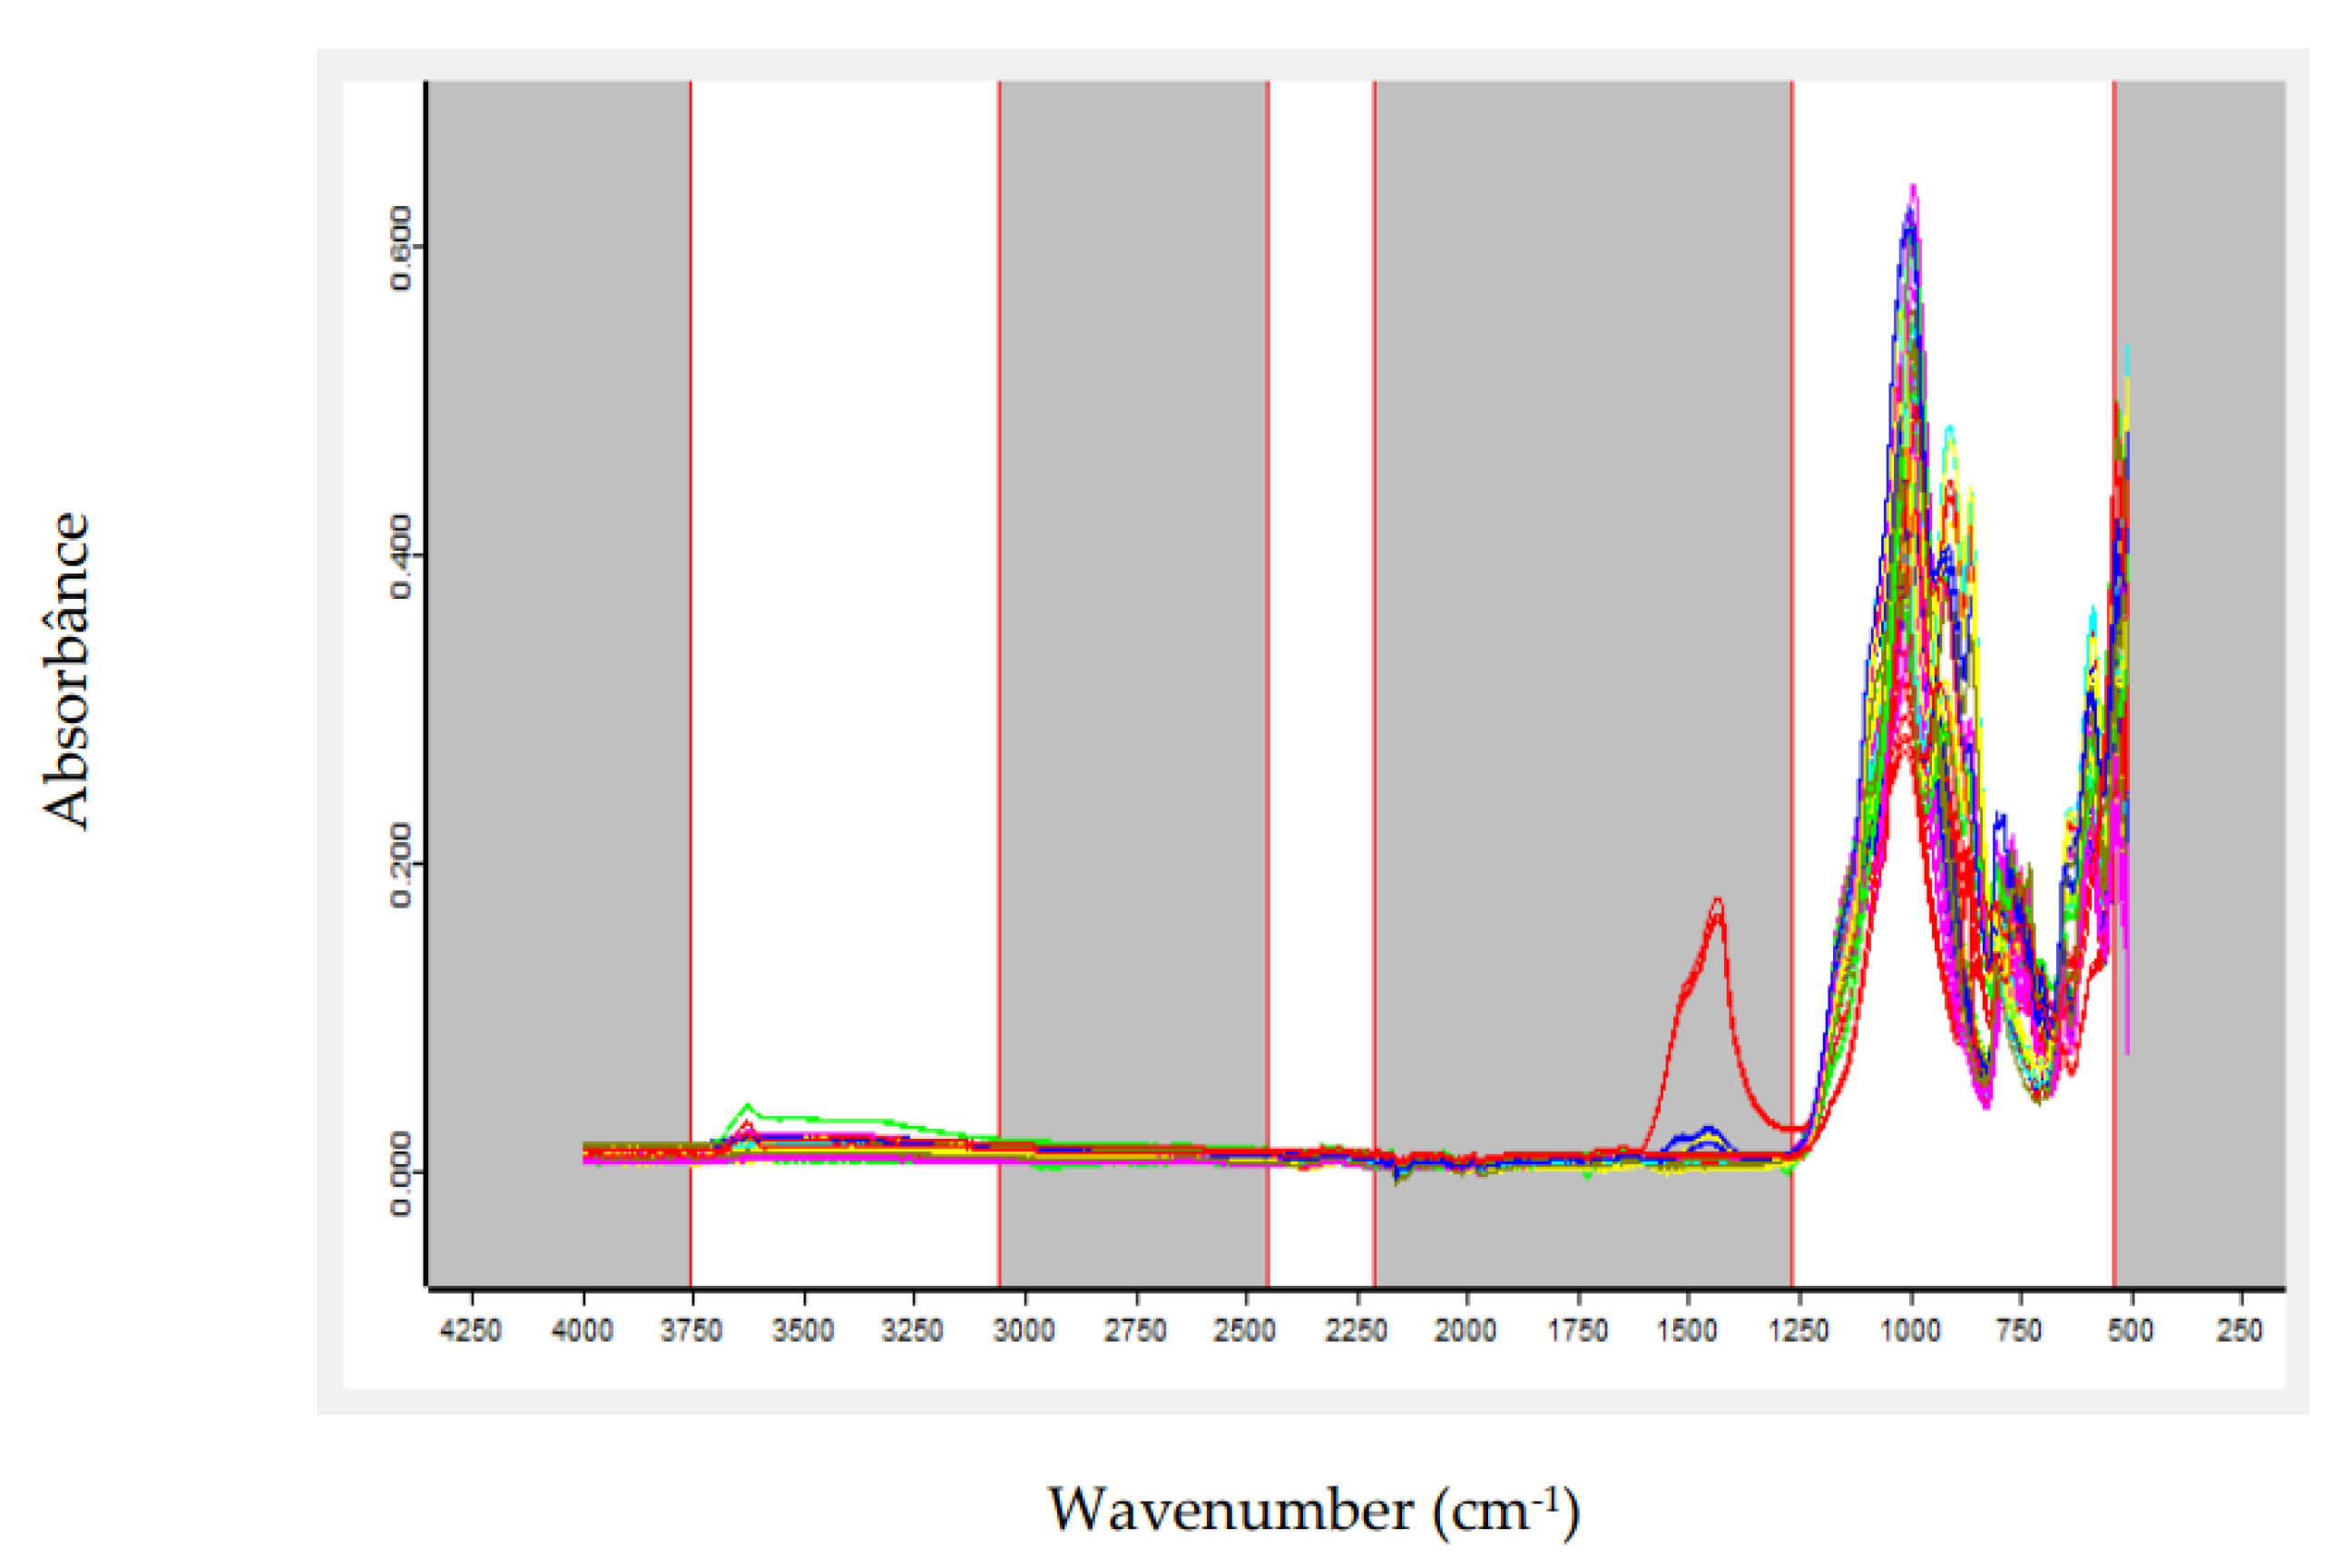
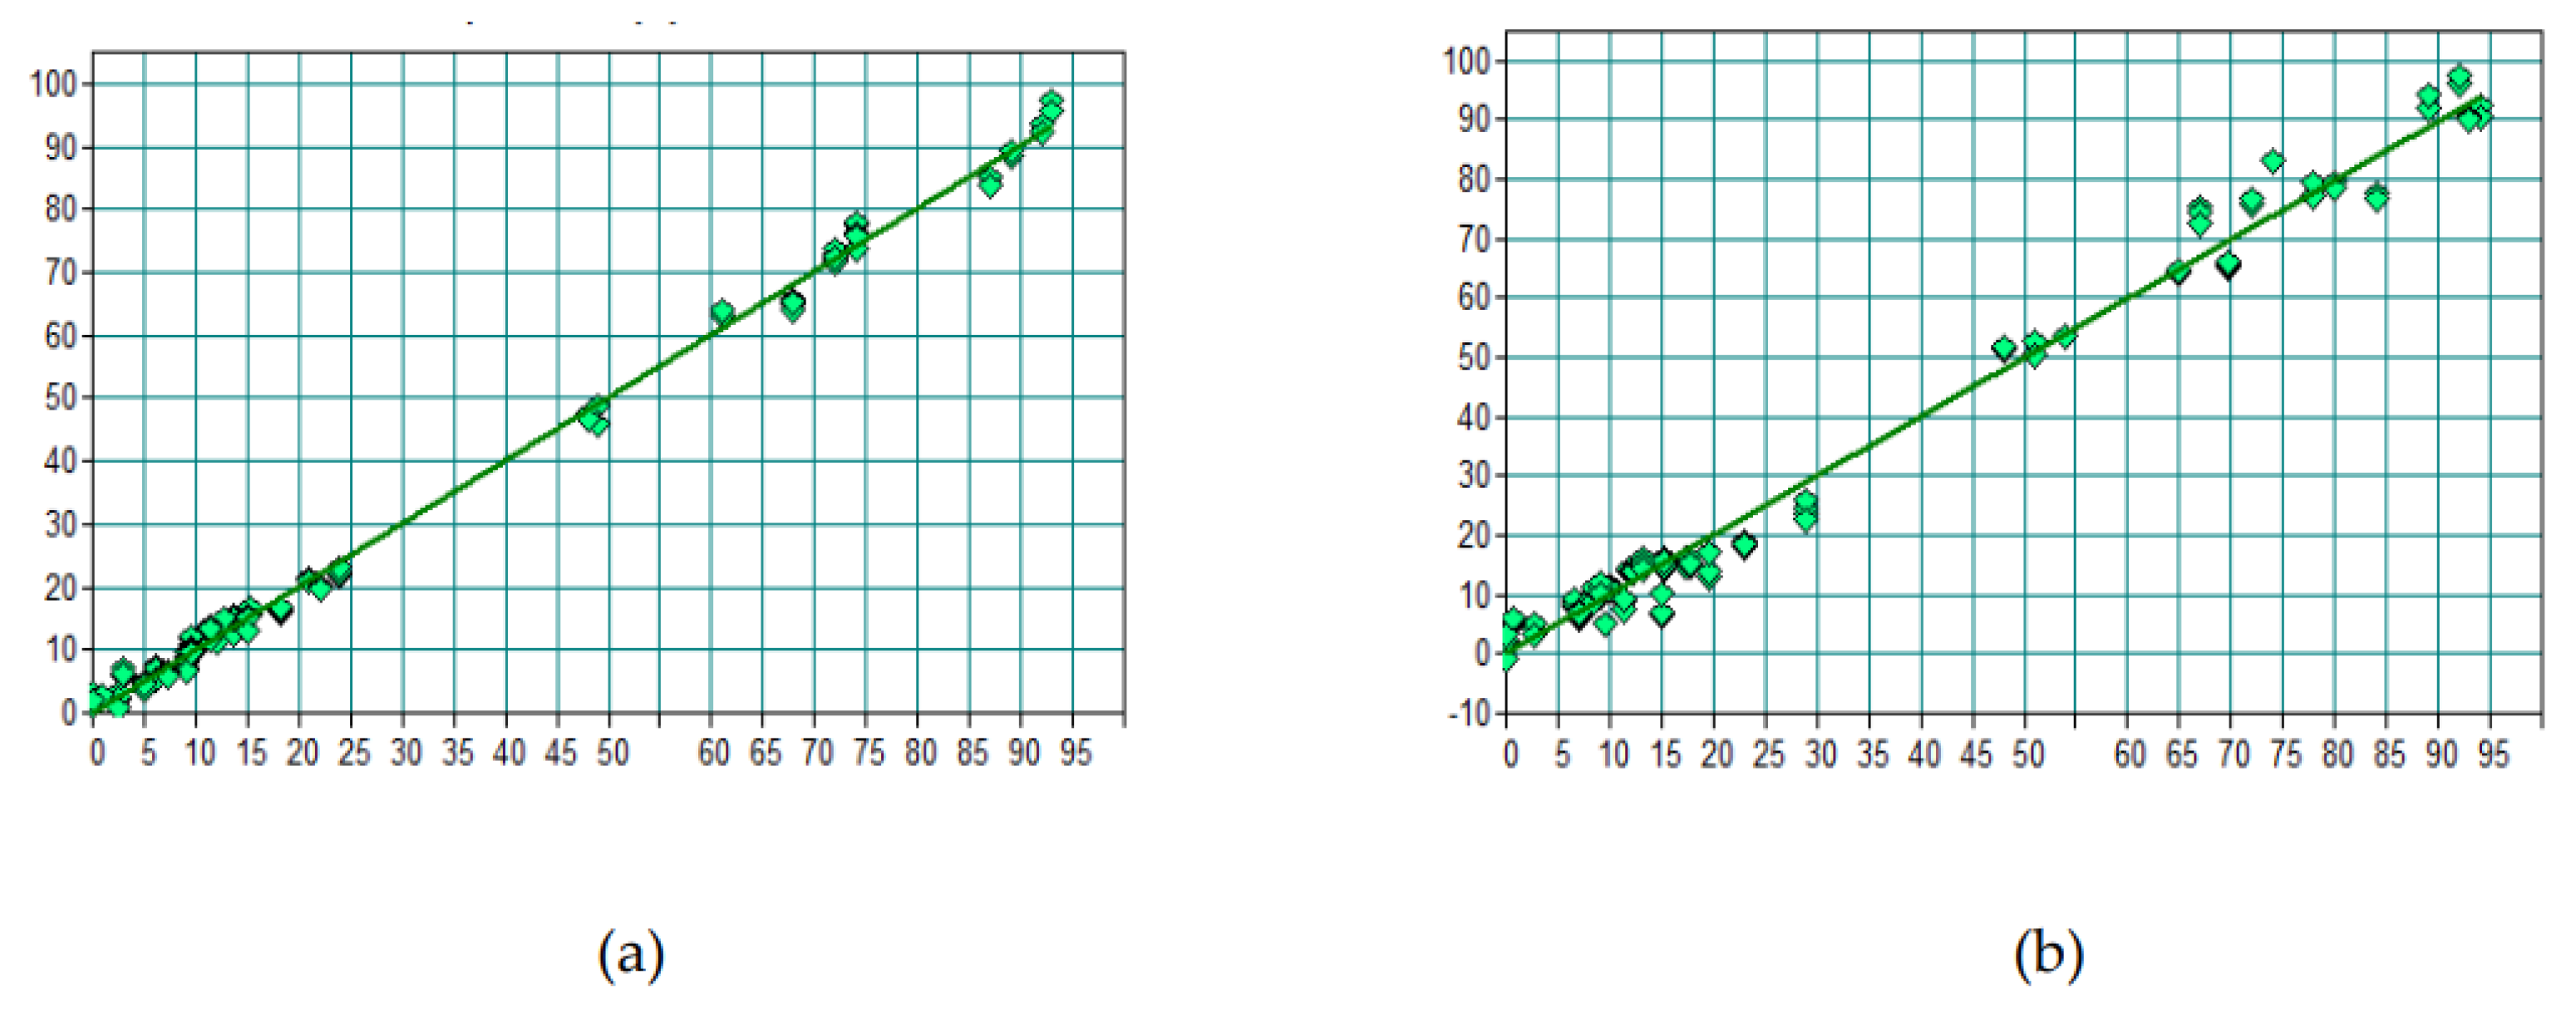
The growing global demand for strategic minerals such as lithium, driven primarily by the battery industry, has made rapid and effective control of mineral quality an urgent necessity. Conventional analytical methods, although accurate, often require considerable time and complex sample preparation, which can delay process control. To overcome this challenge, this work proposes the use of Fourier Transform Infrared (FTIR) spectroscopy combined with Partial Least Squares (PLS) modeling as an efficient alternative. This approach aims to provide immediate response for predicting grades in lithium-bearing ores, such as spodumene, ensuring agility and precision to meet industry demands. This study evaluated the application of FTIR spectroscopy coupled with chemometric modeling for the simultaneous prediction of lithium oxide (Li₂O) and spodumene contents in pegmatitic samples. Two independent PLS models were developed, using spectra preprocessed with first derivative and/or Standard Normal Variate (SNV). Spectral regions were selected based on the structural response of Al–O, Si–O, and OH⁻ groups, which are indirectly influenced by the presence of lithium. The spectral datasets were split into calibration and external test sets, and the models were evaluated based on statistical metrics and Principal Component Analysis (PCA). The Li₂O model achieved an R² of 0.9934 and an RMSEP of 0.185 in external validation, with a mean absolute error below 0.15%. The spodumene model achieved an R² of 0.9961, an RMSEP of 1.79, and a mean absolute error of 2.80%. The results indicate that the FTIR-PLS approach enables efficient quantitative estimation of lithium-bearing minerals, with reduced analytical time, good accuracy, and feasibility for application in process control and mineralogical sorting environments. PCA confirmed the statistical representativeness of the test sets, with no occurrence of spectral extrapolation.
Keywords:
1. Introduction
2. Materials and Methods
3. Results
3.1. Prediction of Li₂O by FTIR
3.2. Spodumene Prediction by FTIR
4. Discussion
5. Conclusions
Author Contributions
Acknowledgments
Conflicts of Interest
Abbreviations
| ATR | Attenuated Total Reflectance |
| FTIR | Fourier Transform Infrared |
| ICP-OES | Inductively Coupled Plasma Optical Emission Spectrometry |
| PCA | Principal Component Analysis |
| PLS | Partial Least Squares |
| RMSE | Root Mean Square Error |
| RMSEE | Root Mean Square Error of Calibration |
| RMSEP | Root Mean Square Error of Prediction |
| SNV | Standard Normal Variate |
| XRD | X-ray Diffraction |
Appendix A
Appendix A.1

| Test Set Validation | ||||
|---|---|---|---|---|
| Sample | Spectrum | Reference Value | Predicted Value | Difference |
| 1 | 1 | 2,20 | 2,01 | 0,19 |
| 1 | 2 | 2,20 | 2,02 | 0,18 |
| 1 | 3 | 2,20 | 1,95 | 0,25 |
| 1 | 4 | 2,20 | 2,08 | 0,12 |
| 2 | 5 | 1,20 | 1,31 | -0,11 |
| 2 | 6 | 1,20 | 1,22 | -0,02 |
| 2 | 7 | 1,20 | 1,27 | -0,07 |
| 2 | 8 | 1,20 | 1,26 | -0,06 |
| 3 | 9 | 0,70 | 0,89 | -0,19 |
| 3 | 10 | 0,70 | 0,88 | -0,18 |
| 3 | 11 | 0,70 | 0,90 | -0,20 |
| 3 | 12 | 0,70 | 0,85 | -0,15 |
| 4 | 13 | 1,30 | 1,36 | -0,06 |
| 4 | 14 | 1,30 | 1,42 | -0,12 |
| 4 | 15 | 1,30 | 1,39 | -0,09 |
| 4 | 16 | 1,30 | 1,38 | -0,08 |
| 5 | 17 | 1,00 | 1,08 | -0,08 |
| 5 | 18 | 1,00 | 1,11 | -0,11 |
| 5 | 19 | 1,00 | 1,09 | -0,05 |
| 5 | 20 | 1,00 | 1,05 | -0,05 |
| 6 | 21 | 1,40 | 1,45 | -0,05 |
| 6 | 22 | 1,40 | 1,49 | -0,09 |
| 6 | 23 | 1,40 | 1,49 | -0,09 |
| 6 | 24 | 1,40 | 1,47 | -0,07 |
| 7 | 25 | 0,93 | 0,92 | 0,01 |
| 7 | 26 | 0,93 | 0,94 | -0,01 |
| 7 | 27 | 0,93 | 0,95 | -0,02 |
| 7 | 28 | 0,93 | 0,95 | -0,02 |
| 8 | 29 | 1,22 | 0,95 | 0,27 |
| 8 | 30 | 1,22 | 0,93 | 0,29 |
| 8 | 31 | 1,22 | 0,93 | 0,29 |
| 8 | 32 | 1,22 | 0,98 | 0,24 |
| 9 | 33 | 1,73 | 1,42 | 0,31 |
| 9 | 34 | 1,73 | 1,43 | 0,30 |
| 9 | 35 | 1,73 | 1,46 | 0,27 |
| 9 | 36 | 1,73 | 1,40 | 0,33 |
| 10 | 37 | 2,33 | 2,00 | 0,34 |
| 10 | 38 | 2,33 | 1,98 | 0,35 |
| 10 | 39 | 2,33 | 2,00 | 0,33 |
| 10 | 40 | 2,33 | 1,93 | 0,40 |
| 11 | 41 | 4,98 | 4,82 | 0,16 |
| 11 | 42 | 4,98 | 4,82 | 0,16 |
| 11 | 43 | 4,98 | 4,85 | 0,14 |
| 11 | 44 | 4,98 | 4,84 | 0,14 |
| 12 | 45 | 1,67 | 1,48 | 0,20 |
| 12 | 46 | 1,67 | 1,50 | 0,17 |
| 12 | 47 | 1,67 | 1,45 | 0,22 |
| 12 | 48 | 1,67 | 1,45 | 0,22 |
| 13 | 49 | 1,61 | 1,60 | 0,01 |
| 13 | 50 | 1,61 | 1,60 | 0,01 |
| 13 | 51 | 1,61 | 1,62 | 0,00 |
| 13 | 52 | 1,61 | 1,61 | 0,00 |
| 14 | 53 | 0,92 | 1,02 | -0,10 |
| 14 | 54 | 0,92 | 0,99 | -0,07 |
| 14 | 55 | 0,92 | 1,02 | -0,10 |
| 14 | 56 | 0,92 | 1,04 | -0,12 |
| 15 | 57 | 0,84 | 0,88 | -0,04 |
| 15 | 58 | 0,84 | 0,90 | -0,06 |
| 15 | 59 | 0,84 | 0,88 | -0,04 |
| 15 | 60 | 0,84 | 0,87 | -0,03 |
| 16 | 61 | 1,29 | 1,33 | -0,03 |
| 16 | 62 | 1,29 | 1,31 | -0,02 |
| 16 | 63 | 1,29 | 1,35 | -0,06 |
| 16 | 64 | 1,29 | 1,31 | -0,02 |
| 17 | 65 | 5,45 | 5,37 | 0,08 |
| 17 | 66 | 5,45 | 5,62 | -0,17 |
| 17 | 67 | 5,45 | 5,42 | 0,03 |
| 17 | 68 | 5,45 | 5,48 | -0,03 |
| 18 | 69 | 5,82 | 5,64 | 0,18 |
| 18 | 70 | 5,82 | 5,54 | 0,28 |
| 18 | 71 | 5,82 | 5,69 | 0,13 |
| 18 | 72 | 5,82 | 5,58 | 0,24 |
| 19 | 73 | 1,34 | 1,34 | 0,00 |
| 19 | 74 | 1,34 | 1,37 | -0,03 |
| 19 | 75 | 1,34 | 1,37 | -0,03 |
| 19 | 76 | 1,34 | 1,33 | 0,01 |
| 20 | 77 | 1,27 | 1,27 | 0,00 |
| 20 | 78 | 1,27 | 1,25 | 0,02 |
| 20 | 79 | 1,27 | 1,22 | 0,05 |
| 20 | 80 | 1,27 | 1,19 | 0,08 |
| 21 | 81 | 1,05 | 1,08 | -0,03 |
| 21 | 82 | 1,05 | 1,09 | -0,04 |
| 21 | 83 | 1,05 | 1,11 | -0,06 |
| 21 | 84 | 1,05 | 1,11 | -0,06 |
| 22 | 85 | 1,09 | 1,13 | -0,04 |
| 22 | 86 | 1,09 | 1,11 | -0,02 |
| 22 | 87 | 1,09 | 1,12 | -0,03 |
| 22 | 88 | 1,09 | 1,13 | -0,04 |
| 23 | 89 | 1,00 | 1,09 | -0,09 |
| 23 | 90 | 1,00 | 1,10 | -0,10 |
| 23 | 91 | 1,00 | 1,06 | -0,06 |
| 23 | 92 | 1,00 | 1,10 | -0,10 |
| 24 | 93 | 0,76 | 0,84 | -0,08 |
| 24 | 94 | 0,76 | 0,83 | -0,07 |
| 24 | 95 | 0,76 | 0,81 | -0,05 |
| 24 | 96 | 0,76 | 0,84 | -0,08 |
| 25 | 97 | 4,18 | 4,41 | -0,23 |
| 25 | 98 | 4,18 | 4,36 | -0,18 |
| 25 | 99 | 4,18 | 4,40 | -0,22 |
| 25 | 100 | 4,18 | 4,39 | -0,21 |
| 26 | 101 | 3,82 | 3,98 | -0,16 |
| 26 | 102 | 3,82 | 3,99 | -0,17 |
| 26 | 103 | 3,82 | 4,06 | -0,24 |
| 26 | 104 | 3,82 | 4,00 | -0,18 |
| 27 | 105 | 3,91 | 4,03 | -0,12 |
| 27 | 106 | 3,91 | 4,09 | -0,18 |
| 28 | 107 | 4,67 | 4,73 | -0,05 |
| 28 | 108 | 4,67 | 4,72 | -0,05 |
| 28 | 109 | 4,67 | 4,75 | -0,08 |
| 28 | 110 | 4,67 | 4,66 | 0,01 |
| 28 | 111 | 4,67 | 4,75 | -0,08 |
| 29 | 112 | 4,69 | 4,93 | -0,24 |
| 29 | 113 | 4,69 | 4,90 | -0,21 |
| 29 | 114 | 4,69 | 4,88 | -0,19 |
| 29 | 115 | 4,69 | 4,70 | -0,01 |
| 30 | 116 | 4,65 | 4,88 | -0,23 |
| 30 | 117 | 4,65 | 4,86 | -0,21 |
| 30 | 118 | 4,65 | 4,84 | -0,19 |
| 30 | 119 | 4,65 | 4,87 | -0,22 |
| 31 | 120 | 4,61 | 4,70 | -0,09 |
| 31 | 121 | 4,61 | 4,73 | -0,12 |
| 31 | 122 | 4,61 | 4,70 | -0,09 |
| 31 | 123 | 4,61 | 4,83 | -0,22 |
| 32 | 124 | 4,45 | 4,60 | -0,15 |
| 32 | 125 | 4,45 | 4,66 | -0,21 |
| 32 | 126 | 4,45 | 4,68 | -0,23 |
| 32 | 127 | 4,45 | 4,69 | -0,24 |
| 33 | 128 | 4,33 | 4,65 | -0,32 |
| 33 | 129 | 4,33 | 4,66 | -0,33 |
| 33 | 130 | 4,33 | 4,67 | -0,34 |
| 33 | 131 | 4,33 | 4,61 | -0,28 |
| 34 | 132 | 0,16 | 0,50 | -0,34 |
| 34 | 133 | 0,16 | 0,48 | -0,32 |
| 34 | 134 | 4,14 | 4,01 | 0,13 |
| 34 | 135 | 4,14 | 4,06 | 0,08 |
| 35 | 136 | 4,14 | 4,09 | 0,05 |
| 35 | 137 | 4,14 | 3,93 | 0,22 |
| 36 | 138 | 1,61 | 1,62 | -0,01 |
| 36 | 139 | 1,61 | 1,60 | 0,01 |
| 36 | 140 | 1,61 | 1,58 | 0,03 |
| 36 | 141 | 1,61 | 1,61 | 0,00 |
| 37 | 142 | 1,00 | 1,12 | -0,12 |
| 37 | 143 | 1,00 | 1,10 | -0,10 |
| 37 | 144 | 1,00 | 1,09 | -0,09 |
| 37 | 145 | 1,00 | 1,13 | -0,13 |
| 38 | 146 | 0,95 | 0,99 | -0,04 |
| 38 | 147 | 0,95 | 0,98 | -0,03 |
| 38 | 148 | 0,95 | 0,90 | 0,05 |
| 38 | 149 | 0,95 | 0,93 | 0,02 |
| 39 | 150 | 0,83 | 0,96 | -0,13 |
| 39 | 151 | 0,83 | 0,91 | -0,08 |
| 39 | 152 | 0,83 | 0,90 | -0,07 |
| 39 | 153 | 0,83 | 0,92 | -0,09 |
| 40 | 154 | 0,71 | 0,91 | -0,20 |
| 40 | 155 | 0,71 | 0,94 | -0,23 |
| 40 | 156 | 0,71 | 0,93 | -0,22 |
| 40 | 157 | 0,71 | 0,95 | -0,24 |
| 41 | 158 | 5,20 | 5,64 | -0,44 |
| 41 | 159 | 5,20 | 5,52 | -0,32 |
| 41 | 160 | 5,20 | 5,44 | -0,24 |
| 42 | 161 | 1,02 | 1,37 | -0,35 |
| 42 | 162 | 1,02 | 1,40 | -0,38 |
| 42 | 163 | 1,02 | 1,37 | -0,35 |
| 42 | 164 | 1,02 | 1,41 | -0,39 |
| 43 | 165 | 1,29 | 1,25 | 0,04 |
| 43 | 166 | 1,29 | 1,25 | 0,04 |
| 43 | 167 | 1,29 | 1,28 | 0,01 |
| 43 | 168 | 1,29 | 1,35 | -0,06 |
| 44 | 169 | 1,32 | 1,21 | 0,11 |
| 44 | 170 | 1,32 | 1,14 | 0,18 |
| 44 | 171 | 1,32 | 1,27 | 0,05 |
| 44 | 172 | 1,32 | 1,20 | 0,12 |
| 45 | 173 | 5,55 | 5,94 | -0,39 |
| 45 | 174 | 5,55 | 5,92 | -0,37 |
| 45 | 175 | 5,55 | 5,96 | -0,41 |
| 45 | 176 | 5,55 | 5,87 | -0,32 |
| 45 | 177 | 5,55 | 5,83 | -0,28 |
| 45 | 178 | 5,55 | 5,91 | -0,36 |
| 45 | 179 | 5,55 | 5,84 | -0,29 |
| 46 | 180 | 5,68 | 5,94 | -0,26 |
| 46 | 181 | 5,68 | 6,08 | -0,40 |
| 46 | 182 | 5,68 | 5,98 | -0,30 |
| 46 | 183 | 5,68 | 5,95 | -0,27 |
| 47 | 184 | 1,42 | 1,54 | -0,12 |
| 47 | 185 | 1,42 | 1,27 | 0,16 |
| 47 | 186 | 1,42 | 1,33 | 0,09 |
| 47 | 187 | 1,42 | 1,25 | 0,17 |
| 48 | 188 | 5,37 | 5,64 | -0,27 |
| 48 | 189 | 5,37 | 5,69 | -0,32 |
| 48 | 190 | 5,37 | 5,78 | -0,41 |
| 49 | 191 | 1,59 | 1,42 | 0,17 |
| 49 | 192 | 1,59 | 1,45 | 0,14 |
| 49 | 193 | 1,59 | 1,44 | 0,15 |
| 49 | 194 | 1,59 | 1,42 | 0,17 |
| 50 | 195 | 1,44 | 1,27 | 0,17 |
| 50 | 196 | 1,44 | 1,31 | 0,13 |
| 50 | 197 | 1,44 | 1,31 | 0,13 |
| 50 | 198 | 1,44 | 1,26 | 0,18 |
| 51 | 199 | 1,33 | 1,27 | 0,07 |
| 51 | 200 | 1,33 | 1,24 | 0,09 |
| 51 | 201 | 1,33 | 1,33 | 0,00 |
| 51 | 202 | 1,33 | 1,36 | -0,02 |
| 52 | 203 | 1,47 | 1,40 | 0,08 |
| 52 | 204 | 1,47 | 1,38 | 0,09 |
| 52 | 205 | 1,47 | 1,44 | 0,03 |
| 52 | 206 | 1,47 | 1,36 | 0,11 |
| 53 | 207 | 1,14 | 1,11 | 0,03 |
| 53 | 208 | 1,14 | 1,11 | 0,03 |
| 53 | 209 | 1,14 | 1,10 | 0,04 |
| 53 | 210 | 1,14 | 1,13 | 0,01 |
| 54 | 211 | 1,29 | 1,16 | 0,13 |
| 54 | 212 | 1,29 | 1,11 | 0,18 |
| 54 | 213 | 1,29 | 1,20 | 0,09 |
| 54 | 214 | 1,29 | 1,16 | 0,13 |
| 55 | 215 | 7,61 | 7,35 | 0,26 |
| 55 | 216 | 7,61 | 7,29 | 0,32 |
| 56 | 217 | 3,06 | 2,88 | 0,18 |
| 56 | 218 | 3,06 | 2,84 | 0,22 |
| 56 | 219 | 3,06 | 2,82 | 0,24 |
| 56 | 220 | 3,06 | 2,94 | 0,12 |
| 57 | 221 | 0,42 | 0,71 | -0,29 |
| 57 | 222 | 0,42 | 0,74 | -0,32 |
| 57 | 223 | 0,42 | 0,73 | -0,31 |
| 57 | 224 | 0,42 | 0,70 | -0,28 |
| 58 | 225 | 1,61 | 1,42 | 0,20 |
| 59 | 226 | 0,00 | 0,01 | -0,01 |
| 59 | 227 | 0,00 | 0,03 | -0,03 |
| Test Set Validation | |||||
|---|---|---|---|---|---|
| Sample | Spectrum | Reference Value | Predicted Value | Difference | |
| 1 | 1 | 9,60 | 4,67 | 4,93 | |
| 2 | 2 | 6,60 | 8,29 | -1,69 | |
| 2 | 3 | 6,60 | 7,36 | -0,76 | |
| 2 | 4 | 6,60 | 7,88 | -1,28 | |
| 2 | 5 | 6,60 | 8,86 | -2,26 | |
| 3 | 6 | 2,70 | 3,63 | -0,93 | |
| 3 | 7 | 2,70 | 3,72 | -1,02 | |
| 3 | 8 | 2,70 | 4,80 | -2,10 | |
| 3 | 9 | 2,70 | 3,05 | -0,35 | |
| 4 | 10 | 11,90 | 14,10 | -2,20 | |
| 4 | 11 | 11,90 | 13,70 | -1,80 | |
| 4 | 12 | 11,90 | 13,69 | -1,79 | |
| 4 | 13 | 11,90 | 14,17 | -2,27 | |
| 5 | 14 | 7,00 | 5,49 | 1,51 | |
| 5 | 15 | 7,00 | 7,13 | -0,13 | |
| 5 | 16 | 7,00 | 6,32 | 0,68 | |
| 5 | 17 | 7,00 | 6,79 | 0,21 | |
| 6 | 18 | 0,00 | 1,76 | -1,76 | |
| 6 | 19 | 0,00 | 1,83 | -1,83 | |
| 7 | 20 | 15,00 | 6,05 | 8,96 | |
| 7 | 21 | 15,00 | 6,54 | 8,46 | |
| 7 | 22 | 15,00 | 10,05 | 4,95 | |
| 8 | 23 | 29,00 | 23,17 | 5,83 | |
| 8 | 24 | 29,00 | 24,00 | 5,00 | |
| 8 | 25 | 29,00 | 25,49 | 3,51 | |
| 8 | 26 | 29,00 | 22,50 | 6,50 | |
| 9 | 27 | 17,30 | 15,72 | 1,58 | |
| 9 | 28 | 17,30 | 14,72 | 2,58 | |
| 9 | 29 | 17,30 | 14,74 | 2,56 | |
| 9 | 30 | 17,30 | 14,52 | 2,78 | |
| 10 | 31 | 17,70 | 15,64 | 2,06 | |
| 10 | 32 | 17,70 | 14,29 | 3,41 | |
| 10 | 33 | 17,70 | 14,57 | 3,13 | |
| 10 | 34 | 17,70 | 15,04 | 2,66 | |
| 11 | 35 | 9,10 | 9,22 | -0,12 | |
| 11 | 36 | 9,10 | 9,92 | -0,82 | |
| 11 | 37 | 9,10 | 10,25 | -1,15 | |
| 11 | 38 | 9,10 | 9,95 | -0,85 | |
| 12 | 39 | 9,40 | 11,17 | -1,77 | |
| 12 | 40 | 9,40 | 10,96 | -1,56 | |
| 12 | 41 | 9,40 | 10,84 | -1,44 | |
| 12 | 42 | 9,40 | 10,11 | -0,71 | |
| 13 | 43 | 12,40 | 13,87 | -1,47 | |
| 13 | 44 | 12,40 | 14,11 | -1,71 | |
| 13 | 45 | 12,40 | 13,52 | -1,12 | |
| 13 | 46 | 12,40 | 13,34 | -0,94 | |
| 14 | 47 | 69,70 | 64,76 | 4,94 | |
| 14 | 48 | 69,70 | 65,92 | 3,78 | |
| 14 | 49 | 69,70 | 65,39 | 4,31 | |
| 14 | 50 | 69,70 | 65,51 | 4,19 | |
| 15 | 51 | 15,26 | 14,10 | 1,16 | |
| 15 | 52 | 15,26 | 14,42 | 0,84 | |
| 15 | 53 | 15,26 | 16,07 | -0,81 | |
| 15 | 54 | 15,26 | 15,37 | -0,11 | |
| 16 | 55 | 13,14 | 14,67 | -1,53 | |
| 16 | 56 | 13,14 | 15,98 | -2,84 | |
| 16 | 57 | 13,14 | 15,14 | -2,00 | |
| 16 | 58 | 13,14 | 13,95 | -0,81 | |
| 17 | 59 | 8,38 | 9,84 | -1,46 | |
| 17 | 60 | 8,38 | 9,30 | -0,92 | |
| 17 | 61 | 8,38 | 8,44 | -0,06 | |
| 17 | 62 | 8,38 | 10,86 | -2,48 | |
| 18 | 63 | 9,92 | 10,44 | -0,52 | |
| 18 | 64 | 9,92 | 11,18 | -1,26 | |
| 18 | 65 | 9,92 | 10,52 | -0,60 | |
| 18 | 66 | 9,92 | 10,56 | -0,64 | |
| 19 | 67 | 9,19 | 10,59 | -1,40 | |
| 19 | 68 | 9,19 | 11,62 | -2,43 | |
| 19 | 69 | 9,19 | 11,50 | -2,31 | |
| 19 | 70 | 9,19 | 9,93 | -0,74 | |
| 20 | 71 | 19,60 | 12,78 | 6,82 | |
| 20 | 72 | 19,60 | 13,66 | 5,94 | |
| 20 | 73 | 19,60 | 16,60 | 3,00 | |
| 21 | 74 | 11,50 | 8,29 | 3,21 | |
| 21 | 75 | 11,50 | 9,01 | 2,49 | |
| 21 | 76 | 11,50 | 7,25 | 4,25 | |
| 21 | 77 | 11,50 | 8,83 | 2,67 | |
| 22 | 78 | 0,70 | 4,89 | -4,19 | |
| 22 | 79 | 0,70 | 5,81 | -5,11 | |
| 22 | 80 | 0,70 | 5,07 | -4,37 | |
| 22 | 81 | 0,70 | 5,76 | -5,06 | |
| 23 | 82 | 72,00 | 76,45 | -4,45 | |
| 23 | 83 | 72,00 | 76,50 | -4,50 | |
| 24 | 84 | 67,00 | 74,76 | -7,76 | |
| 24 | 85 | 67,00 | 74,24 | -7,24 | |
| 24 | 86 | 67,00 | 72,11 | -5,11 | |
| 25 | 87 | 23,00 | 17,82 | 5,18 | |
| 25 | 88 | 23,00 | 18,73 | 4,27 | |
| 25 | 89 | 23,00 | 18,19 | 4,81 | |
| 26 | 90 | 72,00 | 75,62 | -3,62 | |
| 26 | 91 | 72,00 | 76,49 | -4,49 | |
| 27 | 92 | 48,00 | 50,81 | -2,81 | |
| 27 | 93 | 48,00 | 51,22 | -3,22 | |
| 28 | 94 | 89,00 | 91,64 | -2,64 | |
| 28 | 95 | 89,00 | 93,86 | -4,86 | |
| 29 | 96 | 74,00 | 82,68 | -8,68 | |
| 29 | 97 | 74,00 | 83,00 | -9,00 | |
| 30 | 98 | 54,00 | 53,34 | 0,66 | |
| 30 | 99 | 54,00 | 53,28 | 0,72 | |
| 31 | 100 | 78,00 | 77,01 | 0,99 | |
| 31 | 101 | 78,00 | 79,18 | -1,18 | |
| 32 | 102 | 92,00 | 95,64 | -3,64 | |
| 32 | 103 | 92,00 | 96,93 | -4,93 | |
| 33 | 104 | 65,00 | 64,11 | 0,89 | |
| 33 | 105 | 65,00 | 64,23 | 0,77 | |
| 34 | 106 | 84,00 | 77,14 | 6,86 | |
| 34 | 107 | 84,00 | 76,29 | 7,71 | |
| 35 | 108 | 80,00 | 79,37 | 0,63 | |
| 35 | 109 | 80,00 | 77,99 | 2,01 | |
| 36 | 110 | 94,00 | 92,25 | 1,75 | |
| 36 | 111 | 94,00 | 90,29 | 3,71 | |
| 37 | 112 | 51,00 | 52,48 | -1,48 | |
| 37 | 113 | 51,00 | 49,93 | 1,07 | |
| 38 | 114 | 93,00 | 90,29 | 2,71 | |
| 38 | 115 | 93,00 | 89,62 | 3,38 | |
| 39 | 116 | 0,00 | -1,16 | 1,16 | |
| 39 | 117 | 0,00 | 2,86 | -2,86 | |
References
- Sardisco, L.; et al. Multi-Technique Analytical Approach to Quantitative Analysis of Spodumene. Minerals, 2022, 12, 175. [Google Scholar] [CrossRef]
- Vahur, S.; Et al Quantitative mineralogical analysis of clay-containing materials using ATR-FT-IR spectroscopy with PLS method. Analytical and Bioanalytical Chemistry, 2021.
- Guatame-García, A.; Buxton, M. Prediction of Soluble Al2O3 in Calcined Kaolin Using Infrared Spectroscopy and Multivariate Calibration. Minerals, 2018, 8, 136. [Google Scholar] [CrossRef]
- Müller, M. M.; et al. Infrared Attenuated Total Reflectance Spectroscopy: An Innovative Strategy for Analyzing Mineral Components in Energy Relevant Systems. Scientific Reports, 2014, 4, 6764. [Google Scholar] [CrossRef] [PubMed]
- Xu, X.; et al. Detection of soil organic matter from laser-induced breakdown spectroscopy (LIBS) and mid-infrared spectroscopy (FTIR-ATR) coupled with multivariate techniques. Geodema, 2019, 355, 113905. [Google Scholar] [CrossRef]
- Zhao, M.; et al. Quantification of calcium in infant formula using laser-induced breakdown spectroscopy (LIBS), Fourier transform mid-infrared (FT-IR) and Raman spectroscopy combined with chemometrics including data fusion. Food Chemistry 2020, 320, 126639. [Google Scholar] [CrossRef] [PubMed]
- RITZ, M.; et al. Determination of Chlorite, Muscovite, Albite and Quartz in Claystones and Clay Shales By Infrared Spectroscopy and Partialleast-Squares Regression. Acta Geodyn. Geomater. 2012, 9, 9–4. [Google Scholar]
- Dehaine, Q.; et al. Geometallurgical Characterisation with Portable FTIR: Application to Sediment-Hosted Cu-Co Ores. Minerals 2022, 12, 15. [Google Scholar] [CrossRef]
- Stacey, P.; Clegg, F.; Sammon, C. Multicomponent Measurement of Respirable Quartz, Kaolinite and Coal Dust using Fourier Transform Infrared Spectroscopy (FTIR): A Comparison Between Partial Least Squares and Principal Component Regressions. Annals of Work Exposures and Health, 2022, 66- 5, pp 644–655.
- Weakley, A.T.; et al. Quantifying silica in filter-deposited mine dusts using infrared spectra and partial least squares regression 2014, Anal Bioanal Chem 406, 4715–4724.

Disclaimer/Publisher’s Note: The statements, opinions and data contained in all publications are solely those of the individual author(s) and contributor(s) and not of MDPI and/or the editor(s). MDPI and/or the editor(s) disclaim responsibility for any injury to people or property resulting from any ideas, methods, instructions or products referred to in the content. |
© 2025 by the authors. Licensee MDPI, Basel, Switzerland. This article is an open access article distributed under the terms and conditions of the Creative Commons Attribution (CC BY) license (http://creativecommons.org/licenses/by/4.0/).


