
Submitted:
13 November 2025
Posted:
14 November 2025
You are already at the latest version
Abstract
Drought is a major constraint to Cannabis sativa productivity and cannabinoid yield, yet the physiological mechanisms underlying genotypic variation in drought responses remain poorly understood. We hypothesized that (i) more vigorous genotypes would sustain higher photosynthetic rates, (ii) drought would constrain photosynthesis through both diffusional and non-diffusional limitations, and (iii) water deficit would alter cannabinoid production in a genotype-dependent manner. To test these hypoth-eses, two contrasting genotypes (one tetrahydrocannabinol- (THC) dominant and an-other cannabidiol- (CBD) dominant) were grown under greenhouse conditions, with water deficit imposed at early flowering. Leaf water relations remained stable across genotypes and treatments. Although CBD plants accumulated more biomass, they did not exhibit higher photosynthetic rates under well-watered conditions. Under drought, THC plants relied primarily on stomatal regulation, whereas CBD plants showed addi-tional mesophyll and biochemical impairments, resulting in stronger declines in pho-tosynthesis. Despite contrasting photoprotective adjustments, both genotypes con-verged to similar oxidative damage, suggesting that photoprotection was not decisive for their physiological divergence. At the agronomic level, THC plants maintained a higher harvest index under drought, greater baseline cannabinoid concentrations, and inflorescence biomass with higher energetic value. In CBD plants, drought-induced reductions in cannabinoid content and harvest index largely reflected greater photo-synthetic impairment and less efficient carbon use. Overall, resilience of C. sativa to drought imposed at early flowering appears to depend less on hydraulic stability and more on sustaining photosynthetic performance, secondary metabolism, and efficient biomass partitioning. These traits represent key targets for breeding genotypes better adapted to cultivation under increasingly variable water availability.
Keywords:
carbon allocation
; cannabinoid yield
; drought stress
; harvest index
; photosynthetic performance
1. Introduction
Among abiotic stresses, drought is a major constraint to plant performance, limiting growth and productivity and often reshaping resource allocation in crops [1,2]. The magnitude of its effects depends on the intensity and duration of stress, as well as on genotypic traits and plant developmental stage [3]. One of the earliest physiological responses to declining soil water availability is the inhibition of cell expansion, directly caused by reduced turgor as tissues lose water [4,5]. This response usually leads to reductions in leaf area and plant stature; however, biomass may also be preferentially allocated to roots, thereby enhancing soil exploration and water uptake capacity [6]. In addition, plants often adjust their water relations through osmotic adjustment—via the accumulation of compatible solutes to sustain turgor—and elastic adjustment, involving changes in cell wall mechanical properties that moderate the decline in water potential (Ψw) with water loss. Such adjustments help to establish favorable Ψw gradients that facilitate water uptake and/or retention, thereby contributing to homeostasis under drought and mitigating its negative impacts [7].
To conserve water, plants typically partially close stomata under drought [6], leading to reduced stomatal conductance (gs). As a result, both transpiration and CO2 diffusion into the leaf are restricted, ultimately limiting photosynthesis [3,6]. In parallel, mesophyll conductance (gm), which governs CO2 diffusion to the chloroplast stroma, also tends to decrease, further reinforcing diffusional limitations to photosynthesis [5,8]. As drought intensifies, photosynthesis is additionally constrained by photochemical limitations, including reduced ATP and NADPH production that impairs RuBP regeneration, and by biochemical constraints such as decreased RuBisCO activity [5,9]. Thus, photosynthesis under drought reflects the interplay of diffusional and non-diffusional limitations, whose relative importance depends on stress intensity and duration, genotype, atmospheric evaporative demand, and previous drought exposure [5,10]. In any case, as photosynthesis declines, part of the absorbed light energy cannot be dissipated through photochemical processes, favoring the overproduction of reactive oxygen species (ROS). Although enzymatic (e.g., superoxide dismutase, SOD; catalase, CAT; peroxidases, POX) and non-enzymatic (e.g., ascorbate, glutathione, carotenoids, phenolics, proline) antioxidant systems act to scavenge ROS, insufficient antioxidant responses may lead to oxidative damage, including lipid peroxidation, pigment degradation, and impaired chloroplast membranes and proteins [11,12].
Cannabis sativa L., an annual and predominantly dioecious species, has gained increasing agronomic and biomedical interest owing to its production of fibers, seeds, and recreational and medicinal cannabinoids, particularly Δ⁹-tetrahydrocannabinol (THC) and cannabidiol (CBD) [13]. These compounds accumulate in glandular trichomes, especially on pistillate inflorescences of female plants, which bear higher trichome densities than other tissues [14]. Under drought, cannabis exhibits typical plant responses, including impaired water status accompanied by reductions in gs and net photosynthesis rates (A) [13]. Recent studies in hemp and medicinal cannabis have documented wide variation in stomatal sensitivity to drought, reflecting adaptive diversity and potential for selecting more resilient genotypes [13,15,16]. Nevertheless, the mechanistic basis of reduced photosynthetic performance under drought in cannabis remains only partially understood and warrants further investigation.
From a metabolic and productive perspective, drought can decrease biomass accumulation and floral yield in cannabis, but its effects on cannabinoid content are variable and depend on stress intensity, developmental stage, and genotype [13]. Controlled studies suggest that moderate, late-stage drought (during advanced flowering) may increase THC and CBD concentrations without penalizing inflorescence mass, whereas severe or early drought tends to reduce both yield and cannabinoid levels [17,18,19]. Overall, the available evidence points to nonlinear, genotype-specific responses.
Because cannabis cultivation requires relatively few agricultural inputs, the species may be suitable for production under reduced water availability, even when yield is partially compromised, as reported for industrial hemp [20]. Understanding how cannabis genotypes respond physiologically and productively to water deficit is therefore critical, particularly in light of the projected increase in drought frequency and severity under climate change [21]. We hypothesized that (i) more vigorous genotypes, characterized by greater biomass accumulation, would also sustain higher photosynthetic rates; (ii) drought would constrain photosynthesis through both diffusional and non-diffusional limitations, with genotypic differences in their relative contribution; and (iii) water deficit would alter the production of major cannabinoids (CBD and THC) in a genotype-dependent manner, reflecting variation in photosynthetic performance and water status. To test these hypotheses, we compared two contrasting cannabis genotypes, differing in growth and cannabinoid profile, by evaluating their water relations, photosynthetic, metabolic, and productive responses under contrasting water regimes.
2. Results
As expected, both leaf Ψw at predawn (Ψpd) and midday (Ψmd) declined under drought, except for Ψmd in CBD plants under 50% FC (Figure 1). Interestingly, Ψpd remained relatively stable as soil water content declined from 50% to 30% field capacity (FC), suggesting a limited capacity of predawn values to reflect progressive stress severity. By contrast, Ψmd exhibited a marked reduction (from –0.4/–0.5 MPa to –0.8 MPa) in both genotypes, highlighting its greater sensitivity to short-term diurnal water deficits. At 30% FC, no genotypic differences were detected in either Ψpd or Ψmd, indicating comparable water status with increasing drought severity (Figure 1).
From pressure–volume curves, the osmotic potential at full turgor (Ψs(100)) and at the turgor loss point (Ψs(0)), and the bulk modulus of elasticity (ε) were essentially similar across genotypes and unaffected by the treatments (Table 1). Leaf capacitance at full turgor (C(100)) remained stable across treatments, whereas capacitance at the turgor loss point (C(0)) in THC plants decreased by 50% under drought compared with control values (Table 1).
Under full irrigation, gas-exchange parameters did not differ between genotypes. In contrast, drought stress markedly altered these traits (Figure 2). At 50% FC, A declined by approximately 40%, accompanied by sharp reductions in gs (76–81%), intercellular CO2 concentration (Ci, 32–48%), and transpiration rate (E, ~67%) relative to control plants, irrespective of genotype (Figure 2A–D). Conversely, the electron transport rate (ETR) and the single-point apparent maximum carboxylation capacity of RuBisCO, based on chloroplastic CO2 concentration (Vcmax), remained unaffected (Figure 2E–F), whereas the ETR/A and photorespiration to gross photosynthesis (Rp/AG) ratios nearly doubled under drought in both genotypes (Figure 2G–H). At 30% FC, decreases in A and gs became even more pronounced, particularly in CBD, reaching ~20% and 6%, respectively, of the values observed in irrigated plants (in THC, the corresponding values were 44% and 20%, as can be deduced from Figure 2A–B). In THC, however, A did not decline further relative to 50% FC, whereas E was strongly reduced (Figure 2D). While ETR remained stable, Vcmax decreased by 37% exclusively in CBD (Figure 2E–F). Furthermore, both ETR/A and Rp/AG ratios plateaued at 30% FC in THC plants but in CBD they were 242% and 189% higher, respectively, than in well-watered controls (Figure 2G–H). Regardless of drought severity, A and gs were strongly and positively correlated (r ≥ 0.79, P < 0.05) in both genotypes.
We additionally assessed some chlorophyll (Chl) a fluorescence (only at 30% FC) and showed similar drought responses in both genotypes (Table 2). In control plants, the maximum quantum efficiency of PSII photochemistry (Fv/Fm) values averaged 0.81–0.83, but declined by approximately 20% under drought, a reduction accompanied by marked increases in the minimum fluorescence (F0, 52-66%), whereas the coefficient of photochemical quenching (qL) strongly decreased by 59-73% and the non-photochemical quenching (NPQ) reduced by 36-40%; nevertheless, the absolute values of NPQ were consistently higher in THC (81–98%) than in CBD plants, irrespective of water availability (Table 2).
Antioxidant enzyme activities declined overall under drought (Table 3). SOD activity decreased by 36% in CBD and 50% in THC, while CAT was reduced by 30% and 22%, respectively, in these clones. Despite these reductions, both SOD and CAT activities remained higher in CBD than in THC plants, an advantage that became even more evident under drought, with activities 78% (SOD) and 45% (CAT) greater in CBD. In contrast, POX activity showed a genotype-specific response: it dropped sharply in CBD (58%) but was unaffected in THC, resulting in similar levels between genotypes under drought. Regardless of these enzymatic differences, malondialdehyde (MDA) concentrations increased by ~23–29% in both genotypes, indicating comparable oxidative damage under water deficit (Table 3).
Metabolic analyses revealed pronounced shifts in metabolite profiles under water deficit (Table 4). Total Chl (a + b) decreased by 33% in CBD and 18% in THC plants, resulting in 32% higher Chl pools in droughted THC individuals. Carotenoid concentrations also declined, by 40% in CBD and 27% in THC. Regardless of genotype, drought induced significant reductions in free amino acids (~30%) and in carbohydrates, as evidenced by decreases in concentrations of glucose (~35%), fructose (~22%), sucrose (~22%), and starch (19% in CBD and 39% in THC). Glucose and fructose concentrations did not differ between genotypes; however, sucrose pools were consistently higher (~15%) in THC than in CBD plants. Conversely, starch concentrations were markedly lower in THC plants—by 33% under irrigation and 42% under drought—relative to CBD. Total phenols were unaffected by drought but remained slightly higher in CBD than in THC. Proline concentration showed no significant genotypic differences under either water regime, although it declined by 23% under drought only in THC (Table 4).
As expected, CBD concentrations were substantially higher in the CBD genotype (~7%, w/w) than in the THC genotype (~0.3–0.4%). Conversely, the THC genotype accumulated markedly greater THC pools (16.8–20.7%) than the CBD genotype (0.63–0.68%) (Figure 3). Water deficit significantly reduced cannabinoid concentrations in both genotypes, decreasing THC levels by 7% and 19% and CBD concentrations by 14% and 25% in the CBD and THC genotypes, respectively (Figure 3A–B). Total cannabigerol (CBG) levels were low (<0.1%) in CBD plants and remained unaffected by drought, whereas in THC individuals they were consistently higher (~0.4–0.5%) but declined by 24% under water deficit (Figure 3C). Regardless of water regime, THC plants maintained substantially higher total cannabinoid pools—approximately 1.7-fold those of CBD plants (Figure 3D).
Relative to THC, both well-watered and droughted CBD plants accumulated greater total biomass (by 37% and 25%, respectively), primarily due to their higher stem biomass (85% and 94%), whereas leaf biomass was comparable between genotypes (Figure 4A–C). The greater stem mass of CBD plants was mainly associated with their larger stem diameter (~40%), as plant height did not differ between genotypes (data not shown). None of these growth traits were significantly affected by water availability in either genotype. In contrast, total leaf area did not differ between genotypes but declined by approximately 10% under drought, irrespective of genotype (Figure 4D). Inflorescence biomass was higher in well-watered CBD plants but similar between genotypes under drought; however, drought reduced inflorescence biomass by 32% in CBD plants only (Figure 4E). Consequently, harvest index (HI) decreased by 22% in these plants relative to their well-watered counterparts, although HI values in well-watered CBD plants remained comparable to those observed in THC plants under both water regimes (Figure 4F).
3. Discussion
3.1. Stable Leaf Water Relations Fail to Explain Divergence in Growth and Photosynthetic Performance
As expected, plants under drought showed reductions in both Ψpd and Ψmd, which became more pronounced as water deficit intensified. Genotypic differences in these parameters were negligible; moreover, there was no evidence of osmotic adjustment (as indicated by the invariance of Ψs(100) and Ψs(0) nor of elastic adjustment, since ε also remained constant across water regimes and genotypes [22,23]. Therefore, genotypic differences in drought tolerance regarding photosynthetic performance are unlikely to be attributable to plant water relations per se. Importantly, Ψmd consistently exceeded Ψs(0) by ≥ 0.2 MPa, indicating that leaves did not reach the turgor-loss point; accordingly, the deficits imposed qualify as mild at 50% FC and moderate at 30% FC. Both genotypes exhibited relatively low ε, implying that large changes in Ψw require substantial water loss and providing a hydraulic buffer that dampens the diurnal gradient between Ψpd and Ψmd [24]. These features likely explain (i) the modest absolute decreases in Ψpd and Ψmd across deficit levels and (ii) the relatively small separation between them. Overall, the observed divergence in photosynthetic performance between genotypes is more plausibly attributable to non-hydraulic controls, as detailed below.
Maintenance of water relation parameters such as ε, Ψs(100) and Ψs(0) suggest differences in growth ability should not be attributed to varying hydrostatic pressures and/or cell-wall elasticity properties between genotypes. In contrast, hydraulic capacitance revealed a genotype-specific adjustment: while C(100) remained unchanged, C(0) decreased by 50% in THC plants under drought relative to controls (Table 1). This reduction may indicate a diminished capacity to buffer declines in leaf Ψw once turgor is lost, potentially exacerbating desiccation stress in this genotype.
3.2. Contrasting Stomatal Versus Non-Stomatal Limitations Reveal Divergent Strategies of Photosynthetic Response to Drought
The initial reductions in A, observed under 50% FC, were primarily attributable to diffusional limitations at the stomatal level, regardless of genotype. This interpretation is supported by the strong correlation between A and gs, the decline in Ci (driven by a proportionally greater reduction in gs than in A), and the maintenance of both photochemical activity (stable ETR) and the intrinsic biochemical capacity for CO2 fixation (Vcmax unchanged). As the water deficit intensified (30% FC), however, the mechanisms limiting photosynthesis diverged between genotypes. In THC, reductions in A remained predominantly linked to stomatal closure. In contrast, in the CBD genotype, mesophyll and biochemical constraints appeared to account for most of the decreases in A. Although gs declined sharply and A remained correlated with gs, lower Vcmax values revealed additional biochemical limitations. Moreover, since gs is typically coregulated with gm [8,25], it is reasonable to hypothesize that reductions in gm also contributed to the decline in A, particularly in CBD. This inference is further supported by the observation that Ci values were similar between genotypes, yet A and Vcmax were markedly lower in CBD plants. Nevertheless, because gm was not directly measured here, this interpretation should be regarded as tentative, and future studies explicitly quantifying gm will be required to confirm its contribution to the observed photosynthetic impairment. This contrast points to distinct adaptive strategies: THC relies mainly on stomatal regulation, thereby preserving the functionality of the photosynthetic machinery, whereas CBD exhibits greater susceptibility to mesophyll and biochemical impairments. From an ecophysiological standpoint, such differences may have important field implications. Genotypes like THC, dominated by stomatal limitations, are expected to recover more rapidly following rehydration, which could be advantageous under episodic drought. By contrast, genotypes such as CBD, in which stress compromises mesophyll and biochemical processes, are likely to experience slower and incomplete recovery of photosynthesis, increasing the risk of productivity losses under prolonged drought [10].
3.3. Failure to Upregulate Photoprotective Pathways Enhances Photosynthesis Photoinhibition and Oxidative Stress During Water Deficit
ETR values, regardless of treatment, were fully sufficient to sustain the measured A rates [26], even in the face of drought-induced decreases in Chl concentration. Under drought, however, a marked increase in the ETR/A ratio was detected, particularly in CBD plants at 30% FC, where values were more than 200% higher than in THC counterparts. Such an imbalance indicates that the relative electron flux exceeded the capacity for carbon fixation, a condition often associated with electron over-reduction and increased excitation pressure on PSII [27]. In agreement, pronounced declines in qL were observed, reflecting reduced openness of PSII reaction centers and a perturbed balance between photochemical excitation and electron utilization in downstream metabolism [28]. This scenario points to enhanced oxidative pressure within chloroplasts, which may ultimately culminate in oxidative stress and photoinhibition [27]. Although part of the excess electron pressure may be alleviated through photorespiration (particularly in CBD plants) [29,30], the lower NPQ values indicate that thermal dissipation of excess energy via the xanthophyll cycle was insufficiently upregulated [31,32]. This interpretation is consistent with the observed decreases in carotenoid pools, further constraining the capacity for non-photochemical quenching. Consequently, plants exhibited clear signs of PSII photoinhibition, as indicated by drought-induced declines in Fv/Fm, suggesting that a fraction of the reaction centers became damaged or temporarily inactivated [33,34]. In support, F0 values rose markedly even after ≈2 h of dark acclimation. While such increases do not unequivocally confirm chronic photoinhibition, particularly in the absence of overnight dark adaptation, they nonetheless suggest a sustained excitation pressure on PSII and a potential exacerbation of ROS formation. Given that antioxidant enzyme activities were concurrently downregulated under drought, the detoxification of ROS was impaired. Interestingly, despite this general downregulation, CBD plants exhibited relatively higher SOD and CAT activities, along with greater pools of total phenolics, compared with THC. These adjustments, however, were insufficient to counterbalance the greater oxidative burden in CBD. Ultimately, the interplay between excitation pressure and antioxidant defenses converged toward a similar outcome in both genotypes, as reflected by comparable oxidative damage, evidenced by elevated (and similar) MDA levels, a marker for oxidative damage [1].
3.4. Genotypic Differences in Photosynthesis, Biomass Partitioning and Cannabinoid Yield Determine Agronomic and Energetic Returns Under Varying Water Availability
No significant reduction in whole-plant biomass was observed under drought, most likely because water deficit was imposed after the onset of flowering—a stage at which vegetative growth markedly declines or even ceases in annual species [35]. The greater total biomass of CBD plants, however, cannot be attributed to higher A per unit leaf area, differences in leaf area, leaf carbohydrate concentrations, or altered cell-wall elastic properties, as previously discussed. Rather, CBD plants invested disproportionately in stem growth, suggesting a tendency to allocate more carbon to structural tissues at the expense of reproductive organs, particularly under stress. In contrast, the stability of HI in THC plants indicates a greater capacity to maintain reproductive partitioning during drought, reflecting enhanced tolerance of both photosynthetic and assimilate allocation processes. Consistent with this, the sharp decrease in starch pools accompanied by a modest rise in sucrose concentration suggests the mobilization of stored carbohydrates to sustain assimilate export toward reproductive sinks, thereby promoting more efficient carbon use under water-limited conditions.
Under well-watered conditions, CBD and THC plants differed in inflorescence biomass but displayed similar HI. However, genotypic differences might emerge if HI were expressed on an energetic basis [36]. Because cannabinoids (CBD, THC, and CBG) are highly reduced terpenoid isomers (C₂₁H₃₀O₂) with low oxygen content, their combustion enthalpy (~38 MJ kg⁻¹) is comparable to that of lipids and more than twice that of carbohydrates or proteins [37]. Consequently, the markedly lower cannabinoid concentrations in CBD plants (≈40% of those in THC) directly translated into a lower energy density of their inflorescence biomass.
Water deficit imposed at early flowering reduced both CBD and THC concentrations, in agreement with previous studies [18,19], which have shown that drought stress can impair photosynthetic performance and, consequently, cannabinoid biosynthesis [16,38]. In the present study, the pronounced decline in A under drought sharply reduced both HI and total cannabinoid concentration in CBD plants. In THC plants, however, the more moderate decrease in A—coupled with greater carbohydrate mobilization—was insufficient to compromise inflorescence yield or HI, although energy content declined proportionally to the reduction in cannabinoid concentration. Importantly, the decrease in CBG concentration observed in the THC genotype under drought may reflect functional upregulation, or at least unaltered activity, of key biosynthetic enzymes in the cannabinoid pathway [18]. In any case, both genotypes experienced drought-induced decreases in cannabinoid accumulation, underscoring the sensitivity of secondary metabolism to water limitation. Yet, because THC plants consistently accumulated higher baseline levels of cannabinoids, their biomass retained substantially greater energetic value even under drought. In contrast, the combined effects of lower HI and reduced cannabinoid content in CBD plants resulted in biomass with comparatively lower agronomic and energetic returns. Taken together, these findings indicate that genotypic differences in carbon allocation and metabolic plasticity underlie the contrasting agronomic and energetic outcomes observed. The superior capacity of THC plants to maintain reproductive partitioning and preserve high-energy secondary metabolites under drought confers a dual advantage—greater resilience and higher energy yield per unit biomass.
4. Materials and Methods
4.1. Plant Material, Experimental Design, and Analytical Procedures
The experiment was carried out in Viçosa (20°45′14″S, 42°52′53″W; 650 m a.s.l.), southeastern Brazil. Two short-day–adapted cannabis genotypes (clones) were used, differing in growth habit and capacity to produce major cannabinoids: one accumulating predominantly THC with lower biomass (hereafter referred to as THC genotype) and the other accumulating CBD with greater biomass production (CBD genotype). After successful rooting in a controlled mist chamber, 32 uniform seedlings (16 per genotype) were transplanted into 10-L pots filled with a commercial substrate (Mecplant®). Plants were maintained in a greenhouse under naturally fluctuating temperature, relative humidity, and photosynthetic photon flux density (PPFD). To maintain vegetative growth, PPFD was initially supplemented for approximately 4 h per day with 50-W LED lamps, extending the photoperiod to about 16 h. Individuals were spaced 50 cm apart within rows and 75 cm between rows and were fertilized weekly with a commercial nutrient solution (DuGreen®) following the manufacturer’s recommendations.
When plants reached approximately 1-m tall (40 days after transplanting), the LED lamps were turned off to induce flowering, which occurred uniformly in each genotype. Until the onset of flowering, plants were irrigated to maintain substrate moisture close to FC. To this end, a water retention curve of the substrate was established [39] to determine both FC and the permanent wilting point, thereby enabling precise control of water application. After early flowering (46 days after transplanting), half of the plants of each genotype continued to be irrigated at FC, whereas the remaining plants were subjected to a stepwise reduction in water availability to 75, 50, 40, and 30% of FC, with each moisture level maintained for 5 d. During drought imposition, the soil surface of each pot was covered with plastic film to minimize evaporative water loss. Physiological measurements and sampling for subsequent biochemical analyses (see below) were performed in droughted plants on the fourth or fifth day after irrigation corresponding to 50 and 30% FC. Unless otherwise specified, measurements were taken on the youngest fully expanded leaves. The experiment lasted 75 days, at which point all plants were harvested for biomass analyses.
4.2. Leaf Water Potential and Pressure–Volume Curves
Leaf Ψw was determined at both predawn and midday using a Scholander-type pressure chamber (Model 1000; PMS Instrument Company, Albany, NY, USA). To prevent desiccation before measurement, leaves were excised and immediately sealed in zip-lock plastic bags containing a moistened paper towel. For pressure–volume curves, leaves were collected and sealed as described above. Samples were transferred to the laboratory (100 m away) and rehydrated to full turgor by immersing their petioles in water inside a humidity-saturated chamber for 12 h. Subsequently, leaf fresh mass (precision balance, 0.1 mg) and Ψw (Scholander chamber) were recorded periodically during a natural dehydration cycle until Ψw reached approximately –2.5 MPa. Leaves were then oven-dried at 60 °C until constant mass. Pressure–volume curves were constructed by plotting relative water content against the inverse of Ψw, following Tyree and Hammel [40]. From these curves, Ψs(100), Ψs(0), ε, C(100), and C(0) were determined, as described by Blackman and Brodribb [41].
4.3. Gas Exchange and Chlorophyll Fluorescence
Gas exchange (A, gs, E, and Ci) and Chl a fluorescence were measured simultaneously using a portable photosynthesis system (LI-6400XT; LI-COR, Lincoln, NE, USA) fitted with an integrated fluorescence chamber (LI-6400-40). Gas-exchange measurements were recorded at 09h00−11h00 (solar time) at a PPFD of 1000 µmol m⁻² s⁻¹, 28 °C, and an ambient CO₂ concentration of 430 µmol mol⁻¹, following DaMatta et al. [42].
Leaf samples were first dark-adapted for 2 h, after which they were exposed to a weak modulated measuring beam (0.03 μmol m⁻² s⁻¹) to determine F0. Maximum fluorescence (Fm) was then obtained by applying a saturating pulse of white light (8000 μmol photons m⁻² s⁻¹; 0.8 s). From these values, the maximum quantum efficiency of PSII photochemistry was calculated as Fv/Fm = (Fm − F0)/Fm. In light-acclimated tissues (1000 μmol m⁻² s⁻¹), steady-state fluorescence (Fs) was measured immediately before another saturating pulse (8000 μmol m⁻² s⁻¹, 0.8 s), which yielded the maximum fluorescence under light (Fm’). Following this, actinic illumination was switched off and a far-red beam (2 μmol m⁻² s⁻¹) was applied to obtain the minimal fluorescence in light-acclimated leaves (F0'). These parameters were then used to estimate several photosynthetic traits: the coefficient of photochemical quenching, qL = [(Fm’ − Fs)/( Fm' – F0')] × (F0’/Fs), the non-photochemical quenching, NPQ = ((Fm – Fm’)/Fm’, and the effective quantum yield of PSII, ΦPSII = (Fm’ – Fs)/Fm’ [28]. ETR was subsequently derived as ΦPSII*PPFD*f*α; where f represents the assumed 0.5 partitioning of excitation energy between PSI and PSII, and α corresponds to the leaf absorptance (set at 0.84) of photosynthetic tissues [43].
Nocturnal mitochondrial respiration (Rn) was measured 2 h after darkness and used to estimate respiration in the light (Rd) following Lloyd et al. [44]: Rd = (0.5 − 0.05 ln(PPFD)) × Rn. The rate of RuBisCO photorespiration (Rp) was then obtained according to Valentini et al. [45] using the equation Rp = 1/12 [ETR – 4(A + Rd)], and the Rp/AG ratio was calculated as described by DaMatta et al. [42]. Vcmax was estimated with the one-point method [46], using tobacco RuBisCO kinetics (Kc = 8.6 µM; Ko = 226 µM) [47] together with simultaneous morning A and ETR, when both parameters typically reach their maximum. Finally, Vcmax values were standardized to 25 °C following the temperature correction procedure proposed by Sharkey et al. [48].
4.4. Biochemical and Cannabinoid Analyses
Leaf samples collected at midday were rapidly frozen in liquid nitrogen and stored at –80 °C until biochemical analyses. Tissues were subsequently lyophilized at –48 °C and ground with metallic beads in a Mini Bead Beater disruptor. For primary metabolite quantification, 10 mg aliquots were extracted in methanol [49]. The soluble fraction was used to determine photosynthetic pigments [50], hexoses and sucrose [51], total amino acids [52], total phenolics [53], and proline [54]; the insoluble fraction was analyzed for total proteins [55] and starch [49,56].
MDA was quantified from 30 mg of lyophilized tissue extracted in aqueous 80% (v/v) ethanol. The extract was split into two tubes: one received 20% (w/v) trichloroacetic acid (TCA) only, and the other received 20% (w/v) TCA containing 0.65% (w/v) thiobarbituric acid. MDA, used as a proxy for lipid peroxidation, was determined in the soluble fraction following Hodges et al. [57], with the corrections proposed by Landi [58]. For antioxidant enzymes, 20 mg aliquots were extracted as in Peixoto et al. [59] to determine activities of SOD (EC 1.15.1.1) [60], CAT (EC 1.11.1.6) [61], and POX (EC 1.11.1.7) [62]. Protein content of enzymatic extracts was measured by the Bradford assay [55] using bovine serum albumin as the standard, and specific enzyme activities were expressed on a protein basis.
The major cannabinoids (CBD, THC, and CBG) were quantified using a portable Fourier-transform near-infrared (FT-NIR) spectrometer (Valenveras Portable Lab, NeoSpectra, Barcelona, Spain) operating across the 1,350–2,500 nm range. Analyses were performed on oven-dried, ground inflorescences, following validated protocols for NIR-based cannabinoid profiling [63,64]. According to the manufacturer, the prediction models achieved coefficients of determination (R2) > 0.90 and errors comparable to those of standard HPLC assays. Total cannabinoid concentration was computed as the sum of CBD, THC, and CBG.
4.5. Growth Traits
At the end of the experiment, aboveground tissues were separated into leaves, stems, and inflorescences, which were oven-dried at 70 °C for 72 h to determine their dry mass. Senesced leaves—typically remaining attached to the stems but detaching easily when handled—were collected and their mass added to the total leaf dry mass. Plant height and stem diameter were measured with a ruler and a digital caliper, respectively. Roots were excluded from the analysis due to the difficulty of separating them from the substrate and the inevitable losses during washing. For each plant, two representative leaves were scanned prior to drying to estimate specific leaf area (SLA). Total leaf area was then calculated by multiplying SLA by total leaf biomass. The HI was computed as the ratio of inflorescence biomass to total aboveground biomass, following standard procedures used for field-grown crops.
4.6. Experimental Design and Statistical Analysis
The study was conducted in a completely randomized factorial design with two genotypes and two water regimes. Each treatment included eight replicates, with individual pots treated as the experimental unit. Prior to analysis, data were checked for normality and variance homogeneity, and then subjected to ANOVA at P ≤ 0.05 using the R software.
5. Conclusions
In summary, the combined physiological, biochemical, and agronomic evidence demonstrates that drought responses in cannabis involve complex trade-offs between carbon assimilation, metabolite biosynthesis, and reproductive allocation, which differ markedly between genotypes.
Our results only partially supported the initial hypotheses. Although CBD plants were more vigorous, they did not sustain higher photosynthetic rates and, under drought, exhibited stronger mesophyll and biochemical impairments than THC plants, which relied primarily on stomatal regulation. Despite genotypic contrasts in photoprotective responses, both genotypes converged toward similar levels of oxidative damage, indicating that photoprotection was not decisive for their divergence. At the agronomic level, THC plants maintained a higher HI under drought, greater baseline cannabinoid concentrations, and higher energetic value. In contrast, the sharper decline in cannabinoids observed in CBD plants was largely attributable to reduced photosynthesis and less efficient carbohydrate use, whereas in THC plants the metabolic pathway itself was likely modified, as suggested by decreases in CBG pools. Overall, drought resilience in cannabis imposed at early flowering appears to depend less on hydraulic stability and more on safeguarding photosynthetic performance, sustaining secondary metabolism, and ensuring efficient biomass partitioning. These traits provide promising targets for breeding genotypes better adapted to water-limited environments.
Author Contributions
M.M. Pena: Writing – review & editing, Writing – original draft, Validation, Methodology, Investigation, Data curation, Conceptualization. F.R. Miranda: Writing – review & editing, Writing – original draft, Validation, Methodology, Investigation. T.O. Ribeiro: Methodology, Investigation. G.C.S. Couto: Methodology, Investigation. S.B.F. Rocha: Methodology, Investigation, Project administration, Funding acquisition. S.C.V. Martins: Writing – review & editing, Validation, Supervision. F.M. DaMatta: Writing – review & editing, Writing – original draft, Visualization, Supervision, Project administration, Funding acquisition, Conceptualization.
Funding
F.M.D. acknowledges research fellowships granted by the National Council for Scientific and Technological Development (CNPq, Brazil) and the Foundation for Research Assistance of the Minas Gerais State (FAPEMIG-Brazil) (Grant CRA - RED-00060-23). Scholarships were provided by CAPES (Finance Code 001).
Data Availability Statement
Data will be made available on request.
Conflicts of Interest
The authors declare no conflict of interest.
References
- Farooq, M.; Wahid, A.; Kobayashi, N.; Fujita, D.; Basra, S.M.A. Plant drought stress: Effects, mechanisms and management. Agron. Sustain. Dev. 2009, 29, 185–212. [Google Scholar] [CrossRef]
- Ali, S.; Mir, R.A.; Haque, M.A.; Danishuddin; Almalki, M. A.; Alfredan, M.; Khalifa, A.; Mahmoudi, H.; Shahid, M.; Tyagi, A.; Mir, Z.A. Exploring physiological and molecular dynamics of drought stress responses in plants: Challenges and future directions. Front. Plant Sci. 2025, 16, 1565635. [Google Scholar] [CrossRef] [PubMed]
- Mukarram, M.; Choudhary, S.; Kurjak, D.; Petek, A.; Khan, M.M.A. Drought: Sensing, signalling, effects and tolerance in higher plants. Physiol. Plant. 2021, 172, 1291–1300. [Google Scholar] [CrossRef] [PubMed]
- Shao, H.-B.; Chu, L.-Y.; Jaleel, C.A.; Zhao, C.-X. Water-deficit stress-induced anatomical changes in higher plants. C. R. Biol. 2008, 331, 215–225. [Google Scholar] [CrossRef]
- Chaves, M.M.; Flexas, J.; Pinheiro, C. Photosynthesis under drought and salt stress: Regulation mechanisms from whole plant to cell. Ann. Bot. 2009, 103, 551–560. [Google Scholar] [CrossRef]
- Dietz, K.J.; Zörb, C.; Geilfus, C.M. Drought and crop yield. Plant Biol. 2021, 23, 881–893. [Google Scholar] [CrossRef]
- Kramer, P.J.; Boyer, J.S. Water Relations of Plants and Soils; Academic Press: San Diego, CA, USA, 1995. [Google Scholar]
- Flexas, J.; Díaz-Espejo, A.; Conesa, M.A.; Coopman, R.E.; Douthe, C.; Gago, J.; et al. Mesophyll conductance to CO₂ and Rubisco as targets for improving intrinsic water use efficiency in C₃ plants. Plant Cell Environ. 2016, 39, 965–982. [Google Scholar] [CrossRef]
- Ilyas, M.; Nisar, M.; Khan, N.; Hazrat, A.; Khan, A.H.; Hayat, K.; Fahad, X.; Khan, A.; Ullah, A. Drought tolerance strategies in plants: A mechanistic approach. J. Plant Growth Regul. 2021, 40, 926–944. [Google Scholar] [CrossRef]
- Flexas, J.; Medrano, H. Drought-inhibition of photosynthesis in C₃ plants: Stomatal and non-stomatal limitations revisited. Ann. Bot. 2002, 89, 183–189. [Google Scholar] [CrossRef]
- Foyer, C.H.; Kunert, K. The ascorbate–glutathione cycle coming of age. J. Exp. Bot. 2024, 75, 2682–2699. [Google Scholar] [CrossRef]
- Wang, P.; Liu, W.-C.; Han, C.; Wang, S.; Bai, M.-Y.; Song, C.-P. Reactive oxygen species: Multidimensional regulators of plant adaptation to abiotic stress and development. J. Integr. Plant Biol. 2024, 66, 330–367. [Google Scholar] [CrossRef] [PubMed]
- Sharma, S.; Alberti, T.; Raposo, R.S.; Anterola, A.M.; Weber, J.; Diatta, A.A.; Leme Filho, J.F.C. The effects of water-deficit stress on Cannabis sativa L. development and production of secondary metabolites: A review. Horticulturae 2025, 11, 646. [Google Scholar] [CrossRef]
- Fetterman, P.S.; Keith, E.S.; Waller, C.W.; Guerrero, O.; Doorenbos, N.J.; Quimby, M.W. Mississippi-grown Cannabis sativa L.: Preliminary observation on chemical definition of phenotype and variations in tetrahydrocannabinol content versus age, sex, and plant part. J. Pharm. Sci. 1971, 60, 1246–1249. [Google Scholar] [CrossRef] [PubMed]
- Sheldon, K.; Shekoofa, A.; Walker, E.; Kelly, H. Physiological screening for drought-tolerance traits among hemp (Cannabis sativa L.) cultivars in controlled environments and in field. J. Crop Improv. 2021, 35, 816–831. [Google Scholar] [CrossRef]
- Gill, A.R.; Loveys, B.R.; Cowley, J.M.; Hall, T.; Cavagnaro, T.R.; Burton, R.A. Physiological and morphological responses of industrial hemp (Cannabis sativa L.) to water deficit. Ind. Crops Prod. 2022, 187, 115331. [Google Scholar] [CrossRef]
- Caplan, D.; Dixon, M.; Zheng, Y. Increasing inflorescence dry weight and cannabinoid content in medical cannabis using controlled drought stress. HortScience 2019, 54, 964–969. [Google Scholar] [CrossRef]
- Park, S.H.; Pauli, C.S.; Gostin, E.L.; Staples, S.K.; Seifried, D.; Kinney, C.; Vanden Heuvel, B.D. Effects of short-term environmental stresses on the onset of cannabinoid production in young immature flowers of industrial hemp (Cannabis sativa L.). J. Cannabis Res. 2022, 4, 1. [Google Scholar] [CrossRef]
- Morgan, W.; Singh, J.; Kesheimer, K.; Davis, J.; Sanz-Saez, A. Identifying physiological traits related with drought tolerance and water-use efficiency in floral hemp (Cannabis sativa L.). Crop Sci. 2024, 64, 354–372. [Google Scholar] [CrossRef]
- Cosentino, S.L.; Riggi, E.; Testa, G.; Scordia, D.; Copani, V. Evaluation of European developed fibre hemp genotypes (Cannabis sativa L.) in semi-arid Mediterranean environment. Ind. Crops Prod. 2013, 50, 312–324. [Google Scholar] [CrossRef]
- Gebrechorkos, S.H.; Sheffield, J.; Vicente-Serrano, S.M.; Funk, C.; Miralles, D.G.; Peng, J.; et al. Warming accelerates global drought severity. Nature 2025, 642, 628–635. [Google Scholar] [CrossRef]
- Bartlett, M.K.; Scoffoni, C.; Sack, L. The determinants of leaf turgor loss point and prediction of drought tolerance of species and biomes: A global meta-analysis. Ecol. Lett. 2012, 15, 393–405. [Google Scholar] [CrossRef]
- Blum, A. Osmotic adjustment is a prime drought stress adaptive engine in support of plant production. Plant Cell Environ. 2017, 40, 4–10. [Google Scholar] [CrossRef]
- Marshall, J.G.; Dumbroff, E.B. Turgor regulation via cell wall adjustment in white spruce. Plant Physiol. 1999, 119, 313–319. [Google Scholar] [CrossRef]
- Gago, J.; Daloso, D.M.; Carriquí, M.; Nadal, M.; Morales, M.; Araújo, W.L.; et al. The photosynthesis game is in the “interplay”: Mechanisms underlying CO₂ diffusion in leaves. Environ. Exp. Bot. 2020, 178, 104174. [Google Scholar] [CrossRef]
- Martins, S.C.V.; Galmés, J.; Molins, A.; DaMatta, F.M. Improving the estimation of mesophyll conductance to CO2: On the role of electron transport rate correction and respiration. J. Exp. Bot. 2013, 64, 3285–3298. [Google Scholar] [CrossRef] [PubMed]
- Marçal, D.M.; Avila, R.T.; Quiroga-Rojas, L.F.; de Souza, R.P.; Junior, C.C.G.; Ponte, L.R.; et al. Elevated [CO2] benefits coffee growth and photosynthetic performance regardless of light availability. Plant Physiol. Biochem. 2021, 158, 524–535. [Google Scholar] [CrossRef] [PubMed]
- Kramer, D.M.; Johnson, G.; Kiirats, O.; Edwards, G.E. New fluorescence parameters for the determination of QA redox state and excitation energy fluxes. Photosynth. Res. 2004, 79, 209–218. [Google Scholar] [CrossRef] [PubMed]
- Wingler, A.; Lea, P.J.; Quick, W.P.; Leegood, R.C. Photorespiration: Metabolic pathways and their role in stress protection. Philos. Trans. R. Soc. Lond. B Biol. Sci. 2000, 355, 1517–1529. [Google Scholar] [CrossRef]
- Villalobos-González, L.; Alarcón, N.; Bastías, R.; Pérez, C.; Sanz, R.; Peña-Neira, Á.; Pastenes, C. Photoprotection is achieved by photorespiration and modification of the leaf incident light, and their extent is modulated by the stomatal sensitivity to water deficit in grapevines. Plants 2022, 11, 1050. [Google Scholar] [CrossRef]
- Muller, P.; Li, X.P.; Niyogi, K.K. Non-photochemical quenching: A response to excess light energy. Plant Physiol. 2001, 125, 1558–1566. [Google Scholar] [CrossRef]
- Murchie, E.H.; Lawson, T. Chlorophyll fluorescence analysis: A guide to good practice and understanding some new applications. J. Exp. Bot. 2013, 64, 3983–3998. [Google Scholar] [CrossRef] [PubMed]
- Baker, N.R.; Rosenqvist, E. Applications of chlorophyll fluorescence can improve crop production strategies: An examination of future possibilities. J. Exp. Bot. 2004, 55, 1607–1621. [Google Scholar] [CrossRef] [PubMed]
- Zhuang, J.; Wang, Y.; Chi, Y.; Zhou, L.; Chen, J.; Zhou, W.; et al. Drought stress strengthens the link between chlorophyll fluorescence parameters and photosynthetic traits. PeerJ 2020, 8, e10046. [Google Scholar] [CrossRef] [PubMed]
- Araki, T. Transition from vegetative to reproductive phase. Curr. Opin. Plant Biol. 2001, 4, 63–68. [Google Scholar] [CrossRef]
- Sinha, S.K.; Bhargava, S.C.; Goel, A. Energy as the basis of harvest index. J. Agric. Sci. 1982, 99, 237–238. [Google Scholar] [CrossRef]
- Nelson, D.L.; Cox, M.M. Lehninger Principles of Biochemistry, 7th ed.; W.H. Freeman: New York, NY, USA, 2017. [Google Scholar]
- Qiao, M.; Hong, C.; Jiao, Y.; Hou, S.; Gao, H. Impacts of drought on photosynthesis in major food crops and the related mechanisms of plant responses to drought. Plants 2024, 13, 1808. [Google Scholar] [CrossRef]
- Cavatte, P.C.; Oliveira, A.A.; Morais, L.E.; Martins, S.C.; Sanglard, L.M.; DaMatta, F.M. Could shading reduce the negative impacts of drought on coffee? A morphophysiological analysis. Physiol. Plant. 2012, 144, 111–122. [Google Scholar] [CrossRef]
- Tyree, M.T.; Hammel, H.T. The measurement of the turgor pressure and the water relations of plants by the pressure-bomb technique. J. Exp. Bot. 1972, 23, 267–282. [Google Scholar] [CrossRef]
- Blackman, C.J.; Brodribb, T.J. Two measures of leaf capacitance: Insights into the water transport pathway and hydraulic conductance in leaves. Funct. Plant Biol. 2011, 38, 118–126. [Google Scholar] [CrossRef]
- DaMatta, F.M.; Godoy, A.G.; Menezes-Silva, P.E.; Martins, S.C.V.; Sanglard, L.M.V.P.; Morais, L.E.; et al. Sustained enhancement of photosynthesis in coffee trees grown under free-air CO₂ enrichment conditions: Disentangling the contributions of stomatal, mesophyll, and biochemical limitations. J. Exp. Bot. 2016, 67, 341–352. [Google Scholar] [CrossRef]
- Maxwell, K.; Johnson, G.N. Chlorophyll fluorescence—A practical guide. J. Exp. Bot. 2000, 51, 659–668. [Google Scholar] [CrossRef] [PubMed]
- Lloyd, J.; Grace, J.; Miranda, A.; Meir, P.; Wong, S.; Miranda, H.; et al. A simple calibrated model of Amazon rainforest productivity based on leaf biochemical properties. Plant Cell Environ. 1995, 18, 1129–1145. [Google Scholar] [CrossRef]
- Valentini, R.; Epron, D.; De Angelis, P.; Matteucci, G.; Dreyer, E. In situ estimation of net CO₂ assimilation, photosynthetic electron flow and photorespiration in Quercus cerris leaves: Diurnal cycles under different levels of water supply. Plant Cell Environ. 1995, 18, 631–640. [Google Scholar] [CrossRef]
- De Kauwe, M.G.; Lin, Y.S.; Wright, I.J.; Medlyn, B.E.; Crous, K.Y.; Ellsworth, D.S.; et al. A test of the “one-point method” for estimating maximum carboxylation capacity from field-measured, light-saturated photosynthesis. New Phytol. 2016, 210, 1130–1144. [Google Scholar] [CrossRef]
- von Caemmerer, S.; Evans, J.R.; Hudson, G.S.; Andrews, T.J.; Seemann, J.R. The kinetics of ribulose-1,5-bisphosphate carboxylase/oxygenase in vivo inferred from measurements of photosynthesis in leaves of transgenic tobacco. Planta 1994, 195, 88–97. [Google Scholar] [CrossRef]
- Sharkey, T.D.; Bernacchi, C.J.; Farquhar, G.D.; Singsaas, E.L. Fitting photosynthetic carbon dioxide response curves for C₃ leaves. Plant Cell Environ. 2007, 30, 1035–1040. [Google Scholar] [CrossRef]
- Lisec, J.; Schauer, N.; Kopka, J.; Willmitzer, L.; Fernie, A.R. Gas chromatography mass spectrometry–based metabolite profiling in plants. Nat. Protoc. 2006, 1, 387–396. [Google Scholar] [CrossRef]
- Bender-Machado, L.; Bauerlein, M.; Carrari, F.; Schauer, N.; Lytovchenko, A.; Gibon, Y.; et al. Expression of a yeast acetyl CoA hydrolase in the mitochondrion of tobacco plants inhibits growth and restricts photosynthesis. Plant Mol. Biol. 2004, 55, 645–662. [Google Scholar] [CrossRef]
- Fernie, A.R.; Roscher, A.; Ratcliffe, R.G.; Kruger, N.J. Fructose 2,6-bisphosphate activates pyrophosphate: Fructose 6 phosphate 1-phosphotransferase and increases triose phosphate to hexose phosphate cycling in heterotrophic cells. Planta 2001, 212, 250–263. [Google Scholar] [CrossRef]
- Yemm, E.W.; Cocking, E.C.; Ricketts, R.E. The determination of amino-acids with ninhydrin. Analyst 1955, 80, 209–214. [Google Scholar] [CrossRef]
- Bieleski, R.L.; Turner, N.A. Separation and estimation of amino acids in crude plant extracts by thin-layer electrophoresis and chromatography. Anal. Biochem. 1966, 17, 278–293. [Google Scholar] [CrossRef]
- Carillo, P.; Gibon, Y. Protocol: Extraction and determination of proline. PrometheusWiki 2011, 2011, 1–5. [Google Scholar]
- Bradford, M.M. A rapid and sensitive method for the quantitation of microgram quantities of protein utilizing the principle of protein-dye binding. Anal. Biochem. 1976, 72, 248–254. [Google Scholar] [CrossRef]
- Praxedes, S.C.; DaMatta, F.M.; Loureiro, M.E.; Maria, M.A.; Cordeiro, A.T. Effects of long-term soil drought on photosynthesis and carbohydrate metabolism in mature robusta coffee (Coffea canephora Pierre var. kouillou) leaves. Environ. Exp. Bot. 2006, 56, 263–273. [Google Scholar] [CrossRef]
- Hodges, D.M.; DeLong, J.M.; Forney, C.F.; Prange, R.K. Improving the thiobarbituric acid reactive substances assay for estimating lipid peroxidation in plant tissues containing anthocyanin and other interfering compounds. Planta 1999, 207, 604–611. [Google Scholar] [CrossRef]
- Landi, M. Commentary to: “Improving the thiobarbituric acid-reactive-substances assay for estimating lipid peroxidation in plant tissues containing anthocyanin and other interfering compounds” by Hodges et al., Planta (1999) 207, 604–611. Planta 2017, 245, 1067. [Google Scholar] [CrossRef]
- Peixoto, P.H.P.; Cambraia, J.; Sant’Anna, R.; Mosquim, P.R.; Moreira, M.A. Aluminum effects on lipid peroxidation and on the activities of enzymes of oxidative metabolism in sorghum. Rev. Bras. Fisiol. Veg. 1999, 11, 137–143. [Google Scholar]
- Giannopolitis, C.N.; Ries, S.K. Superoxide dismutases: I. Occurrence in higher plants. Plant Physiol. 1977, 59, 309–314. [Google Scholar] [CrossRef]
- Havir, E.A.; McHale, N.A. Biochemical and developmental characterization of multiple forms of catalase in tobacco leaves. Plant Physiol. 1987, 84, 450–455. [Google Scholar] [CrossRef]
- Kwak, S.S.; Lee, M.S.; Park, I.H.; Kim, I.J.; Liu, J.R. Enhancement of peroxidase activity by stress-related chemicals in sweet potato. Phytochemistry 1996, 43, 565–568. [Google Scholar] [CrossRef]
- Jarén, C.; Zambrana, P.C.; Pérez-Roncal, C.; López-Maestresalas, A.; Ábrego, A.; Arazuri, S. Potential of NIRS technology for the determination of cannabinoid content in industrial hemp (Cannabis sativa L.). Agronomy 2022, 12, 938. [Google Scholar] [CrossRef]
- Rafiq, H.; Hartung, J.; Schober, T.; Vogt, M.M.; Carrera, D.A.; Ruckle, M.; Graeff-Hönninger, S. Non-destructive near-infrared technology for efficient cannabinoid analysis in cannabis inflorescences. Plants 2024, 13, 833. [Google Scholar] [CrossRef]
Figure 1.
(A) Predawn water potential (Ψpd ) and (B) midday water potential (Ψmd ) in two cannabis genotypes grown under well-watered or drought conditions. For droughted plants, measurements were taken at 50% and 30% field capacity (FC). Values are means ± SE (n =8). Different letters indicate significant differences between genotypes within the same water regime; asterisks, when shown, indicate a drought effect within a genotype (Tukey’s test, P ≤ 0.05).
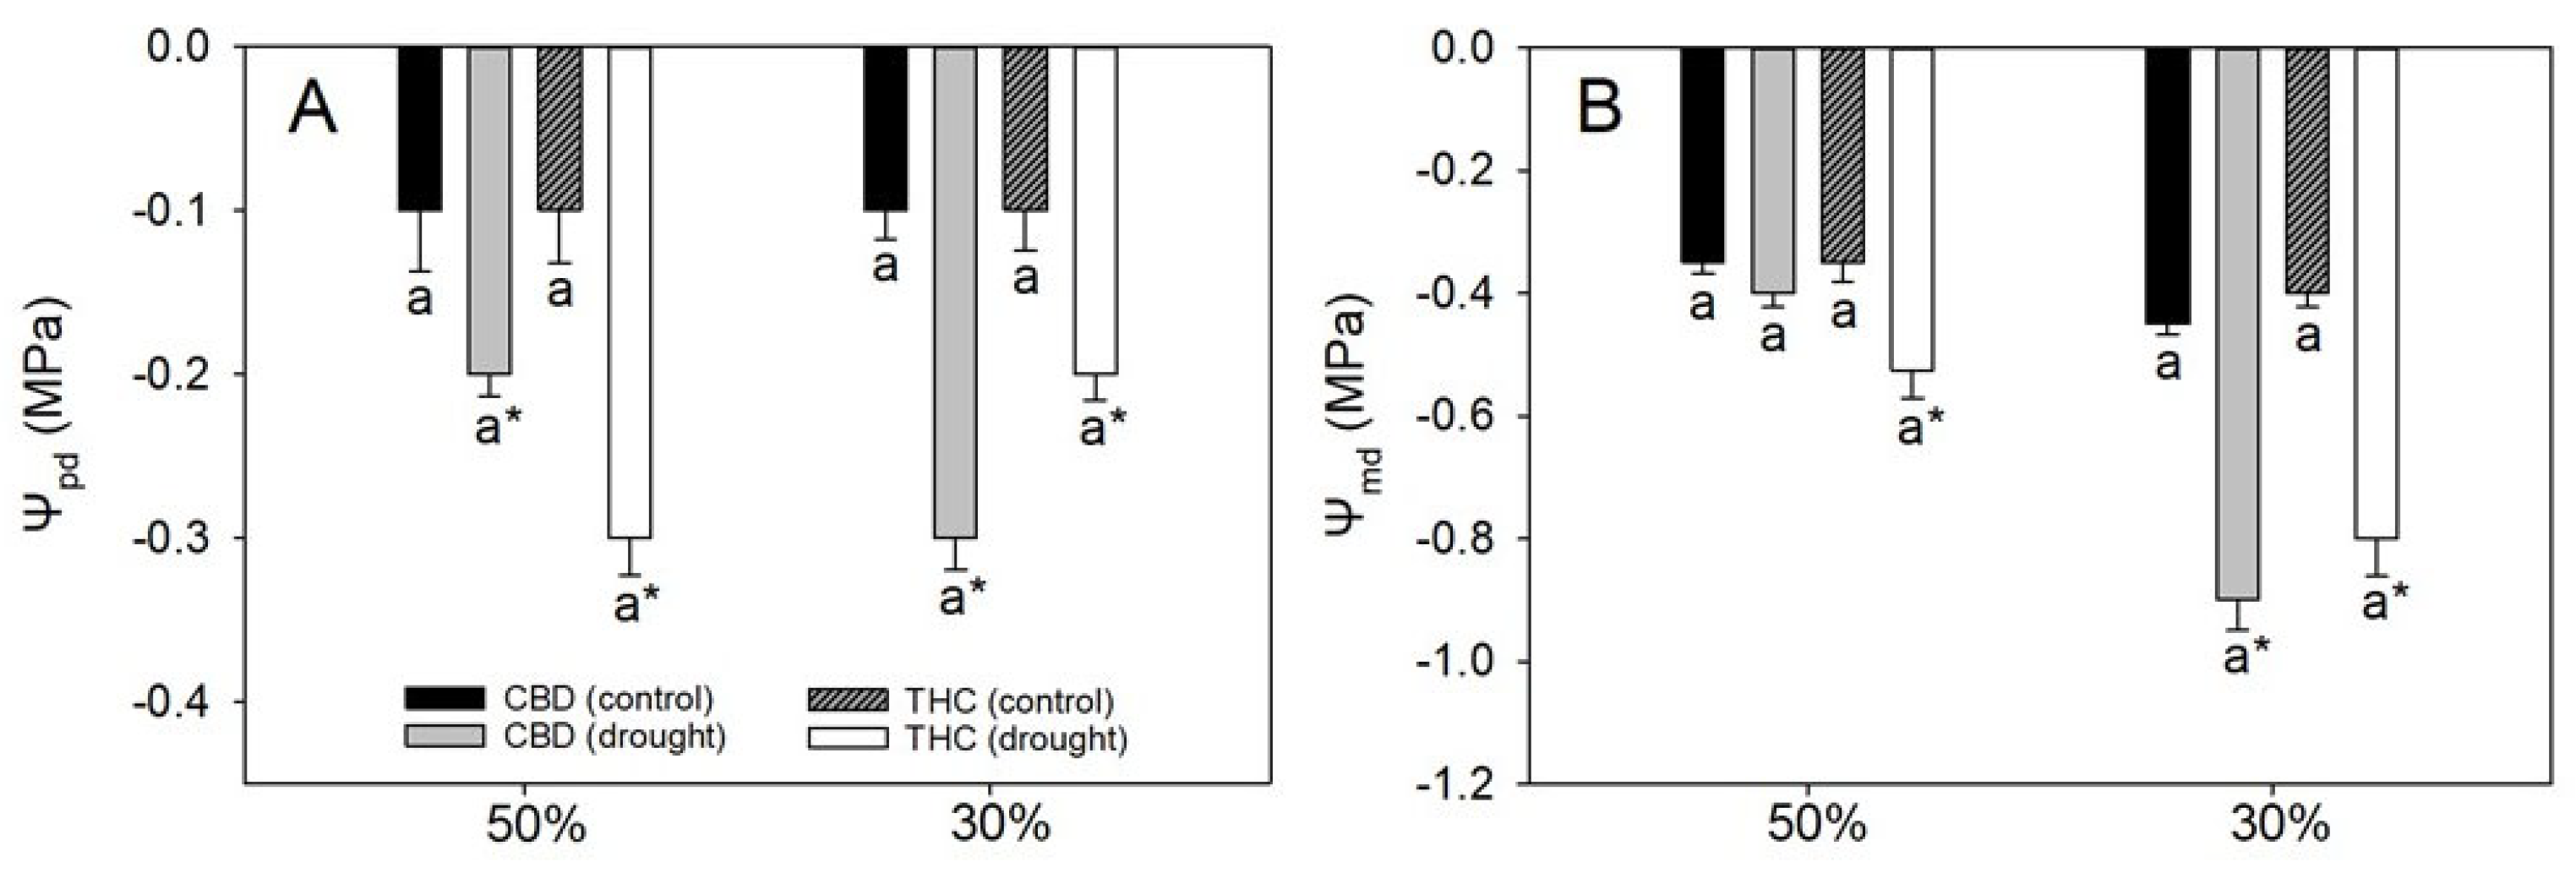
Figure 2.
(A) Net photosynthetic rate (A), (B) stomatal conductance (gs). (C) internal CO2 concentration (Ci), (D) transpiration rate (E), (E) electron transport rate (ETR), (F) maximum single-point carboxylation capacity based on chloroplastic CO2 concentration (Vcmax), (G) electron transport rate-to-photosynthesis ratio (ETR/A), and (H) photorespiration-to-gross photosynthesis ratio (RP/AG) in two cannabis genotypes grown under well-watered or drought conditions. For droughted plants, measurements were taken at 50% and 30% field capacity (FC). Values are means ± SE (n = 8). Different letters indicate significant differences between genotypes within the same water regime; asterisks, when shown, indicate a drought effect within a genotype (Tukey’s test, P ≤ 0.05).
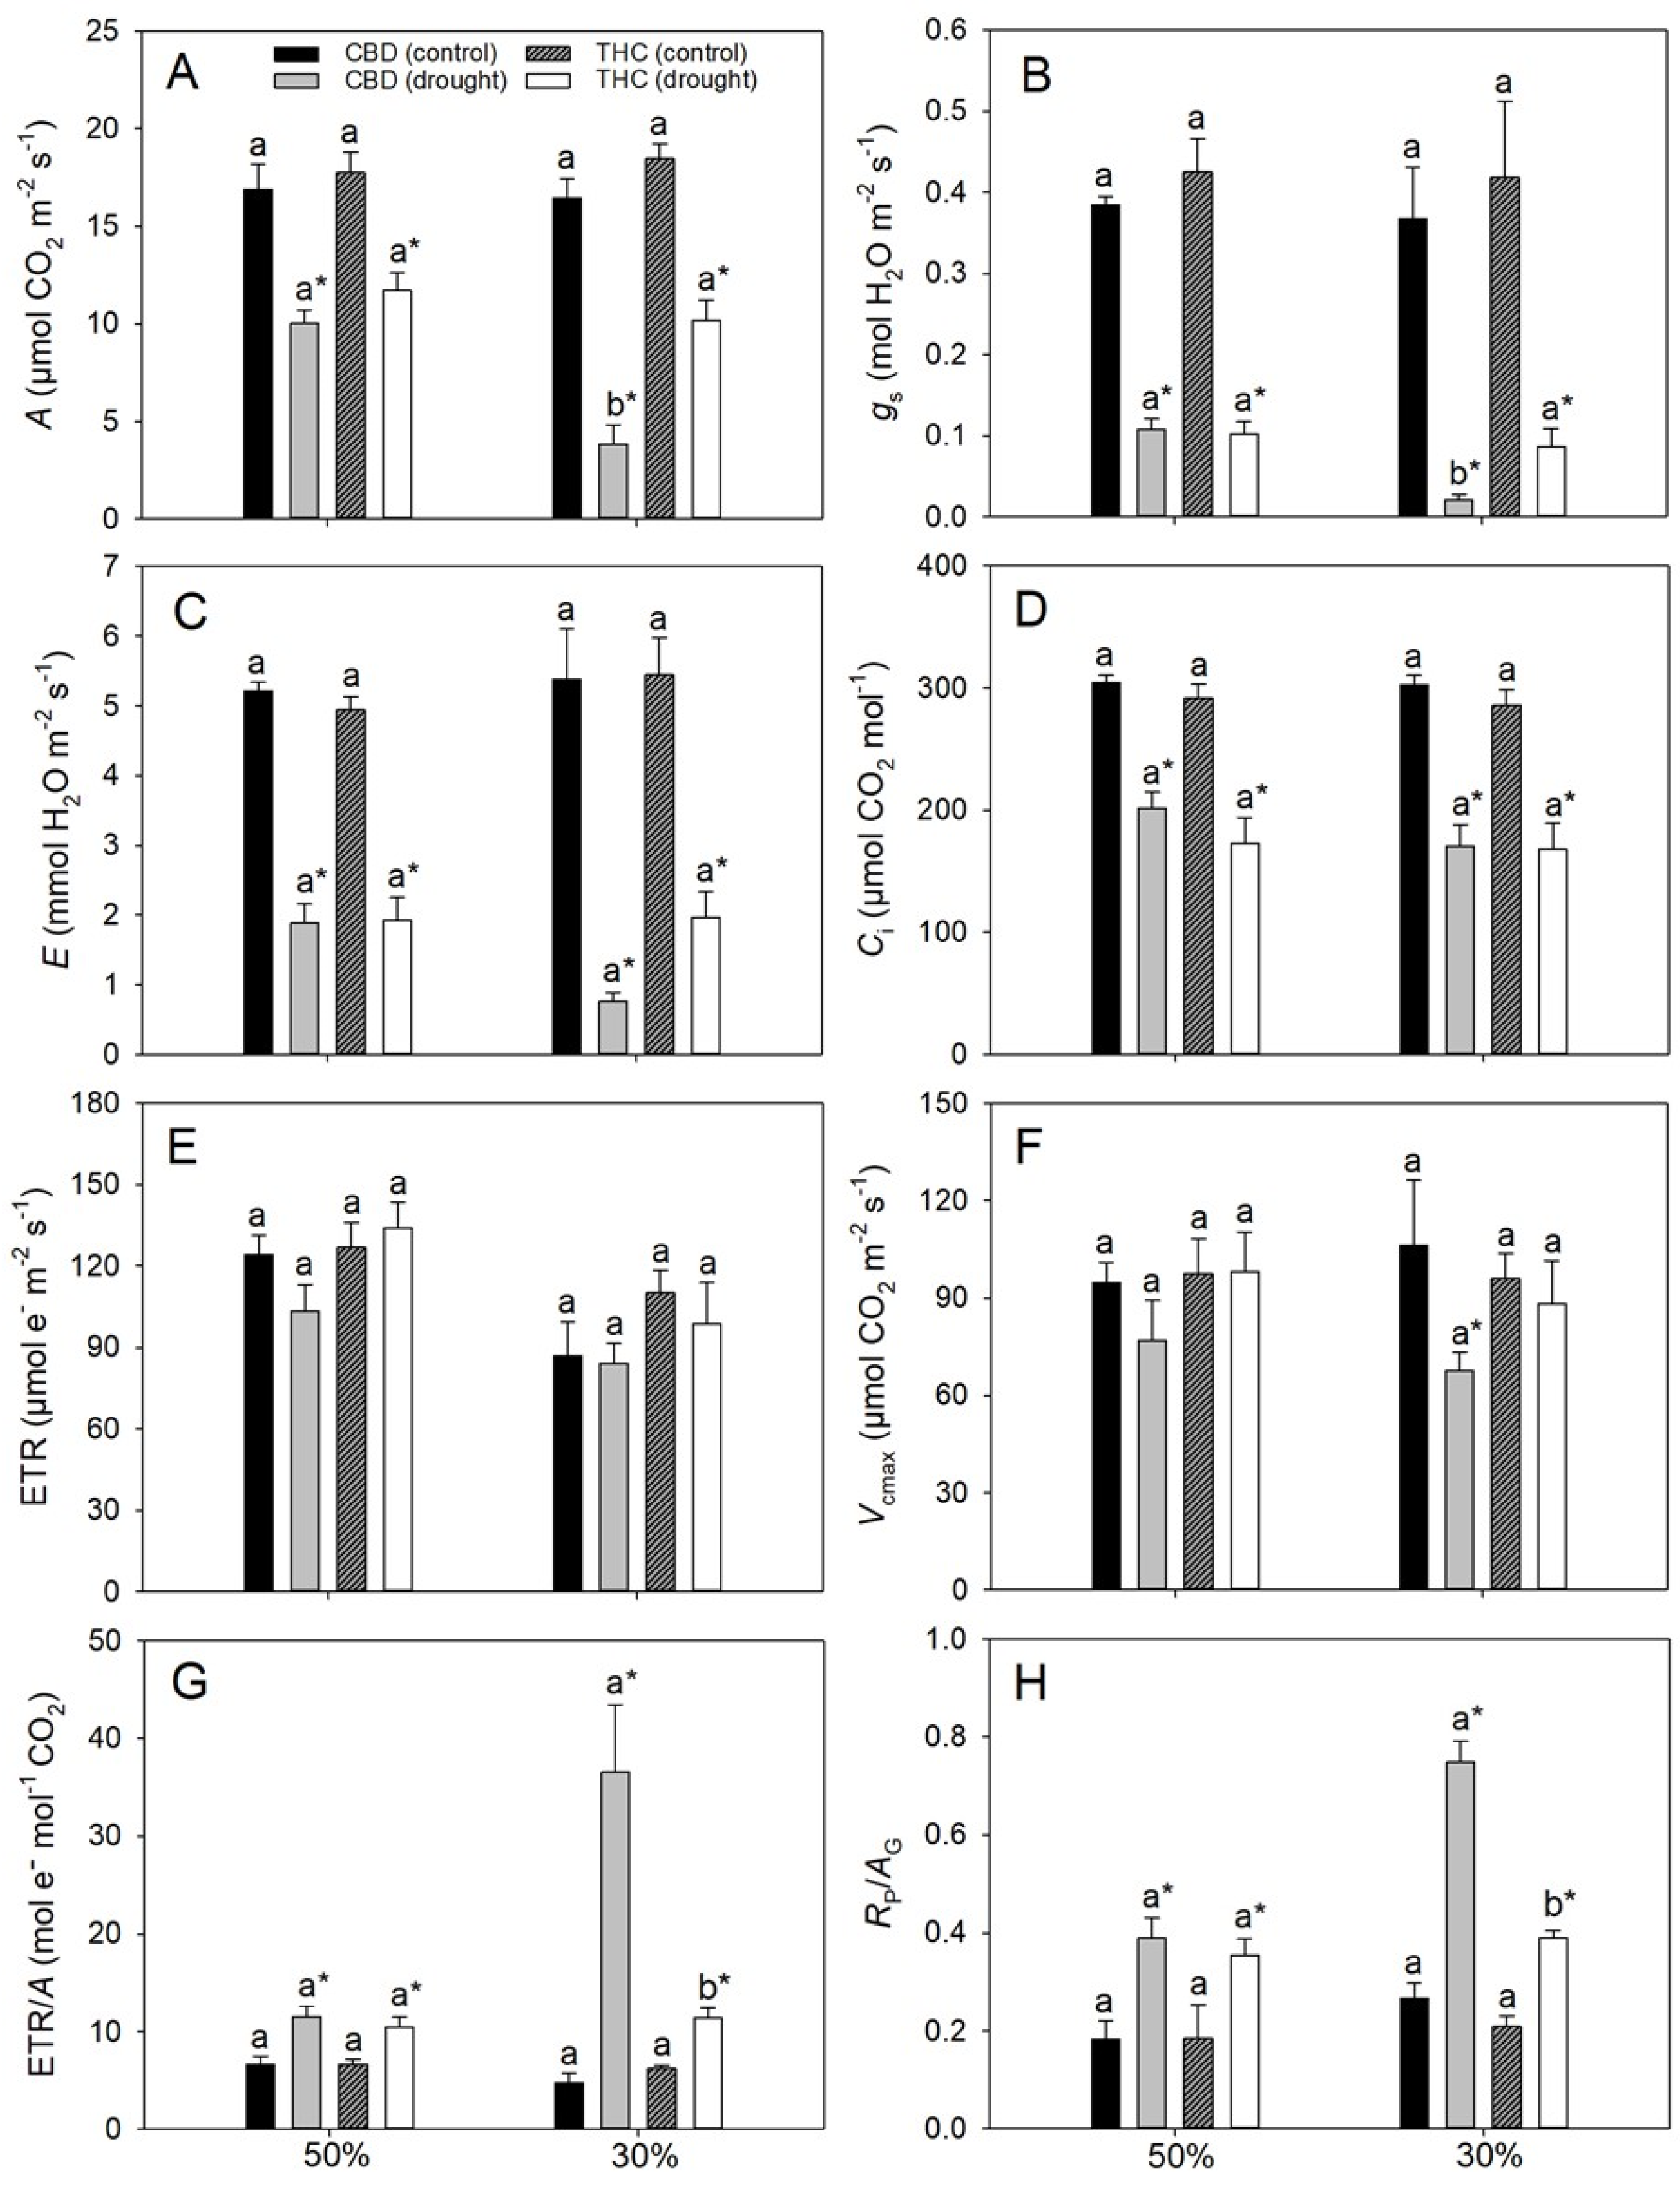
Figure 3.
Leaf concentrations (per dry mass) of cannabidiol (CBD), tetrahydrocannabinol (THC), cannabigerol (CBG) and total cannabinoids in two cannabis genotypes grown under well-watered or drought conditions. Values are means ± SE (n = 8). Different letters indicate significant differences between genotypes within the same water regime; asterisks, when shown, indicate a drought effect within a genotype (Tukey’s test, P ≤ 0.05).
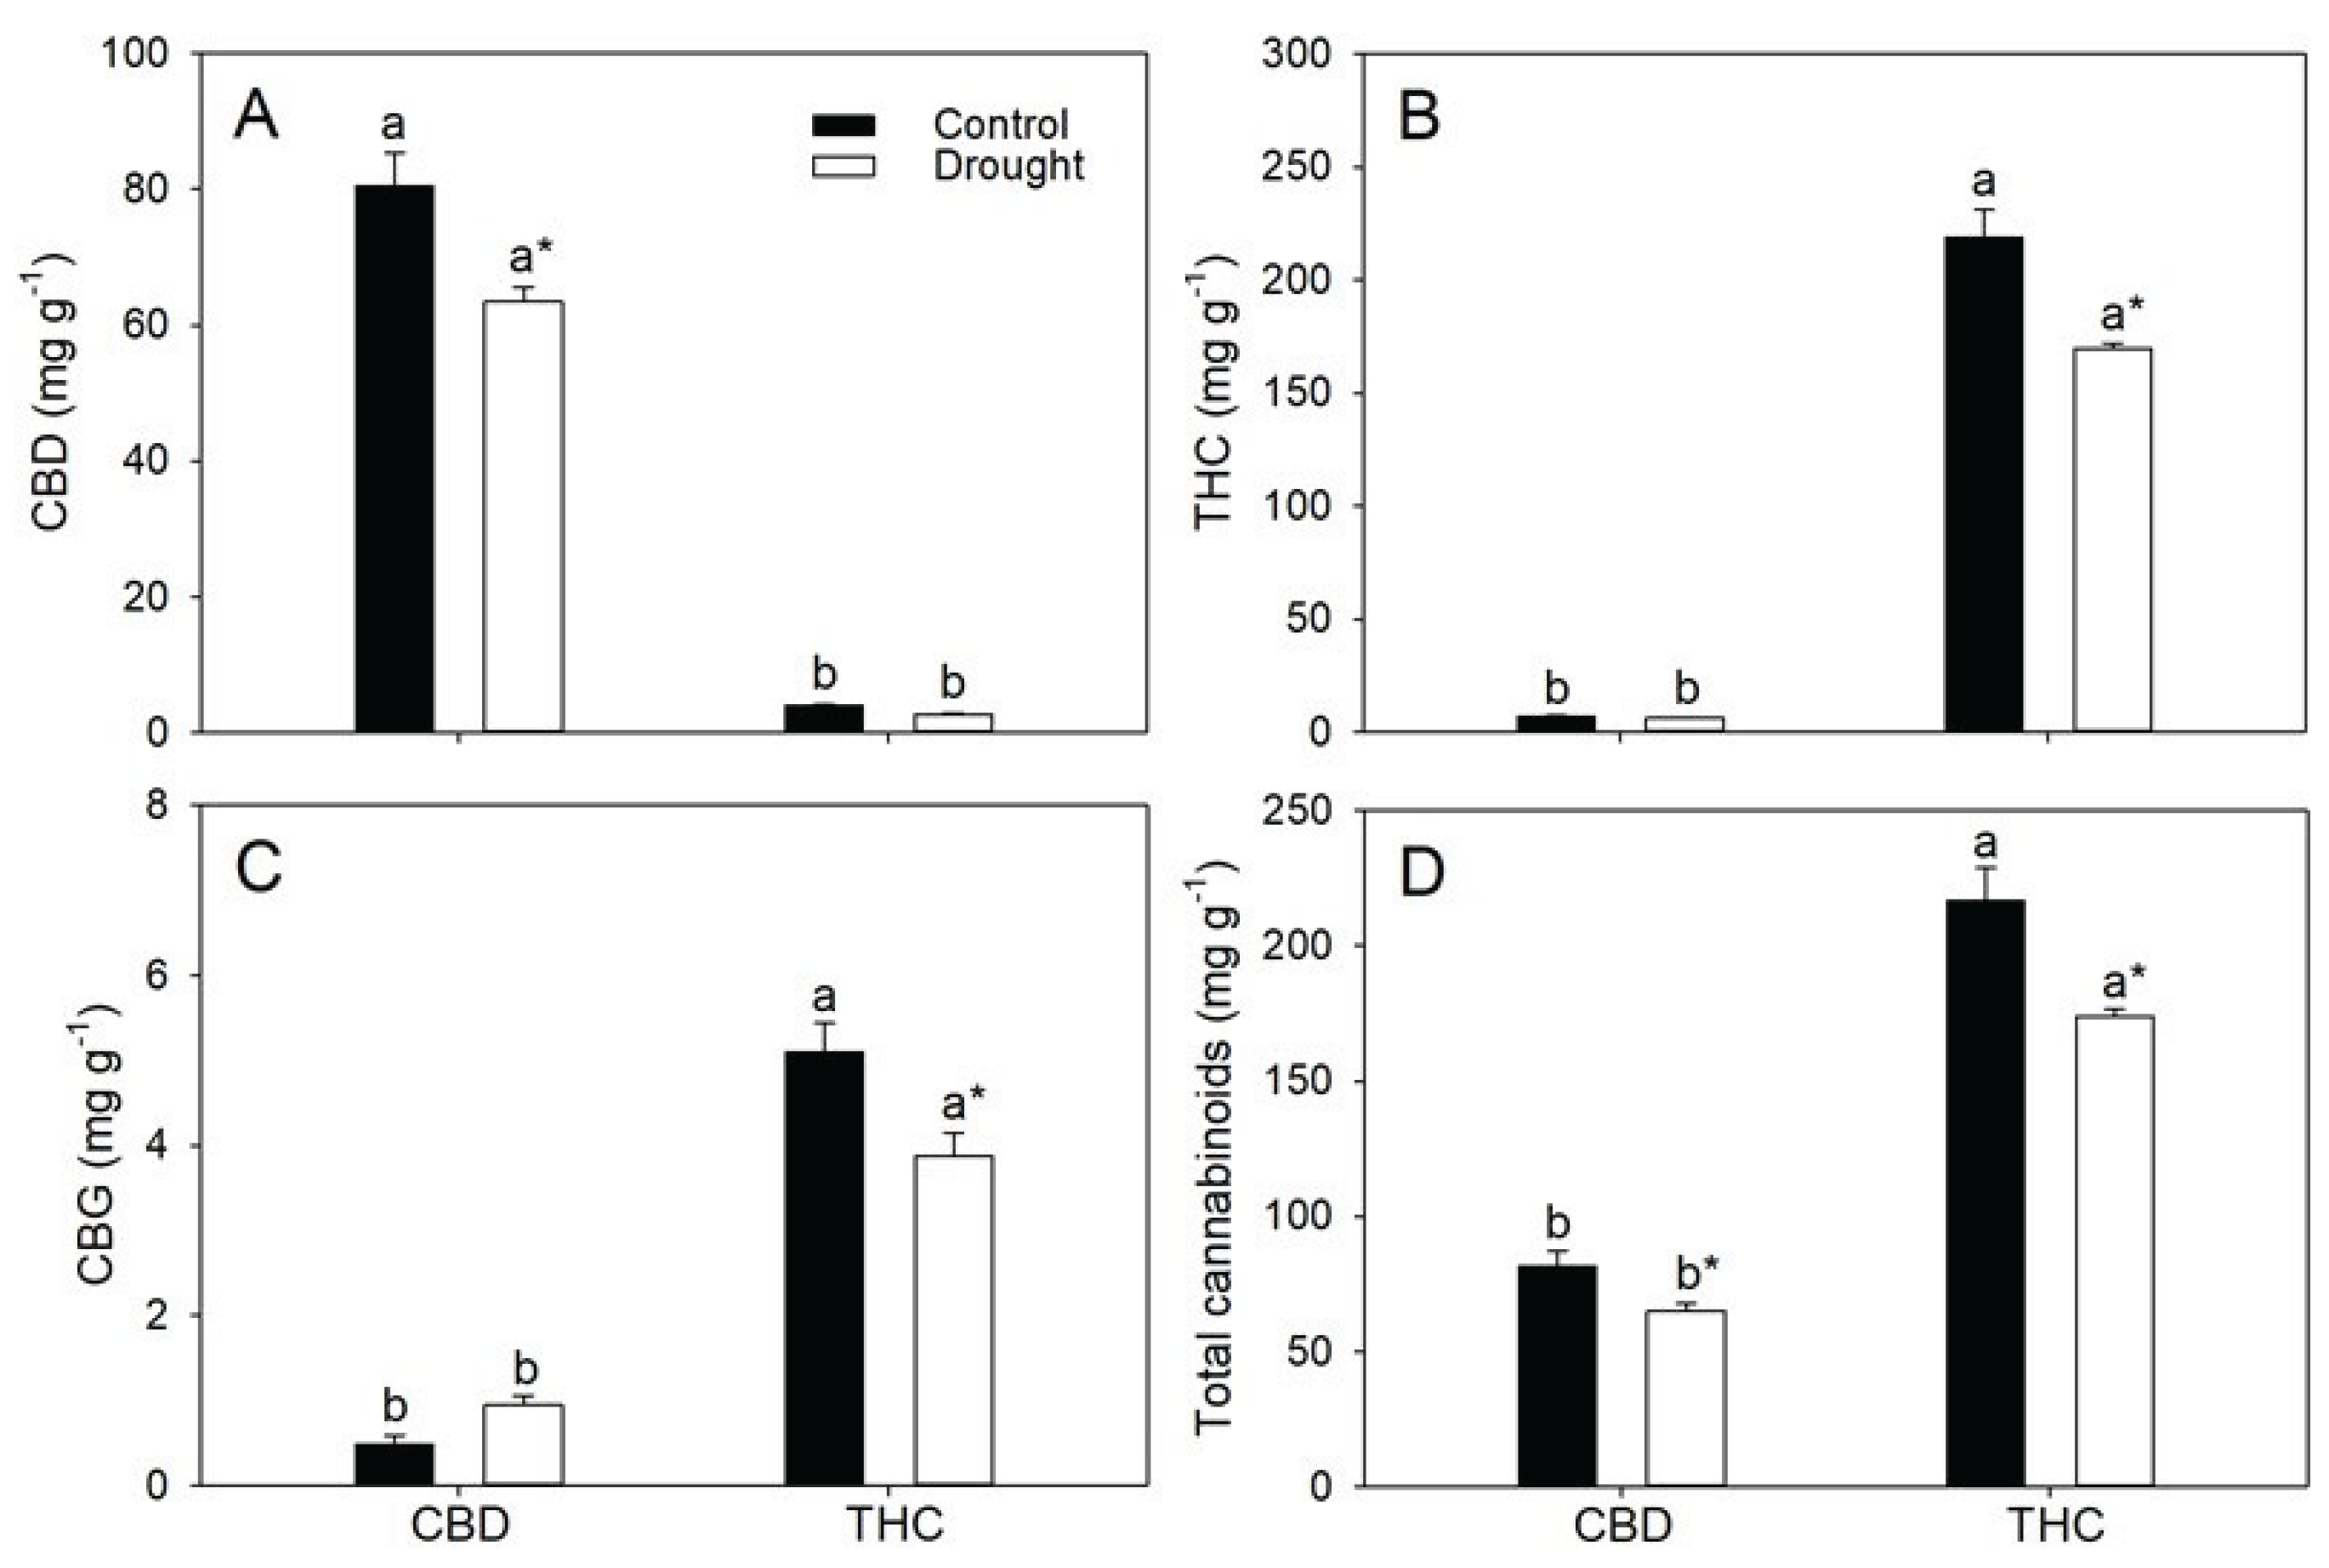
Figure 4.
Total biomass, stem biomass, leaf biomass, leaf area, inflorescence biomass, and harvest index (HI) in two Cannabis genotypes grown under well-watered or drought conditions. Values are means ± SE (n = 8). Different letters indicate significant differences between genotypes within the same water regime; asterisks, when shown, indicate a drought effect within a genotype (Tukey’s test, P ≤ 0.05).
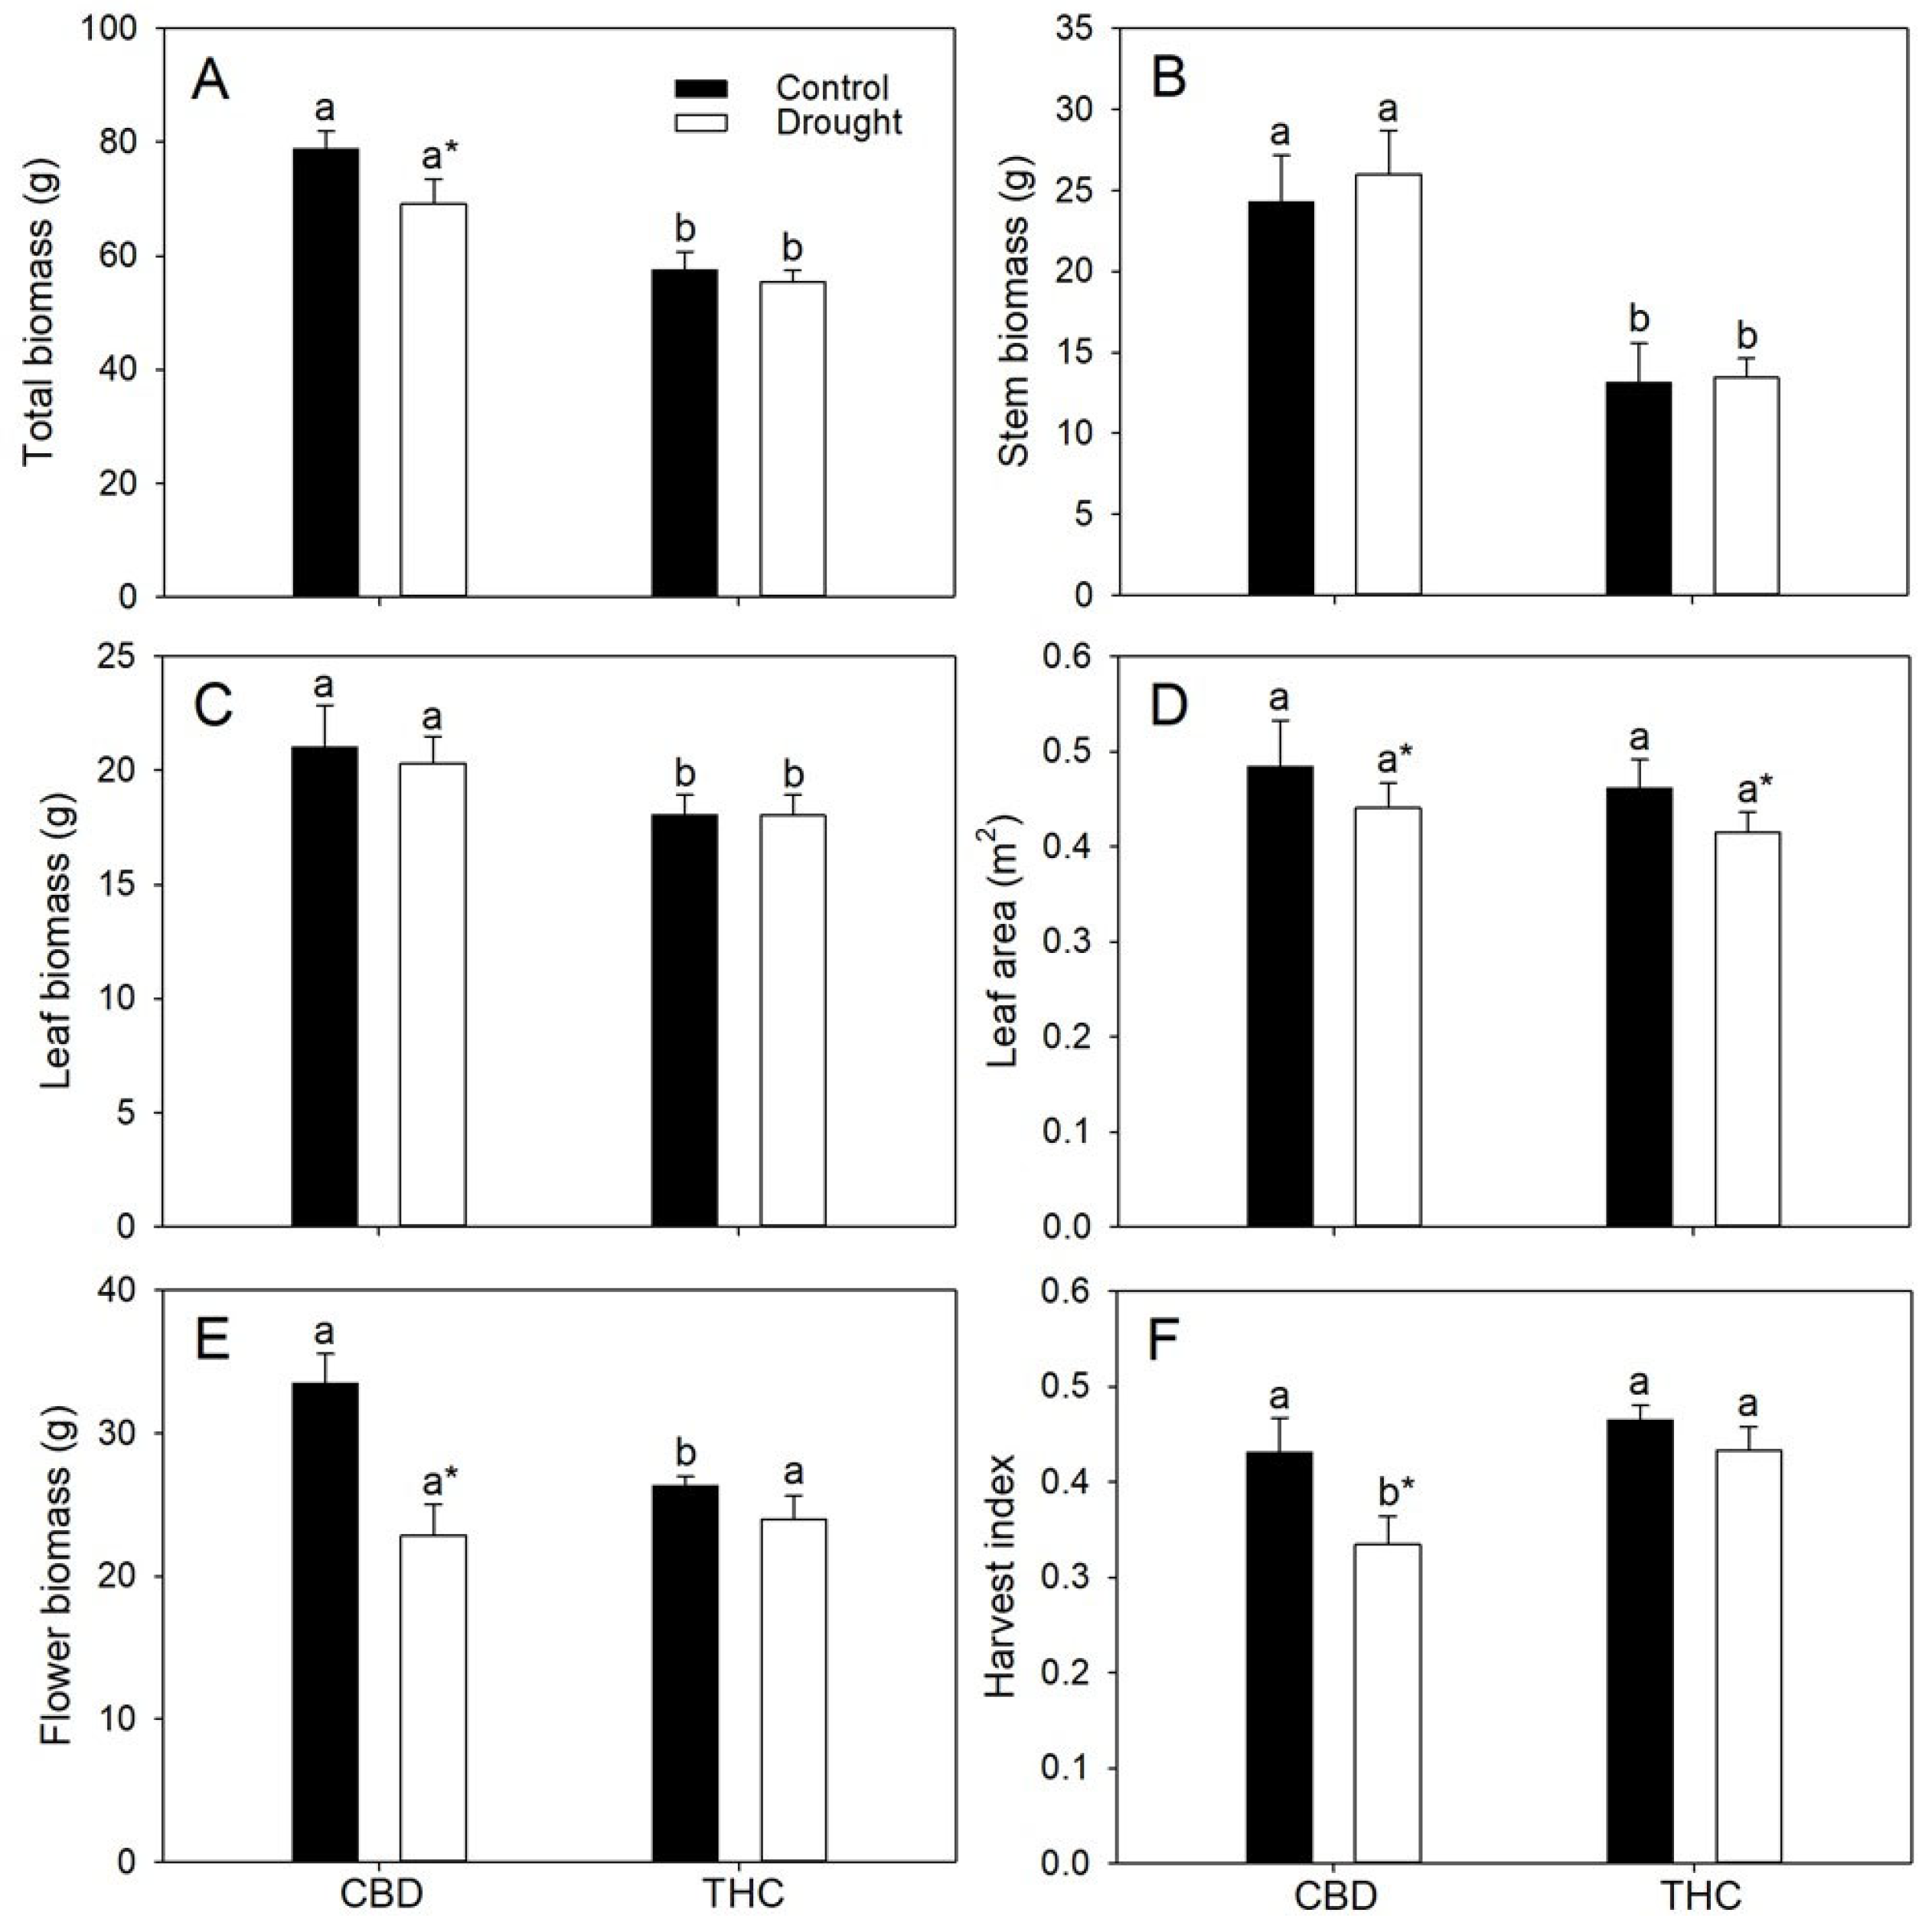

Table 1.
Parameters from pressure–volume curves: osmotic potential at full turgor (Ψs(100 )) and at the turgor loss point (Ψs(0)), bulk modulus of elasticity (Ɛ), and leaf capacitance at full turgor (C(100)) and at the turgor loss point (C(0)) in two cannabis genotypes grown under well-watered or drought conditions. Values are means ± SE (n = 8). Different letters indicate significant differences between genotypes within the same water regime; asterisks, when shown, indicate a drought effect within a genotype (Tukey’s test, P ≤ 0.05).
| Parameters | CBD | THC | ||
|---|---|---|---|---|
| Control | Drought | Control | Drought | |
| Ψs(100) (MPa) | -0.73 ± 0.12a | -0.62 ± 0.06a | -1.08 ± 0.17a | -0.69 ± 0.05a |
| Ψs(0) (MPa) | -1.23 ± 0.19a | -1.13 ± 0.08a | -1.50 ± 0.15a | -1.08 ± 0.06a |
| ε (MPa) | 5.77 ± 1.12a | 4.49 ± 0.48a | 6.75 ± 1.21a | 5.82 ± 0.62a |
| C(100) (mol m-2 MPa-1) | 0.09 ± 0.02a | 0.11 ± 0.01a | 0.09 ± 0.01a | 0.09 ± 0.01a |
| C(0) (mol m-2 MPa-1) | 0.11 ± 0.02b | 0.11 ± 0.01a | 0.22 ± 0.03a | 0.11 ± 0.02a* |
Table 2.
Maximum quantum efficiency of PSII photochemistry (Fv/Fm), minimum chlorophyll fluorescence (F0), coefficient of photochemical quenching (qL), and non- photochemical quenching (NPQ) in two cannabis genotypes grown under well-watered or drought conditions. Values are means ± SE (n = 8). Different letters indicate significant differences between genotypes within the same water regime; asterisks, when shown, indicate a drought effect within a genotype (Tukey’s test, P ≤ 0.05).
| Parameters | CBD | THC | ||
|---|---|---|---|---|
| Control | Drought | Control | Drought | |
| Fv/Fm | 0.81 ± 0.01a | 0.64 ± 0.01a* | 0.83 ± 0.01a | 0.68 ± 0.02a* |
| F0 | 626 ± 18a | 950 ± 72a* | 554 ± 19a | 922 ± 98a* |
| qL | 0.46 ± 0.02a | 0.19 ± 0.01a* | 0.44 ± 0.03a | 0.12 ± 0.07a* |
| NPQ | 0.96 ± 0.08b | 0.58 ± 0.07b* | 1.74 ± 0.28a | 1.15 ± 0.14a* |
Table 3.
Activities of superoxide dismutase (SOD), catalase (CAT) and peroxidases (POX), and malondialdehyde (MDA) concentration in two cannabis genotypes grown under well-watered or drought conditions. Values are means ± SE (n = 8). Different letters indicate significant differences between genotypes within the same water regime; asterisks, when shown, indicate a drought effect within a genotype (Tukey’s test, P ≤ 0.05).
| Parameters | CBD | THC | ||
|---|---|---|---|---|
| Control | Drought | Control | Drought | |
| SOD (U min-1 mg-1 protein) | 26.43 ± 1.9a | 16.73 ± 1.2a* | 19.85 ± 1.5a | 9.23 ± 0.6b* |
| CAT (µmol H2O2 min-1 mg-1 protein) | 17.5 ± 1.3a | 14.1 ± 0.9a* | 12.4 ± 0.7a | 8.7 ± 0.5a* |
| POX (µmol purpurogalin min-1 mg-1 protein) | 0.10 ± 0.01a | 0.03 ± 0.01a* | 0.04 ± 0.01b | 0.03 ± 0.01a |
| MDA (µmol g-1 DW) | 0.95 ± 0.09a | 1.24 ± 0.06a* | 1.16 ± 0.05a | 1.50 ± 0.09a* |
Table 4.
Leaf concentrations (per dry mass) of chlorophylls, carotenoids, free amino acids, glucose, fructose, sucrose, starch, phenols and in two cannabis genotypes grown under well-watered or drought conditions. Values are means ± SE (n = 8). Different letters indicate significant differences between genotypes within the same water regime; asterisks, when shown, indicate a drought effect within a genotype (Tukey’s test, P ≤ 0.05).
| Parameters | CBD | THC | ||
|---|---|---|---|---|
| Control | Drought | Control | Drought | |
| Chlorophylls a+b (μg g-1) | 2807 ± 133a | 1759 ± 131b* | 2813 ± 35a | 2320 ± 77a* |
| Carotenoids (μg g-1) | 735 ± 20a | 437 ± 33a* | 715 ± 9a | 522 ± 22a* |
| Glucose (μmol g-1) | 87 ± 10a | 55 ± 3a* | 84 ± 6a | 55 ± 4a* |
| Fructose (μmol g-1) | 30 ± 3a | 24 ± 3a* | 38 ± 5a | 29 ± 2a* |
| Sucrose (μmol g-1) | 93 ± 7b | 73 ± 3b* | 107 ± 2a | 82 ± 2a* |
| Starch (mmol equiv. glucose g-1) | 0.90 ± 0.09a | 0.73 ± 0.06a* | 0.60 ± 0.07b | 0.42 ± 0.07b* |
| Amino acids (μmol g-1) | 43 ± 2a | 30 ± 2a* | 44 ± 1a | 32 ± 2a* |
| Phenolics (mg g-1) | 113 ± 3a | 102 ± 6a | 89 ± 2b | 91 ± 4b |
| Proline (μmol g-1) | 9.81 ± 0.5a | 8.69 ± 0.5a | 10.05 ± 1.0a | 7.72 ± 0.5a* |
Disclaimer/Publisher’s Note: The statements, opinions and data contained in all publications are solely those of the individual author(s) and contributor(s) and not of MDPI and/or the editor(s). MDPI and/or the editor(s) disclaim responsibility for any injury to people or property resulting from any ideas, methods, instructions or products referred to in the content. |
© 2025 by the authors. Licensee MDPI, Basel, Switzerland. This article is an open access article distributed under the terms and conditions of the Creative Commons Attribution (CC BY) license (http://creativecommons.org/licenses/by/4.0/).
Copyright: This open access article is published under a Creative Commons CC BY 4.0 license, which permit the free download, distribution, and reuse, provided that the author and preprint are cited in any reuse.


