Introduction
The use of comprehensive genomic profiling (CGP) has become widespread, allowing personalized medical care based on gene profiles in cases of unresectable or recurrent cancers. Malignant pancreatic tumors such as pancreatic ductal adenocarcinoma (PDAC), acinar cell carcinoma, and neuroendocrine carcinoma were included in these profiles. However, the early detection of PDAC, which accounts for a large proportion of cancer cases, is challenging and its prognosis remains poor.
CGP is based on the genome profile from next-generation sequencing (NGS), which requires sufficient specimens; however, only approximately 15–20% of PDAC cases are resectable at the time of diagnosis [
1], whereas few cases have surgical specimens available for NGS. Additionally, a short period between tissue collection and genome testing is preferable because the specimens must be of high quality. Therefore, tissue sampling for CGP using endoscopic ultrasound-guided fine-needle biopsy (EUS-FNB) has become increasingly important.
In tissue sampling under EUS-FNB, specimen quality is affected by tumor puncture area. Malignant pancreatic neoplasms often exhibit central necrosis, and it is difficult to distinguish FNB-derived specimens from necrotic areas owing to the limited number of nucleated cells. Similarly, necrosis degree may affect DNA yield and quality, and the FNB sampling of necrotic areas for CGP is considered unsuitable.
Perflubutane (Sonazoid), an ultrasound contrast agent, consists of microbubbles containing perflubutane gas as the active ingredient and is stabilized using hydrogenated egg yolk sodium phosphatidylserine. These microbubbles are efficiently reflected on ultrasonography, enabling the evaluation of blood flow within the tissues [
2]. Because it is not absorbed by necrotic tissue, perflubutane enables the assessment of necrosis. It is widely used in contrast-enhanced ultrasound examinations of liver masses [
3] and was recently reported as an effective contrast agent for observing pancreatic masses, including the presence or absence of necrosis, using EUS [
4].
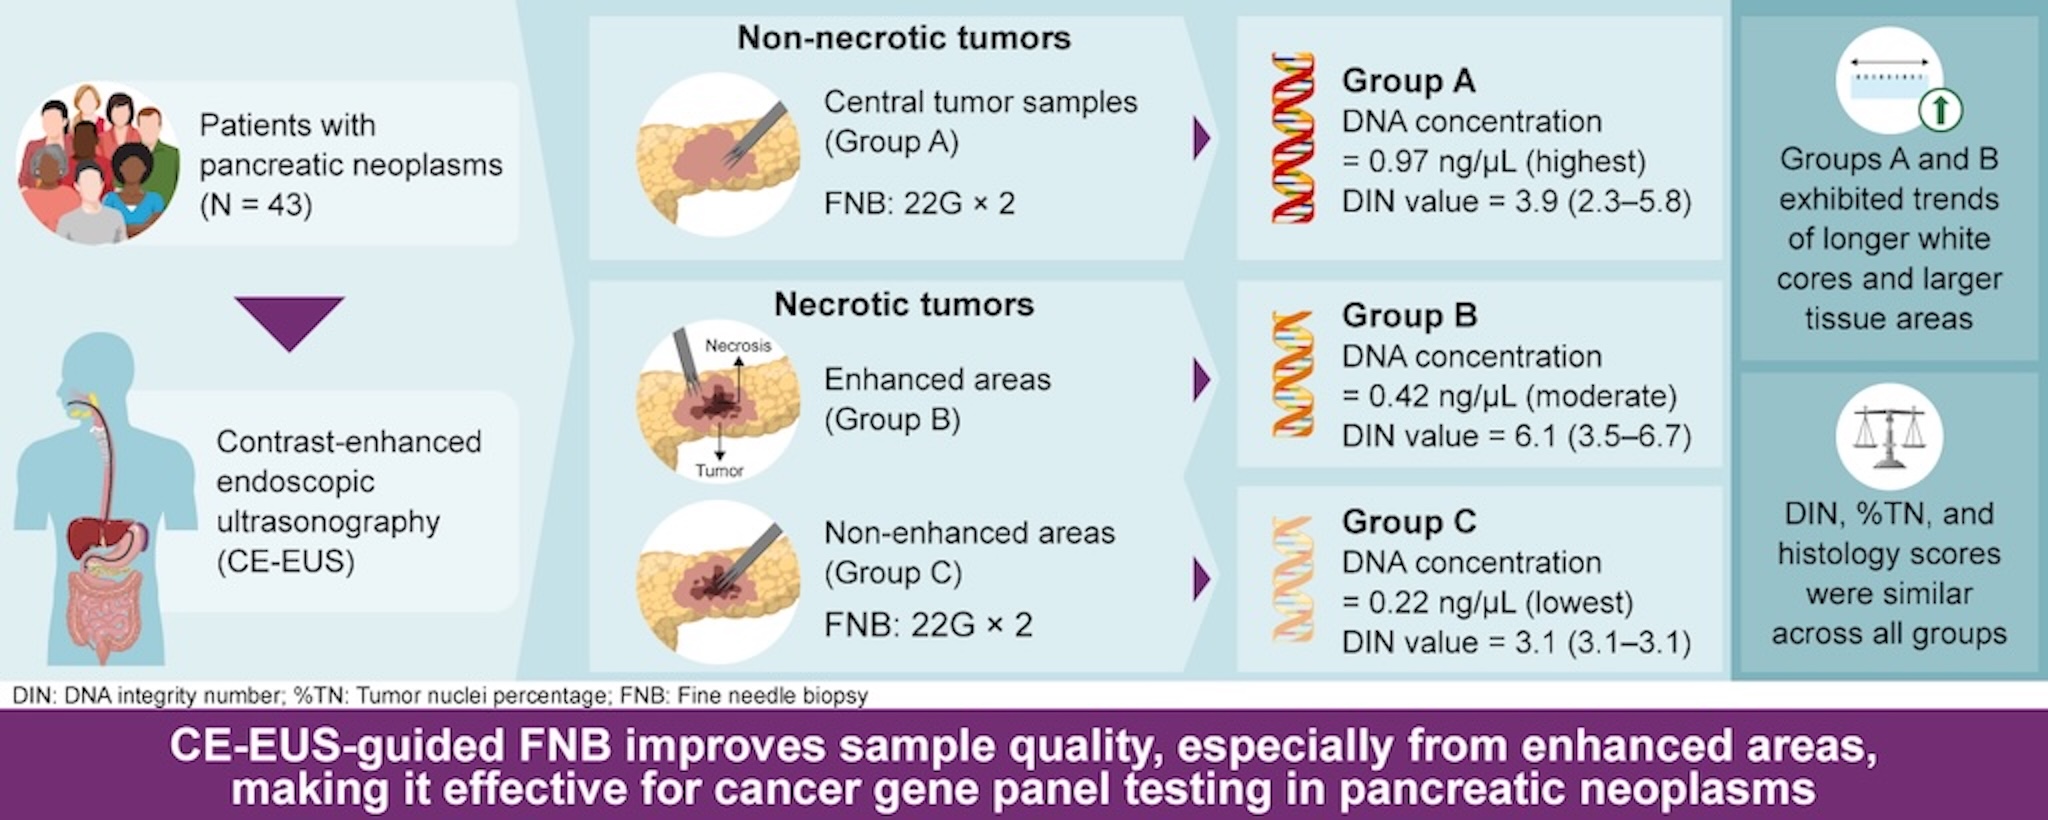
This clinical study compared the adequacy of tissue collection from non-necrotic versus necrotic areas to evaluate the efficacy of tissue sampling from pancreatic neoplasms using CE-EUS- FNB for CGP.
Materials and Methods
Study Design
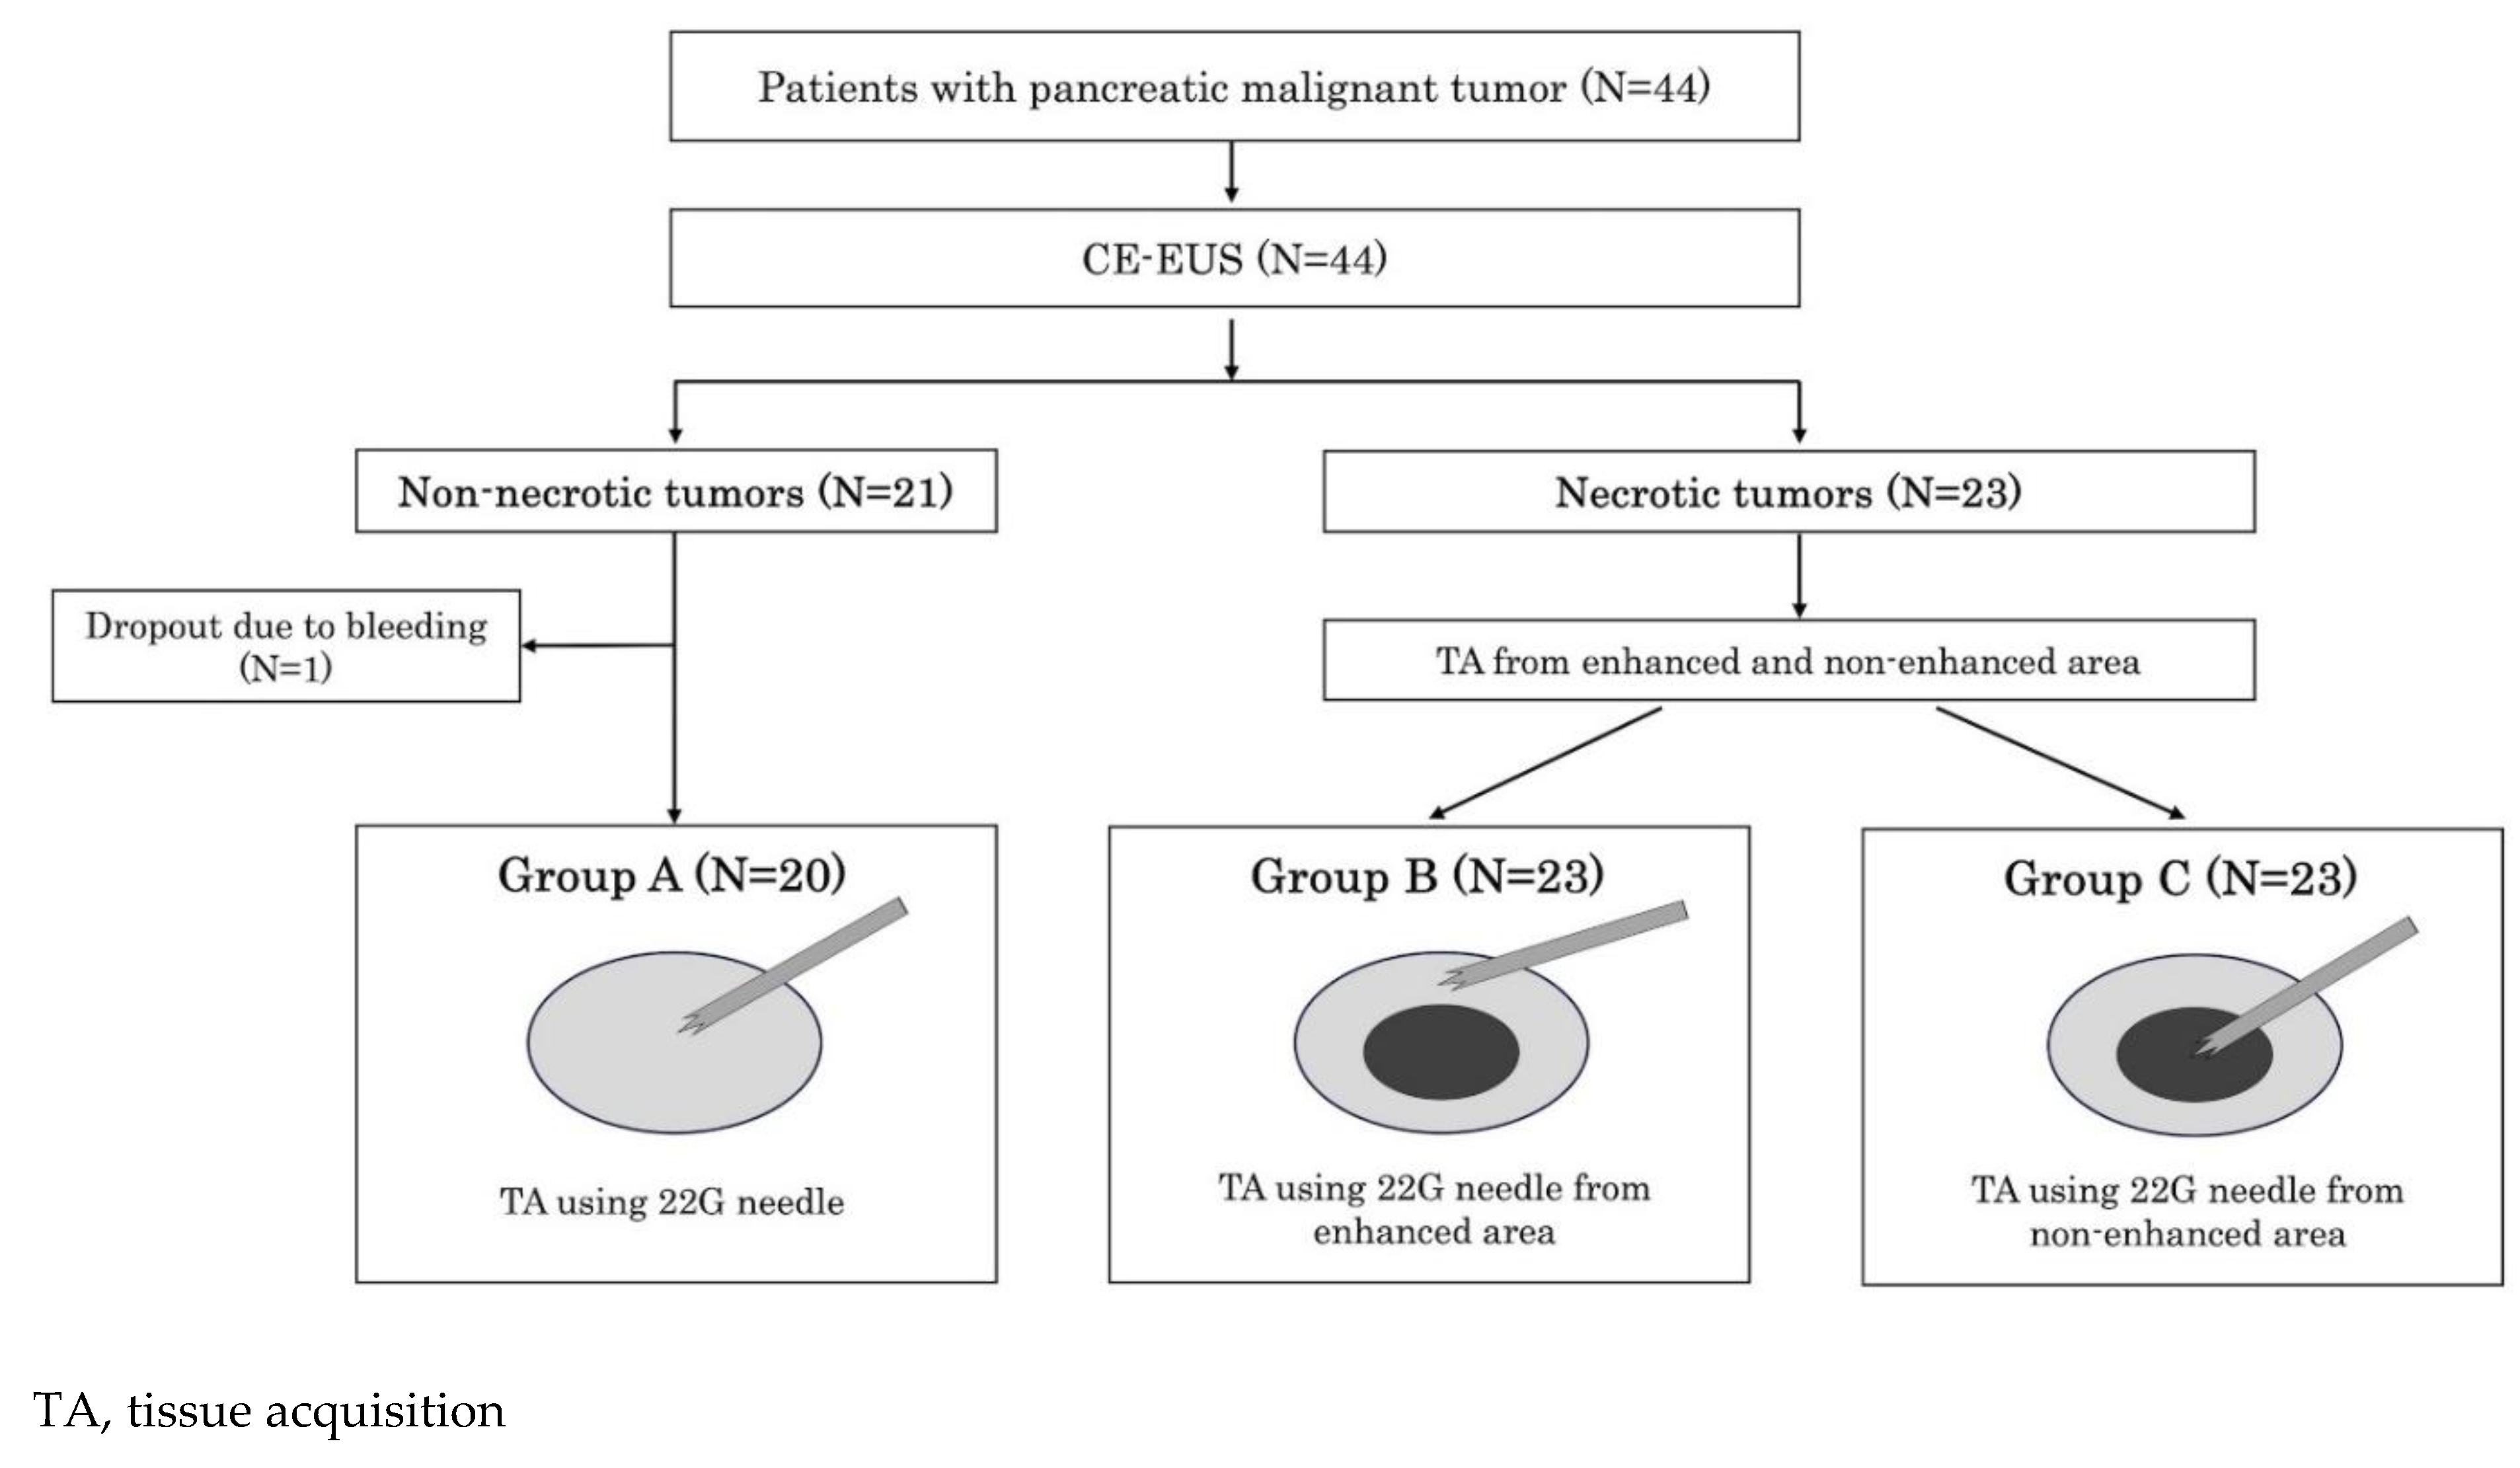
This study was conducted at Okayama University Hospital between November 2021 and March 2024. This is single-center, single-blind, non-randomized prospective study to compare the quality of FNB specimens obtained from non-necrotic and necrotic areas of pancreatic lesions for CGP. The presence or absence of central necrosis within the tumors was evaluated using CE-EUS. Tissue samples from non-necrotic tumors were classified as group A. For tumors with central necrosis, samples from the contrast-enhanced peripheral region reflecting non-necrotic areas were designated as group B, whereas samples from the non-enhanced central region reflecting necrosis were designated as group C. Specimens from each group were then compared (
Figure 1). This study was approved by the Institutional Review Board of Okayama University (approval no. 2111-003) and registered with the Japan Registry of Clinical Trials (no. 1062210071). All patients provided written informed consent prior to any study procedure. This study was conducted in accordance with the Declaration of Helsinki.
Patients
Forty-four patients were enrolled. The eligibility criteria were as follows: (i) diagnosis of malignant pancreatic tumor; (ii) planned CGP by EUS-FNB for pancreatic lesions; (iii) age ≥ 20 years; and (iv) provision of written informed consent. The exclusion criteria were as follows: (i) performance status of 3 or 4; (ii) bleeding tendency or administration of two antithrombotic agents; (iii) lack of a secure puncture route for EUS due to difficulty in identifying an appropriate pathway or the presence of intervening blood vessels; (iv) pregnancy; (v) unwillingness to provide written consent despite a sufficient study explanation; and (vi) assessed by the study director or researcher as being ineligible for the study.
CE-EUS Evaluation
The ultrasound observation system (ALOKA ProSound SSD α-10; Aloka Co. Ltd, Tokyo, Japan or SU-1; FUJIFILM, Tokyo, Japan) was used and the extended pure harmonic detection method was employed with a mechanical index of 0.2-0.4 [
5]. Perflubutane (Sonazoid) was reconstituted with 2 mL of sterile water, and 0.015 mL/kg was administered via a peripheral vein. After bolus infusion, contrast enhancement of the pancreatic tumor was continuously monitored in real time. Vascular patterns were assessed at two time phases: 0–15 seconds (early-phase) and 30–60 seconds (late-phase) post-injection [
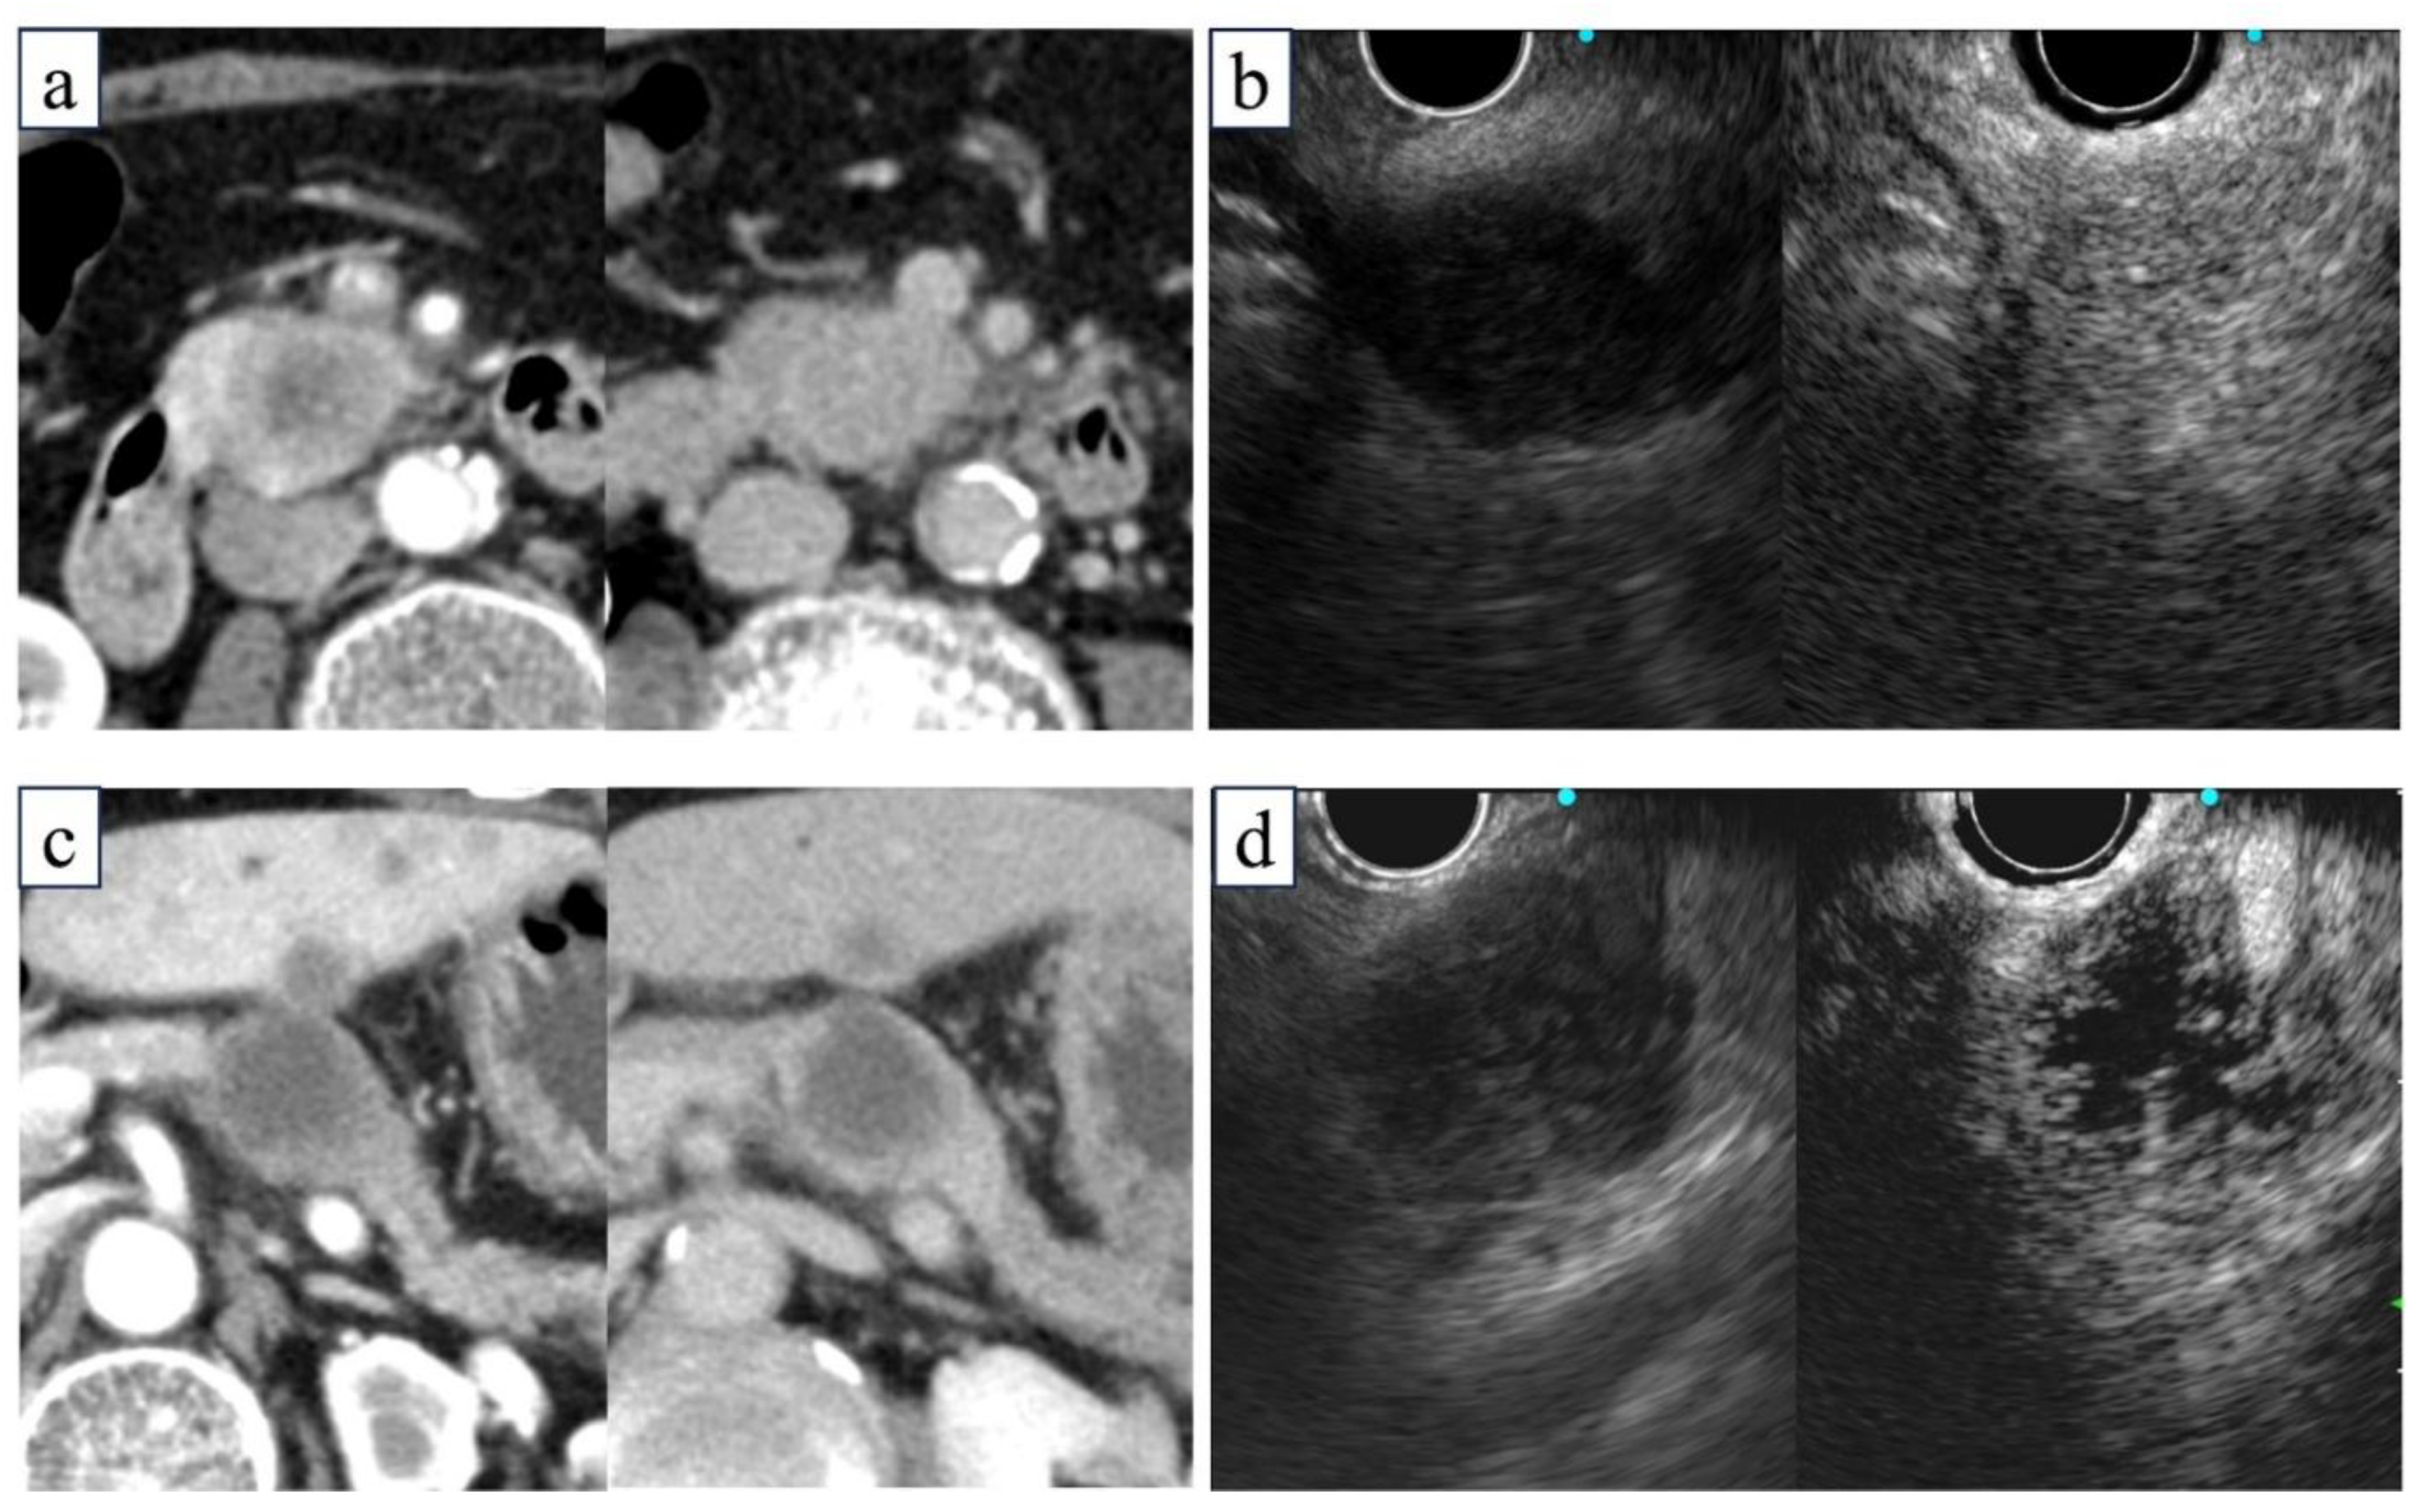
6]. Necrosis was evaluated in the late-phase image and defined as a non-enhanced area clearly demarcated from an enhanced area within the tumor on CE-EUS. When the entire tumor showed poor contrast enhancement without a clear demarcation line, it was considered non-necrotic but highly fibrotic. In all cases, radiologists evaluated contrast-enhanced CT images and confirmed that CE-EUS findings of necrosis were consistent with those on contrast-enhanced CT (
Figure 2).
Tumor images in the arterial phase (left) and delayed phase (right) on CE-CT or CE-EUS. (a, b) Non-necrotic tumors exhibiting enhancement in the delayed phase on CE-CT (a) and CE-EUS (b). (c, d) Necrotic tumors are accompanied by a non-enhancing area, indicating central necrosis on CE-CT (c) and CE-EUS (d). CE-EUS, contrast-enhanced endoscopic ultrasonography; CT, computed tomography.
EUS-FNB Procedure
EUS-FNB was performed by endoscopists with experience in over 100 procedures and certification by the Japan Gastroenterological Endoscopy Society, or under their supervision. A linear echoendoscope (GF-UCT260-AL5; Olympus Medical Systems, Tokyo, Japan or EG-580UT; FUJIFILM, Tokyo, Japan) was used. The target lesion was described in the 5–7 o’clock direction on EUS images, and the puncture route without obstructions, such as blood vessels, was confirmed using Doppler mode. In CE-EUS evaluations with perflubutane, tumors without non-contrast effects were classified as non-necrotic, and those with non-contrast effects as necrotic. Samples were collected using a 22G Acquire needle (Boston Scientific, Natick, MA, USA). Tumors in the non-necrotic group were punctured twice at the center (group A), while tumors in the necrotic group were punctured twice from the contrast-enhanced peripheral region (group B) and twice from the non-enhanced central region (group C). The needle was replaced between groups to prevent cross-contamination. Puncture stroke distances were recorded. Post-puncture, the inner sheath was advanced and removed, a syringe was attached to apply suction pressure, and the puncture needle was stroked back and forth 10 times. Suction was then released, and the needle withdrawn. Each specimen was expelled using the inner sheath and subjected to cytological and histological analysis.
Rapid on-Site Cytologic Evaluation
The rapid on-site cytological evaluation was performed blindly, and the visible white tissue core length was measured on a glass slide by a cytotechnologist using a standard size scale. Red core tissues were discarded for being unsuitable for genetic analysis since they reflected non-cancerous tissues that contained large amounts of blood. If the specimen was insufficient for CGP, an additional puncture not subject to study was performed. There were no regulations regarding the use of puncture needles or techniques for additional punctures.
Histological Evaluation
The specimens were fixed in formalin, embedded in paraffin, and sectioned at each puncture point for histopathological analysis. The formalin fixation time was within 24 hours per The Japanese Society of Pathology Practical Guidelines on the handling of pathological tissue samples for cancer genomic medicine [
7]. Hematoxylin and eosin (HE) staining was performed, and the histology, percent tumor nuclei (%TN), tumor tissue section surface area, and histology score were blindly evaluated by an experienced pathologist. The %TN was calculated as the percentage of tumor cells among all nucleated (excluding necrotic) cells. The histological score was evaluated based on the cellularity score as follows: 0, material insufficient for interpretation; 1, material allowing limited cytological interpretation; 2, material sufficient for adequate cytological interpretation; 3, material allowing a limited histological assessment; 4, material sufficient for adequate histological interpretation but of low quality (total material within a ×10 power field); and 5, material sufficient for adequate histological interpretation and of high quality (total tissue sample in a >×10 power field) [
8].
DNA Extraction and DIN Value Evaluation
Extraction of DNA from one tissue section of each 10-μm-thick formalin-fixed paraffin-embedded (FFPE) sample with was performed using a MagMAX FFPE DNA/RNA Ultra Kit (ThermoFisher Scientific, Waltham, MA, USA) according to the manufacturer’s instructions with a final elution volume of 25 μL. The DNA concentration was measured using a Qubit fluorometer (ThermoFisher Scientific) with 1 μL of eluate. For samples with DNA concentrations above the measurement sensitivity (0.1 ng/μL), the DIN value was measured using a TapeStation 4150 electrophoresis system (Agilent, Santa Clara, CA, USA) according to the manufacturer’s instructions.
Evaluated Specimen Quality
The following points were assessed for specimen quality: (i) %TN (evaluated in FFPE tissue sections); (ii) tumor tissue section surface area (evaluated in FFPE tissue sections); (iii) DIN value; (iv) DNA concentration; (v) length of white tissue core measured on glass slide during specimen collection; and (vi) histological score evaluated by cellularity score of HE-stained pathological specimen. The specimens in groups A, B, and C were then evaluated and compared.
Statistical Analysis
Categorical variables are reported as percentages, while continuous variables are presented as medians, averages, and interquartile ranges. The Wilcoxon rank-sum test (non-parametric) was used to analyze continuous data for intergroup comparisons, while the Kruskal–Wallis test (non-parametric) was used to compare three groups. The chi-squared test was used to analyze categorical data. Logistic regression analysis was used to identify the risk factors for fine-needle aspiration/biopsy (FNA/B)–related complications. The threshold for statistical significance was set at P<0.05. All statistical analyses were performed using JMP version 15.0 (SAS Institute, Cary, NC, USA).
Results
Patients’ Characteristics
One patient was excluded from the analysis because of study discontinuation due to bleeding during the FNB procedure; thus, the data of 43 patients were analyzed (
Figure 1). The patients' baseline characteristics are shown in
Table 1. The median patient age was 70 years; 22 (51%) were male. Twelve (28%) patients had pancreatic head lesions; 30 (70%) underwent transgastric puncture. Forty-one (95%) patients had adenocarcinoma, one had acinar cell carcinoma, and one had neuroendocrine carcinoma. Twenty-three (53%) patients showed necrotic areas on CE-EUS. There were significantly more female patients in the necrotic group than in the non-necrotic group (P=0.03). The mean tumor diameter was significantly larger in the necrotic versus non-necrotic group (35 mm vs. 25 mm; P<0.01). No significant intergroup differences were noted in tumor location, puncture route, or the number of cases with additional puncture.
Specimen Quality of Non-Necrotic versus Necrotic Neoplasms
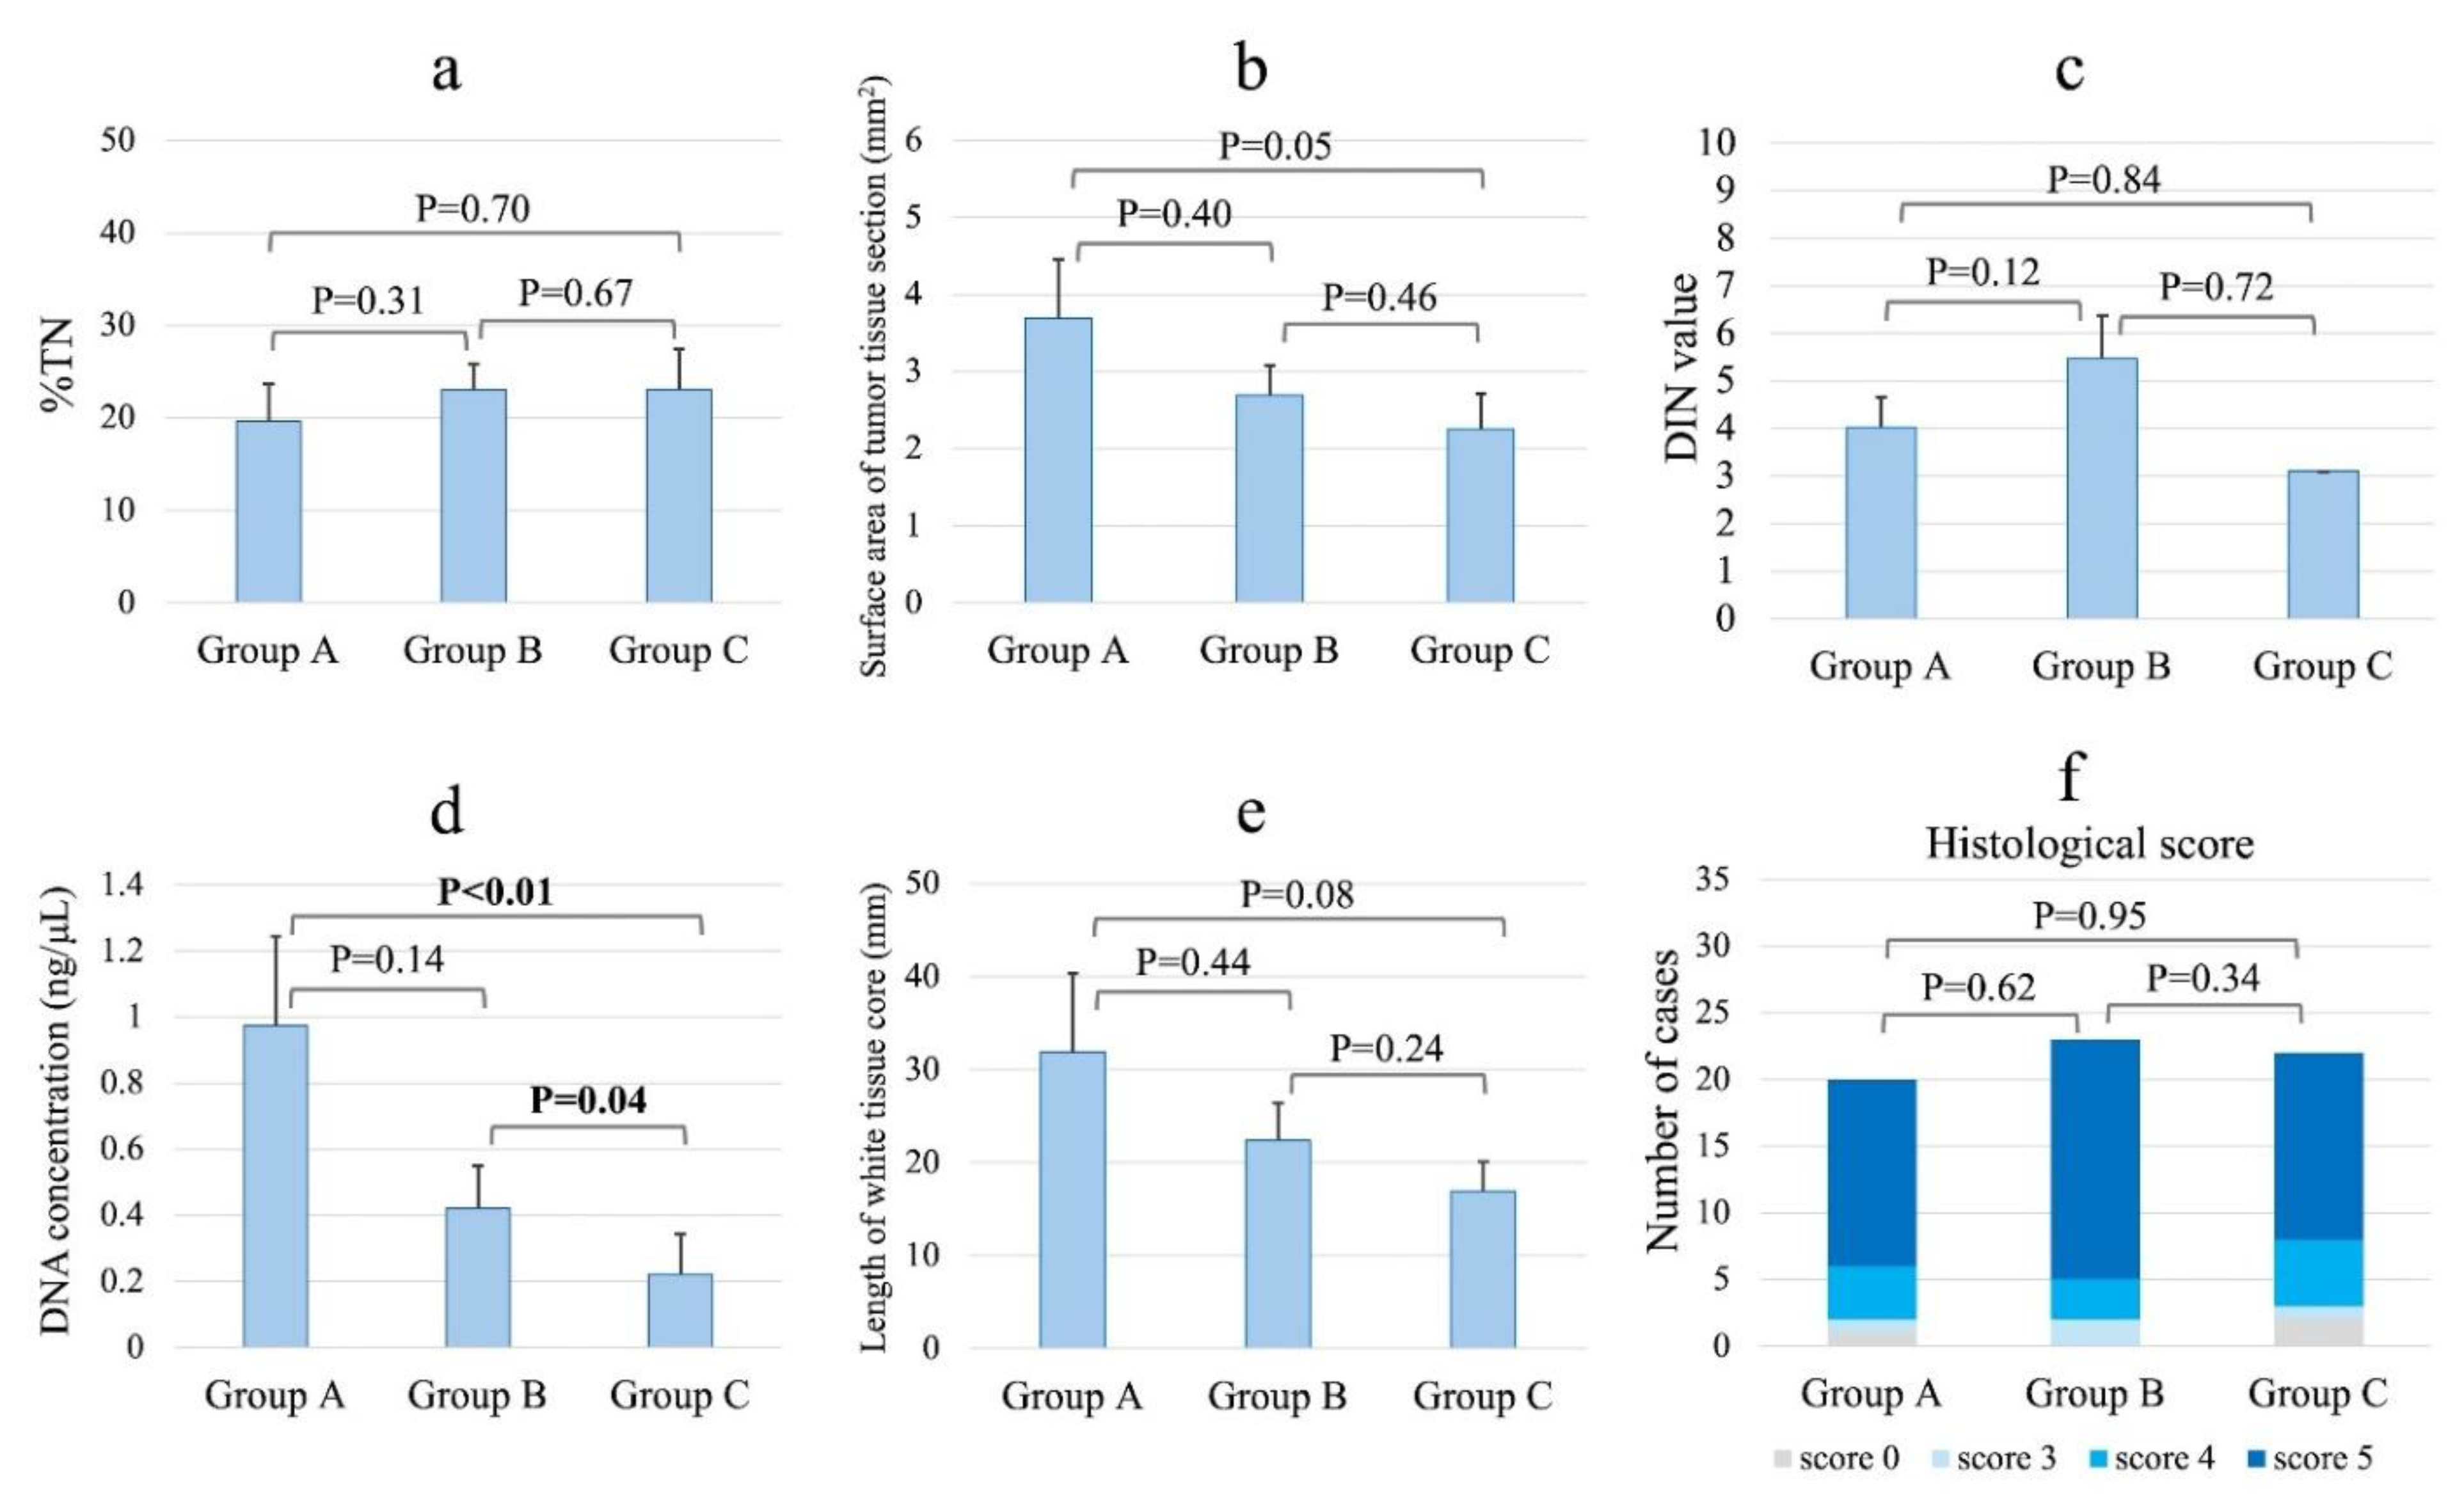
The specimen characteristics by group are shown in
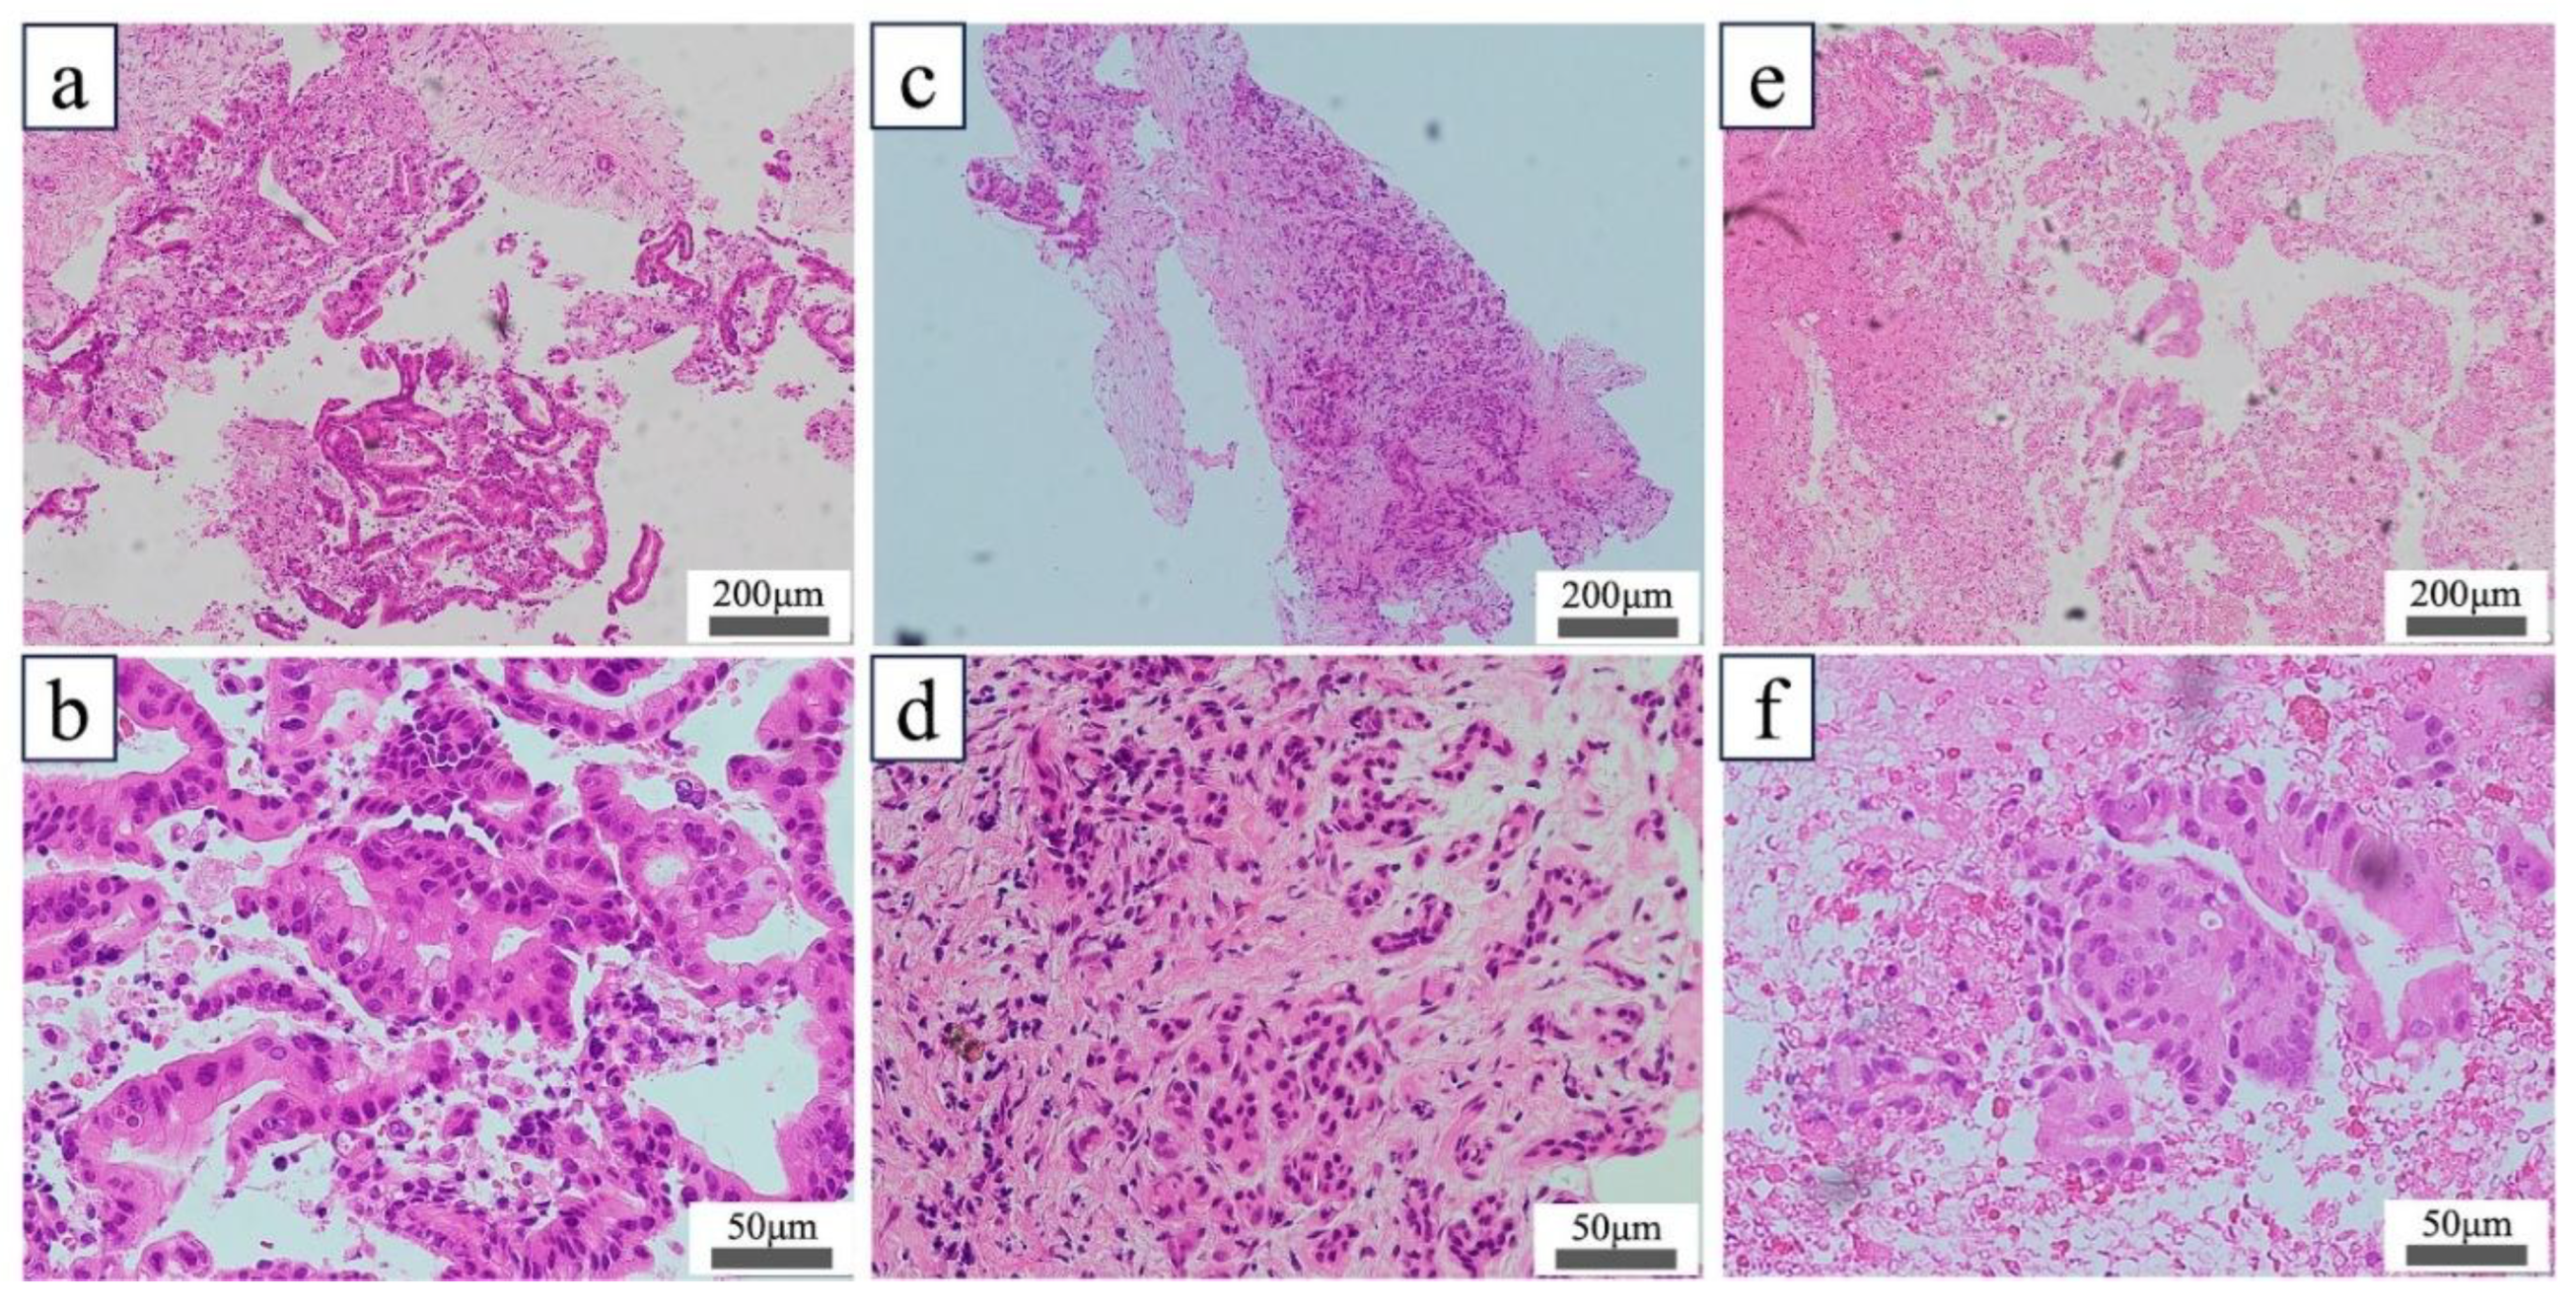
Figure 3. The percentage of DNA that exceeded the measurement sensitivity (>0.1 ng/μL) was 60% (12/20) in group A, 52% (12/23) in group B, and 26% (6/23) in group C. In the sample in which DNA quality was measurable, a significant difference in DNA concentrations was noted across groups (group A: 0.97 ng/μL; group B: 0.42 ng/μL; and group C: 0.22 ng/μL; P<0.01, Kruskal–Wallis test). The DNA concentration was significantly higher in the tissues taken from non-necrotic versus necrotic areas (group A vs. group C, P<0.01; group B vs. group C, P=0.04, Wilcoxon test). The percentages of DIN values greater than the measurement sensitivity were 67% (8/12) in group A, 33% (4/12) in group B, and 17% (1/6) in group C. Measurable DIN values did not differ among the three groups (P=0.26). The length of the high-quality white tissue core of the pathological evaluation tended to be longer (P=0.18), while the surface area of the tumor tissue section tended to be larger (P=0.19) in groups A and B than in group C. The %TN and histological scores did not differ significantly among the three groups. A pathological evaluation revealed that specimens from groups A and B had minimal necrotic areas and abundant nucleated cells, including tumor cells, whereas specimens from group C contained scattered tumor cells within the extensive necrotic areas (
Figure 4).
The acquired tissues were stained with hematoxylin and eosin. (a, b) Low-magnification (a) and high-magnification (b) images of FNA/B specimens collected from non-necrotic tumors (group A). (c, d) Low- (c) and high-magnification (d) images of FNA/B specimens collected from the contrast-enhanced area of the tumor (group B). (e, f) Low- (e) and high-magnification (f) images of FNA/B specimens collected from the non-contrast-enhanced area of the tumor (group C). In this case, malignant tumor tissue fragments were identified in extensive necrotic areas, and the histological score was 4 (f). FNA/B, fine-needle aspiration biopsy
Discussion
To our knowledge, this is the first study to compare tumor DNA concentrations between contrast-enhanced and non-enhanced areas of pancreatic tumors using CE-EUS. Tissues from non-necrotic tumors had the highest quality; however, even in necrotic tumors, samples from contrast-enhanced areas were superior to those from non-enhanced regions. DNA concentrations were significantly higher in specimens from enhanced areas, highlighting the value of CE-EUS in tissue sampling.
Recent studies have evaluated CGP tissue sampling using FNA/B needles. The utility of tissue sampling with FNB and 19G needles has been reported; however, the adequacy of the Foundation One or OncoGuide NCC Oncopanel System was 47.5–78% [
9,
10], which remains insufficient. Additionally, 19G needles have lower technical success than 22G needles, particularly for pancreatic head lesions [
9,
11]. Therefore, we investigated whether it is possible to efficiently collect nucleated cells from tumor tissues using CE-EUS, a method that does not require a puncture device.
CE-EUS is useful for assessing necrosis and fibrosis in pancreatic masses [
12], as it visualizes blood flow, with non-enhancement indicating absent flow typically seen in necrotic areas. Highly fibrotic tumors show poor, patchy enhancement, resembling necrosis. We defined necrosis as clearly demarcated non-enhancing areas, and severe fibrosis as diffusely poor patchy enhancement. These CE-EUS-based distinctions corresponded with pathological findings. While previous studies showed that CE-EUS-guided FNA/B yields sufficient diagnostic samples with fewer passes by avoiding non-enhanced regions [
13], the quality of samples from enhanced versus non-enhanced areas has not been directly compared.
In this study, DNA concentrations were higher in specimens from contrast-enhanced areas (groups A and B) than from non-enhanced areas (group C). Pathological evaluation of non-enhanced areas revealed few nucleated cells in necrotic tissue, resulting in lower DNA yields. While previous reports examined DNA yield by needle type [
10], none have focused on tumor viability using CE-EUS.
The DIN value was assessed when DNA concentration exceeded the sensitivity threshold (0.1 ng/μL). DIN, ranging from 1 to 10, reflects DNA degradation as measured by the Genomic DNA ScreenTape assay (Agilent 2200/4200 TapeStation). Lower DIN values indicate greater degradation. We hypothesized that necrotic areas would show lower DIN values due to DNA fragmentation; however, DIN could be measured in only one necrotic case, and no significant difference was found between enhanced and non-enhanced areas. This may reflect difficulty in accurately measuring DIN when DNA levels are low, even above the threshold. Due to the small sample size, further study is needed. In contrast, most evaluable samples had DIN ≥2.5, a level associated with higher CGP success rates [
14]. Over-fixation with formalin during FFPE processing reduces DIN and hampers sequencing [
15]. As FNA/B specimens are small, avoiding over-fixation is crucial. Our results suggest 24-hour formalin fixation is acceptable.
Specimens from contrast-enhanced areas generally showed larger tumor surface areas and longer white tissue cores than those from non-enhanced areas. However, %TN was similar across groups, as it reflects tumor cells among all non-necrotic nucleated cells. Enhanced areas had more nucleated cells, while non-enhanced regions contained mostly necrotic tissue. Nonetheless, diagnostic tumor clusters were also found in necrotic areas, explaining the similar histological scores between enhanced and non-enhanced samples.
This study had some limitations. First, it was a single-center study. Second, it was a crossover trial and the endoscopist was not blinded. Third, this was an ancillary study of crossover trials to evaluate the superiority of 22G over 19G needles for obtaining suitable specimens for CGP. We did not calculate the sample size for the evaluation of CE-EUS utility in FNA/B for DNA yield. Finally, we could not assess the number of samples that passed the CGP test.
Conclusions
FNA/B with CE-EUS of the contrast-enhanced area of a malignant pancreatic tumor can yield tissue samples containing a greater amount of DNA suitable for CGP. These results suggest that FNA/B with CE-EUS is useful for facilitating the successful genetic analysis of tissue samples.
Author Contributions
KMa and HT: conceptualization and study design; drafting of the manuscript. TT, HI, RS, TO, AM, KMi, YF, DU, SH, KT, and AH: patient management and critical revision of the manuscript for important intellectual content. MO: final approval of the manuscript. All authors read and approved the final version.
Funding
This research received no external funding.
Acknowledgments
The authors express their sincere gratitude to the staff of the Department of Pathology at Okayama University Hospital for their invaluable assistance in the handling and processing of pathological specimens.
Conflicts of Interest
The authors declare no conflicts of interest.
References
- Ryan, D.P.; Hong, T.S.; Bardeesy, N. Pancreatic adenocarcinoma. New Engl J Med. 2014, 371, 1039–1049. [Google Scholar] [CrossRef] [PubMed]
- Mine, Y.; Takada, E.; Sugimoto, K.; Moriyasu, F. Principle of contrast-enhanced ultrasonography. J Med Ultrason. 2001, 51, 567–580. [Google Scholar] [CrossRef]
- Jeong, W.K. Diagnosis of hepatocellular carcinoma using sonazoid: a comprehensive review. J Liver Cancer. 2023, 23, 272–283. [Google Scholar] [CrossRef] [PubMed]
- Terasawa, H.; Matsumoto, K.; Tanaka, T.; et al. Cysts or necrotic components in pancreatic ductal adenocarcinoma is associated with the risk of EUS-FNA/B complications including needle tract seeding. Pancreatology. 2023, 23, 988–995. [Google Scholar] [CrossRef] [PubMed]
- Yamashita, Y.; Shimokawa, T.; Ashida, R.; et al. Protocol for a Multi-Center Confirmatory Trial to Evaluate the Differential Diagnostic Performance of Contrast-Enhanced Ultrasonography Using Perflubutane in Patients with a Pancreatic Mass: A Multicenter Prospective Study. Diagnostics 2024, 14, 130. [Google Scholar] [CrossRef] [PubMed]
- Yamashita, Y.; Kato, J.; Ueda, K.; et al. Contrast-Enhanced Endoscopic Ultrasonography for Pancreatic Tumors. Biomed Res Int. 2015, 2015, 491782. [Google Scholar] [CrossRef] [PubMed]
- Hatanaka, Y.; Kuwata, T.; Morii, E.; et al. The Japanese Society of Pathology Practical Guidelines on the handling of pathological tissue samples for cancer genomic medicine. Pathol Intl. 2021, 71, 725–740. [Google Scholar] [CrossRef] [PubMed]
- Gerke, H.; Rizk, M.K.; Vanderheyden, A.D.; Jensen, C.S. Randomized study comparing endoscopic ultrasound-guided Trucut biopsy and fine needle aspiration with high suction. Cytopathology. 2010, 21, 44–51. [Google Scholar] [CrossRef] [PubMed]
- Song, T.J.; Kim, J.H.; Lee, S.S.; et al. The prospective randomized, controlled trial of endoscopic ultrasound-guided fine-needle aspiration using 22G and 19G aspiration needles for solid pancreatic or peripancreatic masses. Am J Gastroenterol. 2010, 105, 1739–1745. [Google Scholar] [CrossRef] [PubMed]
- Ikeda, G.; Hijioka, S.; Nagashio, Y.; et al. Fine-needle biopsy with 19G needle is effective in combination with endoscopic ultrasound-guided tissue acquisition for genomic profiling of unresectable pancreatic cancer. Digest Endosc. 2023, 35, 124–133. [Google Scholar] [CrossRef] [PubMed]
- Itoi, T.; Itokawa, F.; Sofuni, A.; et al. Puncture of solid pancreatic tumors guided by endoscopic ultrasonography: a pilot study series comparing Trucut and 19-gauge and 22-gauge aspiration needles. Endoscopy. 2005, 37, 362–366. [Google Scholar] [CrossRef] [PubMed]
- Kitano, M.; Kudo, M.; Yamao, K.; et al. Characterization of small solid tumors in the pancreas: the value of contrast-enhanced harmonic endoscopic ultrasonography. Am J Gastroenterol. 2012, 107, 303–310. [Google Scholar] [CrossRef] [PubMed]
- Sugimoto, M.; Takagi, T.; Hikichi, T.; et al. Conventional versus contrast-enhanced harmonic endoscopic ultrasonography-guided fine-needle aspiration for diagnosis of solid pancreatic lesions: a prospective randomized trial. Pancreatology. 2015, 15, 538–541. [Google Scholar] [CrossRef] [PubMed]
- Hiramatsu, K.; Matsuda, C.; Masago, K.; et al. Diagnostic utility of DNA integrity number as an indicator of sufficient DNA quality in next-generation sequencing-based genomic profiling. Am J Clin Pathol. 2023, 160, 261–267. [Google Scholar] [CrossRef] [PubMed]
- Yanagita, E.; Yamada, H.; Kobayashi, T.; et al. The DNA integrity number and concentration are useful parameters for successful comprehensive genomic profiling test for cancer using formalin-fixed paraffin embedded tissue. Pathol Intl. 2023, 73, 198–206. [Google Scholar] [CrossRef] [PubMed]
|
Disclaimer/Publisher’s Note: The statements, opinions and data contained in all publications are solely those of the individual author(s) and contributor(s) and not of MDPI and/or the editor(s). MDPI and/or the editor(s) disclaim responsibility for any injury to people or property resulting from any ideas, methods, instructions or products referred to in the content. |
© 2025 by the authors. Licensee MDPI, Basel, Switzerland. This article is an open access article distributed under the terms and conditions of the Creative Commons Attribution (CC BY) license (http://creativecommons.org/licenses/by/4.0/).