
Submitted:
13 November 2025
Posted:
17 November 2025
You are already at the latest version
Abstract
An increasing number of different types of dielectric liquids are appearing on the market. This is undoubtedly related to sustainable development goals. This paper presents comparative studies of the lightning impulse breakdown voltage (LIBV) of six dielectric liquids with different chemical compositions: naphthenic uninhibited mineral oil (UMO), naphthenic inhibited mineral oil (IMO), natural ester (NE), synthetic ester (SE), bio-based hydrocarbon (BIO), and an inhibited liquid produced using gas-to-liquids technology (GTL). Tests were conducted in a point to sphere electrode configuration with a 5 mm thick pressboard barrier placed between them. This configuration was designed to more closely replicate the actual configuration found in transformers, where the oil channels are separated by pressboard barriers. Tests were performed for two inter-electrode gap distances of 25 mm and 40 mm, and for both lightning impulse voltage polarities. Pressboard barrier was placed so that the distance between point electrode and the barrier was always the same (10 mm). Measurements were performed using the step method. Before measurements began, pressboard barrier was impregnated in dielectric liquid being tested. The obtained measurement results were compared with previous studies conducted by authors, which used a similar electrode system but without pressboard barrier. The results confirmed that inserting pressboard barrier between electrodes effectively inhibits development of discharges and significantly increases the electrical strength of the entire insulation system.
Keywords:
dielectric liquids
; breakdown voltage
; negative polarity
; positive polarity
; mineral oil
; ester liquids
; GTL
; pressboard barrier
; lightning impulse voltage
1. Introduction
Electricity plays a significant role in the development and modernization of every country. It is particularly important in terms of the security and economic stability of the country. Access to it facilitates new investments and eliminates obstacles to strategic actions and development. The broad power engineering sector complements other sectors of the national economy, without which their functioning is difficult to imagine. Therefore, a continuous and reliable supply of electricity is necessary, the availability of which is determined by the extensive infrastructure of the power system. One of its key elements are transformers. Almost 140 years have passed since the production of the first power transformer, which became a permanent fixture and revolutionized the process of converting and distributing electricity. During this time, there has been a comprehensive development of transformer construction, and the currently growing demand for electricity deepens their importance in the energy sector and the development of new technologies. The increase in transformer power ratings began around 1900 with the need for oil cooling, using mineral oil, which is still used today as a coolant and insulating material [1,2,3].
Most transformers use paper-oil insulation as their insulating material. The insulation system of oil-filled transformers is quite complex and consists of various insulating materials [3,4]. It provides:
- insulation of transformer windings - using insulating paper,
- inter-layer insulation and inter-coil insulation – using pressboard, paper, special transformer board and bakelized paper plates and shapes,
- main insulation – using sleeves and angle rings made of bakelized paper, pressboard and soft cable paper.
All the materials mentioned are subjected to an oil impregnation process. In addition to its insulating function, oil also provides impregnation for cellulose insulation, dissipates heat generated during transformer operation, and preserves the oil tank and windings. It also has arc-quenching properties. When designing a transformer, designers are interested in the electrical strength of the liquid, as it determines the insulation breakdown voltage and transformer damage. Among the most common dielectric liquids are mineral oils obtained from crude oil refining. Due to the growing awareness of human impact on the environment, oil waste poses a serious threat to flora and fauna. These liquids undoubtedly belong to the group of non-biodegradable oils and, in the event of a leak, decompose very slowly, contaminating the area they come into contact with. The negative impact of oil waste on soil, groundwater, and surface water has led to the development of new solutions in the power industry aimed at reducing environmental impact [1,3,5,6,7].
Due to the increased demand for electricity, research is being carried out on new types of transformer oils that will maintain high efficiency of transformers throughout their service life and will also be environmentally friendly. Ester fluids (natural or synthetic) are increasingly being used. However, some of the most modern and easily biodegradable transformer oils are dielectric liquids produced using Gas-to-liquids (GTL) technology or bio-based hydrocarbons. In the future, the use of biodegradable fluids may reduce the costs of adapting the site for transformer station construction, which requires the installation of a sealed oil tank under the transformer in the event of a failure or oil leak from the transformer. The requirements placed on the power industry at the European Union level, which is taking steps to promote pro-environmental policies, compel the search for new technological solutions. An important aspect of implementing a new dielectric fluid is its electrical strength testing under alternating and lightning impulse voltages. The tests with alternating voltage are intended to represent the long-term impact of the operating voltage and temporary overvoltage, while the tests with lightning impulse voltage are intended to represent switching and lightning overvoltage’s. Overvoltage’s occurring in the network require various types of insulation coordination. The concept of insulation coordination refers to the selection of appropriate insulation quality for transformer insulation system components, at a level that ensures and adapts the electrical strength of the device to the expected voltage exposures (overvoltage’s), while taking into account the properties of available overvoltage protection measures. Lightning impulse voltage tests are among the most essential tests, providing key information for designers working on the operation of transformers with new dielectric liquids. It is important to test the liquid under conditions that replicate the structure of the transformer's insulation system to provide information on the actual phenomena occurring between the liquid and the solid dielectric. A valuable source of such tests is model tests, which provide knowledge about the electrical strength of a section of the transformer's insulation system. One of the most important parameters determining the properties of the dielectric liquid in the actual transformer's insulation structure is the breakdown voltage. Model tests conducted using new dielectric liquids are intended to provide information not only on the behaviour of the liquid in contact with a solid dielectric, but also in areas of the transformer's insulation system with varying electric field distribution and intensity. During normal lightning surge tests, the photomultiplier method, which involves measuring light intensity pulses during a discharge, plays an important role in assessing the intensity of discharge development. The issues related to introducing new dielectric liquids to the market are related, among others, to understanding the breakdown voltage value as the limiting value for reliable transformer operation [3,4,8,9,10,11,12,13,14].
In this paper, studies were conducted on six different dielectric liquids with different chemical compositions. Well-known mineral oils were used as reference fluids. Uninhibited mineral oil (UMO) and inhibited mineral oil (IMO) were tested. Inhibited oils contain antioxidant additives, also known as oxidation inhibitors (usually phenolic compounds), in amounts ranging from 0.08% to 0.40% by weight. Antioxidant additives are used when it is necessary to ensure the oil's long-term resistance to oxidation. Uninhibited oils, on the other hand, do not add antioxidants, but thanks to optimal refining, they retain some of the natural antioxidants present in crude oil (usually sulphur- and nitrogen-based compounds) [3]. Alternative fluids such as Natural Ester (NE), Synthetic Ester (SE), Bio-Based Hydrocarbon (BIO) and Gas-to-Liquids (GTL) were compared to these fluids. Base oils used for production of natural esters are obtained by pressing the seeds of oil plants such as soybeans, rapeseed, sunflower seeds, etc. Natural esters are readily biodegradable and have a much higher flash point than mineral oils (approximately 350°C to 150°C). However, they are characterized by poor oxidation resistance, so oxidation inhibitors are added to improve their resistance to oxidation. It is recommended to use natural esters only in closed (sealed) systems. These liquids also have a significantly higher viscosity (reduced cooling) [7,15,16,17,18,19,20]. Synthetic esters are created by chemical synthesis of a (saturated) carboxylic acid and an alcohol (usually glycerine). They have slightly lower viscosity and better oxidation resistance than their natural counterparts, but are generally not fully biobased and are more expensive [6,19,20,21]. Bio-based hydrocarbon insulating fluids are produced through deep refining combined with isomerization. The raw materials used in production are primarily residues and byproducts of plant origin. Vegetable oils, animal fats, and crops are also used. The resulting fluids are typically alkanes and isoalkanes and are fully biodegradable [22,23,24]. Gas-to-Liquids (GTL) fluids are quite similar to mineral oils, although they exhibit certain dielectric differences. Base oil is a hydrocarbon produced from natural gas using the Fischer-Tropsch process. Resulting liquid is practically completely pure hydrocarbons, because the basic material for its production is mainly carbon and hydrogen. GTL products are colourless and odourless. They practically do not contain sulphur, unsaturated or aromatic hydrocarbons present in crude oil. Absence of sulphur significantly reduces the likelihood of copper corrosion. Oils produced using GTL technology are miscible and compatible with traditional hydrocarbon oils. It is worth noting that the composition of a GTL product can be tailored to be biodegradable [5,25,26,27].
End users increasingly want to know the behaviour of alternative fluids under lightning impulse stresses. This is also due to the growing awareness of the different nature of discharges developing in ester fluids under the influence of lightning impulse voltage compared to similarly assessed discharges in mineral oil [6,15,28]. Obviously, it is crucial to understand the impact of using alternative insulating fluids on the electrical strength of solid insulation or mixed insulating structure consisting of liquid and paper/pressboard. This aspect is the focus of this article. Comparative results for dielectric fluids of different chemical compositions are collected here. Presented comparative analysis concerns negative and positive lightning impulse, with lightning impulse breakdown voltage (LIBV) selected as the comparative parameter. Presented research results may bring new insights into design aspects for transformer manufacturers as well as the community interested in development of alternative dielectric fluids [1,3,21,29,31].
As already mentioned, six commercially available dielectric liquids of different chemical composition were tested: uninhibited mineral oil (UMO), inhibited mineral oil (IMO), natural ester (NE), synthetic ester (SE), a liquid based on bio-based hydrocarbons (BIO) and a liquid produced using Gas-to-Liquids technology (GTL). Table 1 summarizes the basic physicochemical properties of the tested liquids.
2. Measurement Methodology
The diagram of the measurement system is shown in Fig. 1. This is a modification of the system used by authors in earlier studies [8,9]. It was designed to simulate oil gaps occurring in typical transformer insulation systems. Voltage source was a six-step 450 kV lightning impulse generator. Although the generator's rated voltage was 450 kV the value of 330 kV was not exceeded during experimental tests for this paper. This was due to space constraints in the laboratory where tests were performed, and given the prevailing conditions, it was decided not to increase the voltage above the adopted limit level in order to maintain all occupational safety measures.
Figure 1.
Measurement system, where: LIG – lightning impulse generator, R – limiting resistor, PVM – peak value meter, OSC – digital oscilloscope, PMT - photomultiplier.
Figure 1.
Measurement system, where: LIG – lightning impulse generator, R – limiting resistor, PVM – peak value meter, OSC – digital oscilloscope, PMT - photomultiplier.
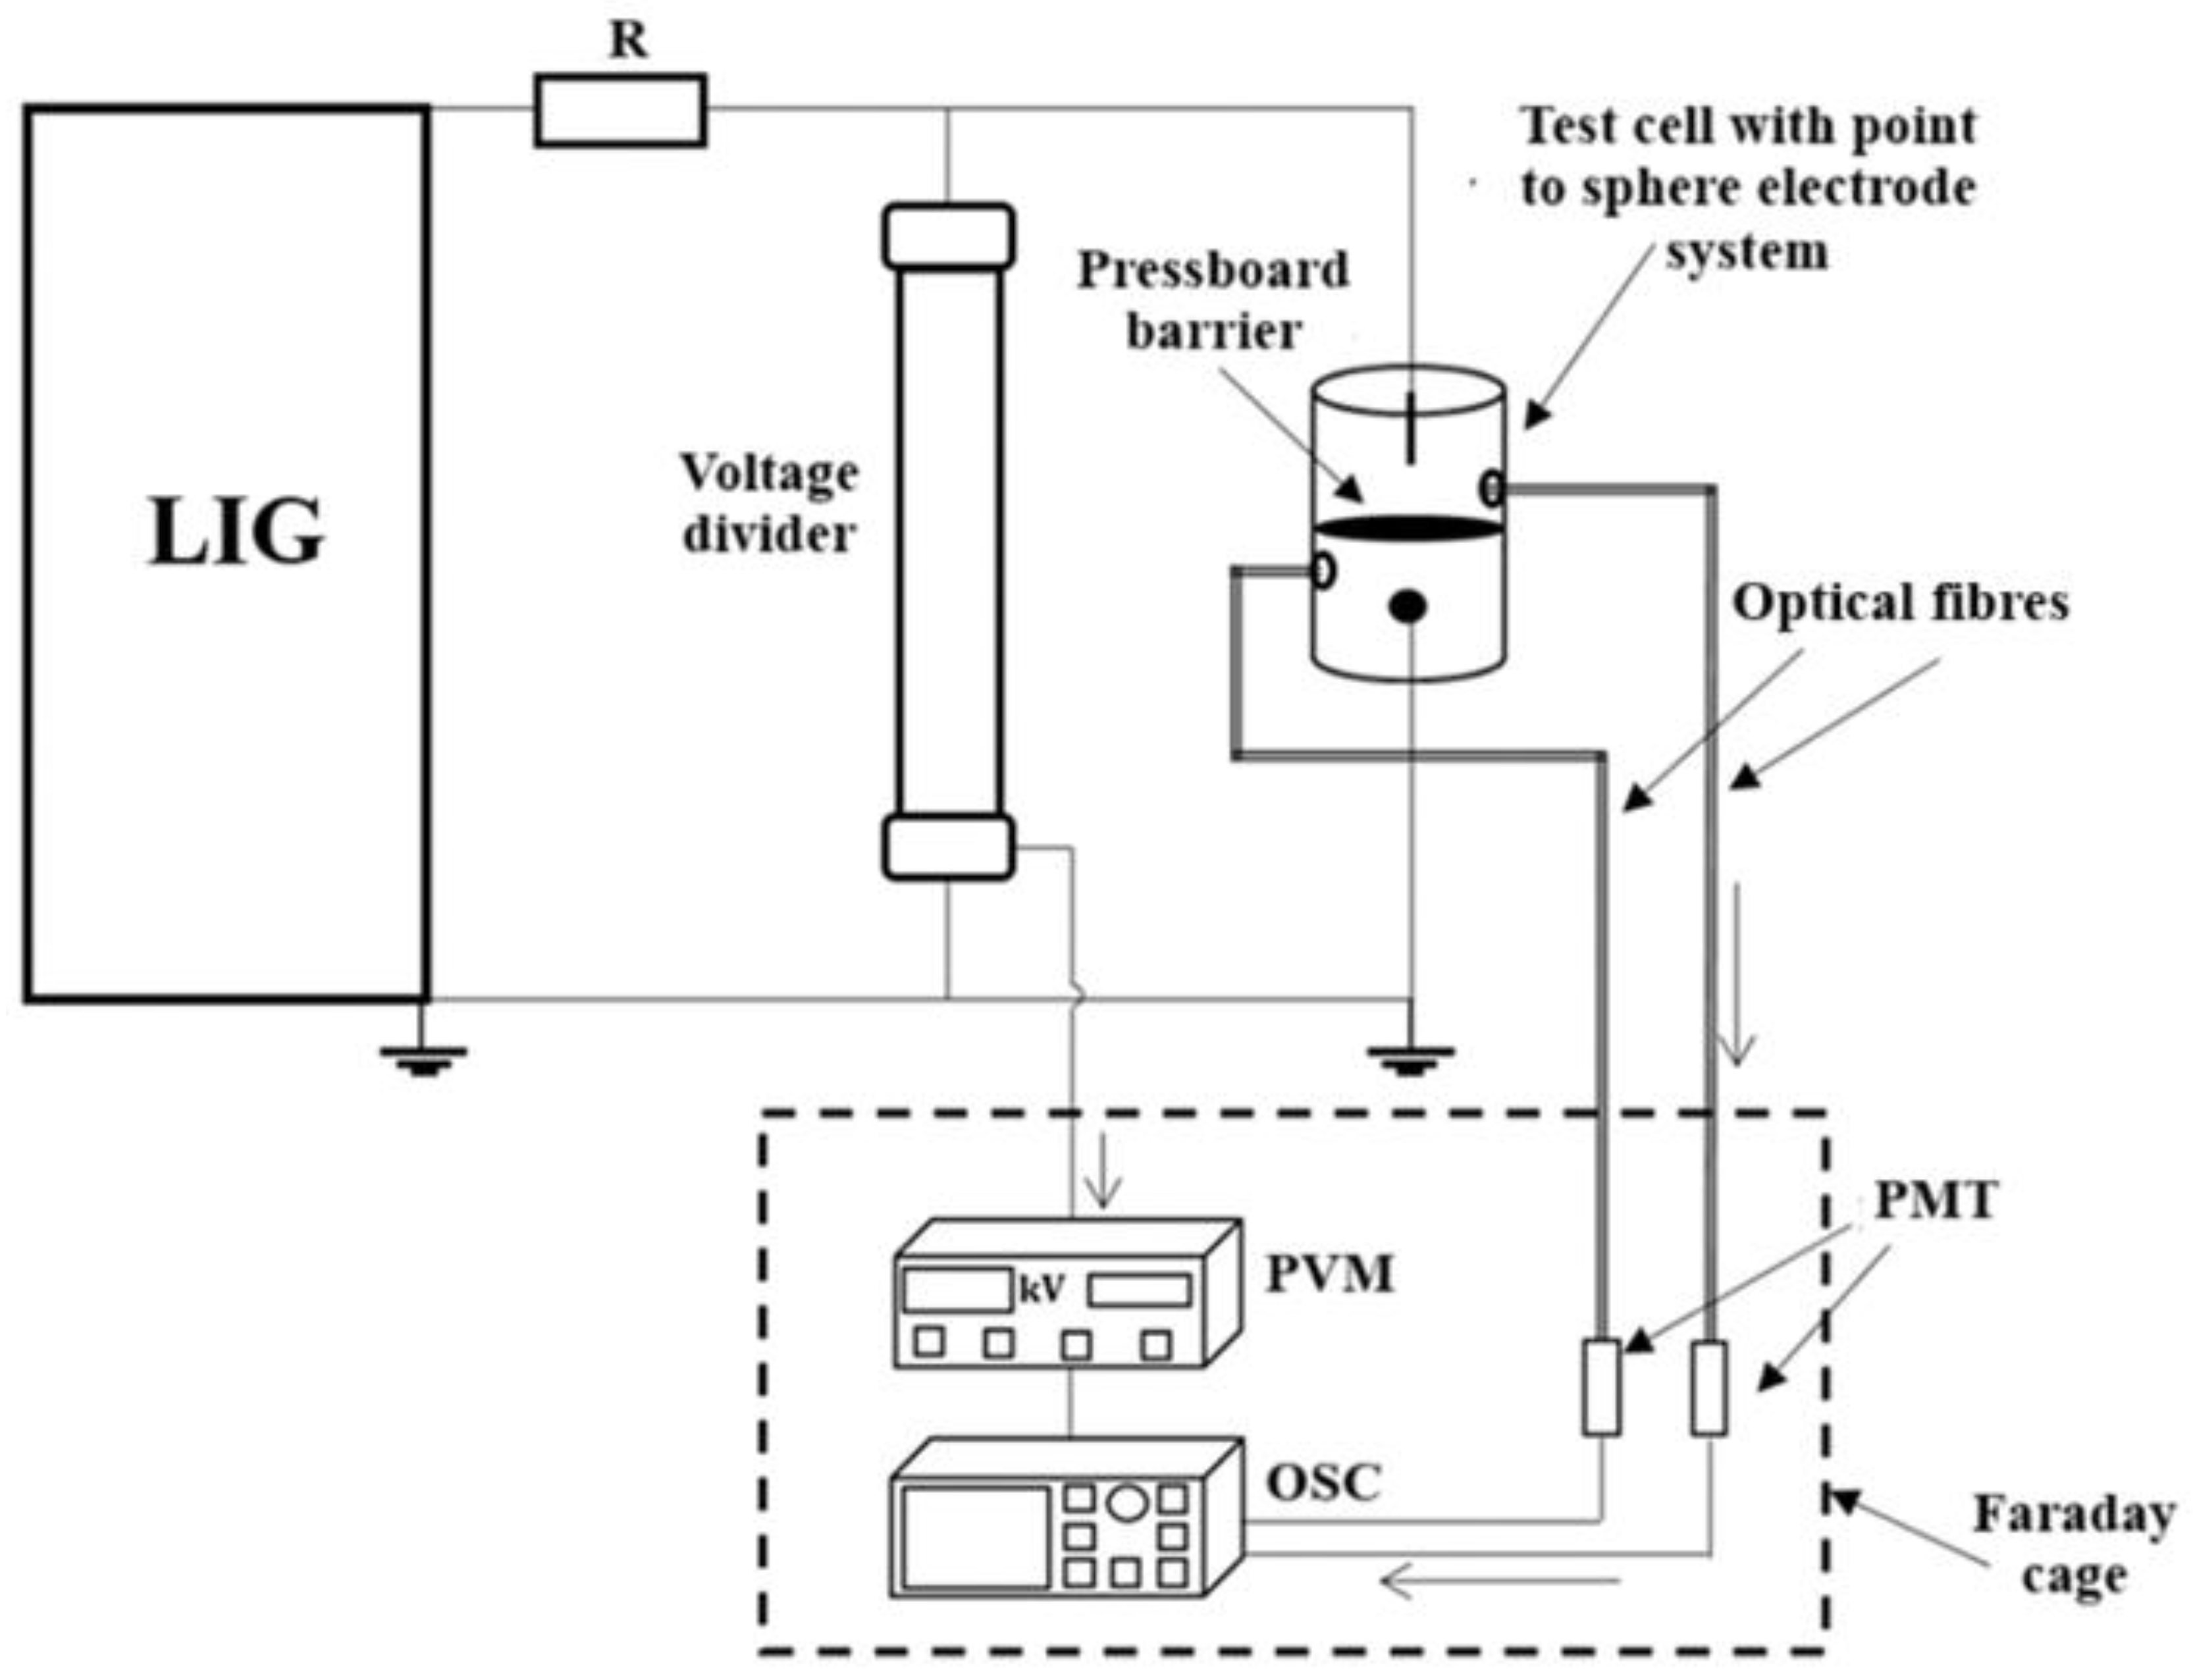
The changes implemented in the test cell are shown in Figure 2. A 5 mm thick pressboard barrier was inserted between the point to sphere electrode system. The system for recording the light emitted during the discharge was expanded with an additional photomultiplier and an optical fibre. Thanks to this, it was possible to record the light pulse waveforms in two locations: the first optical fibre transmitted the light signal from the space between the high-voltage point electrode and the pressboard surface, while the second one transmitted the light signal between the barrier and the earthed sphere electrode. The pressboard used during the tests was manufactured by the German company Krempel GmbH, and its catalogue data is presented in Table 2. Pressboard discs with a diameter of 15 cm were used, matching the diameter of the internal electrode mounting system.
The measurements were performed for two inter-electrode gaps, the same as those considered in the studies without a barrier (25 and 40 mm) [8,9]. The barrier location was selected so that the distance between the blade electrode and the pressboard surface was always constant at 10 mm. Diagram of used electrode system with a pressboard barrier is shown in Figure 2.
The measurement methodology was analogous to that described in the authors' previous studies [8,9], consistent with the stepwise method described in the IEC 60897 standard [33]. Voltage was applied until breakdown occurred (within the generator's capabilities). The same voltage step ΔU (5 kV) and time interval between subsequent voltage steps Δt (1 minute) were maintained as described previously. The test cel was flooded with the test liquid the day before the measurements began, and measurements were performed for both polarities of the applied lightning impulse voltage.
Before the tests began, an important aspect was the preparation of the pressboard barriers. They were dried and then impregnated in a vacuum chamber in accordance with the IEC 60641-2 standard [34] and own experience of the authors in this field [35]. Sample preparation was carried out in three stages:
- Drying the samples in a vacuum at 105°C for 48 hours.
- Flooding the vacuum chamber with the test liquid and impregnating samples at 80°C for 24 hours.
- Turning off the heating and then cooling the samples in a vacuum to ambient temperature, while leaving them in an oil bath for 24 hours.
Impregnation took place in the liquid in which the tests were to be conducted.
The obtained measurement results were compared with studies previously conducted by authors [8,9]. In these studies, LIBV was determined based on ten measurement series, which were conducted according to the step method described in the IEC 60897 standard.
Fluids used in these tests were tested in condition as received. Only mineral oil was pretreated to remove moisture and contaminants. Before testing fluids were tested by measuring the AC breakdown voltage according to IEC 60156 standard [36] and the moisture content using the Karl-Fisher method. Obtained AC breakdown voltage values were greater than 70 kV for each fluid tested, while the moisture content for UMO, IMO, BIO, and GTL was less than 5 ppm, and for NE and SE, less than 50 ppm. These measurements confirmed the good quality of fluids used
3. Results & Discussion
3.1. Negative Polarity
As mentioned above results of the tests performed in the system with a pressboard barrier were compared with previously obtained results of measurements using a point to sphere electrode system without an insulating plate. Figure 3 presents results of lightning impulse breakdown voltage (LIBV) measurements without the pressboard plate [8] and with pressboard barrier for 25 mm gap. Figure 4 presents the analogous data but for 40 mm gap. In the mentioned Figures results marked as “MAX” represent 330 kV. As explained in Section 2, it was not possible to exceed this value due to equipment limitation, therefore the breakdown voltages for these cases would be higher. In both cases the LIBV was obtained based on 10 measurement series conducted using the step method and the values provided in the Figures are the average values to be calculated.
As the results show pressboard barrier very effectively limits the development of discharges that lead to breakdown. For all dielectric fluids tested, the electrical strength of insulating system was at least doubled at 25 mm compared to system without the barrier. For 40 mm gap distance the improved was lower, but it must be noticed again that the tests stopped at 330 kV of peak value of lightning impulse voltage. During the studies there were the cases noticed where discharges propagated in the space between point and barrier, and between barrier and sphere, but did not merge into a single discharge channel short-circuiting the electrodes. The example in this field, as collected oscillograms, is shown in Figure 5 representing light emission collected by PMTs coughing the light from the space below and above the barrier. The green waveform shows, for (b) and (c) courses, that light appeared solely below the barrier but no breakdown occurred. This was done only by reaching enough high voltage level, which is represented by course (d).
During these studies, attempts were also made to capture the shape of the discharges using photographs taken with a digital camera with a fast shutter. Figure 6 shows three sample images.
Concluding this part, test results showed a significant increase in the electrical strength of the insulating system for all tested liquids. However, the occurrence of breakdown at all distances in tested ester liquids raises doubts as to whether their use in real transformer insulating systems poses different discharge problems than mineral oil when considering exposure to negative lightning impulse. This may be due to, for example, the higher viscosity of these fluids, which may require extending the impregnation process of the solid insulation.
3.2. Positive Polarity
Similarly to the negative polarity, Figure 7 first graphically shows the measurement results obtained for 25 mm gap, while Figure 8 for 40 mm gap.
As with negative polarity, results also show that pressboard barrier effectively limits development of discharges leading to breakdown. Due to much lower values of breakdown voltages, after applying barrier, breakdown occurred in each of the tested cases. In comparison to negative polarity, obtained results for positive polarity revealed an much more increase in electrical strength of insulation system tested. As with negative polarity, cases were observed where discharges propagated in space between point electrode and barrier, and barrier and sphere, but did not merge into a single discharge channel connecting electrodes. This is shown in example of collected oscillograms in Figure 9.
Similar breakdown voltage values obtained for all tested liquids and inter-electrode gaps when considering exposure to a positive polarity lightning impulse allow us to assume that the use of alternative dielectric liquids does not create any different discharge problems than those encountered with mineral oil. This applies to real insulation systems in power transformers, where oil channels are divided by solid dielectric partitions.
3.3. Acceleration Voltage
In previous papers by authors [8,9,23,24,26,31], where a point to sphere electrode system without a pressboard barrier was studied, the acceleration voltage was also determined. As a reminder, acceleration voltage means the value of voltage at which we observe a change from the so-called "slow" to "fast" discharges. In case of fast discharges the discharge channel has a much higher temperature and greater energy, causing greater damage to the solid insulation. Therefore, a higher acceleration voltage value is an advantage of a given dielectric liquid.
After analysing measurement results presented in this paper, it can be observed that introducing a pressboard barrier into interelectrode space effectively limits development of fast discharges. This observation is extremally valid for ester liquids. It means that for the voltage levels, at which in the system without the barrier fast discharges were noticed, the typically observed discharge mode in the system with pressboard was classified as “slow”. Below, Figure 10 and Figure 11 (for negative and positive polarity, respectively, gap distance 25 mm) present selected oscillograms solely for NE, and SE. The examples compare the cases without and with a barrier. For the electrode system without the barrier a fast discharge (short time to breakdown oscillating around 2 µs is seen) is responsible for breakdown, while, for the same voltage level in the electrode system with barrier slow discharges develop without breakdown. For positive polarity SE, oscillogram shown was recorded at a much higher voltage value due to very low value of determined acceleration voltage. For tests in configuration with barrier, measurements began at a much higher voltage level.
Presented oscillograms indicate that introducing a pressboard barrier into interelectrode space effectively limits development of fast discharges. This is particularly important for ester fluids, where fast discharges develop at much lower voltages compared to hydrocarbon fluids [3,8,9,23,24,26,31].
4. Conclusion
The paper examines a point to sphere electrode system with a pressboard barrier inserted into the inter-electrode gap. This simulates in part a real insulation system found in power transformers, where oil channels are separated by partitions made of solid insulating material. The aim of this work was to verify the impact of using a barrier on improving the electrical strength of tested insulation system. Experiments were conducted for six dielectric liquids of varying chemical compositions for negative and positive lightning impulse voltage giving a comprehensive comparison between the liquids.
After conducting research, the following conclusions were drawn:
- When an pressboard barrier was used in tested point to sphere electrode system, not for all dielectric liquids tested with negative polarity achieved breakdown. Since maximum voltage applied was limited by the used high voltage equipment this may be supposed that real value of breakdown voltage might be higher, especially for 40 mm gap distance.
- The well-known fact of much lower breakdown voltage values of tested dielectric liquids under positive lightning impulse allowed to clearly assess the tested system with pressboard barrier for this polarity - in each of tested cases obtained breakdown.
- For all tested dielectric liquids, electrical strength of insulating system was improved compared to the system without barrier. Hence, it may be stated that barrier used effectively influences the condition of the system. Even when the discharges propagated in space between point electrode and barrier and barrier and sphere electrode they did not merge into a single discharge channel connecting electrodes.
- Results obtained during tests showed that in the insulation systems found in real power transformers, where the oil channels are divided into sections using solid dielectric insulating partitions, unfavourable properties of esters demonstrated by the acceleration voltage tests are largely eliminated by placement of pressboard barrier. Introduction of an insulating barrier into space between electrodes effectively limits the development of fast discharges. This conclusion applies to experimental conditions, but equally to exposures to negative and positive lightning impulse voltages.
Experimental results suggest that a process for verifying the properties of dielectric liquids, particularly those newly introduced to the market, should be developed. In addition to the acceleration voltage parameter previously proposed by the authors [8,9], it is also important to verify the electrode systems that are closer to the real insulating structures met in transformers. This may be done by testing the systems with solid insulation components that may show also effectiveness of the impregnation process of solid insulating materials with new dielectric liquid.
Author Contributions
Conceptualization, F.S. and P.R.; methodology, F.S and P.R.; validation, F.S. and P.R.; formal analysis, F.S. and P.R.; investigation, F.S.; data curation, F.S.; writing—original draft preparation, F.S. and P.R.; writing—review and editing, F.S. and P.R.; visualization, F.S. and P.R.; supervision, P.R.; All authors have read and agreed to the published version of the manuscript.
Funding
This research received no external funding
Data Availability Statement
Not applicable.
Conflicts of Interest
The authors declare no conflicts of interest.
References
- Fofana, I. 50 Years in the Development of Insulating Liquids. IEEE Electrical Insulation Magazine 2013, 29, 13–25. [Google Scholar] [CrossRef]
- Devaux, F. The transformation of transformers. A short history of power transformers through the age. Transformers Magazine 2020, 7, 126–131. [Google Scholar]
- CIGRE Technical Brochure 856, “Dielectric performance of insulating liquids for transformers. 2021.
- CIGRE Technical Brochure 967, “Mechanical properties of insulation materials for power transformers. 2025.
- Matharage, S. , Liu Q., Wang Z., et al. Ageing Assessment of a Gas to Liquid Hydrocarbon Transformer Oil Compared with an Inhibited Mineral Oil. International Symposium on High Voltage Engineering (ISH), 2015. [Google Scholar]
- Rozga, P. , Beroual A., Przybylek P., Jaroszewski M. and Strzelecki K. A review on synthetic ester liquids for transformer applications. Energies, 6429; 13. [Google Scholar]
- Rozga, P. , Rao U. M., Fofana I., Beroual A., Calcara L., Pompili M., Wang F., Casserly E., Martin R., Malde J. Next-Generation Ester Dielectric Liquids: Some Key Findings and Perspectives. IEEE Electrical Insulation Magazine, 2024, 40, 23–35. [Google Scholar] [CrossRef]
- Stuchala, F. , Rozga P., Malaczek M., Staniewski J. Comparative analysis of selected insulating liquids including bio-based hydrocarbon and GTL in terms of breakdown and acceleration voltage at negative lightning impulse. IEEE Transactions on Dielectrics and Electrical Insulation, 2024, 31, 2443–2450. [Google Scholar] [CrossRef]
- Stuchala, F. , Rozga P. Comprehensive Comparison of Lightning Properties of Insulating Liquids in Relation to Mineral Oil Under Positive Lightning Impulse. Energies, 2025, 18, 2381. [Google Scholar] [CrossRef]
- Lundgaard L., E. , Linhjell D., Berg G., Sigmond S. Propagation of positive and negative streamers in oil with and without pressboard interfaces. IEEE Transactions on Dielectrics and Electrical Insulation, 5.
- Lesaint, O. , Massala G. Transition to fast streamers in mineral oil in the presence of insulating solids. IEEE International Symposium on Electrical Insulation, 1996. [Google Scholar]
- Liu, Q. , Wang Z.D. Streamer characteristic and breakdown in synthetic and natural ester transformer liquids with pressboard interface under lightning impulse voltage. IEEE Transactions on Dielectrics and Electrical Insulation, 2011, 18, 1908–1917. [Google Scholar] [CrossRef]
- Rozga, P. , Stuchala F., Pasternak B., Binek M. Comparison of negative streamer development in synthetic ester and mineral oil in a point-sphere gap divided by a pressboard barrier. Journal of Electrostatics, 2023, 125, 103839. [Google Scholar] [CrossRef]
- Rozga, P. , Stuchala F., Hantsz D., Wang F., Shen Z., Li J. Behavior of positive streamers in ester liquids and mineral oil in a non-uniform field with and without insulating pressboard barrier. International Conference on Electrical Materials and Power Equipment (ICEMPE), 2021. [Google Scholar]
- Frotscher, R. , Vukovic D., Jovalekic M., Tenbohlen S., Harthun J., Perrier C., Schäfer M. Behaviour of ester liquids under dielectric and thermal stress-from laboratory testing to practical use. CIGRE Paris 2012 – Paper D1-105_2012.
- Scatiggio, F. , Frotscher R., Chittaro C., Ferrari F., Campi G., Giro D., Lombini L. Design of Natural Ester Filled Transformers for Demanding Furnace Applications” CIGRE Paris 2024 - Paper A2 10351.
- Lu, W. , Liu Q. and Wang Z.D. Gelling behaviour of natural ester transformer liquid under thermal ageing. International Conference on High Voltage Engineering and Applications, 2012. [Google Scholar]
- Kweon, D. , Koo K., Woo J., Kim Y. Hot spot temperature for 154 kV transformer filled with mineral oil and natural ester fluid. IEEE Transactions on Dielectrics and Electrical Insulation, 2012, 19, 1013–1020. [Google Scholar] [CrossRef]
- Mahanta, D.K. , Laskar S., "Electrical insulating liquid: A review. Journal of Advanced Dielectrics, 1730. [Google Scholar]
- Wang, Z.D.; et al. , "Ester insulating liquids for power transformers," 44th International Conference on Large High Voltage Electric Systems, Paris, France, 2012.
- CIGRE Technical Brochure 436, “Experiences in Service With New Insulating Liquids. 2010.
- Product Data Sheet—Nytro Bio 300x, NYNAS, 2020.
- Rozga, P. , Stuchala F., Pahlavanpour B., Wolmarans C. Lightning Impulse Breakdown Characteristics of a Bio-Based Hydrocarbon and Other Insulating Liquids under Positive Polarity. IEEE International Conference on Dielectric Liquids (ICDL, 2022. [Google Scholar]
- Zukowski, P. , et al. “Research on the Influence of Moisture in the Solid Insulation Impregnated with an Innovative Bio-Oil on AC Conductivity Used in the Power Transformers. Energies, 2024, 17, 5164. [Google Scholar] [CrossRef]
- Lu, W. , Liu Q., Wang Z.D., Smith P.W.R. Lightning impulse breakdown performance of an inhibited gas-to-liquid (GTL) hydrocarbon transformer oil. International Conference on Dielectric Liquids (ICDL), 2014. [Google Scholar]
- Stuchala, F. , Rozga P. Comparative Analysis of Lightning Properties of Selected GTL based Dielectric Liquids under Positive Lightning Impulse. IEEE Electrical Insulation Conference (EIC), 2023. [Google Scholar]
- Fadillah, A. , et al. Evaluating the Insulating Performance of Natural Ester Oil in Comparison to Mineral Oil and GTL Oil for Transformer. International Conference on Power Engineering and Renewable Energy (ICPERE), 2024. [Google Scholar]
- Vuković, D. , Milone, M., Hjortstam, O., et al. Experimental Discharge Initiation Study for Paper and Pressboard Insulated Electrodes in Mineral Oil and Synthetic Ester Fluid. IEEE International Conference on Dielectric Liquids (ICDL), 2019. [Google Scholar]
- Rao, U.M. , Fofana I., Beroual A., et al. A review on pre-breakdown phenomena in ester fluids: Prepared by the international study group of IEEE DEIS liquid dielectrics technical committee. IEEE Transactions on Dielectrics and Electrical Insulation, 2020, 27, 1546–1560. [Google Scholar] [CrossRef]
- Liu, Q. , Wang Z. D. Streamer characteristic and breakdown in synthetic and natural ester transformer liquids under standard lightning impulse voltage. IEEE Transactions on Dielectrics and Electrical Insulation, 2011, 18, 1908–1917. [Google Scholar] [CrossRef]
- Pompili, M. , Calcara L., Rozga P. , Stuchala F. An Extension of the Standard Based Approach in the Assessment of Liquid Dielectrics Behaviour” IEEE Transactions on Dielectrics and Electrical Insulation, 2023, 30, 1616–1622. [Google Scholar]
- Krempel GmbH &, CO. , Test report - EN 10 204-2.2.
- IEC 60897: 1987 “Methods for the determination of the lightning breakdown voltage of insulating liquids”.
- IEC 60641-2: 2004 “Pressboard and presspaper for electrical purposes - Part 2: Methods of tests”.
- Rozga, P. Using the three-parameter Weibull distribution in assessment of threshold strength of pressboard impregnated by different liquid dielectrics. IET Science, Measurement and Technology, 2016, 10, 665–670. [Google Scholar] [CrossRef]
- IEC 60156: 2018 “Insulating liquids - Determination of the breakdown voltage at power frequency - Test method”.
Figure 2.
Electrode system, where: 1 - high-voltage point electrode; 2 – grounded sphere electrode.
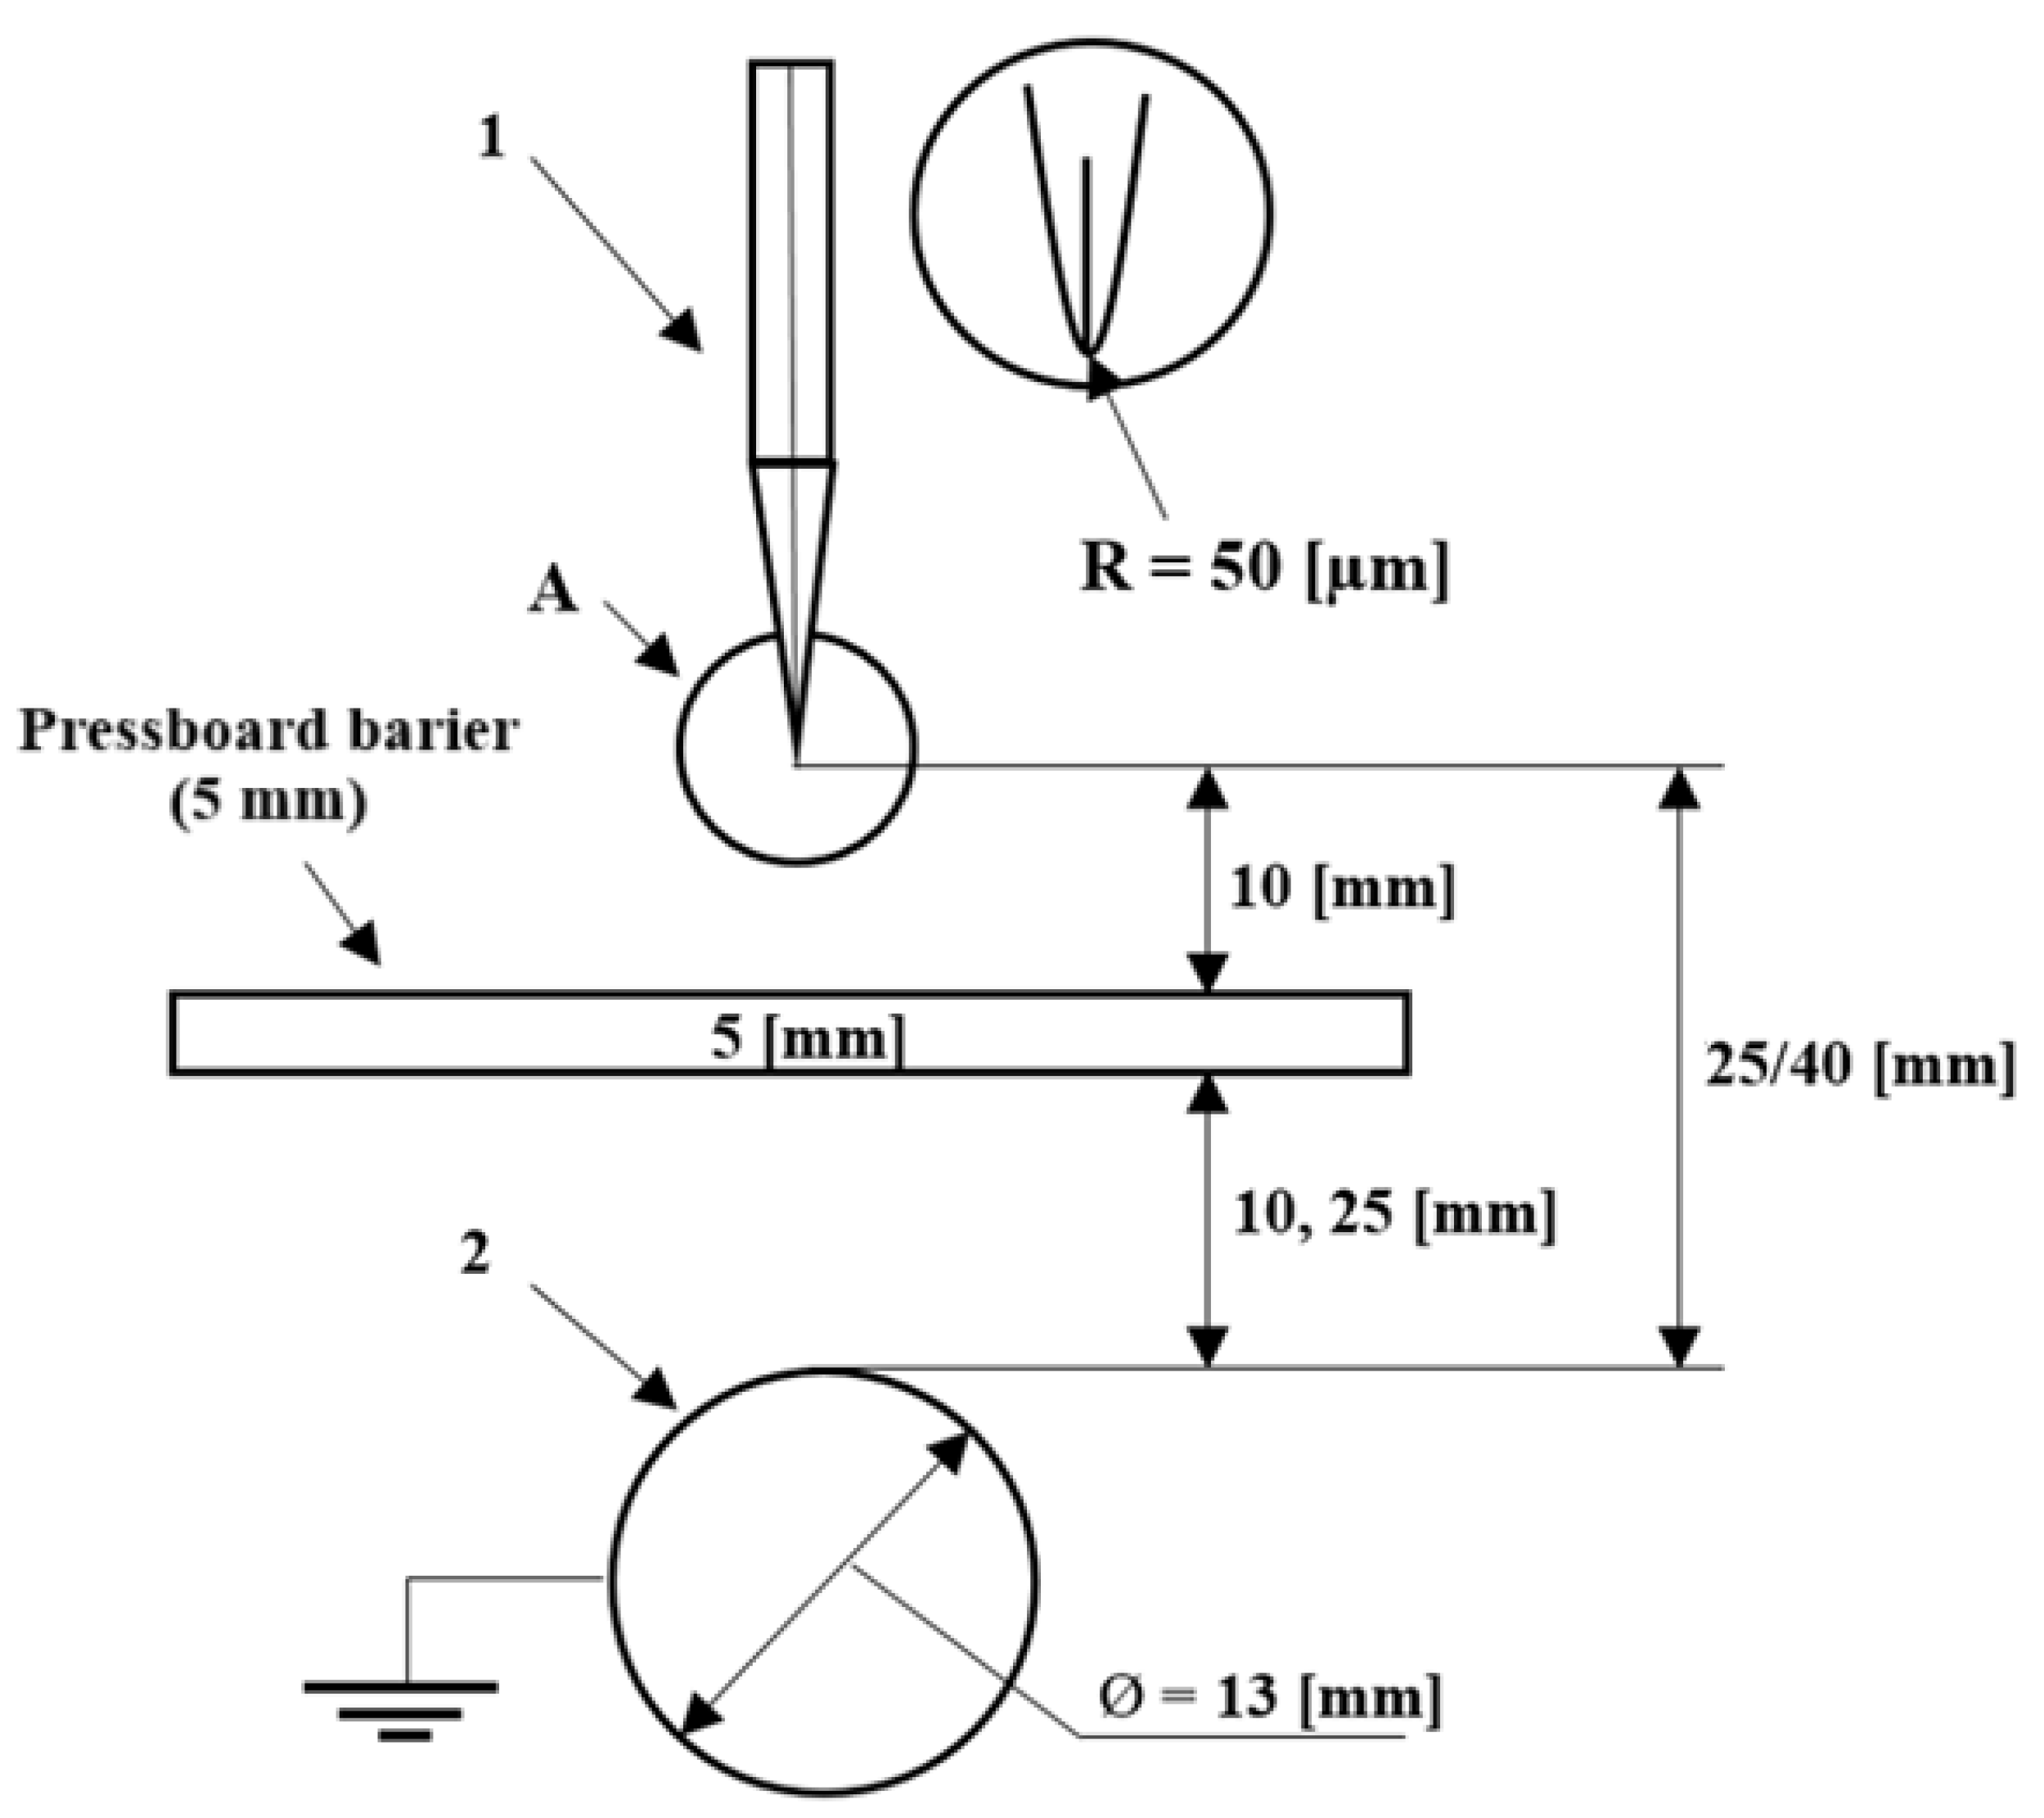
Figure 3.
Graphical representation of obtained average values of LIBV for the cases with and without the barrier at the 25 mm gap distance and negative polarity.
Figure 3.
Graphical representation of obtained average values of LIBV for the cases with and without the barrier at the 25 mm gap distance and negative polarity.
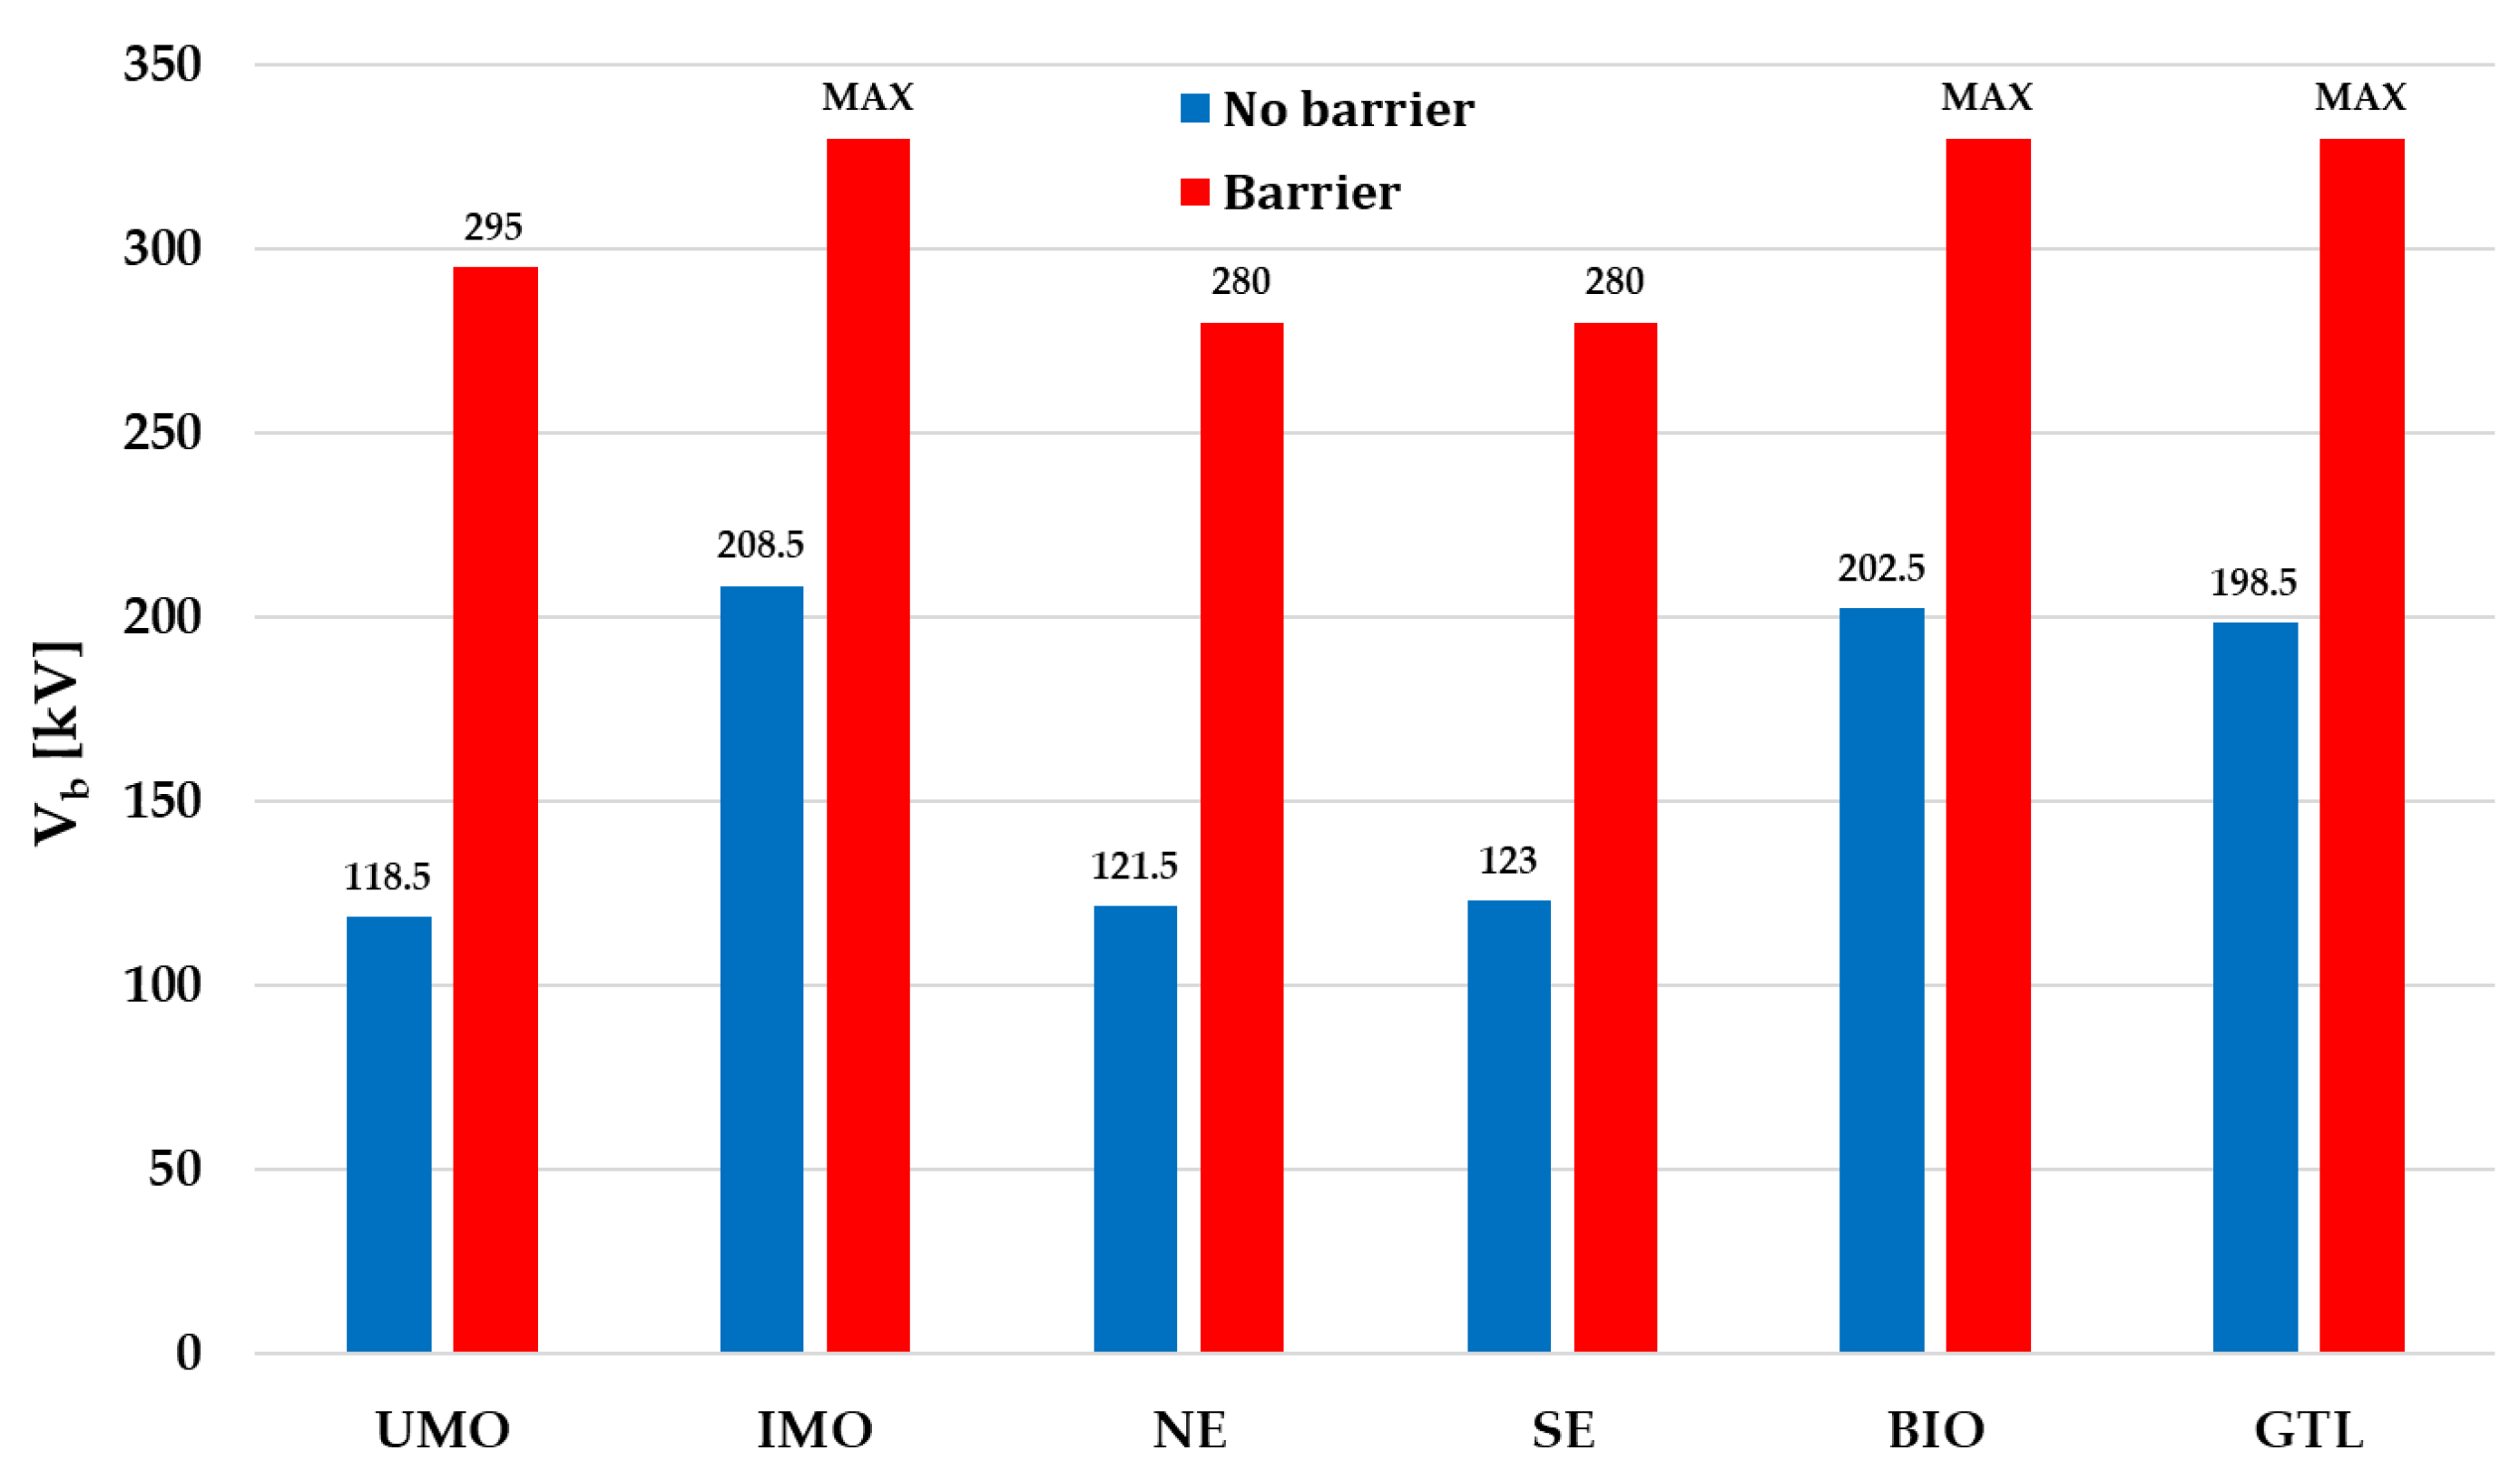
Figure 4.
Graphical representation of obtained average values of LIBV for the cases with and without the barrier at the 40 mm gap distance and negative polarity.
Figure 4.
Graphical representation of obtained average values of LIBV for the cases with and without the barrier at the 40 mm gap distance and negative polarity.
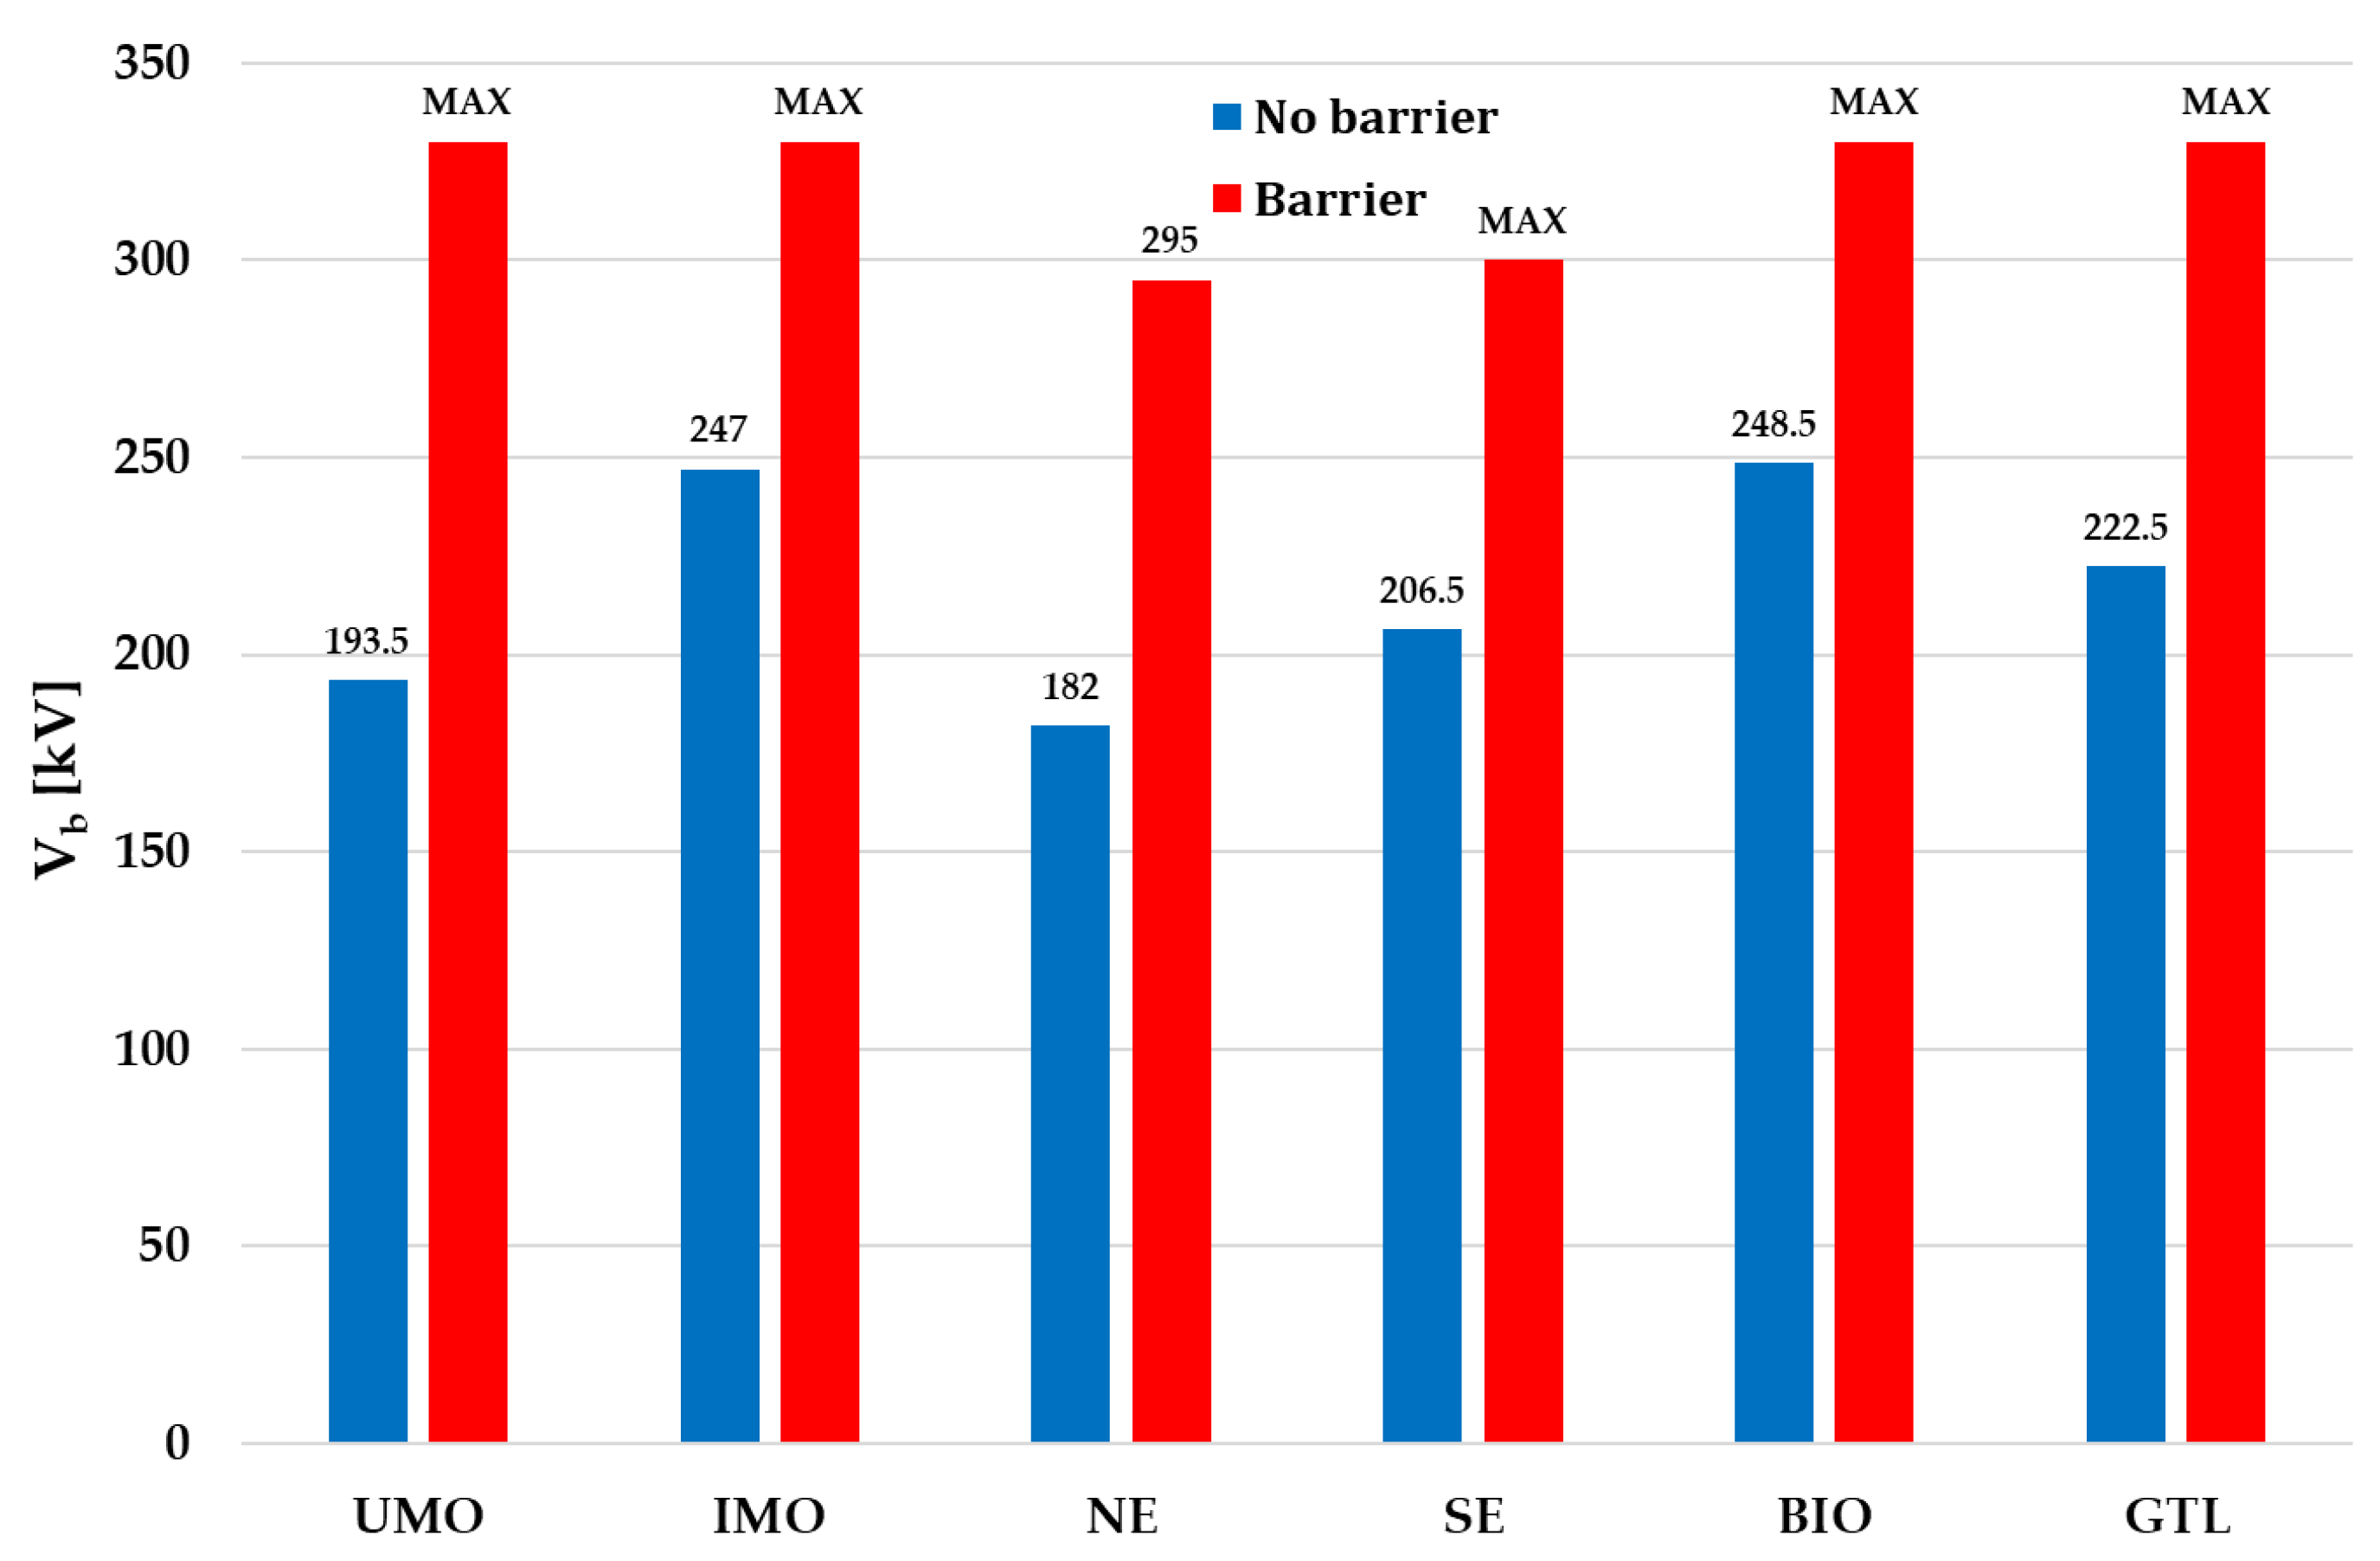
Figure 5.
Sequence of oscillograms for UMO, with a distance between electrodes of 25 mm under a negative lightning impulse voltage; 1 (blue) – voltage waveform, 2 (red) – waveform representing light caught between HV point and barrier, 3 (green) – – waveform representing light caught between barrier and grounded sphere electrode; time base: 4 µs/div, volts/div: 100 kV, where: a) 280 kV, b) 285 kV, c) 290 kV, d) 295 kV – breakdown.
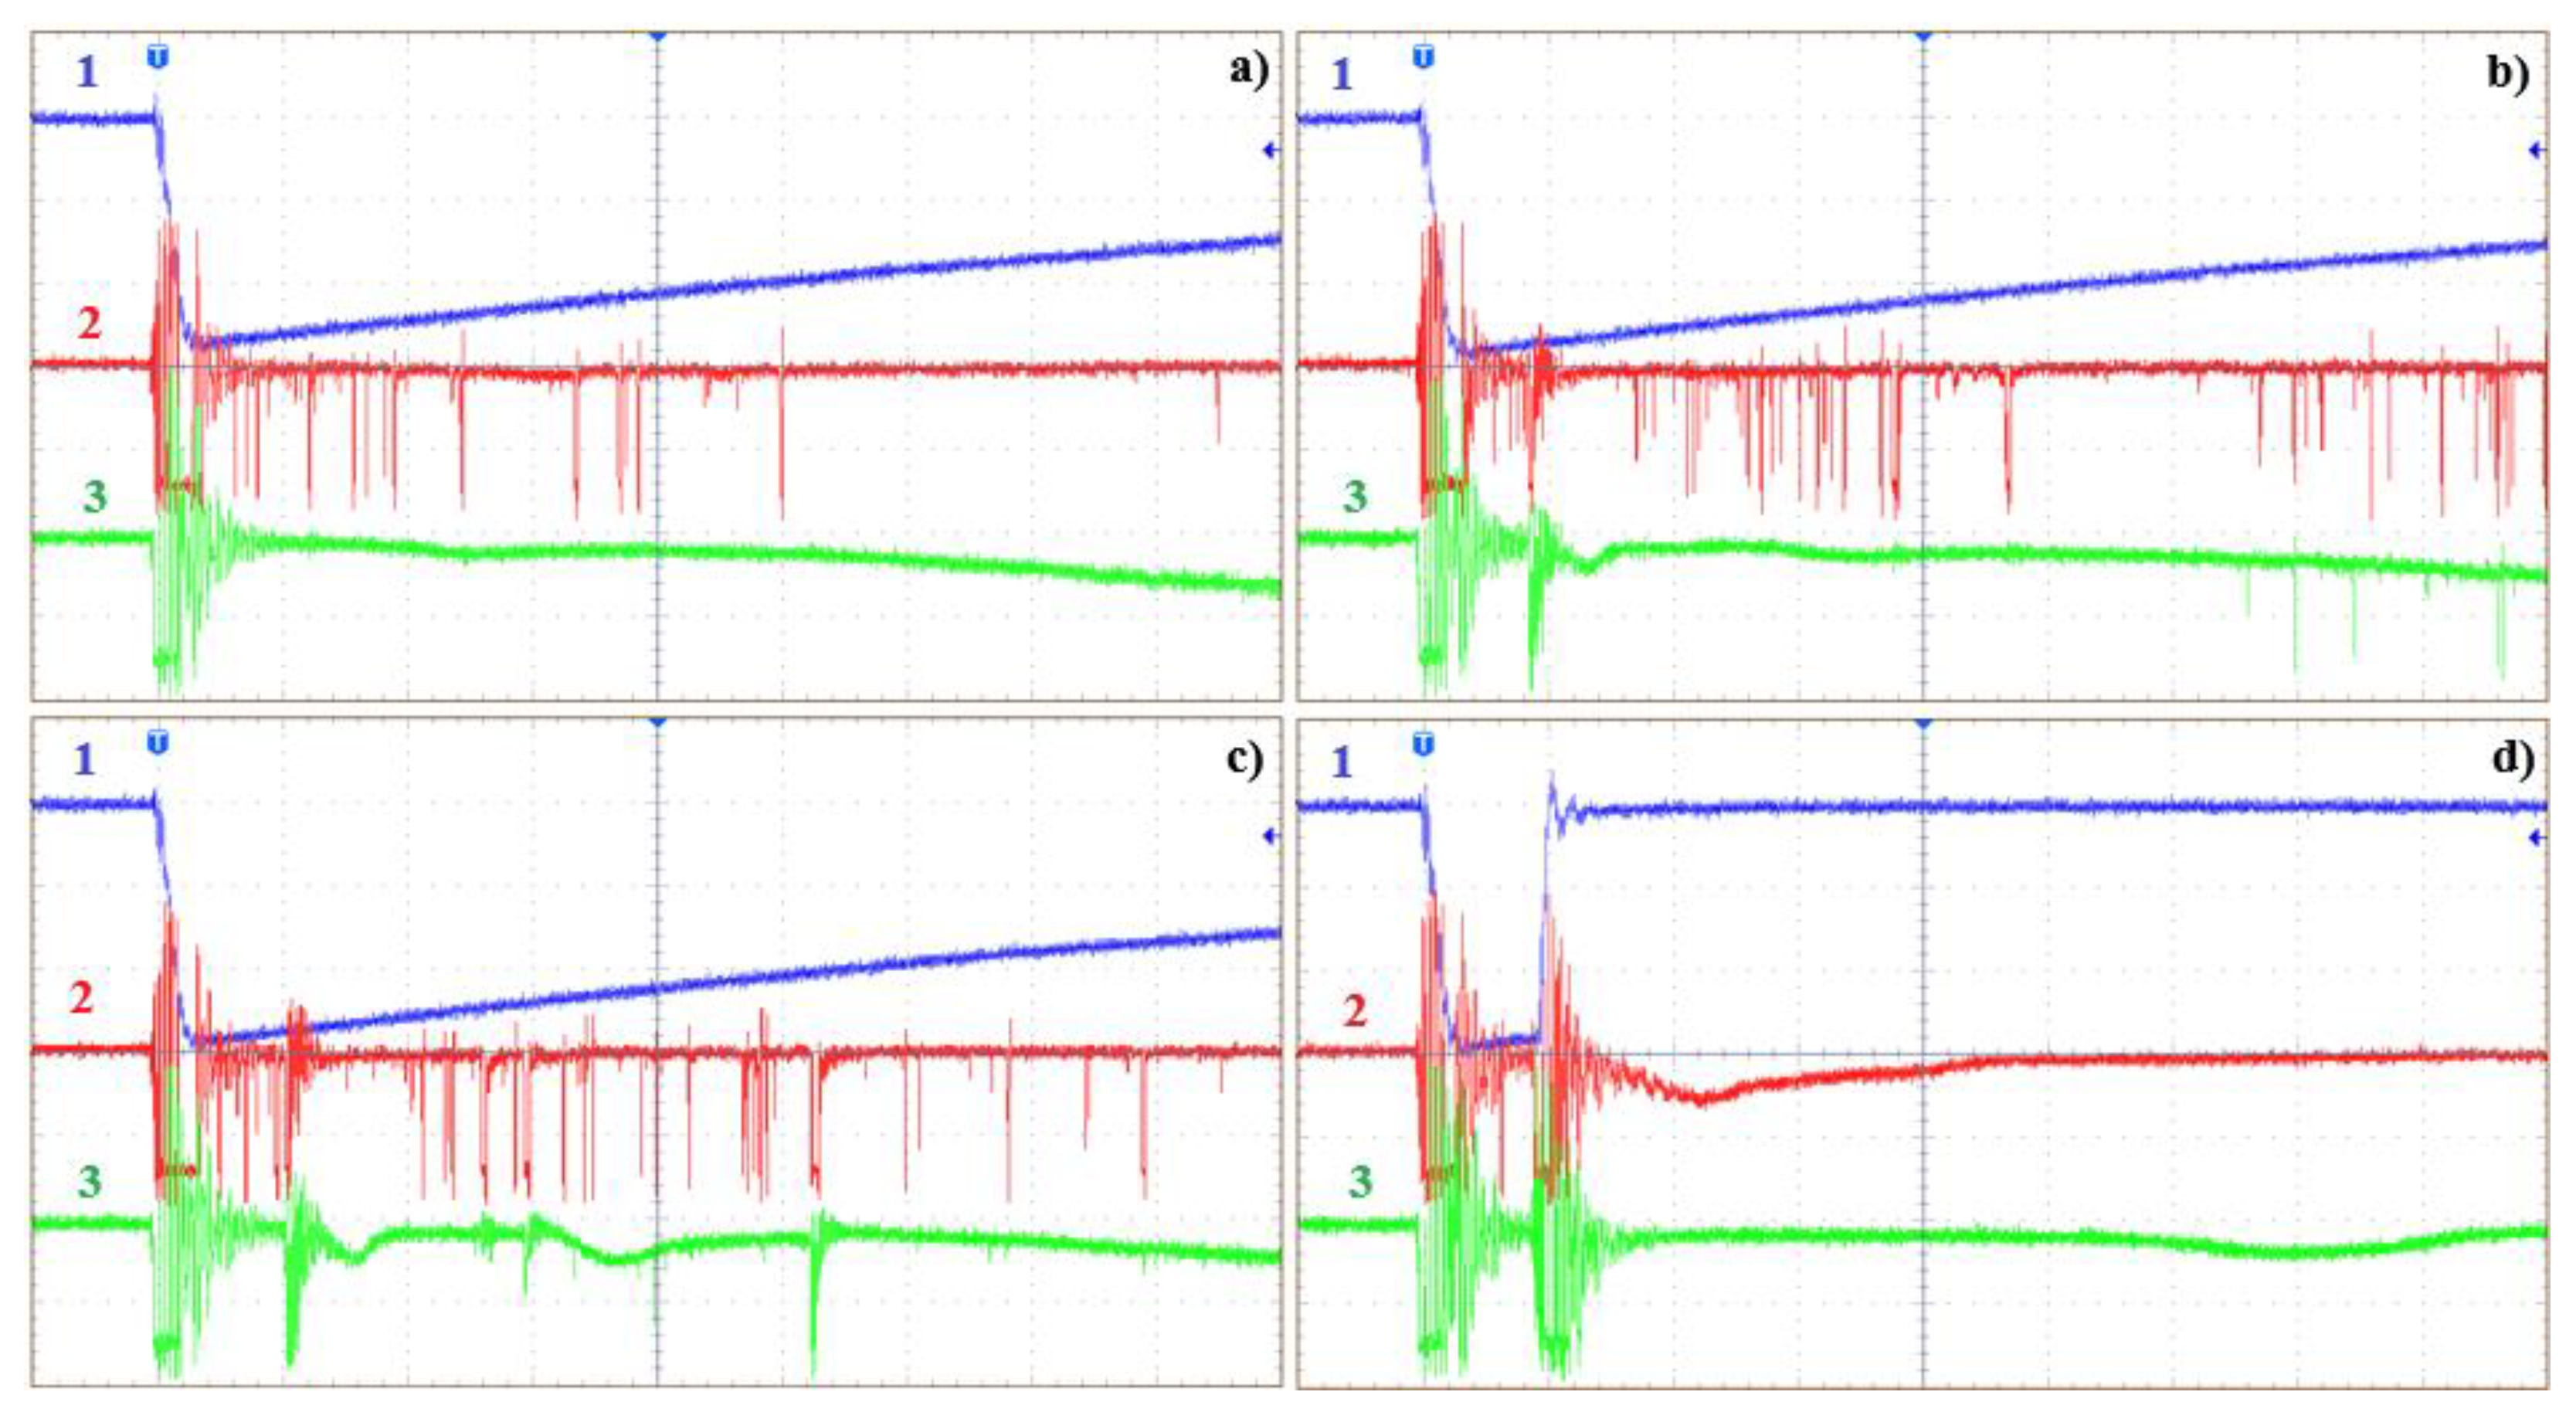
Figure 6.
Example photos of discharges in point to sphere electrode system with a pressboard barrier, where: a) discharge develops between HV point and barrier, b) discharge develops on both sides of barrier, c) breakdown.
Figure 6.
Example photos of discharges in point to sphere electrode system with a pressboard barrier, where: a) discharge develops between HV point and barrier, b) discharge develops on both sides of barrier, c) breakdown.
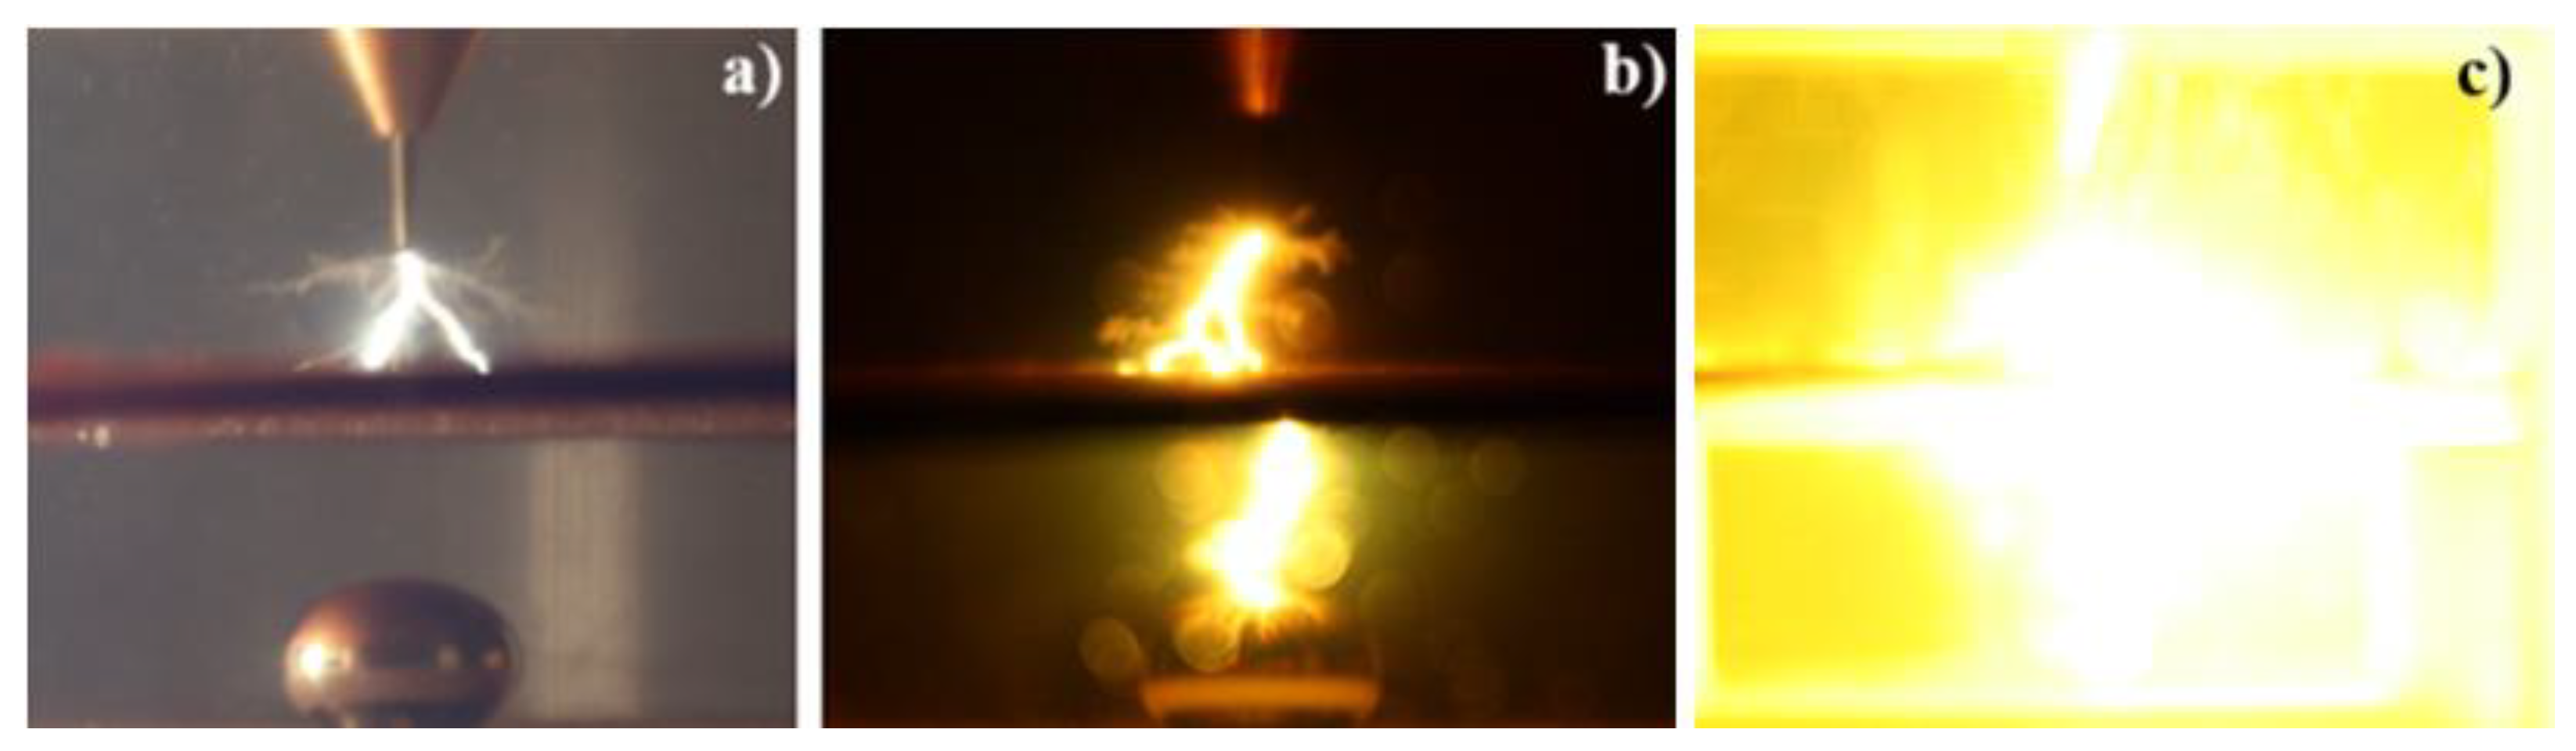
Figure 7.
Graphical representation of obtained average values of LIBV for the cases with and without the barrier at the 25 mm gap distance and positive polarity.
Figure 7.
Graphical representation of obtained average values of LIBV for the cases with and without the barrier at the 25 mm gap distance and positive polarity.
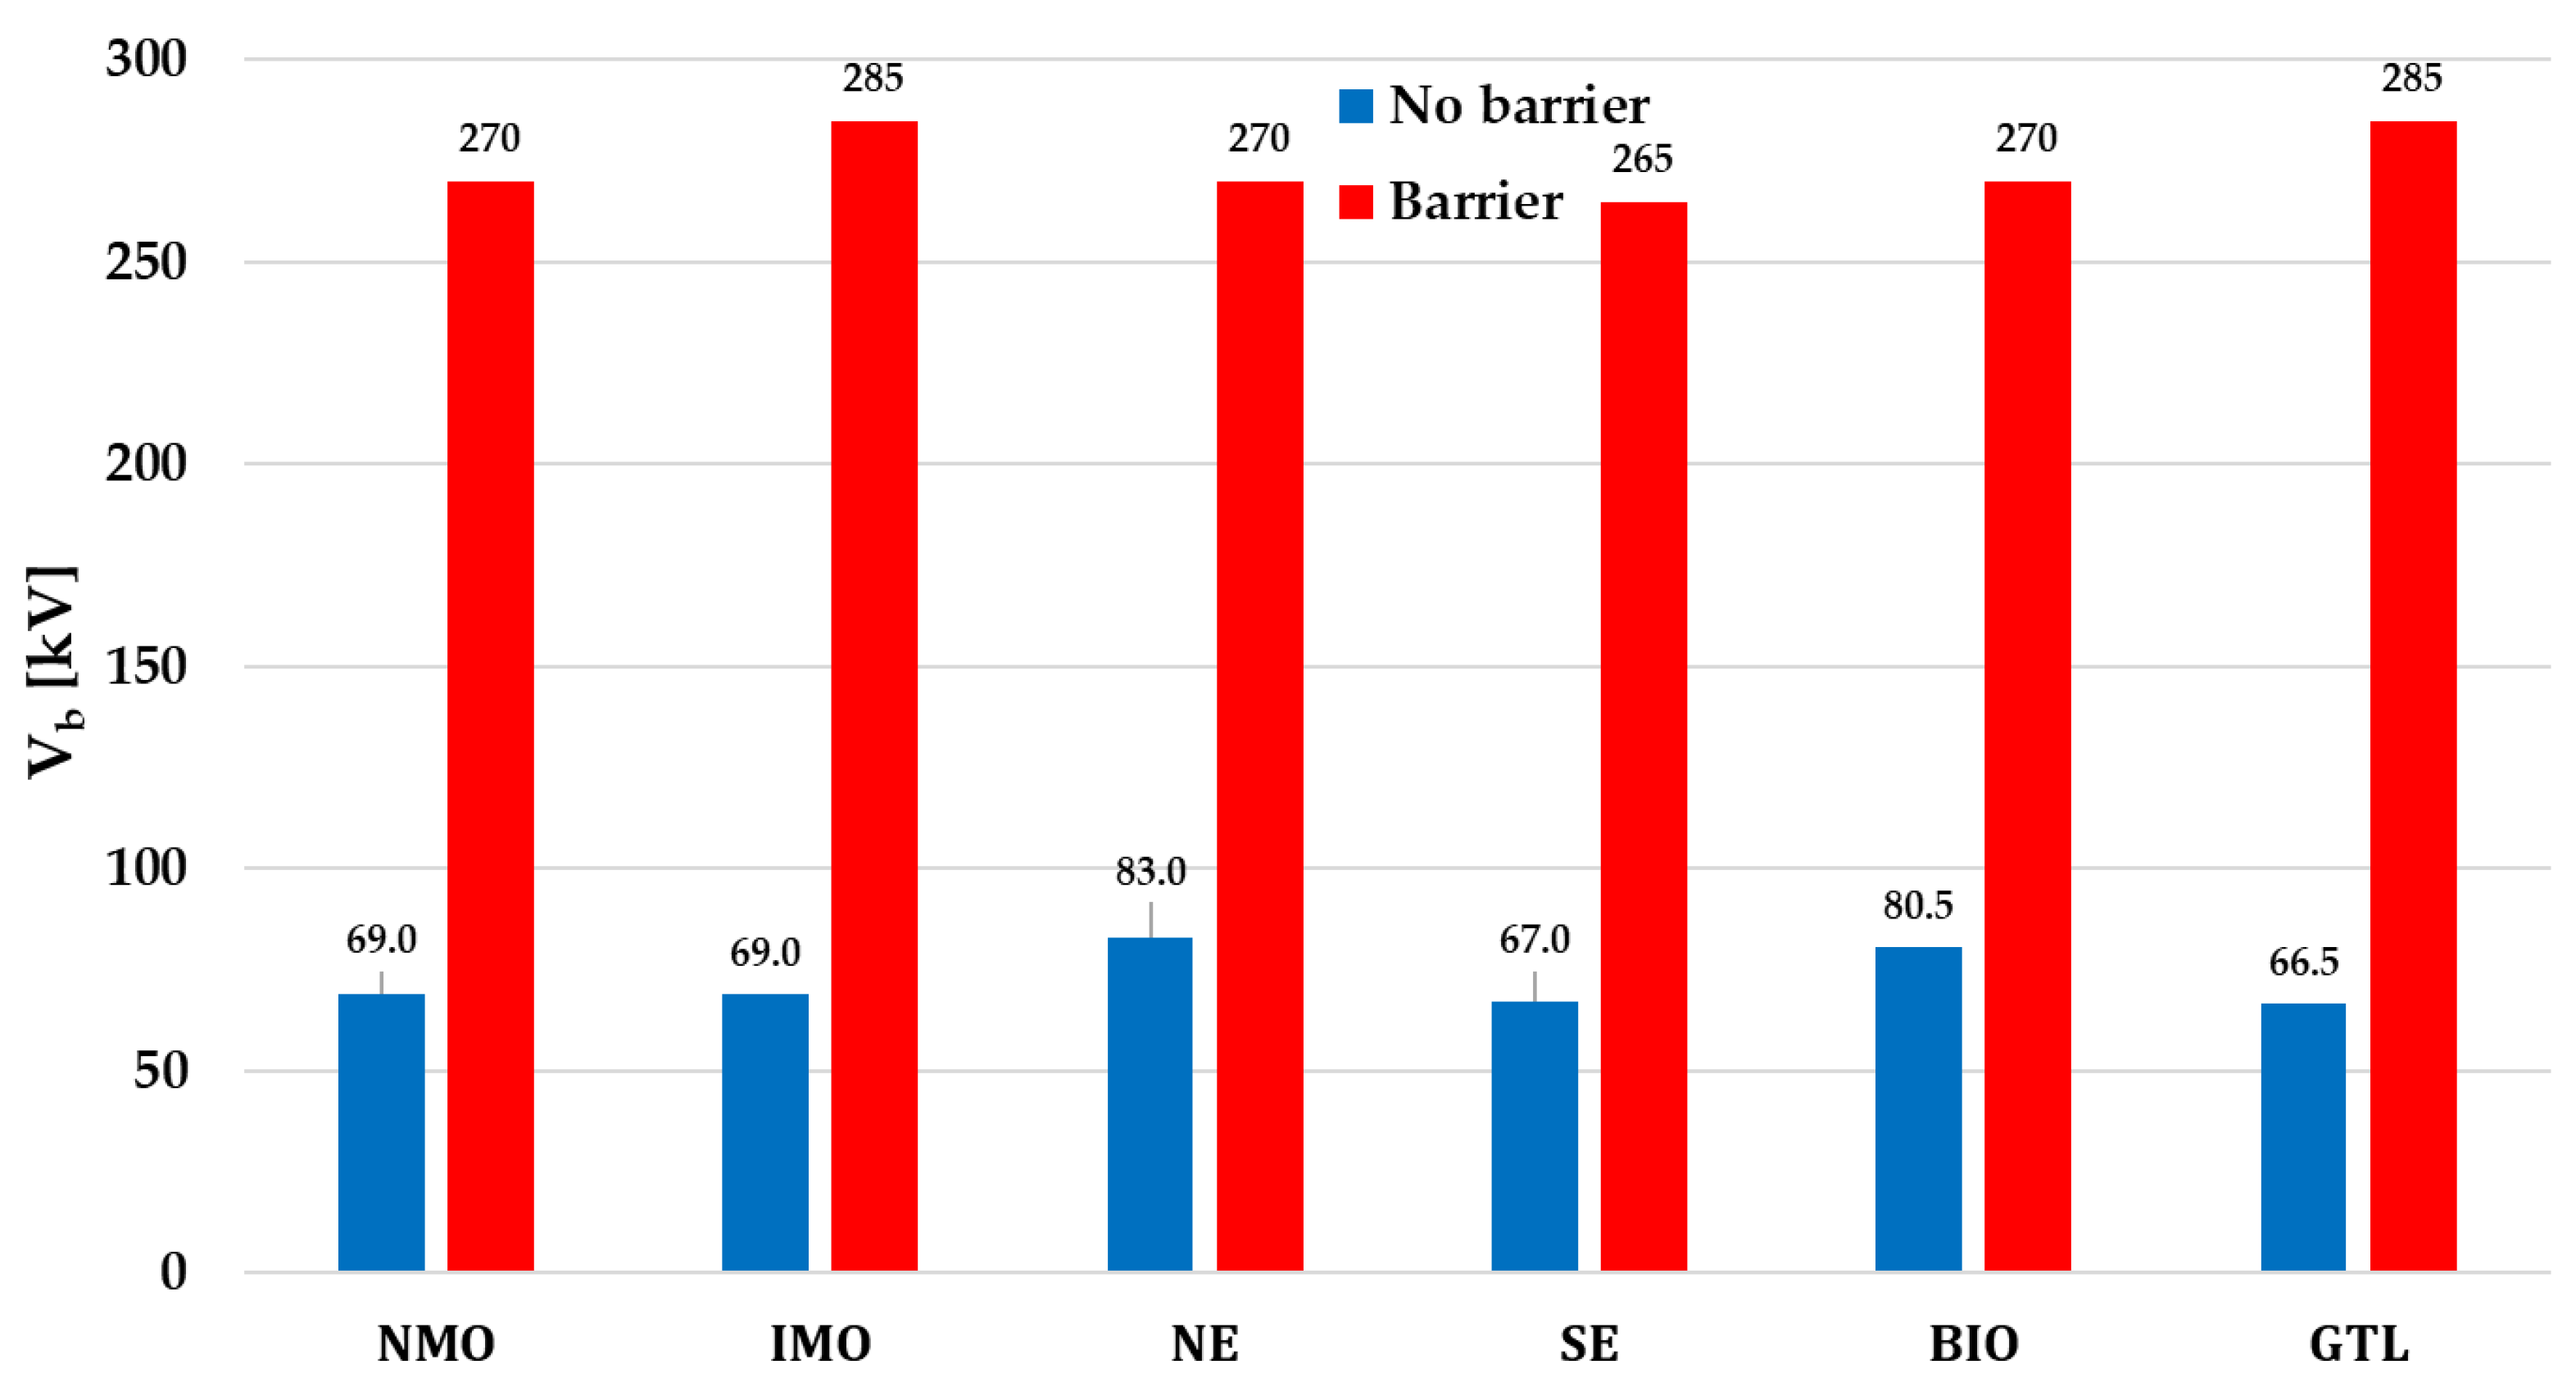
Figure 8.
Graphical representation of obtained average values of LIBV for the cases with and without the barrier at the 40 mm gap distance and positive polarity.
Figure 8.
Graphical representation of obtained average values of LIBV for the cases with and without the barrier at the 40 mm gap distance and positive polarity.
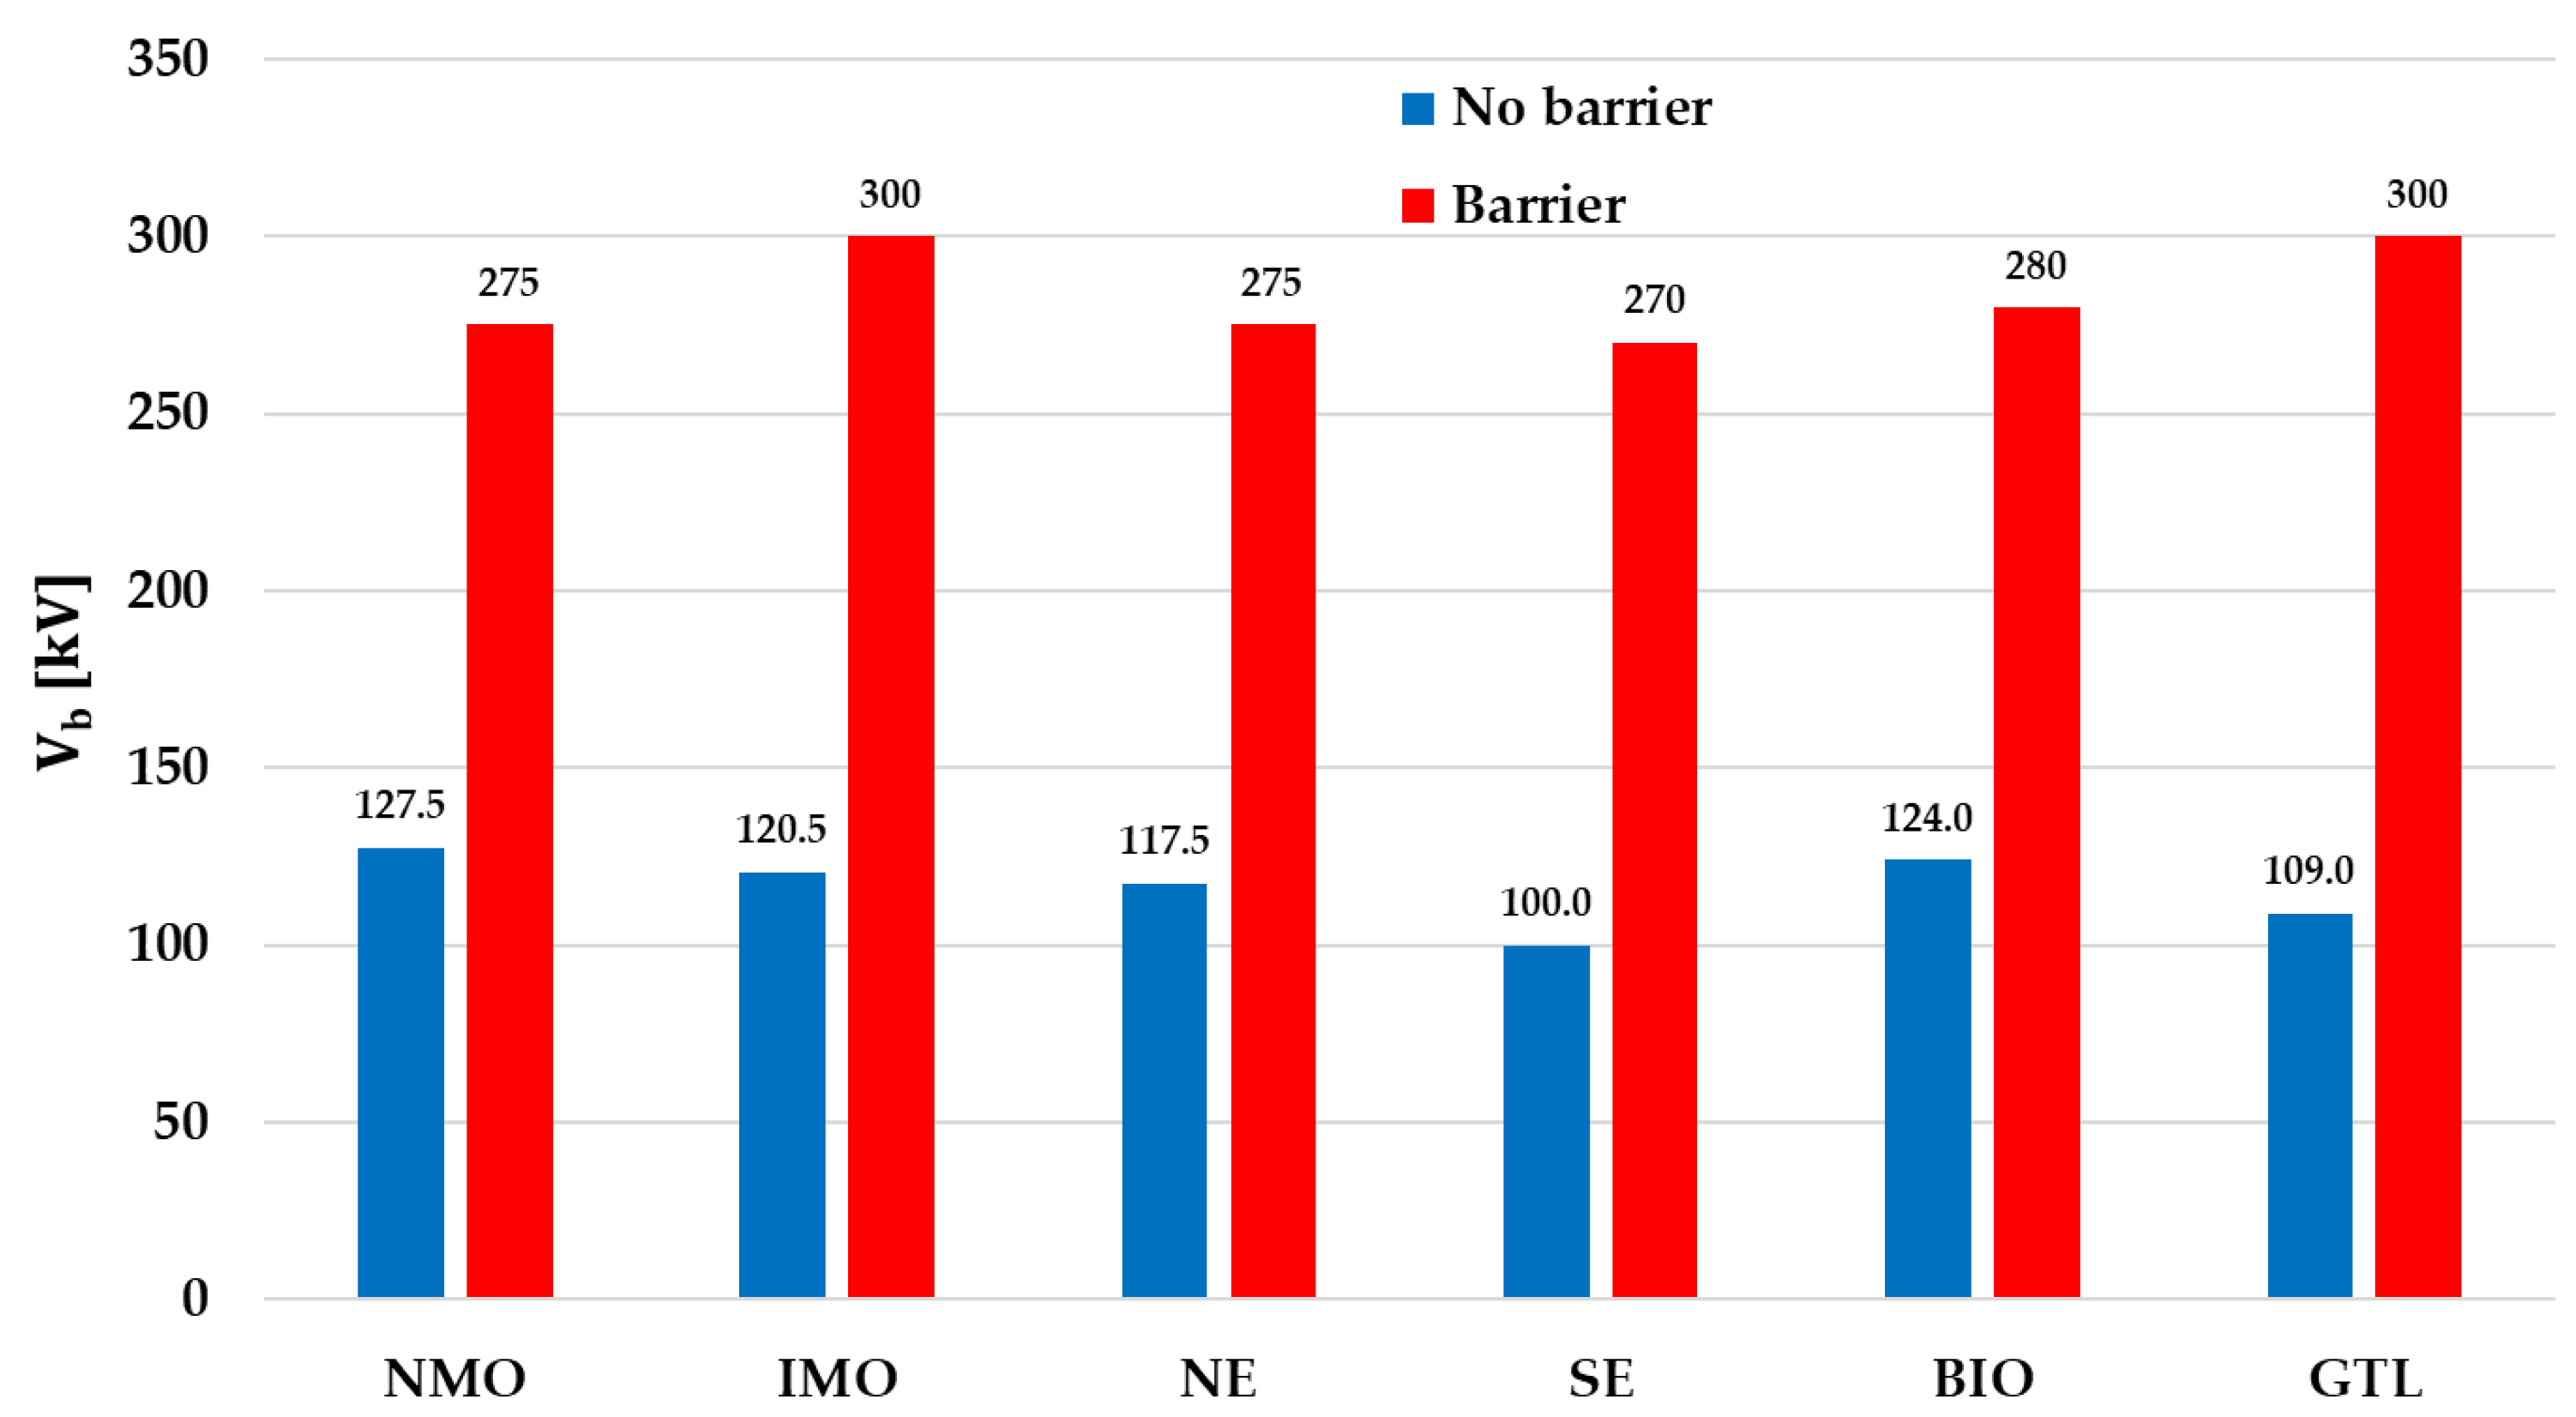
Figure 9.
Sequence of oscillograms for UMO, with a distance between electrodes of 25 mm under a positive lightning impulse voltage, 1 (blue) – voltage waveform, 2 (red) – waveform representing light caught between HV point and barrier, 3 (green) – – waveform representing light caught between barrier and grounded sphere electrode; time base: 4 µs/div, volts/div: 100 kV, where: a) 255 kV, b) 260 kV, c) 265 kV, d) 270 kV – breakdown.
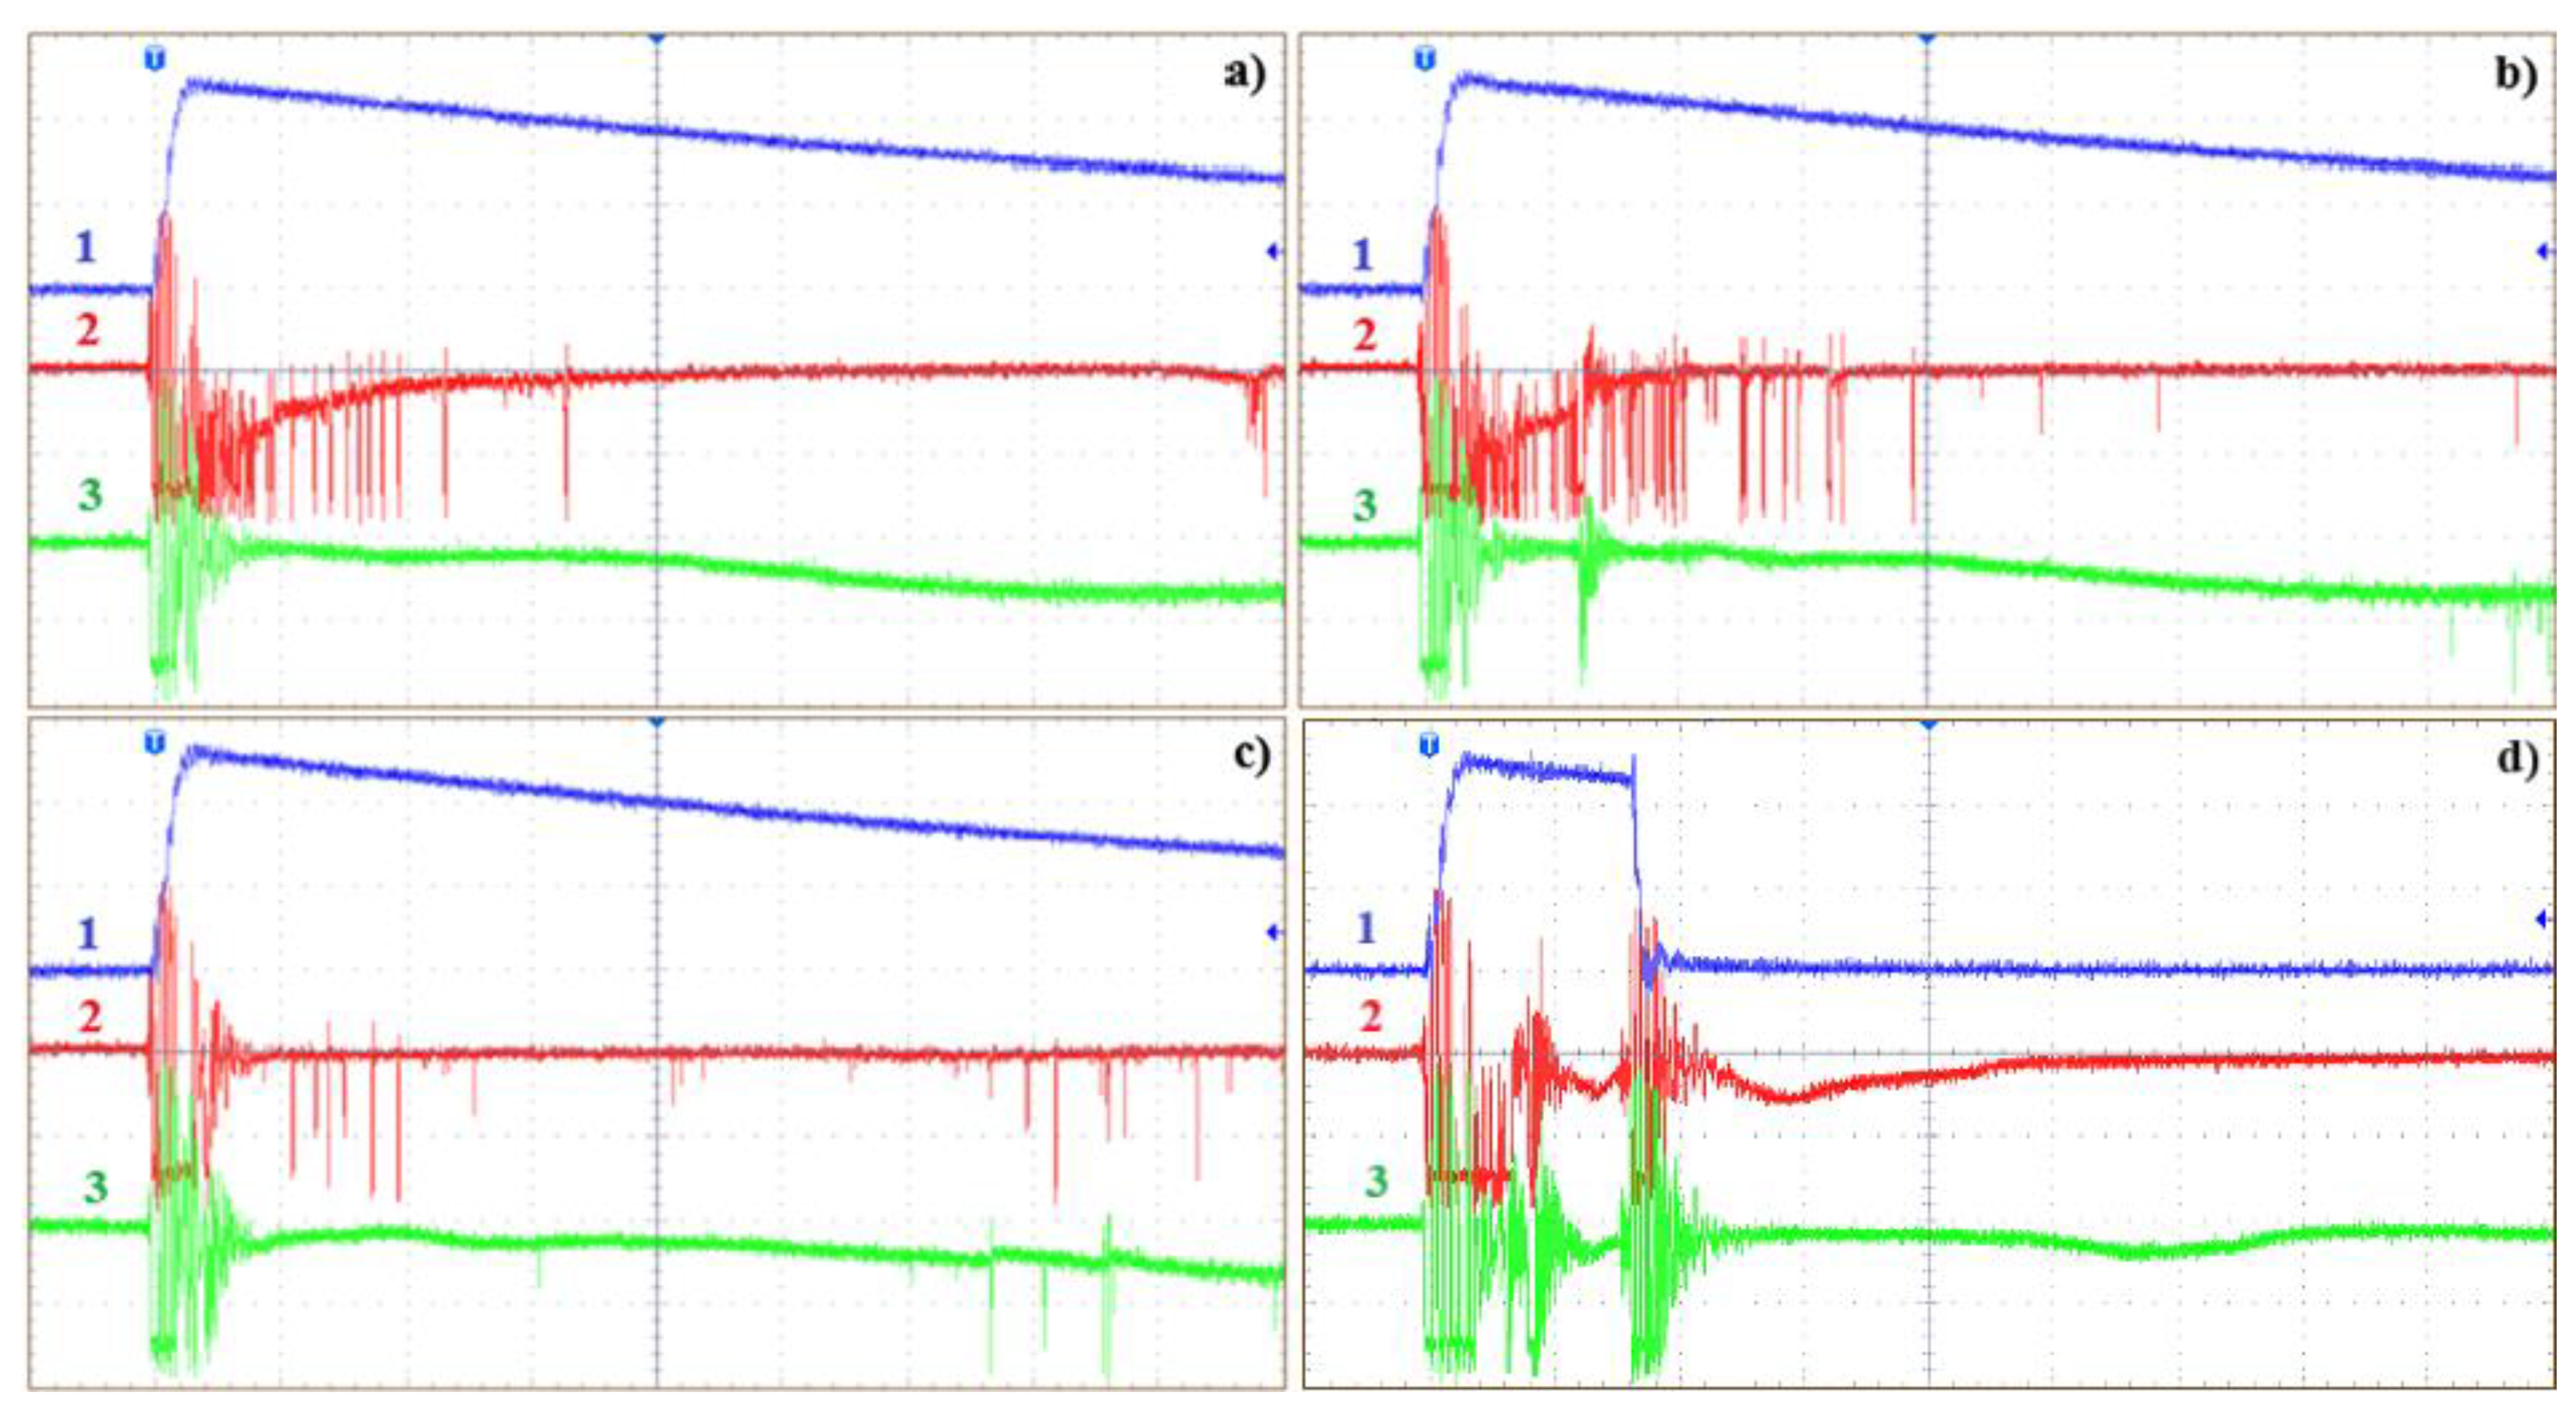
Figure 10.
Oscillograms for the acceleration voltage (a and c) and system with pressboard barrier (b, d), 25 mm under negative lightning impulse voltage, 1 (blue) – voltage waveform, 2 (red) – waveform representing light caught between HV point and barrier, 3 (green) – waveform representing light caught between barrier and grounded sphere electrode, 2.1 (red) – light waveform in a system without a barrier; time base: 4 µs/div, volts/div: 100 kV, where: a) NE - 185 kV kV, b) NE - 185 kV, c) SE - 180 kV, d) SE - 180 kV.
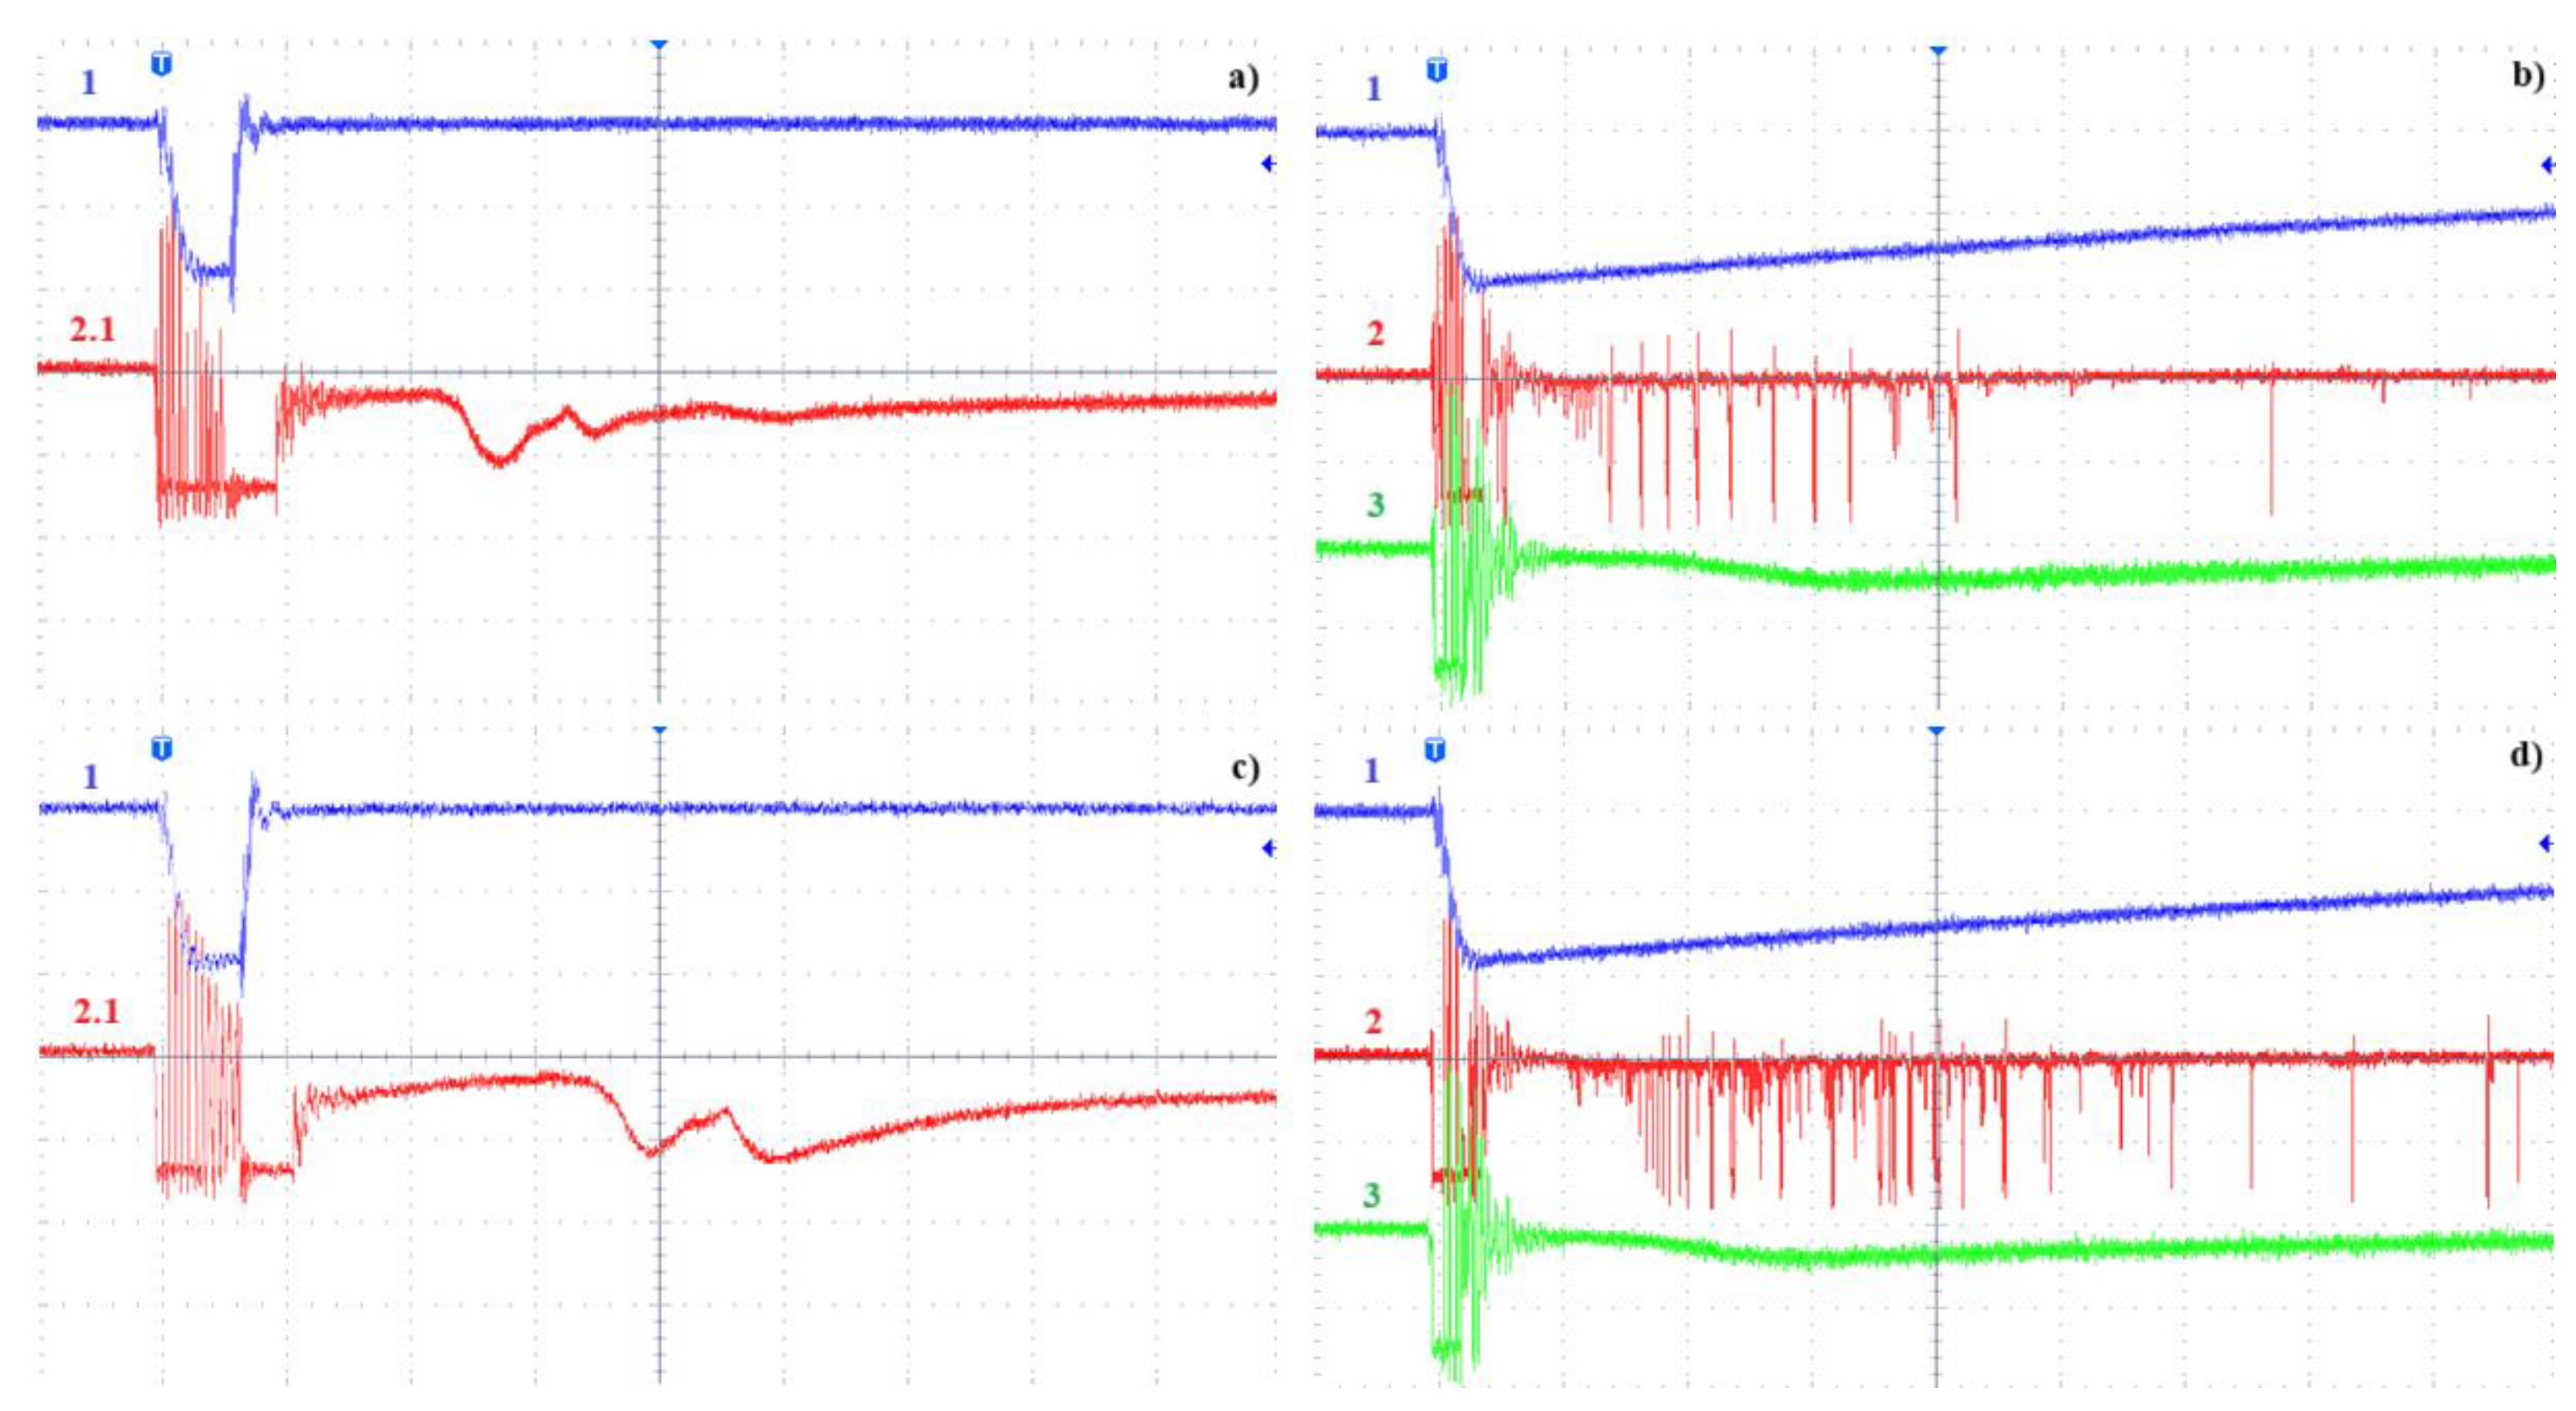
Figure 11.
Oscillograms for the acceleration voltage (a and c) and system with pressboard barrier (b, d), 25 mm under positive lightning impulse voltage, 1 (blue) – voltage waveform, 2 (red) – waveform representing light caught between HV point and barrier, 3 (green) – waveform representing light caught between barrier and grounded sphere electrode, 2.1 (red) – light waveform in a system without a barrier; time base: 4 µs/div, volts/div: 100 kV (for a, b, d) volts/div: 50 kV (for c), where: a) NE - 145 kV kV, b) NE - 150 kV, c) SE - 95 kV, d) SE - 150 kV.
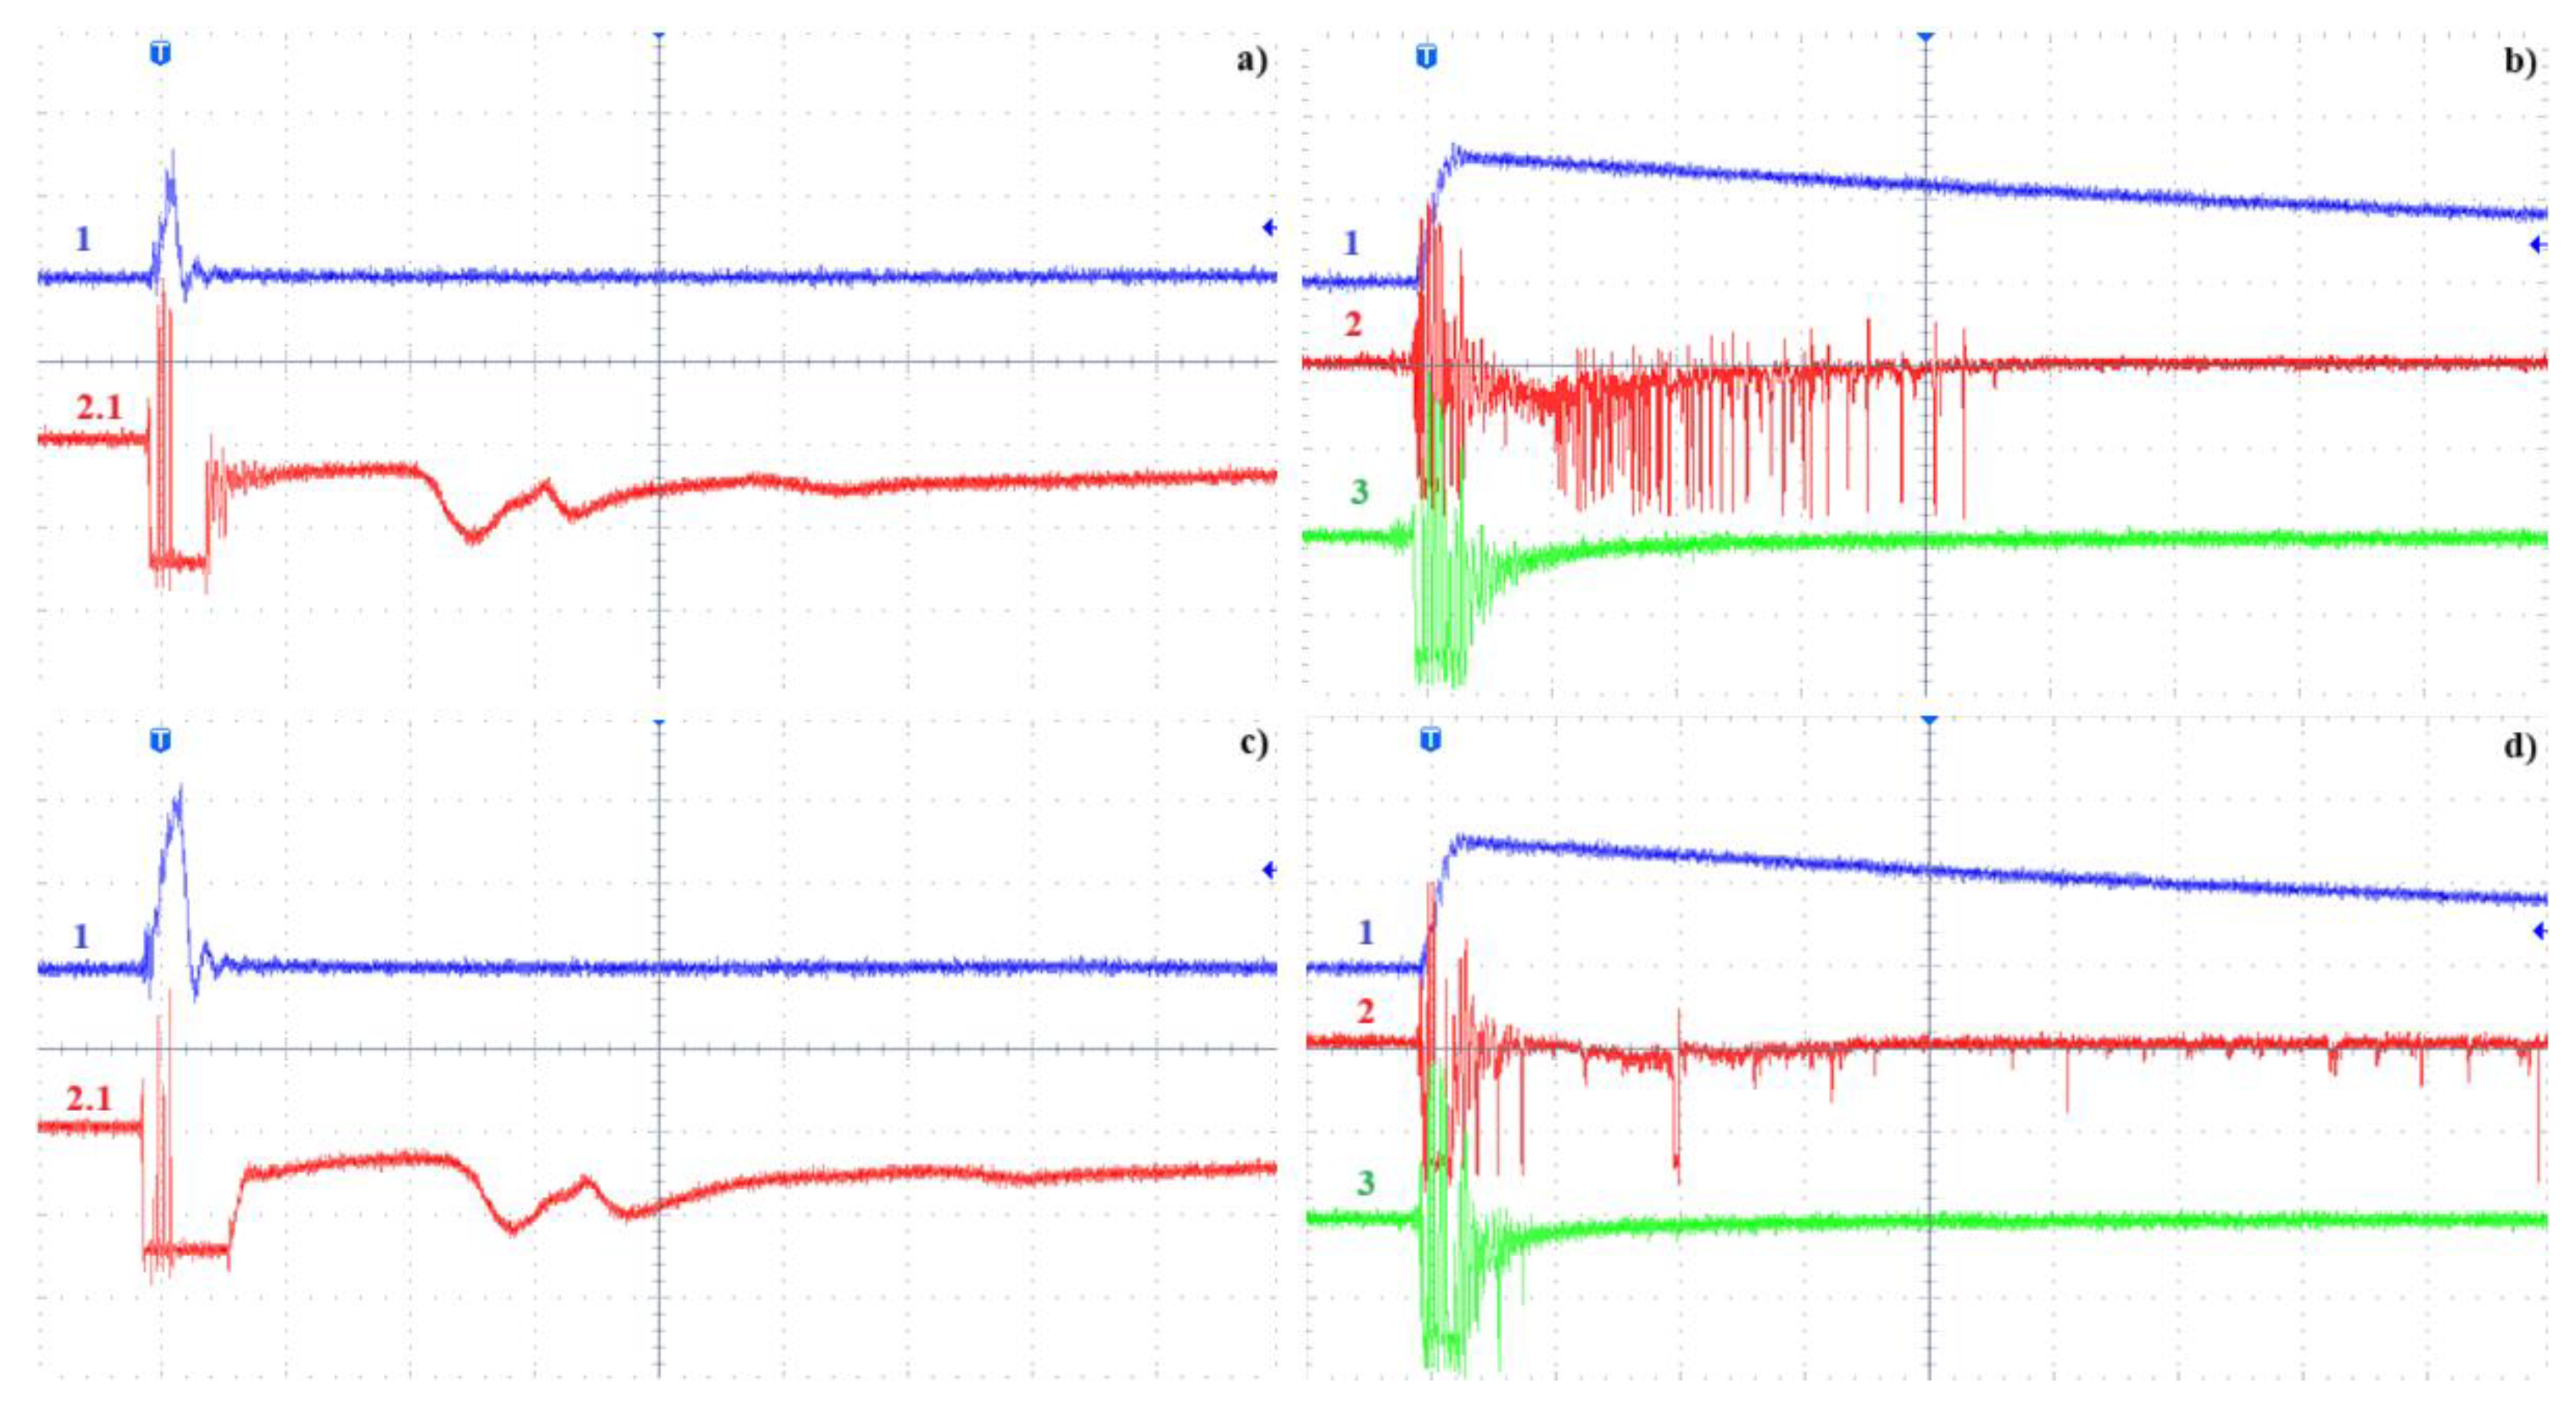

Table 1.
Selected parameters of tested liquids.
| Chemical Family | UMO – Complex Mixture of Hydrocarbons |
IMO – Complex Mixture of Hydrocarbons |
NE - Ester (Triglycerides, soybean) |
SE - Ester (Pentaerythritol Based) |
BIO – Hydrocarbon (Iso-Alkane) |
GTL – Hydrocarbon (Iso-paraffinic) |
|---|---|---|---|---|---|---|
| Density at 20 °C [kg/dm3] (ISO 12185) |
0.88 | 0.87 | 0.92 | 0.97 | 0.78 | 0.8 |
| Viscosity at 40 °C [mm2/s] (ISO 3104) |
11 | 7.8 | 32 | 29 | 3.7 | 9,7 |
| Flash point [°C] (ISO 2719) |
146 | 146 | 320 | 260 | 145 | 191 |
| Pour point [°C] (ISO 3016) |
-50 | -63 | -23 | -56 | -63 | -41 |
| Biodegradability (OECD 301) |
Inherently Biodegradable |
Inherently Biodegradable |
Readily Biodegradable |
Readily Biodegradable |
Readily Biodegradable |
Readily Biodegradable |
| Bio-Based Carbon Content [%] (ASTM D6866) |
0 | 0 | ≈97 | ≈ >50 | 99 | 0 |
| Relative Permittivity at 90°C [-] (IEC 60247) |
2.2 | 2.2 | 3.1 | 3.2 | 1.99 | 2.03 |
Table 2.
Specifications of the pressboard used during tests [32].
Table 2.
Specifications of the pressboard used during tests [32].
| Properties | Unit | Test procedure | Test results from current factory run |
|---|---|---|---|
| Thickness | mm | IEC 60641-2 | 4.99 |
| Density | kg/dm3 | IEC 60641-2 | 1.22 |
| Tensile strength MD | MPa | IEC 60641-2 | 101 |
| Tensile strength TP | MPa | IEC 60641-2 | 83 |
| Shrinkage MD | % | IEC 60641-2 | 9.1 |
| Shrinkage TP | % | IEC 60641-2 | 10.5 |
| Dielectric strength in air | kV/mm | IEC 60641-2 | 13.6 |
| Water content | % | IEC 60641-2 | 7.9 |
| Shrinkage coefficient, longitudinal | % | IEC 60641-2 | 0.66 |
| Shrinkage coefficient, transverse | % | IEC 60641-2 | 0.89 |
Disclaimer/Publisher’s Note: The statements, opinions and data contained in all publications are solely those of the individual author(s) and contributor(s) and not of MDPI and/or the editor(s). MDPI and/or the editor(s) disclaim responsibility for any injury to people or property resulting from any ideas, methods, instructions or products referred to in the content. |
© 2025 by the authors. Licensee MDPI, Basel, Switzerland. This article is an open access article distributed under the terms and conditions of the Creative Commons Attribution (CC BY) license (http://creativecommons.org/licenses/by/4.0/).
Copyright: This open access article is published under a Creative Commons CC BY 4.0 license, which permit the free download, distribution, and reuse, provided that the author and preprint are cited in any reuse.


