Submitted:
12 November 2025
Posted:
13 November 2025
You are already at the latest version
Abstract
This study proposes a comprehensive key performance indicator–multi-criteria decision analysis framework to assess tools supporting renewable energy communities across six critical dimensions. Twenty three specific sub-criteria were defined and scored for each tools, and a weighted sum model was applied to aggregate performance. To ensure robust comparison, criteria weights were derived using both expert judgment (ranking and analytic hierarchy process pairwise comparisons) and objective data-driven methods (entropy-based and the criteria importance through intercriteria correlation weighting). The framework was applied to a diverse sample of contemporary renewable energy community’s tools, including open-source, commercial, and European Union project tools. Key findings indicate that part of tools showed noticeable rank shifts between expert-weighted and data-weighted evaluations, reflecting that expert opinions emphasize technical and operational features while objective variability elevates environmental and economic criteria. This assessment enables stakeholders to compare energy community tools based on structured criteria, offering practical guidance for tool selection and highlighting areas for future improvement.
Keywords:
renewable energy communities
; electrical vehicle
; key performance indicator
; multi-criteria decision analysis
; analytic hierarchy process
; CRITIC
1. Introduction
The transition to renewable energy is a central priority of modern energy policy, driven by climate goals, energy security concerns, and declining technology costs. Renewable energy sources (RES) are now recognized as essential for building sustainable and resilient energy systems. At the European Union (EU) level, directives such as the Renewable Energy Directive (EU) 2018/2001 [1] and its amendment Directive 2023/2413 [2], together with the Internal Electricity Market Directive (EU) 2019/944 [3], set binding targets for renewable deployment and promote citizen participation in community-based initiatives.
Within this framework, Renewable Energy Communities (RECs) and Citizen Energy Communities (CECs) have become key instruments for local empowerment, active consumer involvement, and the integration of distributed renewables. Their main purpose is to generate environmental, economic, and social benefits rather than financial profit, ensuring inclusiveness, cooperation with system operators, and fair access to resources. Accelerating REC development is not only a policy goal but also a socio-technical necessity for achieving the EU’s 2040 climate neutrality targets, as decentralized systems enhance resilience and citizen engagement [4].
With the rise of decentralized energy production and ECs, demand for planning and management tools has also increased. They have become essential for efficient, optimized, and well-controlled implementation of energy communities (ECs) within energy systems, providing technological support for system optimization, energy modeling, and data management to ensure effective operation and to help achieve social and economic benefits for the communities. [5]. Various comparisons and evaluations of energy modelling tools (EMTs) their use cases can be found in the recent academic literature. Reviews are usually focused on software tools for urban energy system modelling [6], urban building energy monitoring [7], and on hybrid energy system designs [8].
For instance, the authors of [9] provide a valuable initial overview of digital tools supporting RECs, their analysis is primarily descriptive and limited to qualitative classification across three REC implementation phases: design, creation, and operation. The evaluation does not apply a formalized scoring system, weighting mechanism, or structured decision-support framework, which restricts reproducibility and comparability across tools. Additionally, the scope of assessment omits key functional areas that are increasingly critical for REC implementation, such as EV integration, demand response aggregation, user-centric design features, and support for socio-legal frameworks. Notably, no attention is given to usability aspects, participatory tools, or how tools address localized regulatory or governance contexts—all of which are essential for real-world community adoption and scalability. As such, while the study offers a broad typological landscape of available tools, it leaves unaddressed the question of which ones perform best under varying user priorities or functional requirements.
The authors of [10] proposed a qualitative evaluation approach for energy system modelling frameworks, examining properties like transparency (open-source), collaborative potential, and structural flexibility. Their approach is tailored to the structural and philosophical characteristics of modelling tools—primarily at the developer and framework level. It lacks consideration of emerging themes crucial to REC tools—such as social participation, regulatory adaptation layers, and open interface usability.
A systematic review in [11] offer a timely and structured review of twelve EMTs relevant to RECs, their focus lies predominantly on the representation of data inputs, simulation features, and technical outputs across a general REC planning workflow. Although the study identifies which tools support techno-economic and, to a lesser extent, spatial and environmental modelling, it does not apply a formal scoring system or weighting mechanism to evaluate tool performance systematically. Their assessment is qualitative in nature and does not distinguish the relative importance of each criterion. In addition, the review highlights—but does not deeply explore—the lack of social participation tools, EV integration, or user-oriented outputs such as dashboards and governance support. Moreover, the authors do not benchmark tools using real-world operational criteria such as interoperability, usability, or readiness for community deployment, leaving a gap in actionable decision support for creators of RECs.
The paper [12] emphasizes that most academic modelling of EC focuses primarily on technical and economic outputs, often neglecting dimensions such as co-creation, educational support, and citizen empowerment. This mirrors gaps identified in digital tool assessments, where features enabling collaborative design, shared decision-making, and local capacity-building are rarely incorporated. The authors of [13], through qualitative interviews, further illustrate the evolving role of digital mediation within RECs. Their study finds that while tools increasingly support technical functions like monitoring and demand response optimization, stakeholders express a clear demand for more participatory and relational features. These include capabilities for peer knowledge exchange, shared project initiation, and coordination with external institutional actors—functionalities largely absent in current tool offerings.
The article [14] offers a technically detailed review of open datasets and tools for local ECs, serving as a valuable technical catalogue. However, it lacks a systematic evaluation of platform usability and practical applicability from a stakeholder perspective. Key dimensions such as user participation, regulatory adaptability, and educational support are overlooked, and no structured comparison or decision-support framework is provided to guide tool selection based on multidimensional performance.
Across the literature, a range of methodological approaches have been used to evaluate and compare EMT. A common approach is feature-based benchmarking: many reviews compile a checklist of functionalities and assess which tools have which features. For example, [9] mapped each tool against services needed in each project phase (design, creation, operation), essentially creating a feature matrix to identify strengths and voids. Similarly, [11] compared tools by the types of inputs they require and outputs they produce (technical, financial, environmental, spatial), using a structured comparison framework. These studies rely on document analysis and tool documentation to score capabilities, often presented in comparative tables. Another technique employed is multi-criteria decision analysis (MCDA) or scoring frameworks. Some reviews explicitly rank or score tools against multiple criteria. For instance, broader energy system model evaluations have introduced qualitative scoring on dimensions like transparency, complexity handling, and collaboration support. According to [15], stakeholder integration in energy system modelling remains limited, as most frameworks still prioritize technical and economic performance over participatory and social dimensions. Their systematic review, based on a SWOT analysis of more than eighty studies, highlights that current modelling tools rarely include mechanisms for co-design, user feedback, or stakeholder interaction throughout the modelling process. The authors argue that this technocentric orientation reduces the applicability of such tools for community-level energy planning and decision-making. They identify opportunities for improvement through the adoption of hybrid approaches—combining MCDA, participatory modelling, and digital interfaces—to better capture local priorities, social acceptance, and behavioural factors. These findings reinforce the relevance of incorporating social and participatory criteria into the KPI framework used to evaluate REC tools.
Some researchers have taken a case study simulation approach to tool evaluation, which are applied to a common scenario to compare results and user experience. For example, [16] conducted a practical comparison of an optimization model vs. a simulation model for the same municipal energy system, highlighting differences in outcomes and modelling effort. Though not focused on REC tools per se, this demonstrates the value of side-by-side case studies to reveal how tool choice can influence planning recommendations.
Another important methodological dimension concerns the integration of stakeholder perspectives and usability evaluations into tool assessment. Although relatively uncommon, some studies have included surveys or interviews to capture user feedback regarding the functionality and applicability of EMTs. For instance, the Finnish study on digital mediation within REC collected practitioner insights on missing or underdeveloped platform features, highlighting the need for participatory design and relational functionalities [13]. Moreover, the authors of the paper [15] have called for the inclusion of user-centred evaluation criteria—such as interface usability, documentation quality, and learning curve—within tool benchmarking frameworks. Nevertheless, quantitative usability metrics such as time required to configure simulations, frequency of operational errors or user satisfaction ratings, remain largely absent from the comparative literature. This methodological gap indicates that most reviews still assess tools based on documented functionalities rather than empirical user testing, limiting the understanding of real-world performance and accessibility.
Despite the proliferation of digital tools designed to support RECs, existing evaluations remain fragmented and limited in scope. Prior studies have primarily focused on technical modeling capabilities or high-level descriptions of tool functionalities, often omitting critical dimensions such as environmental performance, social engagement, and regulatory adaptability. Key reviews in the field have revealed several recurring gaps: the limited integration of electric mobility and multi-vector energy systems, insufficient support for participatory design and citizen interaction and an overarching emphasis on feasibility indicators at the expense of broader sustainability and usability considerations. Moreover, while some frameworks qualitatively assess platform features, they often lack reproducible scoring methodologies, structured prioritization of evaluation criteria, and actionable insights for community stakeholders.
To address these gaps, this study introduces a structured and reproducible evaluation framework that can rank REC tools according to multiple stakeholder-valued criteria. The framework combines key performance indicators (KPIs) with MCDA. The framework spans six functional criteria—technical, operational, economic, environmental, social, and quality and adoption—disaggregated into 23 measurable sub-criteria. The framework applies a stakeholder weighted aggregation using the weighted sum model (WSM) [17] to capture the priorities of non-expert community members. Each criterion is scored on a normalized scale, and aggregated scores are calculated using both expert-informed and data-driven weighting methods. This dual-layered approach enables sensitivity analysis to reflect varying stakeholder priorities and enhances transparency in tool comparison.
The main contributions of this paper are summarized as follows:
1. a comprehensive KPI–MCDA framework for evaluating REC software across technical, economic, environmental, social, usability, and governance criteria is presented;
2. incorporation of multiple weighting methods (stakeholder-derived vs. data-driven) to enhance transparency and replicability is used;
3. demonstration of the framework on representative tools to highlight underexplored features such as EV integration, participatory co-design modules, usability, transparency metrics, and legal adaptability is offered.
By structuring evaluation in this way, our approach moves beyond prior studies to provide actionable, multidimensional performance scores that reflect the diverse needs of REC practitioners and community stakeholders.
The remainder of the paper is structured as follows: Section 2 presents the methodology, including tool-selection criteria, the KPI calculation and the MCDA process; Section 3 reports the evaluation results across a sample of tools; the discussion and conclusions are summarised in the last two sections.
2. Methodology
Most tools were sourced from peer-reviewed articles, reviews, and EU project deliverables. To capture practice-oriented tools under-represented in journals, the authors complemented the literature scan by systematically querying official project and vendor websites, documentation portals, user manuals, open repositories, demo or sandbox instances, and publicly available installers using controlled keywords (e.g., “REC tool/platform,” “energy sharing software,” “community microgrid,” “EV smart charging for RECs,” “REC toolkit”).
Building on this corpus, the authors conduct a structured desk-based [18,19] evaluation of digital tools that support the design, creation, or operation of RECs. The objective is to compare alternatives on a common, multi-criteria basis that reflects the needs of a non-expert audience (for inst. consumers, or/and community initiators), while remaining transparent and reproducible.
The methodology has two pillars:
- A KPI framework structured across six dimensions
MCDA methodologies have been widely applied across areas including renewable energy planning, transportation, sustainability assessment, quality management, and supply chain optimization. Their adaptability allows researchers to customize criteria and weighting systems to adapt the methodology to specific context of research [23]. MCDA provides a structured and systematic framework for managerial decision-making by explicitly incorporating multiple criteria or objectives into the evaluation and ranking of alternative options. MCDA formalizes the decision-making process, thereby enhancing both the quality of decisions and the quality of decision-making practices, by explicitly documenting the applied criteria, their relative weights, and the rationale behind scoring [24].
The paper reviews digital tools, software tools, and toolkits that support the assessment, planning, setup, or operation of RECs, including both European and global cases.
Study selection was guided by two eligibility criteria designed to ensure that each entry could be evaluated transparently and on equal methodological footing. First, a platform or tool had to be documented through an official, publicly accessible source—such as a project website, product page, user or administrator manual, or open repository—detailing functionalities relevant to REC. Second, the platform had to be accessible for independent inspection, either via a public demo or sandbox, a time-limited trial, an openly available installer or codebase, or sufficiently detailed technical documentation to enable functional verification without vendor mediation. Solutions were excluded when they failed to satisfy either of these two conditions.
The KPI assessment methodology includes five consecutive steps for evaluation of each tool (Figure 1).
First, the KPI definition step identifies the main performance domains, that describe the tool’s functional and qualitative characteristics. Second, the ranking of criteria specifies the most relevant sub-criteria within each domain and organizes them according to their importance. Third, the evaluation of each sub-criterion within every KPI dimension is performed, reflecting the tool’s actual features, functionality, and performance. Fourth step consists of the weight coefficient calculation that determines how significant each criterion is compared to the others, applying expert judgment and objective data-driven methods. Finally, during the WSM implementation, all weighted scores are combined into a single overall index, which allows comparing the tools and identifying the most effective one.
2.1. KPI Definition
2.2. KPI Sub-Criteria
The second step focuses on identifying and structuring detailed criteria within each KPI dimension.
2.2.1. Technical Modelling
In the technical modelling (TECH) KPI dimension, the authors identified and evaluated a set of sub-criteria that capture the platform’s ability to represent the technical complexity of RECs and their multi-energy interactions. These sub-criteria address the modelling depth, analytical scope, and realism of technical functionalities.
The criterion “Energy vectors” (TECH_vec) [30] assesses the extent to which a platform models multiple energy carriers and their couplings within a community context. Multi-vector capability is essential for representing sector coupling (e.g., electricity-to-heat via heat pumps, combined heat and power, thermal storage, and electric-vehicle smart charging), thereby enabling integrated techno-economic assessment rather than electricity-only appraisals. A platform scores higher when it can model several carriers and their interactions, rather than electricity alone.
The criterion “Optimisation” (TECH_opt) evaluates whether the platform goes beyond basic simulation to offer design or operational optimization, and whether the optimization objective space is single- or multi-dimensional.
“Simulation capability” (TECH_sim) criterion evaluates the temporal fidelity and breadth of the simulation engine used for techno-economic assessment and operational studies. Higher capability entails time-series simulation over full annual cycles, sub-hourly granularity where needed (e.g., EV/BESS control), and consistent mass-/energy-balance handling across coupled vectors [31].
“Forecasting” (TECH_forec) criterion assesses whether the platform provides endogenous forecasting of key time series relevant to REC planning and operation (e.g., load/consumption, renewable generation).
The “LV/MV grid constraints or losses” (TECH_grid) criterion addresses the representation of distribution-network feasibility—voltage bounds, thermal limits, losses, reverse power flows, and curtailment—at low and medium voltage levels. For RECs, distribution constraints often determine admissible asset sizing and operational envelopes [32].
“Spatial/GIS capabilities” (TECH_spat) criterion evaluates geospatial awareness and place-based modelling, including building-level siting, roof orientation and shading, community perimeter rules (e.g., same-substation constraints), and proximity to thermal networks or other infrastructures. Spatialized modelling is a prerequisite for actionable planning and compliance with jurisdiction-specific REC boundaries.
2.2.2. Operations and Control
Operations and control (OPER) dimension assess whether a platform is ready for day-to-day operation of an EC: running diverse assets, ingesting telemetry, producing actionable analytics and reports, settling energy sharing, exposing reliable interfaces, and coordinating flexibility
The criterion “Asset classes” (OPER_ascl) valuates the scope and diversity of assets that the platform can natively model, monitor, or control within an energy community framework. It reflects both the breadth (variety of asset types) and depth (level of technical detail and control granularity) of device integration [33].
“Analytics and reporting” criterion (OPER_analyt) [34] evaluates the platform’s data analytics, performance assessment, and reporting capabilities, which are essential for operational optimization and strategic decision support. It covers the transformation of raw telemetry data into actionable insights, including statistical analysis, KPI tracking, anomaly detection, and trend forecasting. Advanced tools integrate predictive or prescriptive analytics, provide automated performance summaries, and enable custom report generation for various stakeholders (operators, policymakers, or community members).
“Demand response and flexibility aggregation” (OPER_flex) [35] assesses the platform’s ability to aggregate and activate flexibility from distributed energy resources (DERs) and controllable loads—including batteries, heat pumps, and smart appliances. It focuses on how effectively the system can enrol flexible assets, predict available flexibility, nominate resources for activation, and execute automated control strategies in response to internal signals or market events.
“EV management” sub-criterion (OPER_EV) evaluates the platform’s native capabilities for EV charging management, including smart-charging policies, schedule configuration. Emphasis is placed on the coordination of charging with price/tariff signals, renewable generation forecasts, and distribution-network constraints, as required for cost-effective and grid-compliant operation in energy communities.
2.2.3. Economic
Economic KPI dimension (ECON) evaluates a platform’s capability to support techno-economic assessment and market realism [36].
“Financial indicators” (ECON_fin) assesses whether the platform implements standard project-finance indicators [37] for community-scale assets and portfolios, enabling rigorous techno-economic appraisal and comparability across scenarios.
The sub-criterion “Tariff/market models” [12] (ECON_tar) evaluates how realistically the platform represents end-user tariffs and market price signals—from flat/static rates to time-of-use, dynamic wholesale/retail, or real-time pricing—since tariff fidelity materially affects REC economics and operational strategies.
“Sensitivity analysis” (ECON_sens) tests robustness of techno-economic results to variation in key drivers (prices, load/generation, discount rate, etc), via batch “what-if” runs or formal uncertainty modules.
“Benefit-sharing calculators” [38] (ECON_shar) whether the platform provides transparent and configurable mechanisms for distributing collective benefits and costs within the REC. It focuses on how energy, financial savings, and operational costs are allocated among members based on predefined or dynamic sharing rules.
2.2.4. Environmental
Environmental (ENVIR) [28] KPI dimension evaluates the platform’s capability to quantify, monitor, and optimize the environmental performance of RECs. Its purpose is twofold: first, to assess what environmental impacts are measured, focusing on robust and transparent carbon accounting; and second, to examine how these metrics influence decision-making through the integration of environmental objectives or constraints into system design and operational optimization.
“Carbon accounting” (ENVIR_carb) sub-criterion verifies whether the tool quantifies greenhouse-gas impacts of REC designs/operations with sufficient temporal and geographic resolution.
Environmental objective support (ENVIR_obj) Assesses whether environmental performance is treated as a first-class decision driver. Mature tools embed emissions (or emission intensity) as a design/operation objective alongside cost and reliability, or as binding constraints. This enables transparent trade-off analysis and policy-aligned planning.
2.2.5. Social
This KPI dimension evaluates how effectively the platform supports transparent participation, communication, and decision-making within the REC [39]. It focuses on whether members have clear visibility of data, results, and impacts, as well as access to interactive tools or dashboards that promote understanding and engagement. The dimension also examines the presence of mechanisms for capturing member preferences, feedback, and co-design inputs, ensuring that community decisions reflect user priorities rather than purely technical optimization. Additionally, it considers whether the platform provides built-in guidance, tutorials, or simplified interfaces that help users participate meaningfully without requiring advanced technical skills.
The sub-criterion “Member portals and transparency dashboards” (SOC_trans) addresses user-facing transparency. It evaluates how clearly the platform communicates energy, financial, and environmental data to community members through dashboards, portals, and reports. This criterion focuses on member-level visibility and trust, ensuring that users can understand and verify community performance and decision-making outcomes.
The “Co-design features” (SOC_des) sub-criterion assesses the platform’s capability to actively involve community members in planning, decision-making, and operational processes through participatory design functionalities.
“Education” (SOC_educ) sub-criterion evaluates the platform’s ability to educate, guide, and support users—both community members and administrators—through a combination of integrated assistance tools and external documentation. It measures how effectively the platform lowers technical barriers and ensures that users can understand, operate, and expand the system confidently.
2.2.6. Quality Indicators
Quality indicators (QUAL) KPI dimension evaluates the overall maturity, robustness, and user-readiness of the platform supporting RECs. It focuses on how well the tool performs in practical implementation, ensuring reliability, usability, and long-term sustainability [40]. The dimension consists of six sub-criteria described below.
Usability (QUAL_us) sub-criterion assesses how intuitive and user-friendly the platform interface is for different user groups (e.g., administrators, members, operators). Tools that offer multilingual interfaces, contextual help, and user-tailored dashboards demonstrate enhanced usability.
The sub-criterion “Reliability and performance” (QUAL_perf) evaluates the platform’s technical robustness, responsiveness, and stability under different operational conditions. It includes aspects such as system uptime, error handling, data integrity, and computational efficiency. Tools that maintain consistent performance during peak data loads or simulation runs, and that provide redundancy and backup mechanisms, score higher.
The “Openness” (QUAL_open) refers to the technical and architectural openness of the platform. It evaluates whether the system provides open-source access, transparent algorithms, well-documented application programming interfaces, and compliance with interoperability standards. The focus is on developer- and integrator-level transparency—ensuring reproducibility, interoperability, and long-term vendor independence.
“Scalability” (QUAL_scab) assesses the platform’s capacity to scale in terms of data volume, number of users, and integration scope. It examines whether the system can handle larger communities, new asset types, or expanded geographic coverage without performance degradation.
2.3. KPI Calculation and Tool Evaluation
In this study, each sub-criterion is scored on a three-level scale 0/0.5/1, where 0 denotes no support (or no verifiable evidence), 0.5 denotes partial support, and 1 denotes full support with documented/demonstrated evidence.
The dimension-average KPI score for tool i is computed as the arithmetic mean over its sub-criteria [25]:
where d is the dimension label (d ∈ {TECH, OPER, ECON, ENVIR, SOC, QUAL}); nd is the total amount of sub-criteria of dimension d; j is the index of the sub-criterion within dimension d (j ∈ {1, …, nd}); i is the index of the tool (i ∈ {1, …, I}); is sub-criterion score for dimension d of tool i on sub-criterion j, ({0;0.5;1}). Descriptions of the scoring levels for every sub-criterion in each dimension are provided in Appendix 1.
To compute the overall performance score Si for the i-th evaluated platform, the WSM [41,42], is applied. This model aggregates the normalized performance scores from each of the six defined KPI dimensions, according to their assigned weight coefficients wb:
where is the weight of dimension d, and .
2.4. Weight Coefficient Determination
In this review the authors have employed four well-established approaches to determine the weighting coefficients [43] wd for the six offered KPI dimensions: rank order centroid (ROC) [44,45] analytic hierarchy process (AHP, pairwise comparisons) [46,47,48], entropy weight method (EWM) [49] and the criteria importance through intercriteria correlation (CRITIC) [50]. These methods were chosen for their reproducibility, transparency, and firm grounding in MCDA literature [51]. ROC and AHP approaches use the authors expert judgment in a structured manner, while the EWM and CRITIC derive weights objectively from the variability and correlation of the data. All four methods produce a normalized weight vector (summing to 1), which is then used to weight each dimension’s contribution in the overall performance evaluation by WSM model. The comparative analysis of different weight sets is provided in Section 3.
2.4.1. ROC
In this case, the ROC method serves as a transparent, non-compensatory weighting approach suitable in the absence of stakeholder-derived numerical weights. It relies on the assumption that decision-makers (here, the authors) can establish a rank order of KPI dimension importance (from 1 to 6), even if they cannot specify precise magnitudes of difference between them.
To determine the final ranking, the authors agreed to use the average rank method, which is widely applied in multi-criteria analysis. The formula for calculating the average rank for each criterion is [52]:
where is the average rank of criterion ; is the rank assigned to criterion by author ; Auth is the number of authors.
For C criteria ranked from 1 (most important) to C (least important), the ROC weight for criterion c of dimension d is [44]:
where C is the total number of criteria (ranges); r is the index of rank positions starting from c to C (r ∈ {1, …, C}).
2.4.2. AHP
In this case, AHP was applied as a structured expert judgment method in the absence of stakeholder surveys. The research team constructed a 6x6 reciprocal pairwise comparison matrix A, covering the six KPI dimensions, using a simplified Saaty scale [53]. Each matrix element reflects the perceived importance of dimension d relative to dimension r.
where A is the pairwise comparison matrix of the dimensions, where >0, =0, =1/ .
The weight coefficient by AHP method is calculated as follows [46]:
where adc indicates how much more important dimension d is compared to dimension r; is geometric mean of row d.
2.4.3. EWM
The fundamental idea of EWM [54] is that a dimension provides more decision-making value if its values are more dispersed (less uncertain or more informative). Conversely, dimensions with uniformly distributed scores are considered less informative and are therefore assigned lower weights. Because it uses only data (no expert judgements), EWM was selected to cross-check subjective schemes (ROC and AHP) in hybrid weighting.
The normalized weight for each KPI dimension by EWM is evaluated as follows [55]:
where k is an auxiliary index, k ∈ {1, …, nb}; is the divergence of each dimension b and computes as:
where Ed is the entropy of dimension d. Dimensions with higher divergence are considered more informative.
The entropy is defined as follows:
where represents the normalized proportion of tool i performance on KPI dimension d, relative to all other tools for that dimension.
Thу (9) expression is bounded in [0,1], where Ed = 1 implies a uniform distribution (low discriminating power), but Ed = 0 implies high contrast (high information content).
The normalized proportion of tool i performance on KPI dimension b is calculated as follows:
where ε is a small positive constant (in this case, ε=10-12) to prevent division by zero. This normalization ensures , mimicking a probability distribution over tools for each dimension.
Entropy captures the contrast intensity or information richness of each criterion. The greater the dispersion of data, the higher the criterion’s ability to distinguish alternatives, and thus the higher its assigned weight. As a result, EWM tends to assign the highest weights to criteria that best differentiate the performance of alternatives—those that contain the most “information” about the decision space.
2.4.4. CRITIC
The CRITIC method [50] is another objective approach that assigns weights by considering both the contrast intensity (standard deviation) and conflict (correlation) among criteria. It emphasizes criteria that vary strongly and are less correlated with others [56].
The weight for each KPI dimension by CRITIC is evaluated as follows:
is the information content (contrast intensity) of the dimension d; is the information content of the dimension k.
The parameter is calculated as afollows:
where is the standard deviation of dimension b; ρdk is the Pearson correlation [57] between dimensions d and k. The correlation analysis between dimensions is calculated by vector .
The is evaluated by Equation (13):
where
The Pearson correlation between dimensions is estimated as:
3. Results
3.1. Overview of the Selected EMTs
The objective of this section is to present and interpret the comparative results of the evaluated software tools across the six defined KPI dimensions. Each tool was assessed based on its performance across 23 sub-criteria spanning technical, operational, economic, environmental, social, and quality-related dimensions. Scoring followed the normalized 0/0.5/1 scale described earlier, enabling consistent comparison and aggregation across functionally diverse tools.
Based on the defined selection criteria, Table 1 provides an overview of the selected software tools, including their primary goals, applicable spatial scale, and scope. The tools’ focus areas range from microgrid dispatch optimization to municipal-scale REC planning, reflecting the diversity of functionalities and use cases relevant to community energy systems.
The tools span a broad spatial spectrum—from individual households and microgrids (e.g., MiGRIDS Lite, OpenEnergyMonitor) to municipal and district-level communities (e.g., LocalRES, eNeuron), and even national or cross-border implementations (e.g., Powerledger, Energy Web, REScoopVPP). Several tools, such as OpenEMS or Hive Power FLEXO, explicitly support scalability from small communities to industrial or grid-level integration. Tools such as eNeuron, LocalRES, and Cleanwatts emphasize multi-vector optimisation (electricity, heat, mobility), while others like Powerledger, and Energy Web focus on market mechanisms, trading, and blockchain infrastructure. Tools like GreenPocket and REScoop Energy Community Platform emphasize community engagement, transparency, and governance, while Rectool and PROCSIM focus on planning and dataset-based modelling.
3.2. Results by Methodological Step
This section presents the outcomes of the KPI-based evaluation following the sequence of methodological steps defined in the assessment framework. Each step reflects a specific stage of the analysis—from KPI definition and ranking of sub-criteria scoring, KPI dimension’s weighting, to final evaluation of each tool.
3.3. KPI Results
According to Equation (1), the dimension-average KPI score for each tool is computed. Results of the scoring levels for every sub-criterion in each dimension are provided in Appendix 2. The results of KPI scores for each considered tool is presented in Figure 3.
Figure 3 shows that KPI values differ substantially across the tools. Some tools clearly outperform others in specific categories, while a few demonstrate a more balanced profile. For example, solutions such as BECoop, MiGRIDS Lite, LocalRES and PROCSIM appear to specialize in narrow functional areas, achieving high scores only in selected KPI criteria and low scores in others. This specialization suggests that these tools are tailored for specific use cases rather than offering comprehensive functionality across all dimensions.
Tools such as eNeuron, CityxChange, ClearWatts, Hive Power FLEXO and Powerledger exhibit consistently high scores in almost every criterion. This means that they offer well-balanced functionality, combining robust engineering capabilities with sustainability and user adoption features, making them well-rounded solutions.
By contrast, other tools show more uneven profiles. For example, OpenEMS, REScoop VPP and Energy Web have noticeably lower scores across multiple criteria, but high results in certain categories.
Overall, the results confirm that top-performing tools do comprehensive values across all dimensions, making them universal and strong candidates for integrated energy community solutions.
3.4. Ranking of KPI Dimension
In this paper, all authors independently proposed their rankings for six evaluation criteria that are essential for decision-making in the studied context. Each author assigned ranks from 1 (most important) to 6 (least important). The purpose of this stage was to consolidate these individual rankings into a unified order of importance, which would later serve as the basis for calculating weight coefficients for each criterion. According to the methodology described in Subsection 2.1, to determine the final ranking, the authors agreed to use the average rank method, which is widely applied in multi-criteria analysis. The collected data and results of consolidation method is summarized in the following Table 2.
By applying a transparent mathematical approach, the team ensured that the final ranking reflects the collective expertise of all contributors.
3.5. Results of Weight Coefficients
The final the results of all weight calculations, based on the Section 2, are presented in Table 3. A constructed a 6×6 reciprocal comparison matrix by AHP method is given in Appendix 3.
The sum of the weight coefficients assigned to all KPI dimensions equals 1.0 for each of the four methods, confirming that the normalization was performed correctly, and that each method maintains a valid weight distribution across all evaluated criteria.
Table 3 demonstrates that the ROC weights align with the established priorities. TECH and OPER dimensions have the highest weights—0.4083 and 0.2417 respectively, confirming their critical role in the decision-making framework. Mid-ranked dimensions such as QUAL (0.1583) and ECON (0.1028) add moderate value, while SOC (0.0611) and ENVIR (0.0278) contribute less. This spread shows a clear focus on technical and operational factors, while environmental and social considerations, though included, have a less pronounced effect on the total performance score.
The AHP weights closely follow the consolidated ranking, with TECH (0.3735) and OPER (0.2545) emerging as the most influential dimensions. QUAL (0.1620) and ECON (0.1021) occupy intermediate positions, while SOC (0.0650) and ENVIR (0.0430) remain the least significant. This distribution confirms the strong emphasis on technical and operational dimensions, while still incorporating qualitative and sustainability considerations into the decision-making framework.
EWM produced a distribution that differs significantly from that of expert-based methods. ENVIR (0.3386) and ECON (0.2369) emerged as the most influential criteria due to their high variability, while TECH (0.1328) and OPER (0.1262) received moderate weights. SOC (0.1040) and QUAL (0.0614) contributed the least. This outcome highlights the value of incorporating data-driven weighting to complement subjective assessments and strengthen the overall evaluation’s robustness.
The last method, CRITIC produced a criterion with high variability and low correlation. ENVIR (0.2046) and SOC (0.1811) emerged as the most influential, reflecting their distinctive informational contribution. OPER (0.1643) and QUAL (0.1591) received moderate weights, while ECON (0.1536) and TECH (0.1373) were the least significant. This outcome demonstrates how CRITIC complements other methods by highlighting criteria that reduce redundancy and enhance the robustness of the overall evaluation.
ROC and AHP methods pointed to TECH and OPER as the top priorities. That pretty much matches what the authors already thought was important. EWM and CRITIC methods work a bit differently since they base their weights on the data itself and are data-driven techniques. These methods identified the ENVIR and ECON domains as the most significant, emphasizing the role of environmental and economic variability in the dataset. This really puts the spotlight on how much environmental and economic data can shift the results.
The differences between the weighting methods reveal that ROC and AHP reflect broader strategic or expert-defined priorities, while EWM and CRITIC uncover insights rooted in the intrinsic patterns and variability of the data.
3.6. Results of Final Score
Figure 4 represents the overall performance scores of the tools under four different weighting methods. Each bar represents the KPI score sum for a tool, calculated using the WSM and normalized weight sets (see Equation 2). The figure provides a visual comparison of how the choice of weighting method influences the overall performance assessment.
Tools such as eNeuron, CityxChange, Cleanwatts, Hive Power FLEXO and Powerledger consistently achieve the highest scores using all four weighting schemes. This indicates that these tools deliver balanced performance across technical, operational, economic, and sustainability criteria, regardless of the weight approach.
While the overall ranking of leading tools remains stable, differences appear in mid- and low-performing tools. For example, BECoop, MiGRIDS Lite, REScoopVPP, Compile Toolbox and Rectool Simulator show noticeable variation between ROC and AHP methods and data-driven methods (EWM, CRITIC). This suggests that expert judgment emphasizes technical and operational aspects, whereas objective methods highlight variability in environmental and economic indicators. ROC and AHP consistently assign greater weight to technical and operational KPIs, resulting in higher scores for tools with strong engineering and control capabilities.
Under EWM and CRITIC methods, tools with strong environmental and economic performance—such as (+)CityxChange, Cleanwatts, Powerledger, Energy Web and LocalRES—gain relative advantage compared to expert-based weighting. This reflects the higher variability and lower correlation of these criteria in the dataset, which prioritize objective methods.
4. Discussions
This paper presents a structured KPI–MCDA evaluation of digital tools supporting RECs, aiming to close existing gaps in platform assessment methodologies. Previous literature has primarily focused on technical and economic functionalities, often omitting critical aspects such as user engagement, regulatory adaptability, EV implementation or platform usability. The results confirm that while several tools perform well across multiple functional dimensions, many others show strong performance in only a narrow set of criteria, which limits their broader applicability in real-world community contexts.
During the analysis, several methodological and practical considerations emerged that shaped the final approach and should be considered when interpreting the results. Firstly, the selection of the pairwise comparison scale for the AHP component required careful deliberation. The authors evaluated two options: the discrete odd-number scale commonly used in AHP (e.g., 1, 3, 5) and broader ranges such as 1–5 or 1–9, as proposed in classical AHP literature. While a 1–9 scale offers granularity, empirical observations indicated that the perceived differences in criterion importance across tools were moderate rather than extreme. Therefore, to avoid overstating the influence of marginal differences, the authors opted for a limited 1–5 scale. This compromise balances methodological rigor with real-world interpretability and reflects the underlying distribution of expert judgment. Another practical issue concerned the uniqueness of pairwise ratings. After internal deliberation, the authors concluded that permitting repeated scores across criteria was more realistic. In real-world settings, multiple criteria may be viewed as equally important, and forcing strict ordinal rankings could misrepresent true expert preferences. Allowing repeated values helped retain the semantic integrity of expert assessments and avoided introducing artificial precision into the weighting model. Recognizing the inherent subjectivity of expert-derived weights, the authors further triangulated results using two objective, data-driven methods: EWM and CRITIC. These methods rely solely on the observed variability and correlation within the data and offer complementary perspectives.
The authors intend to explore this balance further in future work, focusing on how different combinations of platform functionalities—such as real-time flexibility control, co-design interfaces, and environmental optimization—can be integrated into scalable, user-friendly digital infrastructures. Particular attention will be paid to the role of interoperability standards, open-source architectures, and modular design in enhancing platform adaptability across diverse regulatory contexts. Additionally, future studies will investigate the incorporation of user feedback and empirical testing to refine the scoring framework and better align platform evaluation with the lived experiences of REC stakeholders.
5. Conclusions
The results of this study provide valuable insights that extend beyond the numerical rankings of the evaluated platforms. The consistent top performance of eNeuron, (+)CityxChange, Cleanwatts, Hive Power FLEXO, and Powerledger across all weighting schemes reflects not a methodological coincidence, but the robustness and comprehensiveness of their design. These platforms simultaneously address technical, operational, economic, environmental, social, and quality domains, demonstrating that balanced multi-domain integration, rather than specialization in one area, determines overall excellence in the multi-criteria evaluation context. Meanwhile, the variability observed among mid-ranked platforms such as BECoop, MiGRIDS Lite, REScoopVPP, Rectool, and PROCSIM under different weighting scenarios reveals that the relevance and performance of each tool are highly dependent on stakeholder priorities. This indicates that platform suitability is contextual and should align with whether a project is primarily technology-driven or community-oriented.
From a practical perspective, the findings suggest that tool selection should be guided by project-specific objectives rather than overall ranking. For ECs that prioritise operational control, flexibility, and integration of EV or demand response, tools with strong operational capabilities are more appropriate. Conversely, initiatives focusing on early-stage design and planning would benefit from tools that demonstrate superior capability in feasibility and spatial analysis. The six KPI dimensions proposed in this study can serve as a comprehensive framework for structuring technical specifications, procurement processes, and evaluation protocols, helping to prevent the omission of critical functionalities such as network constraint modelling, energy-sharing mechanisms, or multi-objective optimisation. In addition, the analysis underscores the importance of modularity and interoperability: while universal tools can serve as a system’s core, the integration of specialised solutions through open interfaces and scalable architectures can improve overall system performance and adaptability.
At the policy level, the results highlight the need to embed environmental and economic sharing dimensions in national and regional regulatory frameworks. Since the rankings are most sensitive to these domains under data-driven weighting schemes, policymakers should consider incorporating requirements for carbon accounting, transparent benefit allocation, and lifecycle performance tracking into public funding programmes and pilot project evaluations. Establishing a baseline set of functional requirements for REC digital tools—covering grid constraint modelling, flexibility management, multi-objective optimisation, and user transparency—would reduce fragmentation among projects and ensure interoperability across different governance levels. Furthermore, the use of publicly available KPI reporting and disclosure of weighting schemes would enhance comparability and accountability across municipal and community-led initiatives.
Author Contributions
Conceptualization: L.P. and A.M.; methodology: L.P., S.H. and I.D.; software: S.H. and L.P.; validation: R.Z. and P.N.; formal analysis: L.P., S.H, R.Z. and P.N..; investigation: R.Z., S.H. and P.N.; resources: L.P. and I.D. ; writing—original draft preparation: L.P., S.H., R.Z. and P.N.; writing—review and editing: L.P. and A.M.; visualization: S.H.; supervision: A.M.; project administration: A.M.; funding acquisition: L.P. and A.M.. All authors have read and agreed to the published version of the manuscript.
Funding
The research conducted in this publication was funded by the Ministry of Education and Science of Ukraine under the grant number 0125U002848 and by the Ministry of Education and Science of the Republic of Latvia for the project LV UA/2025/2 “Development of an open-source tool to support energy communities with electric vehicles and battery energy storage”.
Institutional Review Board Statement
Not applicable.
Informed Consent Statement
Not applicable.
Data Availability Statement
Not applicable
Conflicts of Interest
The authors declare no conflicts of interest.
Appendix 1
| Sub-criteria | Sub-criterion score | ||
| x=0 | x=0.5 | x=1 | |
| TECH_vec | Single vector only | Two vectors | Three or more vectors with explicit couplings |
| TECH_opt | No optimizer (scenario calculation only) |
Single-objective optimization | Multi-objective optimization or equivalent explicit trade-off exploration |
| TECH_Sim | Aggregate/static or seasonal snapshot calculations without continuous time-series | Hourly time-series over representative periods or full year with limited sub-hourly support | Full-year time-series with optional sub-hourly steps, consistent multi-vector balance, and documented numerical/validation details. |
| TECH_forec | No built-in forecasting | Built-in forecasting for at least one stream (e.g., PV or load) or automated import from external services without accuracy reporting | Configurable multi-stream forecasting (load and RES at minimum) with documented methods, horizon/cadence control, and accuracy/confidence reporting. |
| TECH_spat | Non-spatial, aggregate inputs only | Basic GIS support (layer import, georeferencing of assets) | Advanced spatial analytics (3D/shading, geoprocessing queries, perimeter/network checks) |
| TECH_grid | Single-bus balance without grid representation | Simplified treatment (aggregate losses or transformer caps) | Explicit LV/MV network model with power-flow and constraint checking |
| ECON_fin | Costs only | Some KPIs (e.g., LCOE and payback) but not the full set or without transparent assumptions | Full KPI set (NPV, LCOE, IRR, payback) with parameterized assumptions and clear reporting |
| ECON_tar | Single flat tariff only | Multiple static/TOU tariffs or limited dynamic import | Native dynamic pricing support and per-member/asset tariff assignment with scenarioable tariff sets. |
| ECON_sens | No built-in sensitivity | Manual/scenario-by-scenario variation with limited aggregation | Integrated batch sensitivity or stochastic analysis with summarized robustness metrics |
| ECON_shar | No explicit sharing logic (manual spreadsheets required) | Single or hard-coded scheme with limited configurability | Multiple configurable schemes (including dynamic allocation) with transparent statements and exports |
| ENVIR_carb | No emission quantification or only static, generic emission factors without transparency or time resolution | Basic carbon accounting is implemented using national or annual average factors, with limited spatial or temporal granularity. | Comprehensive carbon accounting framework with high-resolution (hourly or regional) emission factors, transparent methodology, and automatic tracking of emissions across scenarios or operational periods. |
| ENVIR_obj | Environmental indicators are reported only as outputs; no influence on design, control, or optimisation decisions. | Environmental parameters (e.g., CO2 intensity, renewable share) can be used qualitatively or as secondary evaluation metrics, but not directly optimised or constrained. | Environmental performance explicitly incorporated as an optimisation objective or constraint (e.g., CO2 minimisation, renewable penetration target, emission caps), with capability for trade-off and scenario analysis. |
| SOC_trans | No member-facing interface or dashboards; information is only accessible to administrators. | Basic dashboards with limited visibility (e.g., simple energy or cost summaries without detailed breakdowns or role differentiation). | Comprehensive, role-based member portal with detailed visualisation of energy, cost, and environmental data; includes data export, report generation, and transparency features that support trust and engagement. |
| SOC_des | No participatory or feedback mechanisms; community members have no structured way to provide input. | Basic feedback options (e.g., static survey or manual preference collection) without integration into platform logic or scenario design | Fully integrated co-design environment with interactive tools (surveys, voting, preference inputs) and feedback loops that directly influence planning, optimisation, or governance decisions. |
| SOC_educ | No built-in help, onboarding, or external documentation; users must rely on ad-hoc support | Basic user manual or FAQ provided; limited contextual help or outdated documentation | Comprehensive learning ecosystem combining interactive onboarding, contextual help, structured documentation (user & developer), and online training resources ensuring accessibility for all user types. |
| OPER_ascl | The platform supports only a single or very limited asset type (e.g., PV monitoring only) with no control or interoperability functions | Multiple asset types are represented but with limited depth (e.g., monitoring without control or lack of standardized integration). | Wide range of controllable and observable assets supported natively, with full data integration, real-time control capability, and interoperability across multiple device classes. |
| OPER_analyt | No analytical or reporting functionality beyond raw data logs. | Basic analytics and standard KPI visualisation (e.g., daily/weekly summaries). | Advanced analytics with predictive/prescriptive functions, automated KPI tracking, and multi-user report generation. |
| OPER_flex | No flexibility or demand response capabilities; assets operate independently. | Basic manual or schedule-based flexibility activation; limited to a single asset class (e.g., batteries or EVs). | Full flexibility aggregation with automated event handling, forecasting, multi-asset coordination (including EVs), and verification of delivery. |
| OPER_EV | Absence of EV-specific functionality beyond manual metering/logging | Support for imported charging schedules or basic rule-based charging, without optimization against price/RES signals and without explicit handling of network constraints | Integrated, policy-based smart charging with optimization against dynamic prices and RES forecasts, explicit enforcement of network/connection constraints, and provision of monitoring and compliance logs |
| QUAL_us | Complex, unintuitive interface requiring expert-level knowledge; no guidance or accessibility support. | Moderately usable interface with partial structure and limited contextual help. | Highly intuitive, user-centred design with clear workflows, multilingual support, and built-in interactive guidance. |
| QUAL_perf | Platform exhibits frequent errors, crashes, or data inconsistencies; performance degrades significantly under normal load. | Platform operates reliably under standard conditions but shows occasional instability or slow performance under heavy computation or large datasets. | Platform demonstrates high reliability and computational performance with stable uptime, efficient resource management, and proven resilience during intensive simulations or multi-user operation. |
| QUAL_scab | Platform cannot scale; performance or stability degrades sharply when data size or number of users increases. | Platform can handle moderate scaling with manual adjustments or partial degradation in responsiveness. | Platform supports seamless scaling in data, users, and functionalities through modular or cloud-based architecture, maintaining stable performance and responsiveness under increased load. |
| QUAL_open | Closed-source platform with proprietary data models and no public documentation or APIs | Partially open system (e.g., documented APIs or selected modules available) with limited transparency | Fully open or transparent ecosystem: open-source code, public API documentation, open data models, and community-driven development. |
Appendix 2
| KPI / Tools/tool | GreenPocket Energy Cockpit | BECoop | MiGRIDS Lite |
LocalRES |
eNeuron |
(+)CityxChange |
|||||
| Tehnical | |||||||||||
| Energy vector | 1 | 0,5 | 0,5 | 1 | 1 | 1 | |||||
| Simulation capability | 0 | 0,5 | 1 | 0,5 | 1 | 0,5 | |||||
| Forecasting | 0 | 0 | 0,5 | 0 | 1 | 0,5 | |||||
| Optimization | 0 | 0 | 1 | 0,5 | 1 | 1 | |||||
| Spatial / GIS | 0 | 0,5 | 0 | 0,5 | 1 | 1 | |||||
| LV/MV grid constraints & losses | 0 | 0 | 0 | 0 | 1 | 0,5 | |||||
| Operational | |||||||||||
| Asset classes | 0 | 0 | 0,5 | 0,5 | 1 | 1 | |||||
| EV management | 0 | 0 | 0 | 0,5 | 1 | 1 | |||||
| Analytics and reporting | 1 | 0,5 | 0,5 | 0,5 | 1 | 1 | |||||
| Demand response / flexibility aggregation | 0 | 0 | 0 | 0,5 | 1 | 1 | |||||
| Economic | |||||||||||
| Financial KPIs | 0,5 | 1 | 0,5 | 0,5 | 1 | 0,5 | |||||
| Tariff / market models | 1 | 0 | 0,5 | 0,5 | 1 | 1 | |||||
| Sensitivity | 0 | 0,5 | 0,5 | 0,5 | 1 | 0,5 | |||||
| Benefit-sharing calculators | 0 | 0 | 0 | 0 | 1 | 0,5 | |||||
| Environmental | |||||||||||
| Carbon accounting | 0 | 0,5 | 0 | 0,5 | 1 | 1 | |||||
| Environmental objectives | 0 | 1 | 0 | 1 | 1 | 1 | |||||
| Social | |||||||||||
| Member portals & transparency | 1 | 0,5 | 0 | 0,5 | 1 | 1 | |||||
| Co-design features | 0 | 1 | 0 | 1 | 1 | 1 | |||||
| Education | 0 | 1 | 0 | 0,5 | 1 | 1 | |||||
| Quality and Adoption | |||||||||||
| Usability | 0,5 | 0,5 | 0,5 | 0,5 | 1 | 1 | |||||
| Reliability and performance | 0 | 0 | 0,5 | 0 | 1 | 0,5 | |||||
| Openness | 0 | 0 | 1 | 0 | 0,5 | 0,5 | |||||
| Scalability | 0 | 0 | 0,5 | 0,5 | 1 | 1 | |||||
| KPI / Tools/tool | Cleanwatts | Hive Power FLEXO | Powerledger | UP-STAIRS | Energy Web | ||||||
| Tehnical | |||||||||||
| Energy vector | 1 | 1 | 1 | 0 | 0 | ||||||
| Simulation capability | 0 | 0,5 | 0 | 0 | 0 | ||||||
| Forecasting | 1 | 1 | 1 | 0 | 0,5 | ||||||
| Optimization | 1 | 1 | 1 | 0 | 0 | ||||||
| Spatial / GIS | 0,5 | 0,5 | 0 | 0 | 0 | ||||||
| LV/MV grid constraints & losses | 0 | 1 | 0,5 | 0 | 0 | ||||||
| Operational | |||||||||||
| Asset classes | 1 | 1 | 1 | 0 | 1 | ||||||
| EV management | 0,5 | 1 | 1 | 0 | 0,5 | ||||||
| Analytics and reporting | 1 | 1 | 1 | 0 | 1 | ||||||
| Demand response / flexibility aggregation | 1 | 1 | 1 | 0 | 1 | ||||||
| Economic | |||||||||||
| Financial KPIs | 1 | 1 | 1 | 0 | 0 | ||||||
| Tariff / market models | 1 | 1 | 1 | 0 | 1 | ||||||
| Sensitivity | 0,5 | 0,5 | 0,5 | 0 | 0 | ||||||
| Benefit-sharing calculators | 1 | 1 | 1 | 0 | 0 | ||||||
| Environmental | |||||||||||
| Carbon accounting | 1 | 1 | 1 | 0 | 1 | ||||||
| Environmental objectives | 0,5 | 0,5 | 0,5 | 0 | 0,5 | ||||||
| Social | |||||||||||
| Member portals & transparency | 1 | 1 | 1 | 0 | 1 | ||||||
| Co-design features | 0,5 | 0,5 | 0,5 | 0,5 | 0 | ||||||
| Education | 1 | 1 | 1 | 1 | 0,5 | ||||||
| Quality and Adoption | |||||||||||
| Usability | 1 | 1 | 1 | 0,5 | 0,5 | ||||||
| Reliability and performance | 1 | 1 | 1 | 0 | 0,5 | ||||||
| Openness | 0 | 0 | 0 | 0 | 0,5 | ||||||
| Scalability | 1 | 1 | 1 | 0,5 | 1 | ||||||
| KPI / Tools/tool | OpenEMS | Energy Community Platform | REScoopVPP | Quixotic | OpenEnergyMonitor | ||||||
| Tehnical | |||||||||||
| Energy vector | 1 | 0,5 | 0,5 | 0 | 0,5 | ||||||
| Simulation capability | 0,5 | 0,5 | 0,5 | 0 | 0,5 | ||||||
| Forecasting | 0,5 | 0 | 1 | 0,5 | 0 | ||||||
| Optimization | 0,5 | 0 | 0,5 | 0 | 0 | ||||||
| Spatial / GIS | 0 | 0 | 0 | 0 | 0 | ||||||
| LV/MV grid constraints & losses | 0,5 | 0 | 0 | 0 | 0 | ||||||
| Operational | |||||||||||
| Asset classes | 1 | 0,5 | 1 | 0,5 | 1 | ||||||
| EV management | 1 | 0 | 1 | 0 | 0 | ||||||
| Analytics and reporting | 1 | 0,5 | 1 | 1 | 0,5 | ||||||
| Demand response / flexibility aggregation | 1 | 0 | 1 | 0 | 0 | ||||||
| Economic | |||||||||||
| Financial KPIs | 0,5 | 0,5 | 0 | 0 | 0 | ||||||
| Tariff / market models | 1 | 0,5 | 0,5 | 0,5 | 1 | ||||||
| Sensitivity | 0,5 | 0,5 | 0 | 0 | 0 | ||||||
| Benefit-sharing calculators | 0 | 0,5 | 0 | 0 | 0 | ||||||
| Environmental | |||||||||||
| Carbon accounting | 0,5 | 0,5 | 0 | 0 | 0 | ||||||
| Environmental objectives | 0,5 | 0,5 | 0 | 0 | 0 | ||||||
| Social | |||||||||||
| Member portals & transparency | 0,5 | 0,5 | 1 | 1 | 0,5 | ||||||
| Co-design features | 0 | 1 | 0,5 | 0,5 | 0 | ||||||
| Education | 0,5 | 0,5 | 0,5 | 0,5 | 0,5 | ||||||
| Quality and Adoption | |||||||||||
| Usability | 0,5 | 0,5 | 0,5 | 0,5 | 0,5 | ||||||
| Reliability and performance | 1 | 0,5 | 0,5 | 1 | 0 | ||||||
| Openness | 0,5 | 1 | 1 | 0 | 0,5 | ||||||
| Scalability | 1 | 1 | 1 | 1 | 0 | ||||||
| KPI / Tools/tool | Compile Toolbox / ComPilot & related tools | Rectool Simulator | PROCSIM | ||||||||
| Tehnical | |||||||||||
| Energy vector | 0 | 0 | 0 | ||||||||
| Simulation capability | 0 | 0,5 | 0,5 | ||||||||
| Forecasting | 0,5 | 1 | 0 | ||||||||
| Optimization | 0,5 | 0 | 0 | ||||||||
| Spatial / GIS | 1 | 1 | 0 | ||||||||
| LV/MV grid constraints & losses | 1 | 0 | 0 | ||||||||
| Operational | |||||||||||
| Asset classes | 0,5 | 0,5 | 0,5 | ||||||||
| EV management | 0 | 0 | 0 | ||||||||
| Analytics and reporting | 1 | 0 | 0 | ||||||||
| Demand response / flexibility aggregation | 1 | 0 | 0 | ||||||||
| Economic | |||||||||||
| Financial KPIs | 0 | 0 | 0 | ||||||||
| Tariff / market models | 1 | 0 | 0 | ||||||||
| Sensitivity | 0 | 0 | 0,5 | ||||||||
| Benefit-sharing calculators | 0 | 0 | 0 | ||||||||
| Environmental | |||||||||||
| Carbon accounting | 0 | 0 | 0 | ||||||||
| Environmental objectives | 0 | 0 | 0 | ||||||||
| Social | |||||||||||
| Member portals & transparency | 1 | 0 | 0 | ||||||||
| Co-design features | 0 | 0 | 0 | ||||||||
| Education | 0,5 | 0 | 0,5 | ||||||||
| Quality and Adoption | |||||||||||
| Usability | 0 | 0,5 | 0,5 | ||||||||
| Reliability and performance | 0 | 0 | 0,5 | ||||||||
| Openness | 0 | 1 | 1 | ||||||||
| Scalability | 1 | 0 | 0,5 | ||||||||
Appendix 3
| TECH | OPER | QUAL | ECON | SOC | ENVIR | |
| TECH | 1 | 2 | 3 | 4 | 5 | 5 |
| OPER | 1/2 | 1 | 2 | 3 | 4 | 5 |
| QUAL | 1/3 | 1/2 | 1 | 2 | 3 | 4 |
| ECON | 1/4 | 1/3 | 1/2 | 1 | 2 | 3 |
| SOC | 1/5 | 1/4 | 1/3 | 1/2 | 1 | 2 |
| ENVIR | 1/6 | 1/5 | 1/4 | 1/3 | 1/2 | 1 |
References
- The European Parliament and The Council of The European Union. Directive (EU) 2018/2001 of the European Parliament and of the Council of 11 December 2018 on the promotion of the use of energy from renewable sources (recast) (Text with EEA relevance.). Official Journal of the European Union. Brussels, Belgium, 2024.
- The European Parliament and The Council of The European Union. Directive (EU) 2023/2413 of the European Parliament and of the Council of 18 October 2023 amending Directive (EU) 2018/2001, Regulation (EU) 2018/1999 and Directive 98/70/EC as regards the promotion of energy from renewable sources, and repealing Council Directive (EU) 2015/652. Official Journal of the European Union. Brussels, Belgium, 2023.
- The European Parliament and The Council of The European Union. Directive (EU) 2019/944 of the European Parliament and of the Council of 5 June 2019 on common rules for the internal market for electricity and amending Directive 2012/27/EU (recast) (Text with EEA relevance.) Official Journal of the European Union. Brussels, Belgium, 2019.
- Caramizaru, E.; Uihlein, A.; Energy communities: An overview of energy and social innovation. JRC Publications Repository 2019, Publications Office of the European Union, Luxembourg, 2020, ISBN 978-92-76-10713-2. [CrossRef]
- Arias, A. Digital Tools and Platforms for Renewable Energy Communities: A Comprehensive Literature Review. Politecnico di Milano, Milan, Italy, 2023-2024.
- Yazdanie, M.; Orehounig, K.; Advancing urban energy system planning and modeling approaches: Gaps and solutions in perspective. Renewable and Sustainable Energy Reviews 2021, 137, 110607, ISSN 1364-0321. Available online: . [CrossRef]
- Ferrando, M.; Causone, F.; Hong, T.; Chen, Y.; Urban building energy modeling (UBEM) tools: A state-of-the-art review of bottom-up physics-based approaches. Sustainable Cities and Society 2020, 62, 102408, ISSN 2210-6707. Available online: . [CrossRef]
- Sinha, S.; Chandel, S. S.; Review of software tools for hybrid renewable energy systems. Renewable and Sustainable Energy Reviews. 2014, 32, 192-205, ISSN 1364-0321. Available online: . [CrossRef]
- Giannuzzo, L.; Minuto, F.D.; Schiera, D.S.; Branchetti, S.; Petrovich, C.; Gessa, N.; Frascella, A.; Lanzini, A. Assessment of renewable energy communities: A comprehensive review of key performance indicators. Energy Reports 2025, 13, 6609–6630, ISSN 2352-4847. Available online: . [CrossRef]
- Wiese, F., Hilpert, S., Kaldemeyer, C.; A qualitative evaluation approach for energy system modelling frameworks. Energ Sustain Soc 2018 8, 13. [CrossRef]
- Vecchi, F.; Stasi, R.; Berardi, U. Modelling tools for the assessment of renewable energy communities. Energy Reports 2024, 11, 3941–3962. Available online: . [CrossRef]
- Velkovski, B.; Gjorgievski, V.Z.; Kothona, D.; Bouhouras, A.S.; Cundeva, S.; Markovska, N.. Impact of tariff structures on energy community and grid operational parameters. Sustainable Energy, Grids and Networks 2024, 38, 101382, . Available online: . [CrossRef]
- Shahzad, K.; Tuomela, S.; Juntunen, J.K.; Emergence and prospects of digital mediation in energy communities: Ecosystem actors’ perspective. Energy, Sustainability and Society 2025, 15, 35. Available online: . [CrossRef]
- Kazmi, H.; Munné-Collado, Í.; Mehmood, F.; Syed, T.A.; Driesen, J.; Towards data-driven energy communities: A review of open-source datasets, models and tools. Renewable and Sustainable Energy Reviews 2021, 148,111290. Available online: . [CrossRef]
- Amin, R. Exploring stakeholder engagement in energy system modelling and planning: A systematic review using SWOT analysis. Energies and Sustainable Planning Journal 2025, 28, 153-178. [CrossRef]
- Johannsen, R.M.; Prina, M.G.; Østergaard, P.A.; Mathiesen, B.V.; Sparber, W.; Municipal energy system modelling—A practical comparison of optimisation and simulation approaches. Energy 2023, 269, 126803, ISSN 0360-5442. Available online: . [CrossRef]
- Weighted Sum Method — an overview. ScienceDirect Topics. Available online: https://www.sciencedirect.com/topics/computer-science/weighted-sum-method (accessed on 5 November 2025).
- Macgregor, G. How to do Research: A Practical Guide to Designing and Managing Research Projects, 3rd.; ed. Library Review; London, GB, 2007. 337–339. Available on: . [CrossRef]
- Glenn A. Bowen; Document Analysis as a Qualitative Research Method. Qualitative Research Journal 3 August 2009; 9 (2): 27–40.
- Triantaphyllou, Evangelos. (2000). Multi-Criteria Decision Making Methods: A Comparative Study. 10.1007/978-1-4757-3157-6.
- Mardani, A.; Zavadskas, E.K.; Khalifah, Z.; Zakuan, N.; Jusoh, A.; Md Nor, K.; Khoshnoudi, M.; A review of multi-criteria decision-making applications to solve energy management problems: Two decades from 1995 to 2015. Renewable and Sustainable Energy Reviews, 2017, 216-256, ISSN 1364-0321. Available online: . [CrossRef]
- Henderson, J.; Peeling, R. A framework for early-stage sustainability assessment of innovation projects enabled by weighted sum multi-criteria decision analysis in the presence of uncertainty. Open Res Europe 2024, 4:162. Available online:. [CrossRef]
- Mardani, A.; Zavadskas, E.K.; Khalifah, Z.; Zakuan, N.; Jusoh, A.; Nor, K.M.; Khoshnoudi, M. A review of multi-criteria decision-making applications to solve energy management problems: Two decades from 1995 to 2015. Renew. Sustain. Energy Rev 2017, 71, 216–256. Available online: . [CrossRef]
- Henderson, J.; Peeling, R. A framework for early-stage sustainability assessment of innovation projects enabled by weighted sum multi-criteria decision analysis in the presence of uncertainty. Open Research Europe 2024, 4, 162. [CrossRef]
- Jahangirian, M.; Taylor, S. J. E.; Young, T.; Robinson, S. Key performance indicators for successful simulation projects. Journal of the Operational Research Society 2017 68(7), 747–765. [CrossRef]
- Roubtsova, E. KPI design as a simulation project. Proceedings of the 32nd European Modeling and Simulation Symposium 2020, 120-129. [CrossRef]
- Kifor, C.V.; Olteanu, A.; Zerbes, M. Key Performance Indicators for Smart Energy Systems in Sustainable Universities. Energies 2023, 16, 1246. [CrossRef]
- Lamprousis, G.D.; Golfinopoulos, S.K. The Integrated Energy Community Performance Index (IECPI): A Multidimensional Tool for Evaluating Energy Communities. Urban Sci 2025, 9, 264. [CrossRef]
- Bianco, G.; Bonvini, B.; Bracco, S.; Delfino, F.; Laiolo, P.; Piazza, G. Key Performance Indicators for an Energy Community Based on Sustainable Technologies. Sustainability 2021, 13, 8789. [CrossRef]
- Mancò, G.; Tesio, U.; Guelpa, E.; Verda, V. A review on multi energy systems modelling and optimization. Applied Thermal Engineering 2024, 236, 121871, ISSN 1359-4311, Available online: . [CrossRef]
- Hao, J.; Yang, Y.; Xu, C. A comprehensive review of planning, modeling, optimization, and control of distributed energy systems. Carb Neutrality 2022 1, 28. Available online: . [CrossRef]
- Taxt, H.; Bjarghov, S.; Askeland, M.; Crespo del Granado, P.; Morch, A.; Degefa, M.Z.; Rana, R. Integration of energy communities in distribution grids: Development paths for local energy coordination. Energy Strategy Reviews 2025, 58, 101668, ISSN 2211-467X. Available online: . [CrossRef]
- Obi, M.; Slay, T.; Bass, R. Distributed energy resource aggregation using customer-owned equipment: A review of literature and standards. Energy Reports 2020, 6. Available online: . [CrossRef]
- Li, H.; Johra, H.; de Andrade Pereira, F.; Hong, T.; Le Dréau, J.; Maturo, A.; Wei, M.; Liu, Y.; Saberi-Derakhtenjani, A.; Nagy, Z.; Marszal-Pomianowska, A.; Finn, D.; Miyata, S.; Kaspar, K.; Nweye, K.; O’Neill, Z.; Pallonetto, F.; Dong, B. Data-driven key performance indicators and datasets for building energy flexibility: A review and perspectives. Applied Energy, 2023, 343, 121217, ISSN 0306-2619. Available online: . [CrossRef]
- Ranaboldo, M.; Aragüés-Peñalba, M.; Arica, E.; Bade, A.; Bullich-Massagué, E.; Burgio, A.; Caccamo, C.; Caprara, A.; Cimmino, D.; Domenech, B.; Donoso, I.; Fragapane, G.; González-Font-de-Rubinat, P.; Jahnke, E.; Juanpera, M.; Manafi, E.; Rövekamp, J.; Tani, R. A comprehensive overview of industrial demand response status in Europe. Renewable and Sustainable Energy Reviews 2024, 203, 114797, ISSN 1364-0321, Available online: . [CrossRef]
- Teng, Q.; Wang, X.; Hussain, N.; Hussain, S. Maximizing economic and sustainable energy transition: An integrated framework for renewable energy communities. Energy 2025, 317, 134544, ISSN 0360-5442. Available online: . [CrossRef]
- Delapedra-Silva, V.; Ferreira, P.; Cunha, J.; Kimura, H. Methods for Financial Assessment of Renewable Energy Projects: A Review. Processes 2022, 10(2), 184; [CrossRef]
- Minuto, F.D.; Lanzini, A. Energy-sharing mechanisms for energy community members under different asset ownership schemes and user demand profiles. Renewable and Sustainable Energy Reviews 2022, 168. [CrossRef]
- Ryszawska, B.; Rozwadowska, M.; Ulatowska, R.; Pierzchała, M.; Szymański, P. The Power of Co-Creation in the Energy Transition—DART Model in Citizen Energy Communities Projects. Energies 2021, 14(17), 5266; [CrossRef]
- Berendes, S.; Hilpert, S.; Günther, S.; Muschner, C.; Candas, S.; Hainsch, K.; van Ouwerkerk, J.; Buchholz, S.; Söthe, M. Evaluating the usability of open source frameworks in energy system modelling. Renewable and Sustainable Energy Reviews 2022, 159, 112174, ISSN 1364-0321. Available online: . [CrossRef]
- Department for Energy Security & Net Zero, Use of Multi-Criteria Decision Analysis in options appraisal of economic cases, 2024. Available online: https://assets.publishing.service.gov.uk/media/6645e4b2b7249a4c6e9d3631/Use_of_MCDA_in_options_appraisal_of_economic_cases.pdf.
- O’Shea, R.; Deeney, P.; Triantaphyllou, E.; Diaz-Balteiro, L.; Tarim, S.A. Weight Stability Intervals for Multi-Criteria Decision Analysis Using the Weighted Sum Model. Expert Systems with Applications 2026, 128460. [CrossRef]
- https://ebrary.net/134839/mathematics/methods_choosing_weights.
- Hatefi, M.A. An Improved Rank Order Centroid Method (IROC) for Criteria Weight Estimation: An Application in the Engine/Vehicle Selection Problem. Informatica 2023 34, 2, 249–270 1-22. [CrossRef]
- Kunsch, P. A critical analysis on Rank-Order-Centroid (ROC) and Rank-Sum (RS) weights in Multicriteria-Decision Analysis. Vrije Universiteit Brussel 2019.
- Diahovchenko, I.M.; Kandaperumal, G.; Srivastava, A.K. Enabling resiliency using microgrids with dynamic boundaries. Electric Power Systems Research 2023, 221, 109460, ISSN 0378-7796. [CrossRef]
- Bozorg-Haddad, O.; Loáiciga, H.; Zolghadr-Asli, B. Analytic Hierarchy Process (AHP). [CrossRef]
- Pascoe, S. A Simplified Algorithm for Dealing with Inconsistencies Using the Analytic Hierarchy Process. Algorithms 2022, 15(12), 442; [CrossRef]
- Zhu, Y.; Tian, D.; Yan, F. Effectiveness of Entropy Weight Method in Decision-Making. Mathematical Problems in Engineering 2020. 1-5. 10.1155/2020/3564835. [CrossRef]
- Krishnan, A.R.; Kasim, M.M.; Hamid, R.; Ghazali, M.F. A Modified CRITIC Method to Estimate the Objective Weights of Decision Criteria. Symmetry 2021, 13, 973. [CrossRef]
- Zhang, Q.; Fan, J. & Gao, C. CRITID: Enhancing CRITIC with advanced independence testing for robust multi-criteria decision-making. Sci Rep 2024 14, 25094. [CrossRef]
- Roszkowska, E. Rank Ordering Criteria Weighting Methods—A Comparative Overview. Optimum Economic Studies 2013. [CrossRef]
- Saaty, T.L.; Vargas, L.G. Models, Methods, Concepts & Applications of the Analytic Hierarchy Process, 2nd ed.; Springer: New York, NY, USA, 2022; ISBN 978-1-4614-3596-9.
- Arce, M.E.; Saavedra, Á.; Míguez, J.L.; Granada, E. The use of grey-based methods in multi-criteria decision analysis for the evaluation of sustainable energy systems: A review. Renewable and Sustainable Energy Reviews 2015 47, 924-932, ISSN 1364-0321. [CrossRef]
- Gao, X.; An, R. Research on the coordinated development capacity of China’s hydrogen energy industry chain. Journal of Cleaner Production 2022, 377, 134177, ISSN 0959-6526. [CrossRef]
- Krishnan, A.R.; Mat Kasim, M.; Hamid, R.; Ghazali, M.F. A Modified CRITIC Method to Estimate the Objective Weights of Decision Criteria. Symmetry 2021, 13(6), 973; [CrossRef]
- Berman, J.J. Chapter 4—Understanding Your Data, Berman, J.J. Data Simplification, 2016, Pages 135-187, ISBN 9780128037812, Available online: . [CrossRef]
- Bult-Ito, Y. UAF News and Information, University of Alaska Fairbanks. Free tool helps small communities pick renewable energy sources. 7 August 2025. Available online: https://www.uaf.edu/news/free-tool-helps-small-communities-pick-renewable-energy-sources.php (accessed on 5 November 2025).
- Gilchrist, P. New tool looks to make grid modeling more accessible to small communities. 24 August 2025. Available online: https://fm.kuac.org/2025-08-24/new-tool-looks-to-make-grid-modeling-more-accessible-to-small-communities (accessed on 5 November 2025).
- Localres. Available online: https://www.localres.eu/ (accessed on 5 November 2025).
- eNeuron. Optimising the design and operation of local energy communities based on multi-carrier energy systems. Available online: https://eneuron.eu/ (accessed on 5 November 2025).
- +CityxChange. Positive City ExChange—Enabling the co-creation of the future we want to live in. Available online: https://cityxchange.eu/ (accessed on 6 November 2025).
- +CityxChange. Developing a Lighthouse Project for Positive Energy Districts. +CityxChange Project, Horizon 2020 Grant Agreement No 824260; Sustainable Places 2019: [Limerick, Ireland]. 2021. Available online: https://www.sustainableplaces.eu/wp-content/uploads/2021/04/CityxChange-%E2%80%93-Developing-a-Lighthouse-Project-for-Positive-Energy-Districts.pdf (accessed on 5 November 2025).
- +CityxChange. CORDIS—EU Research Results. Positive city exchange. Available online: https://cordis.europa.eu/project/id/824260/results (accessed on 15 August 2025).
- ABB. The climate-positive city. Available online: https://new.abb.com/news/detail/110049/the-climate-positive-city (accessed on 19 August 2025).
- Gall, T.; Carbonari, G.; Ahlers, D.; Wyckmans, A. Co-Creating Local Energy Transitions Through Smart Cities: Piloting a Prosumer-Oriented Approach. Vol. 16; 2020; pp. 112–127. Available online: https://www.institute-urbanex.org/wp-content/uploads/2020/11/Co-Creating-Local-Energy-Transitions-Through-Smart-Cities-Piloting-a-Prosumer-Oriented-Approach.pdf (accessed on 20 August 2025).
- Cleanwatts. Cleanwatts — Shaping the Future of Sustainable Energy. Available online: https://cleanwatts.energy/ (accessed on 21 August 2025).
- Cleanwatts. Cleanwatts Official Channel. YouTube channel, available online: https://www.youtube.com/@cleanwatts4048 (accessed on 25 Agust 2025).
- ABB. ABB-Cleanwatts solution—Scaling community energy solutions. Available online: https://new.abb.com/low-voltage/solutions/energy-efficiency/abb-cleanwatts (accessed on 26 August 2025).
- Hive Power SA. FLEXO. Available online: https://www.hivepower.tech/flexo (accessed on 2 September 2025).
- Powerledger. Powerledger — Software solutions for tracking, tracing and trading renewable energy. Available online: https://powerledger.io (accessed on 5 September 2025).
- Messari. Power Ledger (POWR)—Project Profile. Available online: https://messari.io/project/power-ledger/profile (accessed on 3 September 2025).
- CoinMarketCap. Powerledger (POWR)—Cryptocurrency profile. Available online: https://coinmarketcap.com/currencies/power-ledger (accessed on 8 September 2025).
- eCREW. The App. Available online: https://ecrew-project.eu/the-app (accessed on 9 September 2025).
- GreenPocket GmbH. Residential Customers—Energy Cockpit for residential customers. Available online: https://www.greenpocket.com/products/residential-customers (accessed on 11 September 2025).
- BECoop. D2.4 BECoop Toolkit—Final. BECoop Project (Horizon 2020 Grant Agreement No 952930), October 2022. Available online: https://becoop-kep.eu/wp-content/uploads/2023/11/D2.4_BECoop_Toolkit-Final_V1.0_compressed.pdf (accessed on 15 September 2025).
- BECoop. Unlocking the Community Bioenergy Potential. Available online: https://www.becoop-project.eu/ (accessed on 17 September 2025).
- UP-STAIRS. UP-lifting energy communities. Available online: https://www.h2020-upstairs.eu/ (accessed on 19 September 2025).
- UP-STAIRS. About the UP-STAIRS. Available online: https://www.h2020-upstairs.eu/about (accessed on 23 September 2025).
- COMPILE. Integrating Community Power in Energy Islands. Available online: https://main.compile-project.eu/ (accessed on 25 September 2025).
- OpenEnergyMonitor. OpenEnergyMonitor—Open Source Energy Monitoring and Analysis Tools. Available online: https://openenergymonitor.org/ (accessed on 26 September 2025).
- OpenEnergyMonitor. Emoncms—User login. Available online: https://emoncms.org/app/view?name=MySolarBattery (accessed on 29 September 2025).
- Joint Research Centre, European Commission. REC Tool—Renewable Energy Communities Tool. Available online: https://ses.jrc.ec.europa.eu/rectool (accessed on 30 September 2025).
- De Paola A.; Musiari, E.; Andreadou, N. Fortunati L.; Francesco G.; Anselmi G. P.; An Open-Source IT Tool for Energy Forecast of Renewable Energy Communities. IEEE Access 2025, 13, 69619–69630. [CrossRef]
- Velosa, N.; Gomes, E.; Morais, H.; Pereira, L. PROCSIM: An Open-Source Simulator to Generate Energy Community Power Demand and Generation Scenarios. Energies 2023, 16, 1611. Available online: https://www.mdpi.com/1996-1073/16/4/1611 (accessed on 3 October 2025).
- Energy Web. Energy Web—Built, connect, transform. Available online: https://www.energyweb.org/ (accessed on 6 October 2025).
- Energy Web. Energy Web X Ecosystem. Documentation overwiev. Available online: https://docs-launchpad.energyweb.org (accessed on 8 October 2025).
- OpenEMS Association e.V. OpenEMS—The Open Source Energy Management System. Available online: https://openems.io/ (accessed on 10 October 2025).
- OpenEMS Association e.V. OpenEMS—Introduction. Available online: https://openems.github.io/openems.io/openems/latest/introduction.html (accessed on 13 October 2025).
- REScoop.eu. Energy Community Platform—One-stop solution for community energy projects. Available online: https://energycommunityplatform.eu/ (accessed on 15 October 2025).
- REScoopVPP. REScoopVPP—Community-driven Virtual Power Plant and Smart Building Ecosystem. Available online: https://www.rescoopvpp.eu/ (accessed on 17 October 2025).
- European Climate, Infrastructure and Environment Executive Agency. Horizon Energy: REScoopVPP—Smart Building Ecosystem for Energy Communities. Available online: https://cinea.ec.europa.eu/featured-projects/horizon-energy-rescoopvpp-smart-building-ecosystem-energy-communities_en (accessed on 20 October 2025).
- Quixotic. Quixotic—Cloud solution to automate energy billing and invoicing operations for energy communities and utilities. Available online: https://www.quixotic.energy/ (accessed on 23 October 2025).
Figure 1.
KPI Assessment methodology.
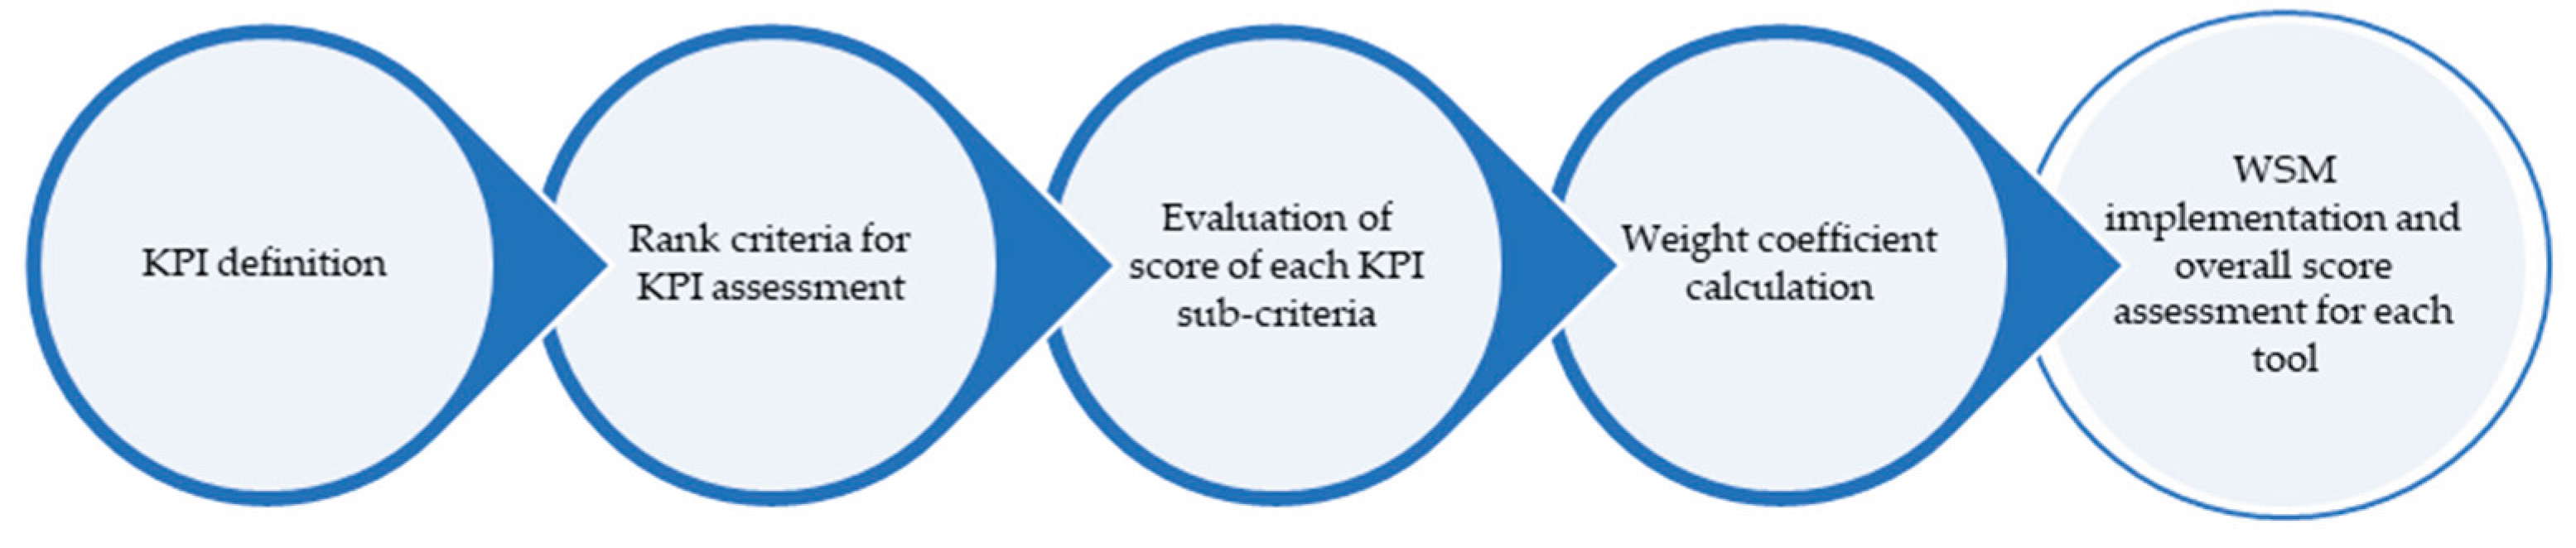
Figure 2.
KPI framework for evaluating digital tools for REC.
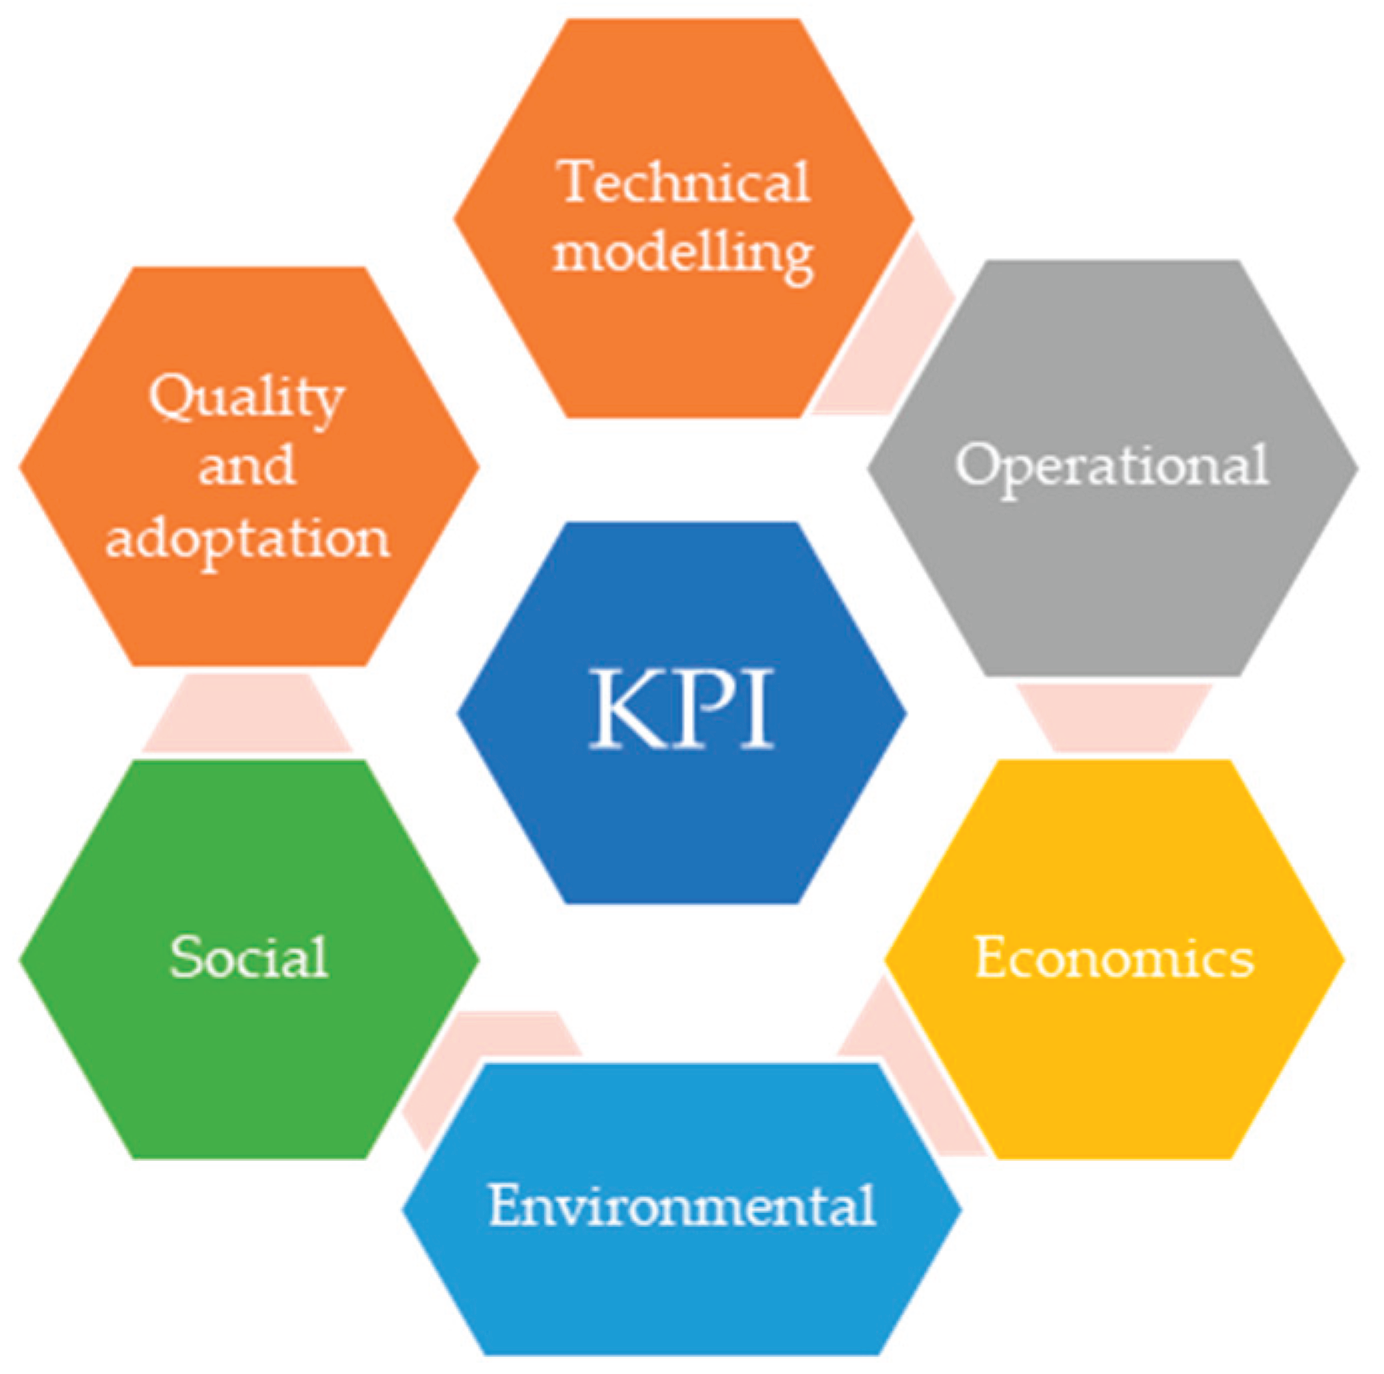
Figure 3.
Average KPIs of the tools.
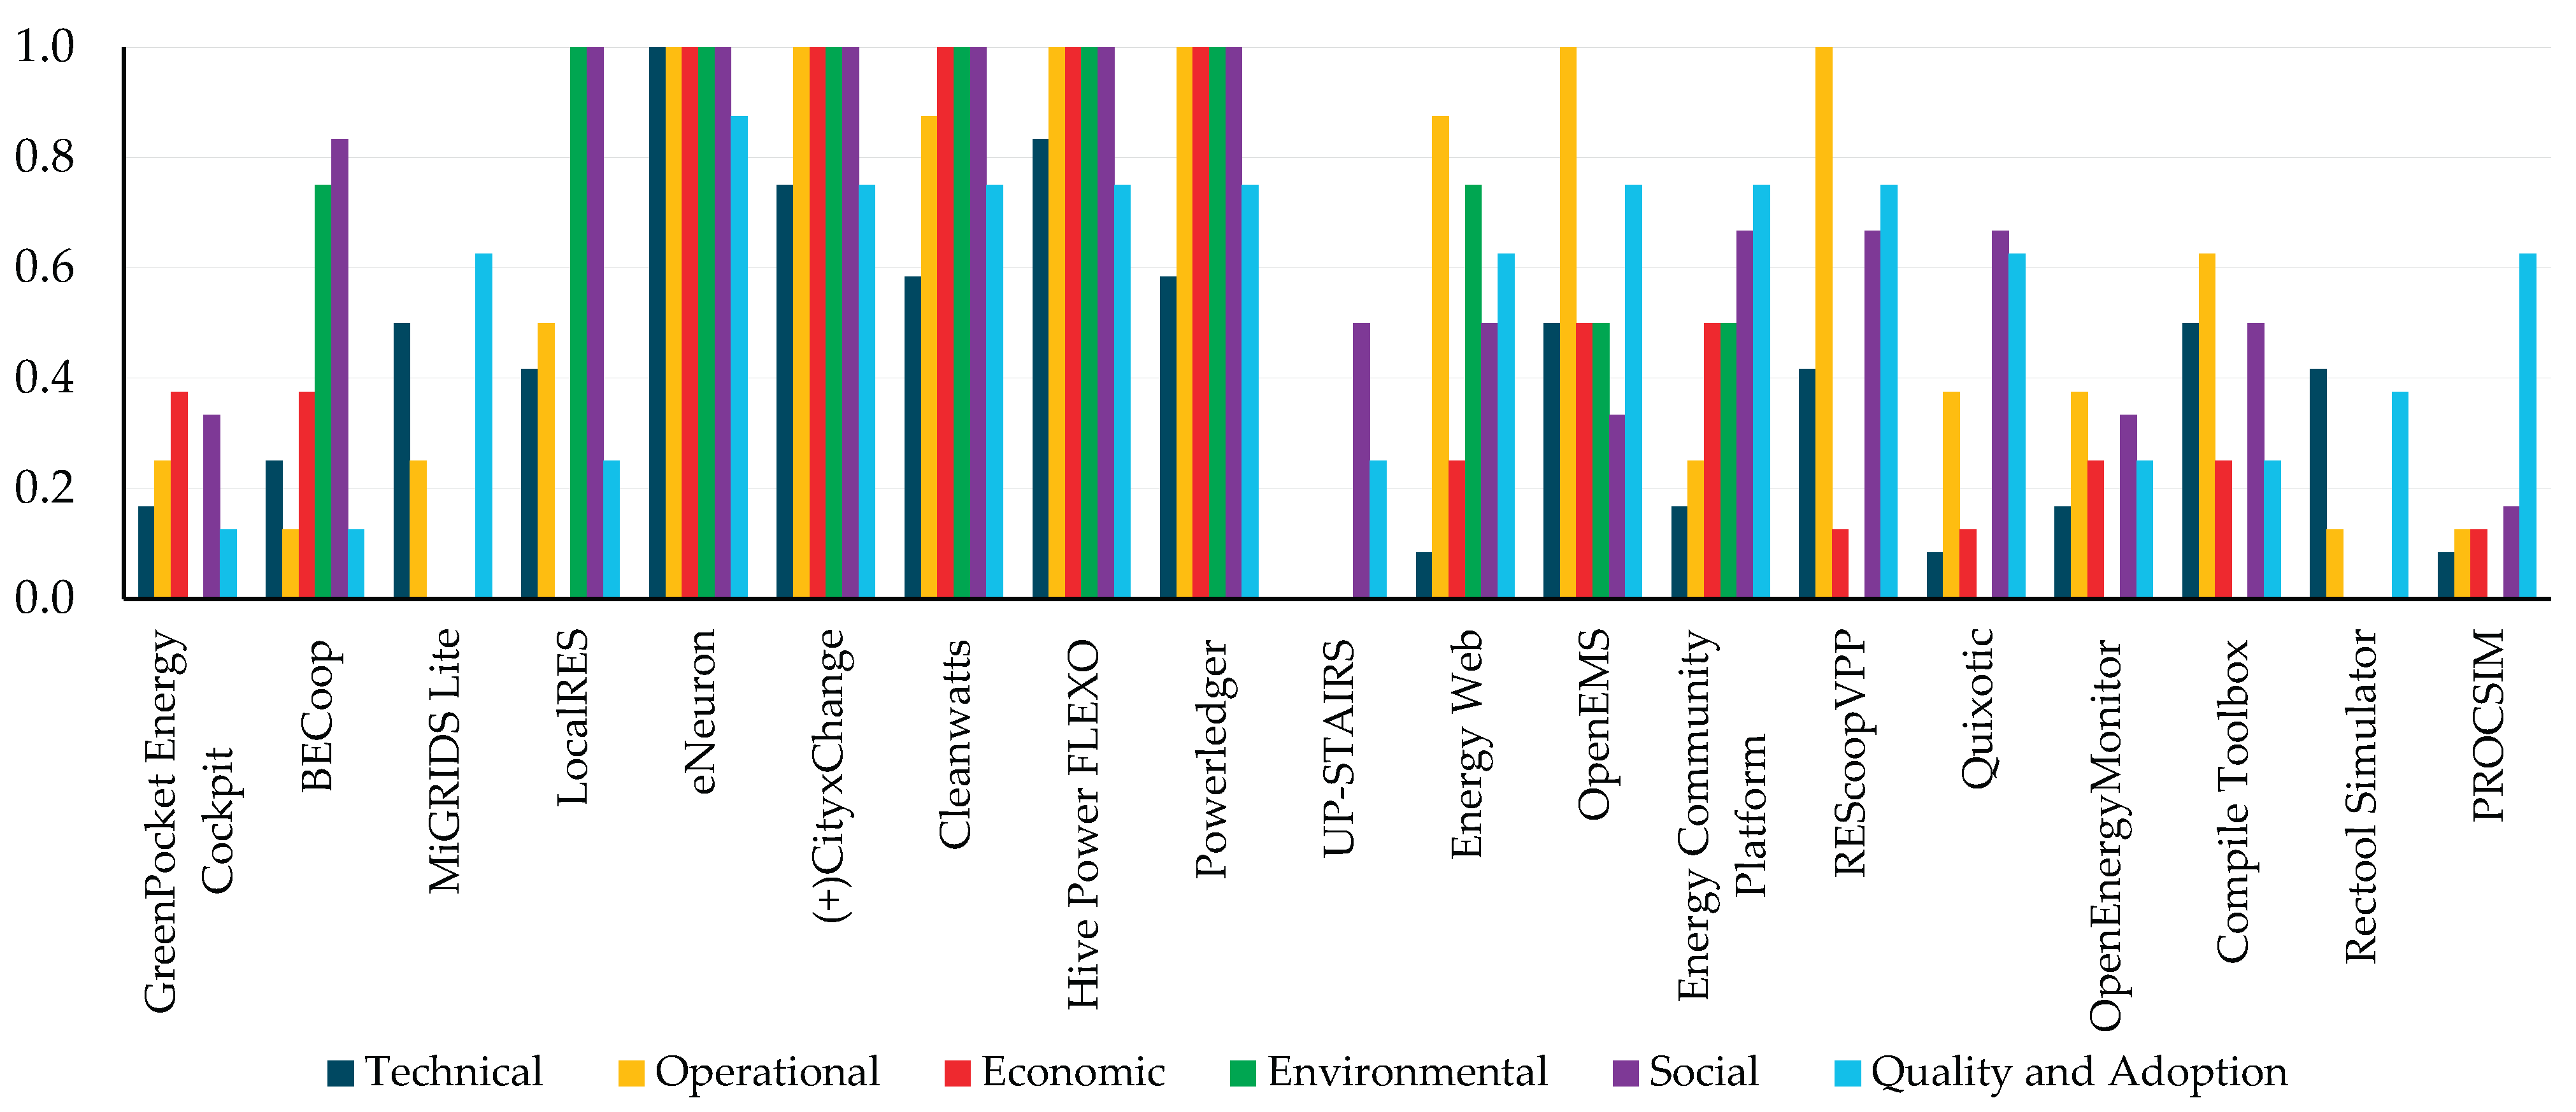
Figure 4.
Overall performance scores of the tools.
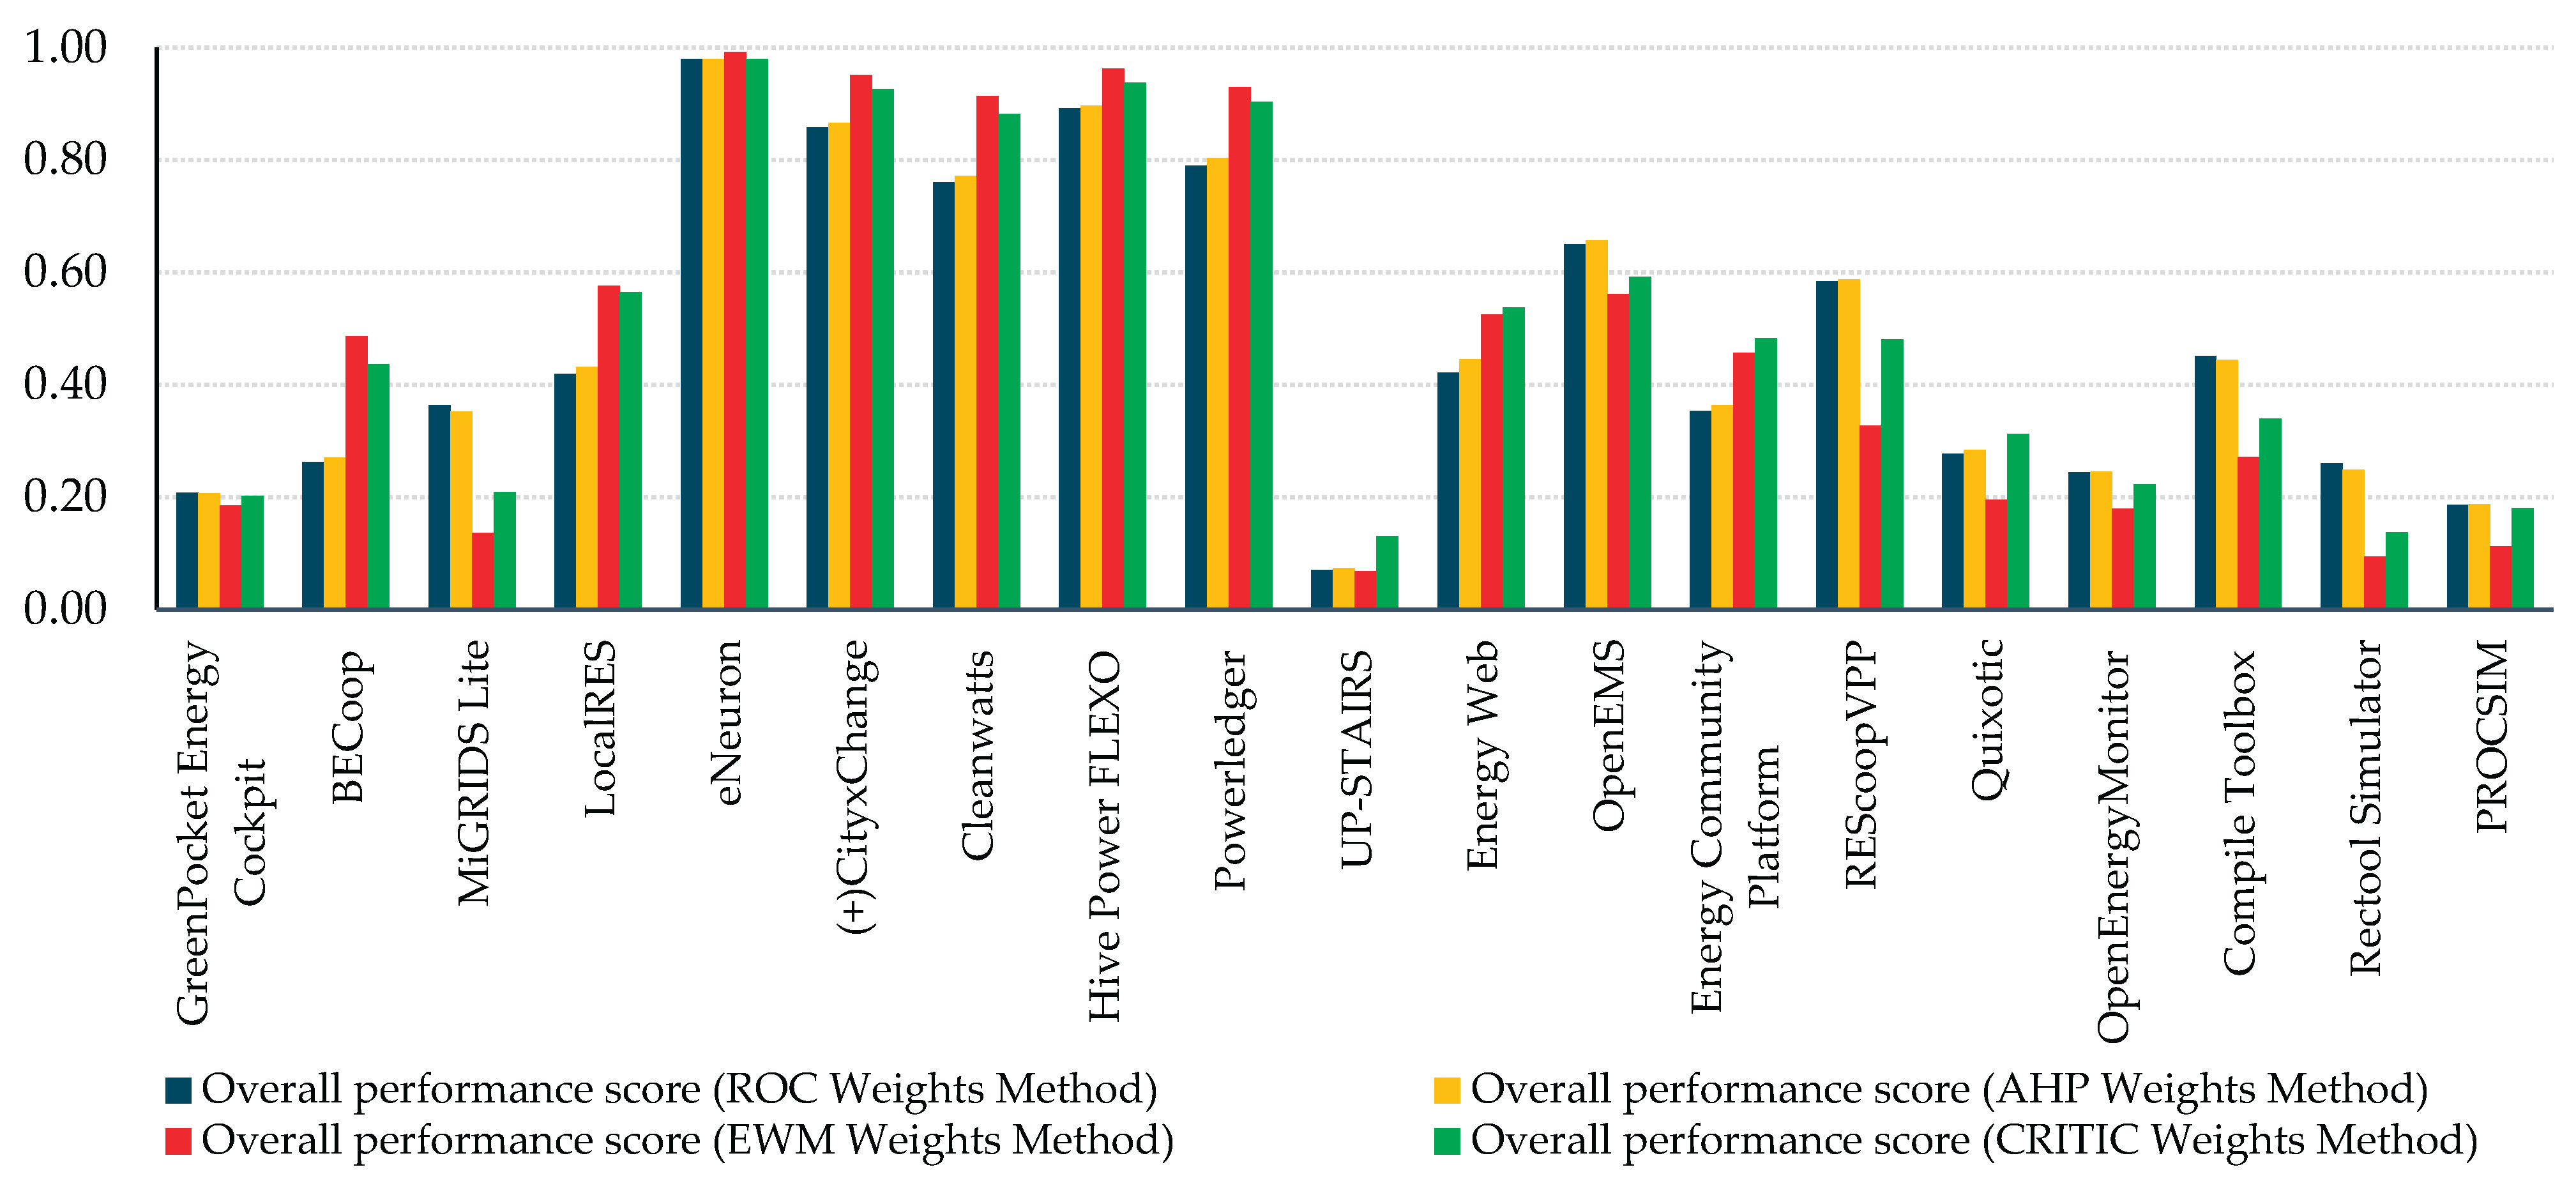

Table 1.
Overview of the selected EMTs for EC assessment, considering main aim of the software, scale and scope, reference studies in which the tool is considered.
Table 1.
Overview of the selected EMTs for EC assessment, considering main aim of the software, scale and scope, reference studies in which the tool is considered.
| Tool/Platform | Goal/Description | Scale and Scope | References |
|---|---|---|---|
| MiGRIDS Lite | Open-source tool for microgrid energy modelling, dispatch optimisation, and sizing using real data. | Small-scale or isolated microgrids (village or island level). | [58,59] |
| LocalRES | Supports municipalities and stakeholders in planning, designing, and optimising Renewable Energy Communities (RECs). | Medium-scale local energy communities (municipal or district level). | [60] |
| eNeuron | Multi-energy carrier simulation and optimisation integrating electricity, heat, gas, and mobility. | Medium to large-scale REC or multi-district systems. | [61] |
| (+CityxChange) | Demonstrates positive-energy blocks and local energy trading within smart-city environments. | Medium to large city districts. | [62,63,64,65,66] |
| Cleanwatts (Kiplo) | Commercial digital platform for creation and optimisation of RECs with PV, BESS, and EVs. | Scalable from small residential RECs to multi-community portfolios. | [67,68,69] |
| Hive Power FLEXO | Flexibility and community orchestration platform for DSOs, aggregators, and RECs. | Medium to large communities, scalable to national aggregation. | [70] |
| Powerledger (xGrid / TraceX) | Blockchain-based local energy-trading platform enabling peer-to-peer and prosumer market transactions. | Large-scale implementation—from community pilots to national and international markets. | [71,72,73] |
| GreenPocket Energy Cockpit | A consumer-facing web & mobile app for energy visualization and engagement used in community pilots to give households transparency on consumption, production, peer comparison, and community features. | From small scale communities to medium scale communities | [74,75] |
| BECoop (H2020) | BECoop aims to put communities in charge of their local renewable (bio)energy generation, overcoming barriers such as knowledge and policies to make bioenergy heating communities more appealing. | Mostly aimed for small, local or regional communities | [76,77] |
| UP-STAIRS (H2020) | The project’s goal is to accelerate the creation of energy communities in the EU by deploying One-Stop Shops, facilitating adoption of renewable energy projects, and enabling local actors to navigate complexity. | Scope of the project is to build small or medium and local communities, but with idea to do that in as many regions across EU as possible. | [78,79] |
| COMPILE Toolbox / ComPilot | Project aims to provide the technical stack, community tools, and support to enable community energy to operate reliably while respecting network constraints, especially in weak grid, islanded systems. | Focus on smaller scale, local communities and microgrids. | [80] |
| OpenEnergyMonitor (Emoncms) | Providing an open-source, modular monitoring, logging, visualization, and data analysis platform for energy systems, enabling users to better understand and interact with their energy usage and systems. | For smaller enviroments, more aimed for single household or small community. | [81,82] |
| Rectool Simulator | To provide tool, for predicting energy behaviour of RECs on the basis of their fundamental planning parameters (type/number of members, installed generation, geographical location). | Small and Medium-sized Enterprises (SMEs) and private customers | [83,84] |
| PROCSIM | Helping to reduce the carbon footprint, by helping to create datasets for generalization, testing and evaluation of renewable energy resource management. | Generalized datasets, for applying the data to medium, larger scale communities. | [85] |
| Energy Web | Acceleration of the global energy transition by providing an open-source, enterprise-grade blockchain | Scales from small communities to global utilities and enterprises. | [86,87] |
| OpenEMS | Open-source modular platform to manage DER, storage, renewables, and flexibility | Scales from small communities to industrial and utility-scale systems | [88,89] |
| REScoop Energy Community Platform | One-stop hub supporting creation and governance of citizen energy communities | Scales from small local groups to national and EU-wide networks | [90] |
| REScoopVPP | Community-driven Virtual Power Plant enabling flexibility, renewables, and smart buildings | Scales from small energy communities to national cooperative networks | [91,92] |
| Quixotic | Cloud-based software as a service platform automating billing, contracting, and energy communities | Scales from small energy communities to utilities and large retailers | [93] |
Table 2.
Each KPI criteria rankings by authors.
| Author/KPI criteria | TECH | OPER | ECON | QUAL | ENVIR | SOC |
| Author 1 | 1 | 2 | 3 | 4 | 5 | 6 |
| Author 2 | 1 | 2 | 3 | 4 | 6 | 5 |
| Author 3 | 2 | 1 | 4 | 3 | 6 | 5 |
| Author 4 | 1 | 3 | 4 | 2 | 6 | 5 |
| Author 5 | 1 | 2 | 3 | 4 | 6 | 5 |
| Author 6 | 2 | 1 | 4 | 3 | 5 | 6 |
| Final ranking | 1 | 2 | 4 | 3 | 6 | 5 |
Table 3.
Weight coefficients by ROC, AHP, EWM and CRITIC methods.
| KPI criteria/ Method of weight calculation | ROC | AHP | EWM | CRITIC |
| TECH | 0.4083 | 0.3735 | 0.1328 | 0.1373 |
| OPER | 0.2417 | 0.2545 | 0.1262 | 0.1643 |
| ECON | 0.1028 | 0.1021 | 0.2369 | 0.1536 |
| ENVIR | 0.0278 | 0.0430 | 0.3386 | 0.2046 |
| SOC | 0.0611 | 0.0650 | 0.1040 | 0.1811 |
| QUAL | 0.1583 | 0.1620 | 0.0614 | 0.1591 |
Disclaimer/Publisher’s Note: The statements, opinions and data contained in all publications are solely those of the individual author(s) and contributor(s) and not of MDPI and/or the editor(s). MDPI and/or the editor(s) disclaim responsibility for any injury to people or property resulting from any ideas, methods, instructions or products referred to in the content. |
© 2025 by the authors. Licensee MDPI, Basel, Switzerland. This article is an open access article distributed under the terms and conditions of the Creative Commons Attribution (CC BY) license (http://creativecommons.org/licenses/by/4.0/).
Copyright: This open access article is published under a Creative Commons CC BY 4.0 license, which permit the free download, distribution, and reuse, provided that the author and preprint are cited in any reuse.


