1. Introduction
Individuals with severe hearing loss usually lose their ability to produce speech normally. The intelligibility of their speech diminishes over time, which can severely hinder their day-to-day communication. Studies have shown that the children who are prelingually deaf and receive a cochlear implant (CI) at a much younger age, before the age of four, the development of their speech production ability can be comparable to their normal-hearing (NH) peers [
1]. However, individual performance with CI is dependent on various factors including the age of implantation, duration of hearing loss, the presence of residual hearing, etc. [
2,
3].
Previous studies in classifying various impairments in voice such as neuralgic, traumatic, psychogenic disorder etc. [
4,
5,
6] commonly use machine learning algorithms on various acoustic features such as Mel-Frequency Cepstral Coefficients (MFCCs), energy, and pitch features etc. The same approach was also employed on the word-based and frame-based classification of the speech produced by CI users and the hearing-aid users [
7]. In our study, we are extending the investigation of the efficacy of one of the machine learning algorithms: Support Vector Machine (SVM) algorithm with four different kernel functions in classifying the continuous speech produced by NH talkers and CI talkers using different acoustic features. The cortical responses to the same speech produced by NH talkers and CI talkers in 11 normal-hearing listeners were recorded using the electroencephalogram (EEG). The feature extraction methodologies used to extract acoustic features were also applied to extract brain wave features from EEG signal. This is based on the ‘quasi-stationarity’ property observed in EEG signal, which is also observed in speech signal. If the EEG are examined over a short period of time (5 to 100 ms), the signal characteristics in EEG is assumed to be stationary. In this paper, we quantified the differences in various acoustic features extracted from the speech produced by NH talkers and CI talkers as well as the EEG collected in response to the speech produced by the two talker groups in normal-hearing listeners in an attempt to classify them using SVM.
Recent studies have explored deep-learning frameworks such as CNNs, RNNs, and hybrid SVM–CNN models for EEG-based speech decoding and classification [
24,
25,
26]. These approaches, while demonstrating promising accuracies, typically require large, balanced datasets and intensive computational resources. Moreover, deep models often lack interpretability and can be prone to overfitting when applied to small-scale neurophysiological datasets. In contrast, traditional kernel-based classifiers such as SVMs have proven advantageous in constrained-data scenarios due to their strong generalization ability, reduced parameter tuning, and robustness to noise. However, previous SVM-based approaches have primarily focused on unimodal speech or EEG signals, with limited work integrating both modalities in a unified analysis. This study addresses this gap by evaluating SVM kernels for combined speech–EEG classification of normal-hearing and cochlear implant talkers. Given the modest data size in this proof-of-concept study, SVMs were chosen to minimize overfitting and to enable systematic comparison across kernel functions. Future work will investigate deep architectures and ensemble approaches once larger, more balanced datasets become available.
The primary contributions of this work are threefold: (1) introducing a multimodal classification framework combining speech and EEG-derived features within a unified SVM-based pipeline, (2) providing a systematic comparison of multiple kernel functions (Linear, Polynomial, Gaussian, RBF) across both modalities, and (3) identifying the most discriminative acoustic and neural features for differentiating cochlear implant and normal-hearing speech. To our knowledge, this is among the first studies to apply SVM kernels simultaneously to speech and EEG data to evaluate auditory–neural correspondence.
The remainder of this manuscript is organized as follows:
Section 2 details the acoustic features extracted from speech and EEG signals.
Section 3 describes the SVM-based classification model and kernel functions.
Section 4 presents the data acquisition and feature extraction procedures.
Section 5 discusses the experimental results and analysis, followed by conclusions and future work in
Section 6.
Related Works
Several studies have explored machine learning techniques for classifying speech and EEG responses in normal-hearing (NH) and cochlear implant (CI) users. These works primarily focus on predicting auditory performance, artifact removal, emotion recognition, and speech enhancement using models like Support Vector Machines (SVM), Random Forests (RF), and neural networks. Below, we discuss relevant works in detail, highlighting their techniques, performance, and limitations, drawing from the references in this manuscript.
Seifert et al. (2002) [
1] conducted a descriptive analysis of voice and articulation changes in children post-CI. The technique involved qualitative assessment of speech production, with no performance metrics reported (N/A; qualitative; no ML). Limitations include small sample size (n=10) and absence of machine learning or EEG integration.
Kim et al. (2018) [
12] used advanced ML techniques (not specified in abstract) on postlingually deaf adults to predict CI outcomes. Prediction accuracy was not reported in the abstract. Limitations include focus on implantation timing, with no EEG or speech classification.
Ruff et al. (2017) [
13] performed acoustic analysis of speech quality versus hearing loss duration in CI users. The approach was descriptive, with no performance metrics (N/A). Limitations include no ML and reliance on clinical correlations only.
Dibazar et al. (2002) [
4] applied feature analysis (MFCC, energy) for pathological speech detection. Performance metrics were not reported. Limitations include general voice pathology focus, not CI-specific.
Grygiel et al. (2011) [
5] utilized Mel Cepstral processing + SVM for diagnosing vocal disorders from voice recordings. Accuracy was ~80%. Limitations include non-CI population and small dataset.
Pishgar et al. (2018) [
6] employed Mel-Cepstrum (MFCC + delta) features with an SVM (RBF kernel) for pathological voice classification, achieving a weighted 5-fold cross-validation score of 0.7469 (≈ 74.7%). Limitations include focus on general voice disorders—not CI or EEG data.
Mahmoudi et al. (2011) [
7] used multiple classifier fusion for voice disorders in children with CI/hearing aids. Accuracy: 96.9% (Avg). Limitations include word-based analysis, no continuous speech or EEG.
Mendel et al. (2017) [
16] created a corpus for deaf speech acoustic and production research. No performance metrics (N/A; data collection). Limitations include no classification, focusing solely on acoustic corpus development.
Tan et al. (2015) [
27] – Semi-supervised SVM on pre-implant fMRI (speech vs. silence contrast) to predict CI language outcomes; Accuracy = 81.3% (up to 93.8 % with 2 features); fMRI-only, no EEG integration.
Raghavendra et al. (2022) [
17] introduced a single-trial EEG regenerative model for cortical entrainment to CI/NH speech. Correlation: NH=0.12, CI=0.08 (p<0.05). This prior work serves as the foundation for the current SVM analysis, extending to multimodal classification.
These studies underscore the novelty of our approach, which is the first to integrate SVM kernels with both continuous speech acoustics and EEG-derived features from the same stimuli, achieving up to 100% accuracy on Energy features.
2. Speech/EEG Features
A set of six acoustic features were chosen such that the log energy and pitch(f0) to characterize for prosodic aspects of the speech, whereas linear predictive coefficients (LPC), an articulatory feature to consider the physiological differences in two groups of speech. MFCCs and perceptual linear predictive cepstral coefficients (PLP-CC) are the perceptual features [
8]. Zero-crossing rate (ZCR) is one of the physical features [
9] of the speech, which was also extracted.
2.1. Log Energy
The logarithmic energy is calculated by:
where
N represents the number of samples in one frame and
s is the input speech signal. The frame logarithmic energy is calculated by fragmenting the speech waveform into a number of frames by windowing [
10]. All logarithmic computations in this study were performed using log₁₀ to maintain consistency across energy and spectral domains, as log₁₀ scaling provides normalized magnitudes suitable for comparative feature analysis in both speech and EEG signals.
2.2. Zero Crossing Rate
The ZCR is explained as the rate at which the amplitude of a speech waveform passes the zero-axis in a specific time. ZCR provides information about the signal’s frequency content. Normally, the value of ZCR would be about 14 for the voiced part and about 49 for the unvoiced part in a sample of 10ms speech data. ZCR is calculated as [
11]:
where
and
where
x(
n) is the input speech signal,
w is the window defined by (4) and
m represents the frame.
2.3. Pitch
Pitch is estimated from the fundamental frequency of the audio signal [
11]. The short-term autocorrelation function is used in our study to calculate the pitch of a speech signal as given by:
where
x _is the input audio signal,
w _is the window and
k represents lag or shift. Pitch was estimated using an autocorrelation-based method with a 25 ms Hamming window and 10 ms step size. The lag search was restricted to 2.5–12.5 ms, corresponding to a pitch range of 80–400 Hz. Unvoiced frames were excluded using an energy-based voicing decision, and pitch outliers deviating by more than two standard deviations from the local mean were removed before feature extraction.
2.4. Linear Predictive Coefficients
The notion of linear predictive analysis is that the speech can be represented by the linear combination of past p speech samples (p-prediction order) [
11]. Linear prediction coding is a method of modeling the vocal tract transfer function to estimate formant frequencies [
12]. In our study, the autocorrelation formulation was employed to obtain LPC.
2.5. Mel-Frequency Cepstral Coefficients
Mel-frequency analysis is a perceptual speech analysis which mimics the functioning of a human ear which is more sensitive to lower frequencies than to higher frequencies. This can be represented by the Mel-scale which establishes the relationship between the perceived frequency
fmel and the actual frequency value
flinear and it is formulated as:
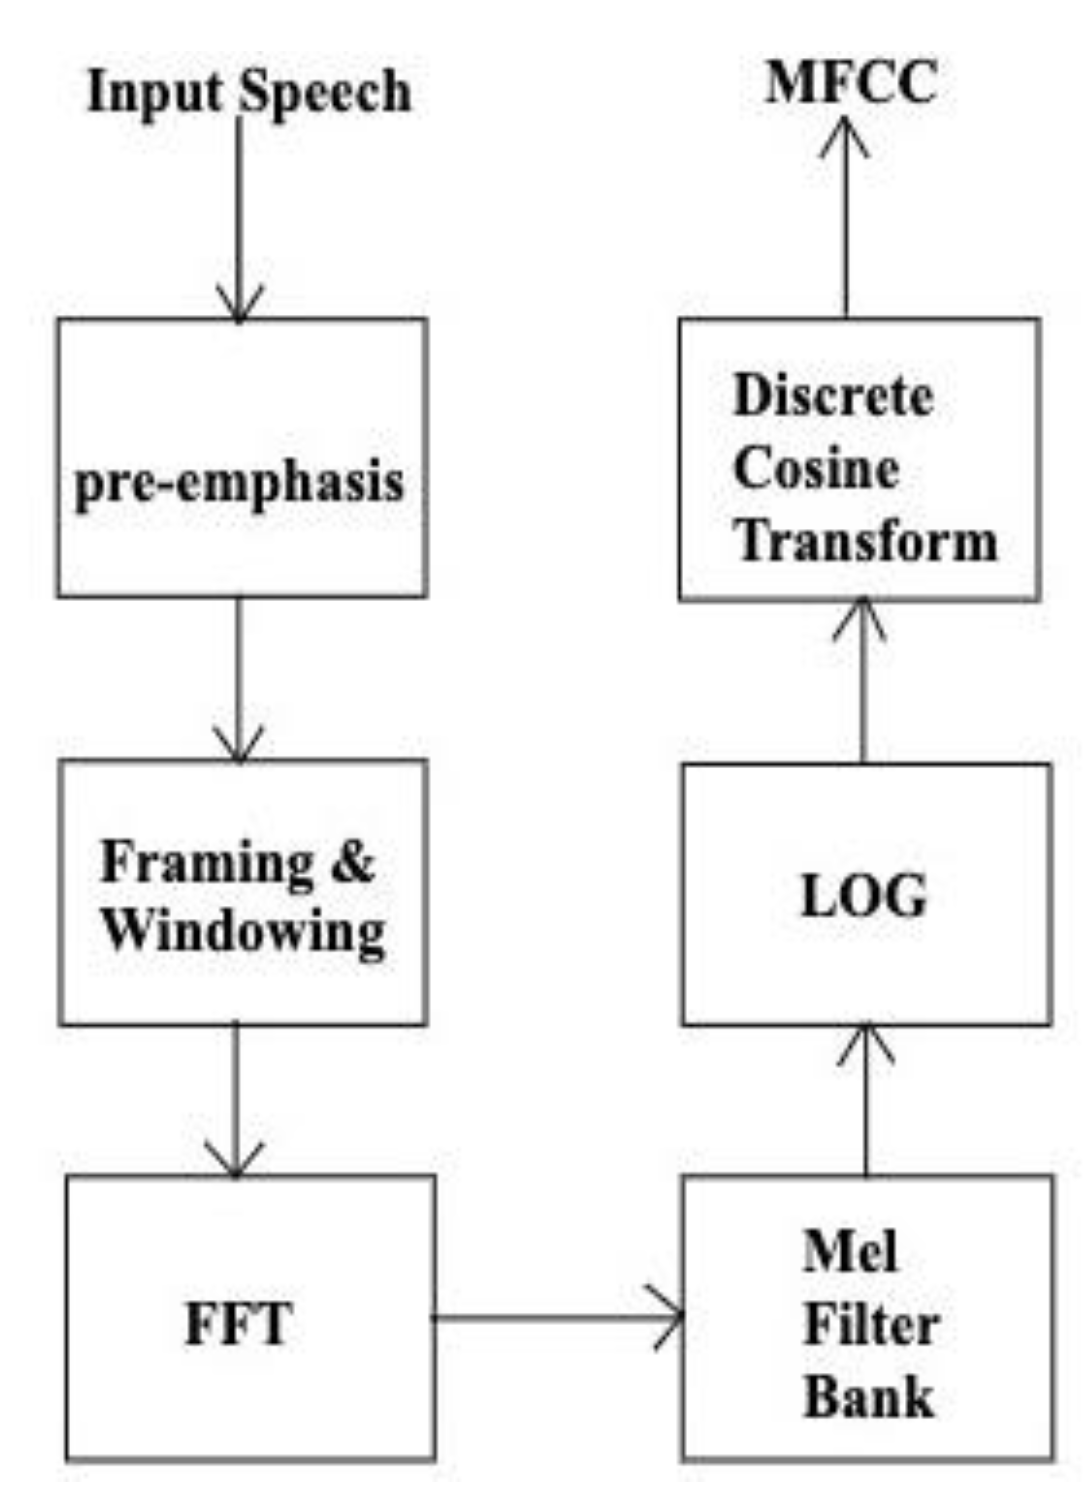
The flow chart of MFCC computation is shown in
Figure 1. Mel- Frequency analysis employs a greater number of triangular filters on the lower frequency region and lesser in the higher frequency region along the Mel-scale [
13]. Next step is to calculate the log energy of the output of each filter, followed by a discrete cosine transform (DCT) to transfer to the quefrency domain as given by:
MFCCs are the output, where m =1, 2, …., L. L is the number of Mel-scale cepstral coefficients and N is the number of triangular filters.
2.6. Perceptual Linear Predictive Cepstral Coefficients
The Perceptual linear predictive (PLP) analysis of speech [
14] is based on the perceptual aspect of the human ear. The PLP cepstral coefficients (PLP-CC) computation starts with windowing the speech signal and then calculating the power spectrum as:
where
S is the spectrum of the speech. The PLP feature vector was calculated by the psychophysical transformation of the power spectrum of the speech signal.
3. Classification Model
Support Vector Machine
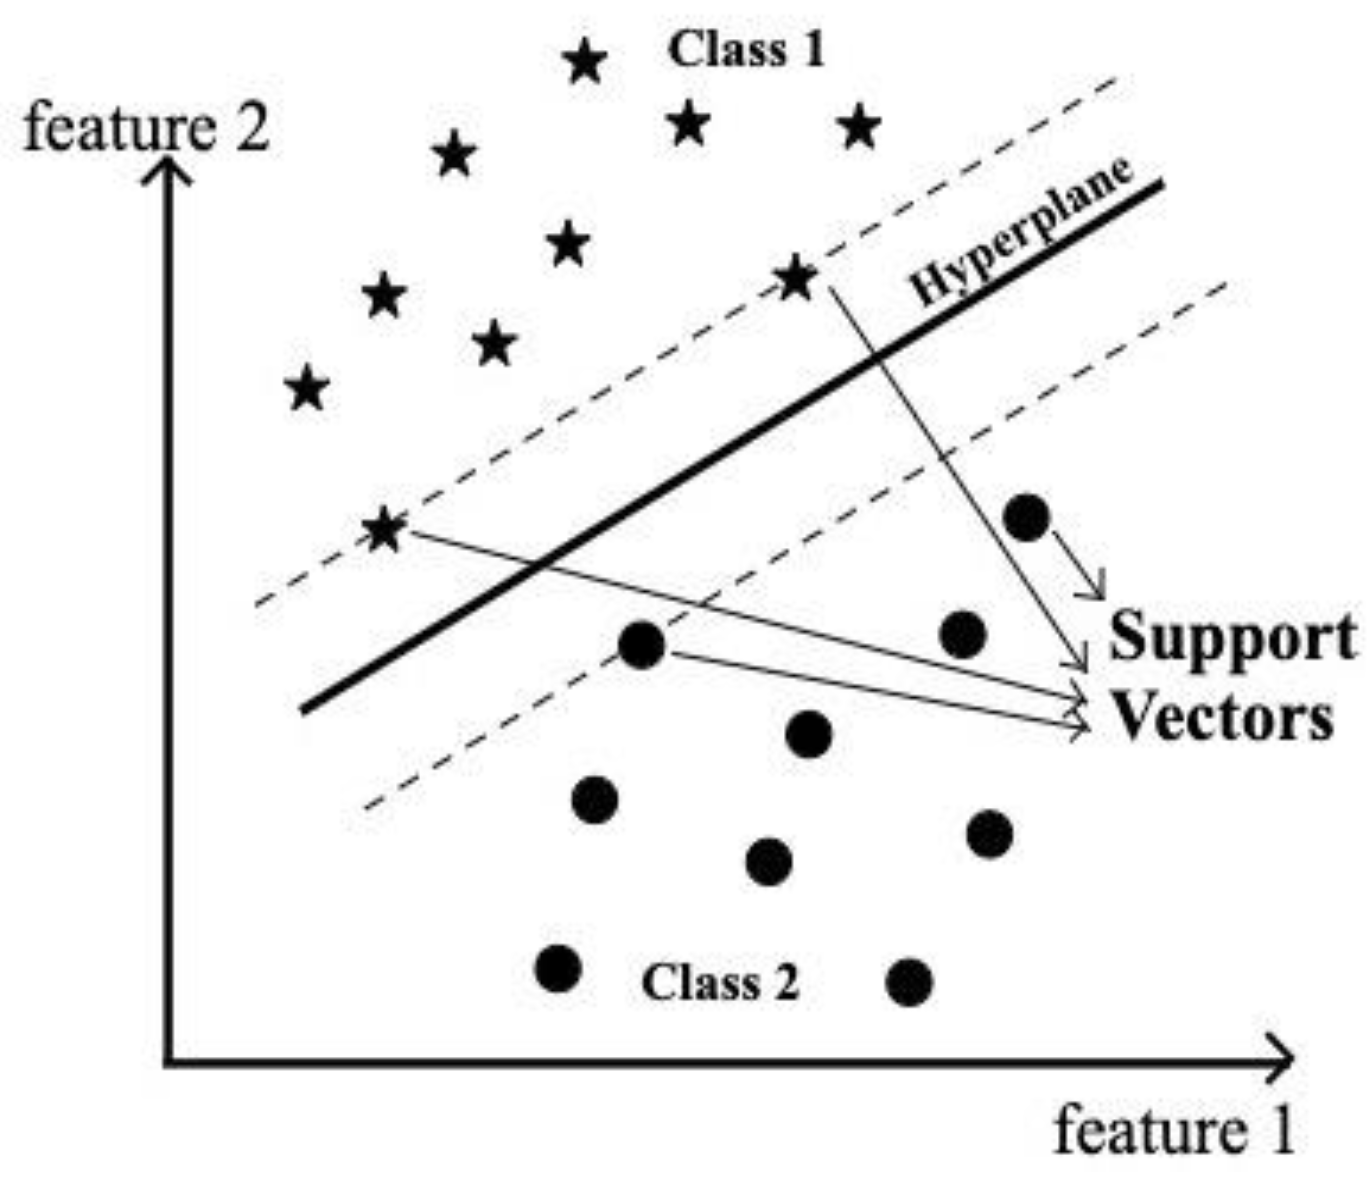
Support Vector Machine (SVM) is one of the supervised machine learning algorithms. SVM aims for maximum separation between the data points of different classes. Classification is achieved by constructing one or more optimal hyperplanes that achieve the distance as far as possible to the nearby data points which belong to any class as shown in
Figure 2. The data points lying on this margin on either side of the hyperplane are called support vectors. In our experiment, SVM was employed as a classification algorithm because of its better classification performance than any other machine learning algorithms [
15]. Hard margin SVM can be applied to linearly separable data as it is rigid and there is no flexibility for any misclassification by the model.
The Linear classifier finds the function/hyperplane f(x) which as given by:
with the largest margin such that sign(f(x)) = +1, for a positive example and sign(f(x)) = -1, for a negative example, where w is a weight vector, x is the input vector and b is a bias.
Soft margin SVM can be applied to data points that are not linearly separable by mapping original data into higher dimensional space. This is achieved by using a kernel function between the pairs of all training examples (xi, xj) which as given as [
16]:
In our paper, we employed four SVM kernel functions to classify the data points:
Slope α and constant c are the variables that can be tuned and σ decides the width of the Gaussian kernel.
Linear kernels are faster and can be useful when the data is linearly separable without the necessity be transferred to higher-dimensional space. The most common application is in text classification. Polynomial kernel utilizes the correlation between the data vectors and also between the combination of vectors. The Gaussian kernel is one specific example of the Radial Basis Function kernel (RBF). The advantages of the RBF kernel are that the mapping is infinite dimensional and that it results in a non-parametric model, where the prediction accuracy increases with the amount of data available for training and testing.
4. Materials and Methods
4.1. Data Acquisition
Speech: “The CI and NH talkers’ recordings were obtained from the Corpus of Deaf Speech for Acoustic and Speech Production Research [
17], which remains one of the most comprehensive publicly available corpora featuring synchronized acoustic recordings of cochlear implant users. The dataset was originally collected to study acoustic-phonetic variability and was used here for algorithmic validation rather than population-level generalization. The inclusion of eight CI and eight NH talkers ensured gender balance and covered a broad age range (16–77 years) to capture intra-group variability. While the corpus does not contain details such as months post-implantation or speech recognition scores, it reflects the heterogeneity of the CI population, which was essential to test the algorithm’s robustness against naturally occurring variation. Future work will include expanded datasets with metadata on device type, duration of implant use, and clinical outcomes. The data consists of the recorded speech passages of 8 CI talkers (4 females; 4 males) and 8 NH talkers (6 females; 2 males) reading “The Rainbow Passage”. The CI group has age between 16 and 77 years having a severe sensorineural hearing loss with at least pure-tone average of 70 dB HL (decibel hearing level), whereas the NH group aged between 15 and 51, had hearing better than 20 dB HL.
EEG: EEG data were recorded from 11 NH adult listeners, who are native speakers of American English, aged from 19 to 29 years (mean age = 21.5 years; 5 female, 6 male) following the protocols approved by the Institutional Review Board at the University of Texas at Dallas. The above chosen speech passages from 8 CI talkers and 8 NH talkers were presented to each NH listener in a randomized order. Their neural responses were recorded using a 64-channel actiCHamp amplifier EEG setup (Brain Products GmbH, Munich, Germany) while listening to the speech passages. Hence, 16 EEG signals were recorded in each listener corresponding to speech passages spoken by 8 CI talkers and 8 NH talkers. The EEG signals were recorded using an electrode cap (actiCAP, Brain Products GmbH, Munich, Germany)) placed in accord to the 10-20 system [Oostenveld and Praamstra, 2001]. The ground channel and the reference channel were located at FPz and FCz, respectively. All electrode impedances were maintained below 10 kOhms. EEG data were recorded with a sampling rate of 1000 Hz.
All the EEG data were preprocessed using the EEGLAB toolbox [Version14.1.2b; Delorme and Makeig, 2004] for MATLAB to prune the unwanted artifacts including muscle activity, eye blink, lateral eye movement, and heart beat related artifacts. The EEG preprocessing steps are explained in detail in our previous works [
18,
19,
20].
4.2. Feature Extraction
4.2.1. Speech
In our work, Log Energy, MFCCs and PLP-CC features are the audio features extracted using the open-source Emotion and Affect Recognition toolkit’s feature extracting backend openSMILE [
18]. Logarithmic energy is extracted with the cEnergy component in opensmile. Here, the speech is processed frame-by-frame in overlapping intervals because the speech is considered to be stationary in this short period of time and the speech features are extracted in those short intervals. The speech signals are analyzed in frames with short window sizes between 20 and 40ms with an overlap of 10ms between two frames so that the signals are assumed to be “quasi-stationary”. In this study, the framing window of 25 ms was considered with overlapping of 10ms between two frames. For MFCCs and PLP-CC, speech was pre-emphasized with k=0.97, this process ensures more weight to the higher frequencies. Later, MFCCs and PLP-CC features were extracted using a Hamming function after the pre-emphasis step. MFCCs were calculated using openSmile with cMelspec and cMfcc components and PLP-CC from the chain of cFFTmagphase, cMelspec and cPLP components which were of 39 and 18 dimensions respectively after appending delta and delta-delta coefficients.
ZCR, Pitch and LPC features were extracted using custom scripts in MATLAB2021b. LPC spectrum was calculated by the autocorrelation method with a prediction order p=12 using a Hamming window. ZCR and Pitch was extracted by an in-built audio extraction function zerocrossrate() and pitch()in MATLAB2021b respectively.
4.2.2. EEG
The same 6 features were also extracted from EEG signals. To extract Log Energy, MFCCs and PLP-CC brain wave features, we also used the openSMILE [
21] feature extraction toolkit. However, in EEG signal processing, the analysis window size of 25ms was multiplied by a factor of 10 due to the low frequency nature of EEG signals with overlapping of 10ms between two frames. The custom MATLAB scripts used to extract the speech features were also used to extract ZCR, Pitch and LPC brain wave features. The features were extracted from each of the 64 channels individually and then features from all 64 channels were merged together.
4.3. CI talkers and NH Talkers Classification: Speech and EEG
Input feature vector consists of six features: Energy, ZCR, Pitch, LPC, MFCCs, and PLP. The Polynomial kernel used was of degree 2, as a higher degree would result in an overfitted model. The SVM learner template was created with a different kernel function followed by training multiclass model for a one-vs-one (OVO) SVM classifier with features and the true labels {1, -1} for NH speech and CI speech respectively. K-fold cross-validation was performed on the data with k-fold=3 by dividing the data randomly into 3 subsets of equal size.
Training was performed with 2 (k-1) subsets and testing/validation with 1 subset with k (=3) iterations and finding the prediction response for testing observations. Accuracy values are calculated and averaged over three runs with training and testing on random data with each feature and with each kernel.
5. Results and Discussion
Talkers classification using speech:
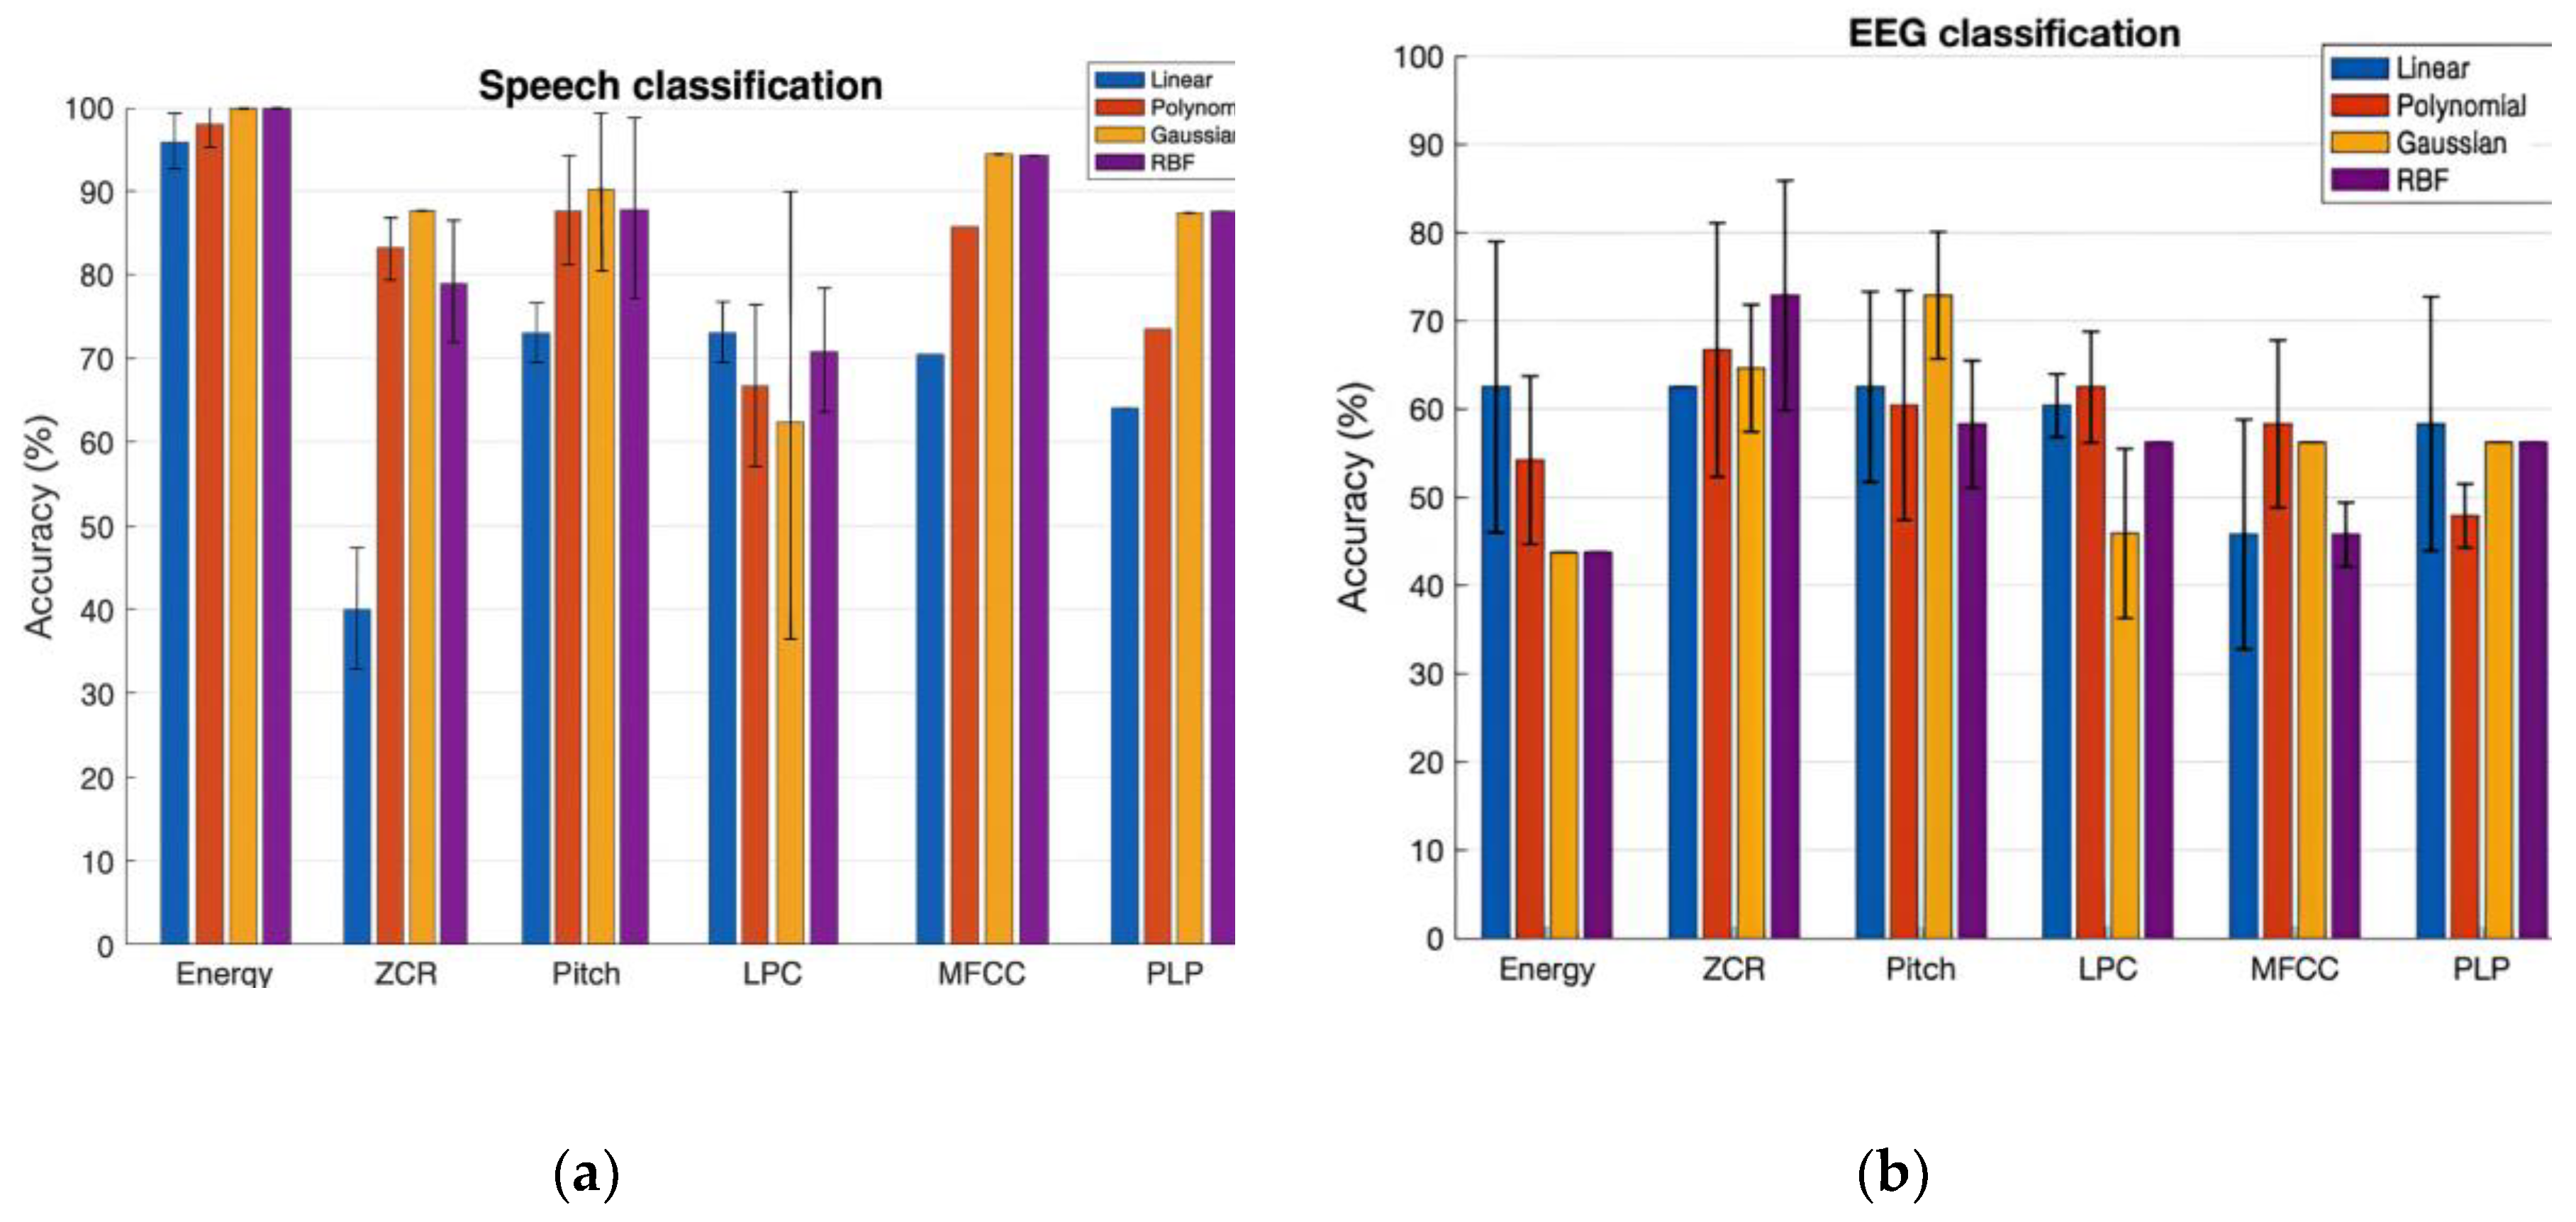
Table 1 and
Figure 3 (left panel) shows the prediction performance of the SVM classification of NH and CI speech with a set of six features. The bar plot shows the classification accuracy values in percentage for the Linear, Polynomial, Gaussian and RBF Kernel in the order. The variation in performance of each kernel across three runs is shown in the plot by error bars. Interpreting the results, Gaussian and RBF kernels both yield the best accuracy values of 100% with Energy feature and 94% with MFCCs feature respectively. Our experiment outcome supports the previous studies that the RBF generally outperforms linear and polynomial kernels as it ensures minimum approximation error in classification problems. This is also true for the Gaussian kernel since it is one of the forms of RBF kernel.
Better performance of SVM with the Log Energy and MFCCs indicate the preservation of the uniqueness in the characteristics of NH speech and CI speech by these two features. Pitch is one of the commonly considered features in discrimination of normal voice and impaired voice since it gives a considerable performance, as in our study, 89% correct classification. We also learned that the ZCR is not a good feature selection to classify NH speech and CI speech, since both are speech signals, they almost have the same rate of sign-changes along the signal unlike in the case of voiced/unvoiced speech [
22] and speech/music [
23], ZCR PLP-CC based classification give moderately accurate results. Our findings show that the RBF kernel performs better than Linear and Polynomial as RBF kernel provides infinite space mapping of the data to classify them. However, considering the tradeoff between the accuracy rate and computational time, the RBF kernel is not recommended for large scale data.
Talkers classification using EEG:
Table 2 and
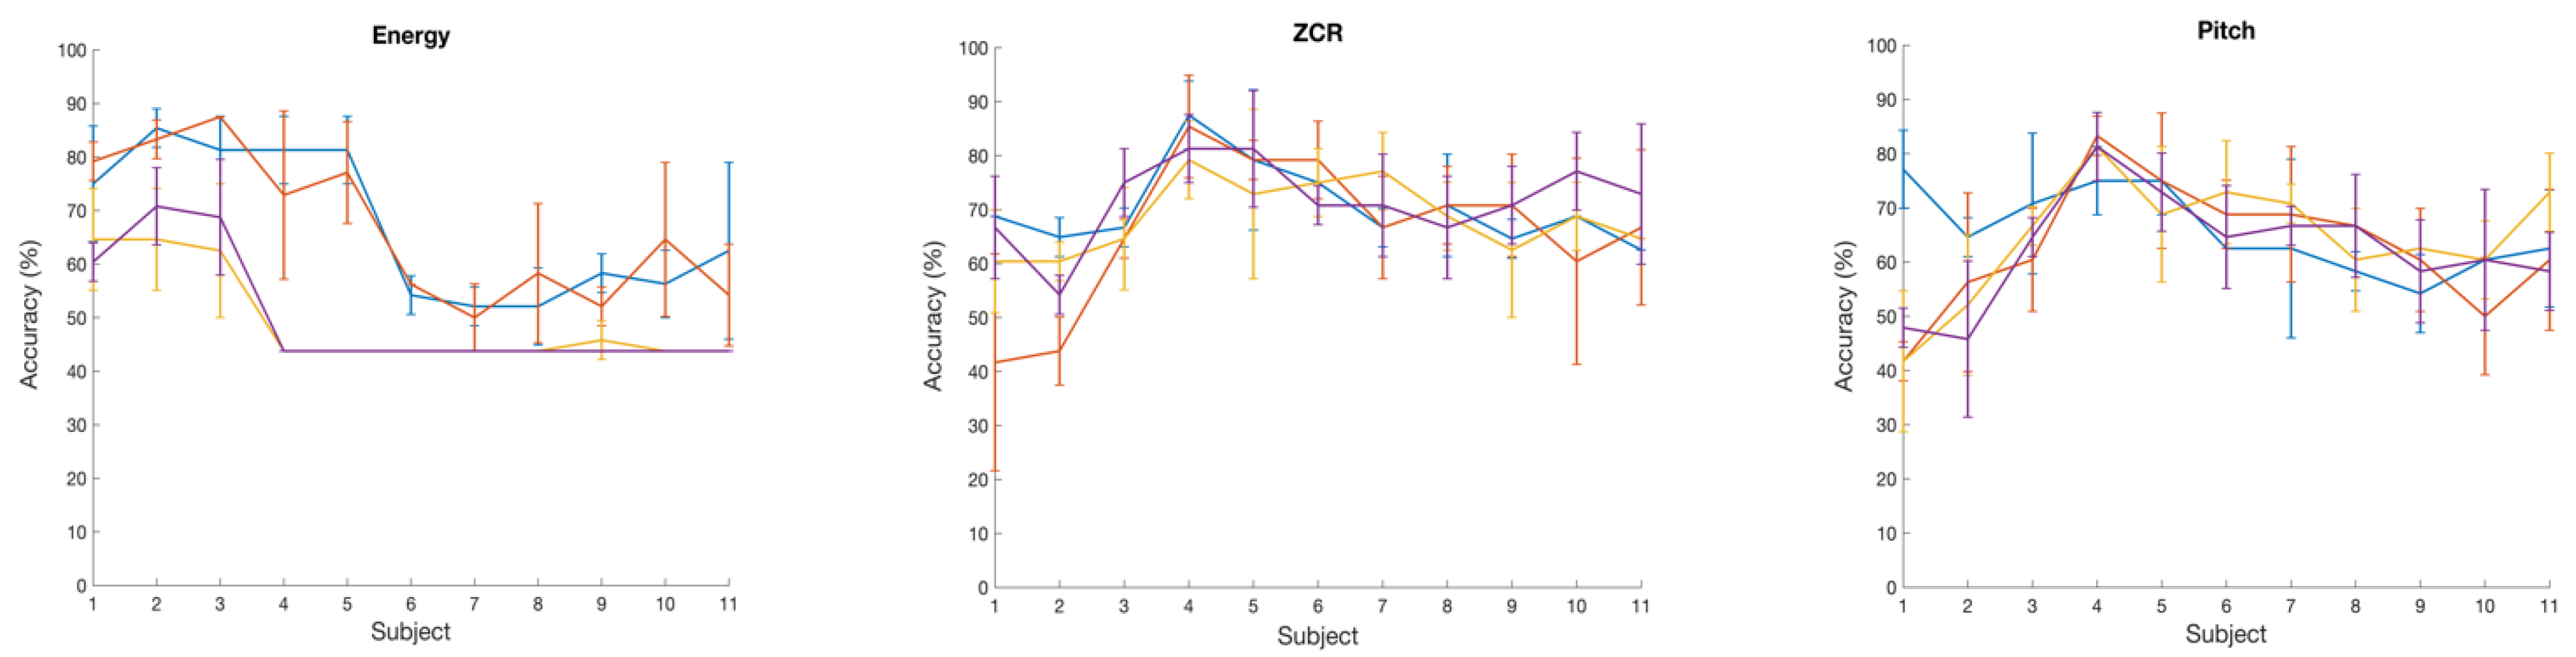
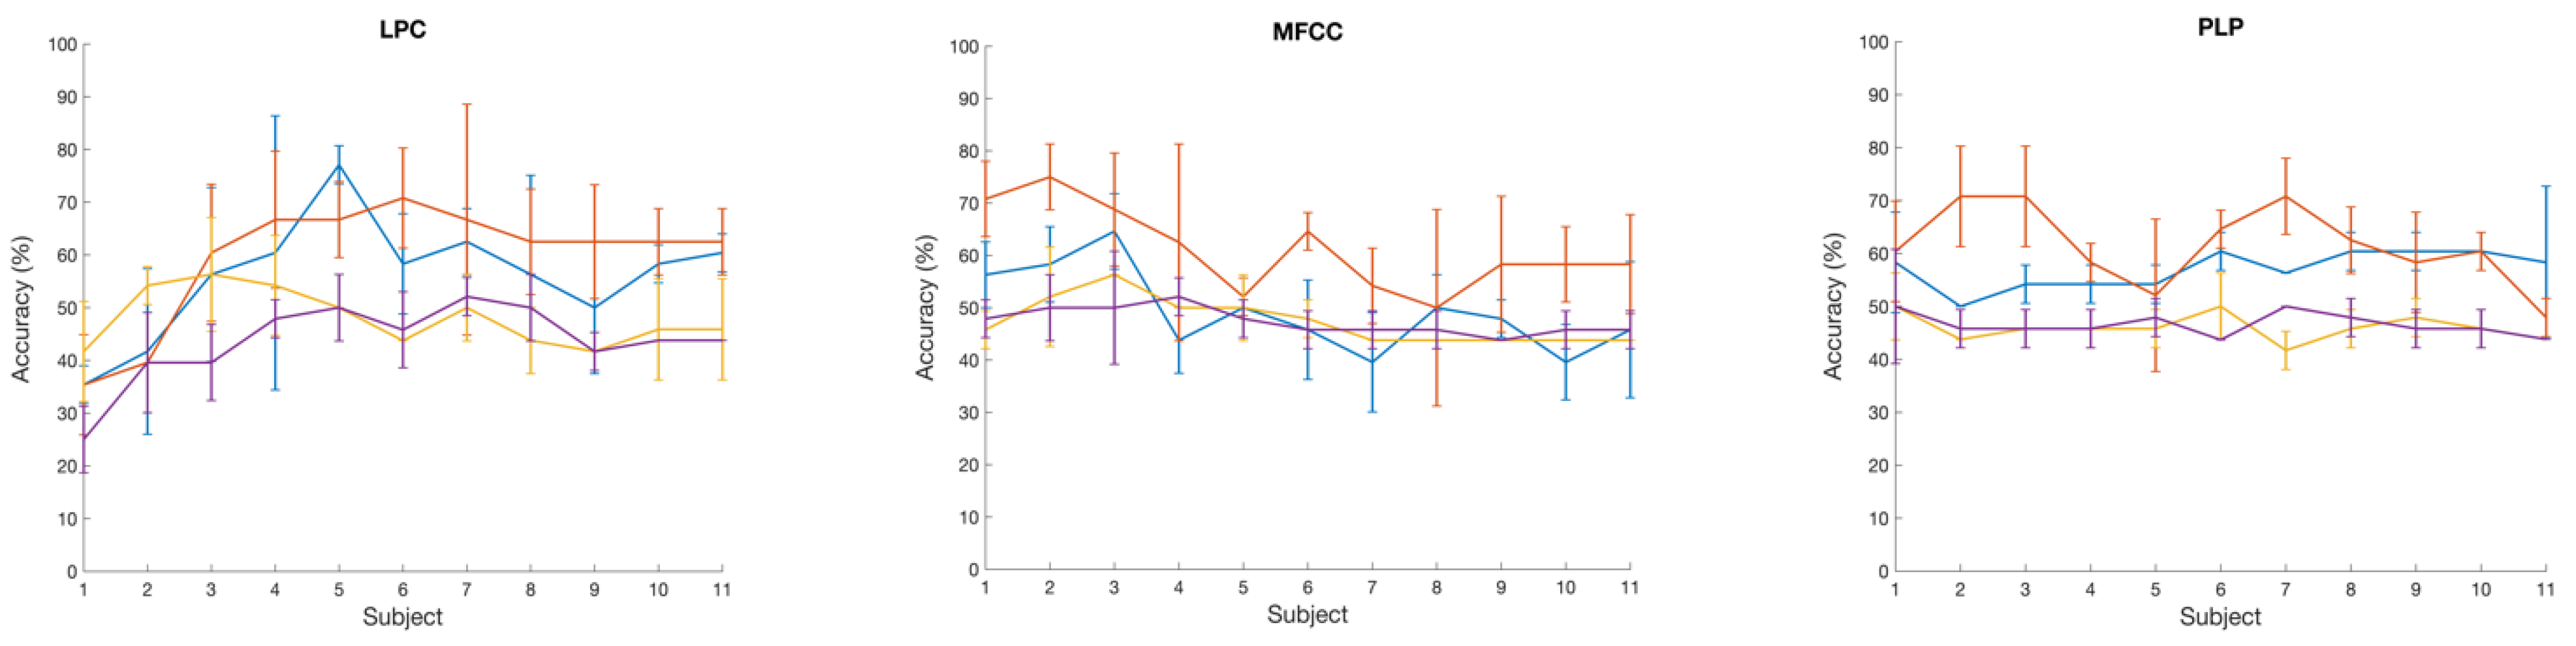
Figure 3 (right panel) shows the prediction performance of the SVM classification of two talker groups: NH and CI with a set of six brain wave features. Here also, RBF and Gaussian kernels both yield the best accuracy values of 73% with ZCR and Pitch brain wave features. On the other hand, Gaussian and RBF kernels performed poorly in classifying the two talker groups with Log Energy feature. With LPC, MFCC, and PLP brain wave features, in general, the classification accuracy with all kernels was below 60%. We also analyzed the variation in classification accuracy of the SVM with the increasing number of subjects. At first, only the brain wave features extracted from the EEG of subject 1 were included to evaluate the classification accuracy using 4 different kernels, followed by adding features from subject 2, subject 3 and so on.
Figure 4 shows the variation of accuracy while increasing the number of subjects, showing average accuracy calculated and also the standard deviation across 3 runs with 6 different brain wave features. With Log Energy, ZCR, Pitch, and MFCC features, a modest increase in classification accuracy was numerically observed when data from approximately four to five subjects were included; however, given the small sample size and the variability across runs, this observation should be interpreted qualitatively rather than as a statistically significant trend. The apparent pattern was derived from mean accuracy values across three cross-validation runs, but no formal statistical testing was performed due to limited sample size. This observation was not evident with the LPC and PLP brain wave features that the accuracy variation while increasing the number of subjects was almost flat for most of the kernels.
Table 2.
Average classification accuracies (%) of speech features for Normal-Hearing (NH) and Cochlear-Implant (CI) talkers using Support Vector Machines (SVMs) with four kernel functions (Linear, Polynomial, Gaussian, and RBF). Gaussian and RBF kernels show superior performance for perceptually relevant features such as Energy and MFCCs.
| Feature |
Linear |
Polynomial |
Gaussian |
RBF |
| Energy |
97% |
99% |
100% |
100% |
| ZCR |
39% |
83% |
87% |
78% |
| Pitch |
72% |
88% |
95% |
86% |
| LPC |
74% |
67% |
63% |
70% |
| MFCC |
70% |
85% |
94% |
94% |
| PLP (PLP-CC) |
63% |
73% |
86% |
86% |
Table 3.
Average classification accuracies (%) of EEG-derived features for Normal-Hearing (NH) listeners when exposed to speech from NH and CI talkers. Results are reported for four SVM kernel functions. ZCR and Pitch features exhibit the highest classification performance, particularly with Gaussian and RBF kernels.
| Feature |
Linear |
Polynomial |
Gaussian |
RBF |
| Energy |
63% |
55% |
45% |
44% |
| ZCR |
63% |
68% |
72% |
71% |
| Pitch |
62% |
66% |
70% |
72% |
| LPC |
63% |
58% |
64% |
61% |
| MFCC |
61% |
58% |
55% |
59% |
| PLP (PLP-CC) |
61% |
53% |
56% |
57% |
The obtained classification accuracies (up to 100% for speech and 73% for EEG) are comparable to or exceed those reported in previous pathological or auditory classification studies [
4,
5,
7,
21]. For example, Dibazar et al. (2002) reported 97% accuracy in pathological speech detection using MFCC features, while Mahmoudi et al. (2011) achieved 87% using hybrid classifiers for CI users. The higher accuracies achieved here can be attributed to feature optimization and careful kernel selection, demonstrating the robustness of SVMs in small-sample multimodal analyses.
Given the limited sample size and the exploratory nature of this proof-of-concept study, formal inferential statistics were not performed. Instead, descriptive statistics (mean ± standard deviation) across three cross-validation runs were reported to indicate the stability of classification performance. The primary purpose of this work was to evaluate the relative trends across features and kernels rather than to draw population-level statistical inferences.
Limitations and Future Scope
The current study was limited by the small number of talkers and listeners, which restricts generalization of the observed classification trends. The CI group also varied in age and device use history, potentially influencing acoustic variability. Moreover, only six low-level features were examined without exploring higher-order feature fusion.
Although the sample size was limited, the purpose of this work was to establish proof-of-concept for dual-modality (speech–EEG) classification using identical SVM kernels. Future studies will involve larger CI cohorts with metadata on device configuration and post-implant duration to examine generalizability. Future extensions will include larger datasets, alternative machine learning models such as convolutional neural networks and random forests, and statistical validation with permutation testing to further quantify model robustness.
6. Conclusion
This study demonstrated that SVM-based classification can effectively differentiate speech and EEG responses corresponding to normal-hearing and cochlear implant talkers. Among the six examined features, Energy and MFCCs showed the highest discriminative potential for speech, while Pitch and ZCR were the most informative EEG features. The findings highlight the feasibility of integrating acoustic and neural information for multimodal assessment of auditory performance. The conclusion is that Energy and MFCC features capture distinguishing acoustic–phonetic characteristics commonly observed in CI speech—such as reduced spectral contrast, atypical formant structure, and altered prosodic energy distribution—allowing these features to be discriminated from NH speech in the non-linear space. These characteristics likely reflect differences in auditory feedback and speech motor control among CI users, which are known to vary widely across individuals depending on implantation age, device type, and rehabilitation experience.
For EEG-derived features, Pitch and ZCR achieved the highest classification accuracies (~70–72%), demonstrating that cortical responses preserve talker-specific cues. However, limited participant numbers and inter-subject variability constrain generalizability. Future work will expand sample size, include statistical validation, and explore multimodal feature fusion to improve robustness
The results underscore that Gaussian and RBF kernels provide superior nonlinear separability in small-sample settings, supporting their use in future auditory classification pipelines. This proof-of-concept framework lays the foundation for neuroacoustic modeling approaches that can guide personalized hearing-aid fitting and cognitive hearing technologies. Future research will extend this model to larger datasets, include feature-level fusion, and evaluate transfer learning for cross-subject generalization.
Author Contributions
Conceptualization, Shruthi Raghavendra; methodology, Shruthi Raghavendra; formal analysis, Shruthi Raghavendra; data curation, Shruthi Raghavendra and Sungmin Lee; writing—original draft preparation, Shruthi Raghavendra; writing—review and editing, Shruthi Raghavendra, Sungmin Lee, and Chin-Tuan Tan; visualization, Shruthi Raghavendra; All authors have read and agreed to the published version of the manuscript.
Funding
This research received no external funding.
Institutional Review Board Statement
This study is a secondary analysis of de-identified data originally collected under protocols that were conducted in accordance with the Declaration of Helsinki and approved by the Institutional Review Board at the University of Memphis and the Institutional Review Board of the University of Texas at Dallas [
17,
18,
19,
20]. No additional ethical review was required for the present analyses.
Informed Consent Statement
Written informed consent was obtained from all participants (or from a parent/legal guardian for minors) during the original data-collection studies [
17,
18,
19,
20]. The datasets were fully de-identified before use in this work, and no new consent was sought.
Data Availability Statement
The dataset used in this study is not publicly available because it is part of an older project, and the principal investigator (PI) who led the project has since left the institution. As a result, the data has archived under institutional access controls and is no longer readily accessible for redistribution. Due to these circumstances, we are unable to share the dataset publicly.
Conflicts of Interest
The authors declare no conflicts of interest.
Abbreviations
The following abbreviations are used in this manuscript:
| CI |
Cochlear Implant |
| EEG |
Electroencephalogram |
| LPC |
Linear Predictive Coefficients |
| MFCC |
Mel-Frequency Cepstral Coefficients |
| NH |
Normal-Hearing |
| PLP-CC |
Perceptual Linear Predictive Cepstral Coefficients |
| RBF |
Radial Basis Function |
| SVM |
Support Vector Machine |
| ZCR |
Zero-Crossing Rate |
References
- Seifert, E.; Oswald, M.; Bruns, U.; Vischer, M.; Kompis, M.; Haeusler, R. Changes of voice and articulation in children with cochlear implants. Int. J. Pediatr. Otorhinolaryngol. 2002, 66, 115–123. [Google Scholar] [CrossRef] [PubMed]
- Kim, H.; et al. Cochlear implantation in postlingually deaf adult is time-sensitive towards positive outcome: prediction using advanced machine learning techniques. Sci. Rep. 2018, 8, 18004. [Google Scholar] [CrossRef] [PubMed]
- Ruff, S.; et al. Speech production quality of cochlear implant users with respect to duration and onset of hearing loss. ORL 2017, 79, 282–294. [Google Scholar] [CrossRef] [PubMed]
- Dibazar, A.A.; Narayanan, S.; Berger, T.W. Feature analysis for automatic detection of pathological speech. In Proceedings of the Second Joint 24th Annual Conference and the Annual Fall Meeting of the Biomedical Engineering Society, Houston, TX, USA; 2002; Volume 1, pp. 182–183. [Google Scholar]
- Grygiel, J.; Strumiłło, P.; Niebudek-Bogusz, E. Application of Mel Cepstral processing and Support Vector Machines for diagnosing vocal disorders from voice recordings. In Proceedings of the Signal Processing Algorithms, Architectures, Arrangements, Poznan, Poland, 2011, and Applications SPA 2011; pp. 1–4. [Google Scholar]
- Pishgar, M.; Karim, F.; Majumdar, S.; Darabi, H. Pathological Voice Classification Using Mel-Cepstrum Vectors and Support Vector Machine. In Proceedings of the 2018 IEEE International Conference on Big Data, Seattle, WA, USA; 2018; pp. 5267–5271. [Google Scholar]
- Mahmoudi, Z.; Rahati, S.; Ghasemi, M.M.; Asadpour, V.; Tayarani, H.; Rajati, M. Classification of voice disorder in children with cochlear implantation and hearing aid using multiple classifier fusion. Biomed. Eng. Online 2011, 10, 3. [Google Scholar] [CrossRef] [PubMed]
- Xie, L.; Liu, Z.Q. A Comparative Study of Audio Features for Audio to Visual Conversion in MPEG-4 Compliant Facial Animation. In Proceedings of the ICMLC, Dalian, China, 13–16 August 2006. [Google Scholar]
- Alías, F.; Socoró, J.C.; Sevillano, X. A Review of Physical and Perceptual Feature Extraction Techniques for Speech, Music and Environmental Sounds. Appl. Sci. 2016, 6, 143. [Google Scholar] [CrossRef]
- Qiang, H.; Youwei, Z. On prefiltering and endpoint detection of speech signal. In Proceedings of the Fourth International Conference on Signal Processing, Beijing, China, October 1998; Volume 1, pp. 749–752. [Google Scholar]
- Rabiner, L.R.; Schafer, R.W. Digital Processing of Speech Signals; Prentice Hall: Englewood Cliffs, NJ, USA, 1978. [Google Scholar]
- Dave, N. Feature extraction methods LPC, PLP and MFCC in speech recognition. Int. J. Adv. Res. Eng. Technol. 2013, 1. [Google Scholar]
- Davis, S.B.; Mermelstein, P. Comparison of Parametric Representations for Monosyllabic Word Recognition in Continuously Spoken Sentences. IEEE Trans. Acoust. Speech Signal Process. 1980, 28, 357–366. [Google Scholar] [CrossRef]
- Hermansky, H. Perceptual linear predictive (PLP) analysis for speech. J. Acoust. Soc. Am. 1990, 87, 1738–1752. [Google Scholar] [CrossRef] [PubMed]
- Kulkarni, P.N.; Gadhe, D.L. Comparison between SVM and other classifiers for SER. Int. J. Eng. Res. Technol. 2013, 2. [Google Scholar]
- Galić, J.; Popović, B.; Šumarac Pavlović, D. Whispered Speech Recognition using Hidden Markov Models and Support Vector Machines. Acta Polytech. Hung. 2018, 15, 11–29. [Google Scholar] [CrossRef]
- Mendel, L.L.; Lee, S.; Pousson, M.; Patro, C.; McSorley, S.; Banerjee, B.; Najnin, S.; Kapourchali, M.H. Corpus of deaf speech for acoustic and speech production research. J. Acoust. Soc. Am. 2017, 142, EL102. [Google Scholar] [CrossRef] [PubMed]
- Raghavendra, S.; Lee, S.; Chun, H.; Martin, B.A.; Tan, C.T. Cortical entrainment to speech produced by cochlear implant talkers and normal-hearing talkers. Front. Neurosci. 2022, 16, 927872. [Google Scholar] [CrossRef] [PubMed]
- Raghavendra, S.; Lee, S.; Chen, F.; Martin, B.A.; Tan, C.T. Cortical entrainment to speech produced by cochlear implant users and normal-hearing talkers. In Proceedings of the 2022 44th Annual International Conference of the IEEE Engineering in Medicine & Biology Society (EMBC), Glasgow, UK, July 2022; pp. 3577–3581. [Google Scholar]
- Raghavendra, S.; Chun, H.; Lee, S.; Chen, F.; Martin, B.A.; Tan, C.T. Cross-frequency coupling in cortical processing of speech. In Proceedings of the 2022 44th Annual International Conference of the IEEE Engineering in Medicine & Biology Society (EMBC), Glasgow, UK, July 2022; pp. 25–29. [Google Scholar]
- Eyben, F.; Weninger, F.; Gross, F.; Schuller, B. Recent Developments in openSMILE, the Munich Open-Source Multimedia Feature Extractor. In Proceedings of the ACM Multimedia (MM), Barcelona, Spain, October 2013; pp. 835–838. [Google Scholar]
- Bachu, R.G.; Kopparthi, S.; Adapa, B.; Barkana, B.D. Voiced/Unvoiced Decision for Speech Signals Based on Zero-Crossing Rate and Energy. In Proceedings of the IEEE International Joint Conferences on Computer, Information, and Systems Sciences, 2008., and Engineering (CISSE).
- Gouyon, F.; Delerue, O.; Pachet, F. On the use of zero-crossing rate for an application of classification of percussive sounds. In Proceedings of the Third Digital Audio Effect Conference; 2000. [Google Scholar]
- Park, H.; Lee, B. Multiclass Classification of Imagined Speech EEG Using Noise-Assisted Multivariate Empirical Mode Decomposition and Multireceptive Field Convolutional Neural Network. Front. Hum. Neurosci. 2023, 17, 1186594. [Google Scholar] [CrossRef] [PubMed]
- Ravanelli, M.; Parcollet, T.; Bengio, Y. SpeechBrain: A General-Purpose Speech Toolkit. arXiv preprint, 0462; .4. [Google Scholar]
- Wang, Q.H.; Kong, W.Z.; Zhong, J.T.; Shan, Z.Y.; Wang, J.; Li, X.W.; Peng, H.; Hu, B. A Hybrid SVM and Kernel Function–Based Sparse Representation Classification for Automated Epilepsy Detection in EEG Signals. Neurocomputing 2023, 562, 126874. [Google Scholar] [CrossRef]
- Tan, L.; Holland, S. K.; Deshpande, A. K.; Chen, Y.; Choo, D. I.; Lu, L. J. A semi-supervised support vector machine model for predicting the language outcomes following cochlear implantation based on pre-implant brain fMRI imaging. Brain Behav. 2015, 5(12), e00391. [Google Scholar] [CrossRef] [PubMed]
|
Disclaimer/Publisher’s Note: The statements, opinions and data contained in all publications are solely those of the individual author(s) and contributor(s) and not of MDPI and/or the editor(s). MDPI and/or the editor(s) disclaim responsibility for any injury to people or property resulting from any ideas, methods, instructions or products referred to in the content. |
© 2025 by the authors. Licensee MDPI, Basel, Switzerland. This article is an open access article distributed under the terms and conditions of the Creative Commons Attribution (CC BY) license (http://creativecommons.org/licenses/by/4.0/).