Submitted:
12 November 2025
Posted:
13 November 2025
You are already at the latest version
Abstract
A decentralized DC power exchange method is proposed to enable direct bidirectional power transfer among geographically distributed DC microgrids. Each microgrid is connected to a shared power exchange grid via a bidirectional DC/DC converter, al-lowing flexible participation regardless of location. The architecture supports dynamic scalability, permitting microgrids to join or leave the exchange network without dis-rupting overall operation. To evaluate the feasibility of the proposed method, a 2-to-2 power exchange experiment was conducted using lithium-ion batteries configured to emulate microgrid baselines. The results demonstrated that arbitrary power ratios can be achieved through appropriate adjustment of converter parameters, and that trans-mission loss and efficiency varies depending on the power distribution ratio. In addi-tion, the operational stability of the system was experimentally verified under sudden fluctuations in baseline voltage, such as those caused by abrupt changes in generation or load. Stable power exchange was maintained even under disturbances of several percent. These findings confirm the practicality and robustness of the converter-based archi-tecture and highlight its applicability to scalable, distributed DC microgrid intercon-nection.
Keywords:
DC power exchange
; DC/DC converter
; power routing
; decentralized power exchange
; DC microgrid
1. Introduction
To build a disaster-resilient society, regional microgrids are being deployed across various areas. These microgrids are generally classified into AC microgrids and DC microgrids. AC microgrids are typically constructed as extensions of existing utility grids and operate in synchronization with the grid under normal conditions [1,2,3,4], as shown in Figure 1(a). In the event of a disaster that causes a grid outage, they are designed to disconnect from the utility grid and operate in stand-alone mode. Consequently, each AC microgrid must include at least one grid-forming device—such as an emergency engine generator—that can establish an independent AC grid.
As illustrated in Figure 1(b), when a disaster occurs, the microgrid is islanded from the main grid, and the grid-former is activated to enable autonomous operation. However, if the backbone of the grid is severed due to the disaster, only those fragmented segments that contain a functioning grid-former can continue operating; segments without such a device cannot function as a grid.
In contrast, DC microgrids [5,6,7,8]—illustrated in Figure 2—are constructed independently of the utility grid and are designed to operate autonomously under both normal and emergency conditions. These microgrids incorporate devices capable of forming a DC grid, typically DC/DC converters powered by distributed energy resources. Unlike AC microgrids, DC microgrids may include multiple grid-forming devices to ensure redundancy, operating cooperatively through control methods such as droop control. Consequently, even if a disaster severs the grid backbone, any fragmented segment that contains at least one functioning grid-former can continue to operate independently, whereas segments without such a device cannot maintain grid functionality. This inherent resilience to physical disruption is a key advantage of DC microgrids.
Although DC microgrids are fundamentally designed for stand-alone operation and independence from the utility grid, some are configured to allow power exchange with the main grid (i.e., on-grid systems). Table 1 summarizes the key differences between AC and DC microgrids [9,10].
In addition to enhancing disaster resilience, regional microgrids also aim to promote sustainable living by integrating renewable energy sources such as solar and wind power [11]. However, due to the intermittent and unstable nature of these sources, they alone cannot guarantee a reliable power supply. To address this limitation, many microgrids are connected to the utility grid—either to supplement insufficient renewable generation or to export surplus electricity.
This configuration enables geographically separated microgrids to exchange power via the utility grid, allowing electricity to flow from surplus regions to those experiencing deficits, as illustrated in Figure 3. However, such exchange is only possible if the utility grid is functioning properly. In the event of a grid outage caused by a disaster, or in the case of intentionally off-grid microgrids, this exchange mechanism becomes unavailable. Therefore, a DC power exchange system that enables direct electricity transfer between DC microgrids—without relying on the utility grid—is highly desirable.
Various power exchange devices and power routers have been proposed for both AC and DC systems [12,13,14,15,16,17,18,19,20,21,22]. In digital communications, the term “router” typically refers to devices that deliver discrete data packets to their intended destinations based on routing tables—Wi-Fi routers being a familiar example. In analog communications, however, such devices are referred to as switches rather than routers.
A similar distinction applies in power systems: the term power router is appropriate when exchanging discrete power packets in a digital power grid [23,24,25], whereas power switch is more suitable when handling analog quantities of power. In this paper, we treat power as an analog quantity and propose a DC power exchange method that enables the transfer of specified amounts of electrical energy between DC microgrids, while accounting for transmission losses.
Power exchange methods can generally be categorized into centralized and decentralized types, as illustrated in Figure 4(a) and Figure 4(b), respectively. Most previously reported systems have adopted centralized approaches [26]. For example, Kado et al. proposed and demonstrated a three-port power exchange device capable of operating in both AC and DC modes [16,17]. In contrast, this paper focuses on a decentralized DC power exchange system that utilizes DC/DC converters distributed across multiple microgrids to facilitate power exchange.
2. Decentralized DC Power Exchange Method
An overview of the decentralized DC power exchange system proposed in this paper is shown in Figure 5. The system assumes power exchange among multiple DC microgrids located at geographically separated sites, each connected to a dedicated DC power exchange grid. Each microgrid is linked to the exchange grid via a bidirectional DC/DC converter. To minimize transmission losses during long-distance power exchange, the voltage is typically stepped up to a higher level.
All DC/DC converters are connected to a central controller via communication links, enabling centralized control. The controller can be located anywhere, including on a cloud-based network accessed via the internet. The proposed system consists of two main components: the power switch, which includes the DC/DC converters and the power exchange grid; and the control plane, which comprises the controller and communication infrastructure. These two components together form a system capable of exchanging analog quantities of power and energy between DC microgrids.
A key feature of the proposed decentralized DC power exchange method is its scalability—the number of microgrids participating in power exchange is not fixed. The system can flexibly accommodate configurations ranging from simple peer-to-peer (one-to-one) exchanges to complex many-to-many (m-to-n) exchanges among multiple microgrids. In contrast, centralized power exchange systems typically have a fixed number of ports [16,17,27], which limits the number of connectable microgrids. In the proposed method, microgrids can be freely added to or removed from the power exchange grid without structural constraints.
Moreover, since the power exchange grid itself is DC-based, its topology can be configured with high flexibility. Bus, star, ring, mesh, and other structures are all feasible, as long as each microgrid is connected to the grid with sufficient power capacity. The grid can be easily expanded or contracted, and additional power lines can be installed to increase capacity. As with conventional AC power systems, the power capacity of grid is determined by the thickness of the power cables and the operating voltage. Therefore, using cables with thicker conductors and operating at higher voltages helps reduce transmission losses and enhances overall power capacity.
To illustrate this, a simple calculation is presented. Figure 6 shows the calculated transmission loss as a function of the sending-end voltage, assuming that 10 kW of power is delivered to a load located 1 km away, with the type of CV cable used as a parameter. For typical microgrid backbone voltages of 350–400 V, a conductor cross-sectional area of at least 22 mm2 (22 SQ) is required. Consequently, the practical transmission distance using 22 SQ CV cables is limited to only a few kilometers. Therefore, for power exchange between microgrids separated by several tens of kilometers, the power exchange grid must operate at several kilovolts.
3. Power Exchange Method
3.1. Peer-to-Peer Power Exchange
The most fundamental procedure is peer-to-peer (one-to-one) power exchange, which consists of the following steps:
1) Formation of the Power Exchange Grid
The sending-side microgrid applies a specified voltage to the power exchange grid via its DC/DC converter, thereby forming the exchange grid. In this step, the DC/DC converter on the sending side operates in output voltage control mode. Prior to initiating the exchange, the power exchange grid is assumed to be in a de-energized state, with no voltage applied.
2) Power Transmission
Next, the receiving-side microgrid draws power from the exchange grid via its DC/DC converter until the desired amount of energy is received at the specified power level. In this step, the DC/DC converter on the receiving side operates in output current or power control mode.
3) Termination of Transmission and Grid Deactivation
Once the receiving-side microgrid has received the desired amount of electrical energy, it terminates the reception. The sending-side microgrid then stops applying voltage to the exchange grid, returning it to the de-energized state.
In this sequence, the receiving-side microgrid determines the amount of power to be exchanged, while the sending-side microgrid passively supplies the total required power—comprising the power received by the receiving-side microgrid plus transmission losses, including the conversion losses of both DC/DC converters and the conductor losses in the exchange grid. Although the baseline voltages of the participating microgrids may differ, it is common practice to perform the exchange at a voltage higher than both baseline voltages, as illustrated in Figure 7.
The electrical equivalent circuit for peer-to-peer power exchange is shown in Figure 8. Let the baseline voltage of the sending-side microgrid be VGS, and that of the receiving-side microgrid be VGR. The power conversion efficiencies of the DC/DC converters on the sending and receiving sides are denoted by ηS and ηR, respectively. The exchange grid cable has a conductor resistance r. The sending-side DC/DC converter applies a voltage VS to the exchange grid, and the receiving-side microgrid draws a current IR from it. In this case, the power received by the receiving-side DC/DC converter, PR, is given by Equation (1), and the actual power received by the microgrid, PGR, is ηR PR:
On the other hand, the power delivered to the exchange grid by the sending-side DC/DC converter, PS, is VS IR, and the actual power supplied by the sending-side microgrid, PGS, is PS/ηS. Therefore, the transmission efficiency between the microgrids, PGR/PGS, is given by Equation (2):
Equation (2) shows that the transmission efficiency is proportional to the product of the conversion efficiencies of both DC/DC converters. It also increases with higher transmission voltage and decreases with larger conductor resistance and exchange current (i.e., power). Therefore, assuming constant transmission voltage and converter efficiency, transmitting a fixed amount of energy at a lower power level over a longer duration results in lower transmission losses and higher efficiency.
However, as will be discussed in the following section, the conversion efficiency of DC/DC converters is not constant with respect to transmitted power.
3.2. m-to-n Power Exchange
Next, the procedure for multi-point power exchange involving m sending-side microgrids and n receiving-side microgrids is described, as illustrated in Figure 9.
1) Formation of the Power Exchange Grid
One of the sending-side microgrids applies a specified voltage to the power exchange grid via its DC/DC converter, thereby forming the exchange grid. In this step, the DC/DC converter operates in output voltage control mode.
2) Initiation of Power Exchange
Next, one of the receiving-side microgrids begins drawing power from the exchange grid at a specified power level via its DC/DC converter. In this step, the converter operates in output current or power control mode.
3) Sequential Participation in Power Exchange
If additional sending-side or receiving-side microgrids are present, their DC/DC converters sequentially begin transmitting to or receiving from the exchange grid at specified power levels. Receiving-side converters operate in output current or power control mode, while sending-side converters operate in input current or power control mode.
4) Termination of Power Exchange and Grid Deactivation
Once each microgrid completes its intended transmission or reception, it sequentially terminates its participation. After all sending-side and receiving-side microgrids have completed their exchanges, the initial sending-side microgrid ceases applying voltage to the exchange grid, returning it to a de-energized state.
Throughout this sequence, the microgrids other than the initial sending-side microgrid take the lead in determining the amount of power to be exchanged. The initial sending-side microgrid, while responsible for forming and maintaining the exchange grid, does not initiate or control the exchange itself; rather, it passively follows the power exchange demands of the other participating microgrids. From this grid, the total power drawn includes the sum of all exchanged power plus transmission losses—namely, the conversion losses of all DC/DC converters and the conductor losses within the exchange grid.
The electrical equivalent circuit for m-to-n power exchange is shown in Figure 10. The DC/DC converter of the grid-forming microgrid (in this case, Microgrid 1) is modeled as a voltage source, while the converters of all other microgrids are modeled as current sources.
In addition to the method described above, an alternative approach involves using a dedicated grid-forming unit—such as a battery or a DC voltage source—separate from the participating microgrids. In this configuration, the grid-former continuously applies voltage to the exchange grid, enabling power exchange at any time. This allows any microgrid to initiate power exchange independently.
4. Peer-to-Peer Power Exchange Experiment
To validate the method described in the previous section, a power exchange experiment was conducted using bidirectional DC/DC converters. In this experiment, the baselines of the DC microgrids were represented by batteries [28,29], and power exchange was performed between two batteries, as illustrated in Figure 11. The batteries used were lithium iron phosphate (LiFePO4) batteries with a terminal voltage of approximately 52 V [30]. Two units of the TDK-Lambda EZA2500-32048FC bidirectional DC/DC converter were employed. The experiment was conducted with the high-voltage sides of both DC/DC converters nearly directly connected, allowing us to neglect power losses in the exchange grid.
Figure 12 plots the transmission losses and transmission efficiency versus received power for both transmission directions. Since the system configuration was symmetrical for sending and receiving, the results showed similar trends in both directions. Transmission losses were minimized around a received power of 600 W and gradually increased with higher received power. On the other hand, transmission efficiency improved when operating closer to the converter’s maximum rated power of 2.4 kW, due to the characteristics of the DC/DC converters used in the experiment. A maximum efficiency of approximately 87% was achieved. This value is reasonable considering that, according to the specifications shown in Table 2, the maximum power conversion efficiency of each DC/DC converter is 94% [31].
5. 2-to-2 Power Exchange Experiment
This section describes a 2-to-2 power exchange experiment involving two sending-side batteries and two receiving-side batteries, as illustrated in Figure 13. According to the procedure described in Section 3.2, the system transitions from a peer-to-peer power exchange state to either a 1-to-2 or 2-to-1 configuration, and finally reaches the 2-to-2 exchange state. We begin by describing the transition from peer-to-peer to 1-to-2 power exchange.
Figure 14 shows the experimental setup for the 1-to-2 power exchange. The DC/DC converter connected to Battery 1 operates as the grid-former, applying voltage to establish and maintain the power exchange grid. Since this configuration is an intermediate step toward the final 2-to-2 exchange, the DC/DC converter connected to Battery 2 (the second sending-side battery) is already connected to the exchange grid, although it remains in a standby state. According to the specifications in Table 2, the standby converter consumes approximately 7 W, which may result in a small current—on the order of tens of milliamperes—flowing from the exchange grid. However, this is negligible within the accuracy of the present experiment.
Due to equipment availability, the DC/DC converters connected to Battery 1 and Battery 3 are the same model used in the peer-to-peer experiment (EZA2500-32048FC), while those connected to Battery 2 and Battery 4 are a slightly different model (EZA2500W-32048). As shown in Table 2, the differences between the two models are minor and do not affect the validity of the experiment. The EZA2500W-32048 has a wider operating voltage range but slightly lower conversion efficiency, with a maximum of 90.5%.
Table 3 presents the measured transmission losses when the received power of Battery 3 and Battery 4 was varied in 200 W increments. Combinations marked with “×” exceed the maximum rated power of the grid-forming DC/DC converter connected to Battery 1. The transmission loss Ploss was calculated using Equation (3):
The corresponding transmission efficiency ηtrans was calculated using Equation (4) and is shown in Table 4.
Figure 15(a) and Figure 15(b) visualize the transmission losses and efficiencies as 3D bar graphs with respect to the received power of Battery 3 and Battery 4. Transmission losses increased with total received power, while transmission efficiency also improved as both receiving powers increased. The highest efficiency, 85.2%, was achieved when Battery 3 received 1200 W and Battery 4 received 800 W. The slight asymmetry is likely due to differences in the converter models.
Next, the experimental setup for the 2-to-1 power exchange is shown in Figure 16. In this case, the DC/DC converter connected to Battery 4 remains connected to the exchange grid in a standby state.
Table 5 shows the measured transmission losses when the received power of Battery 3 and the sent power of Battery 2 were varied in 200 W increments. Combinations marked with “×” indicate cases where the power sent from Battery 1 became negative. Although the bidirectional DC/DC converters can maintain the grid even when Battery 1 is in a receiving state, such operation is outside the intended scope of this power exchange method and was excluded. Table 6 shows the corresponding transmission efficiencies.
Figure 17(a) and Figure 17(b) present 3D bar graphs of the measured transmission losses and efficiencies with respect to the sent power from Battery 2 and the received power by Battery 3. The maximum efficiency of 85.1% was achieved when Battery 2 sent 1200 W and Battery 3 received 2000 W.
The transition from 1-to-2 or 2-to-1 exchange to the final 2-to-2 exchange state was then examined. Figure 18 shows the experimental setup for the transition from 1-to-2 to 2-to-2 exchange. In this case, both Battery 3 and Battery 4 were receiving 1 kW of power, while the sent power from Battery 2 was varied in 200 W increments. Transmission loss and efficiency were calculated using Equations (5) and (6).
Figure 19 shows the results. The minimum transmission loss occurred when Battery 2 sent 1200 W, and the maximum efficiency of 83.3% was observed at that point.
Next, Figure 20 shows the experimental setup for the transition from 2-to-1 to 2-to-2 exchange. In this case, Battery 2 was sending 1 kW and Battery 3 was receiving 1 kW. The received power of Battery 4 was varied in 200 W increments, and the transmission loss and efficiency were measured.
Figure 21 shows the results. Transmission loss increased with the received power of Battery 4, and the maximum efficiency of 85.3% was achieved when the total received power reached 2000 W. Since the total transmitted and received power was not constant in this case, we also conducted an experiment where the total received power was fixed at 2 kW.
Figure 22 shows the experimental setup. While Battery 2 was sending 1 kW, the received power of Battery 3 and Battery 4 was varied such that their sum remained constant at 2 kW. Figure 23 shows the results. The minimum transmission loss occurred when Battery 4 received 800 W, and the maximum efficiency of 83.4% was achieved at that point.
These results confirm that the system can successfully transition to a 2-to-2 power exchange state following the procedure described in Section 3.2. Furthermore, by repeating similar processes, the system can be extended to m-to-n power exchange configurations, thereby demonstrating the scalability of the proposed method.
6. Simulated Peer-to-Peer Power Transmission Experiment
In the experiments described in Section 4 and Section 5, the high-voltage sides of the sending and receiving DC/DC converters were directly connected. However, in practical applications, these converters are connected via a power exchange grid, and electrical resistance from the grid’s power cables introduces transmission losses. To simulate this condition, we modified the peer-to-peer experiment from Section 4 by inserting a resistive element r between the sending and receiving DC/DC converters to emulate conductor resistance. As shown in Figure 24, the value of r was varied across multiple trials. Specifically, we used multiple 1 Ω, 100 W resistors connected in series to discretely vary the resistance. Assuming the use of 22 SQ CV cables with a conductor resistance of 1.08 Ω/km, we varied r across 1, 2, 4, 6, 8, and 10 Ω, effectively simulating cable lengths of up to approximately 10 km.
The received power on the receiving-side battery was fixed at 1 kW, and as in Section 4, we measured the power delivered from the sending-side battery to calculate transmission loss and efficiency. Figure 25(a) shows the measured grid voltage at the receiving side as a function of conductor resistance. Although 380 V was applied on the sending side, the voltage at the receiving side decreased as r increased. The solid line represents the theoretical values, but slight deviations from the measured data were observed. This discrepancy is attributed to contact resistance introduced during the connection of the 1 Ω resistors—approximately 0.05 Ω per connection—resulting in actual resistance values about 10% higher than indicated. Indeed, when ten 1 Ω resistors were connected in series, the total resistance r was confirmed to be approximately 11 Ω through direct measurement.
7. Operational Stability Test
In DC microgrids, sudden influxes of generated power or abrupt changes in load can cause significant fluctuations in the baseline voltage. Since DC/DC converters rely on terminal voltage for feedback loop control, rapid variations in the voltage at their terminals may lead to unstable operation. This section experimentally investigates the stability of power exchange under such baseline voltage disturbances during transmission.
Figure 26 shows the experimental setup for the stability test in a peer-to-peer power exchange using batteries (rated at 52 V, 40 Ah). To simulate the connection of generation equipment or power loads, a DC power supply or electronic load was connected to one of the batteries. During power exchange, current was either suddenly injected into or drawn from the battery. These devices were connected only to Battery A, as shown in the figure. The experiment was conducted bidirectionally: when power was transmitted from Battery A to Battery B, the disturbance was applied to the sending side; when power was transmitted from Battery B to Battery A, the disturbance affected the receiving-side grid. In this experiment, the receiving-side DC/DC converter was controlled to maintain a constant inflow current of 10 A into the receiving battery. During the process, the terminal voltages of both batteries were recorded using the data logger function of the multi-measurement device Moku:Go (Liquid Instruments), with a sampling rate of 1kSa/s.
As shown in Figure 27(a), when a disturbance current of 1 A (equivalent to 0.025 C, assuming 1 C = 40 A for a 40 Ah battery) was injected into Battery A, its terminal voltage rose by approximately 0.04 V (0.08%) within a few milliseconds, while the voltage of Battery B remained unaffected. Conversely, when a 0.025 C (1 A) current was drawn from Battery A, the voltage dropped by about 0.04 V (0.08%) within a few milliseconds, again with no impact on Battery B, as shown in Figure 27(b).
Next, the magnitude of the disturbance current was varied, and additional experiments were conducted by applying disturbances to the receiving-side battery as well. Figure 28 plots the percentage change in terminal voltage for both batteries when disturbance currents of varying magnitudes were injected. When a current of 0.5 C (20 A) was injected, the terminal voltage of the affected battery increased by 1.5–2%, while the other battery remained unaffected. Furthermore, Figure 29 shows the results when current was drawn using an electronic load. In this case, the terminal voltage of the disturbed battery decreased by approximately 3% at 1 C (40 A), while the other battery again showed no response. These results confirm that even under disturbances causing several percent fluctuations in baseline voltage, stable power exchange operation can be maintained.
8. Conclusions
This study proposed and experimentally validated a decentralized DC power exchange method that enables direct energy transfer between DC microgrids without relying on the conventional utility grid. By employing a dedicated power exchange grid and bidirectional DC/DC converters, the system facilitates scalable multi-point energy exchange among arbitrary combinations of *m* sending-side and *n* receiving-side microgrids. Experimental results confirmed the feasibility and stability of the proposed architecture, even under baseline voltage fluctuations of 1.5–3%, demonstrating its robustness in practical scenarios.
Transmission losses in such exchanges are strongly influenced by the characteristics of the DC/DC converters and the electrical resistance of the exchange cables. While converter efficiency tends to improve near rated power, cable losses favor lower power over longer durations. Therefore, determining the optimal exchange power requires a careful balance between these competing loss mechanisms, necessitating pre-exchange optimization. Moreover, the sending-side microgrid responsible for forming and maintaining the exchange grid plays a critical role in coordinating the entire transaction. The power exchange controller must not only manage converter operations but also respond to dynamic energy requests from participating microgrids. To achieve optimal scheduling, intelligent algorithms—potentially AI-based—should consider converter specifications, cable resistance, and grid capacity.
As energy transactions may involve billing based on exchanged energy, loss-aware accounting mechanisms must be incorporated. Furthermore, integration with upper-layer supply-demand systems opens the possibility for advanced operational strategies. As the number of participating microgrids increases, computational complexity grows, potentially requiring distributed processing across cloud-based networks.
Ultimately, the proposed system constitutes a cyber-physical architecture comprising a physical operating plane—consisting of DC/DC converters and the power exchange grid—and a cyber layer that orchestrates optimal energy routing as shown in Figure 30. The controller may not reside in a single machine but rather emerge as a distributed intelligence within the cloud, enabling resilient and scalable energy exchange across future DC microgrid networks.
Funding
This research was funded by the JST OPERA Prog. (Grant Number JPMJOP1852).
Data Availability Statement
The original contributions presented in this study are included in the article. Further inquiries can be directed to the corresponding author.
Acknowledgments
Through the JST OPERA project, the author had many valuable discussions with K. Iwatsuki and T. Otsuji. The author would like to express deep gratitude to them.
Conflicts of Interest
The author declares no conflicts of interest. The funders had no role in the design of this study; in the collection, analyses, or interpretation of data; in the writing of the manuscript; or in the decision to publish the results.
Abbreviations
The following abbreviations are used in this manuscript:
| AC | alternative current |
| AI | artificial intelligence |
| CPS | cyber physical system |
| CV cable | cross-linked polyethylene insulated Vinyl sheath cable |
| DC | direct current |
| LiFePO4 | lithium iron phosphate battery |
| PCS | power conditioning system |
| SQ | square millimeters (mm2) |
References
- Kaviri, S.M.; Pahlevani, M.; Jain, P.; Bakhshai, A. A review of AC microgrid control methods. IEEE 8th Int. Symposium on Power Electronics for Distributed Generation Systems, Florianopolis, Brazil, 17-20 April 2017. [Google Scholar] [CrossRef]
- Mohammed, A.; Refaat, S.S.; Bayhan, S.; Abu-Rub, H. AC Microgrid Control and Management Strategies: Evaluation and Review. IEEE Power Electronics Magazine, 2019, 6, 18–31. [Google Scholar] [CrossRef]
- Singh, J.; Singh, S.P.; Verma, K.S.; Iqbal, A.; Kumar, B. Recent control techniques and management of AC microgrids: A critical review on issues, strategies, and future trends. Wiley Int. Trans. Electr. Energ Syst. 2021, 31, e13035. [Google Scholar] [CrossRef]
- Mezdi, K.E.; Magri, A.E.; Watil, A.; Myasse, I.E.; Aadouli, N.E; Kumar, P. Efficient energy management of a low-voltage AC microgrid with renewable and energy storage integration using nonlinear control. Scientific Reports 2025, 15, 38651. [Google Scholar] [CrossRef]
- Elsayed, A.T.; Mohamed, A.A.; Mohammed, O.A. DC microgrids and distribution systems: An overview. Electr. Power Syst. Res. 2015, 119, 407–417. [Google Scholar] [CrossRef]
- Dragičević, T.; Lu, X.; Vasquez, J.C.; Guerrero, J.M. DC Microgrids—Part I: A Review of Control Strategies and Stabilization Techniques. IEEE Trans. Power Electron. 2015, 31, 4876–4891. [Google Scholar] [CrossRef]
- Dragičević, T.; Lu, X.; Vasquez, J.C.; Guerrero, J.M. DC Microgrids—Part II: A Review of Power Architectures, Applications, and Standardization Issues. IEEE Trans. Power Electron. 2016, 31, 3528–3549. [Google Scholar] [CrossRef]
- Fotopoulou, M.; Rakopoulos, D.; Trigkas, D.; Stergiopoulos, F.; Blanas, O.; Voutetakis, S. State of the Art of Low and Medium Voltage Direct Current (DC) Microgrids. Energies 2021, 14, 5595. [Google Scholar] [CrossRef]
- Memon, D.A.; Ali, K.H.; Memon, A.A.; Ansari, J.A.; Badar, J.; Alharbi, M.; Banatwala, A.Z.; Kumar, M. Comparative analysis and implementation of DC microgrid systems versus AC microgrid performance. Frontiers in Energy Research 2024, 12. [Google Scholar] [CrossRef]
- Lotfi, H.; Khodaei, A. AC Versus DC Microgrid Planning. IEEE Transactions on Smart Grid, 2017, 8, 296–304. [Google Scholar] [CrossRef]
- Yamada, H. Autonomous Decentralizd Cooperative Control DC Microgrid Deployed in Residential Areas. Energies 2025, 18, 5041. [Google Scholar] [CrossRef]
- Saitoh, H.; Miyamori, S.; Shimada, T.; Toyoda, J. A Study on Autonomous Decentralized Control Mechanism of Power Flow in Open Electric Energy Network. IEEJ Transactions on Power and Energy. 1997, 117, 10–18, in Japanese. [Google Scholar] [CrossRef]
- Takuno, T.; Kitamori, Y.; Takahashi, R.; Hikihara, T. AC Power Routing System in Home Based on Demand and Supply Utilizing Distributed Power Sources. Energies 2011, 4, 717–726. [Google Scholar] [CrossRef]
- Takahashi, R.; Kitamori, Y.; Hikihara, T. AC Power Local Network with Multiple Power Routers. Energies, 2013, 6, 6293–6303. [Google Scholar] [CrossRef]
- Takahashi, R.; Tashiro, K.; Hikihara, T. Router for Power Packet Distribution Network: Design and Experimental Verification. IEEE Transactions on Smart Grid, 2015, 6, 618–626. [Google Scholar] [CrossRef]
- Kado, Y.; Shichijo, D.; Deguchi, I.; Iwama, N.; Kasashima, R. Power Flow Control of Three-Way Isolated DC/DC Converter for Y-Configuration Power Router. IEEE 2nd International Future Energy Electronics Conference, Taipei, Taiwan, 01-04 November 2015. [Google Scholar] [CrossRef]
- Kado, Y.; Shichijo, D.; Wada, K.; Iwatsuki, K. Multiport power router and its impact on future smart grids. Radio Science 2016, 51, 1234–1246. [Google Scholar] [CrossRef]
- Huang, X.; Wang, K.; Qi, C.; Li, G.; Zhu, Z. Decentralised DC voltage control and flexible power regulation for multi-port converter-based energy router. IET The Journal of Engineering 2019, 2019, 5255–5259. [Google Scholar] [CrossRef]
- Nguyen-Van, T. A Power Router Composed of Multifunctional Inverters. 2021 IEEE 10th Global Conference on Consumer Electronics (GCCE), 2-15 October 2021, 15 October. [CrossRef]
- Chen, Y.; Wang, P.; Elasser, Y.; Chen, M. Multicell Reconfigurable Multi-Input Multi-Output Energy Router Architecture. IEEE Transactions on Power Electronics, 2020, 35, 13210–13224. [Google Scholar] [CrossRef]
- Liu, Y.; Liu, C.; Wang, W.; Liu, S.; Chen, Y. A Novel Wired/Wireless Hybrid Multiport Energy Router for Dynamic EV Energy Internet with Grid-Tied and Islanded Operations. IEEE Transactions on Industrial Electronics 2024, 71, 3559–3574. [Google Scholar] [CrossRef]
- Zhou, J.; Wang, J. Research Review on Multi-Port Energy Routers Adapted to Renewable Energy Access. Electronics 2024, 13, 1493. [Google Scholar] [CrossRef]
- Saitoh, H.; Toyoda, J. A New Concept of Electric Power Network for the Effective Transportation of Small Power of Dispersed Generation Plants. IEEJ Transactions on Power and Energy. 1995, 115, 568–575, in Japanese. [Google Scholar] [CrossRef]
- Abe, R.; Taoka, H.; McQuilkin, D. Digital Grid: Communicative Electrical Grids of the Future. IEEE Transactions on Smart Grid 2011, 2, 399–410. [Google Scholar] [CrossRef]
- Gadelha, V.; Sumper, A.; Bullich-Massagué, E.; Aragüés-Peñalba, M. Electrical Grids Based on Power Routers: Definition, Architecture and Modeling. IEEE Access 2023, 11, 10004–10017. [Google Scholar] [CrossRef]
- Zhu, B.; Hu, H.; Wang, H.; Li, Y. A Multi-Input-Port Bidirectional DC/DC Converter for DC Microgrid Energy Storage System Applications. Energies 2020, 13, 2810. [Google Scholar] [CrossRef]
- Wang, Z.; Li, H. An Integrated Three-Port Bidirectional DC–DC Converter for PV Application on a DC Distribution System. IEEE Transactions on Power Electronics, 2013, 28, 4612–4624. [Google Scholar] [CrossRef]
- Liu, K.; Yamada, H.; Iwatsuki, K.; Otsuji, T. Experimental Verification and Simulation Analysis of a Battery Directly Con-nected DC-Microgrid System. Int. J. Electr. Electron. Eng. Telecommun. 2023, 12, 326–333. [Google Scholar] [CrossRef]
- Yamada, H. Autonomous Decentralized Cooperative Control DC Microgrids Realized by Directly Connecting Batteries to the Baseline. Electronics 2025, 14, 1356. [Google Scholar] [CrossRef]
- Moussa, S.; Ghorbal, M.J.-B.; Slama-Belkhodja, I. Bus voltage level choice for standalone residential DC nanogrid. Sustainable Cities and Society 2019, 46, 101431. [Google Scholar] [CrossRef]
- TDK-Lambda Bidirectional DC/DC Converter Data Sheet: https://product.tdk.com/en/search/power/switching-power/bidirect-converter/list#part_no=*&_l=20&_p=1&_c=part_no-part_no&_d=0. Available online: https://product.tdk.com/en/search/power/switching-power/bidirect-converter/list#part_no=*&_l=20&_p=1&_c=part_no-part_no&_d=0 (accessed on day month year).
Figure 1.
Operation of AC microgrids.
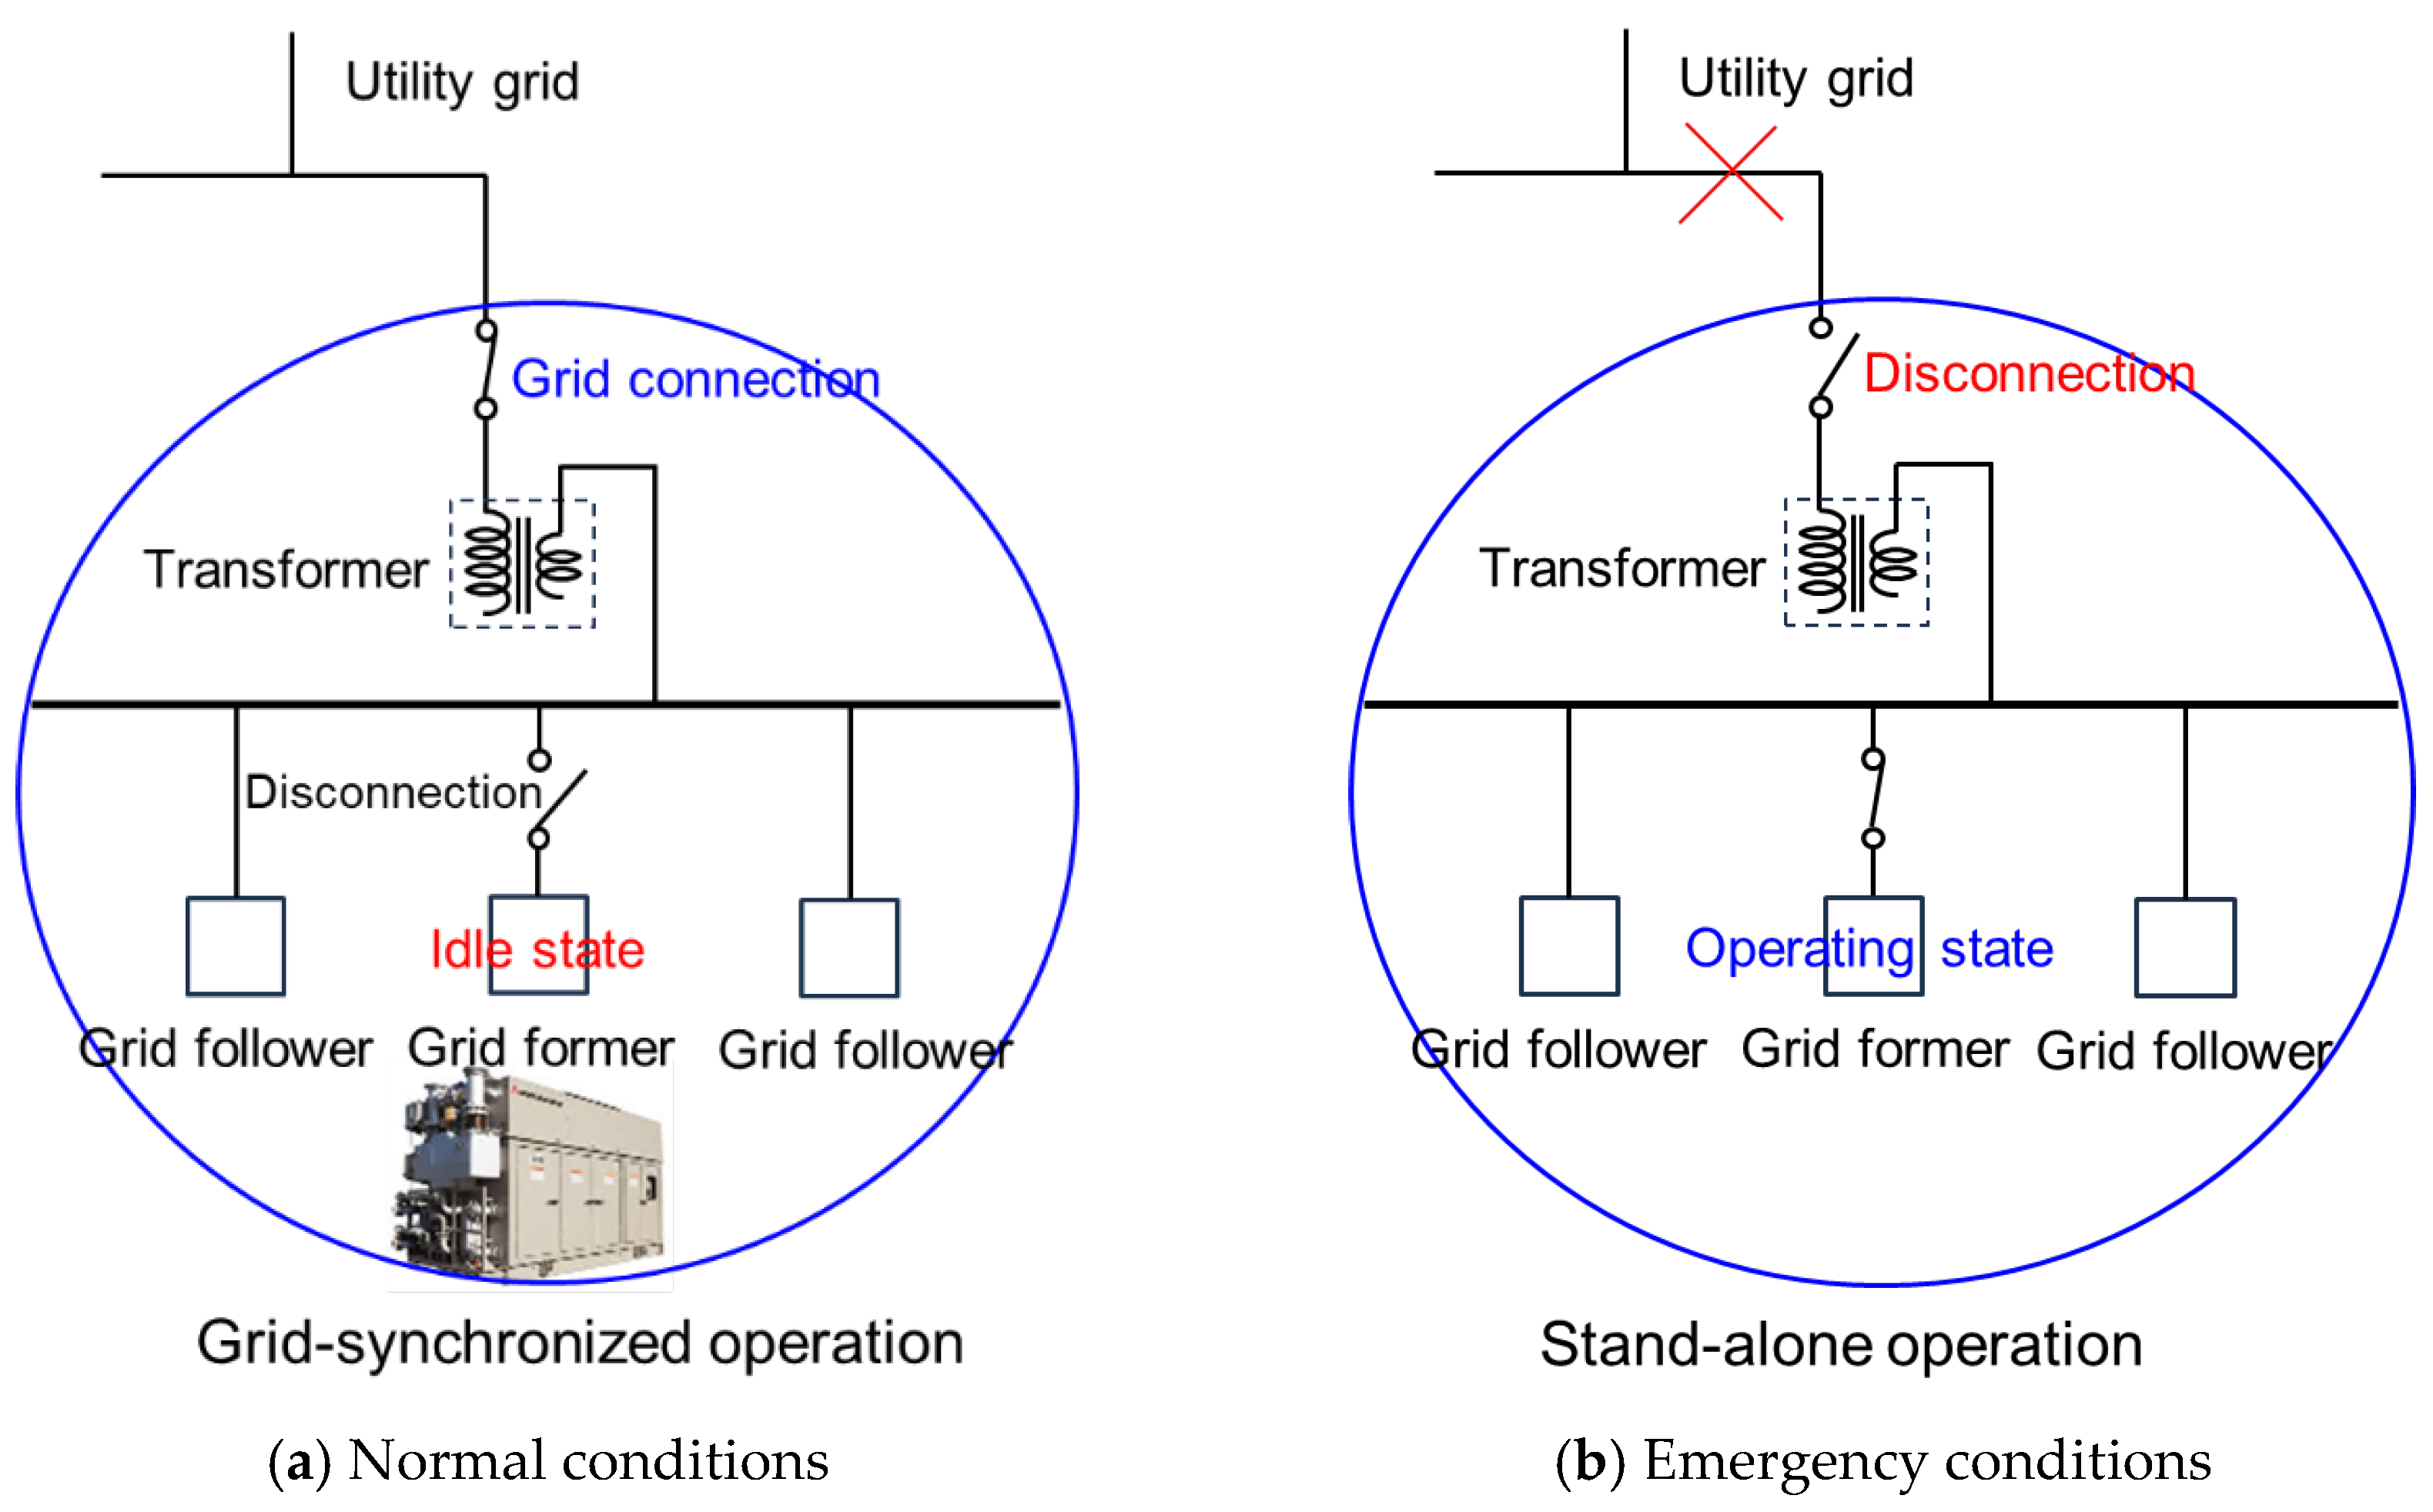
Figure 2.
Operation of DC Microgrids.
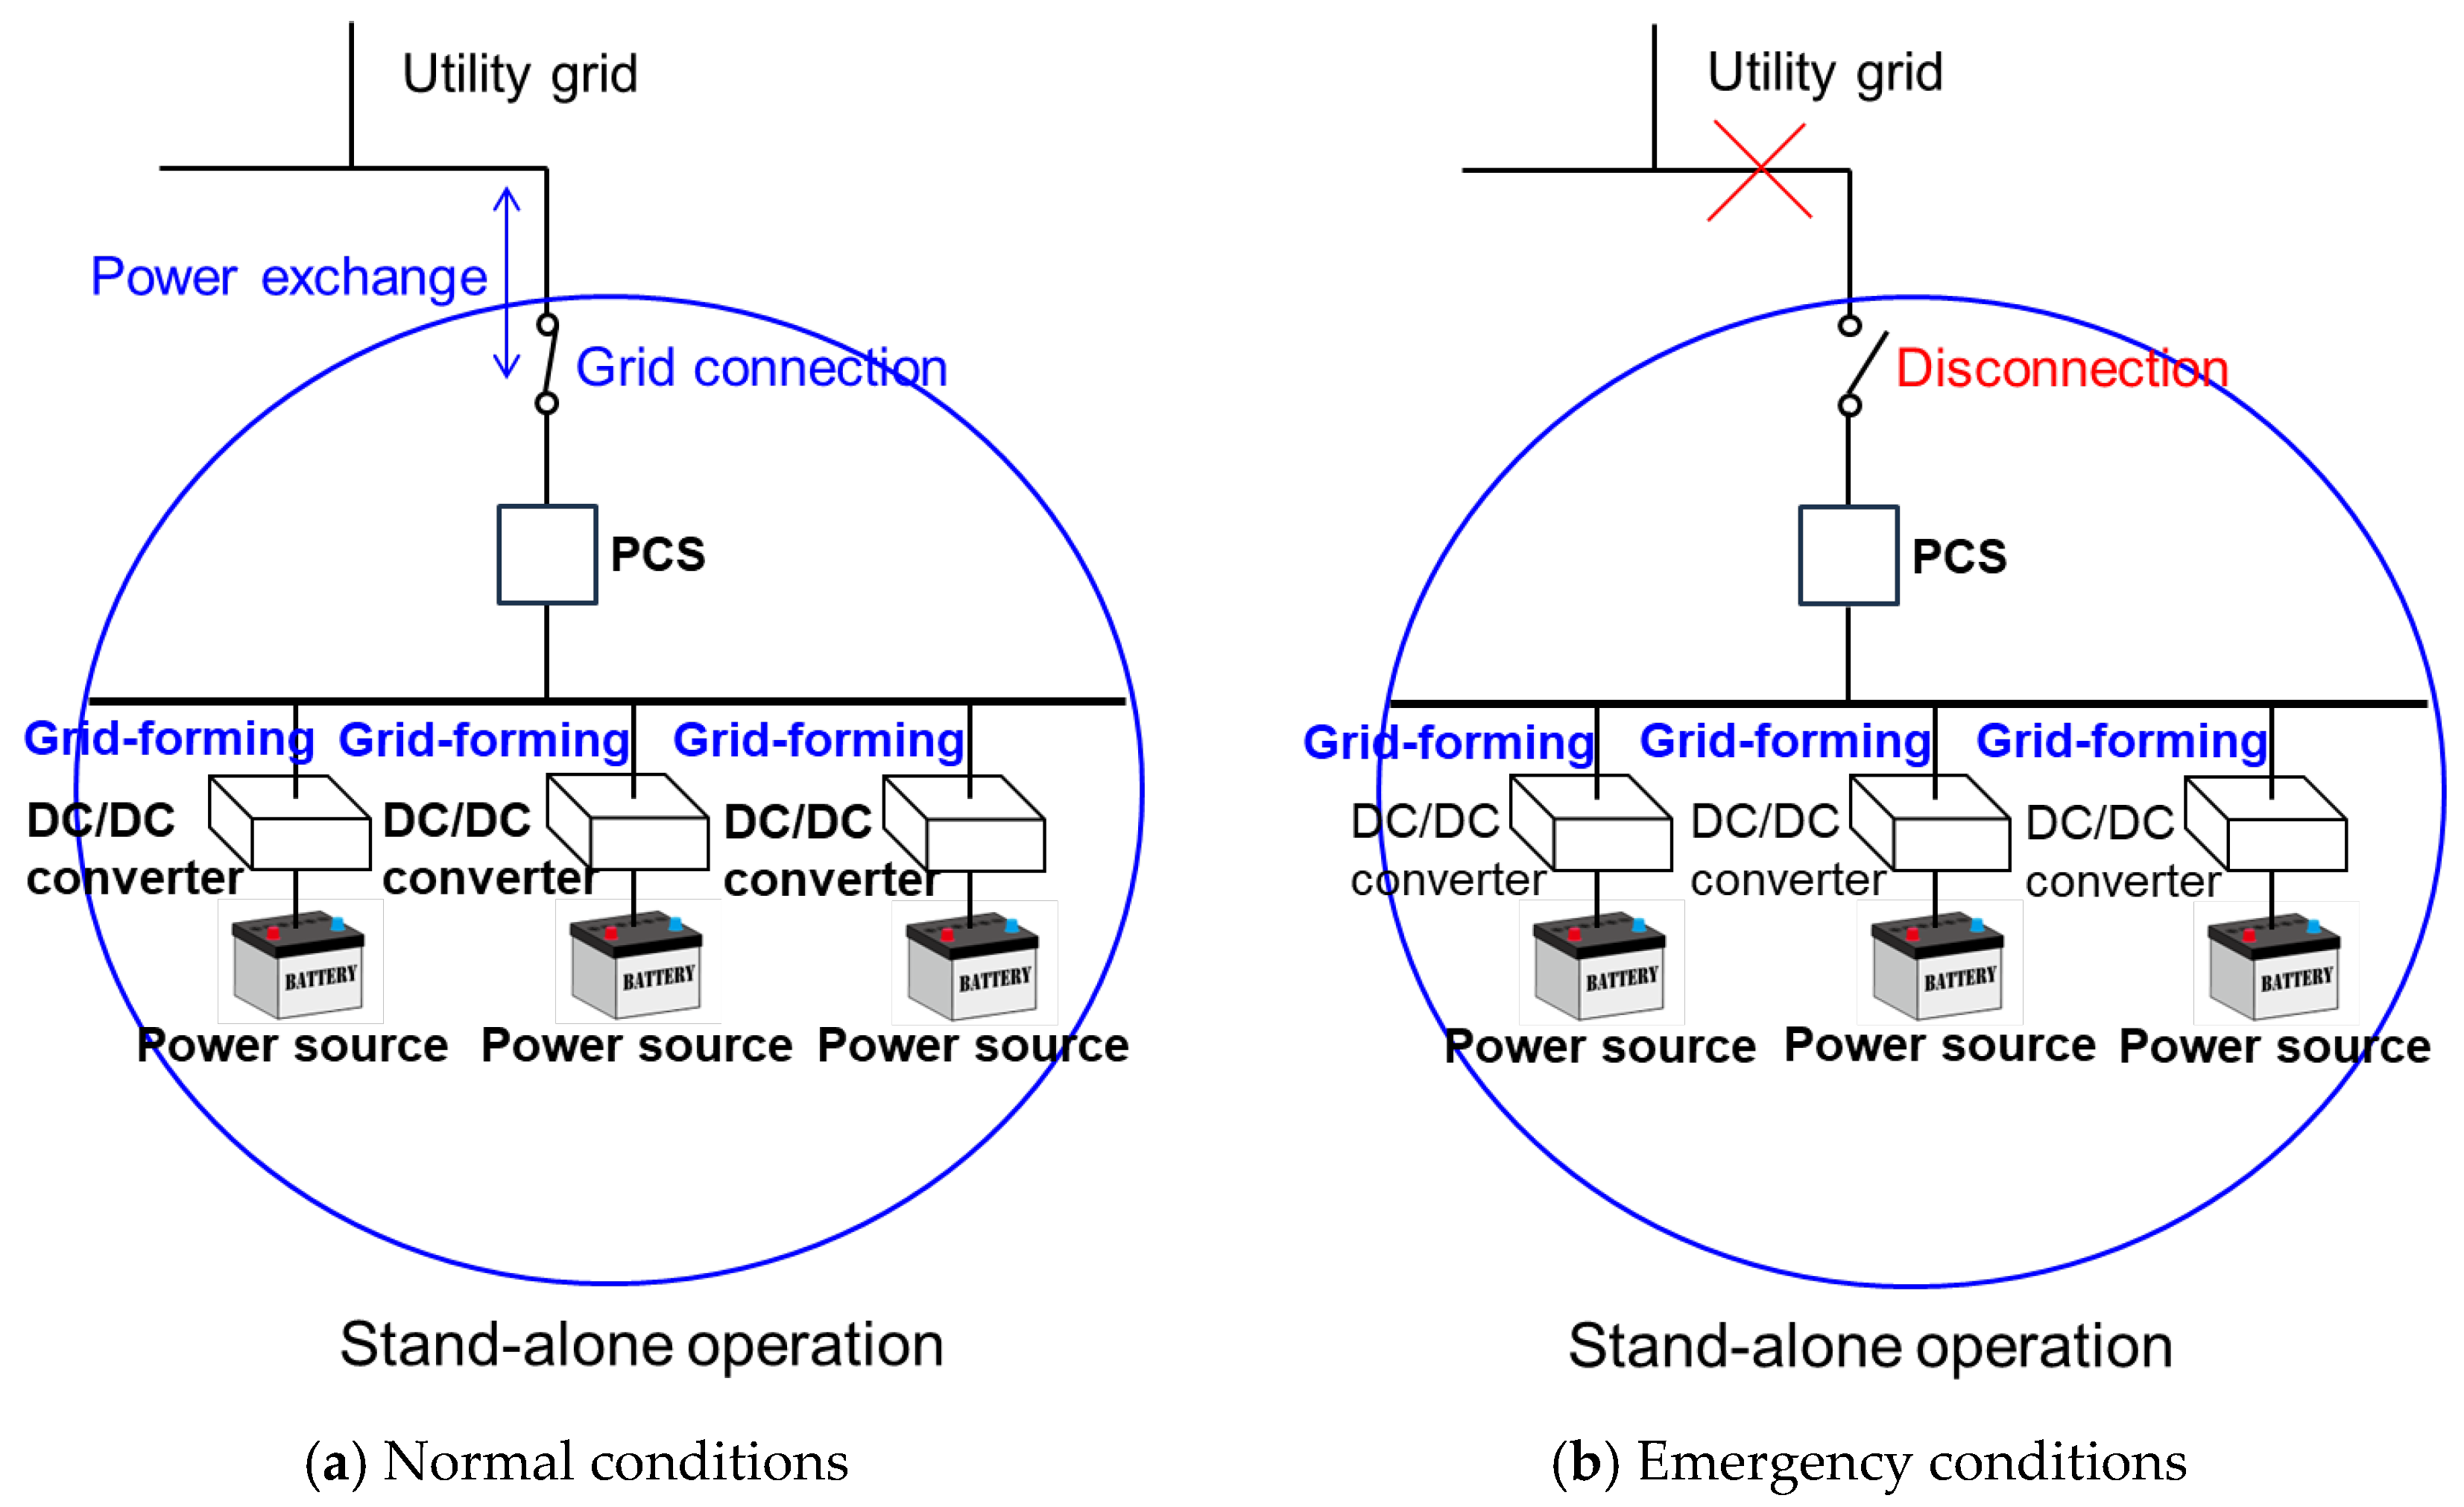
Figure 3.
Power exchange between microgrids via the utility grid.
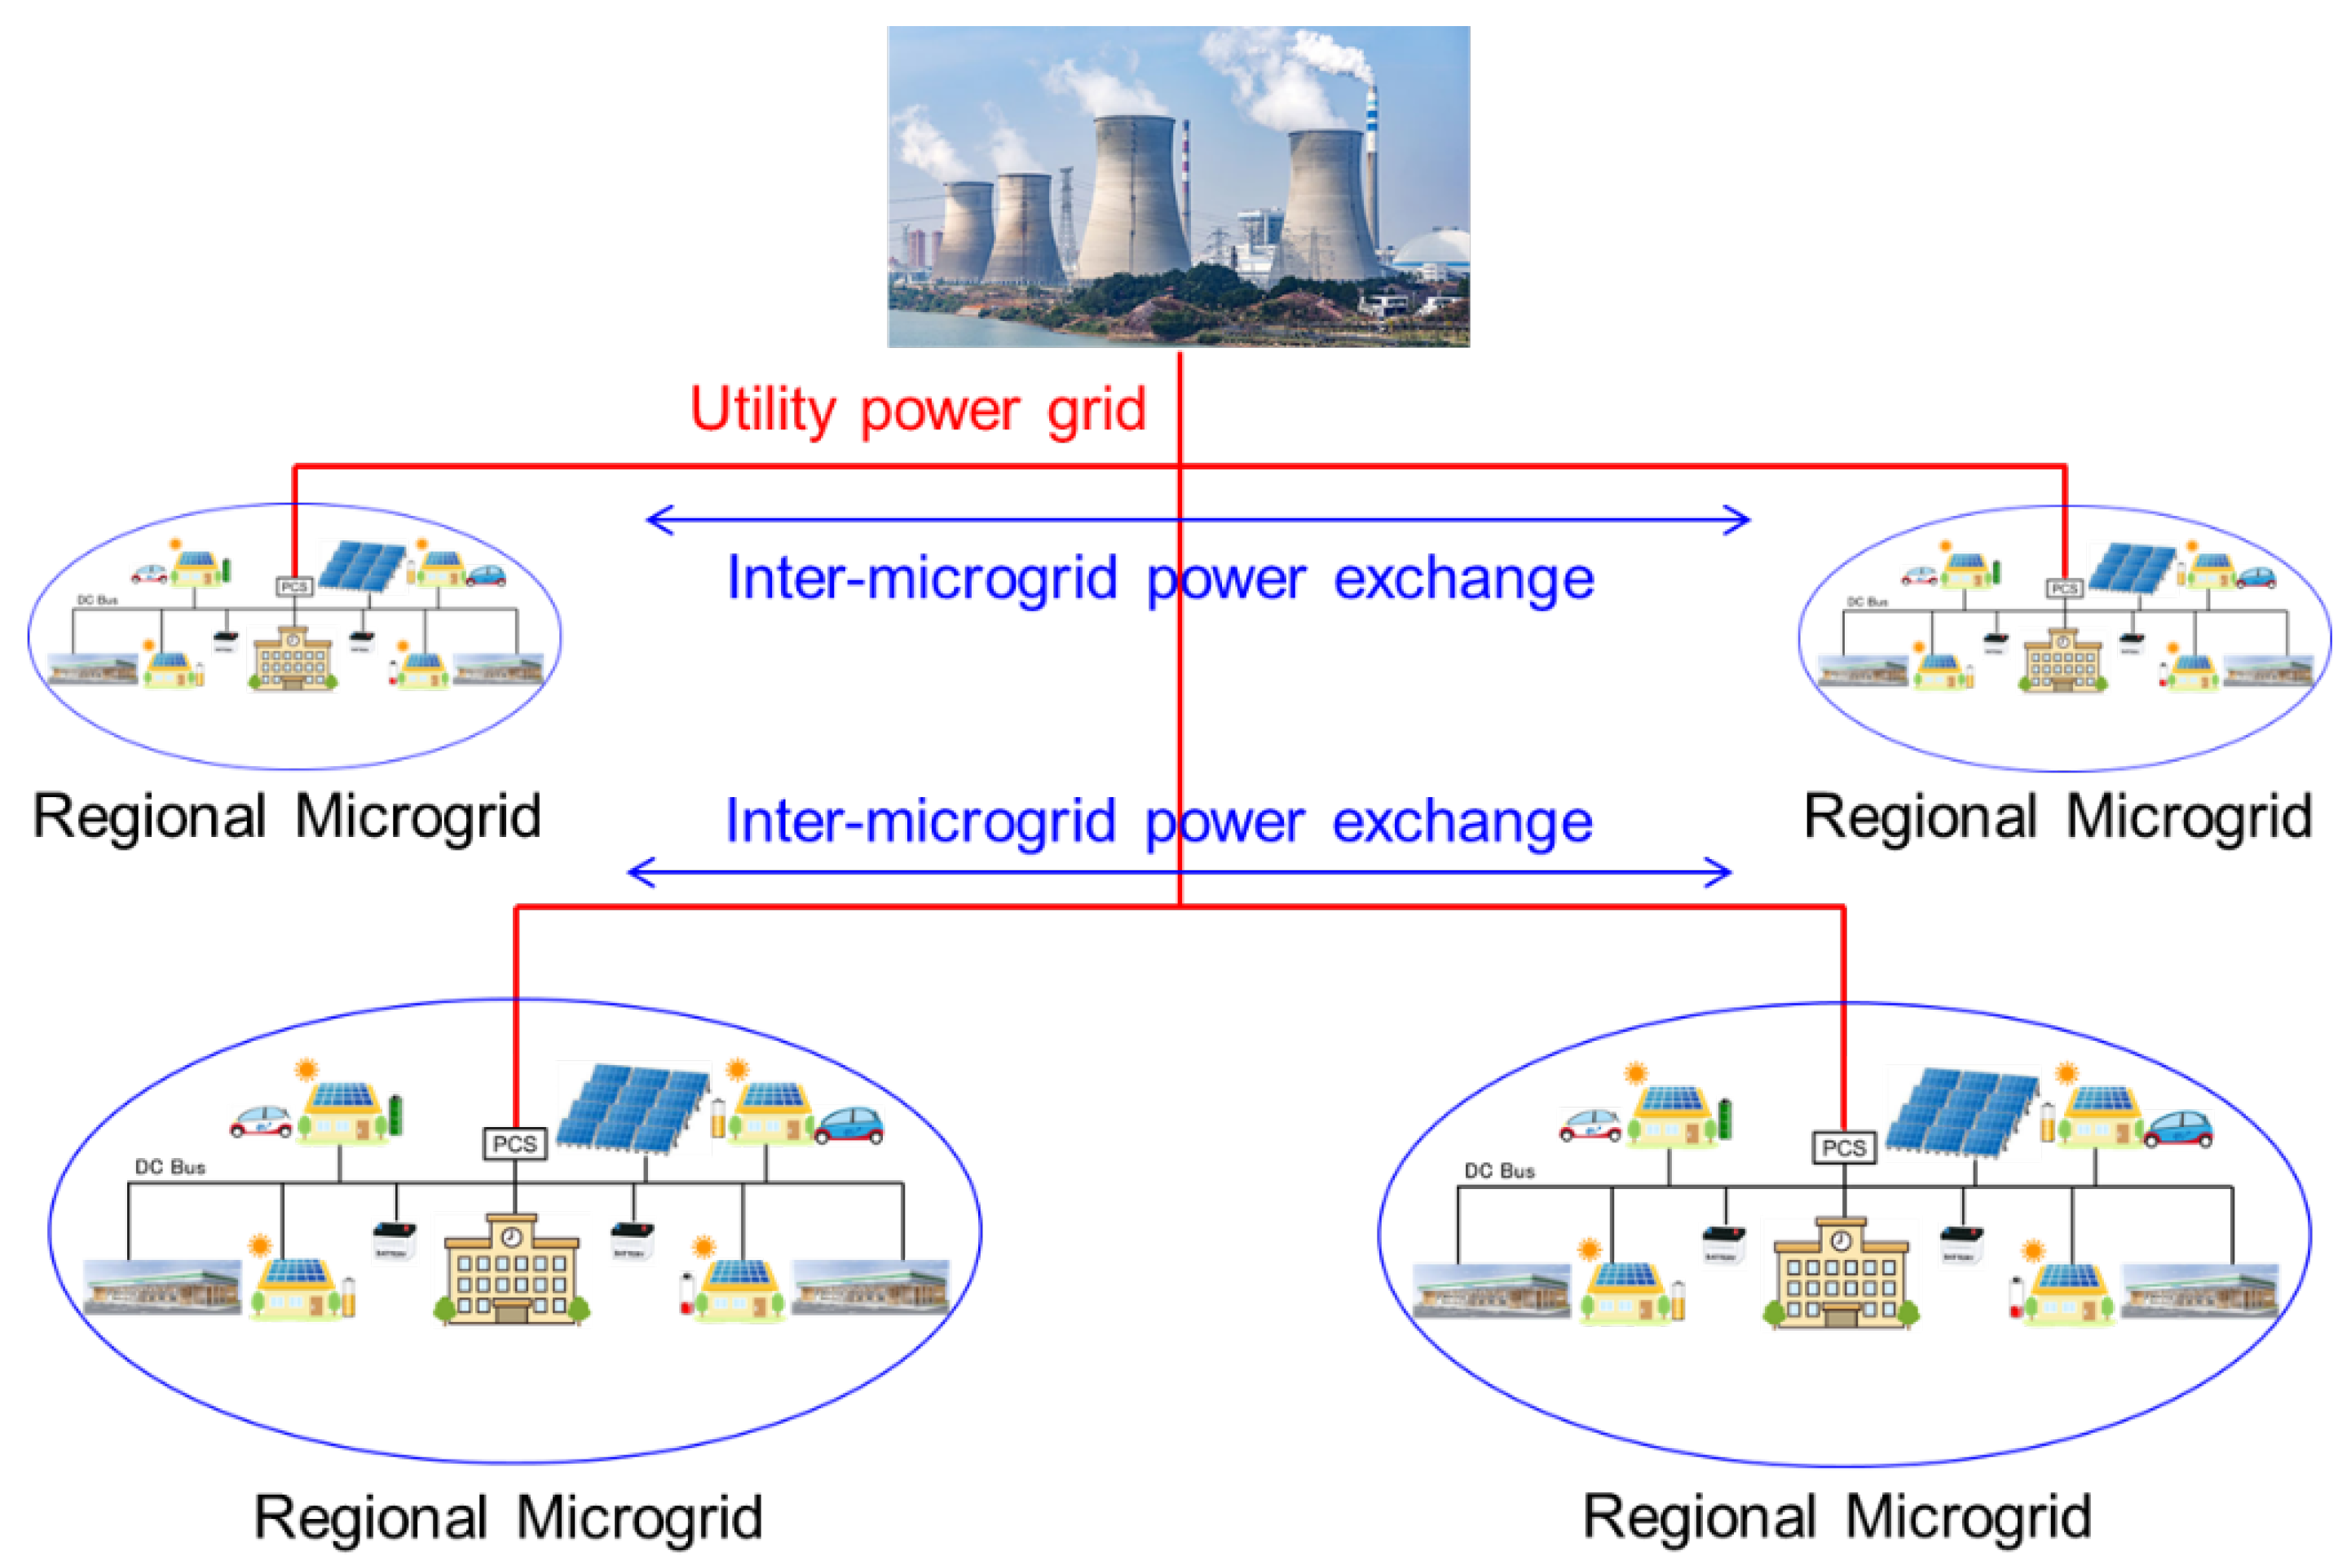
Figure 4.
DC power exchange methods.
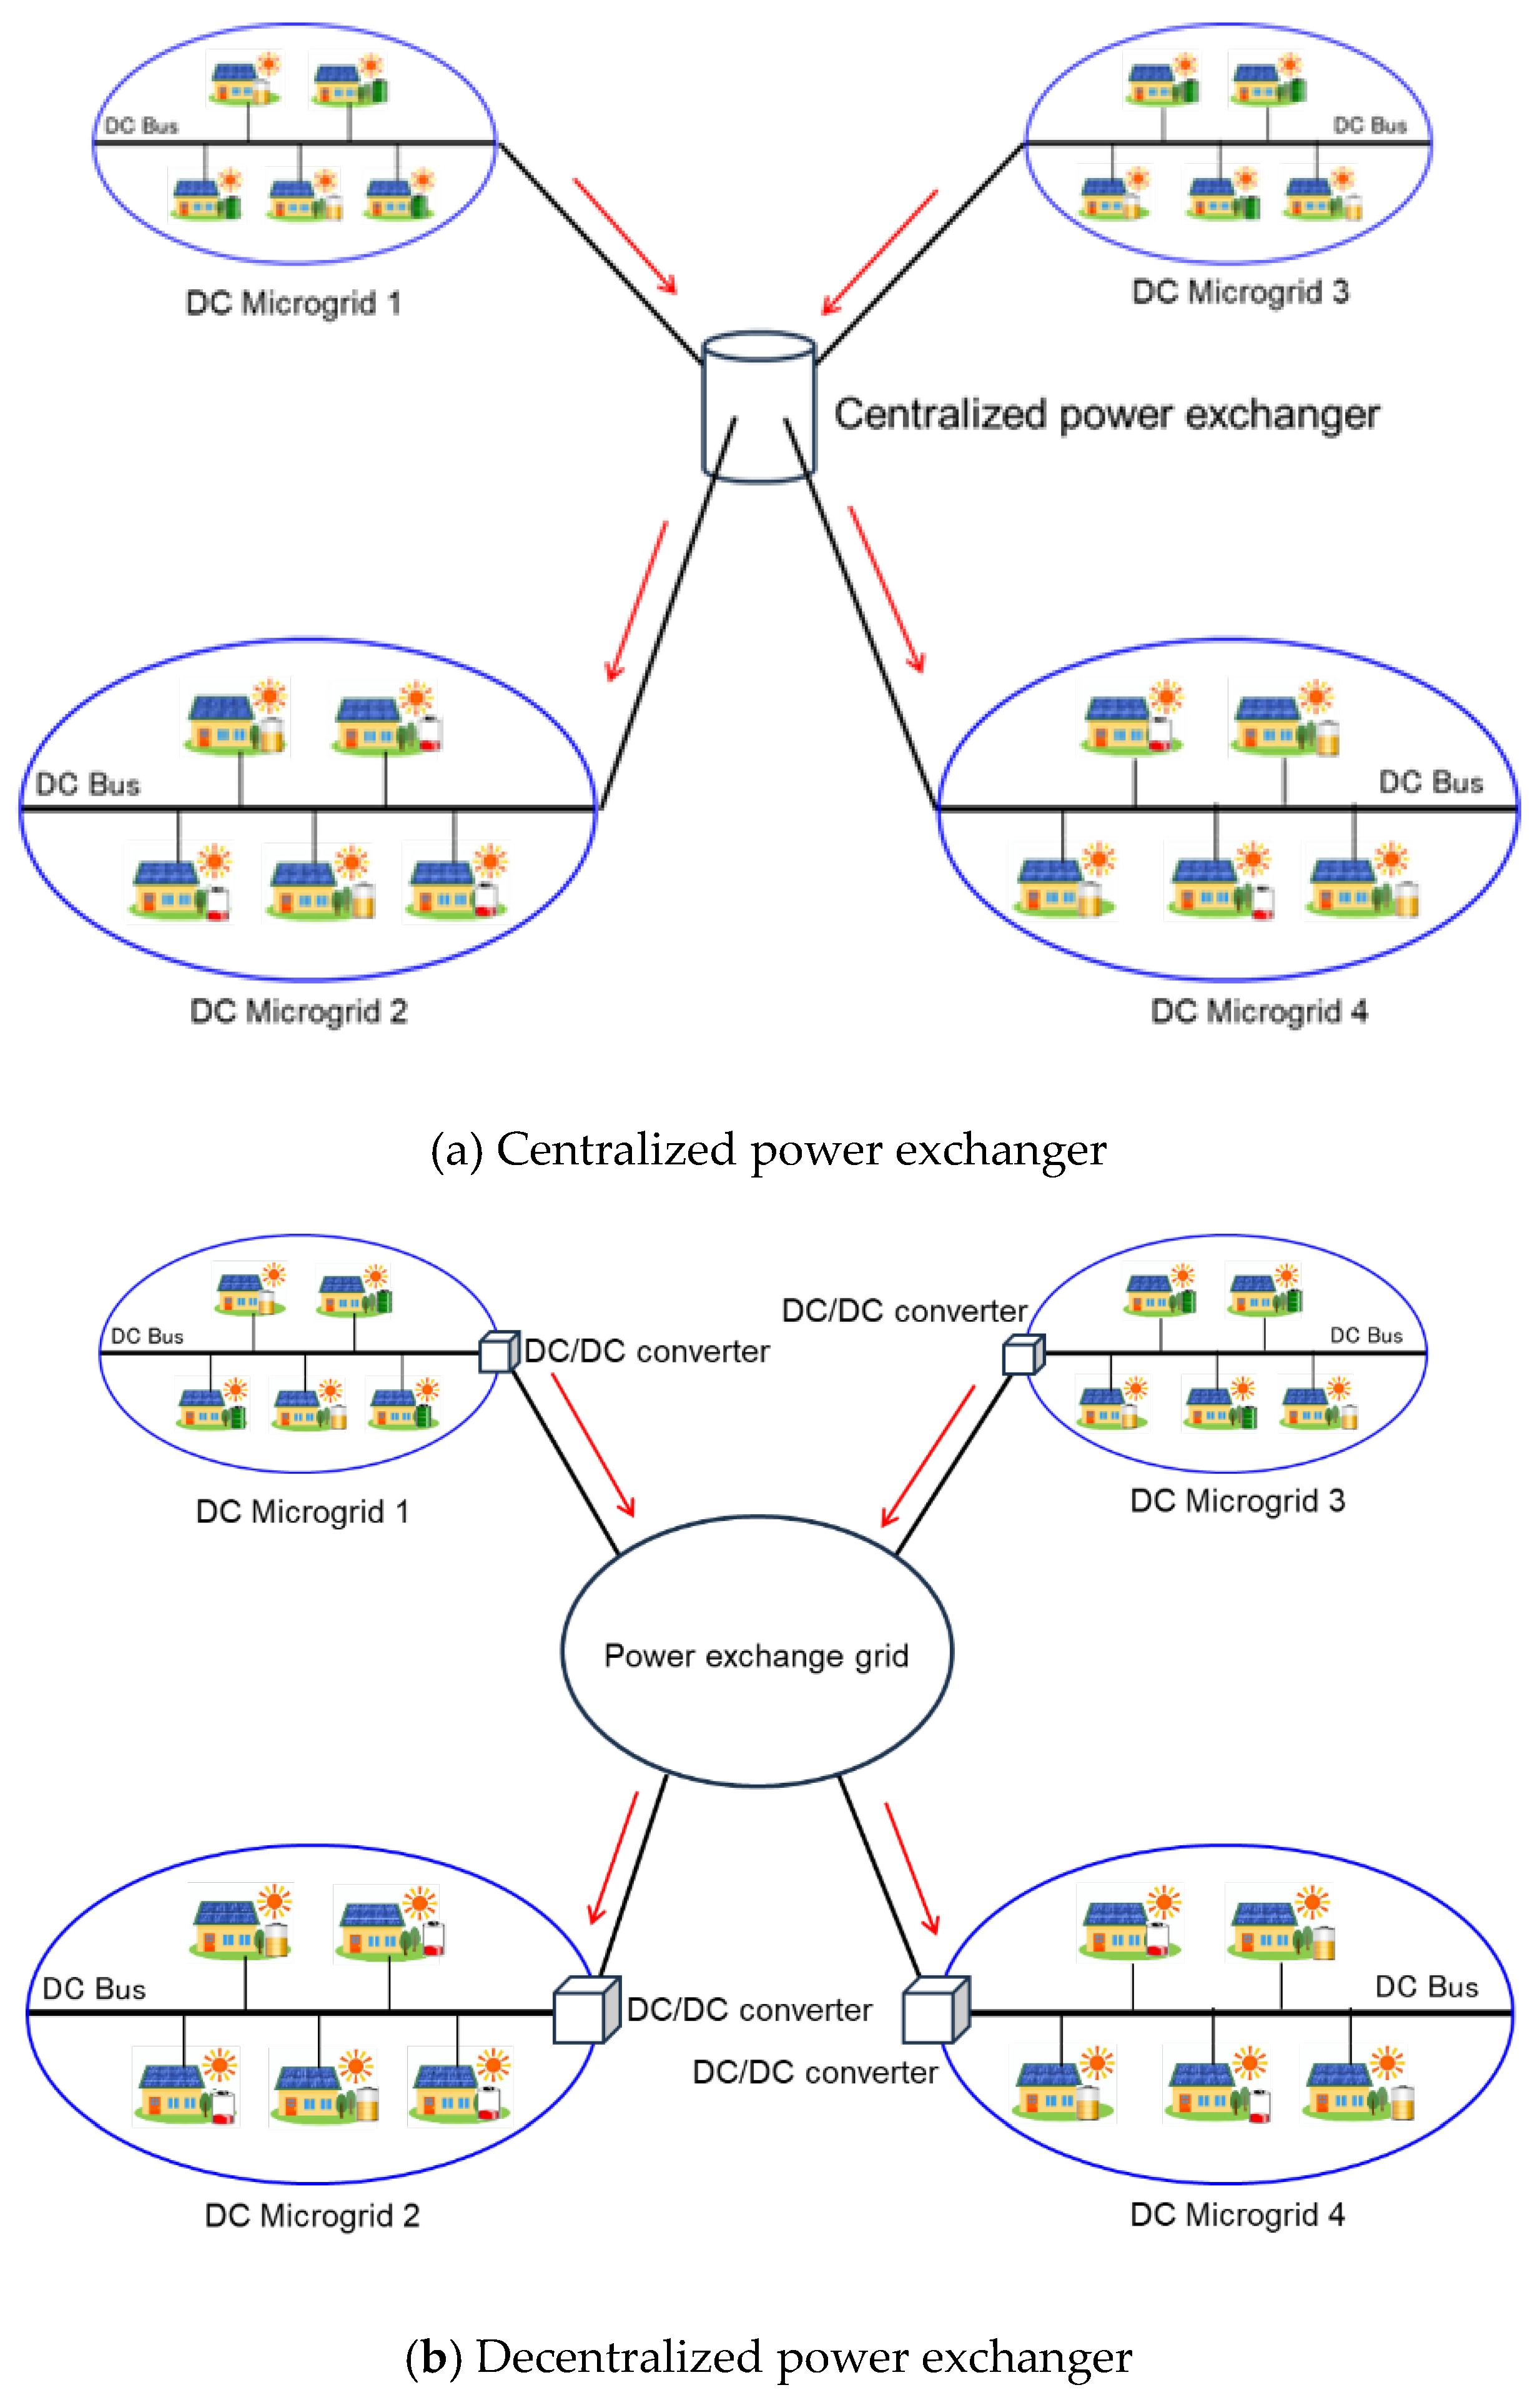
Figure 5.
Overview of the decentralized DC power exchange system.
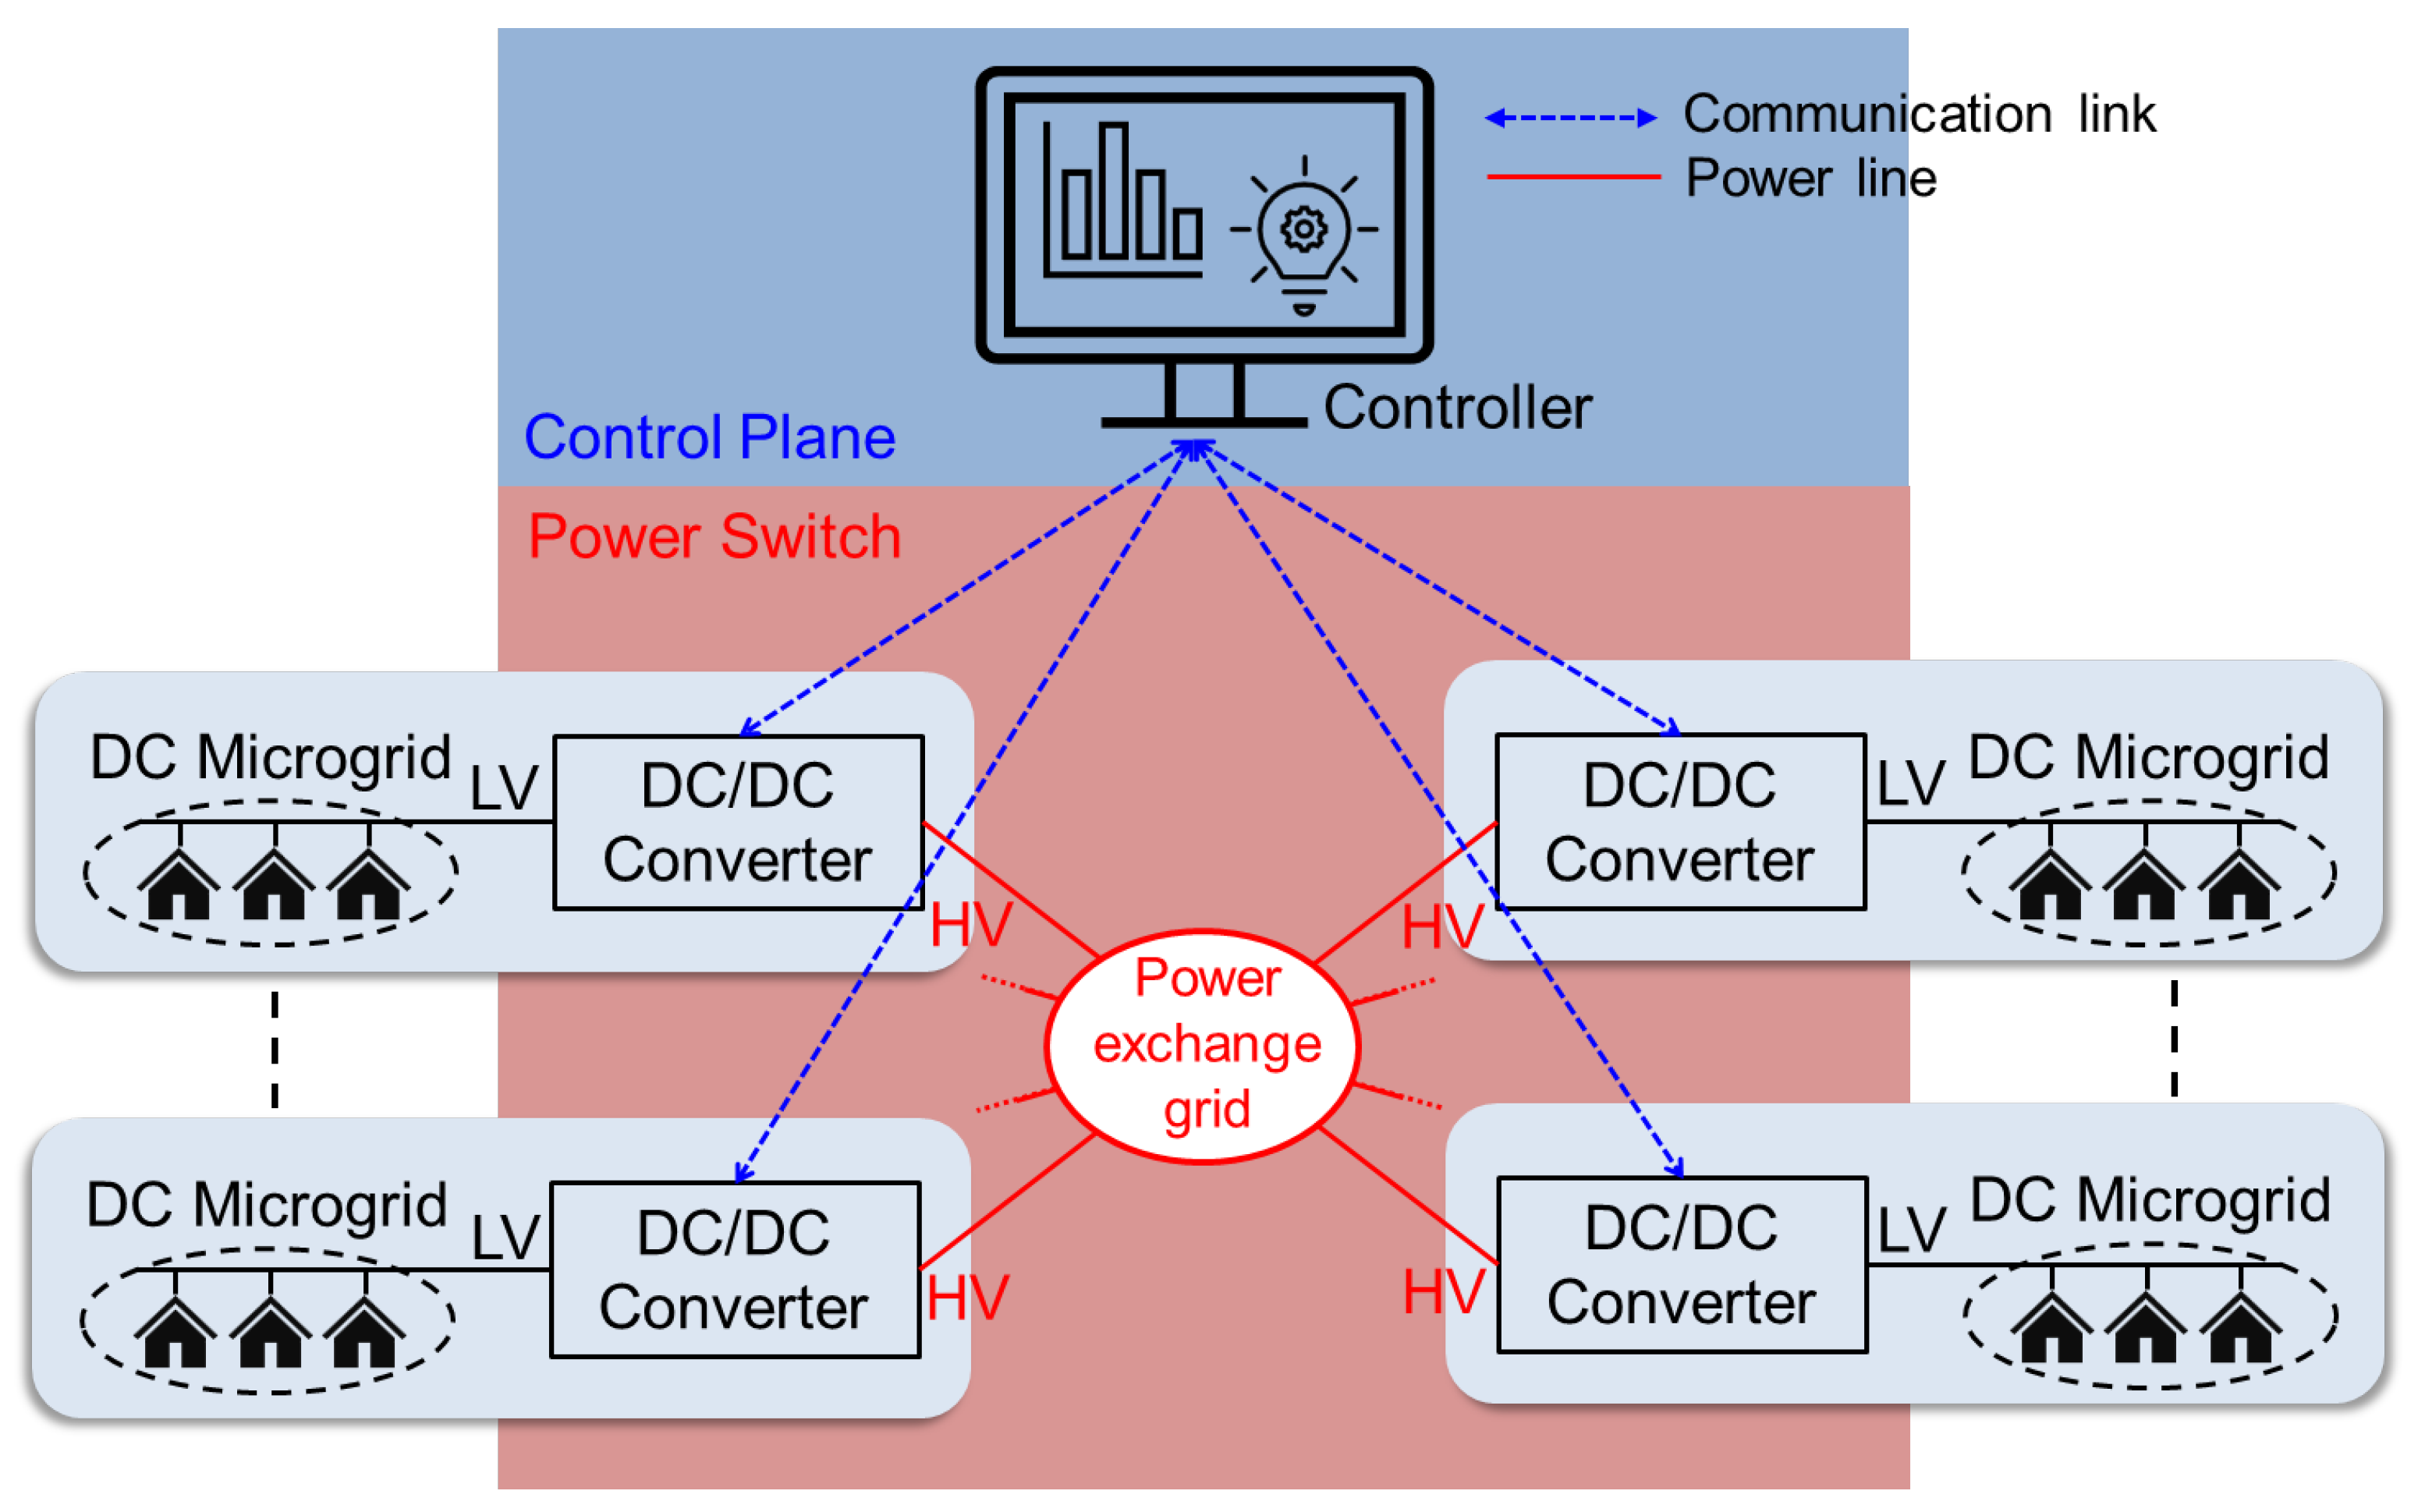
Figure 6.
Transmission loss as a function of transmission voltage.
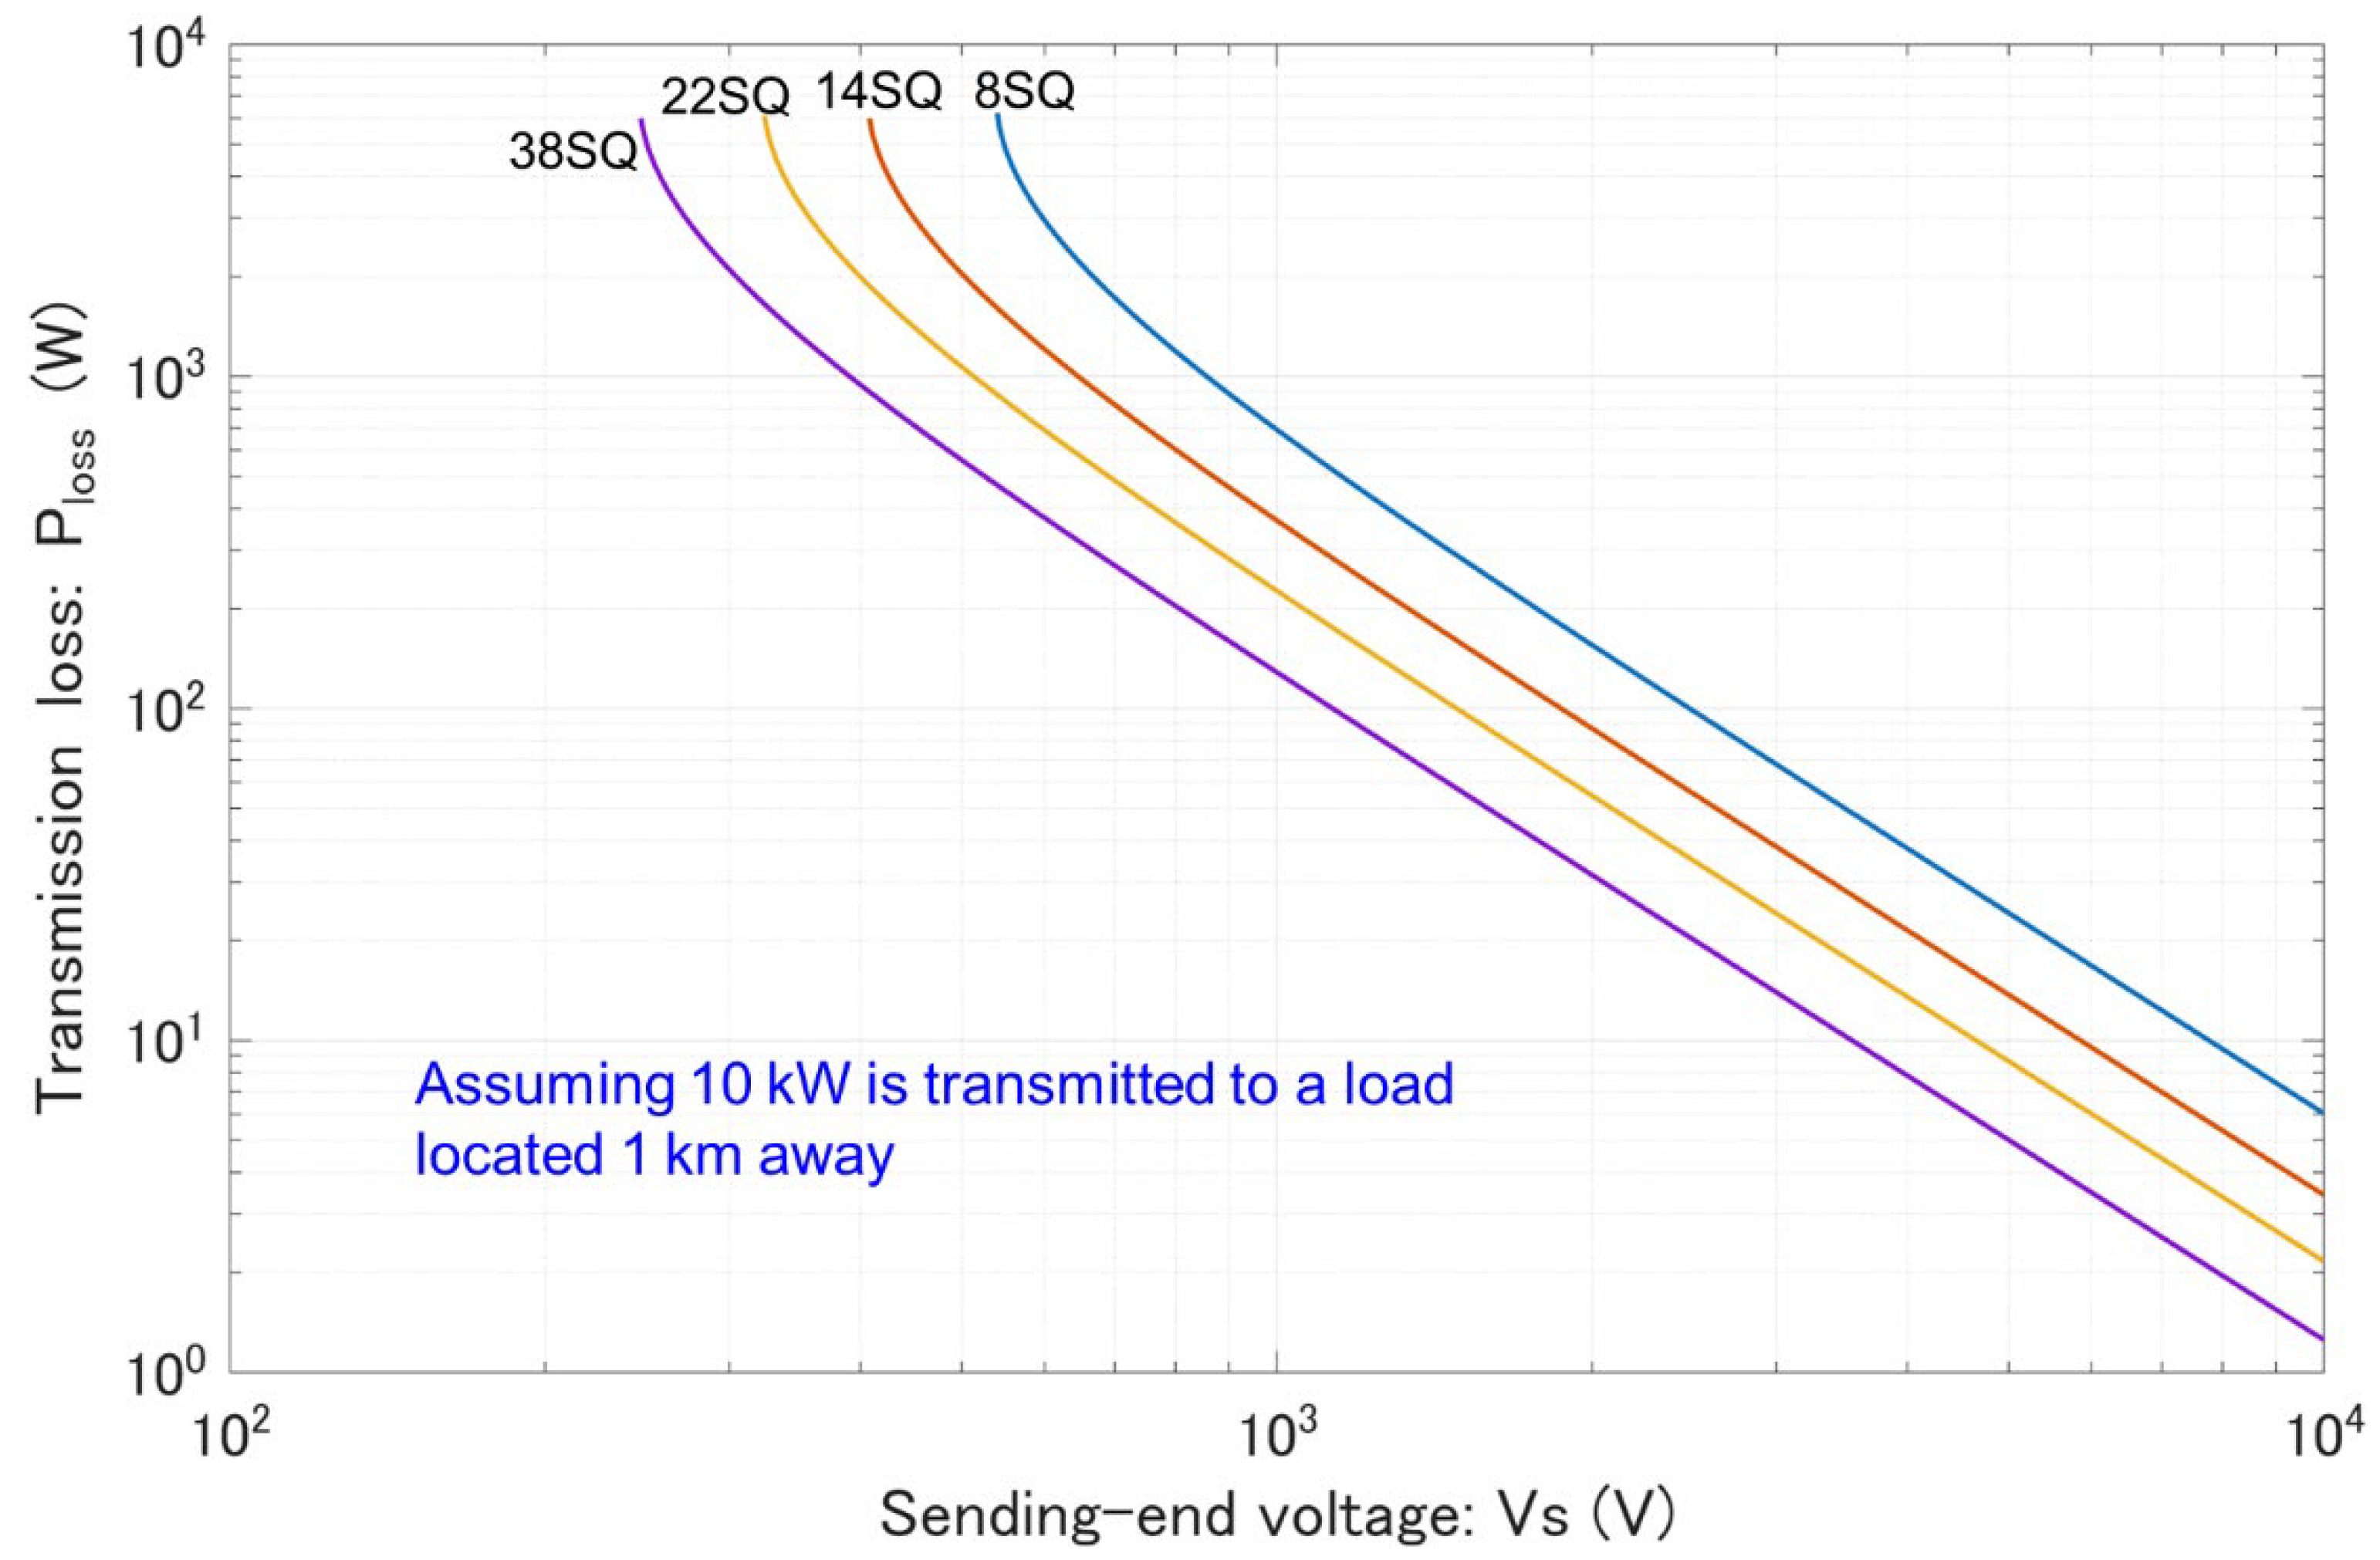
Figure 7.
Peer-to-peer power transfer.
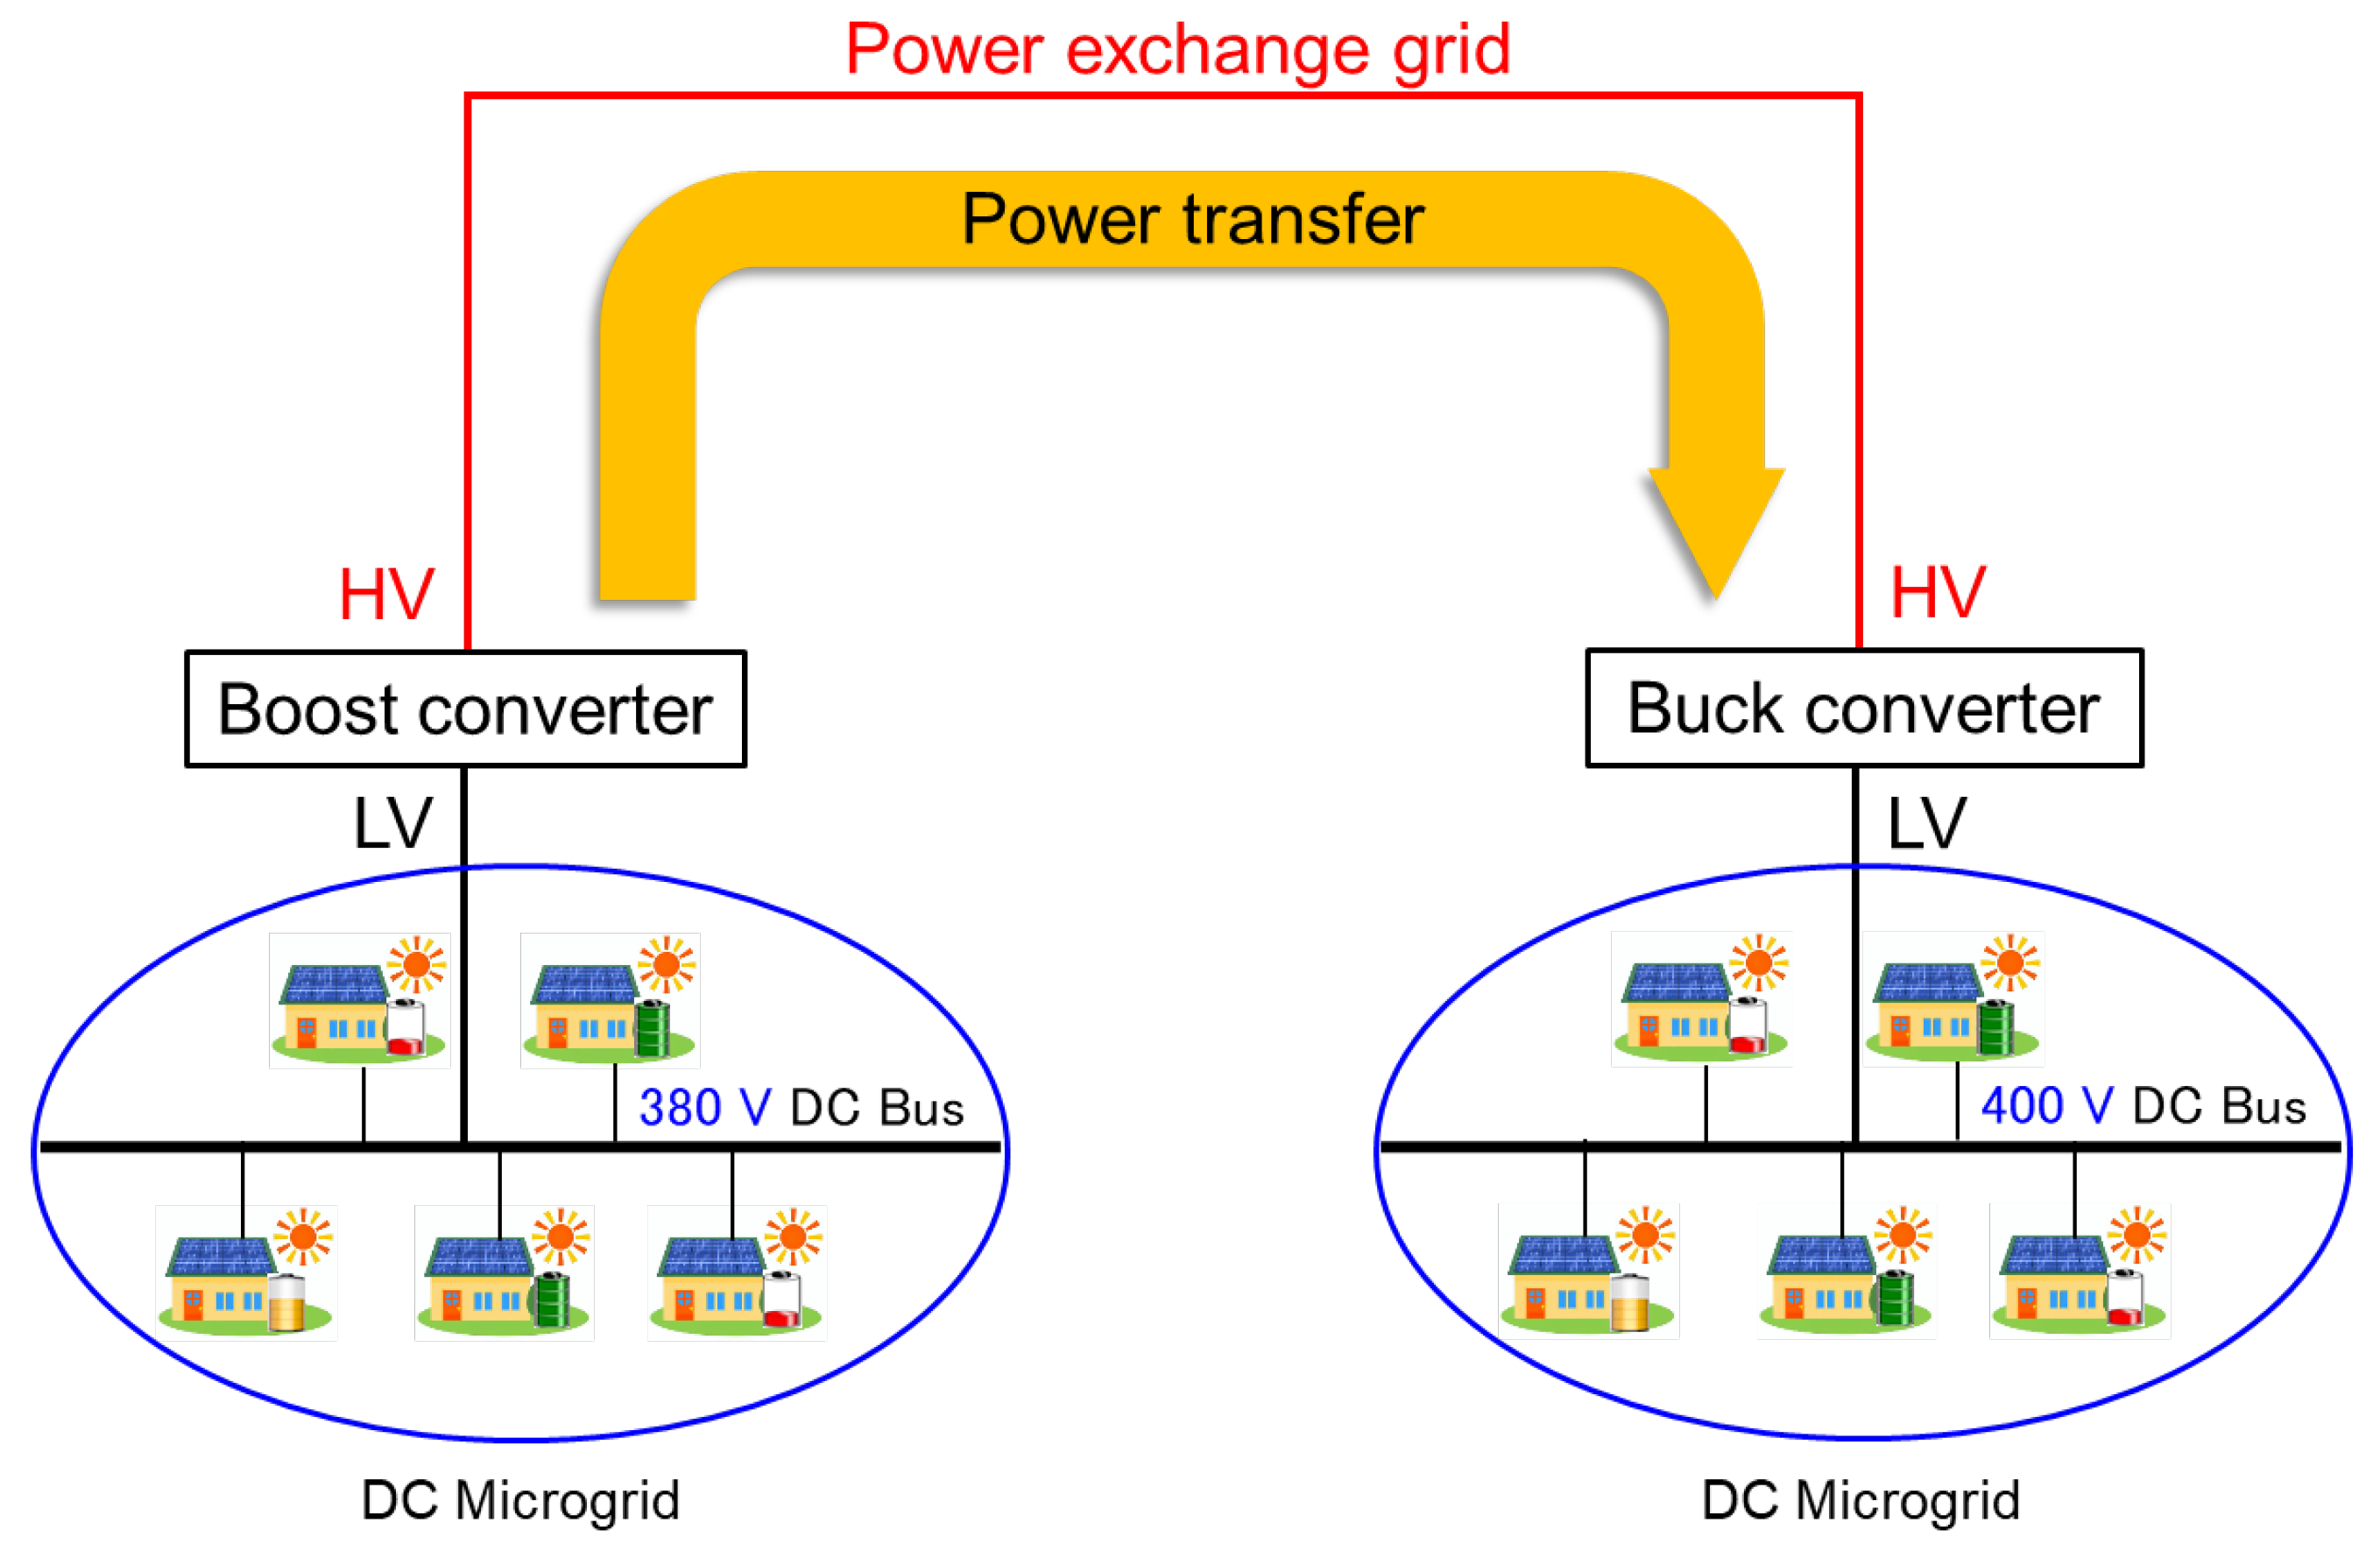
Figure 8.
Electrical equivalent circuit of peer-to-peer power transfer.
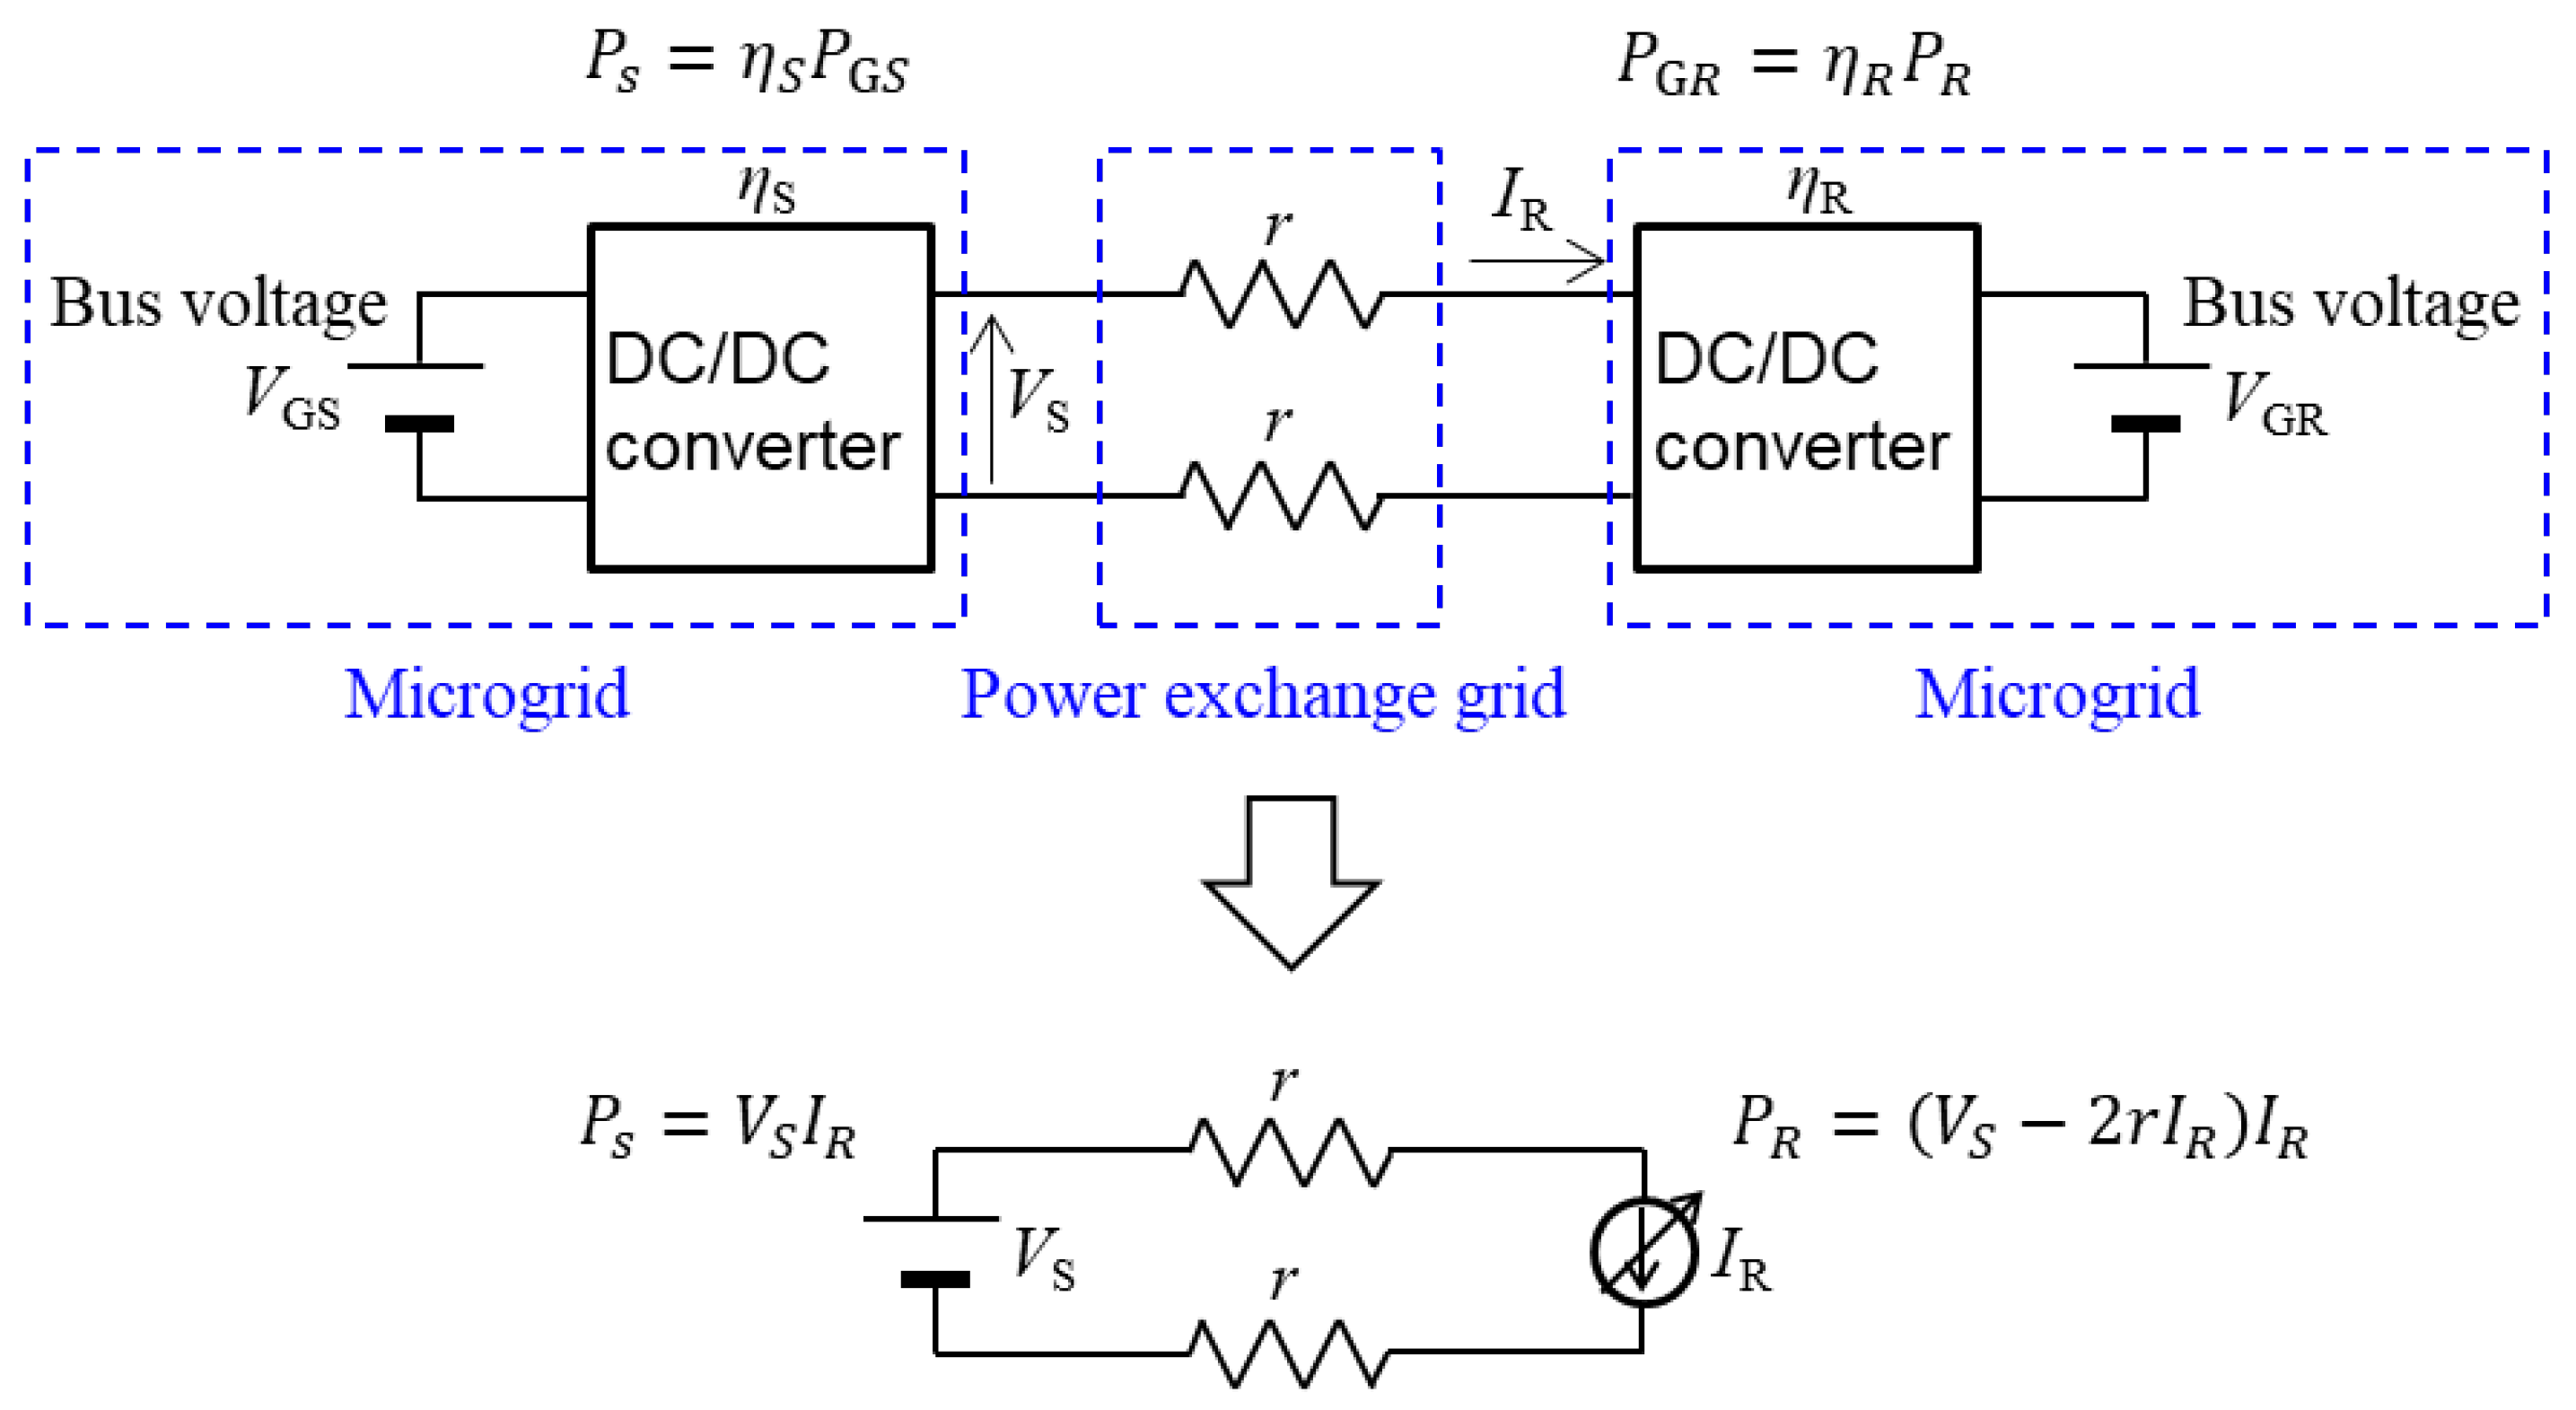
Figure 9.
m-to-n power transfer.
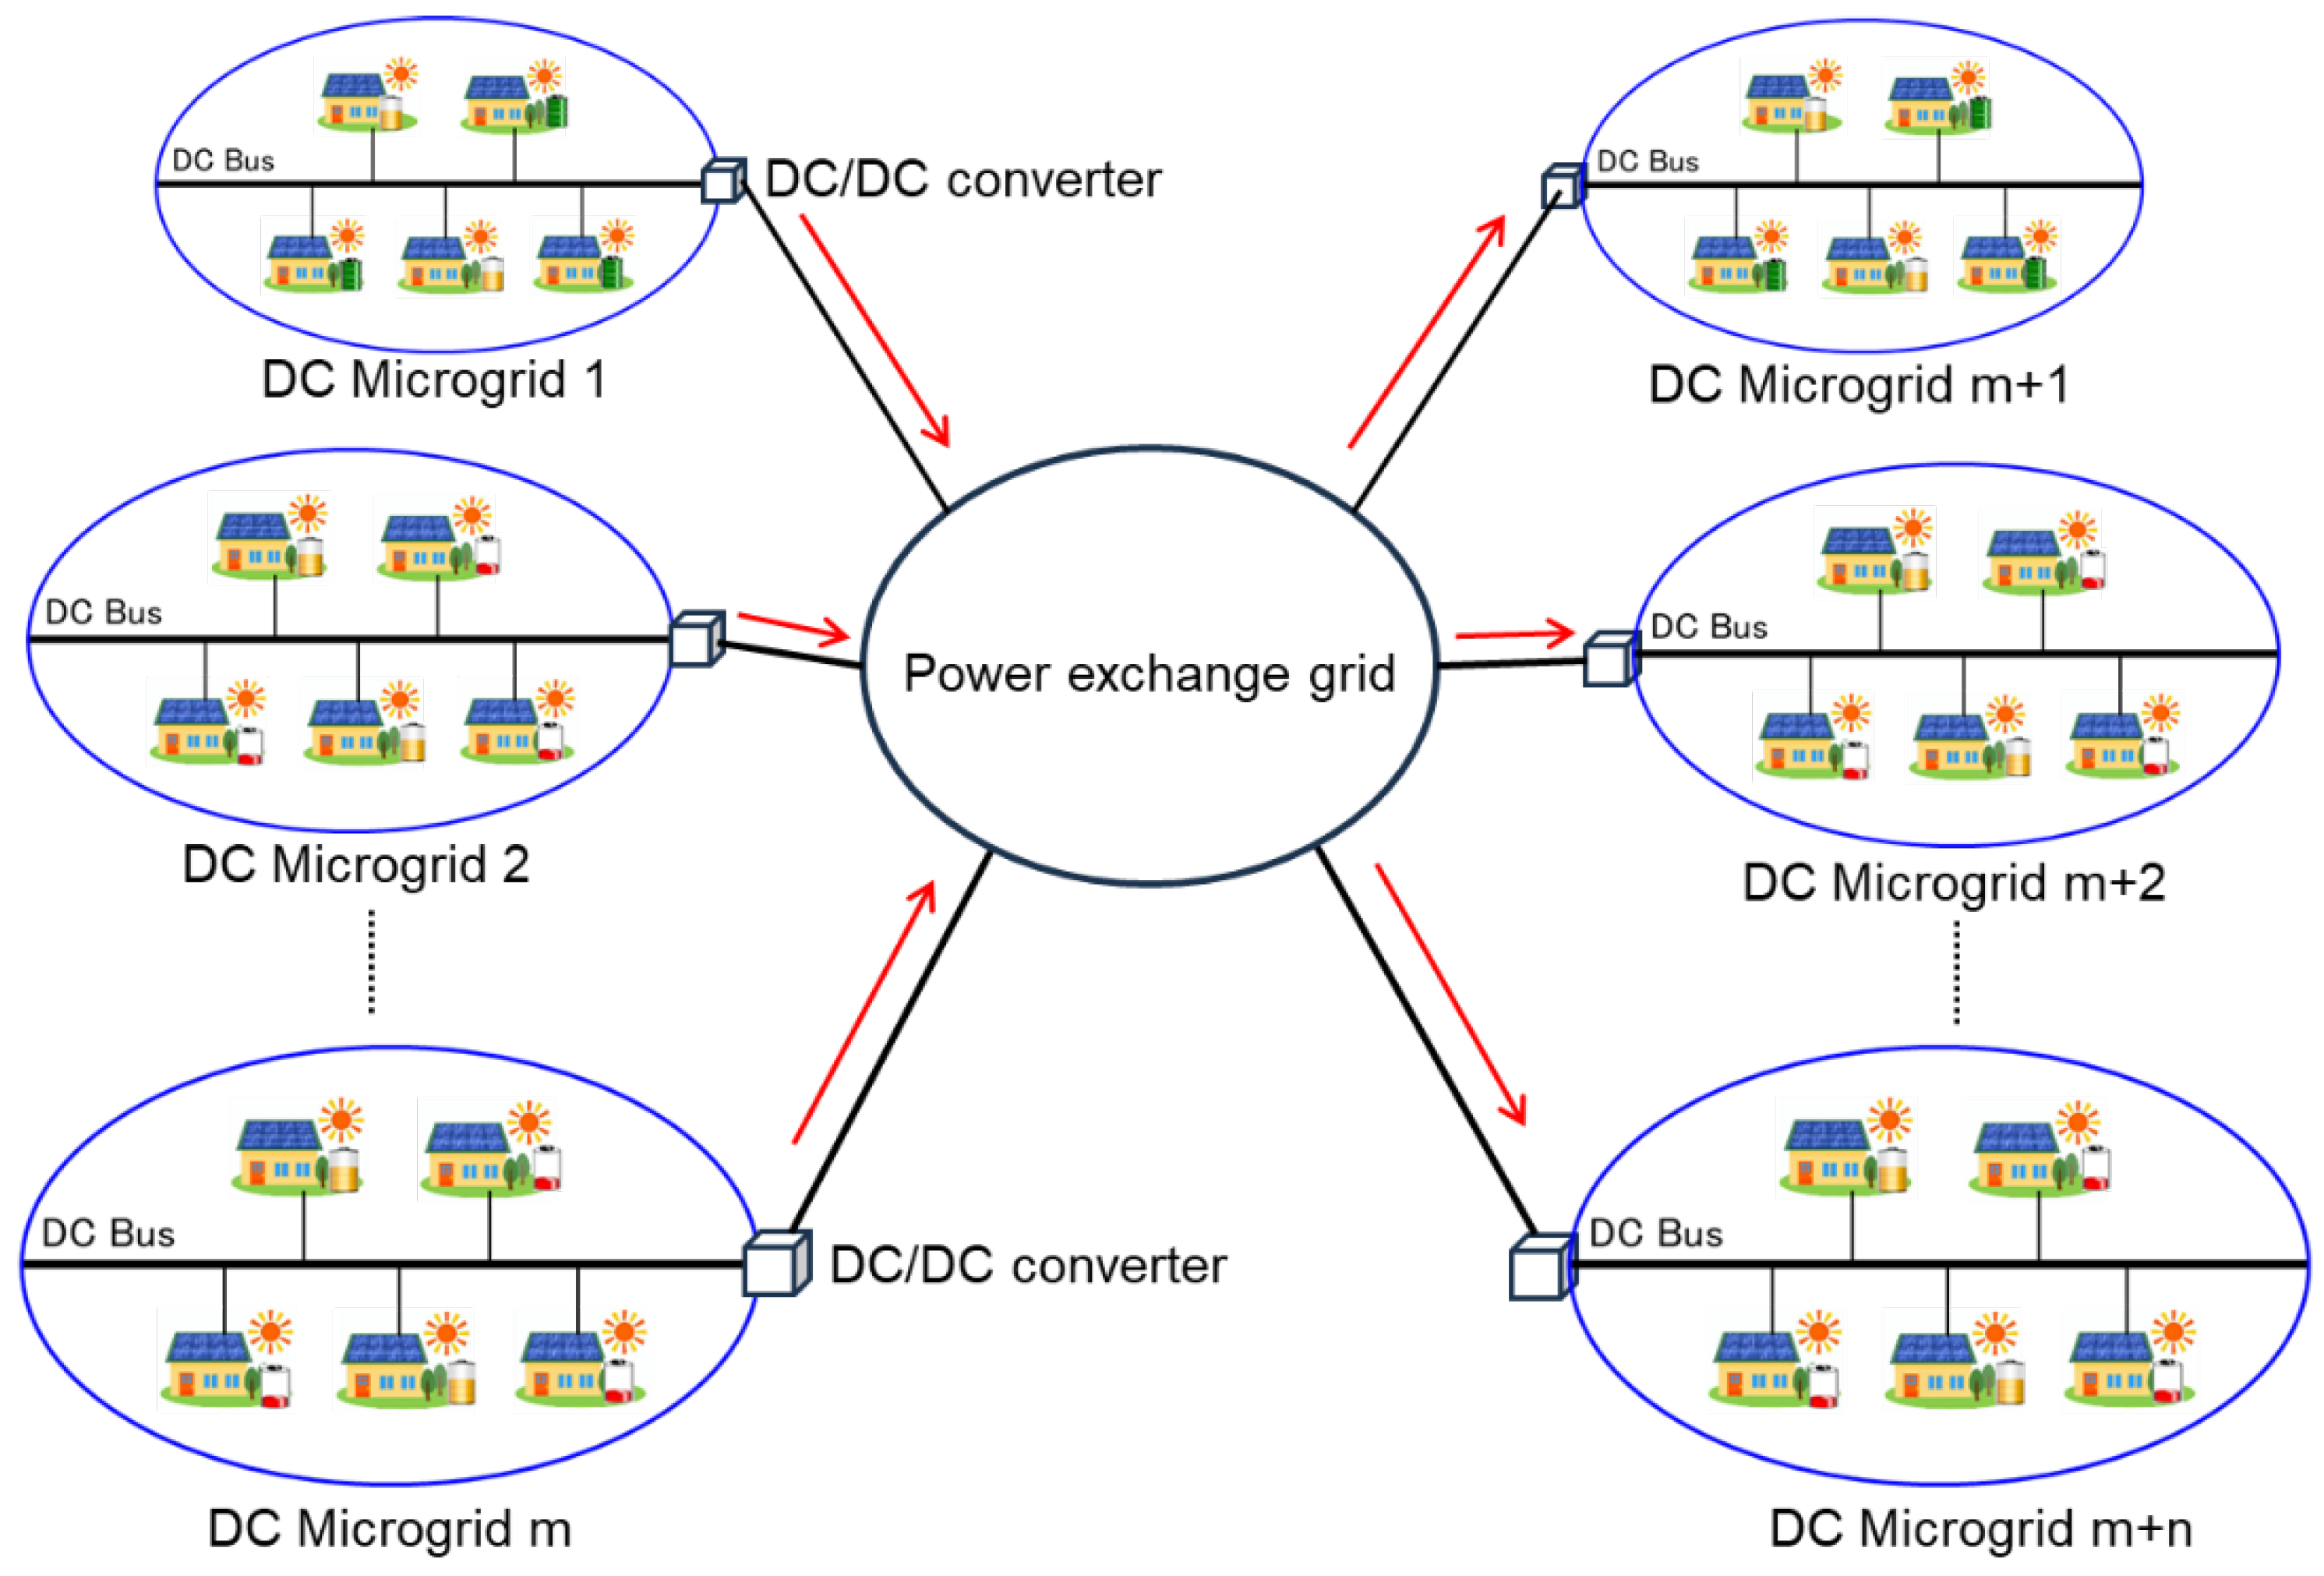
Figure 10.
Electrical equivalent circuit of m-to-n power transfer.
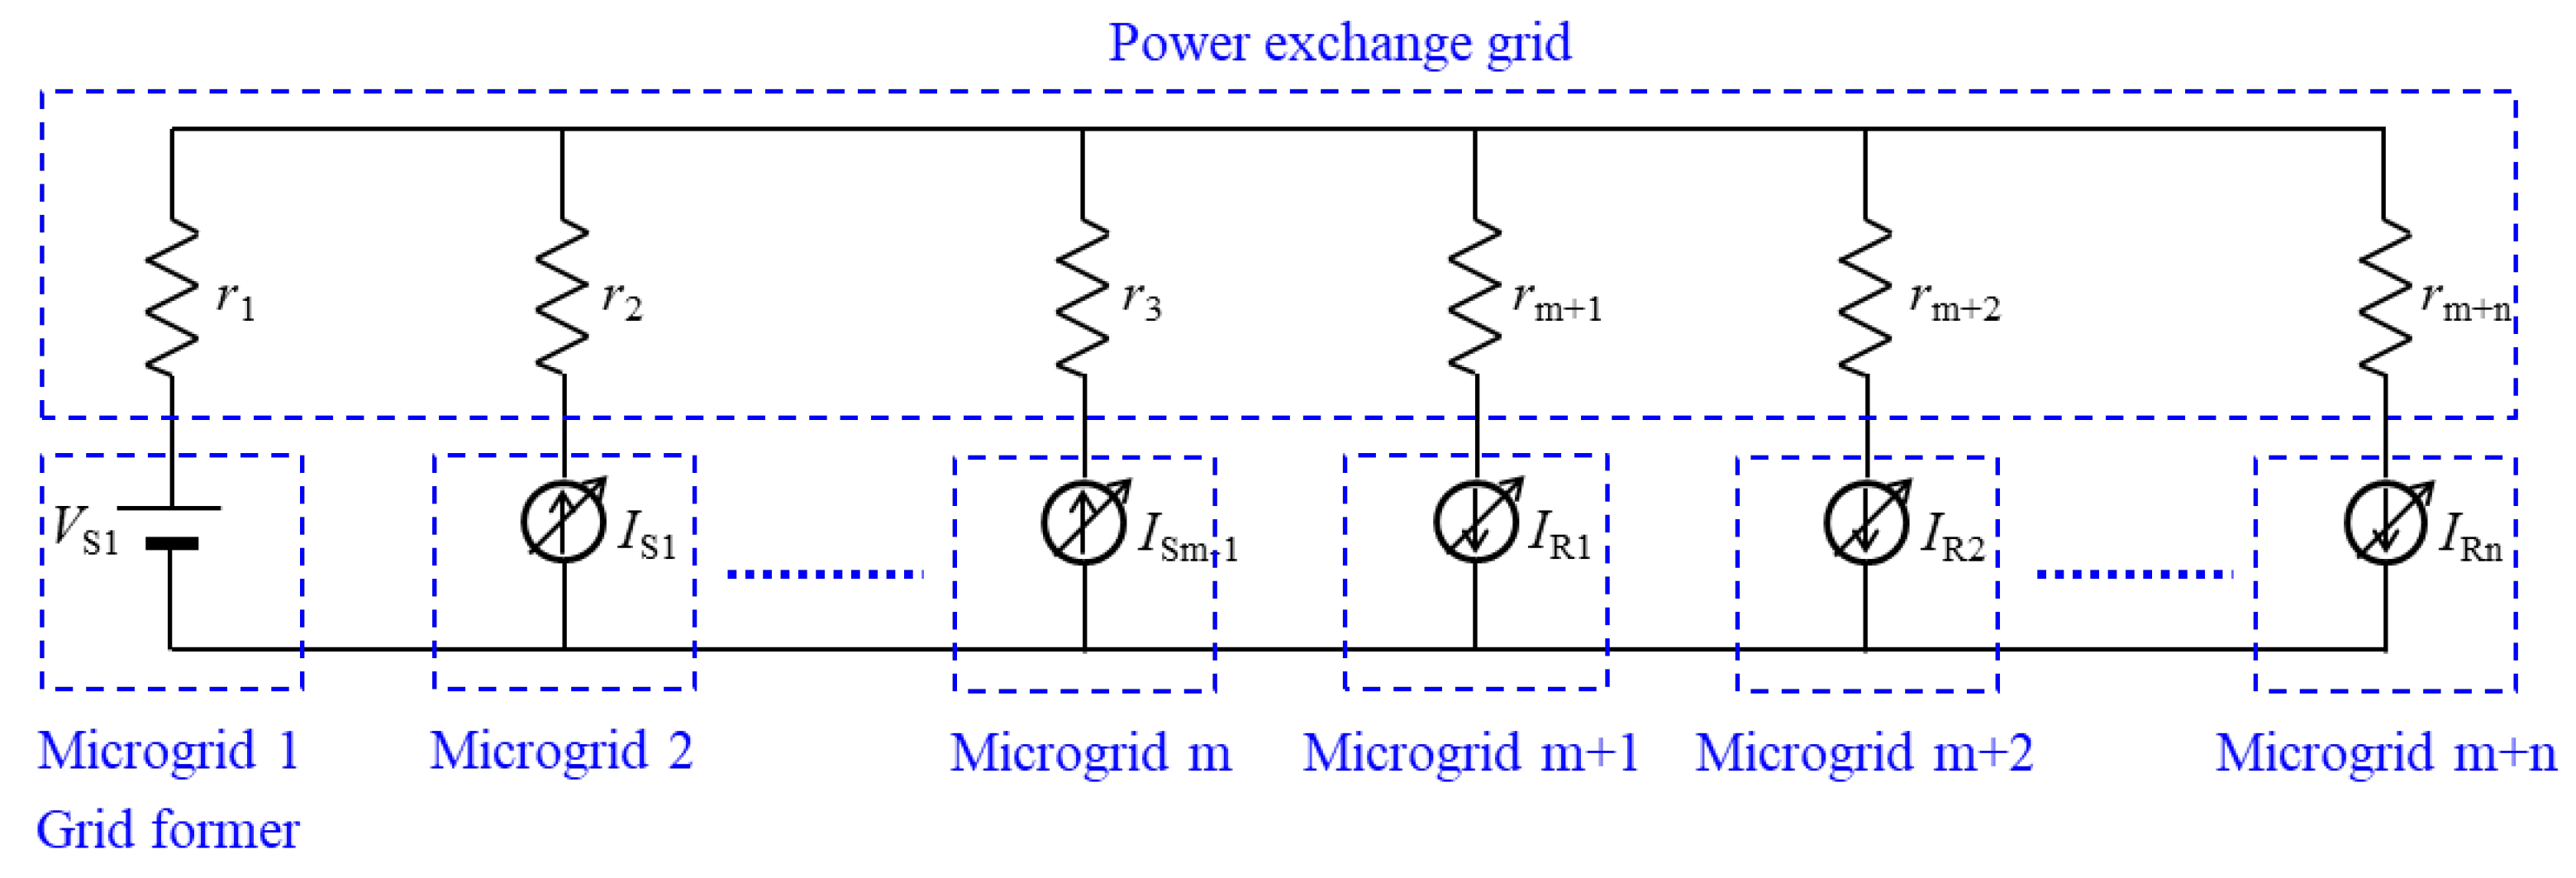
Figure 11.
Method of power transfer using DC/DC converters.
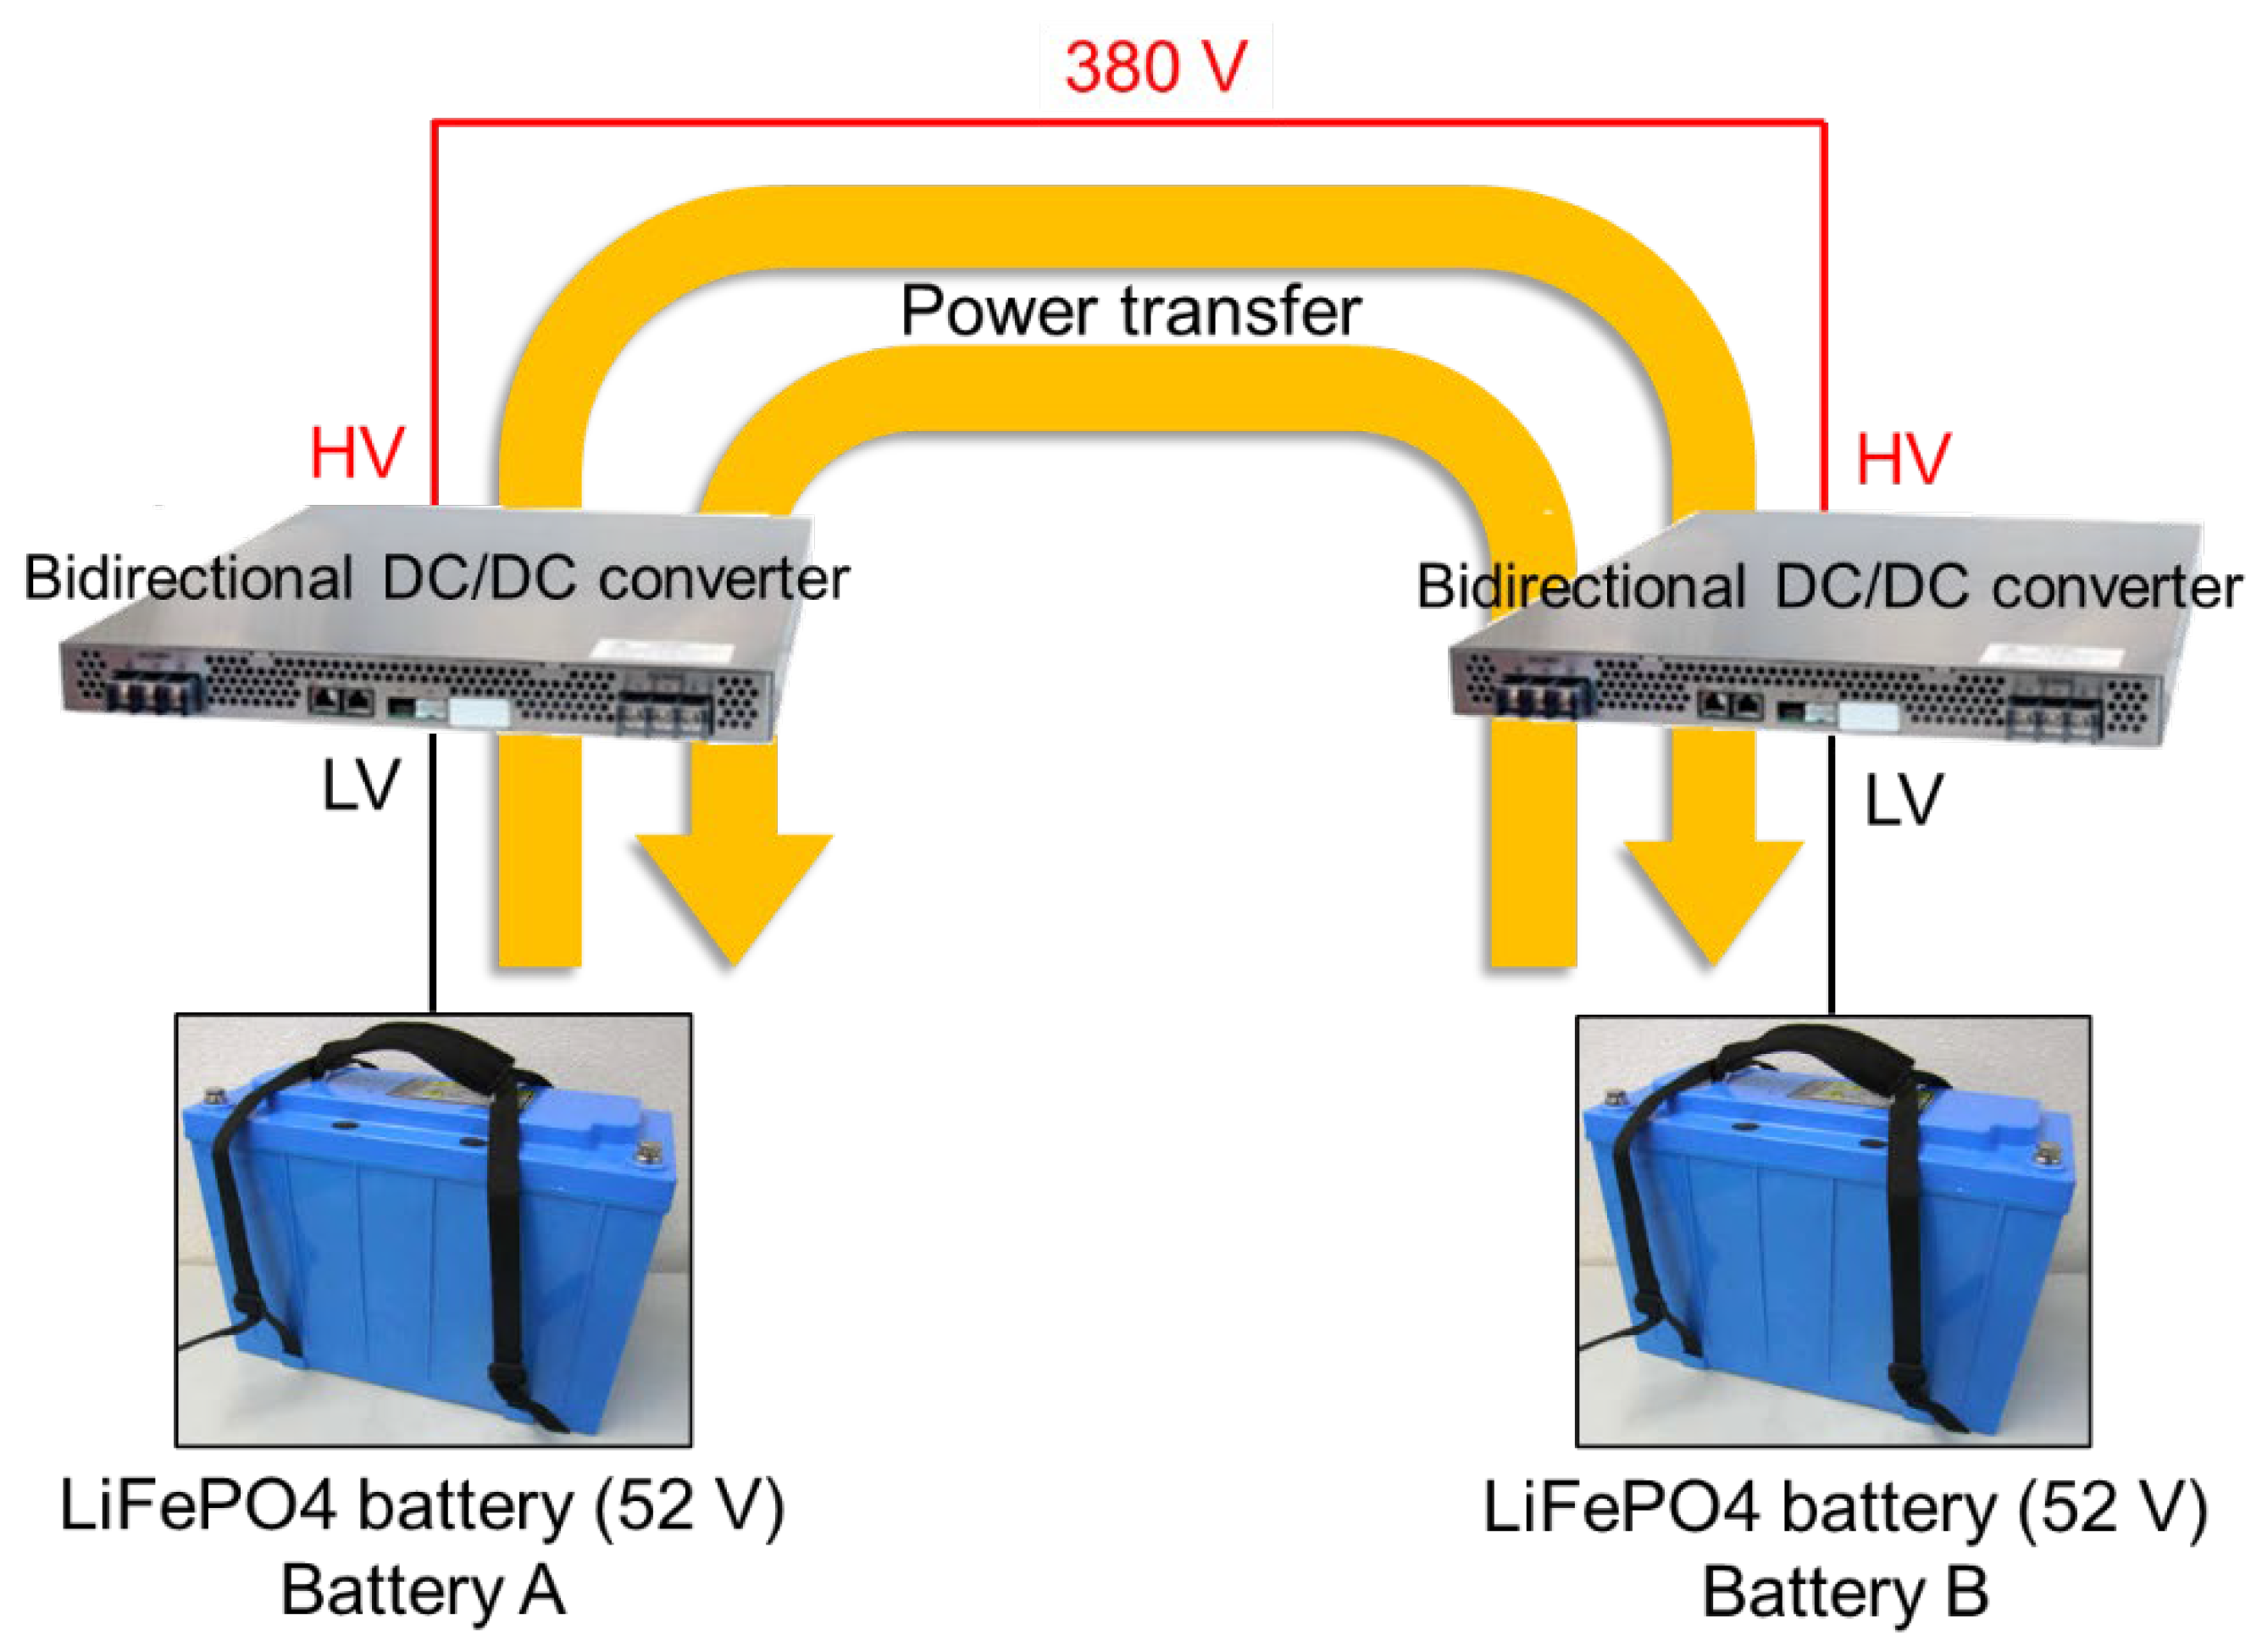
Figure 12.
Characteristics of peer-to-peer power transfer.
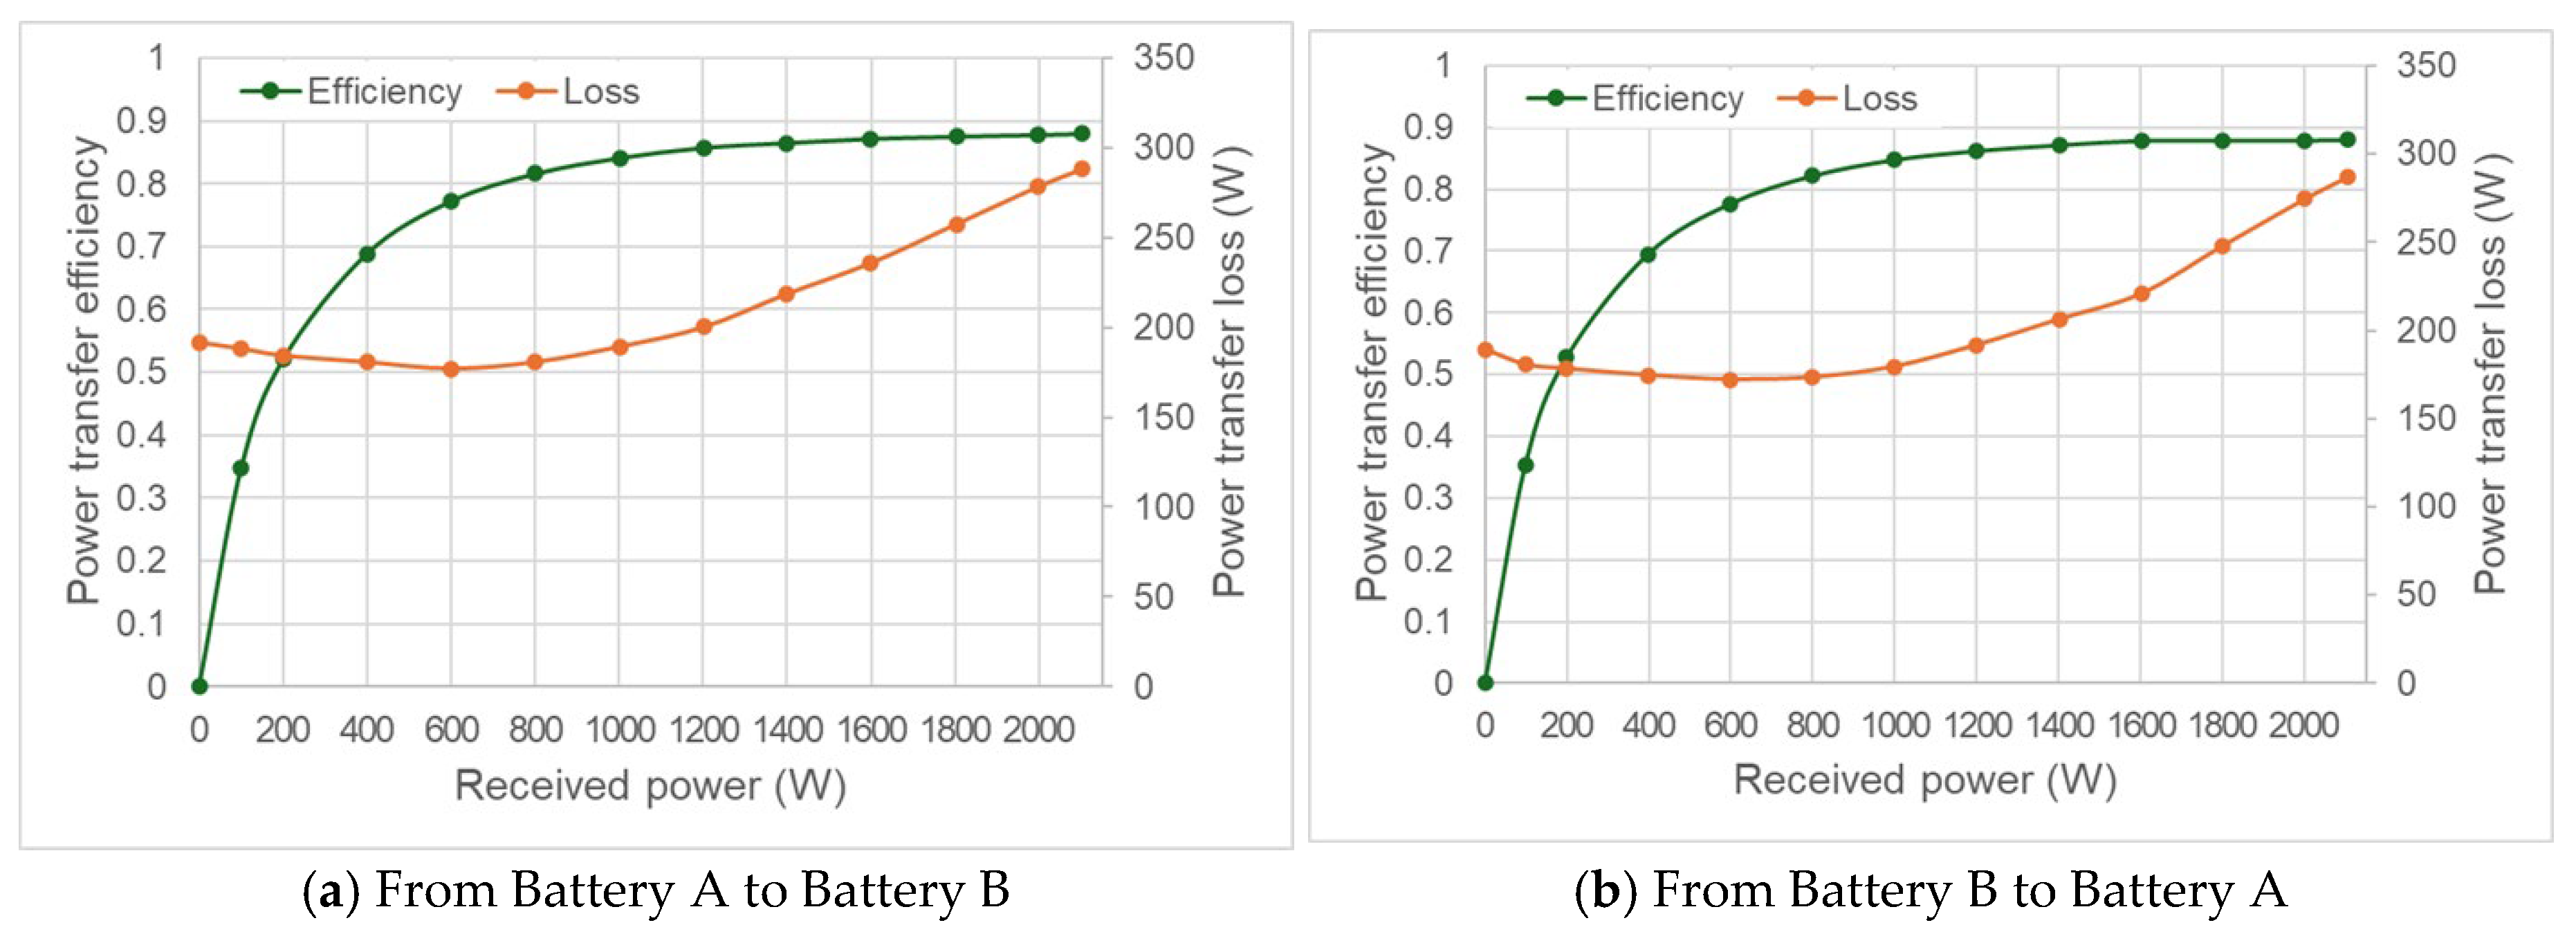
Figure 13.
Experimental Setup for 2-to-2 Battery Power Transfer.
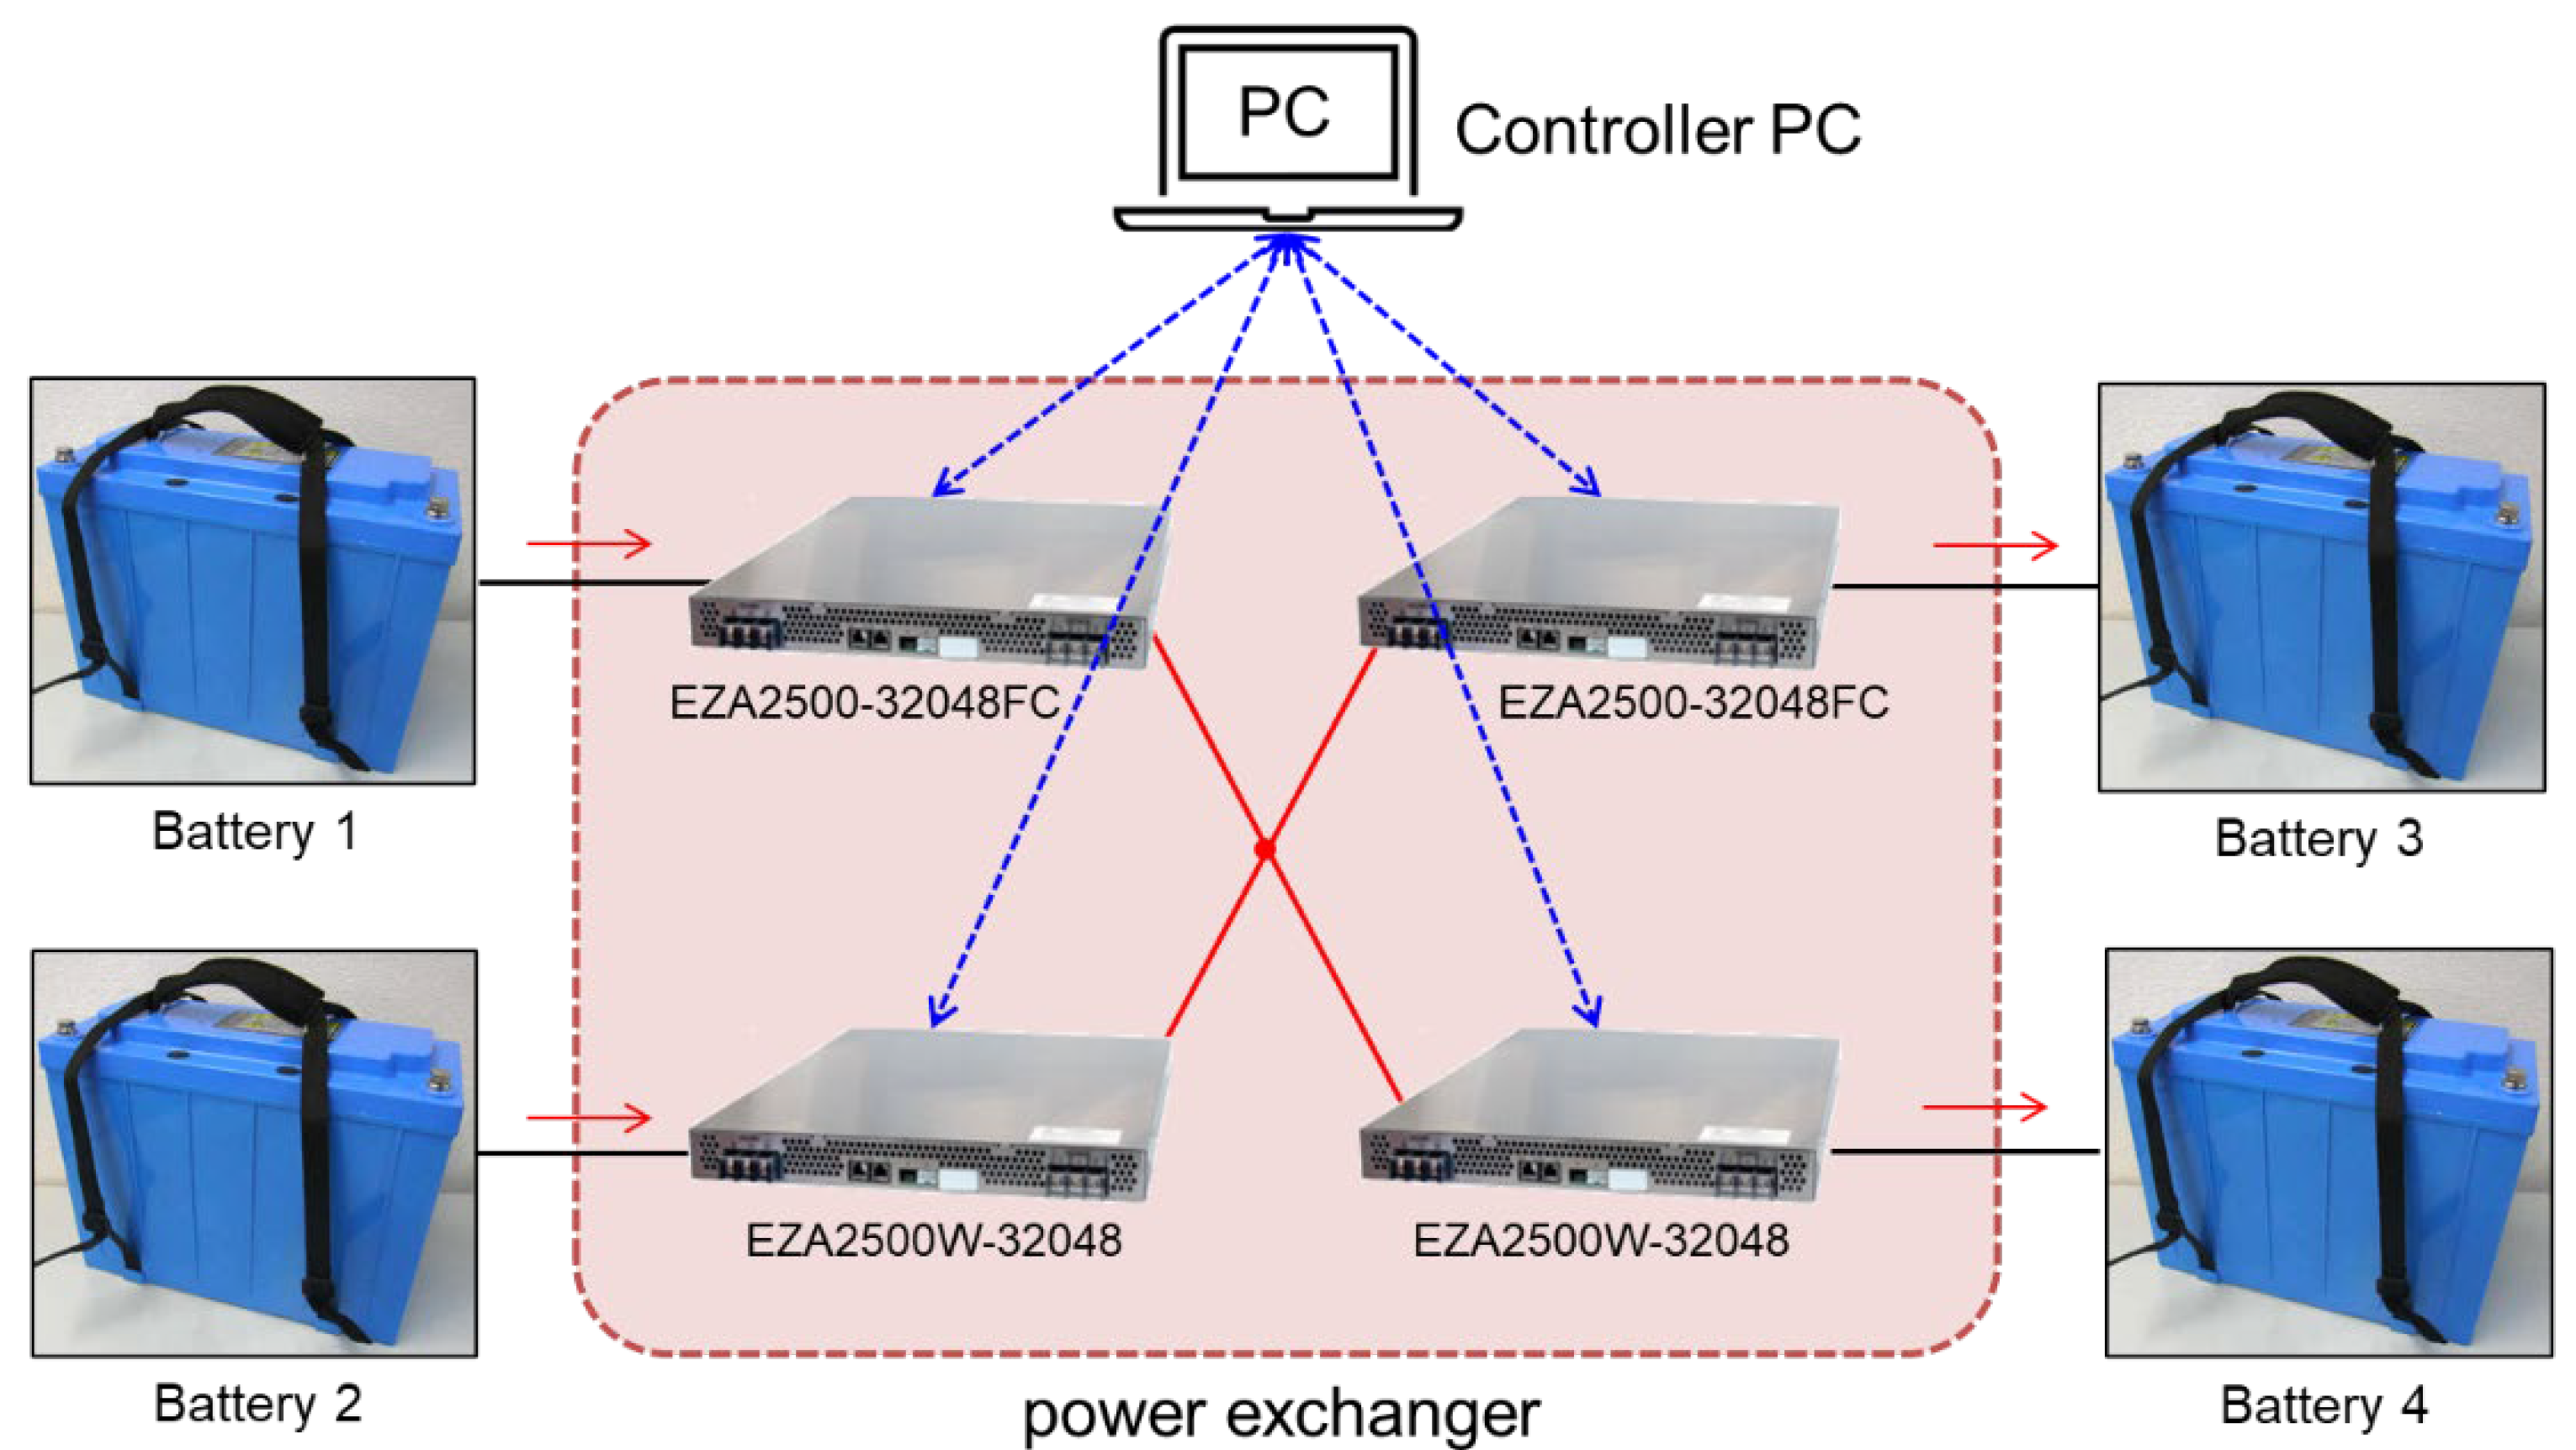
Figure 14.
Configuration for 1-to-2 power exchange.
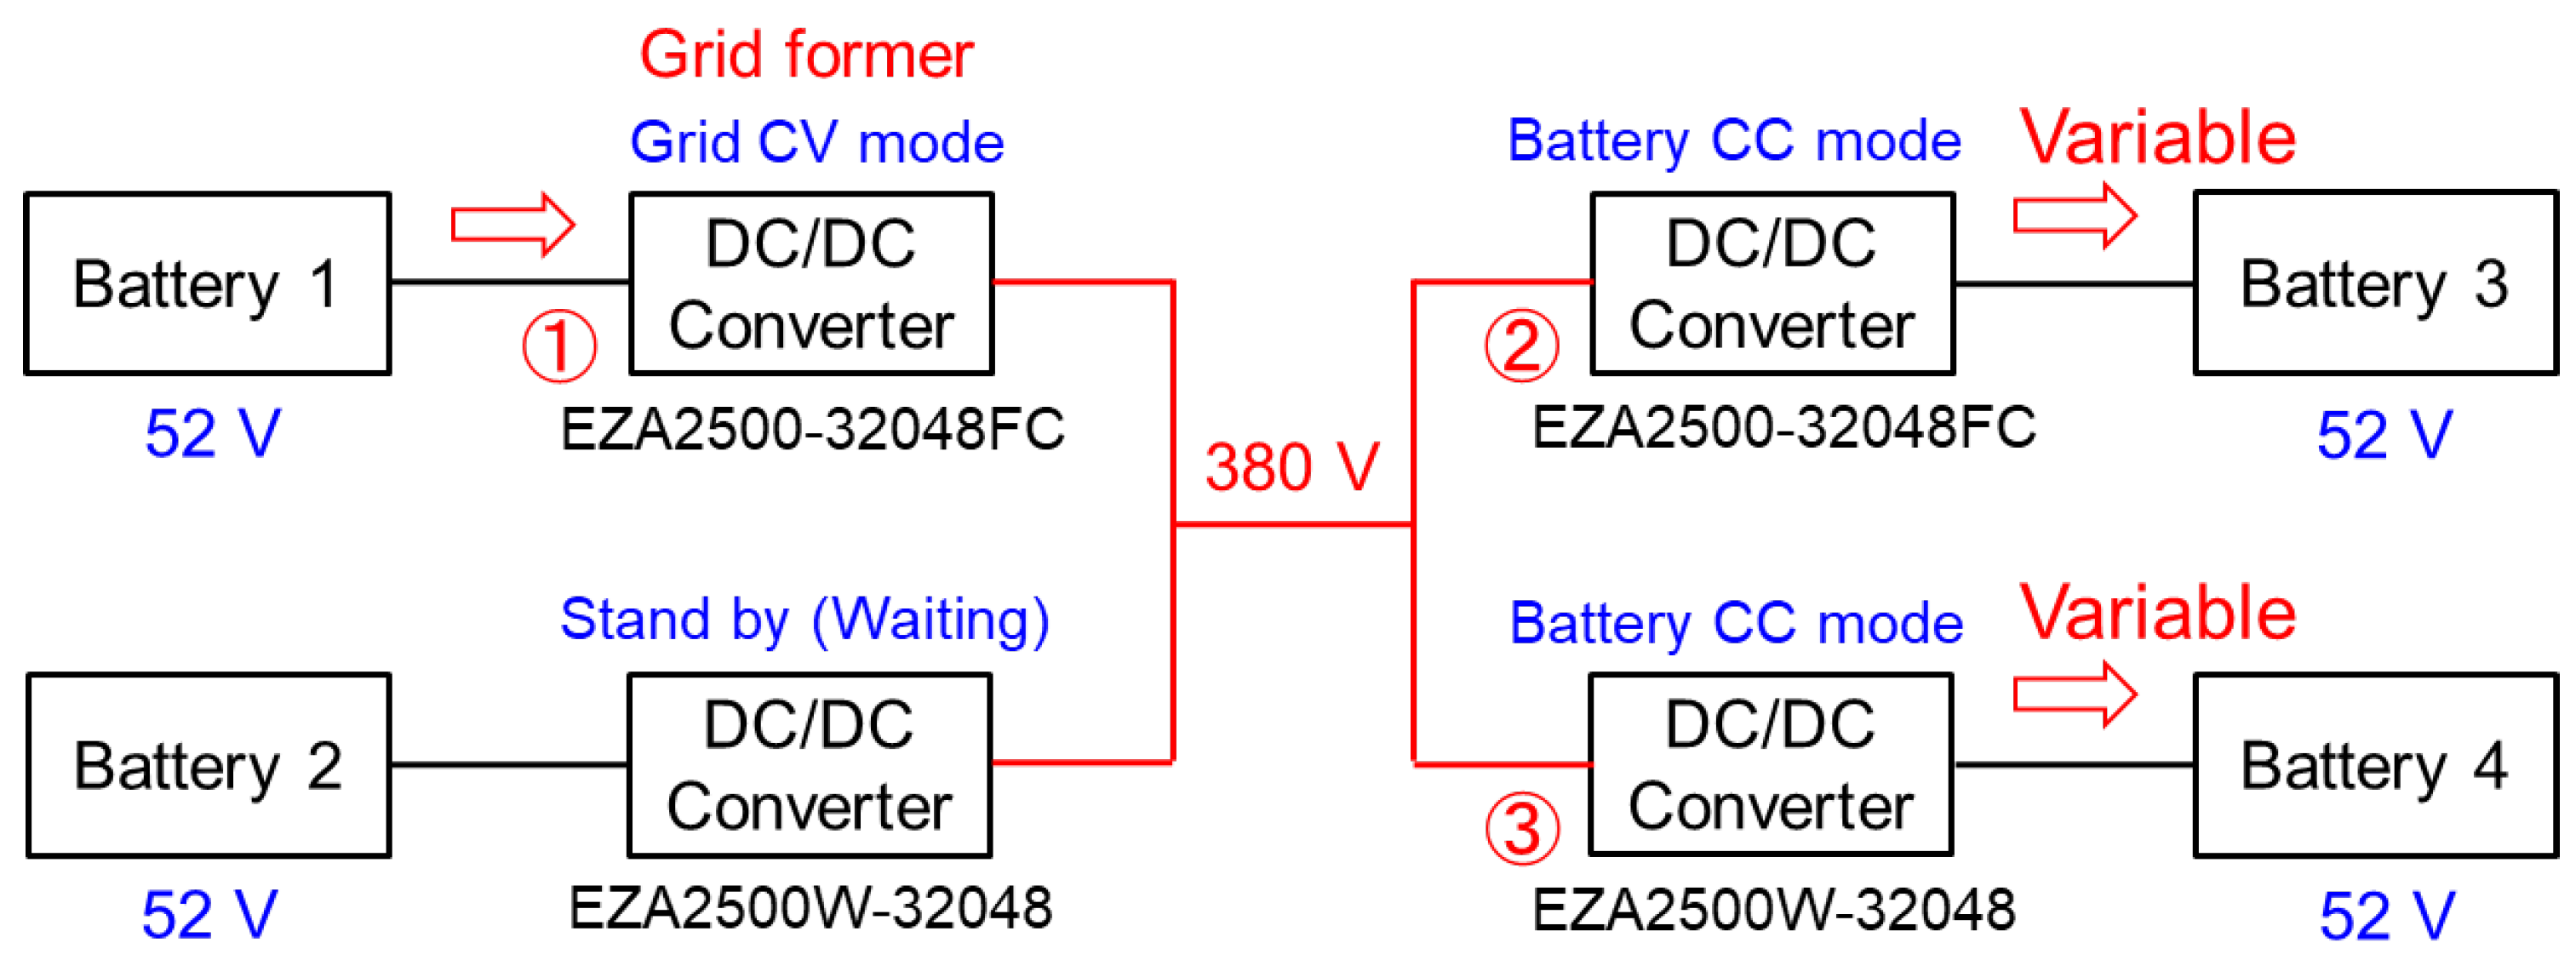
Figure 15.
Transmission losses and efficiencies as 3D bar graphs.
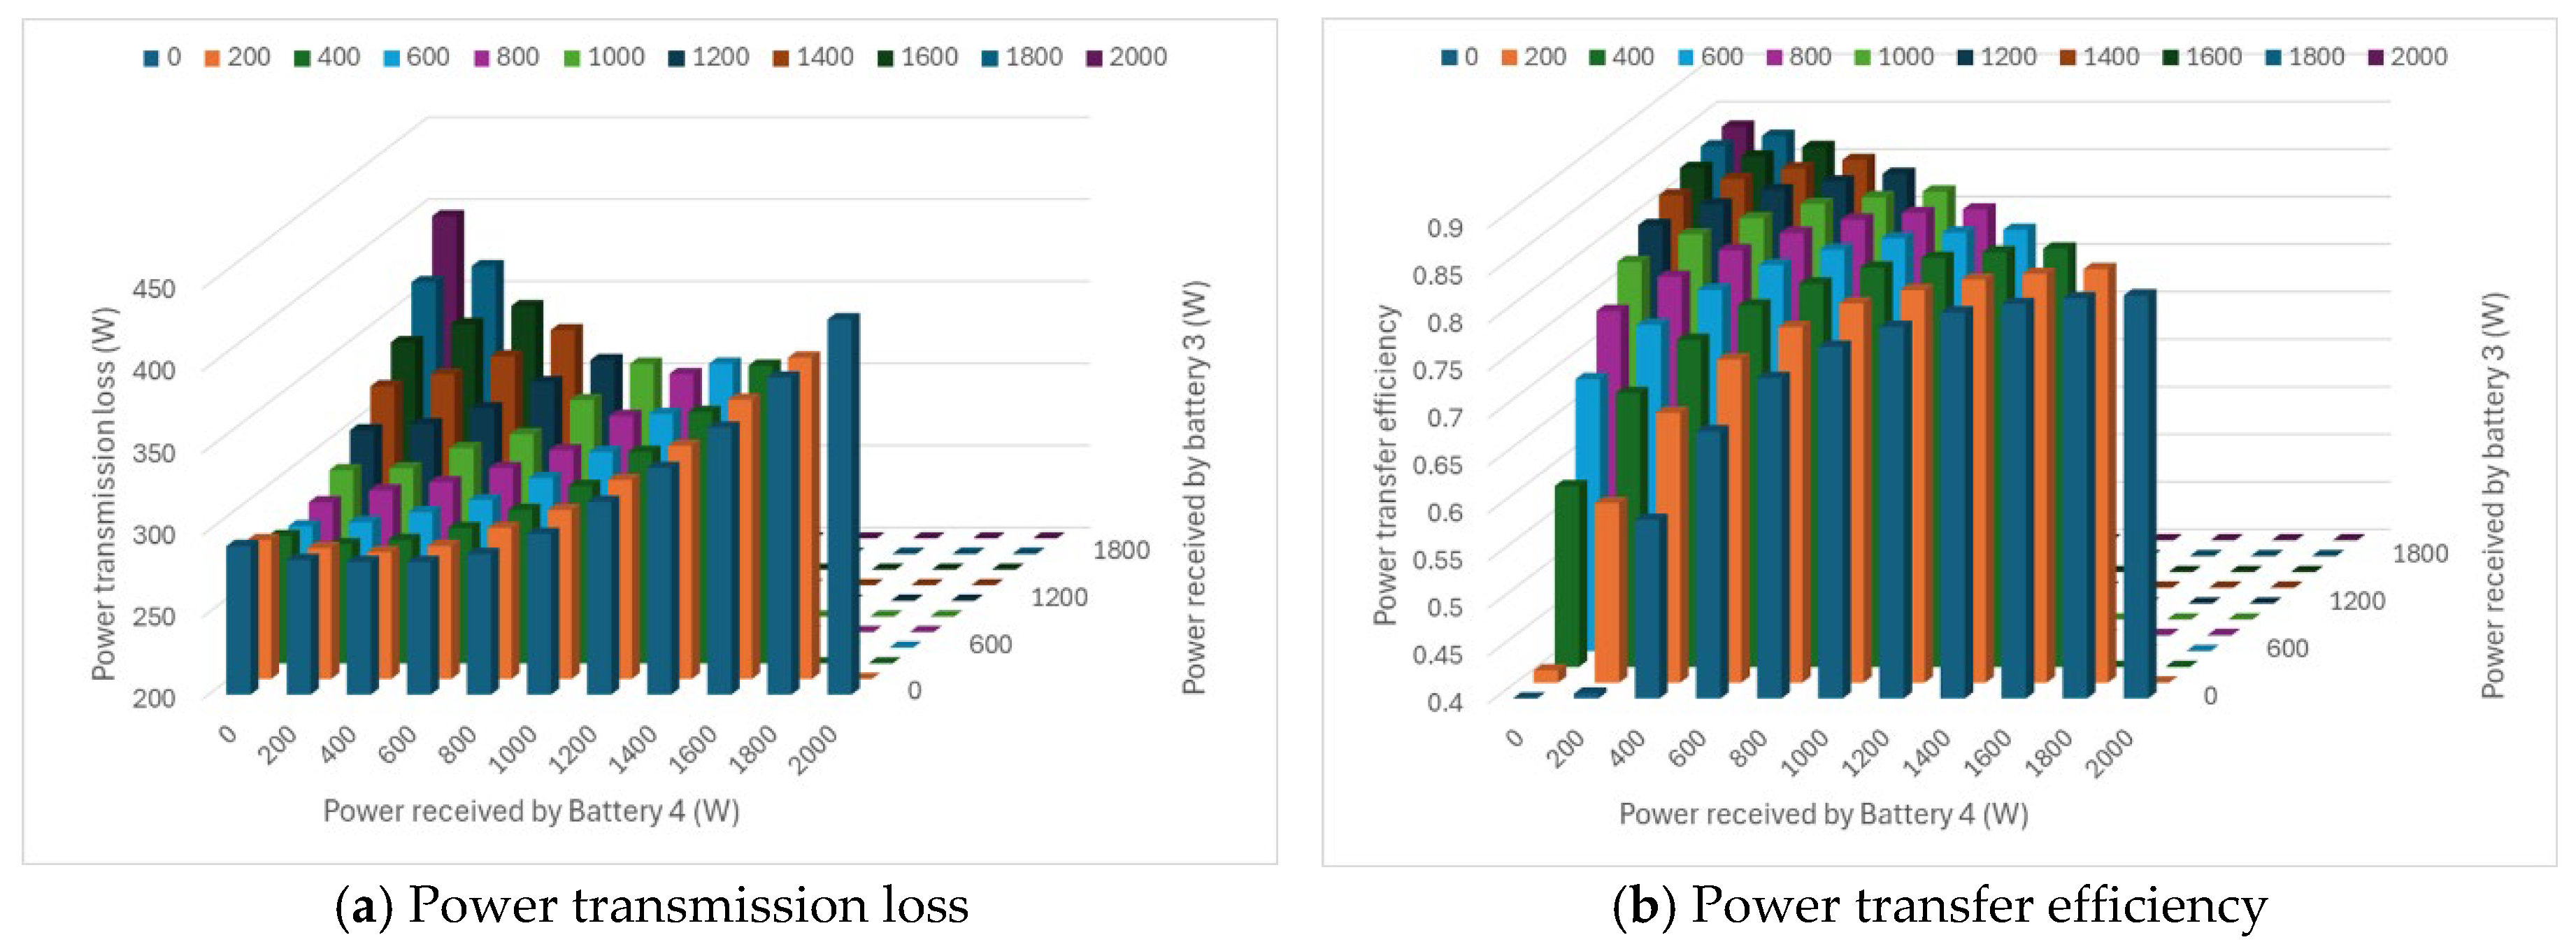
Figure 16.
Configuration for 2-to-1 power exchange.
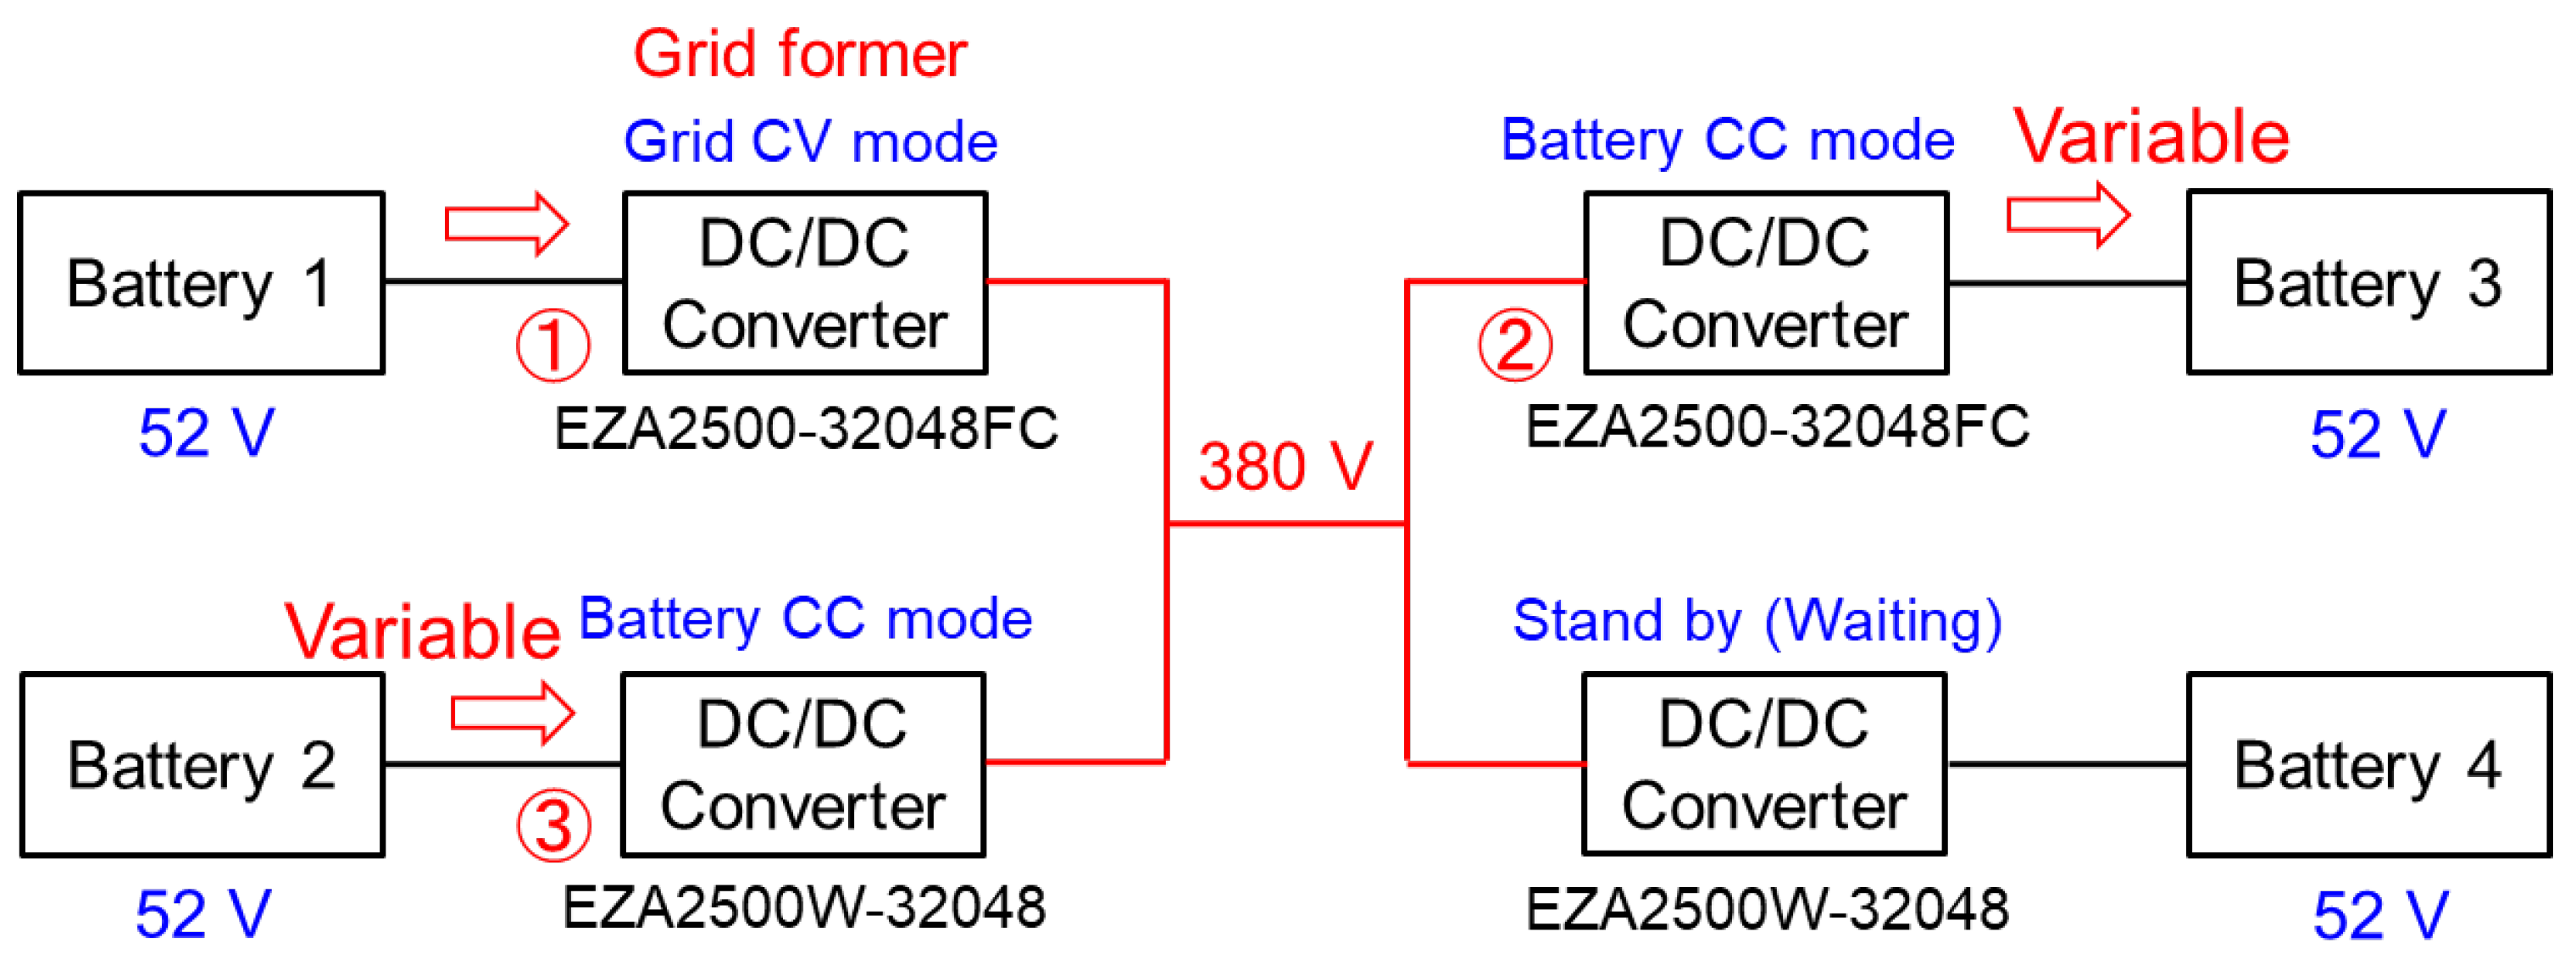
Figure 17.
Transmission losses and efficiencies as 3D bar graphs.
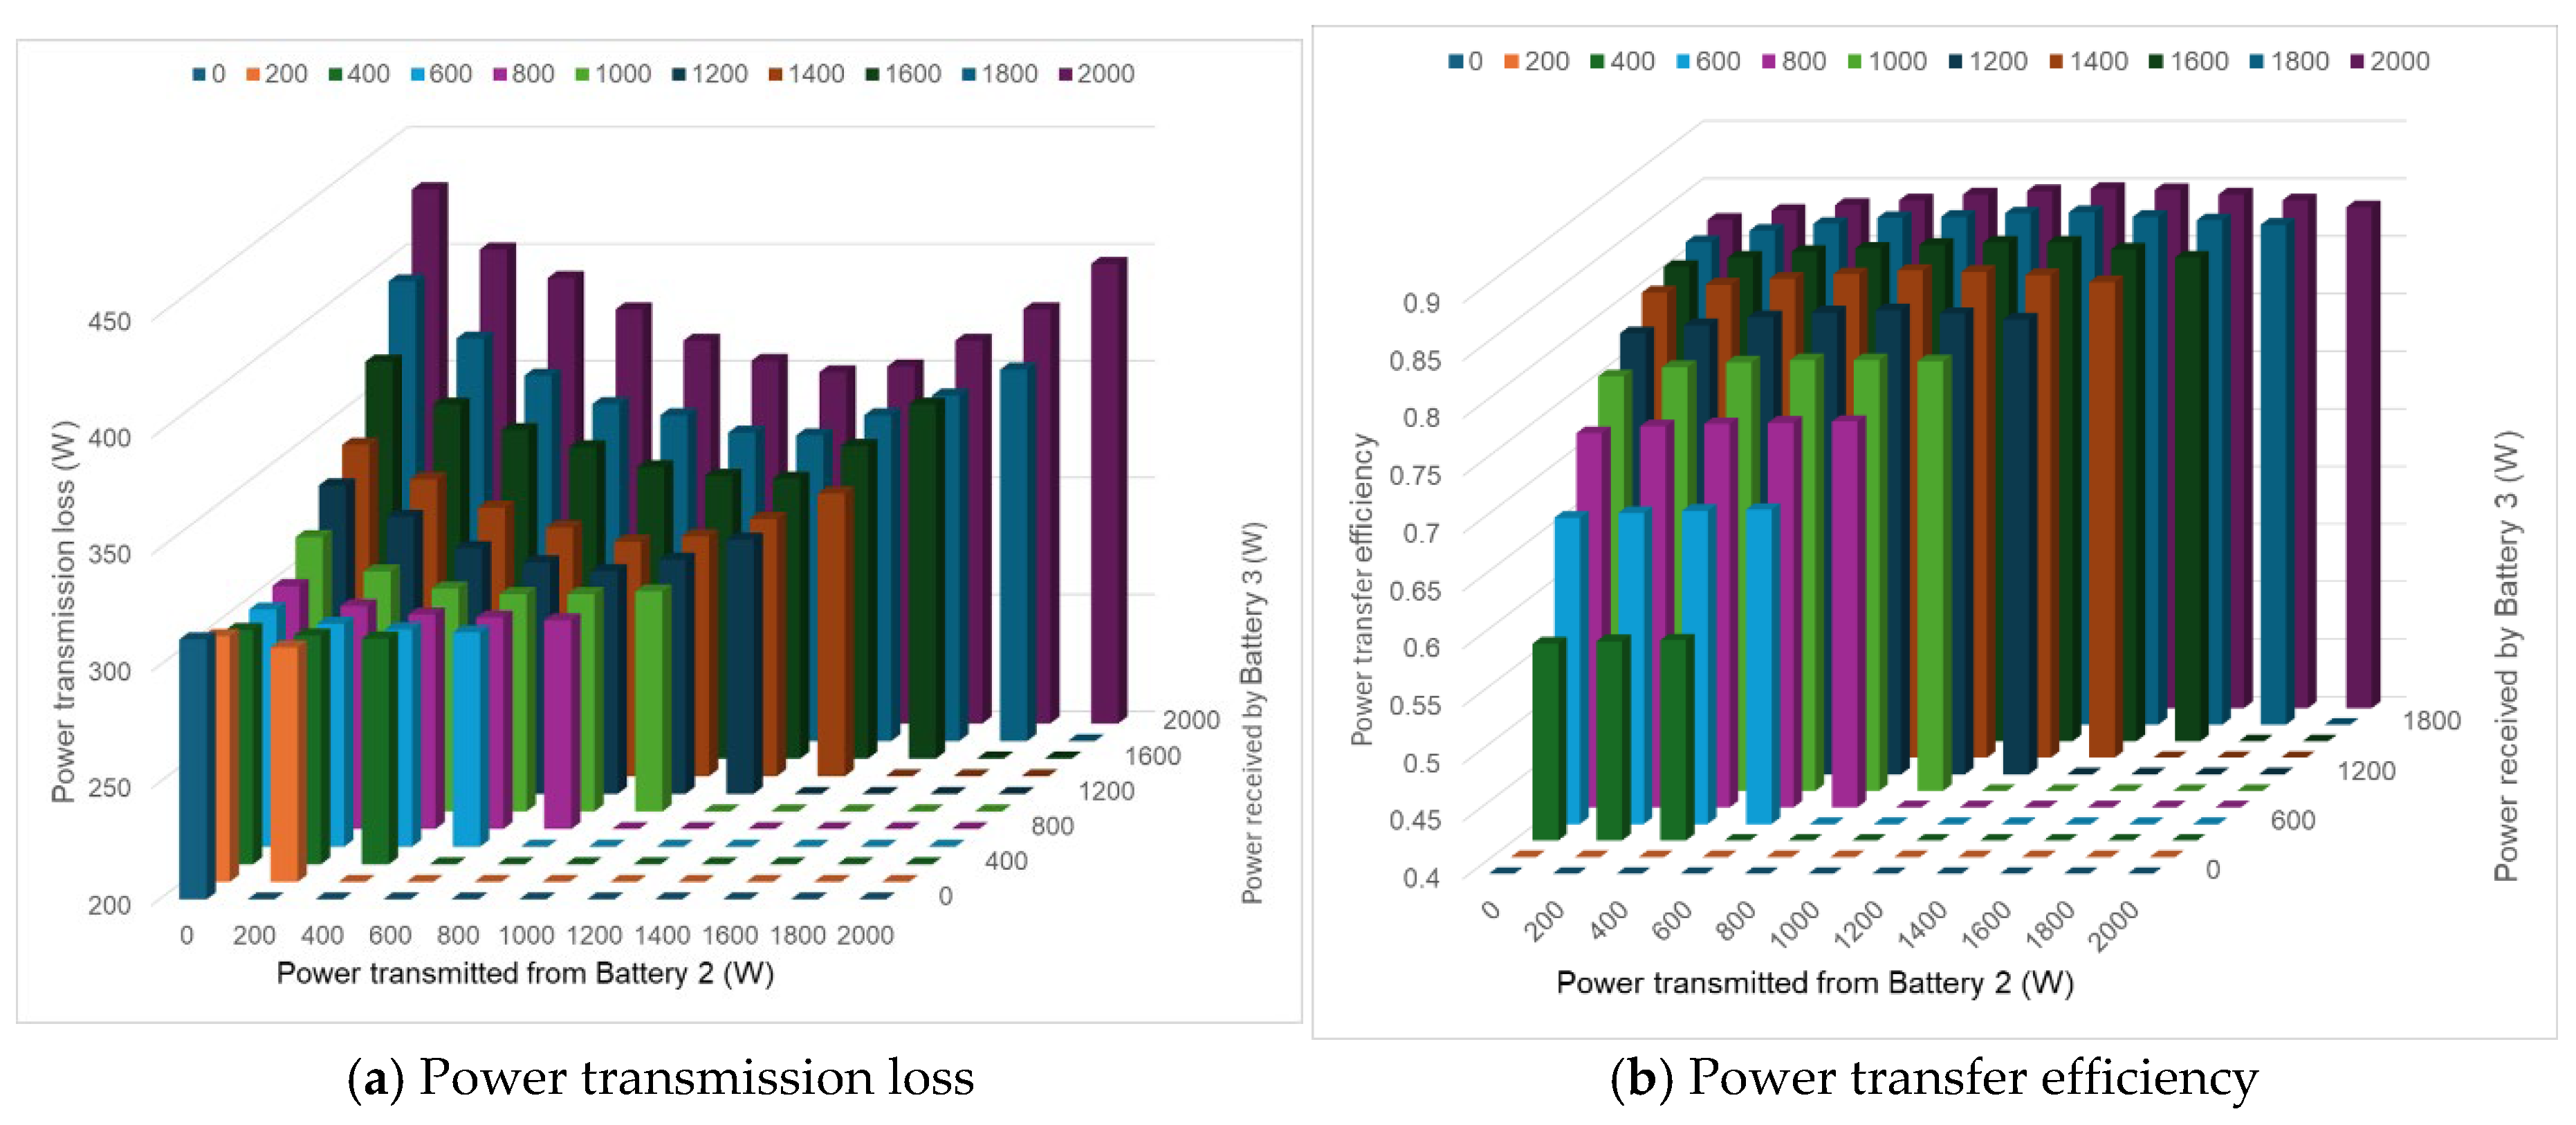
Figure 18.
Setup for transitioning from 1-to-2 to 2-to-2 power exchange.
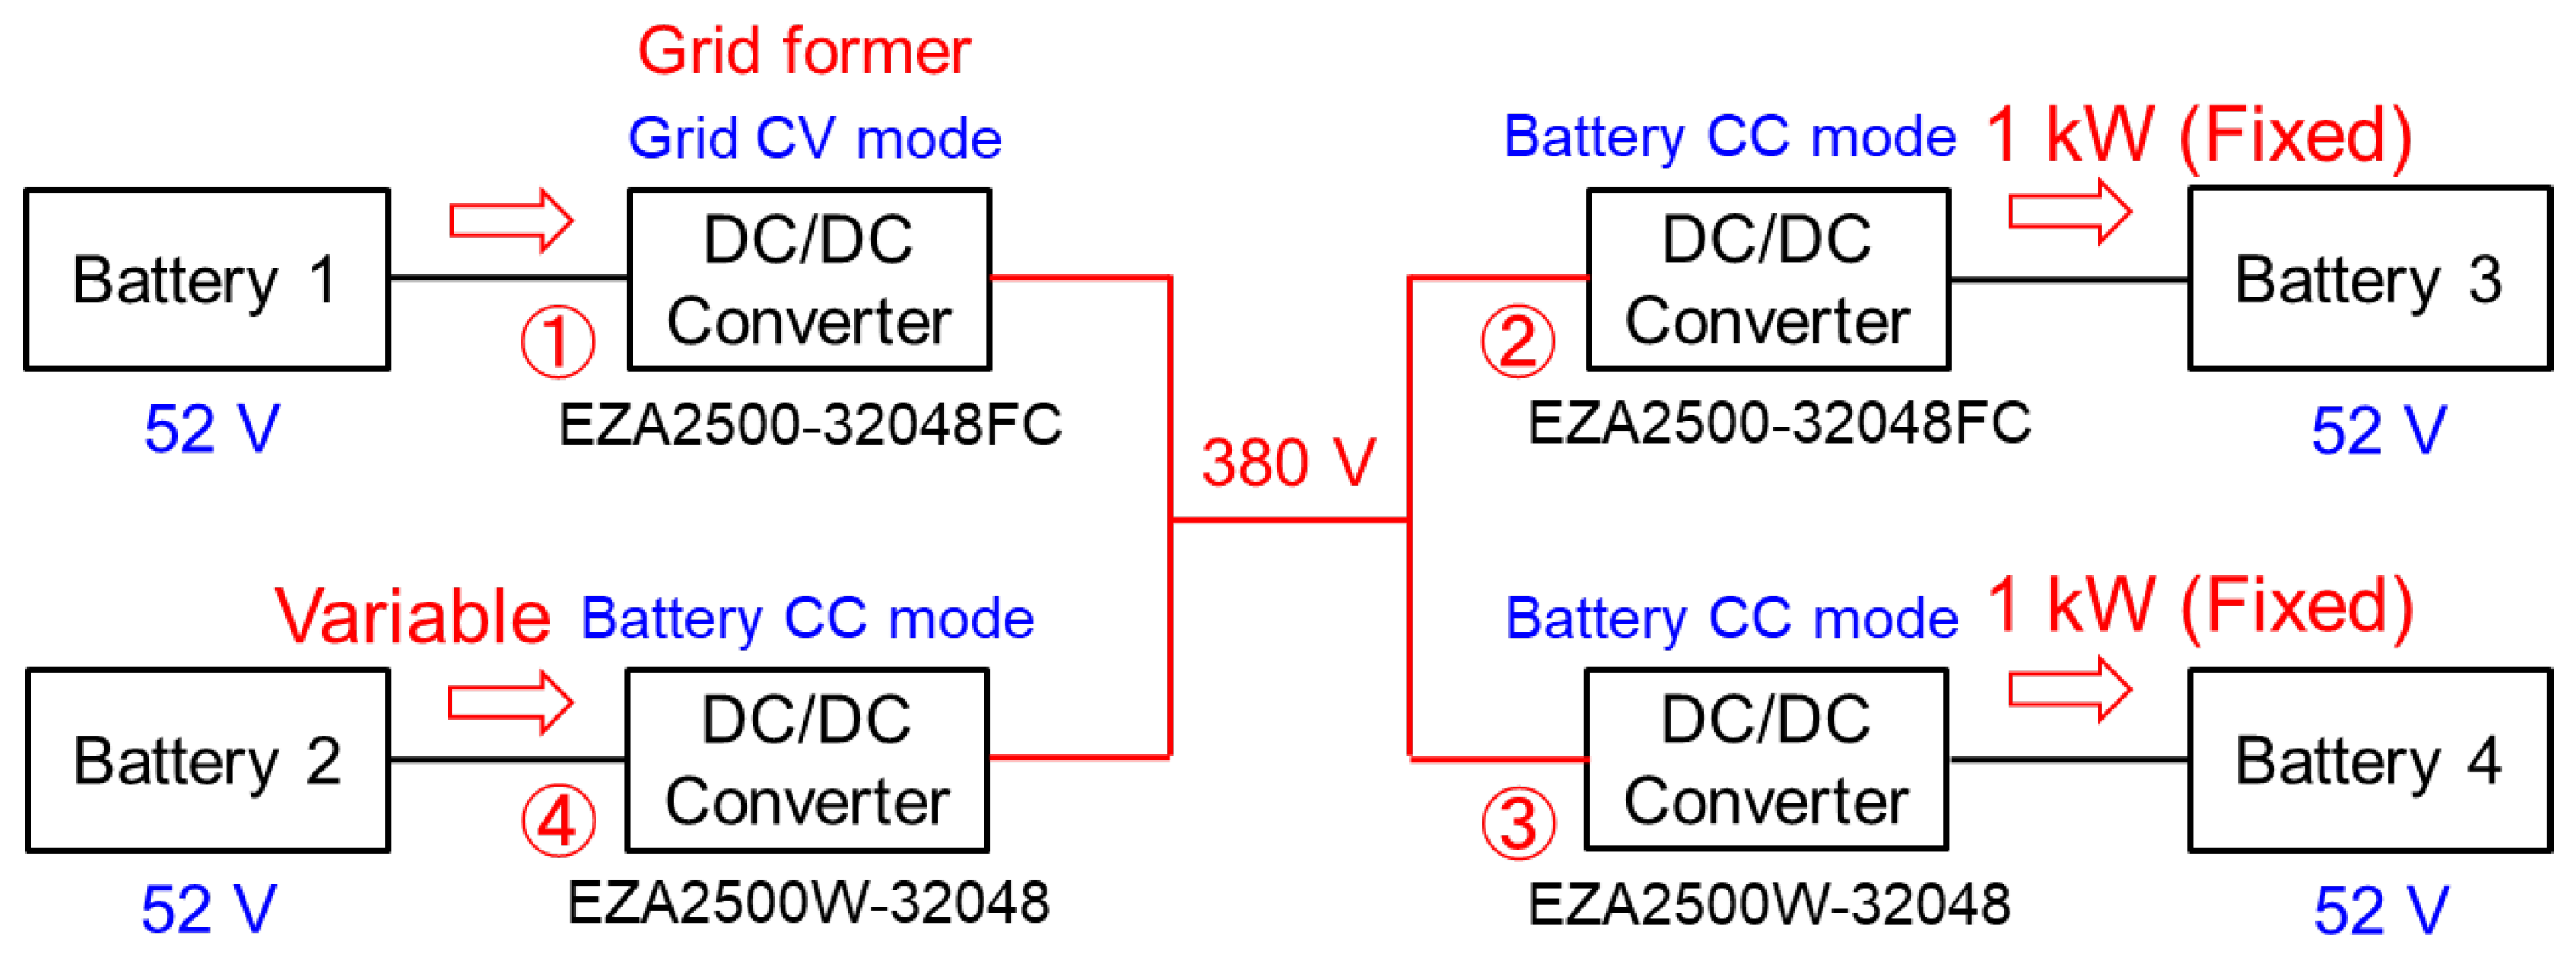
Figure 19.
Measured results during the transition from 1-to-2 to 2-to-2 power exchange.
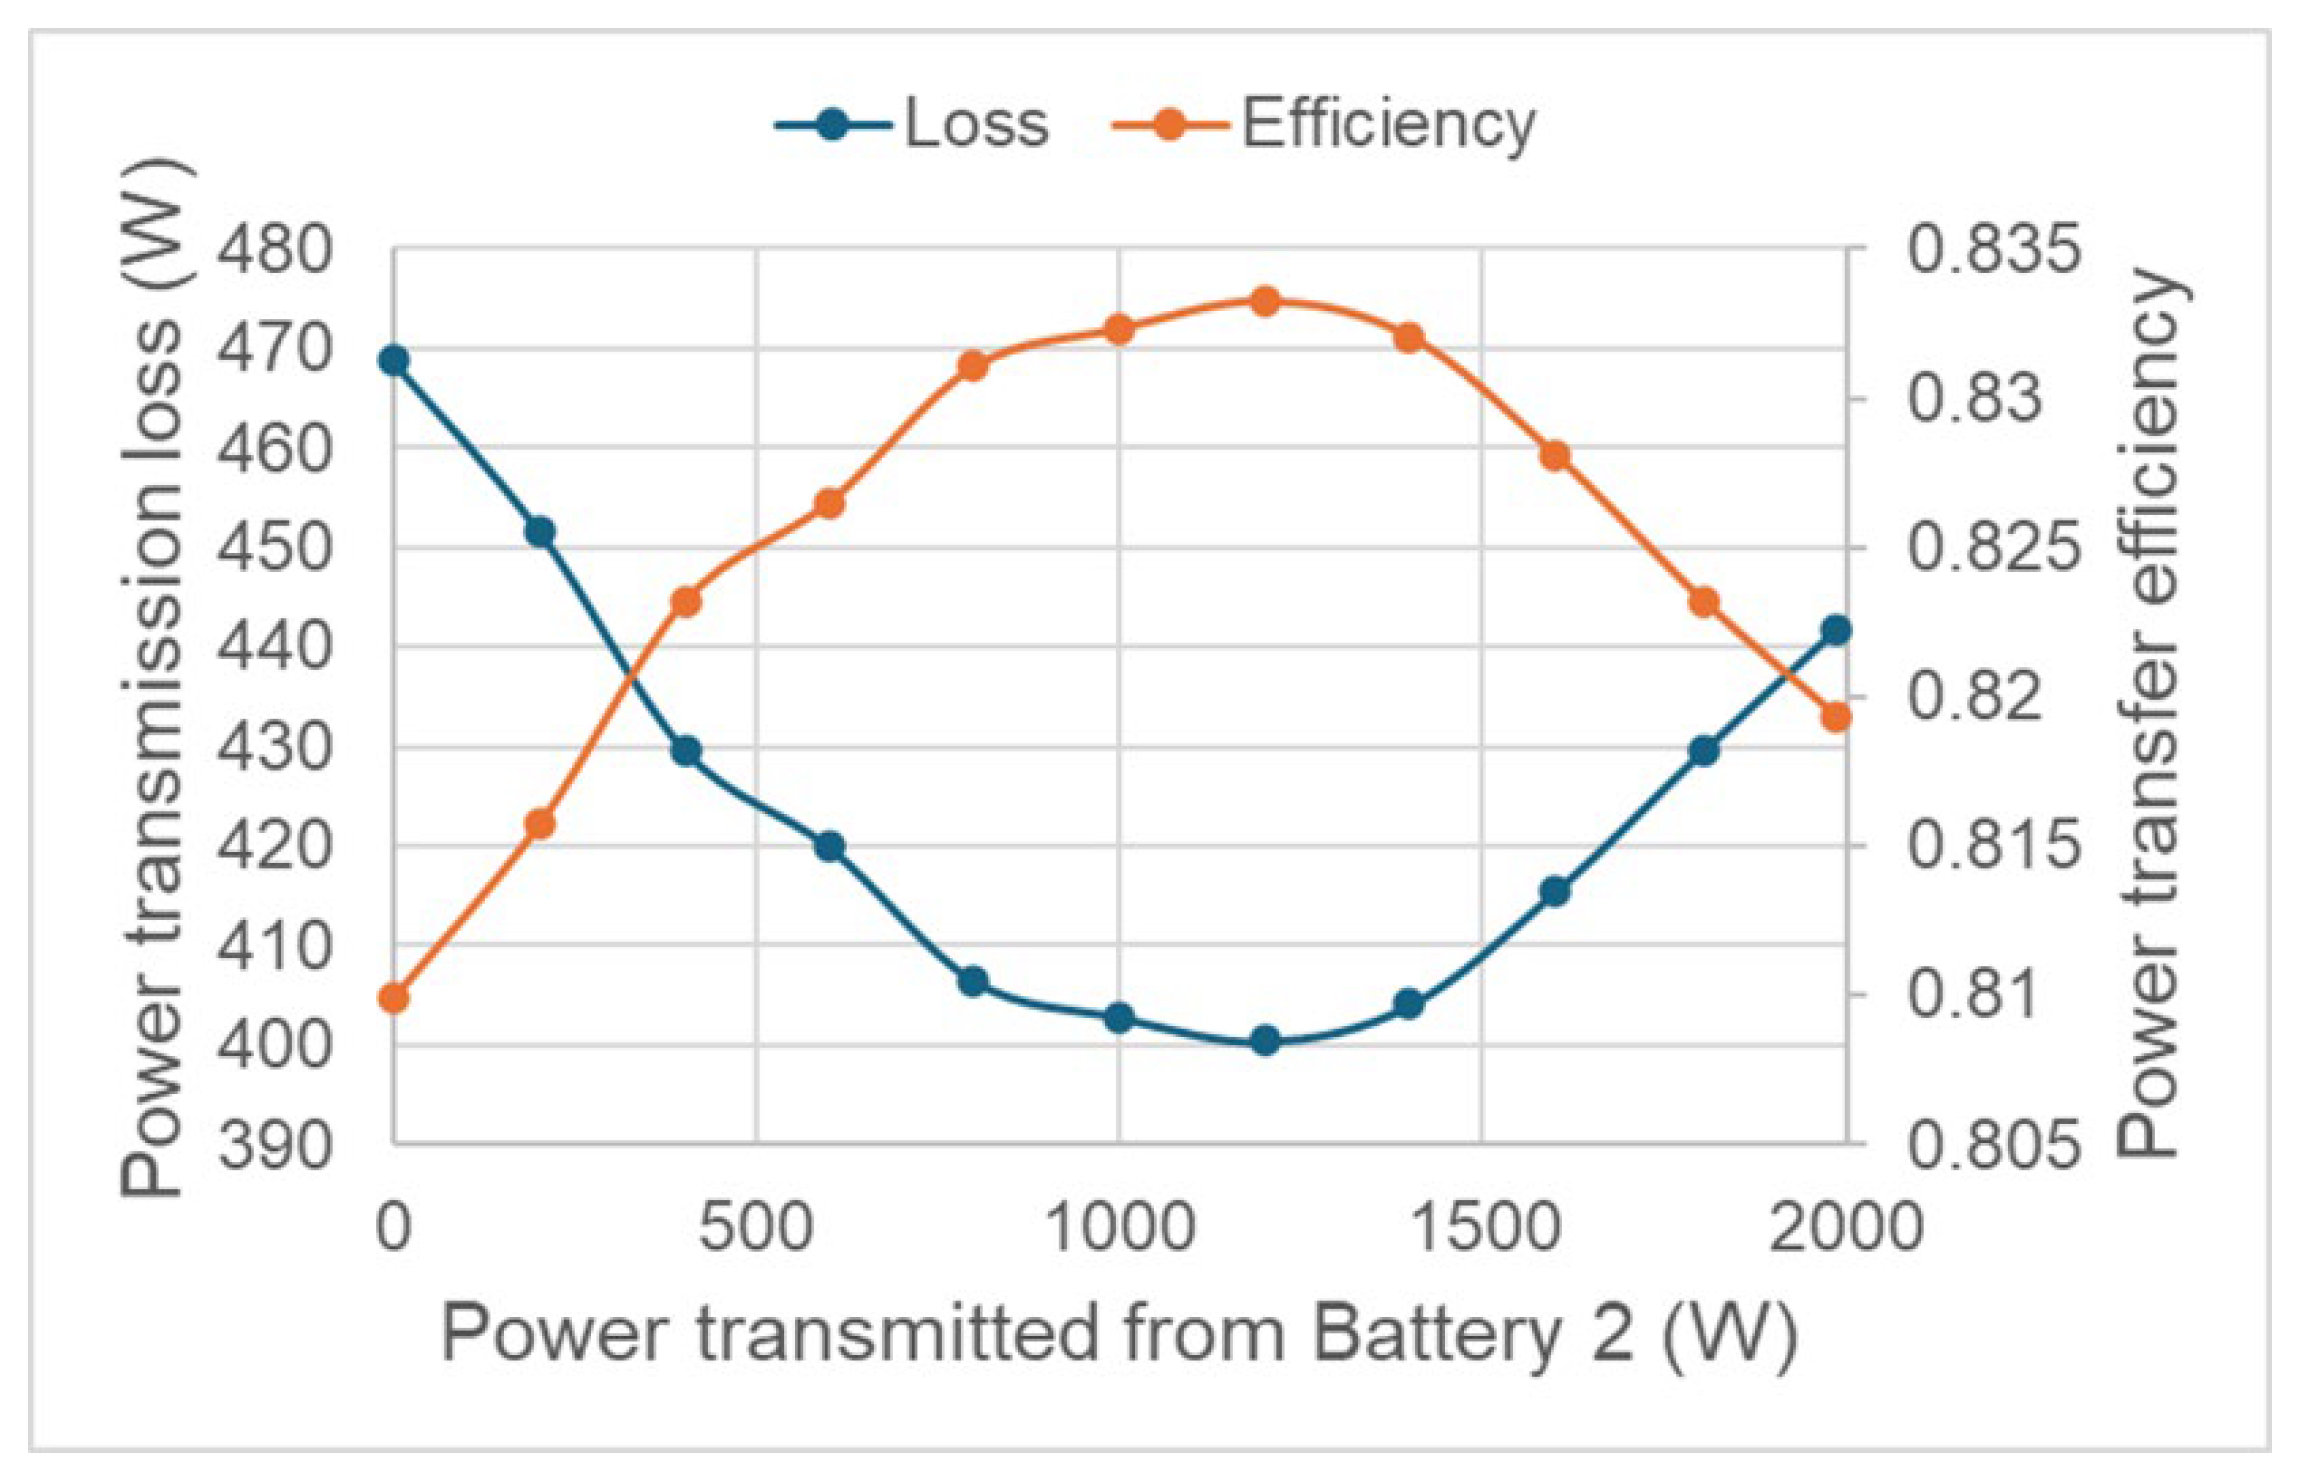
Figure 20.
Setup for transitioning from 2-to-1 to 2-to-2 power exchange.
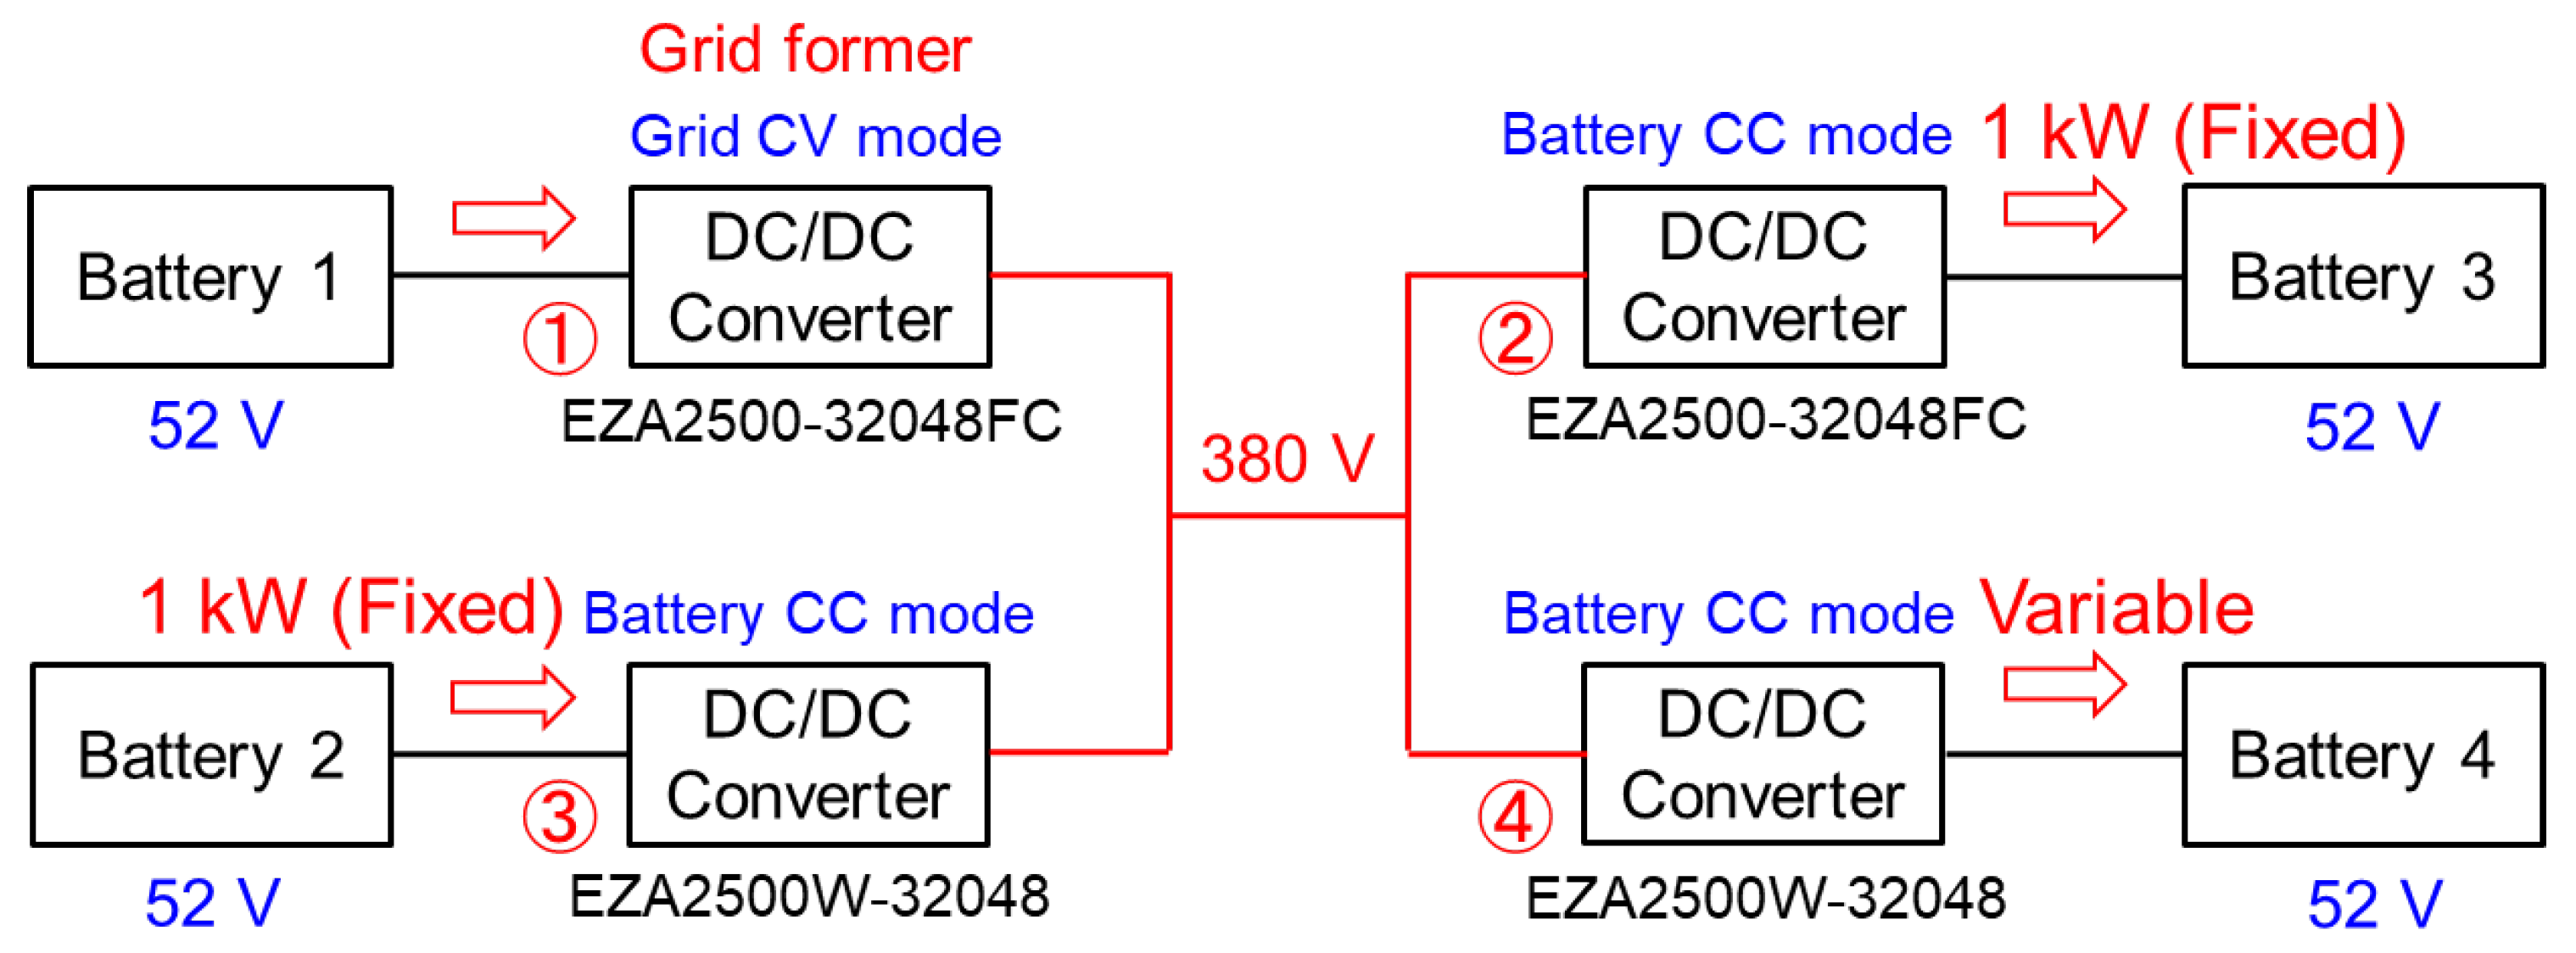
Figure 21.
Measured results during the transition from 2-to-1 to 2-to-2 power exchange.
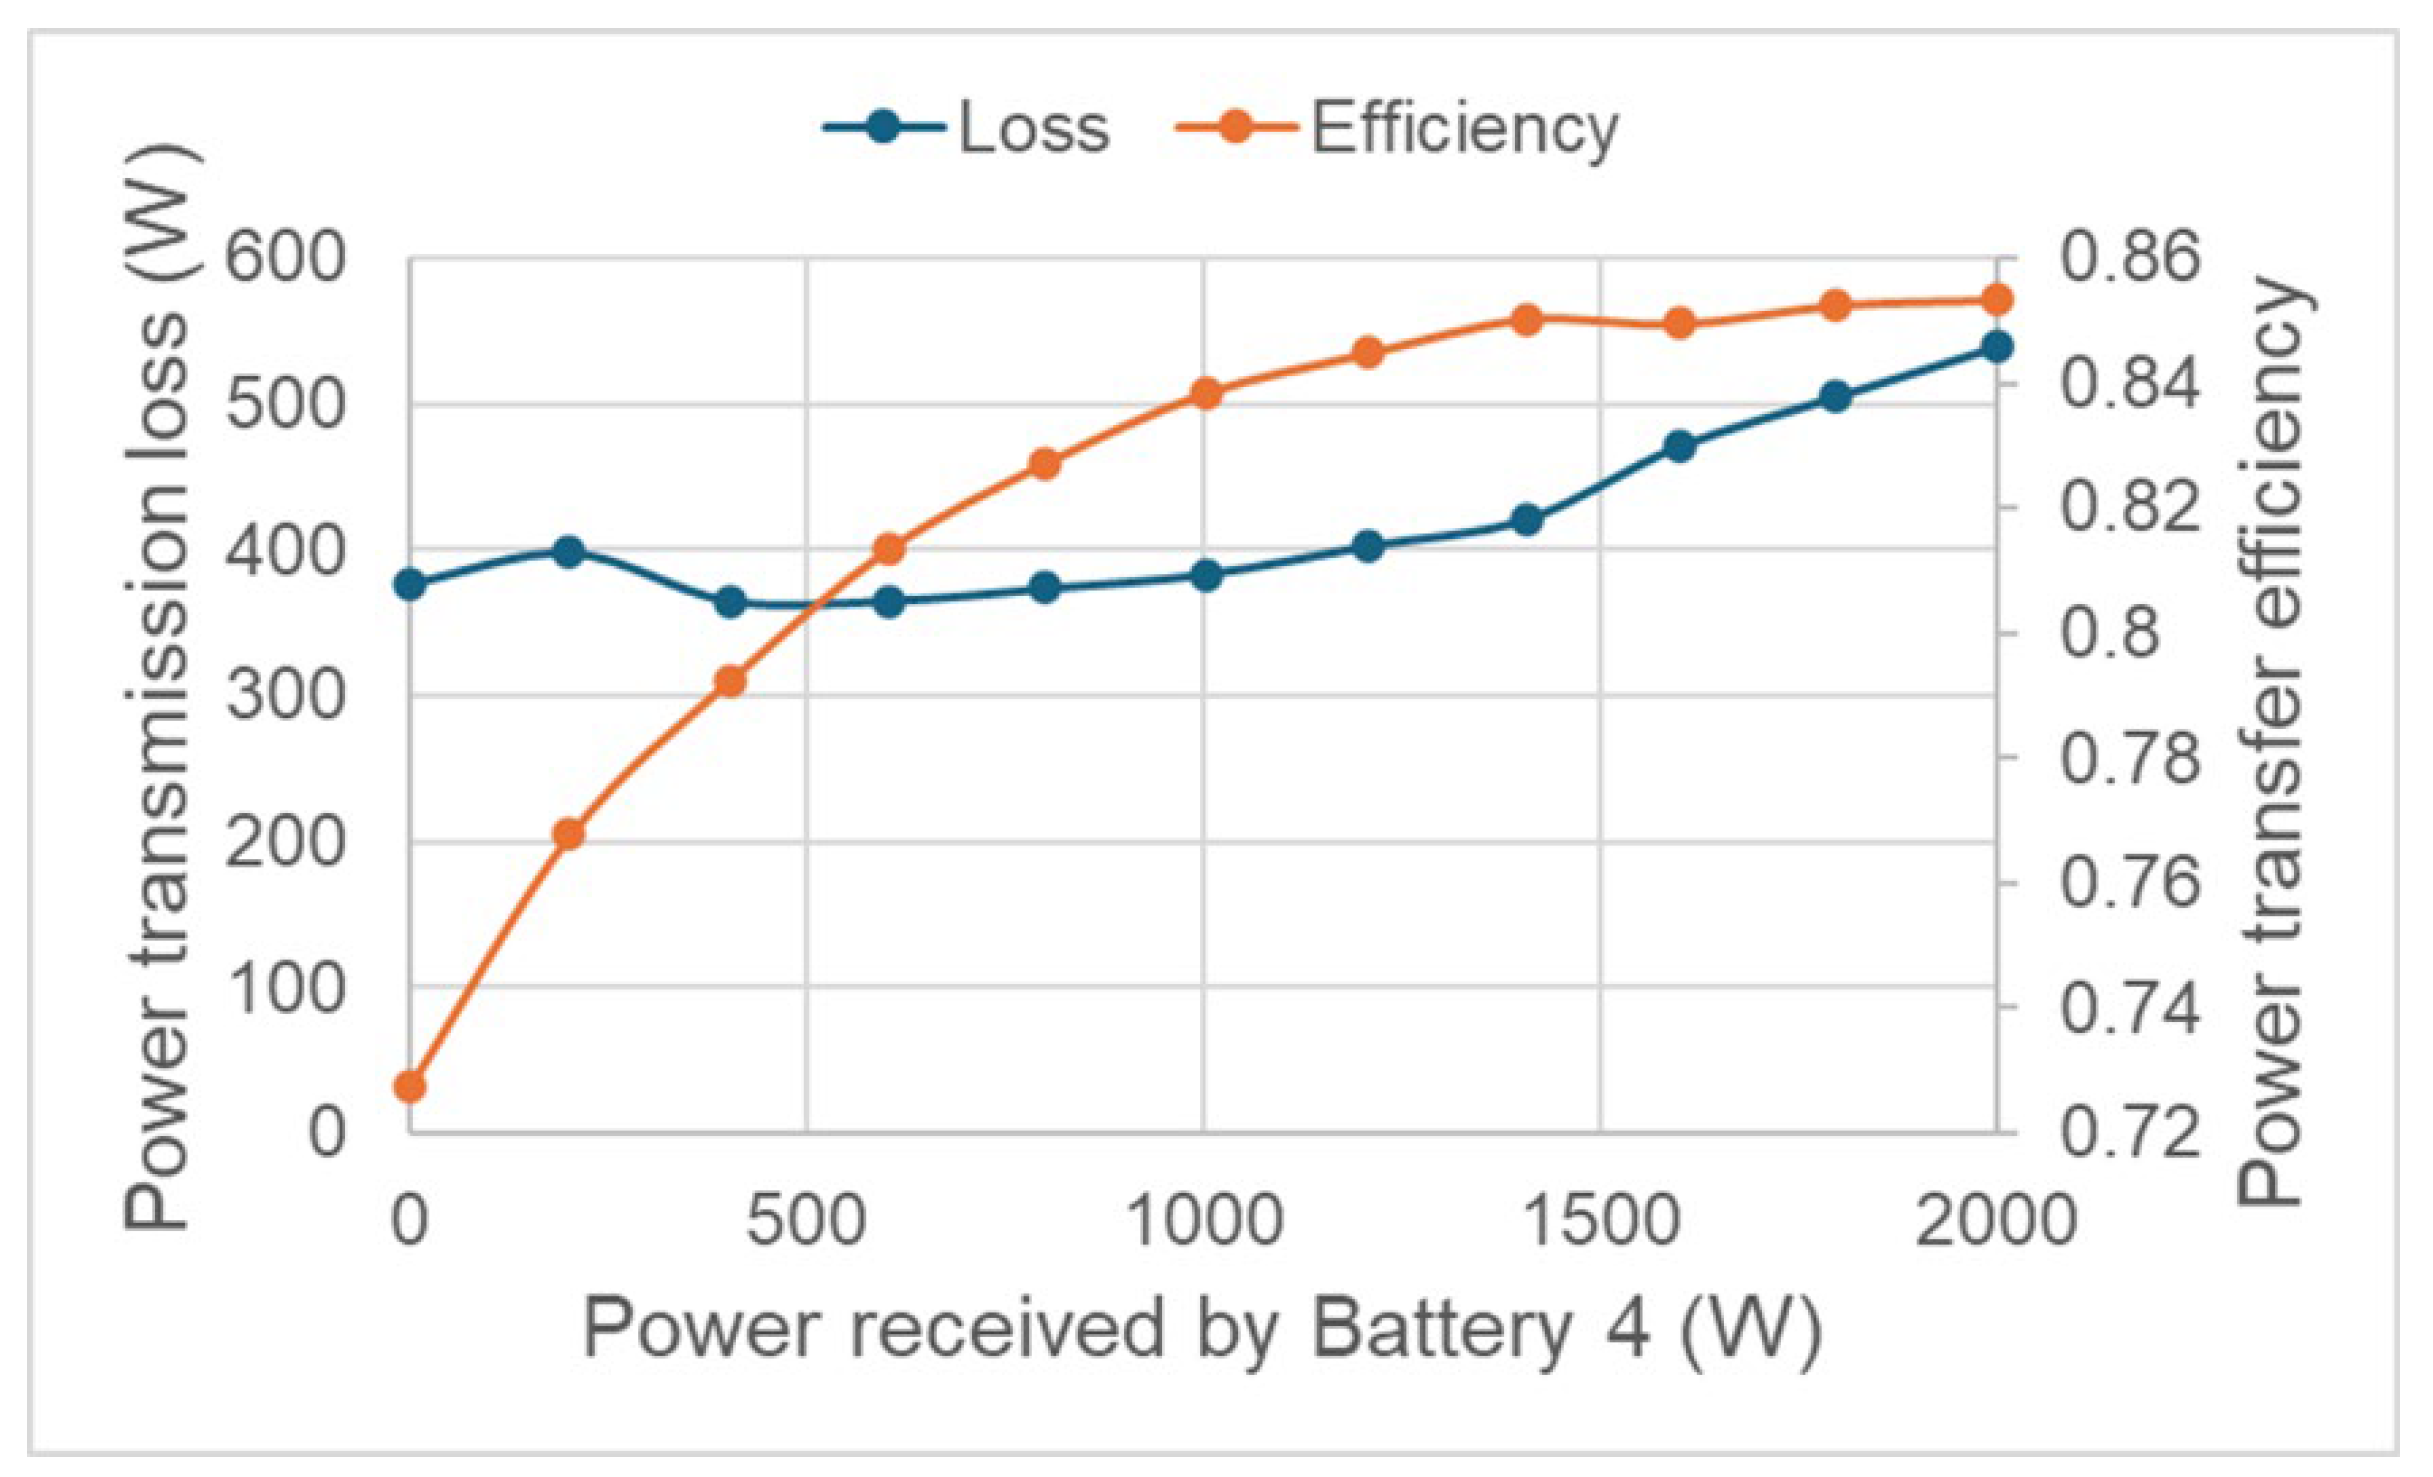
Figure 22.
Setup for transitioning from 2-to-1 to 2-to-2 power exchange.
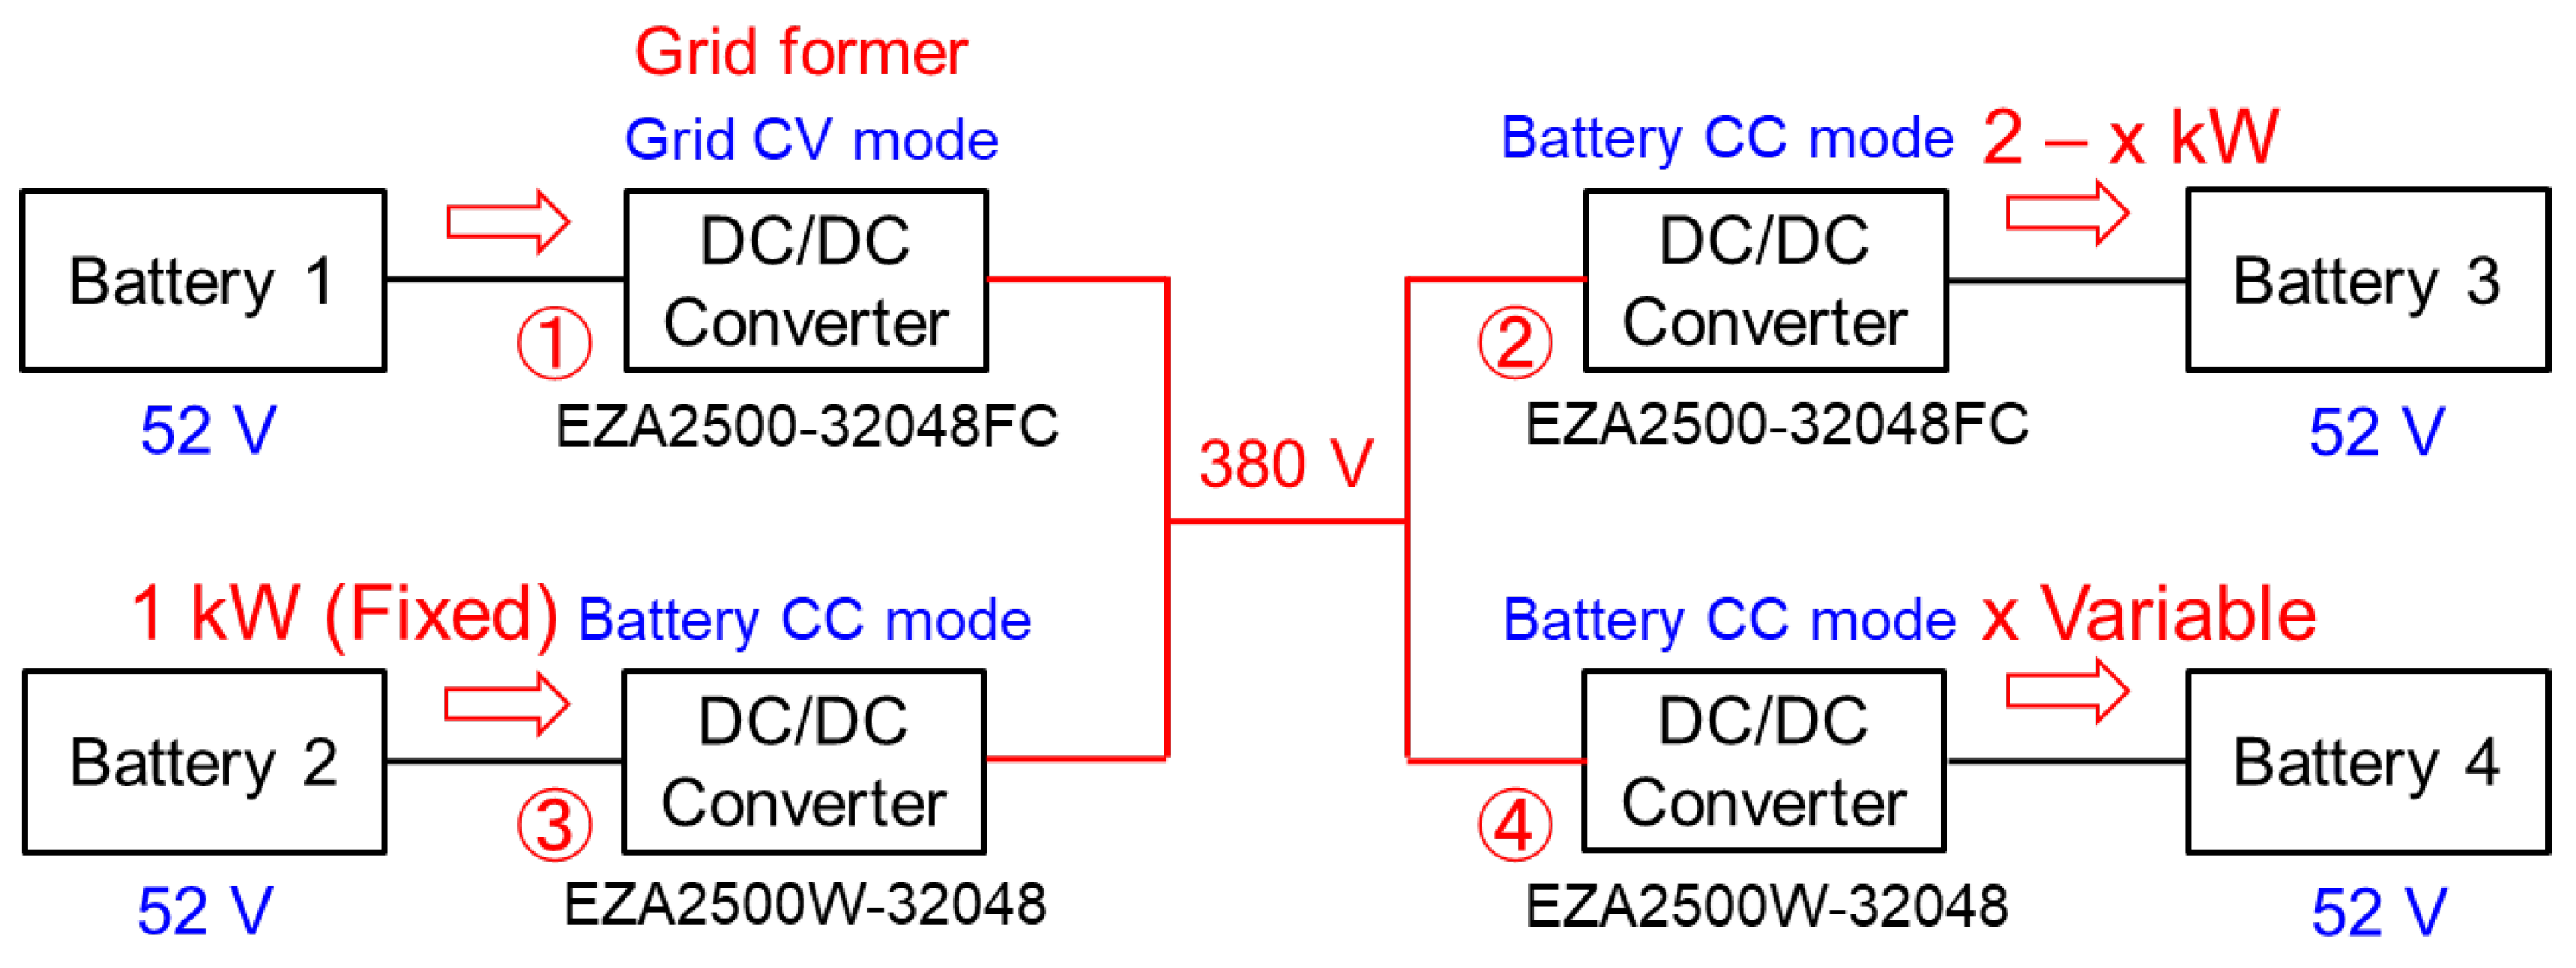
Figure 23.
Measured results during the transition from 2-to-1 to 2-to-2 power exchange.
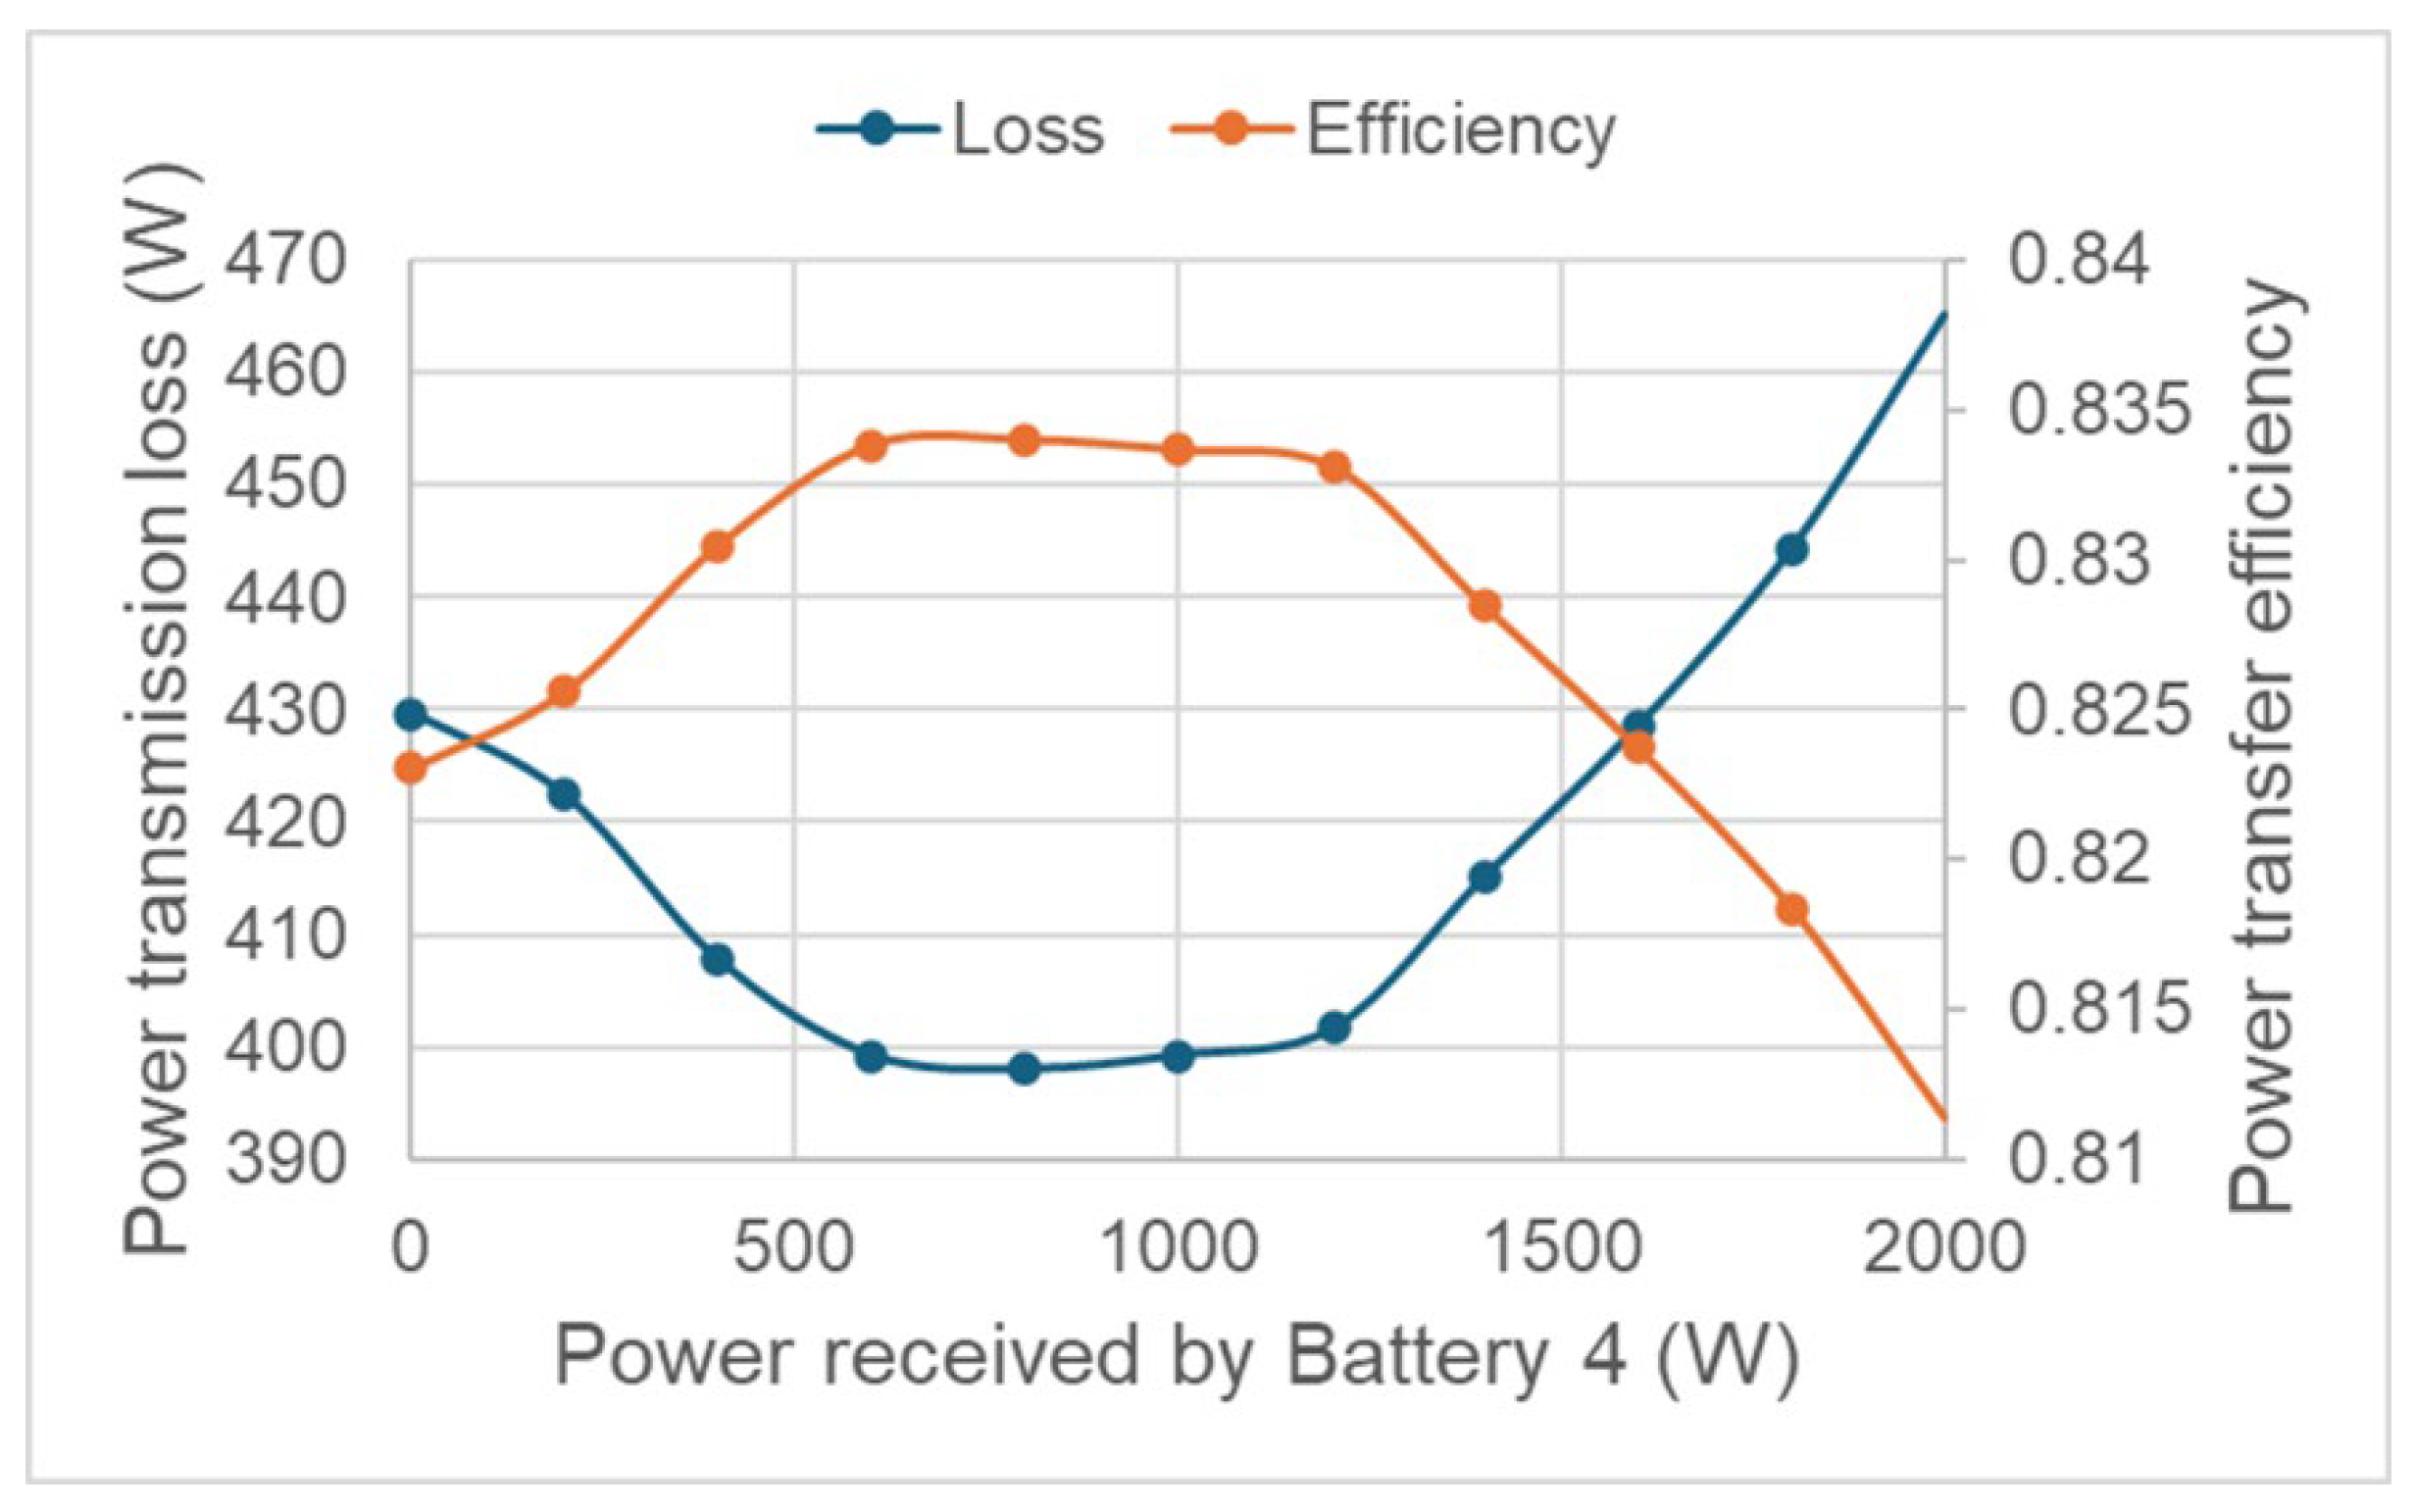
Figure 24.
Experimental setup for simulated peer-to-peer power transmission.
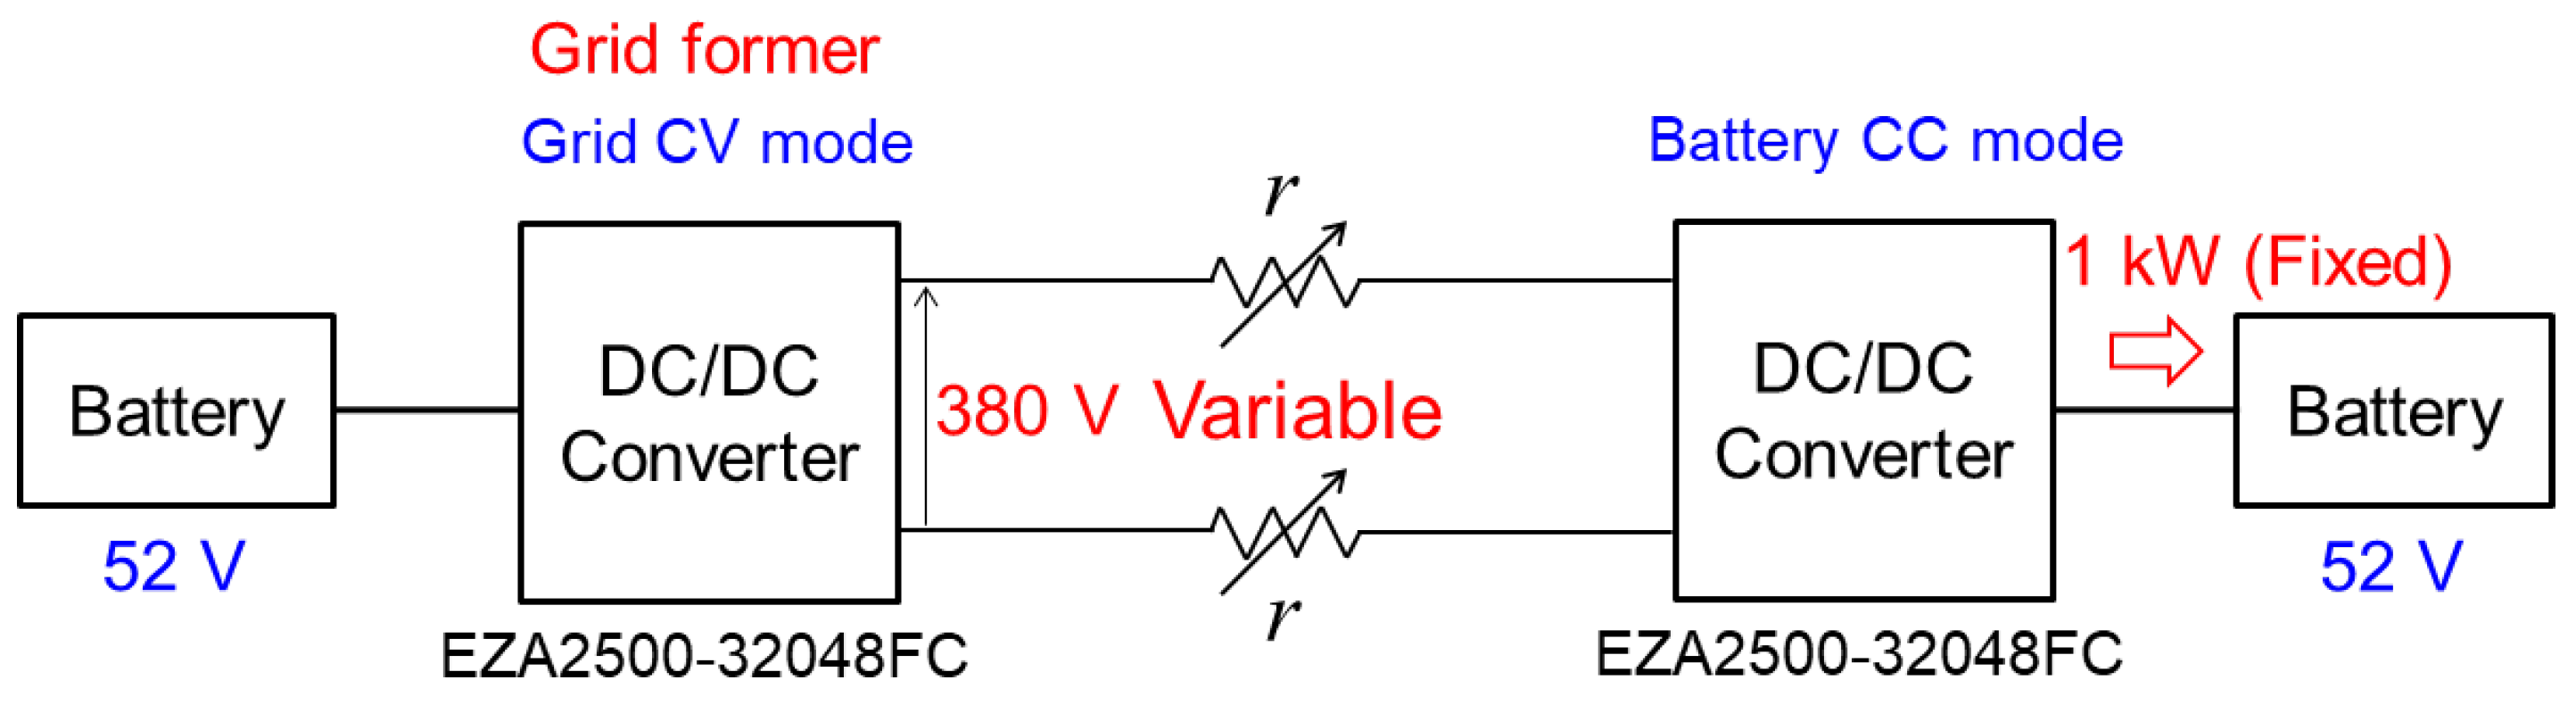
Figure 25.
Results of simulated the peer-to-peer power transmission experiments.
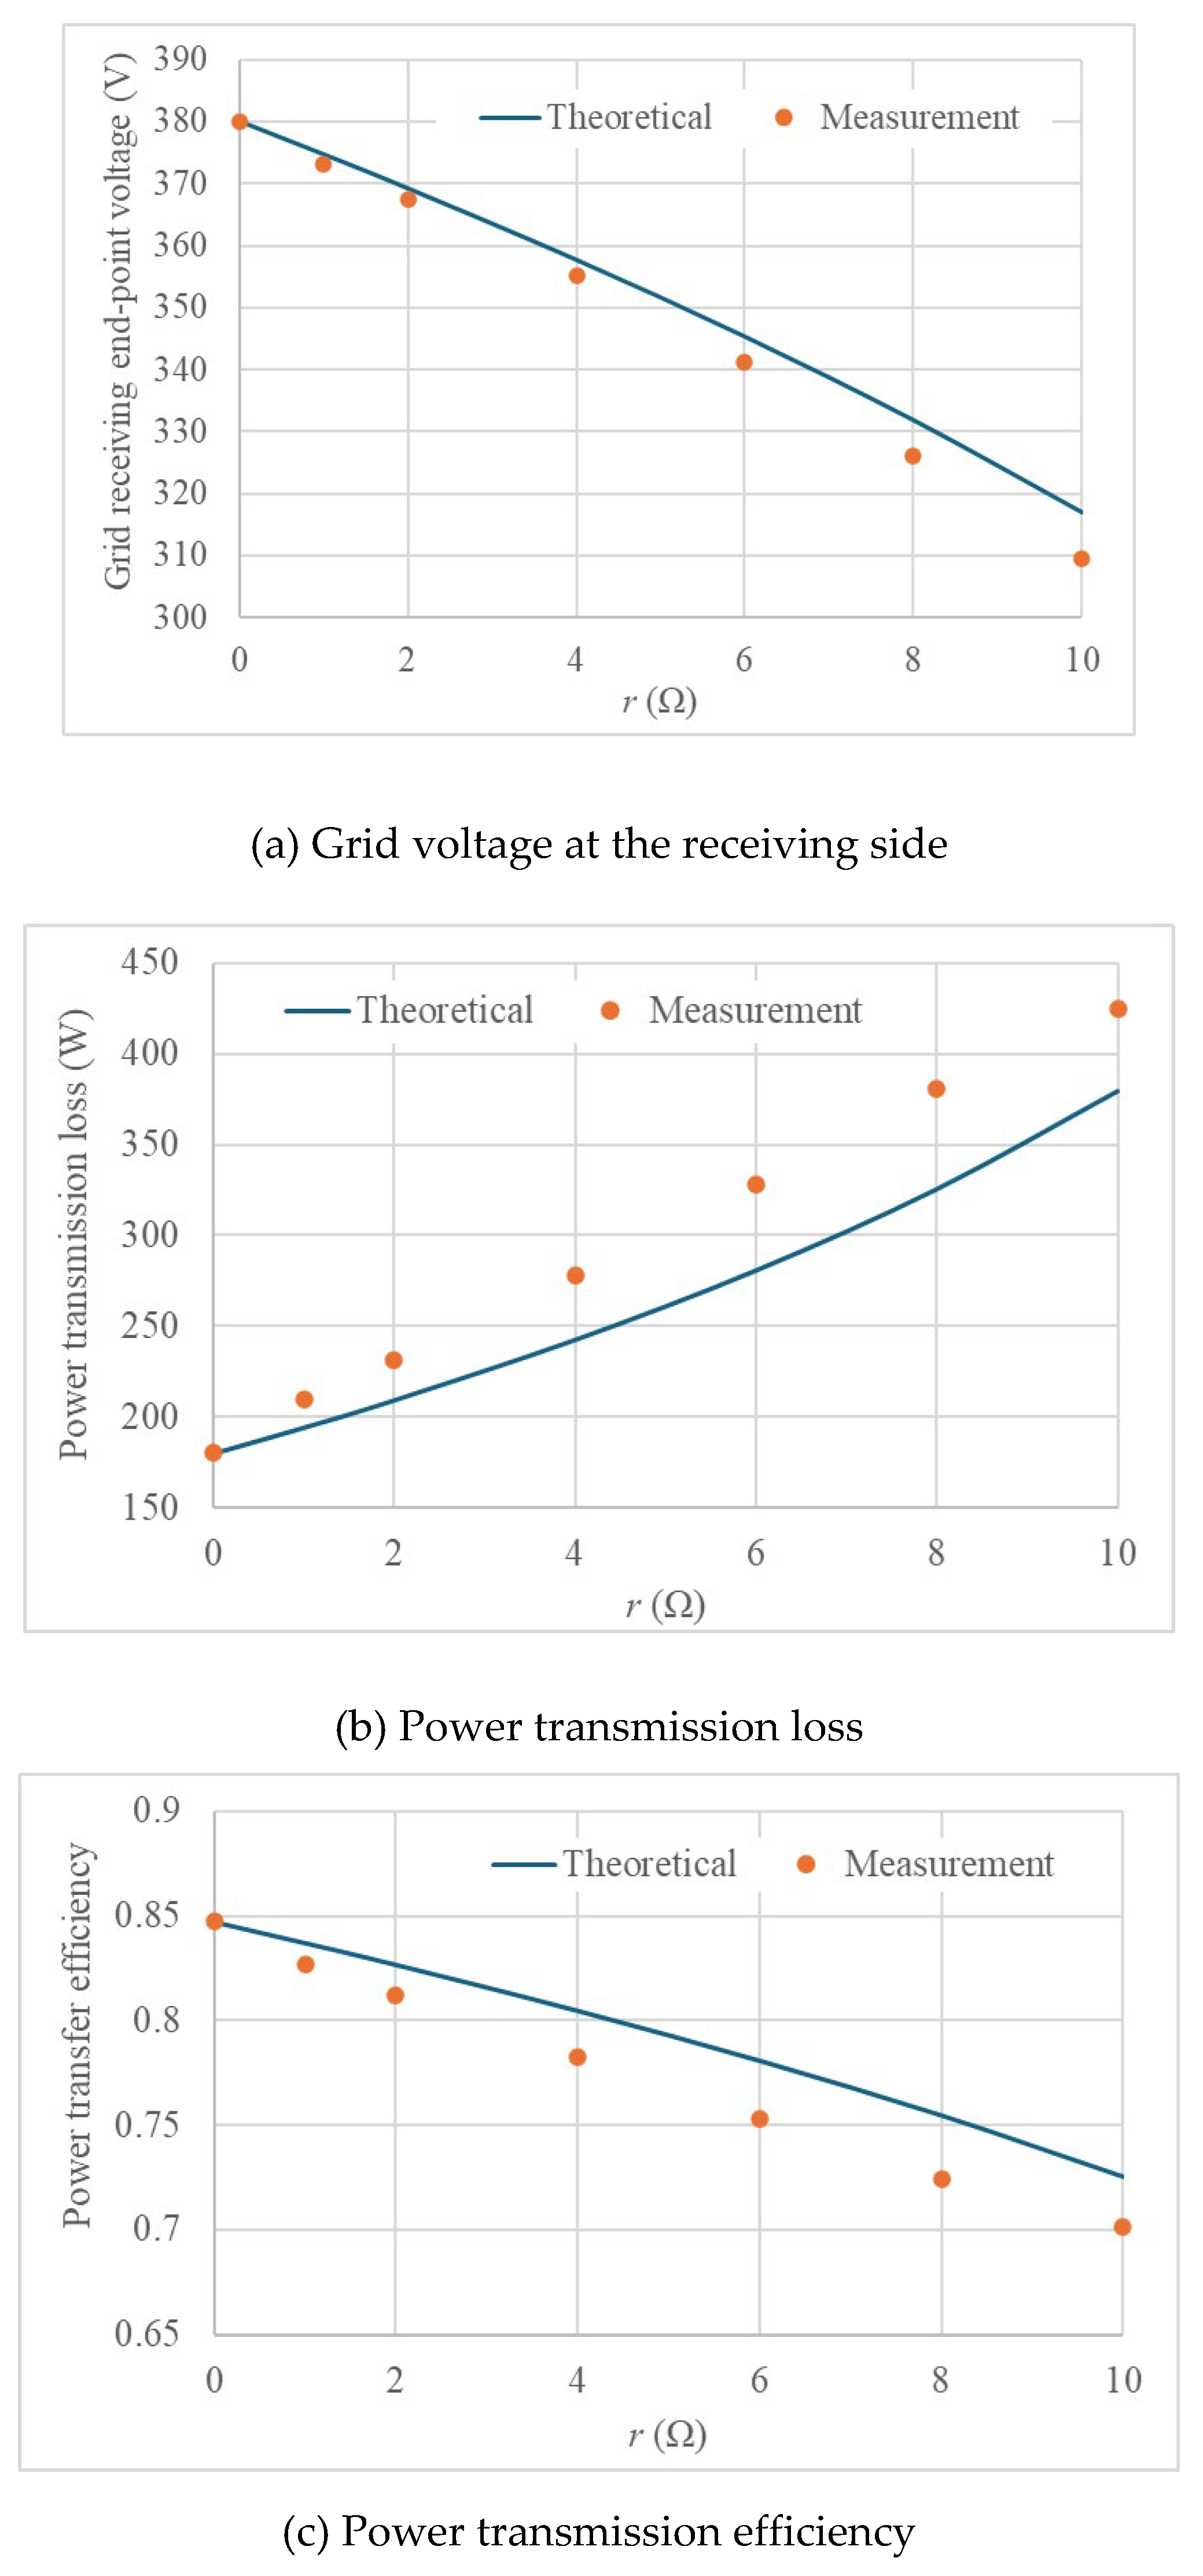
Figure 26.
Test Setup for evaluating operational Stability.
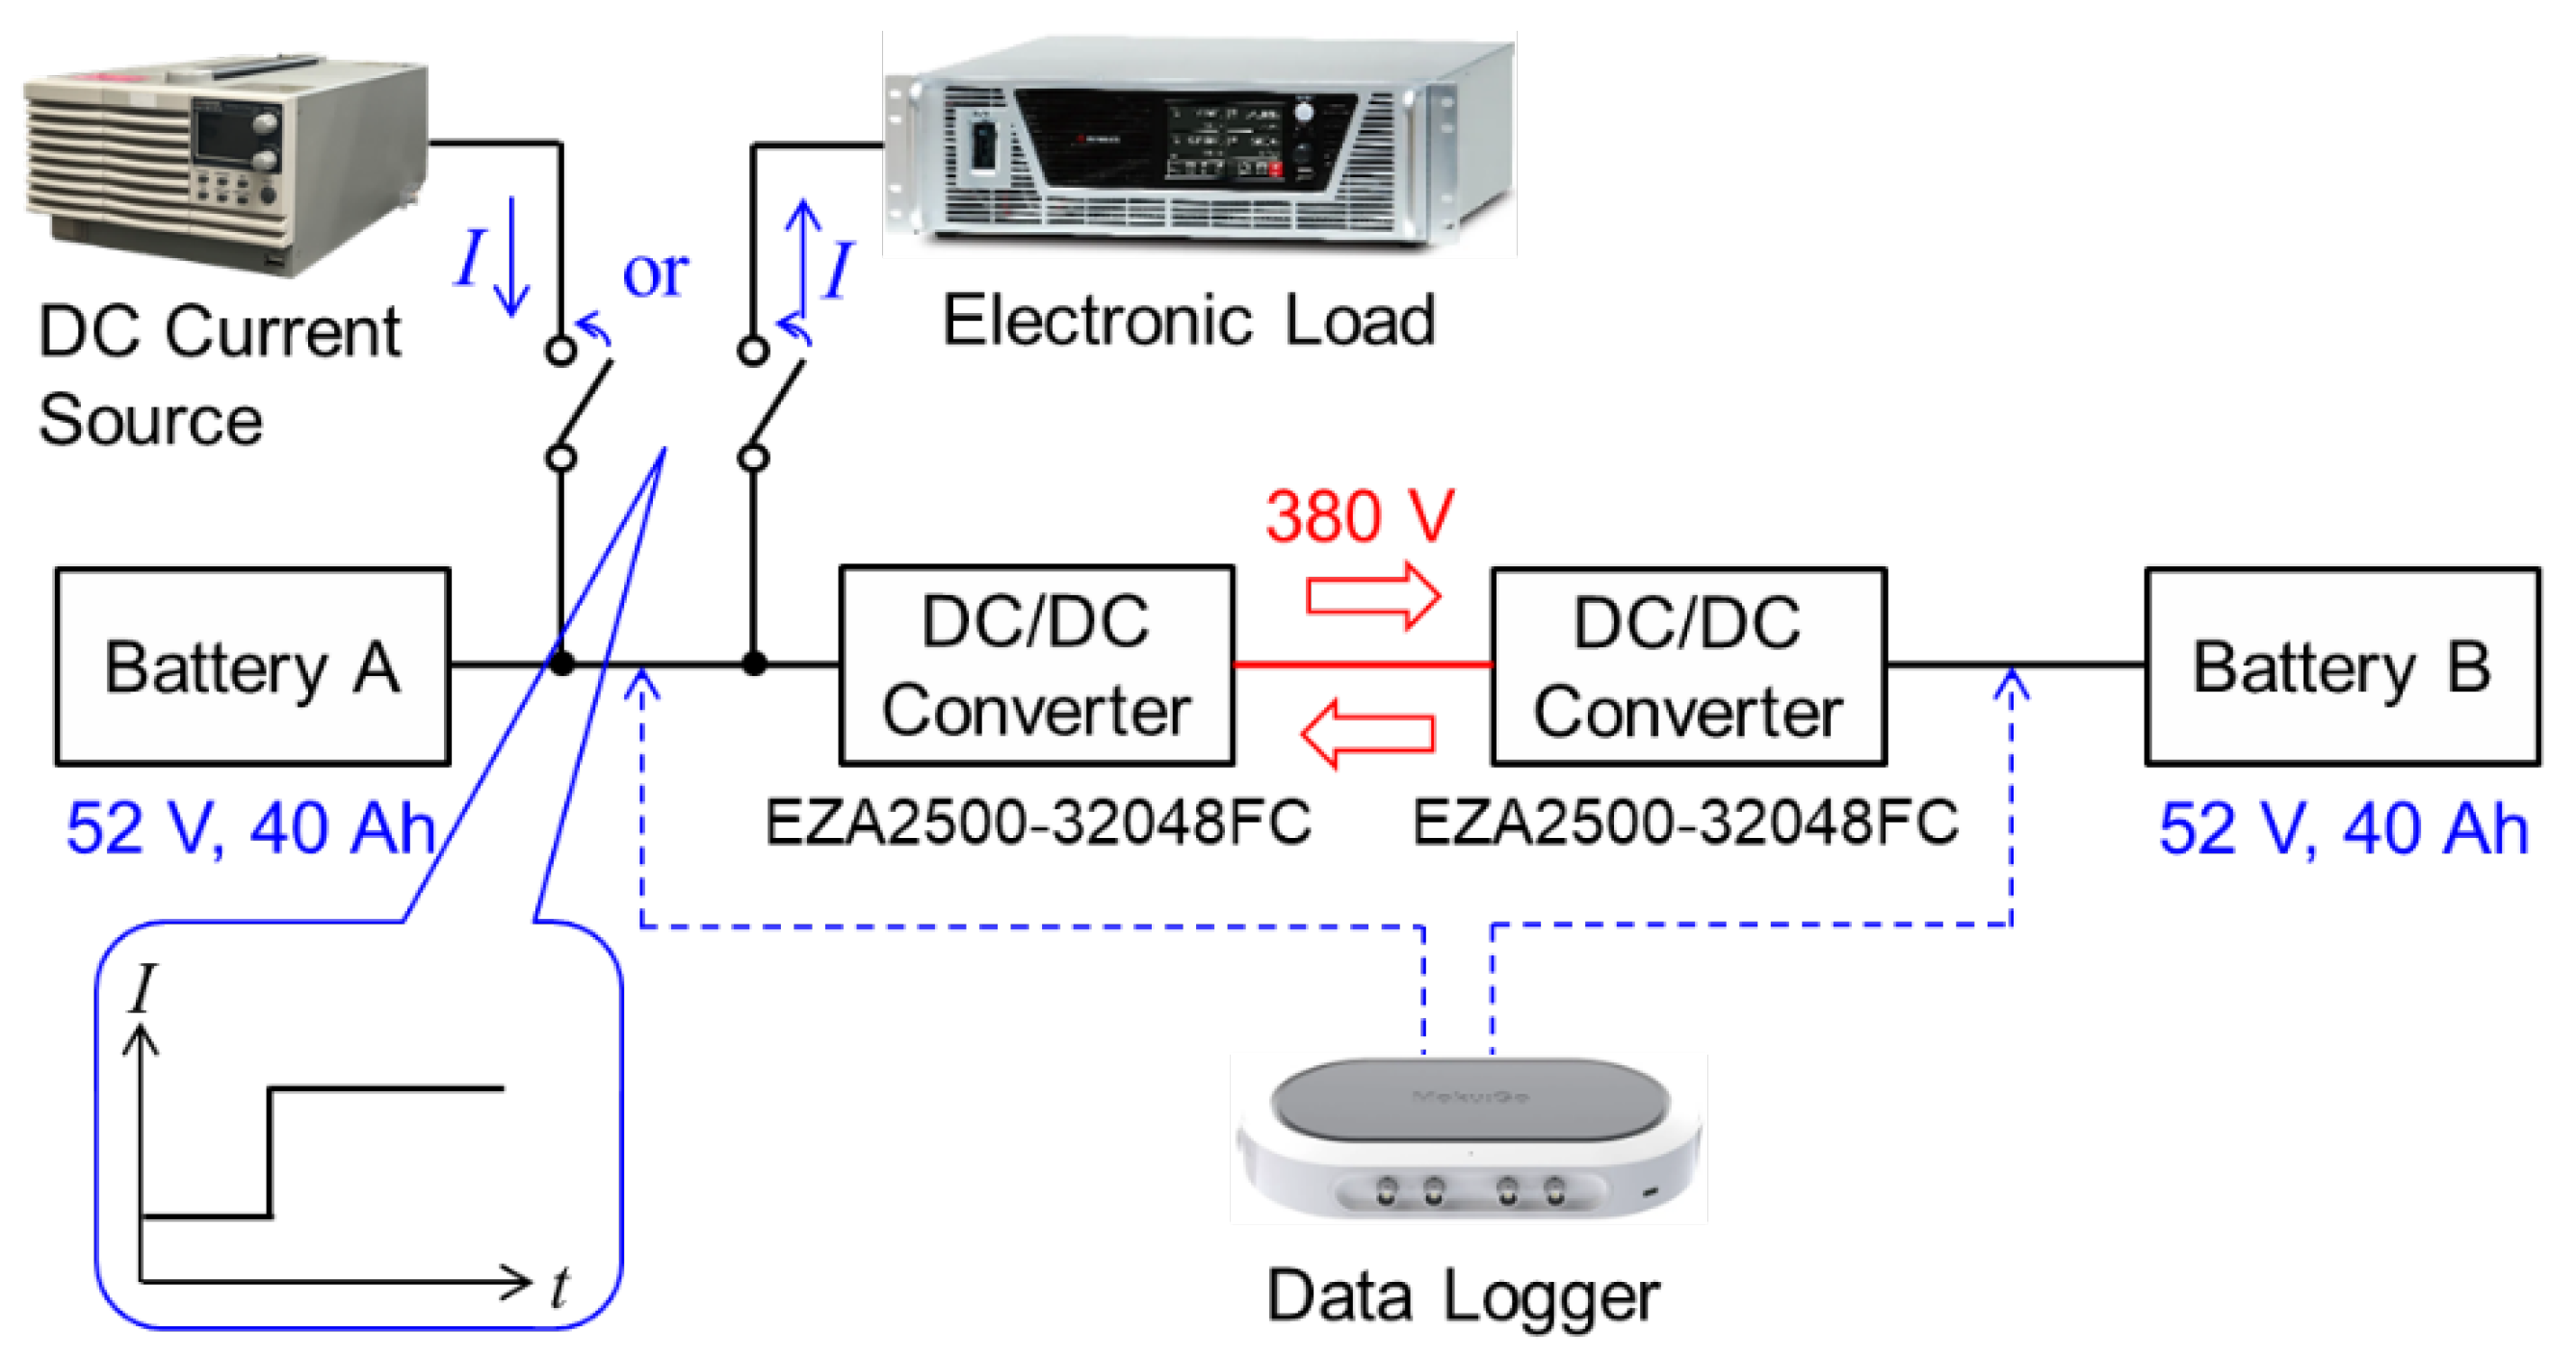
Figure 27.
Terminal voltage response of sending-side and receiving-side batteries during peer-to-peer power exchange under disturbance conditions: (a) when a disturbance current of +1 A is injected into the sending-side battery; (b) when a disturbance current of −1 A is drawn from the sending-side battery.
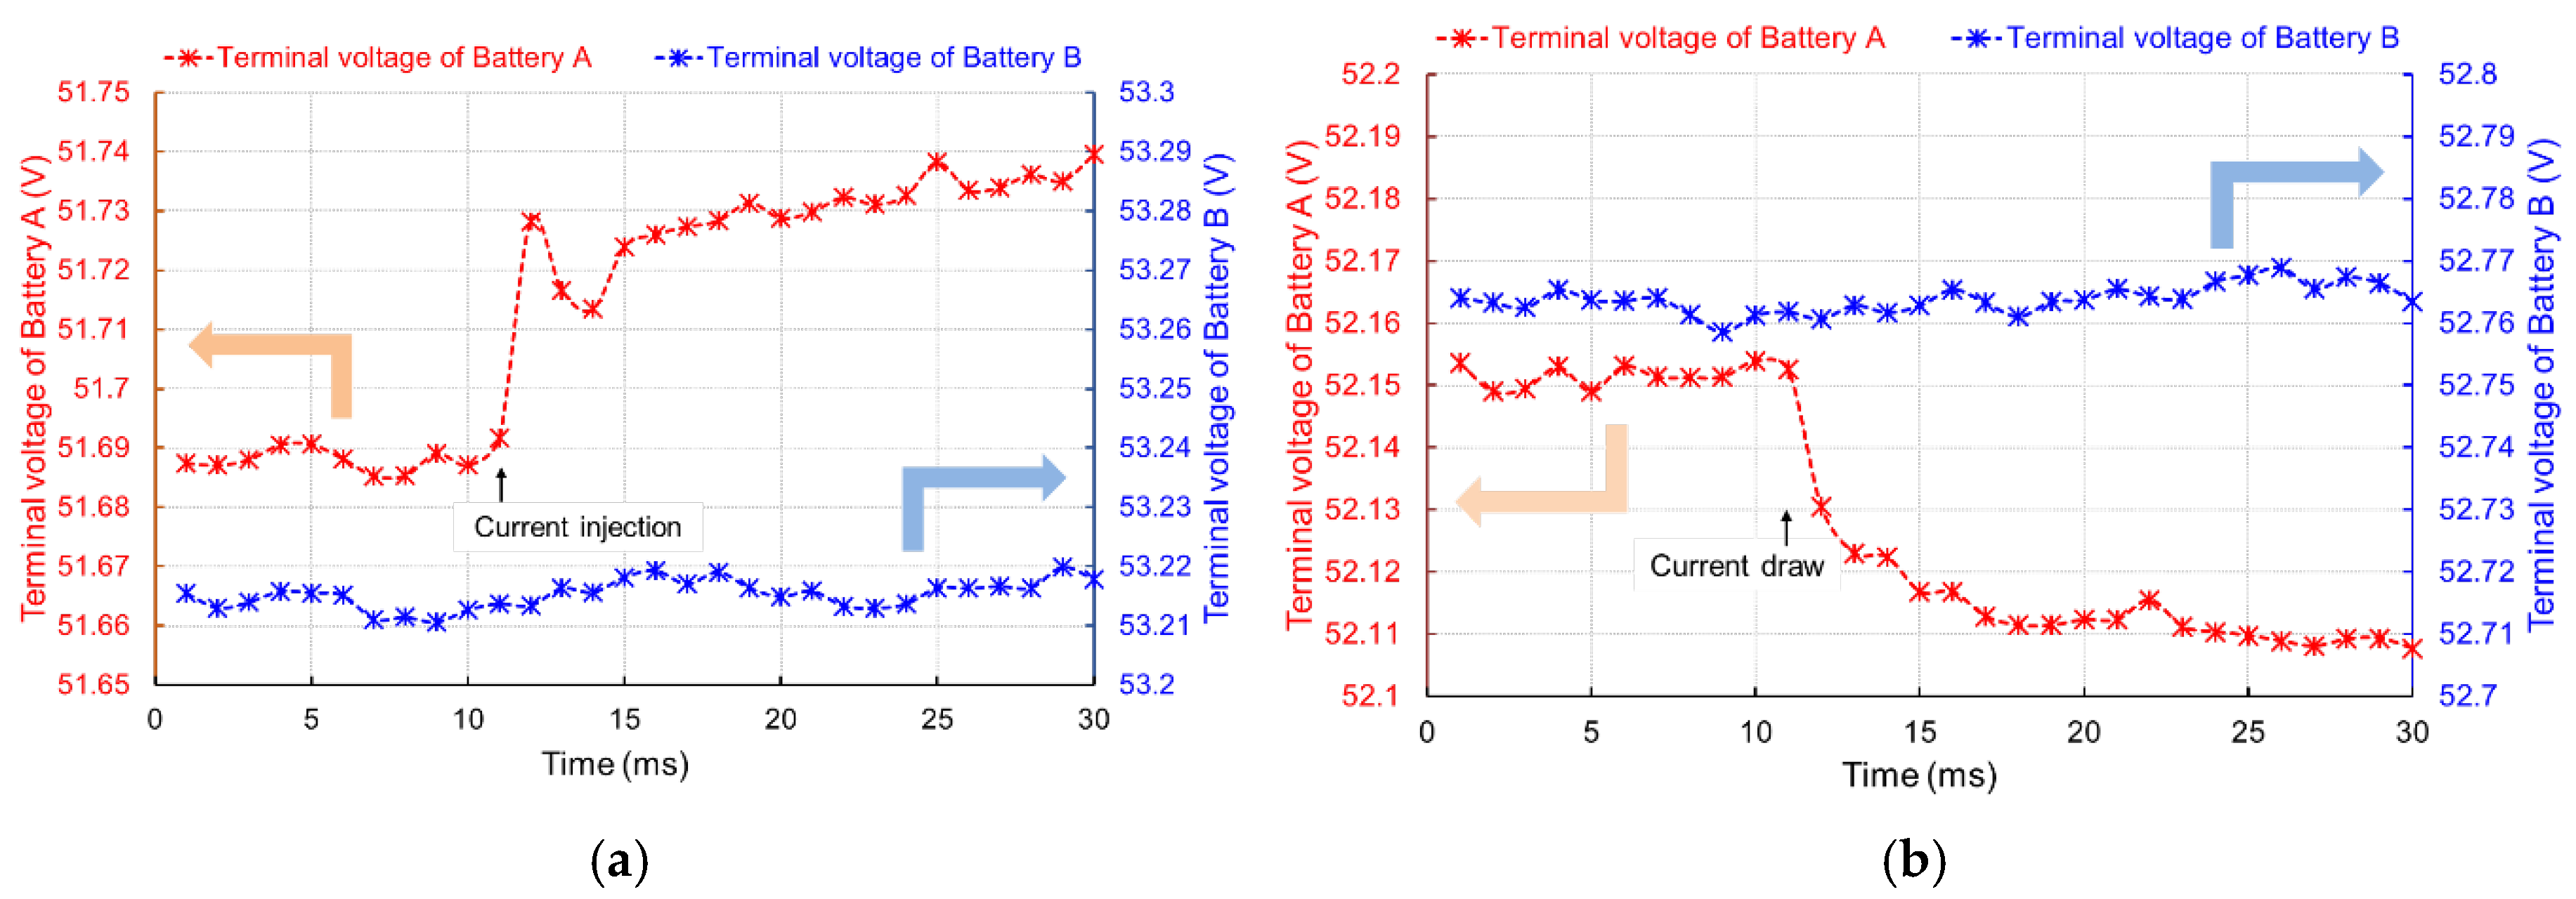
Figure 28.
Voltage fluctuation caused by current injection into Battery A.
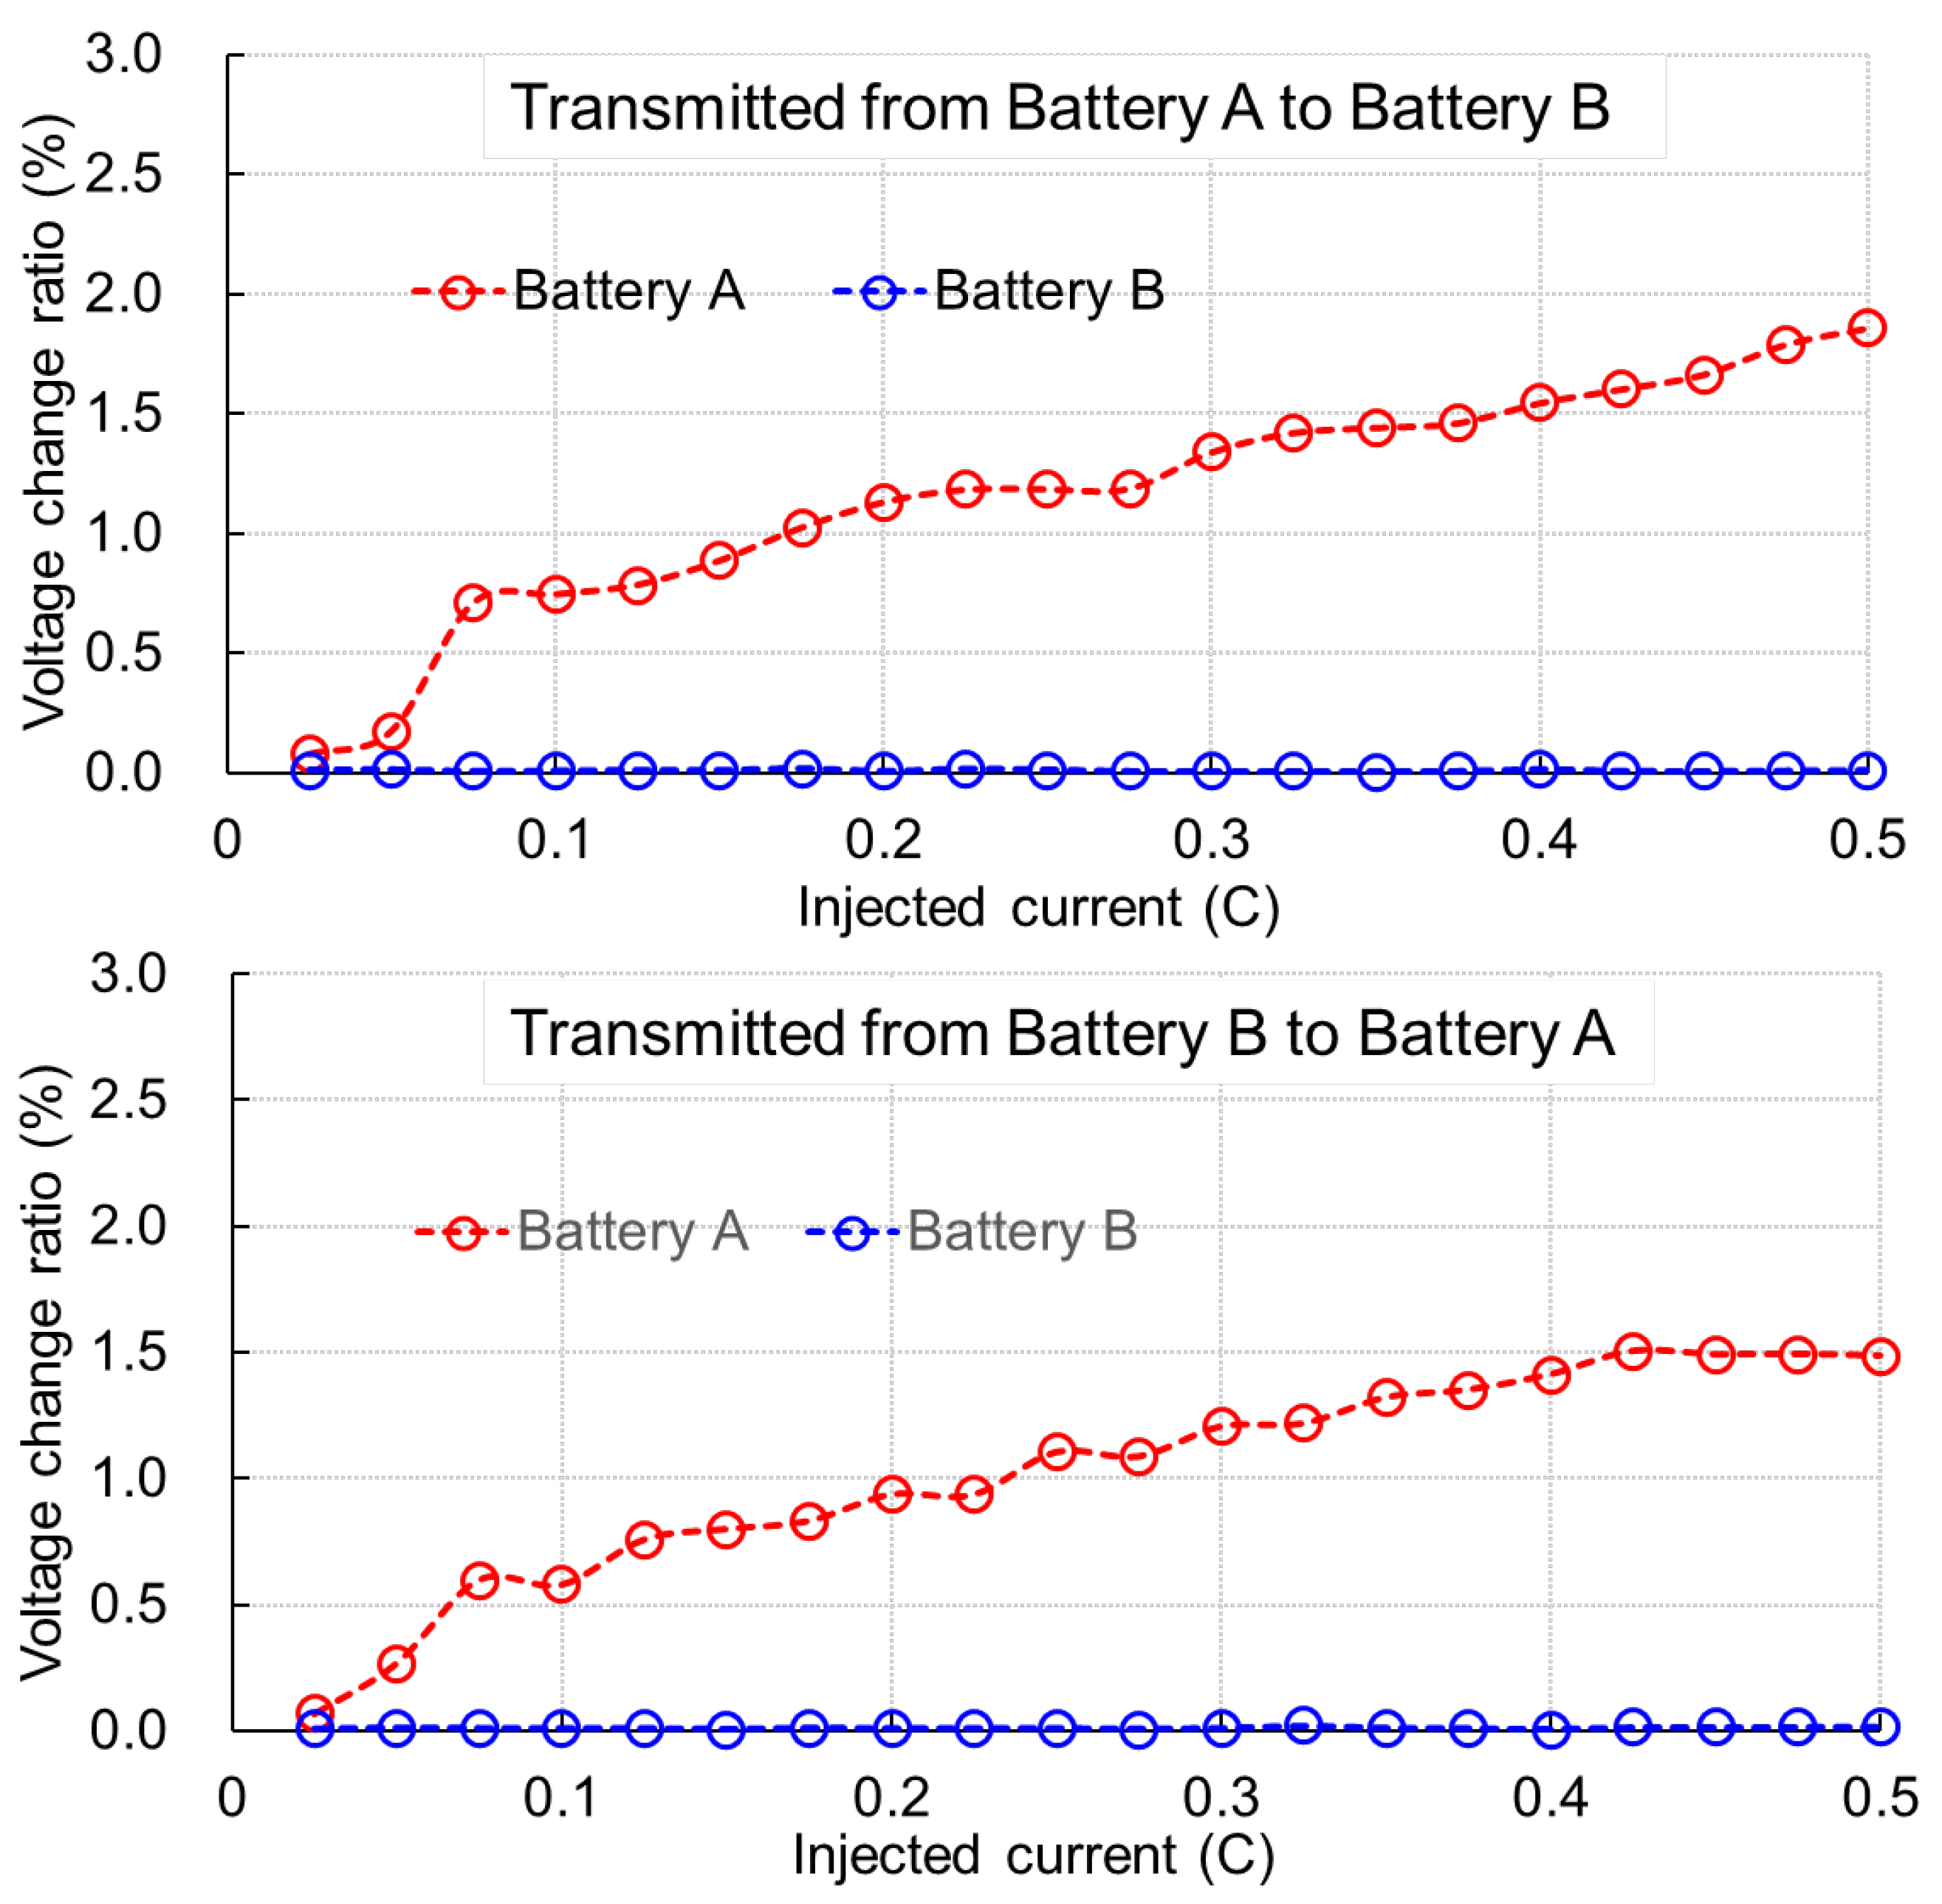
Figure 29.
Voltage fluctuation caused by current draw from Battery A.
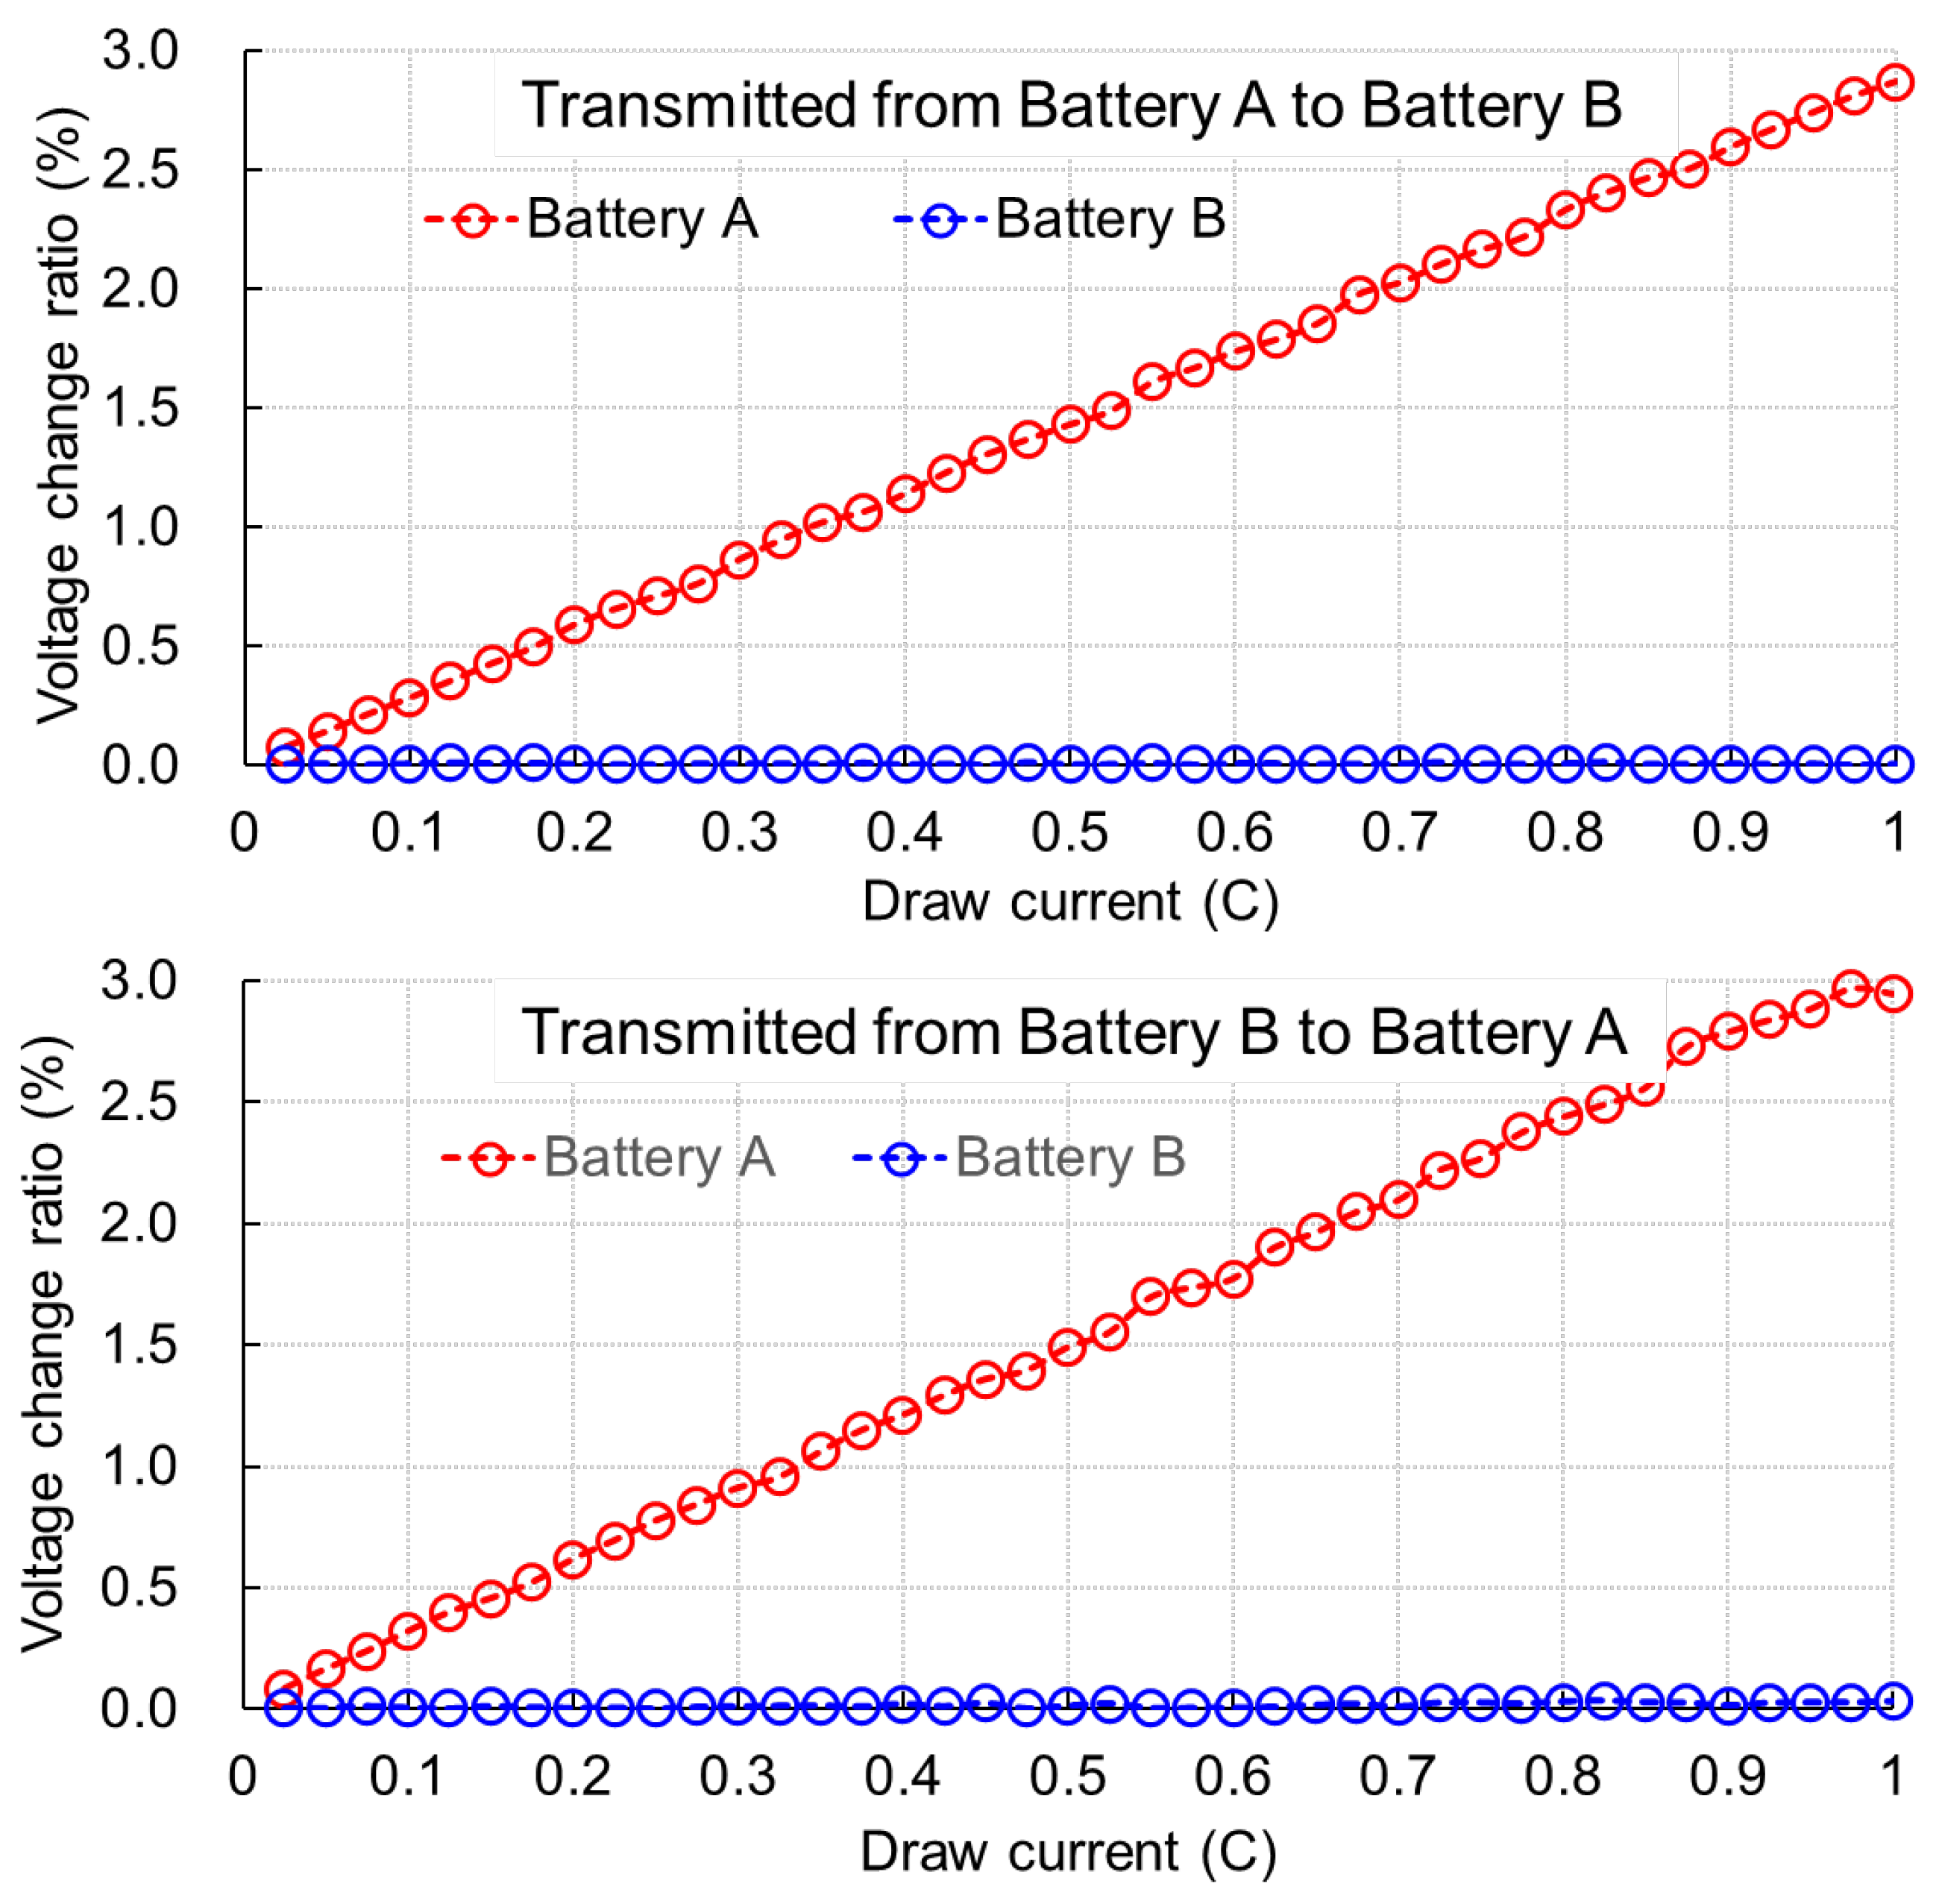
Figure 30.
Power exchange system as a cyber physical system (CPS).
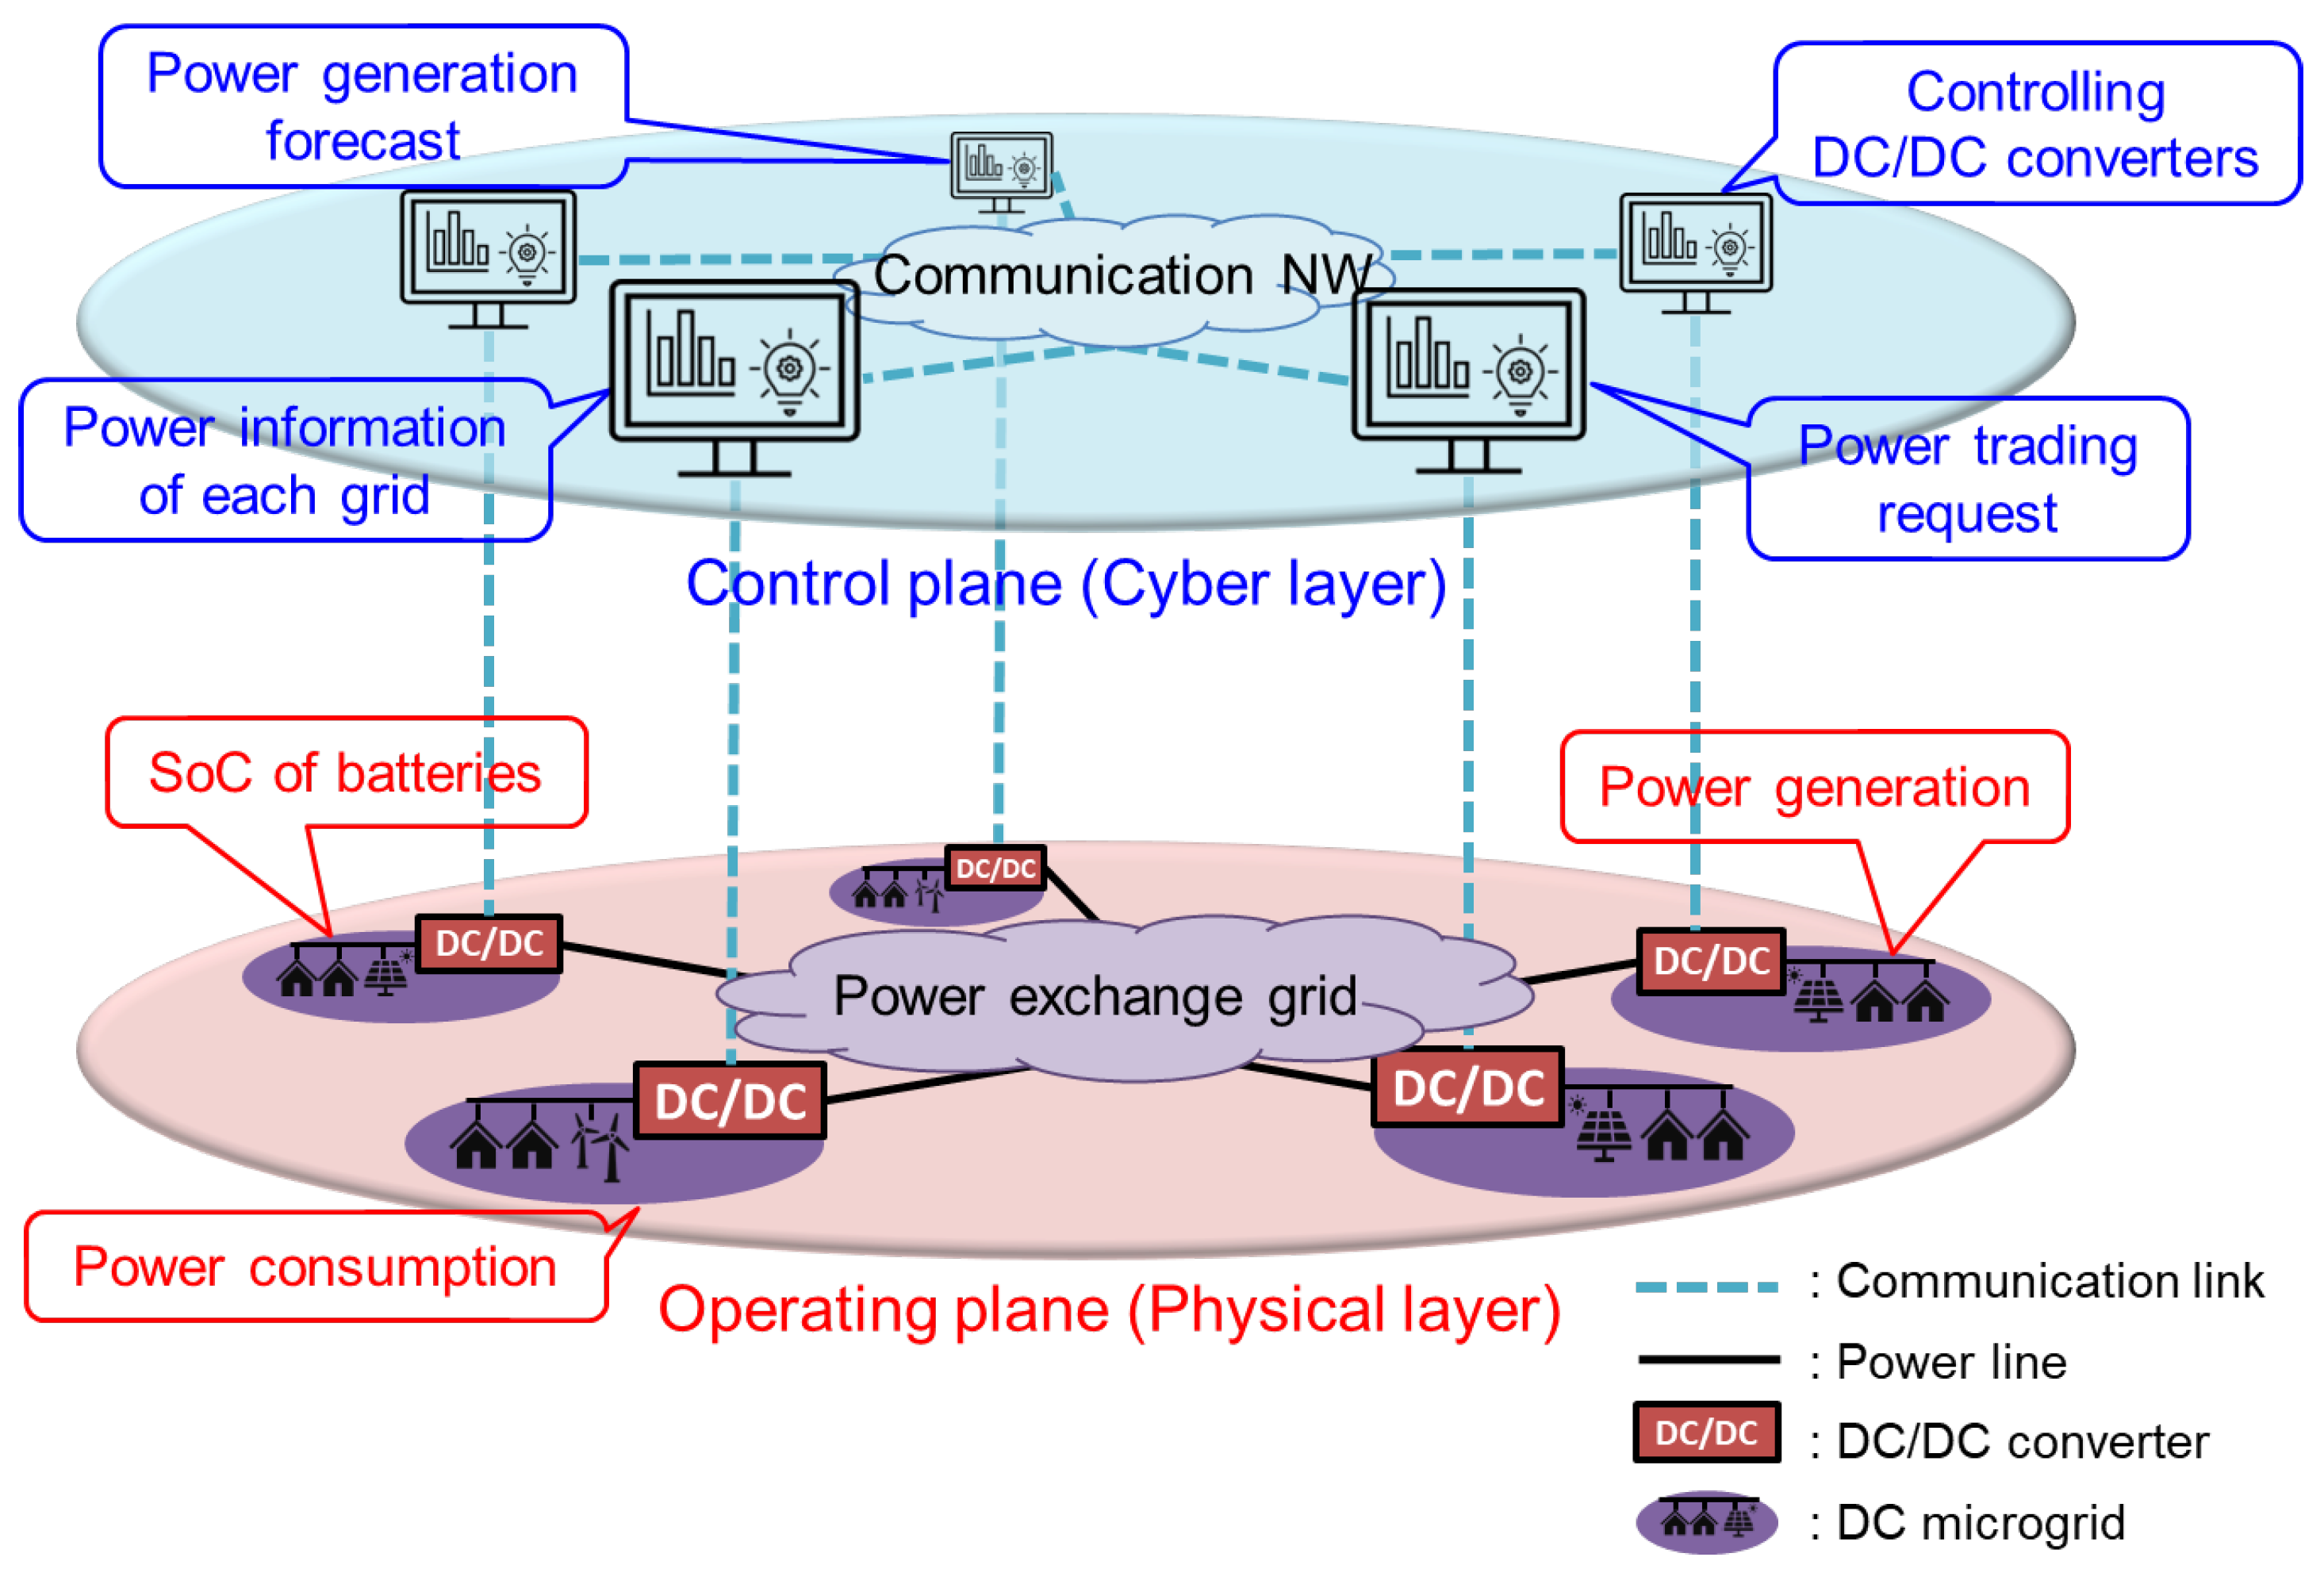

Table 1.
Comparison between AC and DC microgrids.
| Comparison Category | AC Microgrid | DC Microgrid |
|---|---|---|
| Primary Feeder | Alternating current align="left" an extension of the utility grid |
Direct current Constructed separately from the utility grid |
| Operation in Normal Times | Synchronized with the utility grid (may include grid-following devices) | Operates independently by forming its own grid (requires grid-forming equipment) |
| Operation in Emergencies | Decouples from the utility grid and operate independently (requires at least one grid-forming device) | Operates independently by forming its own grid (multiple grid-forming devices enhance resilience) |
| Use of Household Appliances | AC appliances can be used by simply converting voltage via transformers; however, most modern appliances internally convert AC to DC. | DC appliances can be operated merely by converting voltage using DC/DC converters. AC appliances require DC/AC inverters. |
Table 2.
Specifications of the DC/DC converters used in the experiment [31].
Table 2.
Specifications of the DC/DC converters used in the experiment [31].
| TDK-Lambda | EZA2500-32048FC | EZA2500W-32048 |
|---|---|---|
| LV Side Voltage Range | 36 to 60 V | 36 to 65 V |
| HV Side Voltage Range | 300 to 380 V | 260 to 400 V |
| Maximum Output Power | 2,496 W | 2,496 W |
| Maximum Efficiency | 94% Typ | 90.5% Typ |
| Standby power | ||
| Waiting (HV=380 V) | 7.75 W | 6.80 W |
| Generation mode (LV=48 V, HV=380 V) |
61.1 W | 84.36 W |
| Regeneration mode (LV=48 V, HV=380 V) |
95.04 W | No Data |
Table 3.
Power transmission losses measured by 1-to-2 power transfer experiment.
| Power being received by Battery 4 (W) | ||||||||||||
|---|---|---|---|---|---|---|---|---|---|---|---|---|
| 0 | 200 | 400 | 600 | 800 | 1000 | 1200 | 1400 | 1600 | 1800 | 2000 | ||
| Power being received by Battery 3 (W) | 0 | 290.5 | 282.0 | 280.8 | 280.8 | 285.6 | 297.9 | 317.4 | 338.1 | 362.6 | 393.1 | 428.5 |
| 200 | 284.6 | 279.7 | 277.3 | 281.0 | 292.0 | 302.9 | 321.2 | 342.0 | 370.1 | 395.7 | × | |
| 400 | 277.5 | 272.6 | 275.1 | 282.4 | 293.4 | 308 | 328.8 | 353.2 | 381.3 | × | × | |
| 600 | 274.0 | 276.5 | 282.6 | 289.9 | 303.3 | 319.2 | 342.4 | 372.9 | × | × | × | |
| 800 | 279.1 | 286.4 | 291.3 | 299.9 | 310.8 | 331.6 | 357.2 | × | × | × | × | |
| 1000 | 289.1 | 290.3 | 302.5 | 311.0 | 331.8 | 353.8 | × | × | × | × | × | |
| 1200 | 303.9 | 307.6 | 317.3 | 333.2 | 346.6 | × | × | × | × | × | × | |
| 1400 | 321.2 | 328.5 | 339.5 | 355.4 | × | × | × | × | × | × | × | |
| 1600 | 338.5 | 349.5 | 360.5 | × | × | × | × | × | × | × | × | |
| 1800 | 365.5 | 375.3 | × | × | × | × | × | × | × | × | × | |
| 2000 | 396.2 | × | × | × | × | × | × | × | × | × | × | |
× Beyond the output range of the DC/DC converter.
Table 4.
Power transfer efficiencies measured by 1-to-2 power transfer experiment.
| Power being received by Battery 4 (W) | ||||||||||||
|---|---|---|---|---|---|---|---|---|---|---|---|---|
| 0 | 200 | 400 | 600 | 800 | 1000 | 1200 | 1400 | 1600 | 1800 | 2000 | ||
| Power being received by Battery 3 (W) | 0 | 0 | 0.405 | 0.588 | 0.681 | 0.737 | 0.770 | 0.791 | 0.806 | 0.815 | 0.821 | 0.824 |
| 200 | 0.413 | 0.589 | 0.684 | 0.740 | 0.774 | 0.799 | 0.813 | 0.824 | 0.830 | 0.835 | × | |
| 400 | 0.590 | 0.688 | 0.744 | 0.780 | 0.803 | 0.820 | 0.830 | 0.836 | 0.840 | × | × | |
| 600 | 0.686 | 0.743 | 0.780 | 0.806 | 0.822 | 0.834 | 0.840 | 0.843 | × | × | × | |
| 800 | 0.741 | 0.777 | 0.805 | 0.823 | 0.837 | 0.844 | 0.848 | × | × | × | × | |
| 1000 | 0.776 | 0.805 | 0.822 | 0.837 | 0.844 | 0.850 | × | × | × | × | × | |
| 1200 | 0.798 | 0.820 | 0.835 | 0.844 | 0.852 | × | × | × | × | × | × | |
| 1400 | 0.813 | 0.830 | 0.841 | 0.850 | × | × | × | × | × | × | × | |
| 1600 | 0.825 | 0.837 | 0.847 | × | × | × | × | × | × | × | × | |
| 1800 | 0.831 | 0.842 | × | × | × | × | × | × | × | × | × | |
| 2000 | 0.835 | × | × | × | × | × | × | × | × | × | × | |
× Beyond the output range of the DC/DC converter.
Table 5.
Power transmission losses measured by 2-to-1 power transfer experiment.
| Power being transmitted from Battery 2 (W) | ||||||||||||
|---|---|---|---|---|---|---|---|---|---|---|---|---|
| 0 | 200 | 400 | 600 | 800 | 1000 | 1200 | 1400 | 1600 | 1800 | 2000 | ||
| Power being received by Battery 3 (W) | 0 | 311.3 | × | × | × | × | × | × | × | × | × | × |
| 200 | 305.2 | 300.3 | × | × | × | × | × | × | × | × | × | |
| 400 | 300.3 | 297.9 | 296.6 | × | × | × | × | × | × | × | × | |
| 600 | 301.5 | 295.4 | 293.0 | 291.7 | × | × | × | × | × | × | × | |
| 800 | 304.0 | 295.4 | 291.8 | 290.5 | 289.3 | × | × | × | × | × | × | |
| 1000 | 317.4 | 302.7 | 295.4 | 293.0 | 293.0 | 294.2 | × | × | × | × | × | |
| 1200 | 332.0 | 318.6 | 305.2 | 299.1 | 295.4 | 300.3 | 308.8 | × | × | × | × | |
| 1400 | 341.8 | 327.1 | 315.0 | 306.4 | 300.3 | 302.7 | 310.1 | 321.0 | × | × | × | |
| 1600 | 369.9 | 351.6 | 340.6 | 333.3 | 324.7 | 321.1 | 319.8 | 333.9 | 351.6 | × | × | |
| 1800 | 396.7 | 372.3 | 356.4 | 344.2 | 339.4 | 332.0 | 330.8 | 339.4 | 347.9 | 358.9 | × | |
| 2000 | 428.5 | 402.8 | 390.6 | 377.2 | 363.8 | 355.2 | 350.3 | 352.8 | 363.8 | 377.2 | 396.7 | |
× Transmitting power from Battery 1 becomes negative.
Table 6.
Power transfer efficiencies measured by 2-to-1 power transfer experiment.
| Power being transmitted from Battery 2 (W) | ||||||||||||
|---|---|---|---|---|---|---|---|---|---|---|---|---|
| 0 | 200 | 400 | 600 | 800 | 1000 | 1200 | 1400 | 1600 | 1800 | 2000 | ||
| Power being received by Battery 3 (W) | 0 | 0 | × | × | × | × | × | × | × | × | × | × |
| 200 | 0.396 | 0.400 | × | × | × | × | × | × | × | × | × | |
| 400 | 0.571 | 0.573 | 0.574 | × | × | × | × | × | × | × | × | |
| 600 | 0.666 | 0.670 | 0.672 | 0.673 | × | × | × | × | × | × | × | |
| 800 | 0.725 | 0.731 | 0.733 | 0.734 | 0.735 | × | × | × | × | × | × | |
| 1000 | 0.760 | 0.768 | 0.772 | 0.774 | 0.774 | 0.773 | × | × | × | × | × | |
| 1200 | 0.783 | 0.790 | 0.797 | 0.801 | 0.803 | 0.800 | 0.795 | × | × | × | × | |
| 1400 | 0.804 | 0.811 | 0.816 | 0.820 | 0.823 | 0.822 | 0.819 | 0.813 | × | × | × | |
| 1600 | 0.812 | 0.820 | 0.825 | 0.828 | 0.831 | 0.833 | 0.833 | 0.827 | 0.820 | × | × | |
| 1800 | 0.819 | 0.829 | 0.835 | 0.840 | 0.841 | 0.844 | 0.845 | 0.841 | 0.838 | 0.834 | × | |
| 2000 | 0.824 | 0.832 | 0.837 | 0.841 | 0.846 | 0.849 | 0.851 | 0.850 | 0.846 | 0.841 | 0.835 | |
× Transmitting power from Battery 1 becomes negative.
Disclaimer/Publisher’s Note: The statements, opinions and data contained in all publications are solely those of the individual author(s) and contributor(s) and not of MDPI and/or the editor(s). MDPI and/or the editor(s) disclaim responsibility for any injury to people or property resulting from any ideas, methods, instructions or products referred to in the content. |
© 2025 by the authors. Licensee MDPI, Basel, Switzerland. This article is an open access article distributed under the terms and conditions of the Creative Commons Attribution (CC BY) license (http://creativecommons.org/licenses/by/4.0/).
Copyright: This open access article is published under a Creative Commons CC BY 4.0 license, which permit the free download, distribution, and reuse, provided that the author and preprint are cited in any reuse.


