Submitted:
10 November 2025
Posted:
12 November 2025
You are already at the latest version
Abstract
In northwestern Ecuador, where more than 90% of the original forest cover has been lost, it is unknown how soil chemistry influences bat diversity. This study evaluated bat diversity, non-herbaceous plant community structure, and soil nutrients in 30 plots distributed across crops on two farms separated by 32 km. Soil analyses revealed vari-ations in organic matter and nutrients, identifying potassium, calcium, magnesium, and zinc as the most influential. A total of 1,470 individuals of 24 non-herbaceous plant species and 193 individuals of 16 bat species were recorded, dominated by frugivorous and nectarivorous guilds. Correlation analyses showed significant associations between bat diversity indices and soil nutrients. These elements improve tree growth, fruiting, and flowering, which increases the quality and availability of food resources for bats. In return, these mammals provide key ecosystem services such as pollination, seed dis-persal, and insect control. Our findings highlight that soil chemistry indirectly regulates bat communities by influencing vegetation structure and resource availability. This in-tegrated approach underscores the importance of soil-plant-animal interactions in tropical agricultural landscapes, offering practical guidance.
Keywords:
agricultural landscapes
; soil-vegetation-fauna relationship
; biogeochemical cycles
1. Introduction
Northwest Ecuador is the region most affected by agricultural activities; currently, more than 90% of the original forest cover has been destroyed and displaced by agricultural land use, an activity that affects the original biodiversity. The annual deforestation rate increases significantly each year [1]; in this circumstance it is necessary to understand the reasons why some faunal species have been able to survive under these conditions. Previous studies that have studied the presence of biodiversity in disturbed landscapes have found positive and significant relationships between faunal diversity with climatic variables, landscape fragmentations and plant diversity characteristics [2,3,4]. It is known that bat diversity and behavior could be positively or negatively associated with the abundance, richness and structure of non-herbaceous plant communities [2,5,6]; however, there is no research that takes into account the relationship that could be found between soil chemical composition and the characteristics of non-herbaceous plant and bat diversity present in tropical agricultural landscapes.
Based on the knowledge that soil chemical elements play an important role in the generation of vegetable products that can be exploited by wildlife, in this study we evaluated the diversity of bats present in five crops located in two farms in two provinces of the Ecuadorian coast, and we analyzed the partial correlation coefficients of bat diversity with non-herbaceous plant diversity and soil nutrients.
2. Materials and Methods
2.1. Study Area
The study was conducted in two agro-systems located in northwestern Ecuador: a) the Fundo del Guanábano farm (FFG), located in the province of Pichincha, canton of Puerto Quito, parish of Nuevo Triunfo, 165 km from the Quito-La Independencia highway, 0°3'59“ N; 79°15'04” W; 350 and 410 m above sea level, b) the Santa Anita farm (FSA) in the province of Santo Domingo de los Tsáchilas, Santo Domingo canton, 6½ km from the Santo Domingo-Chone highway, 0° 13' 18“ S; 79°13'21” W; 560 m above sea level. The two locations evaluated are 32.14 km apart, both belong to the life zone known as tropical rainforest [7].
With the participation of workers and farm owners, we implemented a total of 30 plots with an area of 100 m² (replications) separated by a minimum distance of 300 m, within five different types of crop (treatments) grouped into two types of plantations (Table 1). In each plot, we studied: a) the physical-chemical properties of the soil, b) non-herbaceous plant diversity, and c) bats diversity.
2.2. Soil Analysis
A linear transect was established in each plot, along which 21 soil subsamples were collected in a zigzag pattern at a depth of 15 cm. The length of the transects was approximately 14 m in 10 × 10 m plots and 100 m in 100 × 1 m plots. The subsamples were homogenized and sent to the Soil, Water, and Foliar Laboratory of the Ecuadorian Ministry of Agriculture. The soil analyses performed were organic matter (OM) content, cation exchange capacity (CEC), macronutrients (N, P, K, Ca, and Mg), and micronutrients (Fe, Mn, Cu, and Zn). To choose the variables that would correlate with the information on non-herbaceous plant and bats diversity, the average was obtained between the highest and lowest values of the autovector of the first two components of the Principal Component Analysis, which explained 83% of the variation in the data (CP1 = 59.4%, CP2 = 23.6%); and then the first six soil variables closest to this mean were taken, corresponding to OM, N, K, Ca, Mg, and Zn.
2.3. Arboreal and Bats Diversity
All non-herbaceous plant with a diameter at breast height (DBH) ≥ 3 cm within the crop of the selected plots were inventoried. After a period of two months, to ensure that human presence did not influence data collection, bats sampling was initiated.
Since mist nets are widely recognized as the most effective method for sampling bats communities [8,9], a 10 m × 2 m mist net with a mesh size of 20 mm was installed in each sampling plot. Mist nets were placed at ground level and were open from 5:30 p.m. to 12:30 a.m., with checks carried out every 15 minutes. The sampling times were selected to coincide with the peak activity of bats [10,11,12]. On all plots, all mist nets were kept open for seven hours per night for two consecutive nights, repeated five times over a period of five months (September, November, December, February, and March). The mist nets were checked simultaneously by five observers (the two authors and three field assistants), each assigned to a different crop type. The sampling effort was calculated as 4,200 m²·h·net (20 m² of net surface area × 7 h × 30 mist nets), this was expressed in m² of mist net to allow direct comparison with non-herbaceous plant density, which is also measured in surface area units [2].
The captured animals were identified at the species level, then marked, photographed for record purposes, and immediately released at the site of capture; none were killed, retained, or kept in captivity. It is important to note that Ecuador's Ministry of Environment, Water, and Ecological Transition approved the protocols and issued scientific research authorizations 10-2013-IC-FAU-DPAP-MA and 01-2015-0-IC-FAU-DPAP-MA. Furthermore, the study adhered to the standards outlined in the ARRIVE guidelines.
2.4. Data Analysis
The indicator of non-herbaceous plant abundance was specific density (number of non-herbaceous plants of each species per 100 m²) and the relative abundance of bats (effective number of individuals captured per species divided by the capture effort expressed in meters). For non-herbaceous plants and bats, species richness (S), rank-abundance curves, the Shannon-Wiener index (H'), the reciprocal of the Simpson dominance index (1/D), and Pielou's evenness (J') were also obtained. All ecological indices were calculates using Past 5.2.1 (https://www.nhm.uio.no/english/research/resources/past/)
We prepared three matrices: the first with the means of the soil chemical variables (M1), the second with the richness and structure of the bat community (M2), and the third with the richness and structure of the non-herbaceous plants (M3). We performed the analyses using nonparametric tests due to the non-normal distribution of the non-herbaceous plants and bat diversity variables (Shapiro-Wilk p > 0.05). We selected Spearman's correlation coefficient to identify the correlations between: M1 and M2, M1 and M3, M2 and M3. We used Spearman's correlation coefficients greater than 0.40 with p values < 0.05 between soil variables and phyllostomid bat diversity and non-herbaceous plants diversity to select the variables for which we calculated partial correlation coefficients. All statistical analyses were performed using InfoStat software [13] integrated with the R interface.
3. Results
3.1. Soil Characterization
The characterization of soil samples from this region revealed that the predominant soil type was silt. The central tendency measures of OM, CEC, macronutrients and micronutrients are showing as complementary material. The soils with the highest CEC were found in the polyspecific live fences, mixed plantations, cocoa plantations, and scattered trees in pastures. In contrast, monospecific fences exhibited lower CEC (Appendix A).
3.2. Bats and Arboreal Diversity
A total of 193 individuals from 16 species of bats were captured, grouped into two families: 94% of the species belong to the family Phyllostomidae, and 6% to the family Vespertilionidae. Glossophaga soricina (Pallas, 1766), Carollia brevicauda (Wied-Neuwied, 1821), Uroderma convexum (Lion, 1902), Carollia perspicillata (Linnaeus, 1758), Sturnira bakeri (Velazco & Patterson, 2014), and Myotis riparius (Handley, 1960), accounted for 81,3% of the captures; Artibeus aequatorialis (Andersen, 1906), Chiroderma villosum (Peters, 1860), Vampyriscus nymphaea (Thomas, 1909), and Artibeus ravus (Miller, 1902), represented 14% of captures Chiroderma salvini (Dobson, 1878), Chiroderma sp., Gardnerycteris keenani ((Handley, 1960), Micronycteris hirsuta (Peters, 1869), Sturnira ludovici (Anthony, 1924), and Trachops cirrhosus (Spix, 1823) were classified as rare species, represented 4,7% due to the captures, each species constituting ≤1% of the total captures (Appendix B).
The rank-abundance curve of the bat community showed a high number of points (species richness), and a broken tail formed by six rare species (Figure 1A).
One thousand five hundred and seventy-six non-herbaceous plants, belonging to 34 vegetal species were censured. As demonstrated by rank-abundance curve, non-herbaceous plant diversity differs from bat diversity (Figure 1B). A total of sixteen plant species accounted for 90% of the relative abundance, while the remaining 10% was made up of the other 18 plant species (Appendix C).
3.3. Correlations Between Non-Herbaceous Plant and Bats Diversity and Soil Nutrients
Both organic matter and N did not show significant associations with the diversity of the bat community in the studied farms. Shannon's richness and diversity showed significant partial correlation coefficients (Table 2). However, 1/D did not show significant degrees of association.
4. Discussion
The visual analysis of the rank-abundance curves indicates moderate diversity of bats and arboreal species in the evaluated farms. It is important to note that a previous study in ecological reserves near the area of influence of this study [14], recorded 41 bat species, while in the evaluated farms we barely recorded 16 bat species [4], this allows inferring that the low number of species recorded demonstrates the effect of conversion to agricultural soils that the studied area has suffered [1]. [2] reported the presence of 16 species of phyllostomids and two of vespertilionids as results of bats inventories applied to four study sites involving eight farms in the same area. In addition, the ecological indices used in this study showed higher values in polycultures than in monocultures, which suggests a positive relationship between non-herbaceous plant diversity and bats diversity in the two farms evaluated.
Livestock farms in northwestern Ecuador have different types of forest arrangements, including fruit orchards, secondary forests, primary forests and forest plantations [15]. A recent study demonstrated the presence of 31 different tree species using in live fences located on farms on the northern coast of Ecuador [2]. Both the previously cited studies, as well as the present work, agree that there is a high percentage of native tree species used as crops in agricultural systems.
K, Ca, Mg and Zn have been identified as essential bioelements in the context of plant and animal nutrition. In this study, these elements exhibited direct and significant associations with bat diversity and the plants under consideration. Information provided by [16] reveals that soil bioelements are continuously recycled through biogeochemical cycles, circulating between biotic components through food webs and abiotic components through soil, water and atmosphere, which ensures their availability to all organisms. Thus, the availability of key bioelements in the soil has a direct impact on the ecology of communities, affecting the nutritional quality of primary producers and, consequently, the structure and dynamics of food chains that influence the diversity, growth, reproduction and adaptation of organisms [17].
According to the findings of previous studies conducted in the same area by [4], the nutritional status of bats is contingent on the quality of the crop. In the two farms under study, it was ascertained that 10 of the bat species captured were frugivorous, two were insectivorous, two were insectivorous/animalivorous, and one was nectarivorous. [18] posit that the chemical composition of flowers exerts a substantial influence on the interactions between plants and herbivores. Consequently, the chemistry of floral nectar and pollen, regarded as essential phyto-products for ecological balance and constituting the primary food rewards for pollinators, can impact both plant reproduction and the health of these herbivores.
The stoichiometric evaluation of pollen [19] in 26 studies of different plant species indicates that it contains different concentrations of essential elements such as C, N, P, Cu, Na, K, Ca, Mg and Zn. These concentrations, among other factors, depend on the availability of soil bioelements. Concurrent with this, studies focusing on nectar chemistry have demonstrated that this floral product, in addition to its high sugar content, contains bioelements such as Cl, Cu, K, Ca, Na, and Zn.
The distinct chemical composition of these elements is found to be contingent upon the stoichiometry of the soil in which the evaluated plants are situated [20]. Furthermore, [17] discovered that the bioelement availability in the soil influences leaf chemistry, thereby affecting the physiology and ecology of herbivores. This establishes a direct link between soil biogeochemistry and the chemical composition of herbivore food. In the context of biogeochemical cycles and ecological stoichiometry, K, Ca, Mg, and Zn have been shown to be positively and significantly correlated with the diversity of bats and plants on the farms evaluated in this study. This phenomenon can be attributed to the fact that the soil provides plants with the necessary nutrients to produce nectar and pollen, which are rich in bioelements, making them more attractive to pollinating insects and bats [19], This, in turn, contributes to the increase in bat and plant abundance, richness, and diversity. The enhancement of pollinator diversity has been demonstrated to improve plant fertilization processes, thereby favoring the dispersal, germination, and survival of plant species. This, in turn, exerts a significant influence on the formation of fruits available to fruit-eating bat species. Conversely, the greater diversity of insects attracts insectivorous bats.
The highest levels of K and Mg were recorded in polyspecific live fences and in trees scattered in paddocks, which are crops that also presented the highest richness of non-herbaceous plants and bats. [21] point out that the availability of Ca, Mg and K in the soil is a key factor to promote a greater diversity of plant cover, since these nutrients directly influence the growth and competitiveness of plant species. Ca is essential for cell wall stability and root development [22], promoting colonization of species with deep root systems. Mg, being a central component of the chlorophyll tetrapyrrole ring [23], is essential for photosynthesis and allows the establishment of plants with high growth rates. For its part, K is involved in osmoregulation and drought resistance, which benefits the coexistence of species in environments with water variability. An adequate supply of bioelements in the soil guarantees the availability of nutrients without generating competitive deficiencies among plant species. Thus, soils well supplied with Ca, Mg and K can support a greater plant diversity generating heterogeneity of plant resources, such as fruits, leaves, flowers and even shelters for bats and other animals. Likewise, different tree species have varied phenological cycles such as flowering or fruiting at different times, which extends the availability of resources for animal species throughout the year [24] and, on the other hand, tree diversity regulates factors such as humidity, temperature and light availability, which directly influence the composition of animal communities [25].
Finally, Zn, an essential plant micronutrient promotes the synthesis of tryptophan, a precursor of auxins, which favors plant growth. It also improves photosynthetic efficiency by stabilizing the RuBisCo enzyme and modulating carbonic anhydrase activity, which results in increased carbon fixation and biomass production. In addition, Zn has been demonstrated to enhance the ability of plants to withstand environmental stresses by regulating water uptake, mitigating the effects of heat and salt stresses, and activating antioxidant mechanisms that protect against oxidative damage [26]. These responses are not only instrumental in optimizing plant growth and health but also serve to increase their nutritional value. For herbivorous bats, Zn obtained through trophic chains is essential for processes such as cell proliferation, differentiation and regulation of the immune system [27]. In addition, it contributes to the activation of transcription factors, the modulation of kinases and phosphatases, and cellular homeostasis, which enhances their health and adaptive capacity. Consequently, ensuring sufficient Zn availability in the soil is advantageous not only for plants but also for bats, which depend on them for nutrition.
5. Conclusions
The present study provides further evidence of the importance of maintaining well-nourished soils to promote the growth and health of trees, which serve as primary roosts for bats in agricultural systems. Our results show that the soil nutrients K, Ca, Mg, and Zn have a substantial linear relationship with the richness and diversity of both bats and non-herbaceous plants in agricultural landscapes. These findings suggest that the presence of these specific soil nutrients favors the establishment and maintenance of healthy and productive trees. Consequently, non-herbaceous plant species provide key food resources that favor the permanence and survival of bat communities in tropical agricultural systems.
Author Contributions
Conceptualization, W.E.P-R. and M.I.A-H.; methodology, W.E.P-R. and M.I.A-H.; formal analysis, W.E.P-R. and M.I.A-H.; data curation, W.E.P-R. and M.I.A-H.; resources, W.E.P-R. and M.I.A-H.; writing—original draft preparation, W.E.P-R. and M.I.A-H.; writing—review and editing, W.E.P-R. and M.I.A-H. All authors have read and agreed to the published version of the manuscript.
Funding
The field trips were supported by Vicerrectorado de Investigaciones of the Universidad de las Fuerzas Armadas ESPE.
Institutional Review Board Statement
This study did not involve human beings or clinical trials requiring Institutional Committee approval. No animals were sacrificed or kept in captivity. All field activities adhered to biosafety standards. The Ministry of Environment, Water, and Ecological Transition of Ecuador authorized the research under permits 10-2013-IC-FAU-DPAP-MA and 01-2015-0-IC-FAU-DPAP-MA. The study complied with ARRIVE guidelines and applicable regulations [28].
Data Availability Statement
Data is contained whitin the article
Acknowledgments
We are grateful to Gabriel Moya, Sebastian Recalde, Noelly Ruiz, Mayra Morales, and Karonila Yazán for their help in collecting field data. We also thank to Soil, Water and Foliar Laboratory of the Ministry of Agriculture of Ecuador for soil analysis.
Conflicts of Interest
The authors declare no conflicts of interest.
Abbreviations
The following abbreviations are used in this manuscript:
| MDPI | Multidisciplinary Digital Publishing Institute |
| DOAJ | Directory of open access journals |
| TLA | Three letter acronym |
| LD | Linear dichroism |
Appendix A
Physicochemical structure of soils in the crop types evaluated.

Table A1.
This is a table caption.
| Crop type | Variable | n | Mean | S.D. | S.E. | V.C. | Mín. | Máx. |
|---|---|---|---|---|---|---|---|---|
| Cocoa plantations | ph | 6 | 5,73 | 0,02 | 0,01 | 0,35 | 5,71 | 5,75 |
| OM(%) | 6 | 8,34 | 0,03 | 0,02 | 0,36 | 8,31 | 8,37 | |
| N(%) | 6 | 0,42 | 0,02 | 0,01 | 4,76 | 0,4 | 0,44 | |
| P(ppm) | 6 | 3,9 | 0,3 | 0,17 | 7,69 | 3,6 | 4,2 | |
| K(cOMl/Kg) | 6 | 0,32 | 0,03 | 0,02 | 9,38 | 0,29 | 0,35 | |
| Ca(cOMl/Kg) | 6 | 5,07 | 0,03 | 0,02 | 0,59 | 5,04 | 5,1 | |
| Mg(cOMl/Kg) | 6 | 0,65 | 0,01 | 0,01 | 1,54 | 0,64 | 0,66 | |
| Fe(ppm) | 6 | 272,8 | 0,1 | 0,06 | 0,04 | 272,7 | 272,9 | |
| Mn(ppm) | 6 | 9,89 | 0,01 | 0,01 | 0,1 | 9,88 | 9,9 | |
| Cu(ppm) | 6 | 7,36 | 0,03 | 0,02 | 0,41 | 7,33 | 7,39 | |
| Zn(ppm) | 6 | 5,3 | 0,3 | 0,17 | 5,66 | 5 | 5,6 | |
| CiC | 6 | 21,68 | 0,02 | 0,01 | 0,09 | 21,66 | 21,7 | |
| Humidity % | 6 | 33,12 | 0,02 | 0,01 | 0,06 | 33,1 | 33,14 | |
| Sand | 6 | 47 | 1 | 0,58 | 2,13 | 46 | 48 | |
| Silt | 6 | 43 | 1 | 0,58 | 2,33 | 42 | 44 | |
| Clay | 6 | 10 | 2 | 1,15 | 20 | 8 | 12 | |
| Live fence of Erythrina spp. | ph | 6 | 6,09 | 0,05 | 0,03 | 0,81 | 6,03 | 6,12 |
| OM(%) | 6 | 4,54 | 0,84 | 0,49 | 18,57 | 3,87 | 5,49 | |
| N(%) | 6 | 0,22 | 0,04 | 0,02 | 18,64 | 0,19 | 0,27 | |
| P(ppm) | 6 | 4,23 | 1,1 | 0,63 | 25,91 | 3,6 | 5,5 | |
| K(cOMl/Kg) | 6 | 0,32 | 0,15 | 0,09 | 48,24 | 0,15 | 0,45 | |
| Ca(cOMl/Kg) | 6 | 6,66 | 2,58 | 1,49 | 38,76 | 4,68 | 9,58 | |
| Mg(cOMl/Kg) | 6 | 1,07 | 0,36 | 0,21 | 34,18 | 0,74 | 1,46 | |
| Fe(ppm) | 6 | 425,2 | 16,48 | 9,51 | 3,88 | 406,5 | 437,6 | |
| Mn(ppm) | 6 | 11,61 | 0,93 | 0,54 | 8 | 10,55 | 12,29 | |
| Cu(ppm) | 6 | 5,63 | 0,24 | 0,14 | 4,32 | 5,37 | 5,85 | |
| Zn(ppm) | 6 | 10,14 | 0,29 | 0,17 | 2,85 | 9,83 | 10,4 | |
| CiC | 6 | 17,98 | 5,86 | 3,38 | 32,57 | 11,22 | 21,48 | |
| Humidity % | 6 | 33,31 | 1,87 | 1,08 | 5,6 | 31,44 | 35,17 | |
| Sand | 6 | 40 | 7,21 | 4,16 | 18,03 | 34 | 48 | |
| Silt | 6 | 45,33 | 2,52 | 1,45 | 5,55 | 43 | 48 | |
| Clay | 6 | 16 | 4,36 | 2,52 | 27,24 | 11 | 19 | |
| Polyspecific live fence | ph | 6 | 6,07 | 0,08 | 0,04 | 1,25 | 5,98 | 6,12 |
| OM(%) | 6 | 12,5 | 2,93 | 1,69 | 23,42 | 9,43 | 15,26 | |
| N(%) | 6 | 0,62 | 0,15 | 0,08 | 23,38 | 0,47 | 0,76 | |
| P(ppm) | 6 | 4,17 | 0,25 | 0,15 | 6,04 | 3,9 | 4,4 | |
| K(cOMl/Kg) | 6 | 0,6 | 0,27 | 0,15 | 44,54 | 0,32 | 0,85 | |
| Ca(cOMl/Kg) | 6 | 12,74 | 3,24 | 1,87 | 25,39 | 9,53 | 16 | |
| Mg(cOMl/Kg) | 6 | 2,22 | 0,49 | 0,28 | 22,02 | 1,92 | 2,78 | |
| Fe(ppm) | 6 | 160,2 | 31,03 | 17,92 | 19,37 | 133 | 194 | |
| Mn(ppm) | 6 | 10,91 | 2,12 | 1,23 | 19,48 | 9,57 | 13,36 | |
| Cu(ppm) | 6 | 6,57 | 0,35 | 0,2 | 5,32 | 6,28 | 6,96 | |
| Zn(ppm) | 6 | 11,72 | 2,73 | 1,58 | 23,28 | 9,17 | 14,6 | |
| CiC | 6 | 25,95 | 7,15 | 4,13 | 27,57 | 17,69 | 30,14 | |
| Humidity % | 6 | 45,8 | 2,57 | 1,48 | 5,61 | 43,23 | 48,37 | |
| Sand | 6 | 46 | 2 | 1,15 | 4,35 | 44 | 48 | |
| Silt | 6 | 43,33 | 1,53 | 0,88 | 3,53 | 42 | 45 | |
| Clay | 6 | 10,67 | 2,89 | 1,67 | 27,06 | 9 | 14 | |
| Mixed plantations | ph | 6 | 5,88 | 0,02 | 0,01 | 0,34 | 5,86 | 5,9 |
| OM(%) | 6 | 9,49 | 0,01 | 0,01 | 0,11 | 9,48 | 9,5 | |
| N(%) | 6 | 0,47 | 0,03 | 0,02 | 6,38 | 0,44 | 0,5 | |
| P(ppm) | 6 | 6,2 | 0,2 | 0,12 | 3,23 | 6 | 6,4 | |
| K(cOMl/Kg) | 6 | 1,01 | 0,01 | 0,01 | 0,99 | 1 | 1,02 | |
| Ca(cOMl/Kg) | 6 | 12,7 | 0,7 | 0,4 | 5,51 | 12 | 13,4 | |
| Mg(cOMl/Kg) | 6 | 1,55 | 0,05 | 0,03 | 3,23 | 1,5 | 1,6 | |
| Fe(ppm) | 6 | 286 | 4 | 2,31 | 1,4 | 282 | 290 | |
| Mn(ppm) | 6 | 15,43 | 0,03 | 0,02 | 0,19 | 15,4 | 15,46 | |
| Cu(ppm) | 6 | 7,05 | 0,15 | 0,09 | 2,13 | 6,9 | 7,2 | |
| Zn(ppm) | 6 | 19,83 | 0,04 | 0,02 | 0,2 | 19,79 | 19,87 | |
| CiC | 6 | 22,98 | 0,02 | 0,01 | 0,09 | 22,96 | 23 | |
| Humidity % | 6 | 43,74 | 0,1 | 0,06 | 0,23 | 43,64 | 43,84 | |
| Sand | 6 | 33 | 1 | 0,58 | 3,03 | 32 | 34 | |
| Silt | 6 | 57,67 | 1,53 | 0,88 | 2,65 | 56 | 59 | |
| Clay | 6 | 9,33 | 1,15 | 0,67 | 12,37 | 8 | 10 | |
| Scattered trees in pastures | ph | 6 | 6,1 | 0,08 | 0,05 | 1,34 | 6,03 | 6,19 |
| OM(%) | 6 | 5,84 | 2,75 | 1,59 | 47,12 | 3,28 | 8,75 | |
| N(%) | 6 | 0,3 | 0,13 | 0,08 | 44,51 | 0,18 | 0,44 | |
| P(ppm) | 6 | 7,6 | 6,93 | 4 | 91,16 | 3,6 | 15,6 | |
| K(cOMl/Kg) | 6 | 0,6 | 0,45 | 0,26 | 74,81 | 0,3 | 1,11 | |
| Ca(cOMl/Kg) | 6 | 6,49 | 0,96 | 0,55 | 14,72 | 5,53 | 7,44 | |
| Mg(cOMl/Kg) | 6 | 0,85 | 0,13 | 0,07 | 14,74 | 0,73 | 0,98 | |
| Fe(ppm) | 6 | 335,73 | 98,09 | 56,63 | 29,22 | 275 | 448,9 | |
| Mn(ppm) | 6 | 11,18 | 1,78 | 1,03 | 15,96 | 9,2 | 12,66 | |
| Cu(ppm) | 6 | 5,99 | 1,15 | 0,66 | 19,11 | 4,79 | 7,07 | |
| Zn(ppm) | 6 | 12,05 | 3,21 | 1,85 | 26,65 | 8,36 | 14,2 | |
| CiC | 6 | 21,74 | 1,26 | 0,73 | 5,79 | 20,48 | 23 | |
| Humidity % | 6 | 31,42 | 9,63 | 5,56 | 30,66 | 20,33 | 37,74 | |
| Sand | 6 | 32 | 5,29 | 3,06 | 16,54 | 28 | 38 | |
| Silt | 6 | 48,67 | 3,51 | 2,03 | 7,22 | 45 | 52 | |
| Clay | 6 | 22,67 | 3,79 | 2,19 | 16,7 | 20 | 27 |
Appendix B
Bat species distribution by crop type.
| Bat species | Cocoa Plantations | Mixed Plantations | Scattered trees in pastures | Polyspecific live fences | Live fences of Erythrina | Abundance relative |
| Glossophaga soricina | 8 | 9 | 4 | 16 | 2 | 20,2 |
| Carollia brevicauda | 2 | 21 | 10 | 17,1 | ||
| Uroderma convexum | 6 | 6 | 12 | 3 | 14,0 | |
| Carollia perspicillata | 3 | 7 | 5 | 9 | 1 | 13,0 |
| Sturnira bakeri | 1 | 5 | 2 | 10 | 3 | 10,9 |
| Myotis nigricans | 12 | 6,2 | ||||
| Artibeus aequatorialis | 2 | 5 | 1 | 4,1 | ||
| Chiroderma villosum | 2 | 4 | 1 | 3,6 | ||
| Vampyriscus nymphaea | 4 | 3 | 3,6 | |||
| Artibeus ravus | 1 | 1 | 1 | 2 | 2,6 | |
| Chiroderma sp. | 1 | 1 | 1,0 | |||
| Chiroderma trinitatum | 1 | 1 | 1,0 | |||
| Gardnerycteris keenani | 1 | 1 | 1,0 | |||
| Micronicterys hirsuta | 1 | 0,5 | ||||
| Sturnira ludovici | 1 | 0,5 | ||||
| Trachops cirrhosus | 1 | 0,5 | ||||
| Richness | 6 | 13 | 5 | 12 | 8 | |
| Adundance | 21 | 58 | 24 | 74 | 16 | |
| Dominance_D | 0,2238 | 0,1779 | 0,3007 | 0,1237 | 0,09167 | |
| Simpson_1-D | 0,7762 | 0,8221 | 0,6993 | 0,8763 | 0,9083 | |
| Simpson 1/D | 4,468275246 | 5,621135469 | 3,325573661 | 8,084074373 | 10,90869423 | |
| Shannon_H | 1,637 | 2,114 | 1,395 | 2,228 | 2,2 |
Appendix C
Non-herbaceous plant species distribution by crop type.
| Plant species | Cocoa plantations | Mixed plantations | Scattered trees in pastures | Polyspecific live fences | Life fences of Erythrina | Relative abundance |
| Erythrina smithiana | 0 | 0 | 16 | 128 | 317 | 29,251269 |
| Theobroma cacao | 198 | 78 | 4 | 33 | 0 | 19,860406 |
| Cordia alliodora | 0 | 0 | 47 | 157 | 0 | 12,944162 |
| Erithryna poeppigiana | 0 | 0 | 14 | 66 | 0 | 5,0761421 |
| Spondias mombin | 0 | 0 | 22 | 53 | 0 | 4,7588832 |
| Musa paradisiaca | 0 | 61 | 0 | 0 | 0 | 3,8705584 |
| Citrus sinensis | 0 | 0 | 10 | 25 | 0 | 2,2208122 |
| Citrus aurantium | 0 | 27 | 0 | 4 | 0 | 1,9670051 |
| Citrus reticulata | 0 | 0 | 4 | 23 | 0 | 1,713198 |
| Jathropa curcas | 0 | 0 | 0 | 26 | 0 | 1,6497462 |
| Manihot sculenta | 0 | 24 | 0 | 0 | 0 | 1,5228426 |
| Gliricidia sepium | 0 | 0 | 0 | 20 | 0 | 1,2690355 |
| Annona muricata | 0 | 0 | 0 | 20 | 0 | 1,2690355 |
| Erythrina poeppigiana | 0 | 0 | 0 | 19 | 0 | 1,2055838 |
| Guadua sp. | 0 | 0 | 0 | 16 | 0 | 1,0152284 |
| Coffea canephora | 0 | 0 | 1 | 15 | 0 | 1,0152284 |
| Phyllantus juglandifolius | 0 | 0 | 2 | 12 | 0 | 0,8883249 |
| Carica papaya | 0 | 0 | 12 | 2 | 0 | 0,8883249 |
| Iriartea deltoidea | 0 | 0 | 2 | 11 | 0 | 0,8248731 |
| Helicostylis tovarensis | 0 | 0 | 2 | 11 | 0 | 0,8248731 |
| Persea americana | 0 | 0 | 8 | 4 | 0 | 0,7614213 |
| Annona cherimola | 0 | 0 | 0 | 12 | 0 | 0,7614213 |
| Tabebuia sp. | 0 | 0 | 0 | 10 | 0 | 0,6345178 |
| Ficus sp. | 0 | 0 | 8 | 2 | 0 | 0,6345178 |
| Baccharis sp. | 0 | 0 | 10 | 0 | 0 | 0,6345178 |
| Attalea colenda | 0 | 9 | 0 | 1 | 0 | 0,6345178 |
| Cecropia sp. | 0 | 0 | 4 | 2 | 0 | 0,3807107 |
| Aegiphilia alba | 0 | 0 | 0 | 6 | 0 | 0,3807107 |
| Coffea arabiga caturra | 0 | 0 | 0 | 5 | 0 | 0,3172589 |
| Psidium guajaba | 0 | 0 | 0 | 4 | 0 | 0,2538071 |
| Citrus limonia | 0 | 0 | 3 | 0 | 0 | 0,1903553 |
| Artocarpus altilis | 0 | 0 | 3 | 0 | 0 | 0,1903553 |
| Undeterminated | 0 | 0 | 0 | 2 | 0 | 0,1269036 |
| Inga sp. | 0 | 0 | 1 | 0 | 0 | 0,0634518 |
| Richness | 1 | 5 | 19 | 28 | 1 | |
| Abndance | 198 | 199 | 173 | 689 | 317 | |
| Dominance_D | 1 | 0,28 | 0,12 | 0,11 | 1 | |
| Simpson_1-D | 0 | 0,72 | 0,88 | 0,89 | 0 | |
| Simpson 1/D | 1 | 3,58 | 8,45 | 8,98 | 1 | |
| Shannon_H | 0 | 1,41 | 2,51 | 2,65 | 0 |
References
- Sierra, R.; Tirado, M.; Palacios, W. Forest-cover changes from labor- and capital-intensive commercial logging in the southern Chocó rainforests. Prof. Geogr. 2003, 55, 477–490. [Google Scholar] [CrossRef]
- Pozo-Rivera, W.E. Relaciones de la diversidad arbórea y la estructura del paisaje agrícola tropical ecuatoriano con la biodiversidad de murciélagos filostómidos. Ph.D. Thesis, Universidad de La Habana, 2017.
- Pozo-Rivera, W.E.; Cárdenas-Tello, C.D.; Echeverría, A.; Berovides-Álvarez, V.; Ricardo-Nápoles, N. Efecto de la estructura del paisaje agrícola en la diversidad arbórea. Bol. Téc. Ser. Zool. 2017, 13, 14–20. [Google Scholar]
- Pozo-Rivera, W.E.; Martin-Solano, S.; Carrillo-Bilbao, G. Response of phyllostomid bat diversity to tree cover types in north-western Ecuador. Sci. Rep. 2024, 14, 22987. [Google Scholar] [CrossRef]
- Medina, A.; Harvey, C.A.; Sanchez-Melo, D.; Vilchez, S.; Hernández, B. Bat diversity and movements in an agricultural landscape in Matiguás, Nicaragua. Biotropica 2007, 39, 120–128. [Google Scholar] [CrossRef]
- García-García, J.L.; Santos-Moreno, A. Efectos de la estructura del paisaje y de la vegetación en la diversidad de murciélagos filostómidos (Chiroptera: Phyllostomidae) de Oaxaca, México. Rev. Biol. Trop. 2014, 62, 217–239. [Google Scholar] [CrossRef]
- Holdridge, L. Ecología basada en zonas de vida; IICA: San José, Costa Rica, 1982. [Google Scholar]
- Pech-Canche, J.M.; MacSwiney, C.; Estrella, E. Importancia de los detectores ultrasónicos para mejorar los inventarios de murciélagos Neotropicales. Therya 2010, 1, 221–227. [Google Scholar] [CrossRef]
- Bracamonte, J.C. Protocolo de muestreo para la estimación de la diversidad de murciélagos con redes de niebla en estudios de ecología. Ecol. Austral. 2018, 28, 183–190. [Google Scholar] [CrossRef]
- Henry, M.; Kalko, E.K.V. Foraging strategy and breeding constraints of Rhinophylla pumilio (Phyllostomidae) in the Amazon lowlands. J. Mammal. 2007, 88, 81–93. [Google Scholar] [CrossRef]
- Kelm, D.H.; Wiesner, K.R.; von Helversen, O. Effects of artificial roosts for frugivorous bats on seed dispersal in a Neotropical forest–pasture mosaic. Conserv. Biol. 2008, 22, 733–741. [Google Scholar] [CrossRef] [PubMed]
- Cortés-Delgado, N.; Sosa, V.J. Do bats roost and forage in shade coffee plantations? A perspective from the frugivorous bat Sturnira hondurensis. Biotropica 2014, 46, 624–632. [Google Scholar] [CrossRef]
- Di Rienzo, J.A.; Casanoves, F.; Balzarini, M.G.; González, L.; Tablada, M.; Robledo, C.W. InfoStat versión 2016 [Software]; Grupo InfoStat, FCA, Universidad Nacional de Córdoba, Córdoba, Argentina, 2016. http://www.infostat.com.ar.
- Tirira, D.G. Guía de campo de los mamíferos del Ecuador, 1st ed.; Murciélago Blanco: Quito, Ecuador, 2007. [Google Scholar]
- Villacís, J.; Chiriboga, C. Relaciones entre las variables socioeconómicas y la cobertura arbórea de fincas ganaderas del trópico húmedo. Rev. Cubana Cienc. For. 2016, 4, 149–163. [Google Scholar]
- Peñuelas, J.; Fernández-Martínez, M.; Ciais, P.; Jou, D.; Piao, S.; Obersteiner, M.; Vicca, S.; Janssens, I.A.; Sardans, J. The bioelements, the elementome, and the biogeochemical niche. Ecology 2019, 100, e02652. [Google Scholar] [CrossRef]
- Schade, J.D.; Kyle, M.; Hobbie, S.E.; Fagan, W.F.; Elser, J.J. Stoichiometric tracking of soil nutrients by a desert insect herbivore. Ecol. Lett. 2003, 6, 96–101. [Google Scholar] [CrossRef]
- Parachnowitsch, A.L.; Manson, J.S. The chemical ecology of plant-pollinator interactions: Recent advances and future directions. Curr. Opin. Insect Sci. 2015, 8, 41–46. [Google Scholar] [CrossRef] [PubMed]
- Filipiak, M.; Weiner, J. Plant-insect interactions: The role of ecological stoichiometry. Acta Agrobot. 2017, 70, 6–8. [Google Scholar] [CrossRef]
- Nanda, V.; Sarkar, B.C.; Sharma, H.K.; Bawa, A.S. Physico-chemical properties and estimation of mineral content in honey produced from different plants in Northern India. Food Chem. 2003, 82, 613–619. [Google Scholar] [CrossRef]
- Wdowiak, A.; Podgórska, A.; Szal, B. Calcium in plants: An important element of cell physiology and structure, signaling, and stress responses. Acta Physiol. Plant. 2024, 46, 1–20. [Google Scholar] [CrossRef]
- Jing, T.; Li, J.; He, Y.; Shankar, A.; Saxena, A.; Tiwari, A.; Maturi, K.C.; Solanki, M.K.; Singh, V.; Eissa, M.A.; Ding, Z.; Xie, J.; Awasthi, M.K. Role of calcium nutrition in plant physiology: Advances in research and insights into acidic soil conditions – A comprehensive review. Plant Physiol. Biochem. 2024, 210, 108602. [Google Scholar] [CrossRef]
- Tian, X.Y.; He, D.D.; Bai, S.; Zeng, W.Z.; Wang, Z.; Wang, M.; Wu, L.Q.; Chen, Z.C. Physiological and molecular advances in magnesium nutrition of plants. Plant Soil 2021, 468, 1–17. [Google Scholar] [CrossRef]
- Silvestro, R.; Deslauriers, A.; Prislan, P.; Rademacher, T.; Rezaie, N. From roots to leaves: Tree growth phenology in forest ecosystems. Curr. For. Rep. 2025. [Google Scholar] [CrossRef]
- Zhang, S.; Landuyt, D.; Verheyen, K.; De Frenne, P. Tree species mixing can amplify microclimate offsets in young forest plantations. J. Appl. Ecol. 2022, 59, 1428–1439. [Google Scholar] [CrossRef]
- Tsonev, T.; Cebola Lidon, F.J. Zinc in plants—An overview. Emir. J. Food Agric. 2012, 24, 322–333. [Google Scholar] [CrossRef]
- Wessels, I.; Fischer, H.J.; Rink, L. Dietary and physiological effects of zinc on the immune system. Annu. Rev. Nutr. 2021, 41, 133–175. [Google Scholar] [CrossRef] [PubMed]
- du Sert, N.P.; et al. Reporting animal research: Explanation and elaboration for the ARRIVE guidelines 2. 0. PLoS Biol. 2020, 18. [Google Scholar]
Figure 1.
Rank-abundance curves expressed as Log10 of the proportional abundance of species (Pi). A) bat diversity: The first six species represent 80% of the relative abundance, with collections ranging from 12 to 39 individuals. B) Arboreal diversity: The first 16 species represent 90% of the relative abundance, with collections ranging from 16 to 461 individuals.
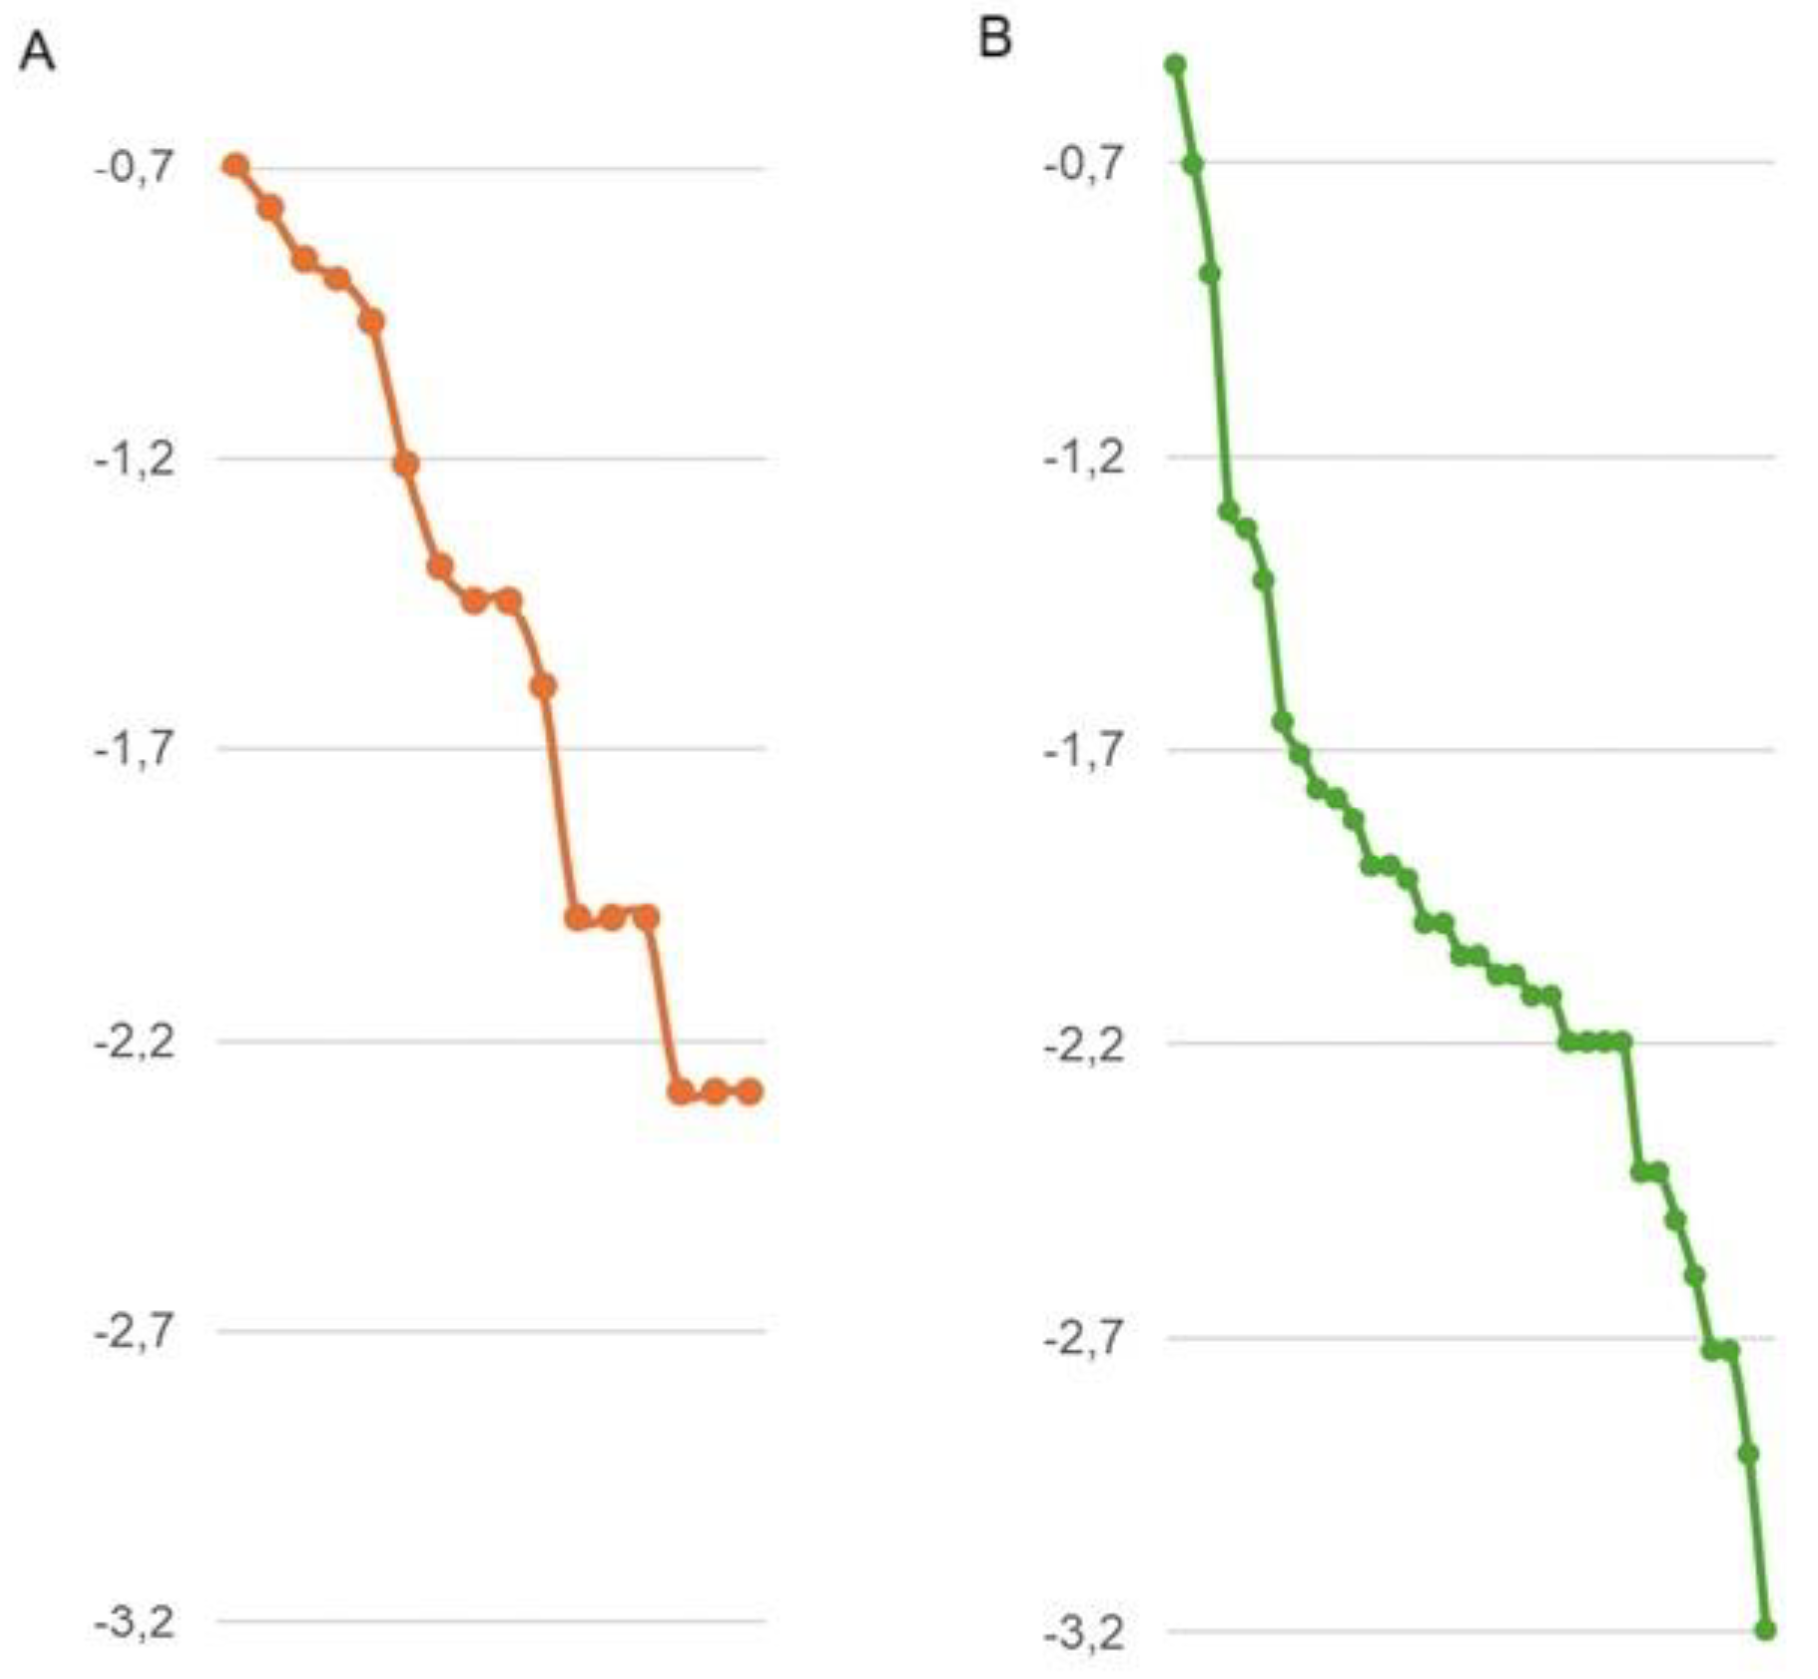
Table 1.
Crop (treatments) and number of plots (replications) in the evaluated farms, Northwestern Ecuador.
Table 1.
Crop (treatments) and number of plots (replications) in the evaluated farms, Northwestern Ecuador.
| Crop Type | Plot Dimension (m) | No. of Plots Per Farm | |
|---|---|---|---|
| FFG+ | FSA++ | ||
| Cocoa plantations | 10 * 10 | 3 | 3 |
| Live fence of Erythrina spp. | 100 * 1 | 3 | 3 |
| Mixed plantations | 10 * 10 | 3 | 3 |
| Polyspecific live fence | 100 * 1 | 3 | 3 |
| Scattered trees in pastures | 10 * 10 | 3 | 3 |
(+ Fundo del Guanabano Farm, ++ Santa Anita Farm).
Table 2.
Partial correlation coefficients (PCC) of richness (Sbats), and Shannon index (H'bats) of the bat's assemblage and non-herbaceous plants (n-hp) with the principal components of soil chemistry, Northwestern Ecuador.
Table 2.
Partial correlation coefficients (PCC) of richness (Sbats), and Shannon index (H'bats) of the bat's assemblage and non-herbaceous plants (n-hp) with the principal components of soil chemistry, Northwestern Ecuador.
| Index | Nutrient | PCC | p-value | Fixed variable |
|---|---|---|---|---|
| Sbats | K | 0.67 | 0.0359 | Sn-hp |
| Ca | 0.94 | 0.0001 | ||
| Mg | 0.78 | 0.0079 | ||
| Zn | 0.76 | 0.0112 | ||
| H'bats | K | 0.45 | 0.1896 | H'n-hp |
| Ca | 0.80 | 0.0056 | ||
| Mg | 0.76 | 0.0100 | ||
| Zn | 0.54 | 0.1092 |
Disclaimer/Publisher’s Note: The statements, opinions and data contained in all publications are solely those of the individual author(s) and contributor(s) and not of MDPI and/or the editor(s). MDPI and/or the editor(s) disclaim responsibility for any injury to people or property resulting from any ideas, methods, instructions or products referred to in the content. |
© 2025 by the authors. Licensee MDPI, Basel, Switzerland. This article is an open access article distributed under the terms and conditions of the Creative Commons Attribution (CC BY) license (http://creativecommons.org/licenses/by/4.0/).
Copyright: This open access article is published under a Creative Commons CC BY 4.0 license, which permit the free download, distribution, and reuse, provided that the author and preprint are cited in any reuse.


