
Submitted:
11 November 2025
Posted:
12 November 2025
You are already at the latest version
Abstract
Background: Triple-negative breast cancer (TNBC) is an aggressive subtype of breast cancer characterized by poor prognosis, high metastatic potential, and limited targeted therapies. Methods: This study evaluates the anticancer activity of kaempferol in two genetically and ethnically distinct TNBC models: MDA-MB-231 (Caucasian) and MDA-MB-468 (African American) cells, utilizing cell viability, cell proliferation, apoptosis, cell cycle arrest, qPCR, and Abby analysis assays. Results: Kaempferol inhibited TNBC cell viability and proliferation in a dose- and time-dependent manner, in both 2D monolayer and three-dimensional (3D) cell cultures, and induced apoptosis and S phase cycle arrest. This investigation demonstrated that kaempferol affects cancer cells by inhibiting CDK1, CDK4, CDK6, and CDK7 at both the gene and protein levels in MDA-MB-231 cells, and specifically CDK6 and CDK7 in MDA-MB-468 cells. It reduced expression of PD-L1, JAK1, STAT3, MUC-1, and NF-κB1 (p50), indicating that the underlying pathway of PD-L1 inhibition may involve targeting the JAK1/STAT3 pathway and downregulating MUC-1, while inhibiting NF-κB1 levels. Kaempferol also inhibited the overexpression of CCL2 and TGM2, which are responsible for the development of resistance to targeted therapies, such as anti-PD-L1 immunotherapy, in TNBC. Conclusion: Kaempferol acts as a multi-target modulator of CDKs and PD-L1-associated signaling in TNBC, extending prior reports of its antiproliferative and pro-apoptotic effects in MDA-MB-231 and, significantly, providing comparative evidence across MDA-MB-231 versus MDA-MB-468 models. Since the levels of PD-L1 have been previously shown to be regulated by CDKs, this study is the first to report the dual inhibitory effect of a flavonoid of natural origin on CDKs and PD-L1 levels in TNBC cells.
Keywords:
Kaempferol
; triple-negative breast cancer
; PD-L1
; CCL2
; TGM2
; CDKs
1. Introduction
Triple-negative breast cancer (TNBC) is one of the most aggressive and non-responsive subtypes regarding standard treatment options for breast cancer. TNBC tumor cells lack estrogen receptors (ER), progesterone receptors (PR), and human epidermal growth factor receptor 2 (HER-2), making them unresponsive to standard hormonal and targeted therapies. TNBC accounts for about 10-15% of all human breast cancers, and it is more aggressive than other subtypes [1]. It is more likely to occur in younger women, and most patients report recurrence and metastasis within 3 years of the first diagnosis. Among ethnic groups, African American and Hispanic women are considered high-risk groups. While the incidence is highest in Caucasians, the disease shows the worst prognosis in African American women [1].
Due to the heterogeneity of TNBC disease, therapeutic strategies that are more specific in targeting the complex interplay of cancer cells within the tumor immune microenvironment (TIME) are needed [2]. Recent advances in TNBC treatment have shifted towards targeting immune checkpoint blockade and reversing reduced T cell infiltration at the tumor site by targeting the interaction of programmed cell death protein 1 (PD-1) and programmed cell death protein ligand 1 (PD-L1) [3]. The successful clinical performance of these antibody-based immune therapies has further highlighted the possibility of targeting unique subtypes of the TIME, thereby increasing the responsiveness of immunotherapeutic treatments. This highlights the dire importance of a deeper understanding of time and the development of therapeutic approaches to overcome resistance to targeted therapies, such as immune checkpoint inhibitors [2].
Within the TIME, CCL2/MCP-1 (Chemokine (C-C Motif) Ligand 2/Monocyte Chemotactic Protein-1) is a molecule of interest for therapeutic intervention, belonging to the family of chemokines that regulates the recruitment of macrophages to the inflammatory site [4]. The CCL2-induced recruitment of macrophages to the tumor microenvironment reduces the effect of PD-L1/PD-1 inhibitors by delaying the T-cell infiltration to the tumor site. Moreover, the transcription activator of immunity and inflammation, NF-κB, has also emerged as a positive regulator of PD-L1 by binding to its promoter post-transcriptionally and modulating various pathways [5,6]. Numerous studies have linked the involvement of NF-κB to the development of resistance and a decline in immune function. With established evidence of the involvement of PD-L1 in reduced immune function and increased resistance, it becomes crucial to explore the effect of targeting NF-κB-mediated PD-L1 expression in resistant TNBC tumors [6]. Additionally, Transglutaminase-2 (TGM2), which is widely distributed in various tissues, is a transpeptidase enzyme that participates in signal transduction by activating GTPase enzymes and in protein cross-linking. It exerts its functions in both normal and inflamed as well as cancer cells [7]. TGM2 is minimally expressed in normal epithelial tissues but is upregulated in tumor cells, where it plays a role in cell survival, tumor invasion, and motility. Interestingly, TGM2 can activate the PI3K/AKT pathway, leading to increased levels of both PD-L1 and CCL2. Choi et al. (2020) reported that, in addition to inhibiting CCL2, TGM2 inhibition can also reverse the development of resistance to PD-L1 immunotherapy [7].
Considering the complexity of TIME and its essential role in cancer development and progression, natural compounds have been extensively studied for their potential anti-cancer activity, targeting multiple molecular targets to exhibit anti-inflammatory, antioxidant, and anti-proliferative effects [3]. Additionally, based on extensive literature, natural compounds are safer, more affordable, and readily available as an adjuvant therapeutic option for several types of human cancer. Kaempferol is a flavonoid of natural origin commonly found in tea, tomato, green peas, broccoli, and berries, and it has been reported to have extensive anti-cancer activity. It exhibits its anticancer effect by targeting various molecular pathways, including the cell cycle, cell proliferation, apoptosis, autophagy, and the inhibition of metastasis and angiogenesis [8,9], demonstrating its significant potential in cancer prevention and therapy.
This study aimed to explore the anticancer mechanisms of kaempferol by modulating the TIME components and demonstrate its potential for use in combination with immunotherapy to reduce treatment resistance. The experiments were conducted using genetically distinct TNBC cell lines: MDA-MB-231 and MDA-MB-468.
2. Materials and Methods
Reagents
Kaempferol purity >=98% (HPLC), Alamar Blue®, dimethyl sulfoxide (DMSO), chloroform, interferon-gamma (IFN-γ), and isopropyl alcohol were purchased from Sigma-Aldrich Co. (St. Louis, MO, USA). Fetal bovine serum heat-inactivated (FBS-HI), Dulbecco’s modified Eagle’s medium (DMEM) high glucose, penicillin/streptomycin, and phosphate-buffered saline (PBS) were purchased from Genesee Scientific (San Diego, CA, USA), and TRIzol from ThermoFisher Scientific (Wilmington, DE, USA). The SYBR Green reagent, iScript Advanced Reverse Transcriptase Kit, and specific primers were purchased from Bio-Rad (Hercules, CA, USA). The protein estimation was performed using the Bicinchoninic Acid (BCA) Protein Assay Kit (Item #23225). The Abby analysis plates and reagents were obtained from ProteinSimple (San Jose, CA, USA), and the antibodies were purchased from Cell Signaling Technology (Danvers, MA, USA). The ELISA kits for PD-L1 (Cat# ELH-B7H1-1), CCL2 (Cat# ELH-MCP1), and tumor necrosis factor-alpha (TNF-α) were purchased from RayBiotech (Norcross, Ga, USA).
Cell Culture:
TNBC cell lines MDA-MB-231 (Caucasian) and MDA-MB-468 (African American) were obtained from the American Type Culture Collection (ATCC). The cells were cultured in Dulbecco’s Modified Eagle Medium (DMEM) supplemented with 10% fetal bovine serum (FBS-HI) and 1% penicillin-streptomycin. Cells were maintained in a humidified atmosphere containing 5% CO2 at 37 °C and were subcultured in T-75 flasks until they reached 90% confluence. For experiments, the DMEM experimental medium was supplemented with 2.5% FBS-HI and lacked penicillin-streptomycin.
Cell Viability:
Cell viability was assessed in both 2D and 3D cell cultures using the Alamar Blue assay with MDA-MB-231 and MDA-MB-468 cells at varying kaempferol concentrations, ranging from 1.56 to 200 µM for 2D cell culture and from 25 to 200 μM for 3D cell culture. In the 2D cell viability assay, cells were seeded at a density of 3 × 10^4 cells/100 µL/well in a tissue culture-treated 96-well plate and treated with kaempferol the following day. They were then incubated for 24 and 48 hours. In the 3D cell viability assay, Thermo Fisher Scientific Nunclon Sphera 96-well bottom plates were used. The cells were plated at a seeding density of 3 × 10⁴ cells in 100μl/well and incubated for 48h to form spheroids. Once the spheroids were formed in 3D, the cells were treated with kaempferol concentrations (25 to 200 μM) and incubated for 24 hours. Then, the Alamar Blue solution was added to the cells and incubated for 4h. The fluorescence changes in the wells (in both 2D and 3D) were measured at an excitation/emission wavelength of 530/590 nm using an Infinite M200 microplate reader from Tecan Trading AG (Morrisville, NC, USA). The fluorescent signal was proportional to the number of viable cells in each treatment.
Cell Proliferation Assay:
Cell proliferation was assessed using the Alamar Blue assay. TNBC cell lines (MDA-MB-231 and MDA-MB-468) were seeded at a density of 5 x 10³ cells per well in tissue culture-treated 96-well plates and were incubated overnight. After 24h, the cells were treated with varying concentrations of kaempferol (3.12 to 200µM), Taxol (a standard chemotherapeutic agent), or DMSO (vehicle control) for 48, 72, and 96h. Following treatment, Alamar Blue reagent was added to each well and incubated for 4h at 37 °C and 5% CO2. Then, the absorbance of the reduced Alamar Blue was measured at excitation/emission of 530/590 nm wavelengths using an Infinite M200 microplate reader Tecan Trading AG (Morrisville, NC, USA).
Apoptosis Assay:
The Annexin/PI assay was used to analyze the induction of apoptosis in kaempferol-treated MDA-MB-231 and MDA-MB-468 cells. For the assay, cells were seeded at a density of 1 × 10⁶ cells per well in a 6-well plate and incubated overnight. The cells were then treated with different concentrations of kaempferol (12.5 to 100μM), and control cells were treated with DMSO at a concentration <0.1%. After 24 hours of incubation, the control and treated cells were trypsinized, pelleted, and washed with PBS. According to the kit’s protocol, the pelleted cells were resuspended in 500 μL of manufacturer-provided binding buffer and labeled with 5 μL of Annexin V and 10 μL of PI for 10 to 15 minutes before acquiring the samples with a Sony SH800 Cell Sorter (San Jose, CA, USA). All the samples were examined at a concentration of 1 × 10⁴ cells and analyzed by the CELLQuest software Pro/Version 5.1.
Dual Acridine Orange/Ethidium Bromide (AO/EtBr) Fluorescent Staining Assay:
The AO/EtBr assay was used to confirm the induction of apoptosis in kaempferol-treated MDA-MB-231 and MDA-MB-468 cells in both 2D and 3D cell cultures. For 2D cells, a density of 3 × 10⁴ cells/well was seeded in a tissue culture-treated 96-well plate and incubated at 37 °C in 5% CO2 for 24 h. In 3D culture, cells were seeded in ThermoFisher Scientific Nunclon Sphera 96U bottom plates at a seeding density of 3 × 10⁴ cells per well and incubated at 37 °C in 5% CO2 for 48 hours. After incubation, the cells were treated with different concentrations ranging from 25 μM to 100 μM and incubated for 24 hours. Then, 5 μL of dual fluorescent staining solution containing 100 μg/mL AO and 100 μg/mL EB (AO/EB, Sigma, St. Louis, MO) was added to all the wells and washed five times with PBS. The fluorescent staining was then analyzed using an Olympus Cell Sens Standard Cytation 5 cell Imaging reader (BioTek Instruments, Inc., Winooski, VT, USA).
Cell-Cycle Assay:
The effect of kaempferol on DNA content and cell cycle distribution was assessed using a cell cycle arrest assay. The TNBC cells were seeded in T-25 flasks and treated with different concentrations of kaempferol (3.125 µM to 50 µM) the following day. The cells were then harvested after a 24-hour incubation, and the cell pellets were collected. The cells were resuspended and fixed using ice-cold PBS and 70% ethanol. Following this, the cell pellets were gently resuspended in 300 µl of propidium iodide (PI) + RNase staining solution, followed by incubation at 37 °C in the dark for 30 min. The cell samples were then analyzed using a Sony SH800 Cell Sorter (San Jose, CA, USA) flow cytometer to investigate the distribution of cells across different cell cycle phases.
qPCR: The iScript advanced reverse transcriptase enzyme from Bio-Rad was used for cDNA synthesis, and RT-PCR was performed using target genes underlying cell cycle arrest. Briefly, the cells were seeded in T-75 flasks followed by incubation for 24h, and treated with DMSO, kaempferol at concentrations of 25µM and 50μM for MDA-MB-231 and MDA-MB-468 cells, respectively, TNF-α (50 ng/mL) or IFN-γ (100 ng/mL), and co-treated with kaempferol + TNF-α (50 ng/mL) or IFN-γ (100 ng/mL), according to each experiment. In the case of co-treatment with kaempferol and TNF-α or IFN-γ, the cells were pre-treated for 1 hour before treatment with kaempferol. After incubation for 24h, the cells were harvested and pelleted. The cell pellets were then processed for RNA isolation using the TRIzol method. The isolated RNA was quantified using a Nanodrop, and the cDNA strands were synthesized using iScript Advanced Transcriptase based on the RNA concentration. In this, the 5X iScript advanced reaction mix, reverse transcriptase, sample RNA, and water were combined in a 0.2 mL tube, and the reverse transcription reaction was performed using the thermocycler at 46 °C for 20 min and 95 °C for 1 min in 40 cycles. For RT-PCR amplification, a SYBR Green kit was used, and the obtained cDNA was amplified according to the protocol, using primers specific to the gene of interest. The mixture of cDNA, SYBR green, master mix, and water was processed on the Bio-Rad CFX96 Real-Time System (Hercules, CA, USA). The thermal cycling protocol included an initial holding step at 95 °C for 2 min and denaturation at 95 °C for 15 sec, followed by 40 cycles of 60 °C for 30 sec (annealing/extension) and 60 °C for 5 sec/step (melting curve). The information about primers used is provided in Supplementary 1.
Abby Protein Analysis: To determine the protein expression, the cells were treated with TNF-α, kaempferol, and the co-treatment of both kaempferol and TNF-α. For the co-treatment, the TNF-stimulated cells were treated with different concentrations of kaempferol 1h after the addition of TNF-α. After 24h of incubation, the cells were harvested, washed, and pelleted. A protease inhibitor-containing lysis buffer was added to these pellets, and the cells were then sonicated and centrifuged. The supernatant was subsequently collected. The samples were then analyzed for protein concentration using the bicinchoninic acid (BCA) Protein Assay Kit, according to the manufacturer’s protocol. Protein expression was obtained with the automated AbbyTM ProteinSimple (San Jose, CA, USA). The analysis was performed using plates and reagents provided by ProteinSimple, and the protein samples and antibodies were optimized by testing different concentrations and dilutions. Protein samples were diluted with 0.1x sample buffer to achieve a final concentration of 1 to 2mg/mL total protein. The samples were heated at 95 °C for 5 minutes. Then, the primary antibody (dilution 1:125), secondary antibody, chemiluminescent substrate, blocking solution, and separation and stacking matrices were all added to the assigned wells as per the manufacturer’s protocol. The microplate was then placed in the AbbyTM instrument, and the fully automated electrophoresis and immunodetection were performed. The camera in the device detected chemiluminescence and digital images. The details of the antibodies used are provided in Supplementary 1, and the uncropped virtual blots are presented in Supplementary 2. The protein expression was normalized to β-actin as a loading control, and normalization calculations were performed using ProteinSimple Compass software version 6.3.0.
Statistical Analysis: The data were presented as mean ± SEM from at least three independent experiments for all the assays. Data were analyzed using GraphPad Prism (version 9.4.1), and statistical significance was determined using one-way ANOVA followed by Dunnett’s multiple comparisons test (*p < 0.05, **p < 0.01, ***p < 0.001, ***p < 0.0001, ns = not significant). Gene expression was quantified using CFX 3.1 Manager software (Bio-Rad), and protein expression was analyzed with Compass software (ProteinSimple).
3. Results
Kaempferol inhibits cell viability and growth:
The cell viability assay was performed using the Alamar Blue assay in 2D (24 and 48 hours) and 3D (24 hours) cell cultures. The cells were treated with different concentrations of kaempferol and the control (DMSO). A dose-response curve was observed with increasing concentrations of kaempferol. In the 2D culture for MDA-MB-231 cells, there was no significant difference in cell viability between the control and the lowest kaempferol concentration of 1.56 μM. However, there was a significant difference in the percentage of viable cells between 3.12 μM and 200 μM of kaempferol compared to the control (Figure 1a). Similarly, in 3D cell culture for MDA-MB-231 cells, kaempferol exhibited a dose-response effect on cell viability. There was no significant difference in the % of cell viability between 25μM and control; however, concentrations from 50μM to 200μM showed a dose-dependent inhibition of cell viability (Figure 1b). Likewise, in the 2D cell culture of MDA-MB-468 cells, there was no significant change in the % of cell viability between control and 1.56μM of kaempferol, but there was a significant dose-dependent response from 3.12μM to 200μM of kaempferol as compared to control (Figure 1d). In the 3D cell culture of MDA-MB-468 cells, all the concentrations of kaempferol from 25μM to 200μM showed a significant dose-dependent decrease in the cell viability compared to the control (Figure 1e). The IC50 for MDA-MB-231 cells in 3D cell culture was approximately 1.5x higher (63.08μM ± 3.4μM) than in 2D cell culture (43.86μM ± 0.83μM at 24h). Similarly, the IC50 calculated for MDA-MB-468 cells in 3D cell culture (61.18μM ± 1.30μM) was also approximately 1.5x higher than in 2D cell culture (48.47μM ± 0.4μM), as expected. The IC50 values in 2D cell culture indicated that MDA-MB-231 cells are more sensitive to kaempferol than MDA-MB-468 cells at 24h and 48h. In 3D cell culture, the cells were equally sensitive to kaempferol, as indicated by the IC50; however, the 468 cells were more sensitive at the lower concentration of 25 µM.
The cell proliferation assay was conducted using Alamar Blue to assess the potential of kaempferol to inhibit the growth of both cell lines compared to the standard chemotherapeutic drug Taxol at a concentration of 1 μM. The antiproliferative activity of kaempferol was analyzed based on the ability of cells to reduce resazurin after incubation with kaempferol for 48, 72, and 96h, and compared to Taxol. The analysis revealed a dose-dependent decrease in cell proliferation in both cell types, with kaempferol concentrations ranging from 3.12 μM to 200 μM. Kaempferol exhibited anti-proliferative effects similar to those of Taxol at 3.12 μM and higher for MDA-MB-231 cells (Figure 1c) and at 12.5 μM and higher for MDA-MB-468 cells (Figure 1f).
Kaempferol induces apoptosis.
The annexin V-FITC assay was used to assess the kaempferol-mediated induction of apoptosis in MDA-MB-231 and MDA-MB-468 cells. The cells were analyzed 48 hours after treatment, and a flow cytometer was used to quantify the level of apoptosis. In MDA-MB-231 cells, kaempferol showed induction of apoptosis from 12.5μM to 100μM (from 41.93% to 58.74%) (Figure 2a-2f). However, in MDA-MB-468 cells, the induction of apoptosis was observed at kaempferol concentrations between 25 μM and 100 μM (from 26.51% to 39.50%), respectively (Figure 2g-2l). Overall, kaempferol showed an apoptotic effect in MDA-MB-231 cells at a concentration lower than in MDA-MB-468 cells.
Effect of kaempferol on dual acridine orange/ethidium bromide (AO/EtBr) fluorescent staining assay
The acridine orange/ethidium bromide (AO/EtBr) staining-based fluorescent assay was used to assess the effect of different concentrations of kaempferol (12.5 µM to 50 µM) on inducing apoptosis in 2D and 3D cell cultures, employing MDA-MB-231 and MDA-MB-468 cells. The green fluorescence indicated healthy cells, and the red or orange colored fluorescence indicated apoptotic or early necrotic cells. The merged green fluorescence and orange fluorescence showed an increase in the induction of apoptosis in both 2D and 3D cell cultures. In MDA-MB-231 cells, kaempferol treatment showed a significant decrease in the green, fluorescent cells from 25μM to 100µM (Figure 3—MDA-MB-231 a to x). Similarly, in MDA-MB-468 cells, kaempferol treatment induced apoptosis at concentrations above 25 µM, as compared to the control cells in both 2D and 3D cell cultures (Figure 3—MDA-MB-468 a to x). The results correlate with the ones obtained from the flow cytometry-based apoptosis assay.
Kaempferol induces cell cycle arrest
A range of concentrations from 3.12 μM to 50 μM was used to investigate the effect of kaempferol on cell cycle arrest at 48 hours in both MDA-MB-231 and MDA-MB-468 cells. The cell distribution among different cell cycle phases was analyzed using a Sony SH800 cell sorter and flow cytometer. In MDA-MB-231 cells, kaempferol induced a significant cell cycle arrest at the S phase at concentrations of 12.5 μM and 25 μM, compared to the control cells, with a significant decrease in the cell number in the G2 phase. At the lower concentrations of 3.12 and 6.25 μM, as well as the highest concentration of 50 μM, there was no statistically significant difference compared to the control (Figure 4a-4f). In MDA-MB-468 cells, a significant increase in the number of cells in the S phase was observed with 25 μM and 50 μM of kaempferol compared to the control cells (Figure 4g-4l). This change in the S phase was also accompanied by a significant concentration-dependent decrease in the percentage of cells in the G1 phase, from 12.5 μM to 50 μM, compared to the control cells. Overall, in both cell lines, kaempferol induced cell cycle arrest at the S phase of the cell cycle. MDA-MB-231 cells were more sensitive to kaempferol, causing arrest at 12.5 μM, compared to 25 μM in MDA-MB-468 cells.
Kaempferol modulates the mRNA and protein expression of CDKs
To further evaluate the effect of kaempferol on cell cycle in TNBC cells and determine the effect of kaempferol against mRNA expression of CDKs, the mRNA expression levels of CDK1, CDK2, CDK4, CDK6, and CDK7 were quantified by RT-PCR, and the protein expression of CDK1 and CDK7 was analyzed using Abby expression analysis. The effect of kaempferol on the mRNA expression of CDKs was studied using RT-PCR with individual primers for CDK1, CDK2, CDK4, CDK6, and CDK7. In MDA-MB-231 cells, co-treatment of kaempferol and TNF-α significantly downregulated the mRNA levels of CDK1 (4x fold), CDK7 (8.3x fold), CDK4 (1.2x fold), and CDK6 (1.9x fold) compared to TNF-α only treated cells (Figure 5a-5e). The effect of TNF-α stimulation and kaempferol treatment was also analyzed for the mRNA expression levels of CDK2. However, there was no significant stimulation of CDK2 mRNA levels after TNF-α treatment. The co-treatment of TNF-α and kaempferol resulted in CDK2 levels higher than those of the control (Figure 5b). In MDA-MB-468 cells, the results showed that stimulation with TNF-α induced the expression of CDK6 and CDK7 (Figure 5q and 5r) significantly compared to the control. While in MDA-MB-468 cells, the co-treatment of TNF-α and kaempferol significantly inhibited the expression of CDK6 (1.9x fold) and CDK7 (2.1x fold) at mRNA levels (Figure 5n and 5r), as compared to the TNF-α only treated cells. Conversely, TNF-α stimulation did not induce the expression of CDK1, CDK2, and CDK4. However, with the co-treatment of TNF-α and kaempferol, only CDK1 showed levels lower than those of the control.
Based on the RT-PCR results, CDK1, CDK4, CDK6, and CDK7 were selected for further investigation at the protein level. In the MDA-MB-231 cells, the co-treatment of TNF-α and kaempferol decreased the CDK1 protein expression by 2.5x fold, CDK4 by 1.25x fold, CDK6 by 2x, and CDK7 by 3x fold, compared to cells treated with TNF-α only (Figure 5f-5m). In the MDA-MB-468 cells, the co-treatment inhibited CDK6 protein levels by 1.25x fold (Figure 5w and 5x) and CDK7 by 1.2x fold (Figure 5y and 5z), compared to the cells treated with TNF-α only. However, with CDK1 and CDK4, the co-treatment showed no statistically significant difference compared to TNF-α only (Figure 5s and 5t; 5u and 5v). Overall, the protein level results confirm those at the gene level, demonstrating kaempferol’s ability to modulate different CDKs and its differential effects on both cell lines.
Effect of kaempferol on mRNA expression and protein release of PD-L1and its inducers
To investigate the effect of kaempferol on the mRNA expression and protein release of PD-L1, RT-PCR assay using a specific primer and an ELISA kit for PD-L1 were performed. The data showed that the stimulation with IFN-γ significantly induced the levels of PD-L1 mRNA expression (about 20-fold in both cell lines (Figure 6a and 6h). It also showed a significant increase in protein release (about 12-fold) as compared to the control in both MDA-MB-231 and MDA-MB-468 cells (Figure 6b and 6i). The co-treatment of IFN-γ and kaempferol showed significant downregulation in the mRNA expression of PD-L1 (about 4-fold) in both cell lines. Similarly, the co-treatment showed significant downregulation of PD-L1 protein release in MDA-MB-231 (2-fold) (Figure 6a-6b) and MDA-MB-468 (2.5-fold) cells (Figure 6h and 6i), compared to IFN-γ stimulation alone. Therefore, the data show that kaempferol significantly inhibited the expression of PD-L1 at both mRNA and protein levels in TNBC cells.
The effect of kaempferol on inducers of PD-L1 expression was analyzed using an RT-PCR assay with specific primers for JAK1, STAT3, MUC-1, NF-κB1, and NF-κB2. The treatment with IFN-γ significantly induced the expression of all genes, except for NF-κB2, in both MDA-MB-231 and MDA-MB-468 cells. The co-treatment of kaempferol and IFN-γ in MDA-MB-231 cells prompted a statistically significant decrease in the mRNA expression of JAK1, STAT3, MUC-1, and NF-κB1, as compared to the IFN-γ treatment alone (Figure 6c to 6g). In MDA-MB-468 cells, the co-treatment of IFN-γ and kaempferol resulted in a significant decrease in the mRNA expression of JAK1, STAT3, and NF-κB1; however, the change in MUC-1 levels was not significant (Figure 6j-6n). Overall, the treatment of kaempferol revealed that the reduction of PD-L1 expression in both TNBC cell lines may be mediated via the JAK1/STAT3 signaling pathway and by the inhibition of MUC-1 levels and NF-κB1, which are involved in the transcription activation of PD-L1.
Kaempferol reduced CCL2 and TGM2 mRNA expression and protein release of CCL2.
The effect of kaempferol on CCL2 and TGM2 mRNA expression, as well as on the CCL2 protein release level, was investigated using specific primers and a CCL2 ELISA kit. The treatment with TNF-α successfully stimulated CCL2 and TGM2 mRNA expression and CCL2 protein release levels in MDA-MB-231 and MDA-MB-468 cells, compared to the control (Figure 7a-7f). The co-treatment of TNF-α and kaempferol significantly reduced CCL2 (2-fold) and TGM2 (3-fold) mRNA expression levels and protein release (5-fold) in MDA-MB-231 cells, as compared to the TNF-α treatment alone (Figure 7a, 7b, and 7e). In MDA-MB-468 cells, the co-treatment significantly decreased the CCL2 (2.8-fold) and TGM2 mRNA expression (2.3-fold), and CCL2 protein release levels (5-fold) (Figure 7c, 7d, and 7f). The data show that kaempferol is more effective in inhibiting CCL2 mRNA expression levels in MDA-MB-468 compared to MDA-MB-231 cells and has a similar downregulatory effect on CCL2 protein release levels in both TNBC cell lines.
4. Discussion
The role of TIME in TNBC development, progression, and treatment outcomes has garnered considerable attention in the last few decades [10]. Recent studies have shown the potential of natural compounds, specifically flavonoids, in modulating the TIME by modulating ROS-scavenging enzyme activities, inducing cell cycle arrest, promoting apoptosis, modulating autophagy, suppressing proliferation and invasiveness of cancer cells, and altering signaling pathways that are overactivated during the development and progression of cancer [11]. The flavonoid kaempferol has been primarily studied in MDA-MB-231 cells, which exhibit diverse molecular anticancer targets. Kaempferol has been demonstrated to target oxidative stress and inflammatory pathways, inducing apoptosis, autophagy, and cell cycle arrest, which provides insight into the effect of kaempferol on specific targets that could help overcome the drug resistance observed with current immunotherapies. However, little is known about its anticancer effects on MDA-MB-468 cells, which could have a significant impact, as the patient’s genetic tumor profile diversity has been proposed to contribute to TNBC disparities. This could help evaluate how genetically different cells may respond to kaempferol’s treatment [12].
The data of this study showed that kaempferol exhibits cytotoxic and anti-proliferative effects in both MDA-MB-231 and MDA-MB-468 cells. This anti-proliferative effect observed in MDA-MB-231 cells is consistent with a study that also demonstrated a dose-dependent decrease in proliferation [13]. However, the IC50 values of both TNBC cells in 2D cell culture at 24 hours and 48 hours showed that MDA-MB-231 cells were more sensitive to kaempferol treatment than MDA-MB-468 cells. Conversely, in 3D cell culture, both cell lines exhibited equal sensitivity to the compound. Moreover, the cell proliferation assay showed a dose-dependent decrease in cell growth for both cell lines at 48, 72, and 96 hours. Additionally, it was observed that kaempferol produced a similar antiproliferative effect to the standard drug Taxol, albeit at lower concentrations, in MDA-MB-231 cells compared to MDA-MB-468 cells. The cell antiproliferative effect of kaempferol demonstrates its potential to inhibit the aggressive tumorigenic nature of TNBC cells, thereby preventing them from proliferating, growing, and translating to disease aggressiveness [14,15,16].
Cell cycle regulators mediate the processes of cell proliferation and apoptosis. The misregulation of cell cycle checkpoints leads to the induction of apoptotic cell death, characterized by DNA and nuclear fragmentation, mRNA decay, chromatin aggregation, and the formation of apoptotic bodies. The alterations in apoptosis in cancer cells due to genetic mutations lead to uncontrolled cell proliferation, an increase in tumor mass, invasion, and metastasis [17]. Multiple studies have demonstrated that kaempferol induces apoptosis, a key mechanism underlying its anti-cancer effects. In another study, authors reported that kaempferol induces the activation of caspase-9 and caspase-3 and increases γ-H2AX in MDA-MB-231 TNBC cells [13]. Similar findings, showcasing the induction of apoptosis and evaluation of apoptotic markers with kaempferol treatment, have been reported in other human cancer cells as well [18,19,20]. In this study, an apoptosis assay was performed in both TNBC cell lines. The results showed that kaempferol induced a significant increase in the percentage of apoptotic cells at concentrations of 12.5 μM and above in MDA-MB-231 cells. However, in the MDA-MB-468 cells, an increase in the number of apoptotic cells was observed at concentrations of 25 μM and above. Further, the induction of apoptosis in 2D and 3D cell cultures was confirmed using AO/EtBr staining assay. The results showed the induction of apoptotic cell death in both cell types, where kaempferol treatment increased the number of dead cells as the concentration of the compound was increased in both 2D and 3D cell cultures. Moreover, this study showed that kaempferol induced cell cycle arrest at the S phase of the cell cycle in both cell lines. The effect was observed between the concentrations of 12.5 μM and 25 μM in MDA-MB-231 cells, while in MDA-MB-468 cells, the arrest was observed at concentrations of 25 μM and 50 μM, indicating a different response from the cell lines studied.
Meanwhile, the progression of the cells through different phases in the cell cycle is controlled by cyclin-dependent kinases (CDKs) [21]. Most of these CDKs are found to be upregulated in cancer tissues, leading to the dysregulation of the cell cycle machinery [22]. The prominent CDK4/6 and their associated Cyclin D proteins are involved in the transition of the cell cycle from the G1 phase to the S phase. The FDA has approved three different CDK4/6 inhibitors to treat ER+/HER-2 breast cancer, but these treatments have inefficient results in TNBC [23]. Apart from CDK4/6, CDK2 is also involved in the progression of cells through the G1, S, and G2 phases, with the aberrant activation of CDK2 being associated with CDK4/6 inhibitors in HER2-responsive breast cancers [24].
Additionally, the overexpression and dysregulation of CDK1 in human cancers support the prospect of targeting CDK1 as a potential therapeutic target [22,25]. In the present study, the effect of kaempferol on the overexpression of CDKs, including CDK1, CDK2, CDK4, CDK6, and CDK7, was evaluated. The TNF-mediated activation of CDKs was used to replicate the pathological levels of CDKs in the TNBC cells. Kaempferol treatment significantly downregulated the mRNA levels of CDK1, CDK6, and CDK7 in the MDA-MB-231 cells, and only CDK6 and CDK7 were downregulated in MDA-MB-468 cells. At the protein level, CDK1 and CDK7 confirmed the results observed in transcription levels in MDA-MB-231 cells; however, in MDA-MB-468 cells, only CDK7 showed decreased levels. According to the literature, CDK7 has also emerged as a promising target in different molecular types of breast cancer, including TNBC. Unlike other CDKs, CDK7 functions as a transcription regulator, initiating transcription by phosphorylating RNA polymerase II [21]. The CDK7 inhibition and its combinatorial therapy with estrogen therapy are considered an effective strategy in overcoming the treatment resistance [26]. Therefore, this study’s findings demonstrate kaempferol’s potential to inhibit CDK1 and CDK7, highlighting it as an important strategy in TNBC treatment. Notably, the differences observed between mRNA and protein expression, particularly for CDK1 and CDK7, in our study can be attributed to regulatory checkpoints downstream of transcription [27,28,29]. In studies by Vogel et al. and Schwanhäusser et al. the authors have demonstrated that CDK protein levels are heavily shaped by translation efficiency, phosphorylation-dependent stabilization/degradation, ubiquitin–proteasome turnover, and cyclin partner assembly [27,29]. For example, stabilizing CDK1–Cyclin B complexes, or TFIIH-associated CDK7 in its CAK module, can preserve protein pools even when transcript levels are suppressed [27]. Additionally, polyphenols, including kaempferol, can also influence the ubiquitin–proteasome system, altering the degradation of specific proteins [30,31,32]. For instance, kaempferol promoted Ubiquitin-Proteasome System (UPS)-mediated degradation of DNA methyltransferase 3B (DNMT3B), which can result in mRNA–protein mismatches [32,33]. These post-transcriptional and post-translational mechanisms have the potential to contribute to the mRNA–protein divergence seen in this study.
Furthermore, the pan CDK inhibitors and CDK4/6 inhibitors have also been associated with significant systemic toxicity in various human cancers, especially in hormone-responsive, HER-2 negative, and metastatic breast cancer [34,35]. The poor selectivity and high toxicity towards normal cells have prevented various CDK inhibitors from progressing to clinical use [34]. Further research led to the development of novel, selective CDK inhibitors, including CDK4/6 inhibitors, which were reported to have little or no toxicity towards normal human cells. The newer CDK inhibitors, including CDK7 and CDK9 inhibitors, have also been reported to be less sensitive or have no effect on MCF-10a, the normal breast epithelial cells [36,37].
Interestingly, kaempferol has also been evaluated in normal human breast epithelial cells. A study showed that kaempferol prevented tumorigenesis in an in vitro model of 17β-estradiol-treated MCF-10A cells and in vivo model of N-methyl-N-nitrosourea (NMU)-induced breast cancer as compared to the control [38]. Consistent with this, kaempferol, when delivered as a niosome-encapsulated formulation, exhibited potent cytotoxic and anti-metastatic effects in MCF-7 cells but no significant toxicity in normal MCF-10A breast epithelial cells at the IC50 doses for MCF-7 cells [39]. In addition, most of the toxicities observed with CDK inhibitors, particularly the early pan-CDK inhibitors, were seen predominantly in hormone-responsive breast cancer subtypes. This ultimately led to the development of newer CDK inhibitors, which are now FDA-approved for patients with ER-positive and HER2-negative breast cancer [34,40]. Also, their efficacy in TNBC remains uncertain due to the associated development of resistance. Consequently, combining CDK inhibitors with other targeted therapies is being actively explored as a strategy to improve treatment outcomes [34,40], and hopes of overcoming resistance [40,41]. Precisely, the ability to target multiple CDKs in TNBC gives us a real opportunity to explore it as part of combination strategies, either with other targeted therapies or even alongside synthetic CDK inhibitors.
Moreover, CDK inhibition in TNBC has also been reported to prime TNBC for better outcomes with anti-PD-L1-based therapies. The combinatorial approach of CDK inhibitors and PD-L1 inhibitors reveals that CDK inhibition at a suboptimal dose promotes immune cell infiltration into the tumor cells and may complement anti-PD-L1-based immunotherapy [42]. The PD-L1 level abundance has been reported to be regulated by CyclinD/CDK4/CDK6, and the inhibition of CDKs with specific inhibitors can increase the PD-L1 levels [43,44]. In another study, authors reported that inhibition of CDKs, including CDK2, CDK4, CDK6, and CDK7, enhances the efficacy of PD-L1 inhibitors. The evaluation of the combinatory effect of CDK4/6 inhibitor (Abemaciclib), CDK2 inhibitor (Fedraciclib), and CDK7 inhibitor (Samuracciclib) on the efficacy of anti-PD-L1 immunotherapy in their in-vitro and in-vivo xenograft models of MDA-MB-231 and 4T1 cells [41] showed that the combination of CDK4/6 inhibitor and CDK7 inhibitor with anti-PD-L1 immunotherapy respectively, significantly inhibited tumor growth in the xenograft models [41].
In the tumor microenvironment, PD-L1 binds to its receptor, PD-1, inhibiting T-cell activation and is considered a key contributor to immune resistance. The anti-PD-L1/PD-1 antibodies intervene in the effect of these tyrosine kinases, leading to the effective activation of downstream signaling involved in the proliferation and differentiation of cytotoxic CD8+ T cells [45]. Numerous studies have evaluated the clinical performance of anti-PD-1 and anti-PD-L1 inhibition, yielding excellent results; however, the complex nature of the heterogeneous disease presents challenges, including the development of resistance and adverse events [45]. The anti-PD-L1/PD-1 immunotherapies, such as pembrolizumab and atezolizumab, have shown significant anti-tumor responses, a favorable safety profile, and prolonged progression-free survival in PD-L1-positive metastatic TNBC [46,47]. However, PD-L1 inhibitors are still considered ineffective, and more effective therapeutic strategies are needed to address the development of resistance in TNBC [45]. The current study evaluated the ability of the flavonoid kaempferol to modulate the levels of PD-L1 and its potential to reverse the development of resistance. To replicate the pathological levels of PD-L1 in TNBC, MDA-MB-231 and MDA-MB-468 cell lines were treated with IFN-γ, which physiologically is secreted by CD8+ T cells to induce PD-L1 expression [48,49,50]. Following the activation of CD8+ T cells, the released IFN-γ binds to its receptors and activates the JAK/STAT signaling pathway, leading to the activation of IRF-1 and the induction of PD-L1 expression on tumor cells, as reported in various human cancer models [48,49,50]. The present investigation demonstrated that when IFN-γ-activated TNBC cells were treated with kaempferol, it significantly inhibited PD-L1 levels. Moreover, the effect of kaempferol on the IFN-γ-mediated JAK1/STAT3 signaling pathway was investigated to gain a better understanding of how the compound affects the downstream signaling associated with PD-L1 upregulation. The results showed that kaempferol treatment inhibited the mRNA levels of JAK1 and STAT3. Multiple studies have demonstrated the crucial role of the JAK/STAT3 pathway in enhancing the efficacy of PD-L1 immune checkpoint inhibition in various human cancers [51,52,53]. To further advance the effect of kaempferol on the molecular mechanisms involved in inhibiting the PD-L1, the compound’s effect on the levels of Mucin 1 (MUC-1) was also investigated. The transmembrane terminal subunit of MUC-1 (MUC-1-C) functions as an oncoprotein, and its gene amplification is linked to 40% of breast cancers [54]. MUC-1 in breast cancer cells is hypo-glycosylated, apically localized, and aberrantly expressed on more than 90% of the breast cancer cell membranes. The MUC-1-C subunit of MUC-1 activates the β-catenin/MYC, NF-κB pathway, and PI3/AKT signaling pathways. MUC-1 binds to p65 NF-κB subunit and forms MUC-1/p65 transcriptionally activated complex. This activation causes NF-κB to enhance MUC-1 expression further, thereby forming a self-sustaining loop between MUC-1 and NF-κB [6,54]. The present study demonstrated that kaempferol treatment downregulates the mRNA expression of MUC-1 and NF-κB1 (p50) in both MDA-MB-231 and MDA-MB-468 cells, indicating that the inhibition of PD-L1 levels in TNBC cells may occur via the inhibition of MUC-1 and subsequent reduction in NF-κB1 (p50) expression. Therefore, kaempferol’s effect on the JAK/STAT pathway, as well as its inhibitory effects on MUC-1 and NF-κB1 expressions, indicates the potential of this compound to reverse the reduced tumor infiltration of T cells in the TIME.
NF-κB activation is also involved in the development of inflammation through the transcription of various chemokines, such as CXCL2, CCL2, and IL-1β, which are involved in the recruitment of myeloid cells to the site of inflammation [55,56]. CCL2, specifically, is a potent initiator of inflammation and is a chemokine attractant involved in the recruitment of macrophages within the TIME [57]. The neutralization of CCL2 with antibodies in the xenograft model of human breast cancer using 4T1 cells and MDA-MB-231 cells resulted in a decrease in tumor growth and metastasis [4,9]. Similarly, in the xenograft mouse models of breast cancer, the silencing of the CCL2 gene resulted in reduced tumor growth and metastasis [4]. CCL2 is also linked to blocking the CD8+ T cell infiltration into the tumor cells by binding to its CCR2 receptor on the T cell surface [7]. The oncogenic pathways, including NF-κB and PI3K/AKT activation, involved in the induction of PD-L1 expression and resistance to PD-L1 immune-checkpoint inhibitors, have been reported to induce the expression of CCL2 [7]. Another study also suggested that transglutaminase 2 (TG2), a post-translational modification enzyme, induces the expression of both PD-L1 and CCL2 by activating the NF-κB and PI3K/AKT pathways. They demonstrated that TG2 also induced PD-L1 immune checkpoint inhibitor resistance when evaluated in the presence of a PD-L1 inhibitor, indicating that CCL2 plays a role as another prominent regulator of resistance development, in addition to PD-L1 [7]. In the present study, kaempferol treatment in TNF-α-stimulated cells resulted in a significant decrease in the mRNA levels of CCL2 in MDA-MB-231 and MDA-MB-468 cells. This finding suggests that kaempferol may inhibit the levels of CCL2 and PD-L1, potentially enhancing the efficacy of current PD-L1 inhibitors and preventing the development of resistance.
TGM2, a multi-functional GTP enzyme overexpressed in various human cancers, is an oncogene that has also been reported to contribute to metastasis and the development of drug resistance. TGM2 was reported to be overexpressed in PD-L1 and TNBC cells [58]. A 2020 study demonstrated that NFκB and PI3K/AKT activation induced by TGM2 is responsible for increased levels of PD-L1 [7]. Elevated levels of TGM2, PD-L1, and CCL2 have also been reported in the TNBC patients. Due to the increased expression of TGM2 and CCL2, along with PD-L1, in TNBC cells, the blockade of PD-1/PD-L1 immune checkpoints with immunotherapy develops resistance through the evasion of the T cell immune response mediated by TGM2-induced CCL2 levels [58]. TGM2 has emerged as a novel diagnostic marker and can be used as a target to overcome resistance to PD-1/PD-L1 inhibitors [7]. In this study, kaempferol significantly downregulated the levels of TGM2 in both MDA-MB-231 and MDA-MB-468 cells, demonstrating that the simultaneous inhibition of PD-L1, CCL2, and TGM2 with kaempferol may be a novel strategy in adjuvant therapy to overcome treatment resistance in TNBC (Figure 8).
5. Conclusions
This study presents the molecular mechanisms by which the flavonoid kaempferol modulates the TIME by targeting multiple molecules and different signaling pathways. The data show that kaempferol presents cytotoxic and antiproliferative effects, induces apoptosis, and promotes cell cycle arrest at the S phase. Kaempferol also inhibited CDK1, CDK4, CDK6, and CDK7 in MDA-MB-231 cells and CDK6 and CDK7 in MDA-MB-468 cells at both the gene and protein levels, indicating that the compound could help improve the poor outcomes observed in TNBC associated with the overexpression of CDKs. Moreover, the data demonstrate that kaempferol shows significant inhibition of the mRNA and protein levels of PD-L1 in both TNBC cell lines. The underlying pathway may involve targeting the JAK1/STAT3 pathway, as well as downregulating the expression of MUC-1 and NF-κB1 (p50). While inhibiting NF-κB1 levels, kaempferol also inhibited the overexpression of CCL2 and TGM2, which are responsible for the development of resistance to targeted therapies, such as anti-PD-L1 immunotherapy, in TNBC. This presents convincing evidence for further evaluation of kaempferol as an adjuvant therapy to overcome the development of treatment resistance in TNBC. Since the levels of PD-L1 have been previously shown to be regulated by CDKs, this study demonstrates that kaempferol inhibits PD-L1 expression. Therefore, the current study is the first to report the dual inhibitory effect of a flavonoid of natural origin on CDKs and PD-L1 levels in TNBC cells. In conclusion, this study describes kaempferol’s anticancer effects through TIME modulation via various molecular mechanisms and targets, which may be essential in developing more effective combined therapies against TNBC.
Author Contributions
Conceptualization: S.K., P.M., and K.F.A.S.; manuscript draft: S.K. and P.M.; figure creation and design: S.K.; review and editing: P.M., S.D.M., and K.F.A.S.; funding acquisition: K.F.A.S.; project administration: K.F.A.S.; resources: K.F.A.S.; supervision: K.F.A.S. All authors have read and agreed to the published version of the manuscript.
Funding
The research reported on this project was supported by the National Institute on Minority. Health and Health Disparities of the National Institutes of Health under Award Number U54 MD007582.
Conflicts of Interest
The authors declare no conflicts of interest.
References
- Almansour, NM. Triple-Negative Breast Cancer: A Brief Review About Epidemiology, Risk Factors, Signaling Pathways, Treatment, and Role of Artificial Intelligence. Front Mol Biosci. 2022 Jan 25; 9:836417. [CrossRef]
- Guo Z, Zhu Z, Lin X, Wang S, Wen Y, Wang L, et al. Tumor microenvironment and immunotherapy for triple-negative breast cancer. Biomark Res. 2024 Dec 31; 12:166. [CrossRef]
- Kumar S, Gupta S, Chandra Gupta S. Editorial: Targeting triple negative breast cancer by natural compounds. Front Pharmacol. 2023 Mar 17; 14:1172245.
- Fang WB, Yao M, Brummer G, Acevedo D, Alhakamy N, Berkland C, et al. Targeted gene silencing of CCL2 inhibits triple-negative breast cancer progression by blocking cancer stem cell renewal and M2 macrophage recruitment. Oncotarget. 2016 Jun 7;7(31):49349–67. [CrossRef]
- Mittendorf EA, Philips AV, Meric-Bernstam F, Qiao N, Wu Y, Harrington S, et al. PD-L1 Expression in Triple-Negative Breast Cancer. Cancer Immunol Res. 2014 Apr;2(4):361–70.
- Antonangeli F, Natalini A, Garassino MC, Sica A, Santoni A, Di Rosa F. Regulation of PD-L1 Expression by NF-κB in Cancer. Front Immunol. 2020 Nov 25; 11:584626. [CrossRef]
- Choi J, Lee HJ, Yoon S, Ryu HM, Lee E, Jo Y, et al. Blockade of CCL2 expression overcomes intrinsic PD-1/PD-L1 inhibitor-resistance in transglutaminase 2-induced PD-L1-positive triple-negative breast cancer. Am J Cancer Res. 2020 Sep 1;10(9):2878–94.
- Li S, Yan, Ting, Deng, Rong, Jiang, Xuesong, Xiong, Huaping, Wang, Yuan, et al. Low dose of kaempferol suppresses the migration and invasion of triple-negative breast cancer cells by downregulating the activities of RhoA and Rac1. OncoTargets Ther. 2017 Oct 3;10(null):4809–19. [CrossRef]
- Kaur S, Mendonca P, Soliman KFA. The Anticancer Effects and Therapeutic Potential of Kaempferol in Triple-Negative Breast Cancer. Nutrients. 2024 Jul 23;16(15):2392. [CrossRef]
- Salemme V, Centonze G, Cavallo F, Defilippi P, Conti L. The Crosstalk Between Tumor Cells and the Immune Microenvironment in Breast Cancer: Implications for Immunotherapy. Front Oncol [Internet]. 2021 Mar 11 [cited 2025 Feb 17];11. Available from: https://www.frontiersin.org/journals/oncology/articles/10.3389/fonc.2021.610303/full. [CrossRef]
- Rodríguez-García C, Sánchez-Quesada C, J Gaforio J. Dietary Flavonoids as Cancer Chemopreventive Agents: An Updated Review of Human Studies. Antioxid Basel Switz. 2019 ;8(5):137. [CrossRef]
- Martin DN, Boersma BJ, Yi M, Reimers M, Howe TM, Yfantis HG, et al. Differences in the tumor microenvironment between African American and European-American breast cancer patients. PloS One. 2009;4(2): e4531.
- Liu R, Zhi X, Zhou Z, Zhang H, Yang R, Zou T, et al. Mithramycin A suppresses basal triple-negative breast cancer cell survival, partially via downregulation of Krüppel-like factor 5 transcription by Sp1. Sci Rep. 2018 Jan 18;8(1):1138. [CrossRef]
- Hung TW, Chen PN, Wu HC, Wu SW, Tsai PY, Hsieh YS, et al. Kaempferol Inhibits the Invasion and Migration of Renal Cancer Cells through the Downregulation of AKT and FAK Pathways. Int J Med Sci. 2017 Aug 18;14(10):984–93. [CrossRef]
- Jiang X, Zhi X, Zhang P, Zhou Z, Ye J, Gao Y, et al. Isochromanoindolenines suppress triple-negative breast cancer cell proliferation partially via inhibiting Akt activation. Int J Biol Sci. 2021 Mar 2;17(4):986–94. [CrossRef]
- Ahmed SA, Mendonca P, Messeha SS, Soliman KFA. Anticancer Effects of Fucoxanthin through Cell Cycle Arrest, Apoptosis Induction, and Angiogenesis Inhibition in Triple-Negative Breast Cancer Cells. Molecules. 2023 Sep 9;28(18):6536. [CrossRef]
- Zhu L, Xue L. Kaempferol Suppresses Proliferation and Induces Cell Cycle Arrest, Apoptosis, and DNA Damage in Breast Cancer Cells. Oncol Res. 2019 Jun 21;27(6):629–34. [CrossRef]
- Choi E, Han EJ, Jeon SJ, Lee SW, Moon JM, Jung SH, et al. Kaempferol Inhibits Cervical Cancer Cells by Inducing Apoptosis and Autophagy via Inactivation of the PI3K/AKT/mTOR Signaling Pathway. ANTICANCER Res. 2024 Jun 26; 44:2961–72.
- Haroon M, Kang SC. Kaempferol promotes apoptosis and inhibits proliferation and migration by suppressing the activation of HIF-1α/VEGF and Wnt/β-catenin under hypoxic conditions in colon cancer. Appl Biol Chem. 2025 ;68(1):19.
- Kashafi E, Moradzadeh M, Mohamadkhani A, Erfanian S. Kaempferol increases apoptosis in human cervical cancer HeLa cells via PI3K/AKT and telomerase pathways. Biomed Pharmacother. 2017 ; 89:573–7. [CrossRef]
- Gupta A, Dagar G, Chauhan R, Sadida HQ, Almarzooqi SK, Hashem S, et al. Chapter Two—Cyclin-dependent kinases in cancer: Role, regulation, and therapeutic targeting. In: Donev R, editor. Advances in Protein Chemistry and Structural Biology [Internet]. Academic Press; 2023 [cited 2025 Feb 25]. p. 21–55. (Control of Cell Cycle & Cell Proliferation; vol. 135). Available from: https://www.sciencedirect.com/science/article/pii/S1876162323000135.
- Wang Q, Bode AM, Zhang T. Targeting CDK1 in cancer: mechanisms and implications. Npj Precis Oncol. 2023 Jun 13;7(1):1–14. [CrossRef]
- Ye P, Zeng Q, Miao H, Pang H, Chen Y. Percutaneous Treatment of Benign Biliary Anastomotic Strictures: Retrievable Covered Self-Expandable Metal Stent with Fixation String Versus Large-Bore Catheters. J Vasc Interv Radiol JVIR. 2021 Jan;32(1):113–20. [CrossRef]
- Gerosa R, De Sanctis R, Jacobs F, Benvenuti C, Gaudio M, Saltalamacchia G, et al. Cyclin-dependent kinase 2 (CDK2) inhibitors and other novel CDK inhibitors (CDKi) in breast cancer: clinical trials, current impact, and future directions. Crit Rev Oncol Hematol. 2024 Apr; 196:104324. [CrossRef]
- Park S, Shim SM, Nam SH, Andera L, Suh N, Kim I. CGP74514A enhances TRAIL-induced apoptosis in breast cancer cells by reducing X-linked inhibitor of apoptosis protein. Anticancer Res. 2014 Jul;34(7):3557–62.
- Guarducci C, Nardone A, Russo D, Nagy Z, Heraud C, Grinshpun A, et al. Selective CDK7 Inhibition Suppresses Cell Cycle Progression and MYC Signaling While Enhancing Apoptosis in Therapy-resistant Estrogen Receptor–positive Breast Cancer. Clin Cancer Res. 2024 ;30(9):1889–905. [CrossRef]
- Pellarin I, Dall’Acqua A, Favero A, Segatto I, Rossi V, Crestan N, et al. Cyclin-dependent protein kinases and cell cycle regulation in biology and disease. Signal Transduct Target Ther. 2025 Jan 13;10(1):11. [CrossRef]
- Vélez-Bermúdez IC, Schmidt W. The conundrum of discordant protein and mRNA expression. Are plants special? Front Plant Sci. 2014 Nov 7; 5:619.
- Schwanhäusser B, Busse D, Li N, Dittmar G, Schuchhardt J, Wolf J, et al. Global quantification of mammalian gene expression control. Nature. 2011 ;473(7347):337–42. [CrossRef]
- Ferreira S, Menezes R, Trougakos IP, Gumeni S, Bolanos-Garcia VM, dos Santos CN, et al. Modulation of the ubiquitin-proteasome system by circulating (poly)phenol-derived metabolites: implications for chronic diseases. J Nutr Biochem. 2026 Jan 1; 147:110127. [CrossRef]
- Amjad E, Sokouti B, Asnaashari S. A systematic review of anti-cancer roles and mechanisms of kaempferol as a natural compound. Cancer Cell Int. 2022 Aug 20;22(1):260. [CrossRef]
- Qiu W, Lin J, Zhu Y, Zhang J, Zeng L, Su M, et al. Kaempferol Modulates DNA Methylation and Downregulates DNMT3B in Bladder Cancer. Cell Physiol Biochem Int J Exp Cell Physiol Biochem Pharmacol. 2017;41(4):1325–35. [CrossRef]
- Momtaz S, Memariani Z, El-Senduny FF, Sanadgol N, Golab F, Katebi M, et al. Targeting Ubiquitin-Proteasome Pathway by Natural Products: Novel Therapeutic Strategy for Treatment of Neurodegenerative Diseases. Front Physiol [Internet]. 2020 Apr 28 [cited 2025 Nov 1];11. Available from: https://www.frontiersin.org/journals/physiology/articles/10.3389/fphys.2020.00361/full. [CrossRef]
- Zhang M, Zhang L, Hei R, Li X, Cai H, Wu X, et al. CDK inhibitors in cancer therapy, an overview of recent development. Am J Cancer Res. 2021 ;11(5):1913–35.
- Cazzaniga ME, Ciaccio A, Danesi R, Duhoux FP, Girmenia C, Zaman K, et al. Late-onset toxicities associated with the use of CDK 4/6 inhibitors in hormone receptor-positive (HR+), human epidermal growth factor receptor-2-negative (HER2-) metastatic breast cancer patients: A multidisciplinary, pan-EU position paper regarding their optimal management. The GIOCONDA project. Front Oncol. 2023 Oct 26; 13:1247270. [CrossRef]
- Patel H, Periyasamy M, Sava GP, Bondke A, Slafer BW, Kroll SHB, et al. ICEC0942, an Orally Bioavailable Selective Inhibitor of CDK7 for Cancer Treatment. Mol Cancer Ther. 2018 Jun;17(6):1156–66.
- Mustafa EH, Laven-Law G, Kikhtyak Z, Nguyen V, Ali S, Pace AA, et al. Selective inhibition of CDK9 in triple-negative breast cancer. Oncogene. 2024 Jan;43(3):202–15. [CrossRef]
- Wang P, Ma Y, Rao X, Luo Q, Xiao X, Wang T, et al. Kaempferol targets Src to exert its chemopreventive effects on mammary tumorigenesis by regulating the PI3K/AKT pathway. Phytomedicine. 2025 Jun 1; 141:156701. [CrossRef]
- Minaei S, Kavousi M, Jamshidian F. The apoptotic and anti-metastatic effects of niosome kaempferol in MCF-7 breast cancer cells. Sci Rep. 2025 Jul 1;15(1):20741. [CrossRef]
- Hu Y, Gao J, Wang M, Li M. Potential Prospect of CDK4/6 Inhibitors in Triple-Negative Breast Cancer. Cancer Manag Res. 2021 Jul 1; 13:5223–37. [CrossRef]
- Wu J, Wang W, Gao L, Shao X, Wang X. Cyclin-dependent kinase inhibitors enhance programmed cell death protein 1 immune checkpoint blockade efficacy in triple-negative breast cancer by affecting the immune microenvironment. Cancer. 2024;130(S8):1449–63. [CrossRef]
- Cheung A, Chenoweth AM, Quist J, Sow HS, Malaktou C, Ferro R, et al. CDK Inhibition Primes for Anti-PD-L1 Treatment in Triple-Negative Breast Cancer Models. Cancers. 2022 Jul 11;14(14):3361. [CrossRef]
- Shao YY, Hsieh MS, Lee YH, Hsu HW, Wo RR, Wang HY, et al. Cyclin-dependent kinase 9 inhibition reduced programmed death-ligand 1 expression and improved treatment efficacy in hepatocellular carcinoma. Heliyon. 2024 Jul 30;10(14): e34289. [CrossRef]
- Zhang R, Wang J, Du Y, Yu Z, Wang Y, Jiang Y, et al. CDK5 destabilizes PD-L1 via chaperon-mediated autophagy to control cancer immune surveillance in hepatocellular carcinoma. J Immunother Cancer. 2023 Nov 1;11(11): e007529. [CrossRef]
- Tang Q, Chen Y, Li X, Long S, Shi Y, Yu Y, et al. The role of PD-1/PD-L1 and application of immune-checkpoint inhibitors in human cancers. Front Immunol [Internet]. 2022 Sep 13 [cited 2025 Jan 27];13. Available from: https://www.frontiersin.org/journals/immunology/articles/10.3389/fimmu.2022.964442/full. [CrossRef]
- Adams S, Loi S, Toppmeyer D, Cescon DW, De Laurentiis M, Nanda R, et al. Pembrolizumab monotherapy for previously untreated, PD-L1-positive, metastatic triple-negative breast cancer: cohort B of the phase II KEYNOTE-086 study. Ann Oncol Off J Eur Soc Med Oncol. 2019 Mar 1;30(3):405–11.
- Rittmeyer A, Barlesi F, Waterkamp D, Park K, Ciardiello F, Pawel J von, et al. Atezolizumab versus docetaxel in patients with previously treated non-small-cell lung cancer (OAK): a phase 3, open-label, multicentre randomised controlled trial. The Lancet. 2017 Jan 21;389(10066):255–65.
- Qian J, Wang C, Wang B, Yang J, Wang Y, Luo F, et al. The IFN-γ/PD-L1 axis between T cells and tumor microenvironment: hints for glioma anti-PD-1/PD-L1 therapy. J Neuroinflammation. 2018 Oct 17;15(1):290.
- Mandai M, Hamanishi J, Abiko K, Matsumura N, Baba T, Konishi I. Dual Faces of IFNγ in Cancer Progression: A Role of PD-L1 Induction in the Determination of Pro- and Antitumor Immunity. Clin Cancer Res. 2016 ;22(10):2329–34.
- Zhao T, Li Y, Zhang J, Zhang B. PD-L1 expression increased by IFN-γ via JAK2-STAT1 signaling and predicts a poor survival in colorectal cancer. Oncol Lett. 2020 Aug 1;20(2):1127–34.
- Mimura K, Teh JL, Okayama H, Shiraishi K, Kua L, Koh V, et al. PD-L1 expression is mainly regulated by interferon gamma, associated with the JAK-STAT pathway, in gastric cancer. Cancer Sci. 2018 Jan;109(1):43–53.
- Zak J, Pratumchai I, Marro BS, Marquardt KL, Zavareh RB, Lairson LL, et al. JAK inhibition enhances checkpoint blockade immunotherapy in patients with Hodgkin lymphoma. Science. 2024 Jun 21;384(6702): eade8520.
- Song TL, Nairismägi ML, Laurensia Y, Lim JQ, Tan J, Li ZM, et al. Oncogenic activation of the STAT3 pathway drives PD-L1 expression in natural killer/T-cell lymphoma. Blood. 2018 Sep 13;132(11):1146–58.
- Kufe, DW. MUC1-C oncoprotein as a target in breast cancer: activation of signaling pathways and therapeutic approaches. Oncogene. 2013 Feb;32(9):1073–81.
- Ma Q, Hao S, Hong W, Tergaonkar V, Sethi G, Tian Y, et al. Versatile function of NF-ĸB in inflammation and cancer. Exp Hematol Oncol. 2024 Jul 16;13(1):68.
- Hoesel B, Schmid JA. The complexity of NF-κB signaling in inflammation and cancer. Mol Cancer. 2013 Aug 2; 12:86.
- Jin J, Lin J, Xu A, Lou J, Qian C, Li X, et al. CCL2: An Important Mediator Between Tumor Cells and Host Cells in Tumor Microenvironment. Front Oncol [Internet]. 2021 Jul 27 [cited 2025 Feb 18];11. Available from: https://www.frontiersin.org/journals/oncology/articles/10.3389/fonc.2021.722916/full.
- Blows FM, Ali HR, Cope W, Pharoah PDP, Pike CVS, Provenzano E, et al. Expression of transglutaminase-2 (TGM2) in the prognosis of female invasive breast cancer. BJC Rep. 2024 Jan 24;2(1):5.
Figure 1.
The effect of kaempferol on cell viability (2D and 3D cell culture) and on cell proliferation, and its comparison with the standard chemotherapeutic drug Taxol in MDA-MB-231 (a, b, and e) and MDA-MB-468 (c, d, and f) TNBC cells. The concentration of kaempferol varied from 1.56 to 200 µM, and the control cells were treated with DMSO (<0.1%). For the proliferation assay, the treatments used were: kaempferol (3.12—200µM), Taxol (1μM), and control (DMSO (<0.1%). The experiments were performed three times with n = 8 at 37 °C in 5% CO2. The data are presented as the mean ± SEM. Statistical significance between control vs. treatments was evaluated by a one-way ANOVA, followed by Dunnett’s multiple comparison tests. *p < 0.05, **p < 0.01, ***p < 0.001, ****p < 0.0001 (24h) and #p < 0.05, p < 0.01, ###p < 0.001, ####p < 0.0001, ns = p > 0.05 (48h).
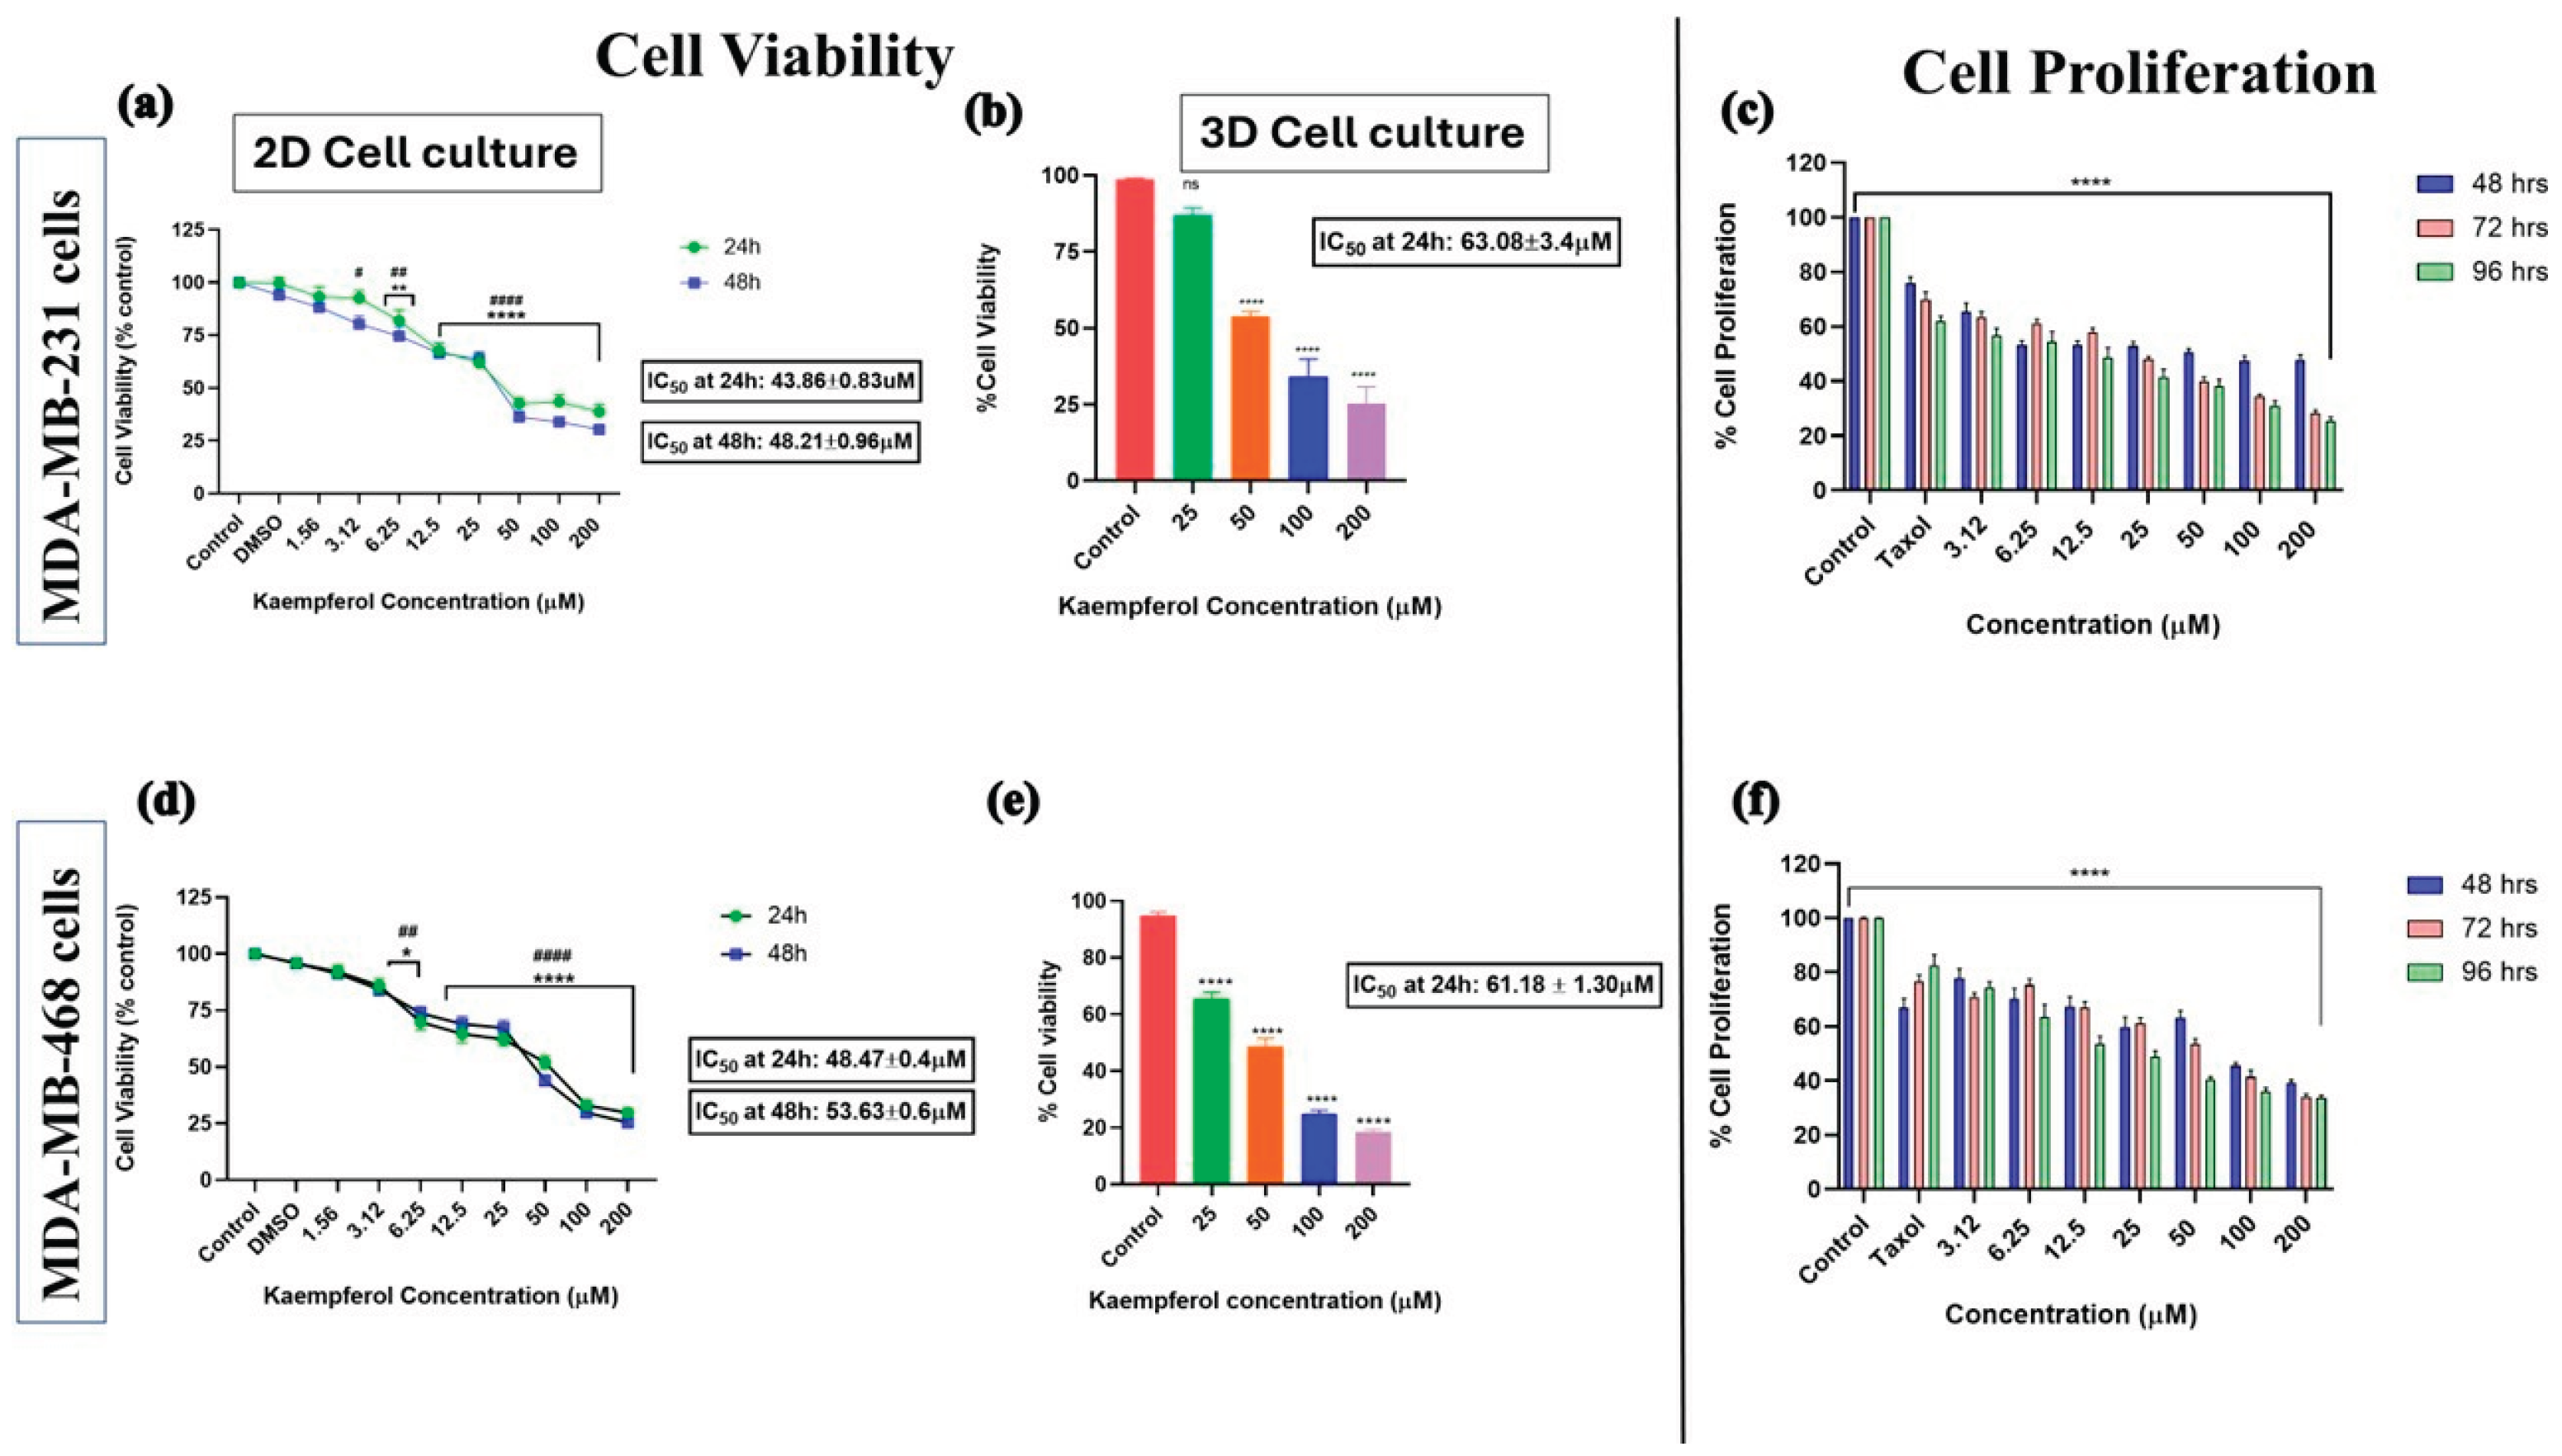
Figure 2.
Effect of kaempferol to induce apoptosis in MDA-MB-231 cells (Figure 3a-3f) and MDA-MB-468 cells (Figure 3g-3l). The cells were treated with kaempferol concentrations ranging from 12.5 to 100µM. At 24h, the apoptotic effect of kaempferol was analyzed using a Sony SH800 Cell Sorter (San Jose, CA, USA) and the CELLQuest software. The experiment was performed 3 times, and the data are presented as the mean ± SEM. The statistically significant differences between control vs. treatments were evaluated with one-way ANOVA and Dunnett’s multiple comparison tests. *p < 0.05, **p < 0.01, ***p < 0.001, ****p < 0.0001, ns = p > 0.05.
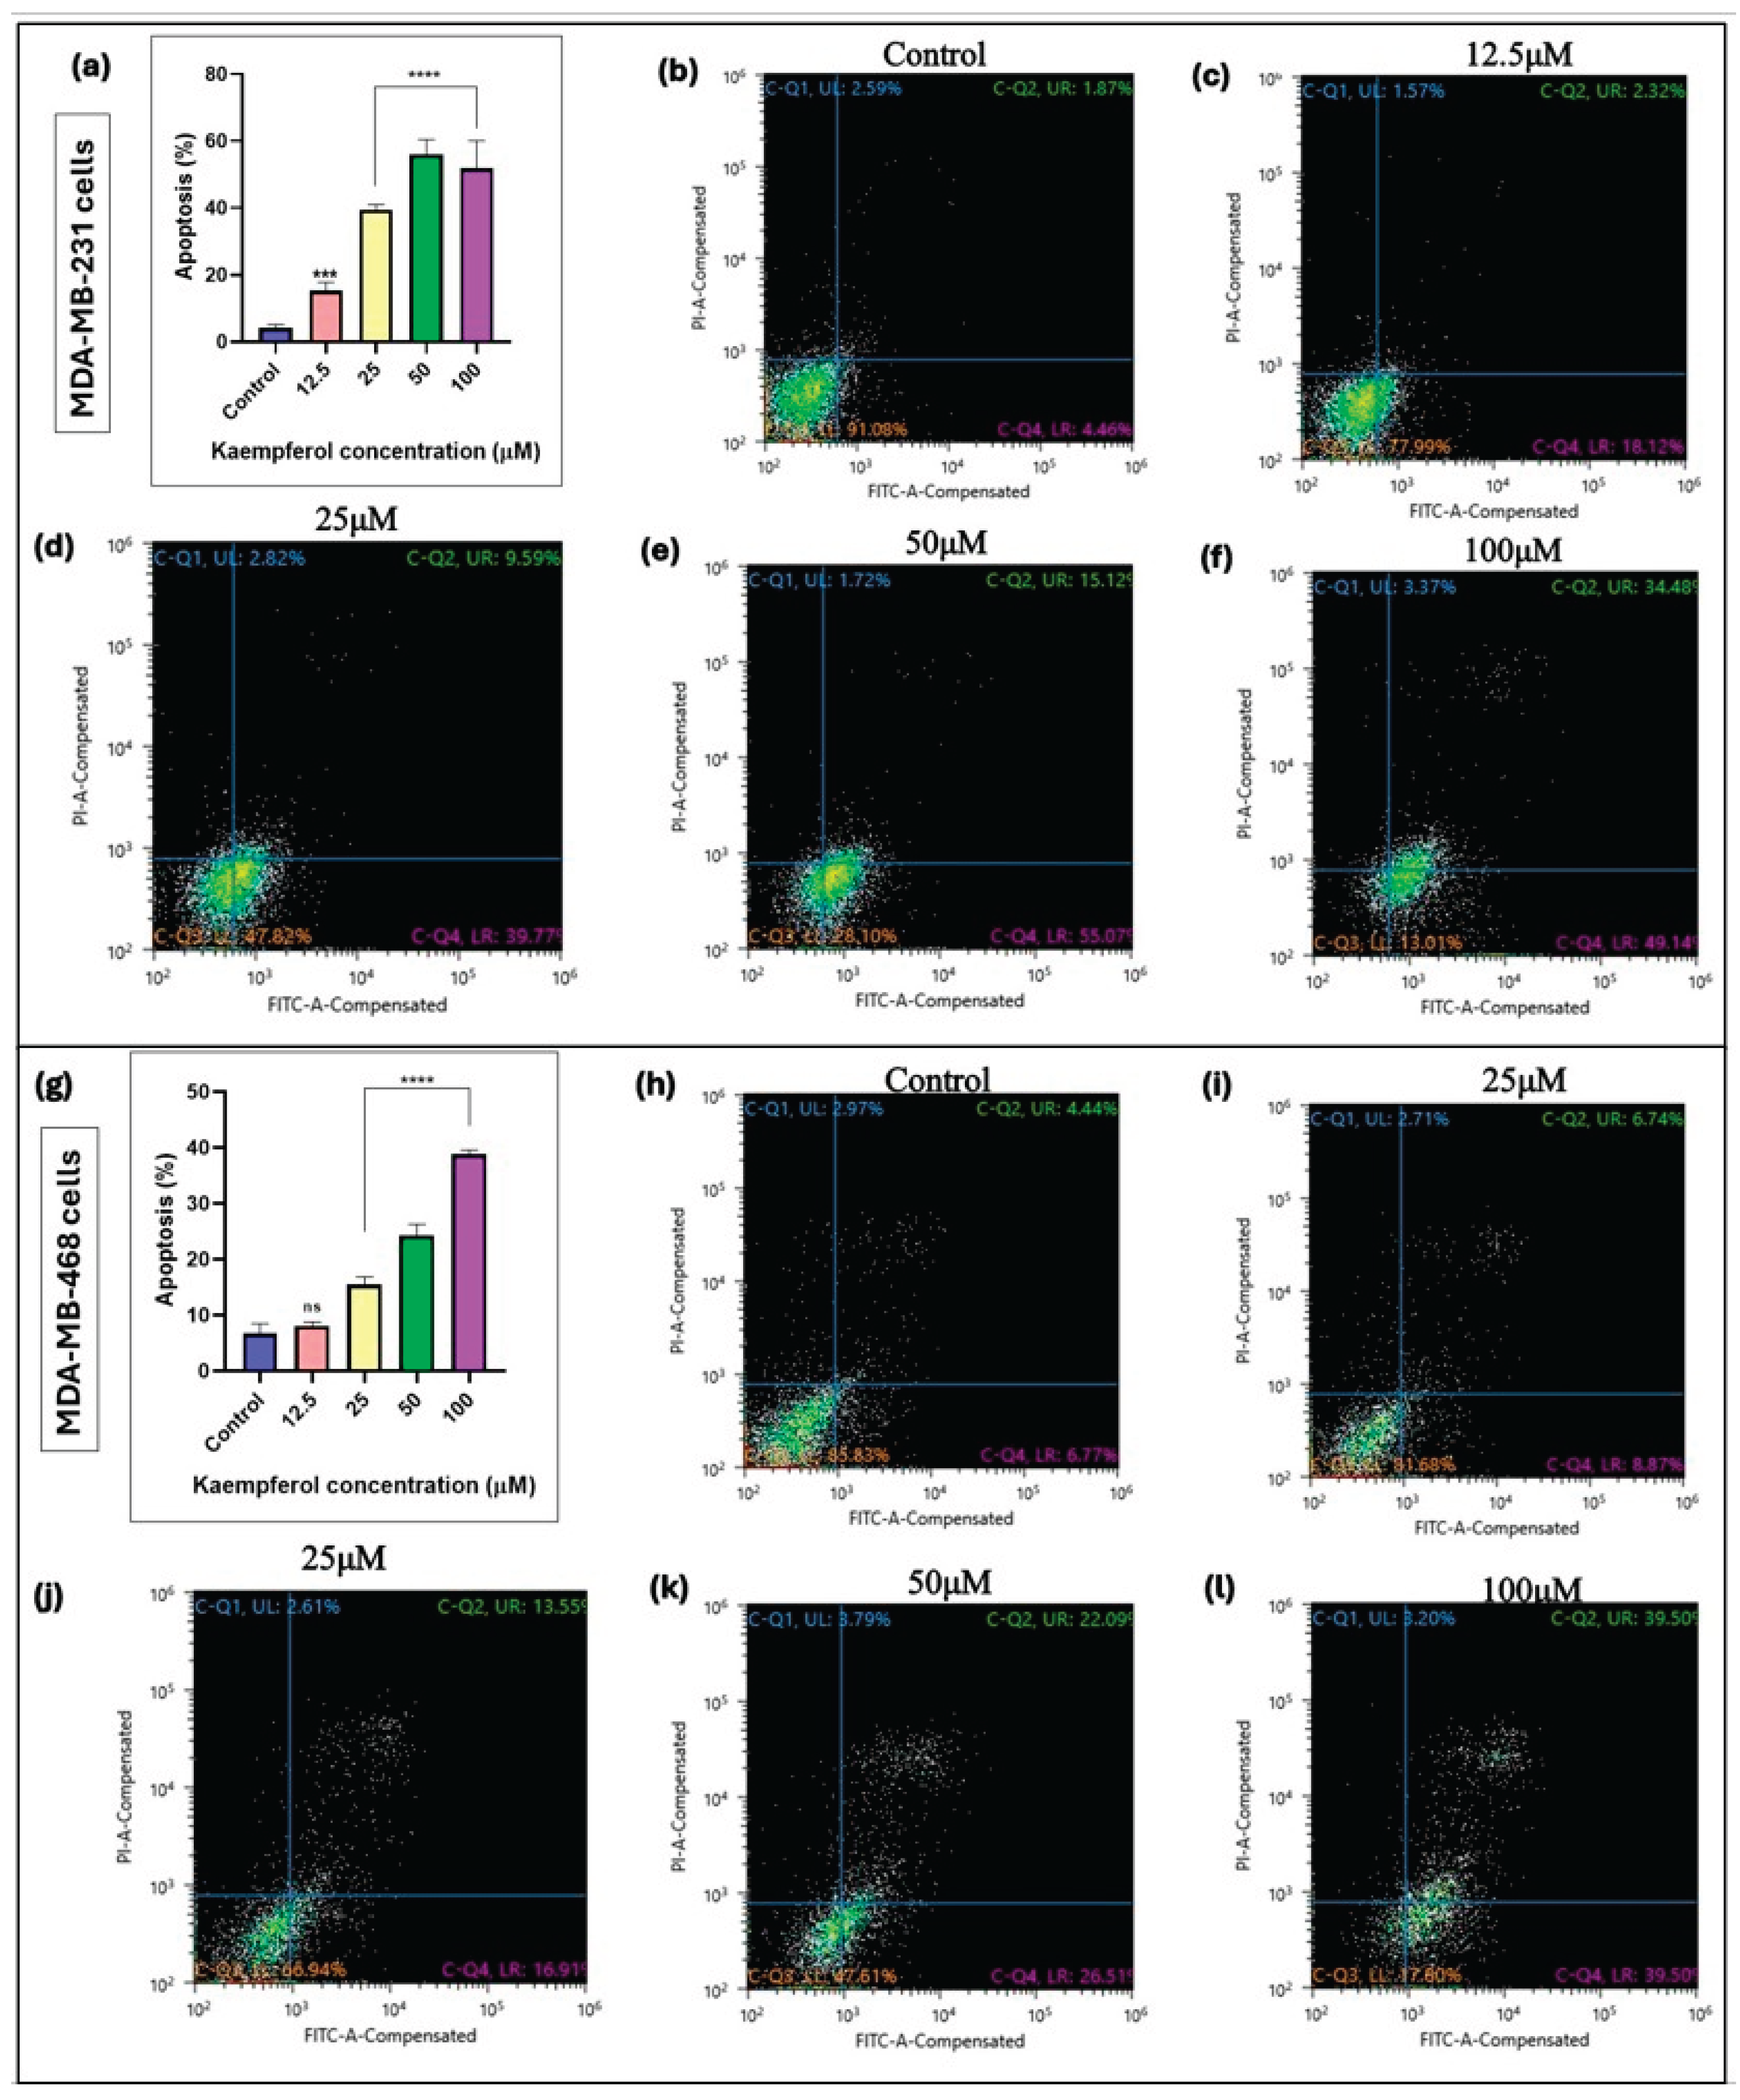
Figure 3.
Effect of kaempferol on dual Acridine Orange/Ethidium bromide (AO/EtBr) fluorescent staining on MDA-MB-231 in 2D (Figure 4a to 4l) and 3D (Figure 4m to 4x) and on MDA-MB-468 cells in 2D (Figure 4a to 4l) and 3D (Figure 4m to 4x) cell culture. The cells were treated with a range of kaempferol concentrations, from 25 μM to 100 μM. Cell imaging was performed at 24 hours and visualized using the Olympus Cell Sens Standard Cytation 5 cell Imaging reader (BioTek Instruments, Inc., Winooski, VT, USA) at 40x magnification.
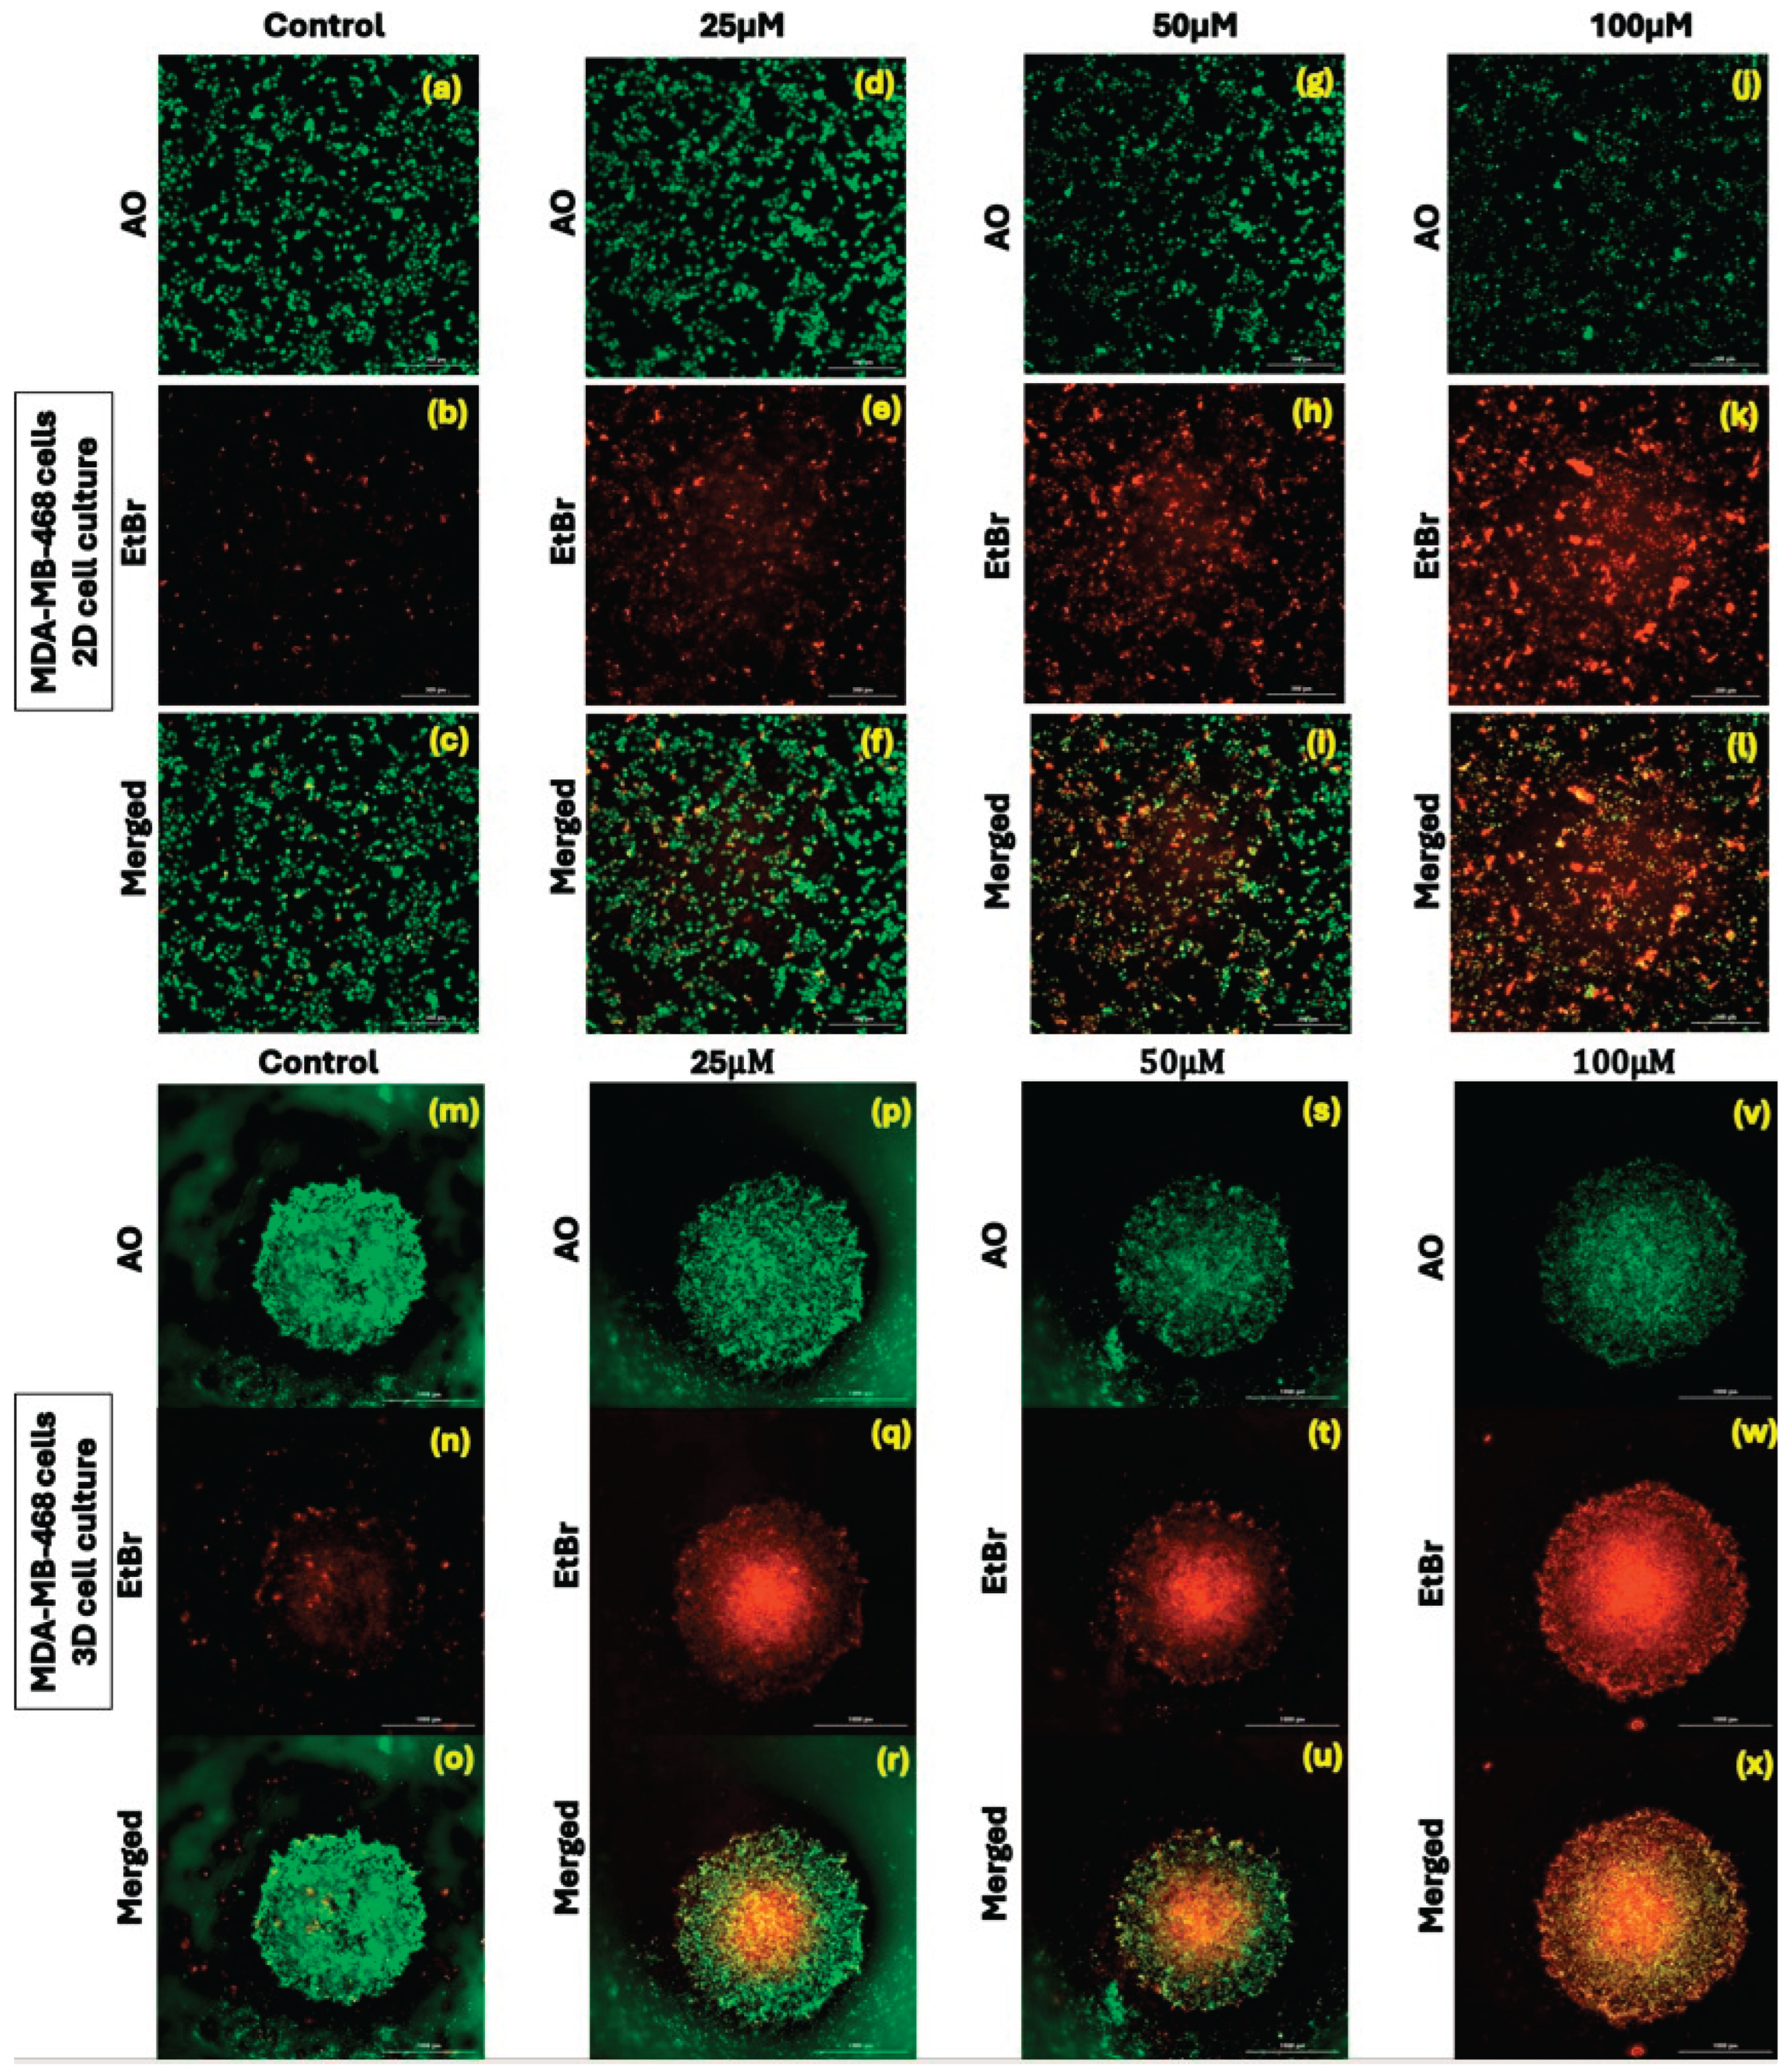
Figure 4.
Effect of kaempferol on the induction of cell cycle arrest in MDA-MB-231 and MDA-MB-468 cells. The cells were treated with DMSO (control) and various concentrations of kaempferol, ranging from 3.12 to 50 µM, for 24 hours. The ability of kaempferol to induce cell cycle arrest was analyzed using a Sony SH800 Cell Sorter (San Jose, CA, USA) and the CELLQuest software. The data are presented as the mean ± SEM, and the statistical significance of the effect between control and treatments was evaluated by one-way ANOVA, followed by Dunnett’s multiple comparison tests. * p < 0.05, ** p < 0.01, *** p < 0.001, **** p < 0.0001, ns = p > 0.05.
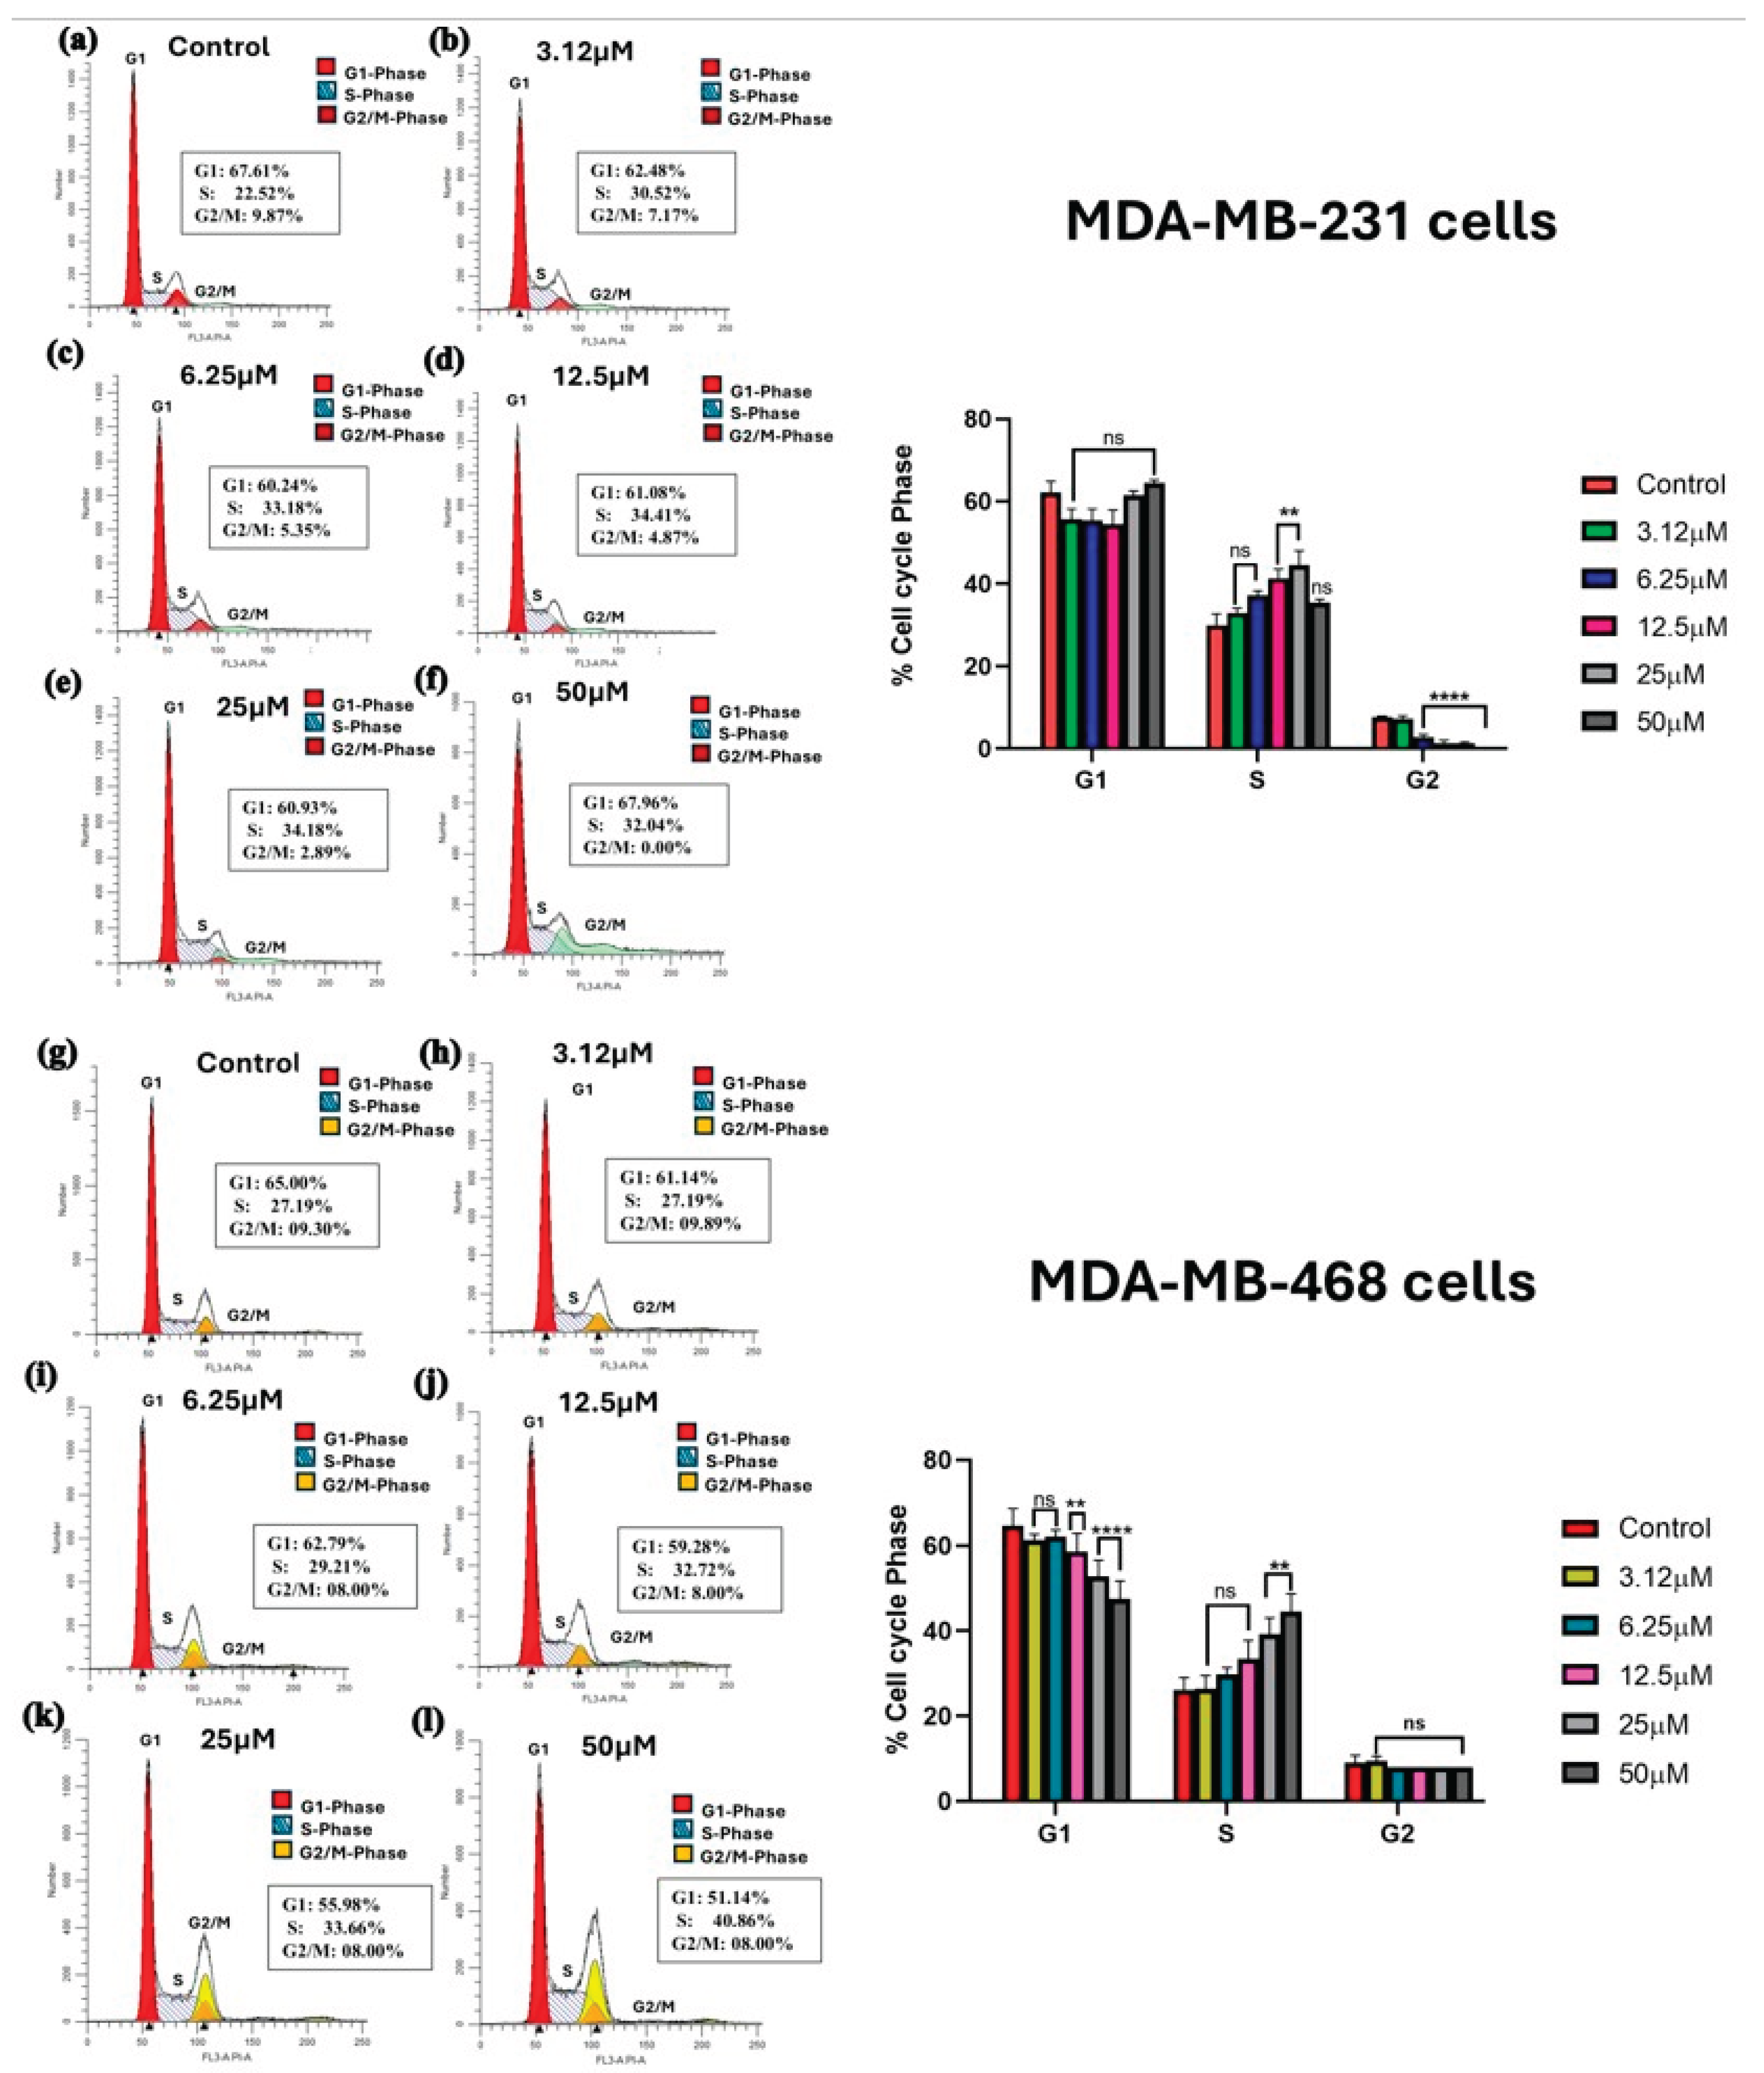
Figure 5.
The effect of kaempferol on the mRNA levels of CDKs (CDK1, CDK2, CDK4, CDK6, and CDK7) was evaluated in MDA-MB-231 and MDA-MB-468 cells using RT-PCR analysis. The MDA-MB-231 cells were treated with 25μM of kaempferol, and the MDA-MB-468 cells with 50μM of kaempferol, with or without TNF-α (50 ng/mL), and the control cells were treated with DMSO (<0.1%). The experiments were performed three times with n = 3 and incubated at 37 °C and 5% CO2. The data are presented as the mean ± SEM. The statistical significance between the control and treatments was evaluated using one-way ANOVA, followed by Dunnett’s multiple comparison tests. *p < 0.05, **p < 0.01, ***p < 0.001, ****p < 0.0001 (control vs. TNF-α), and #p < 0.05, ##p < 0.01, p < 0.001, #### p < 0.0001 (TNF-α vs. co-treatment), ns = p > 0.05.
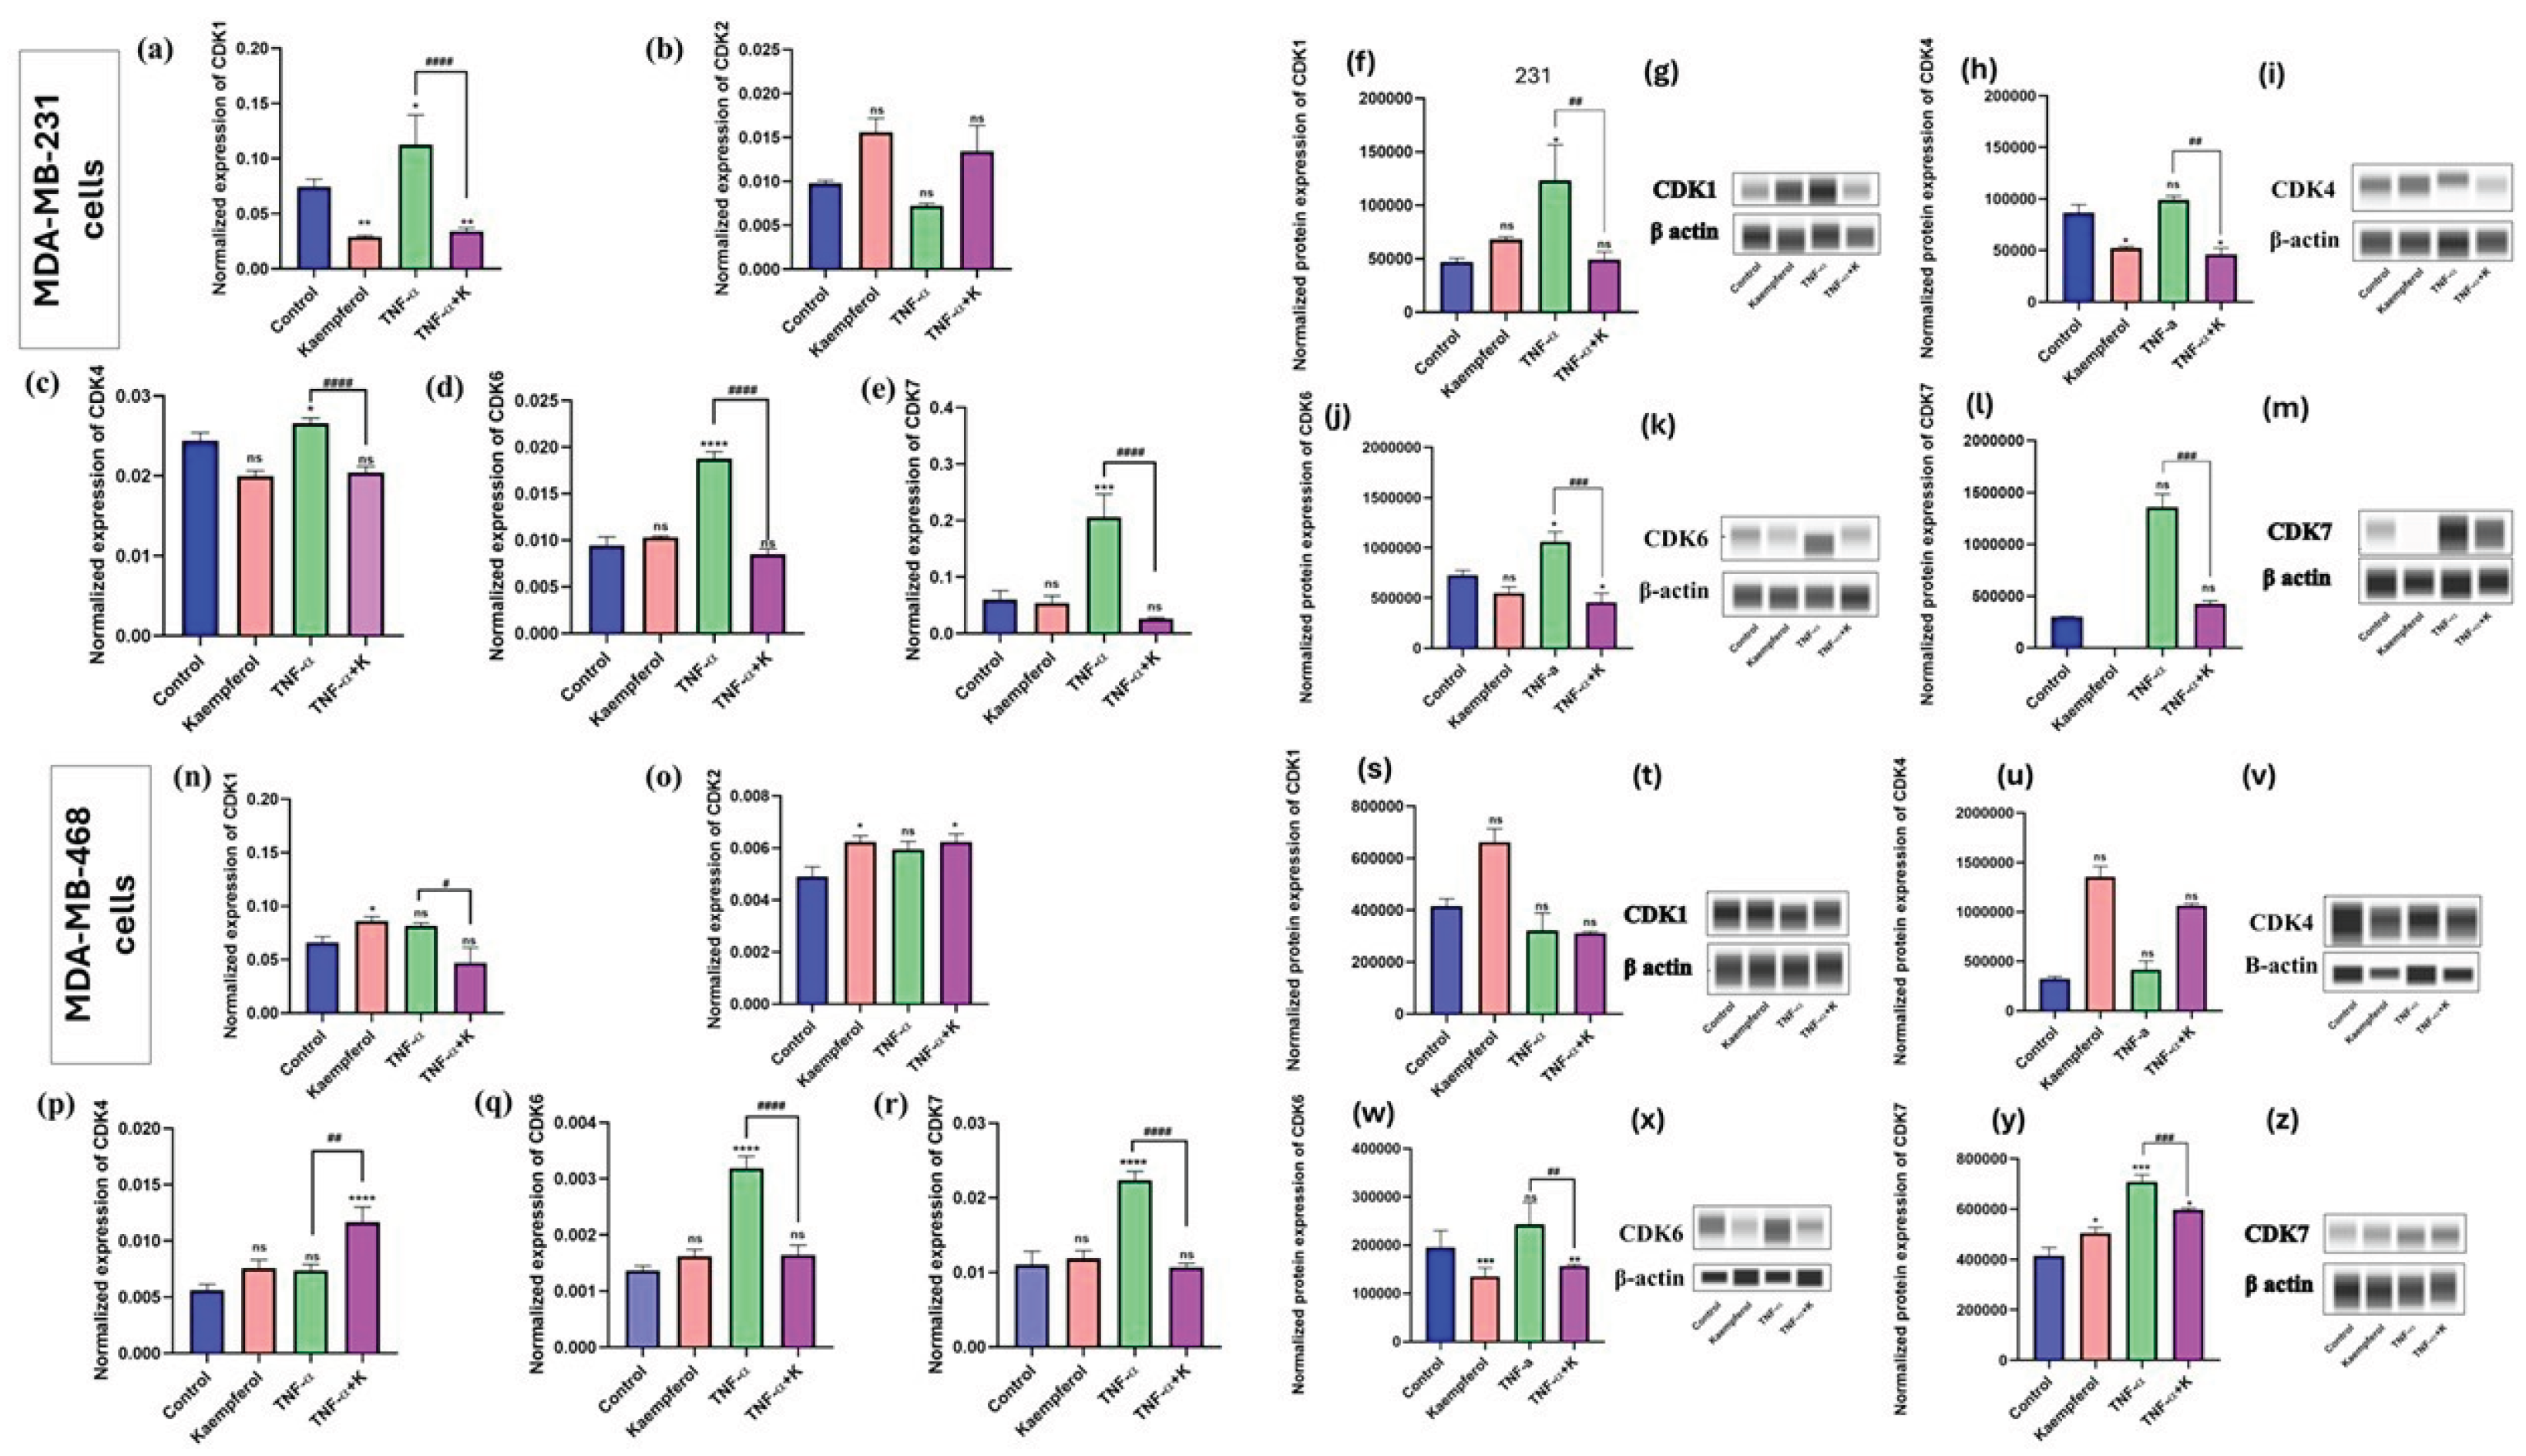
Figure 6.
Effect of kaempferol on mRNA expression and protein release levels of PD-L1 and on gene expression of its inducers (JAK1, STAT3, MUC-1, NF-κB1, and NF-κB2) in TNBC cell lines. The cells were treated with 25 μM and 50 μM kaempferol in MDA-MB-231 and MDA-MB-468 cells, respectively, with or without IFN-γ (100 ng/mL). The control cells were treated with DMSO (<0.1%). The experiments were performed three times with n = 3 and incubated at 37 °C and 5% CO2. The data are presented as the mean ± SEM. The statistical significance between the control and treatments was evaluated using one-way ANOVA, followed by Dunnett’s multiple comparison tests. *p < 0.05, **p < 0.01, ***p < 0.001, ****p < 0.0001 (control and TNF-α), and #p < 0.05, ##p < 0.0,1###p < 0.001, ####p < 0.0001 (TNF-α and co-treatment), ns = p > 0.05.
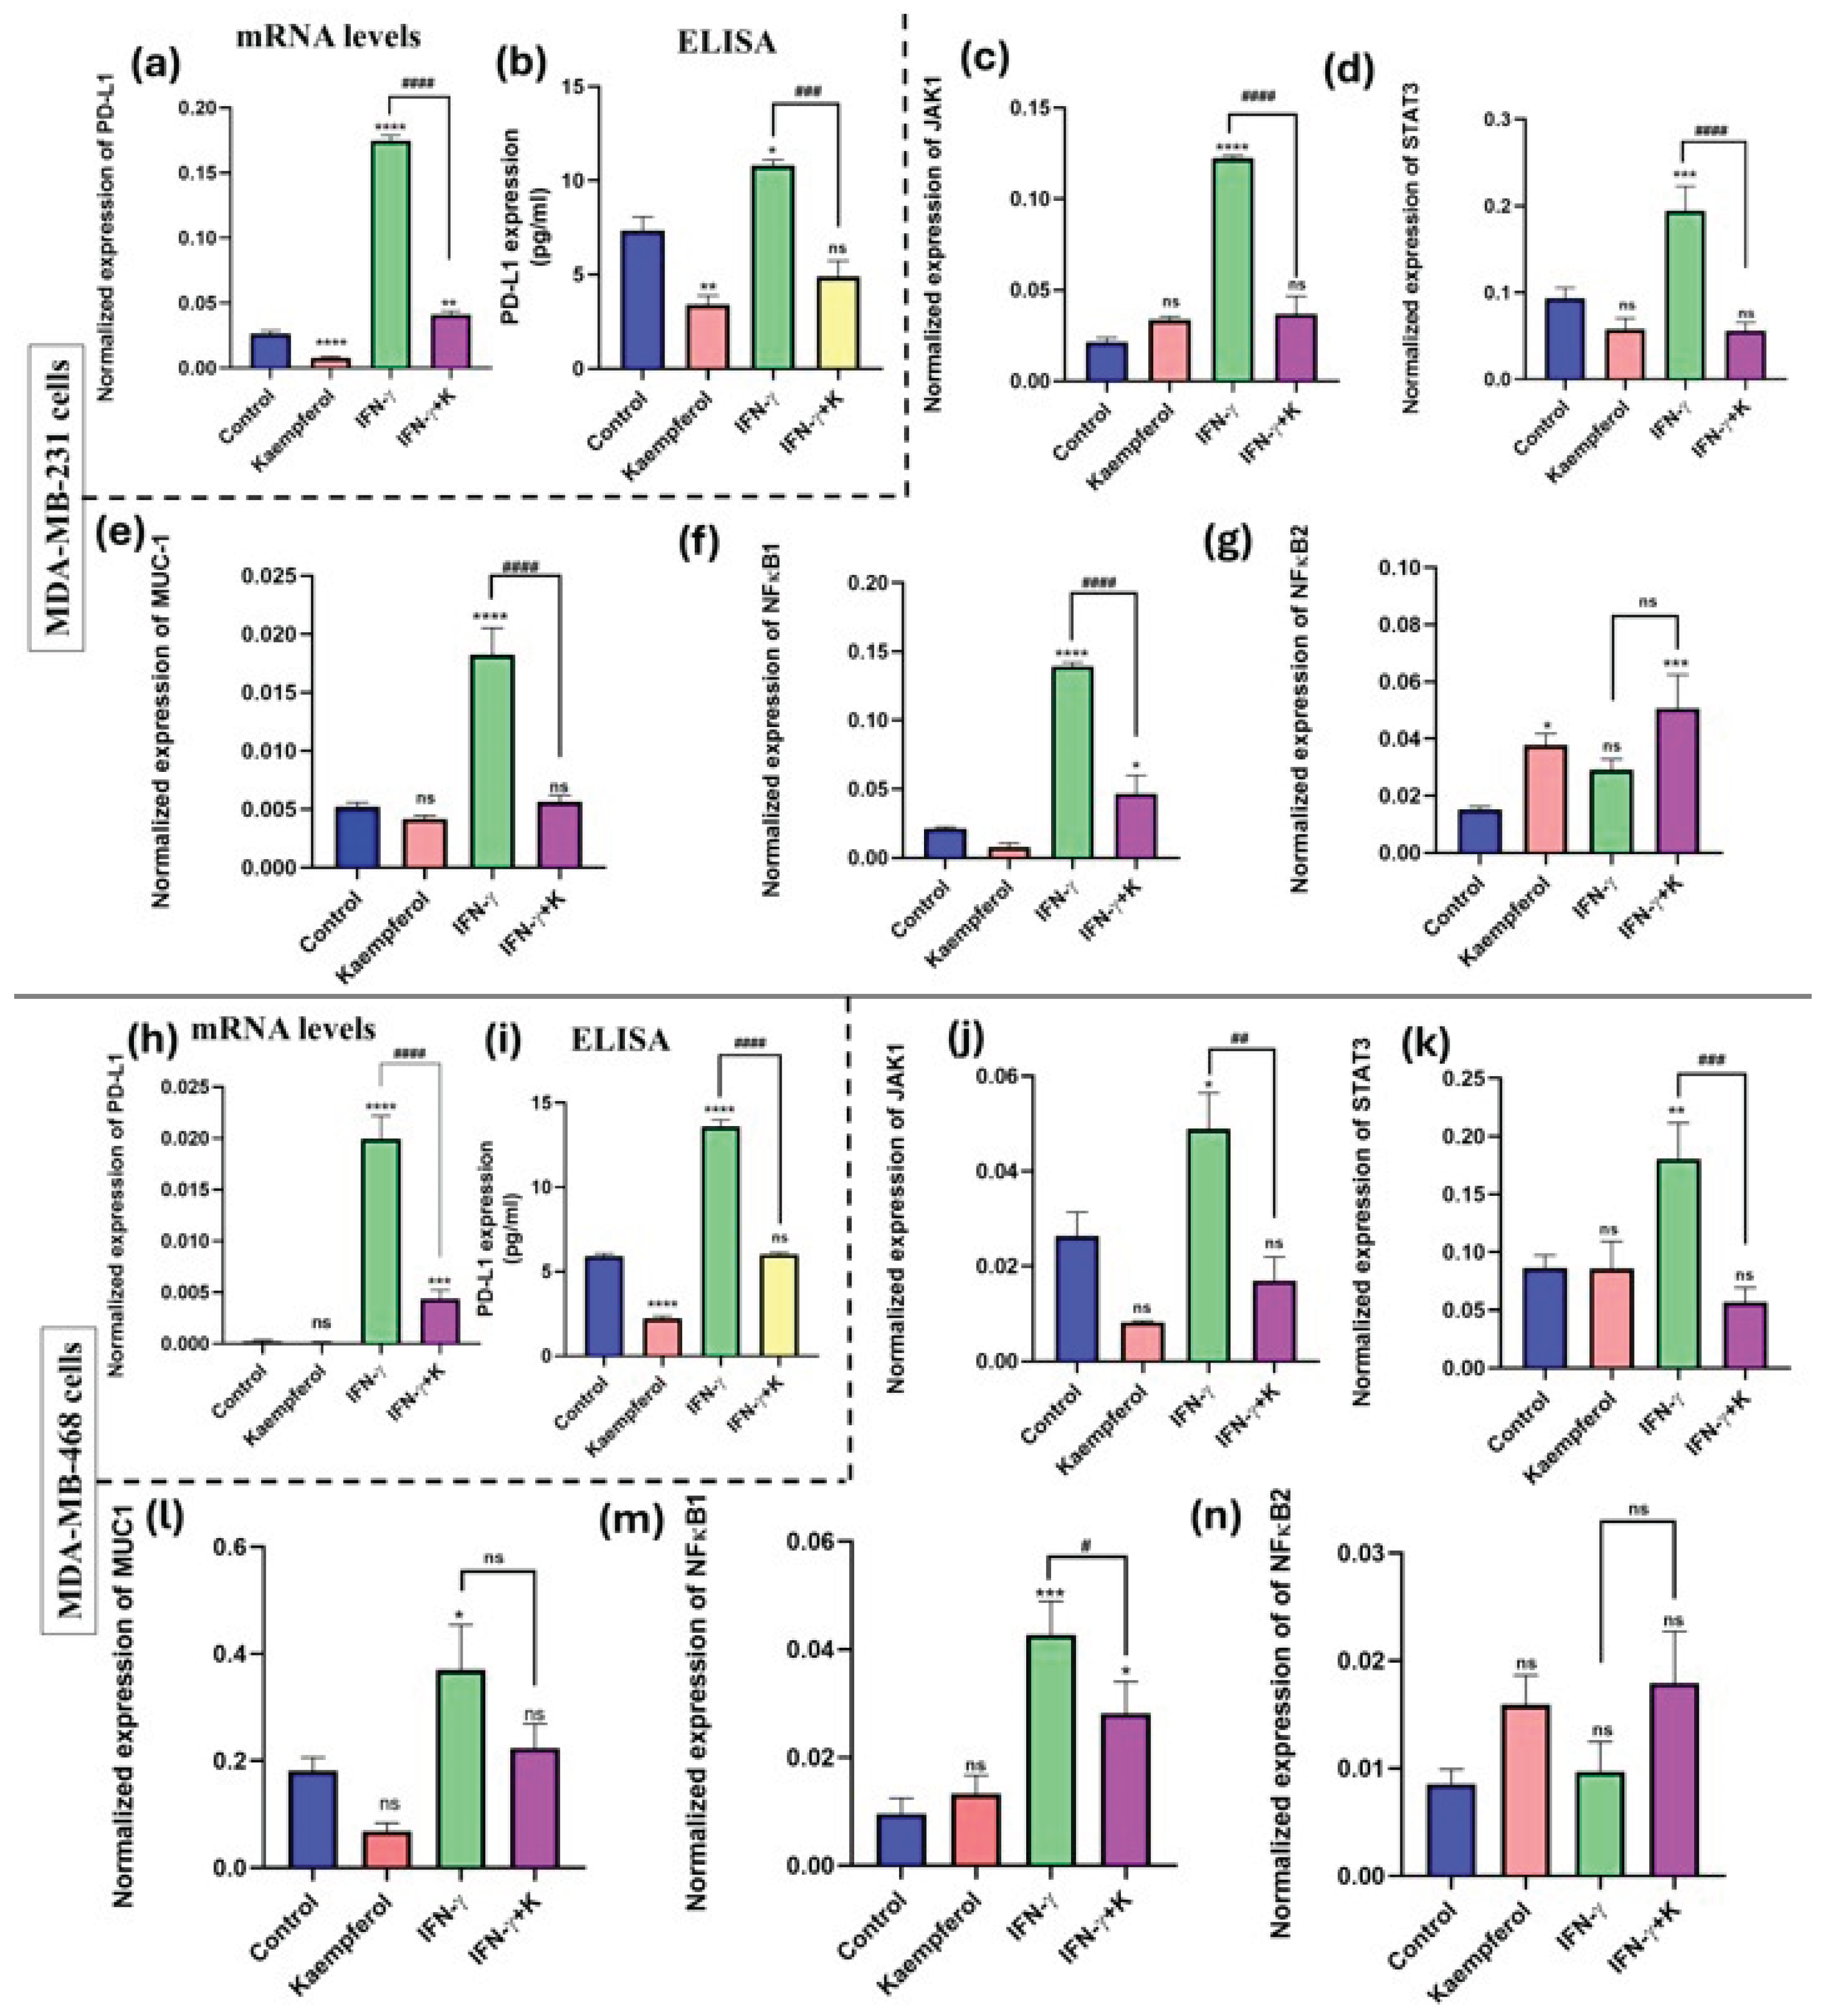
Figure 7.
The effect of kaempferol on mRNA expression of CCL2 and TGM2 and protein release levels of CCL2 in MDA-MB-231 and MDA-MB-468 cells was assessed using RT-PCR analysis and ELISA, respectively. The cells were treated with kaempferol concentrations of 25 μM and 50 μM in MDA-MB-231 and MDA-MB-468 cells, respectively, with or without TNF-α (50 ng/mL). The control cells were treated with DMSO (<0.1%). The experiments were performed three times with n = 3 and incubated at 37 °C and 5% CO2. The data is presented as the mean ± SEM. The statistical significance between the control and treatments was evaluated using one-way ANOVA, followed by Dunnett’s multiple comparison tests. *p < 0.05, **p < 0.01, ***p < 0.001, ****p < 0.0001 (control vs. TNF-α), and #p < 0.05, < 0.01, p < 0.001, ####p < 0.0001 (TNF-α vs. co-treatment), ns = p > 0.05.
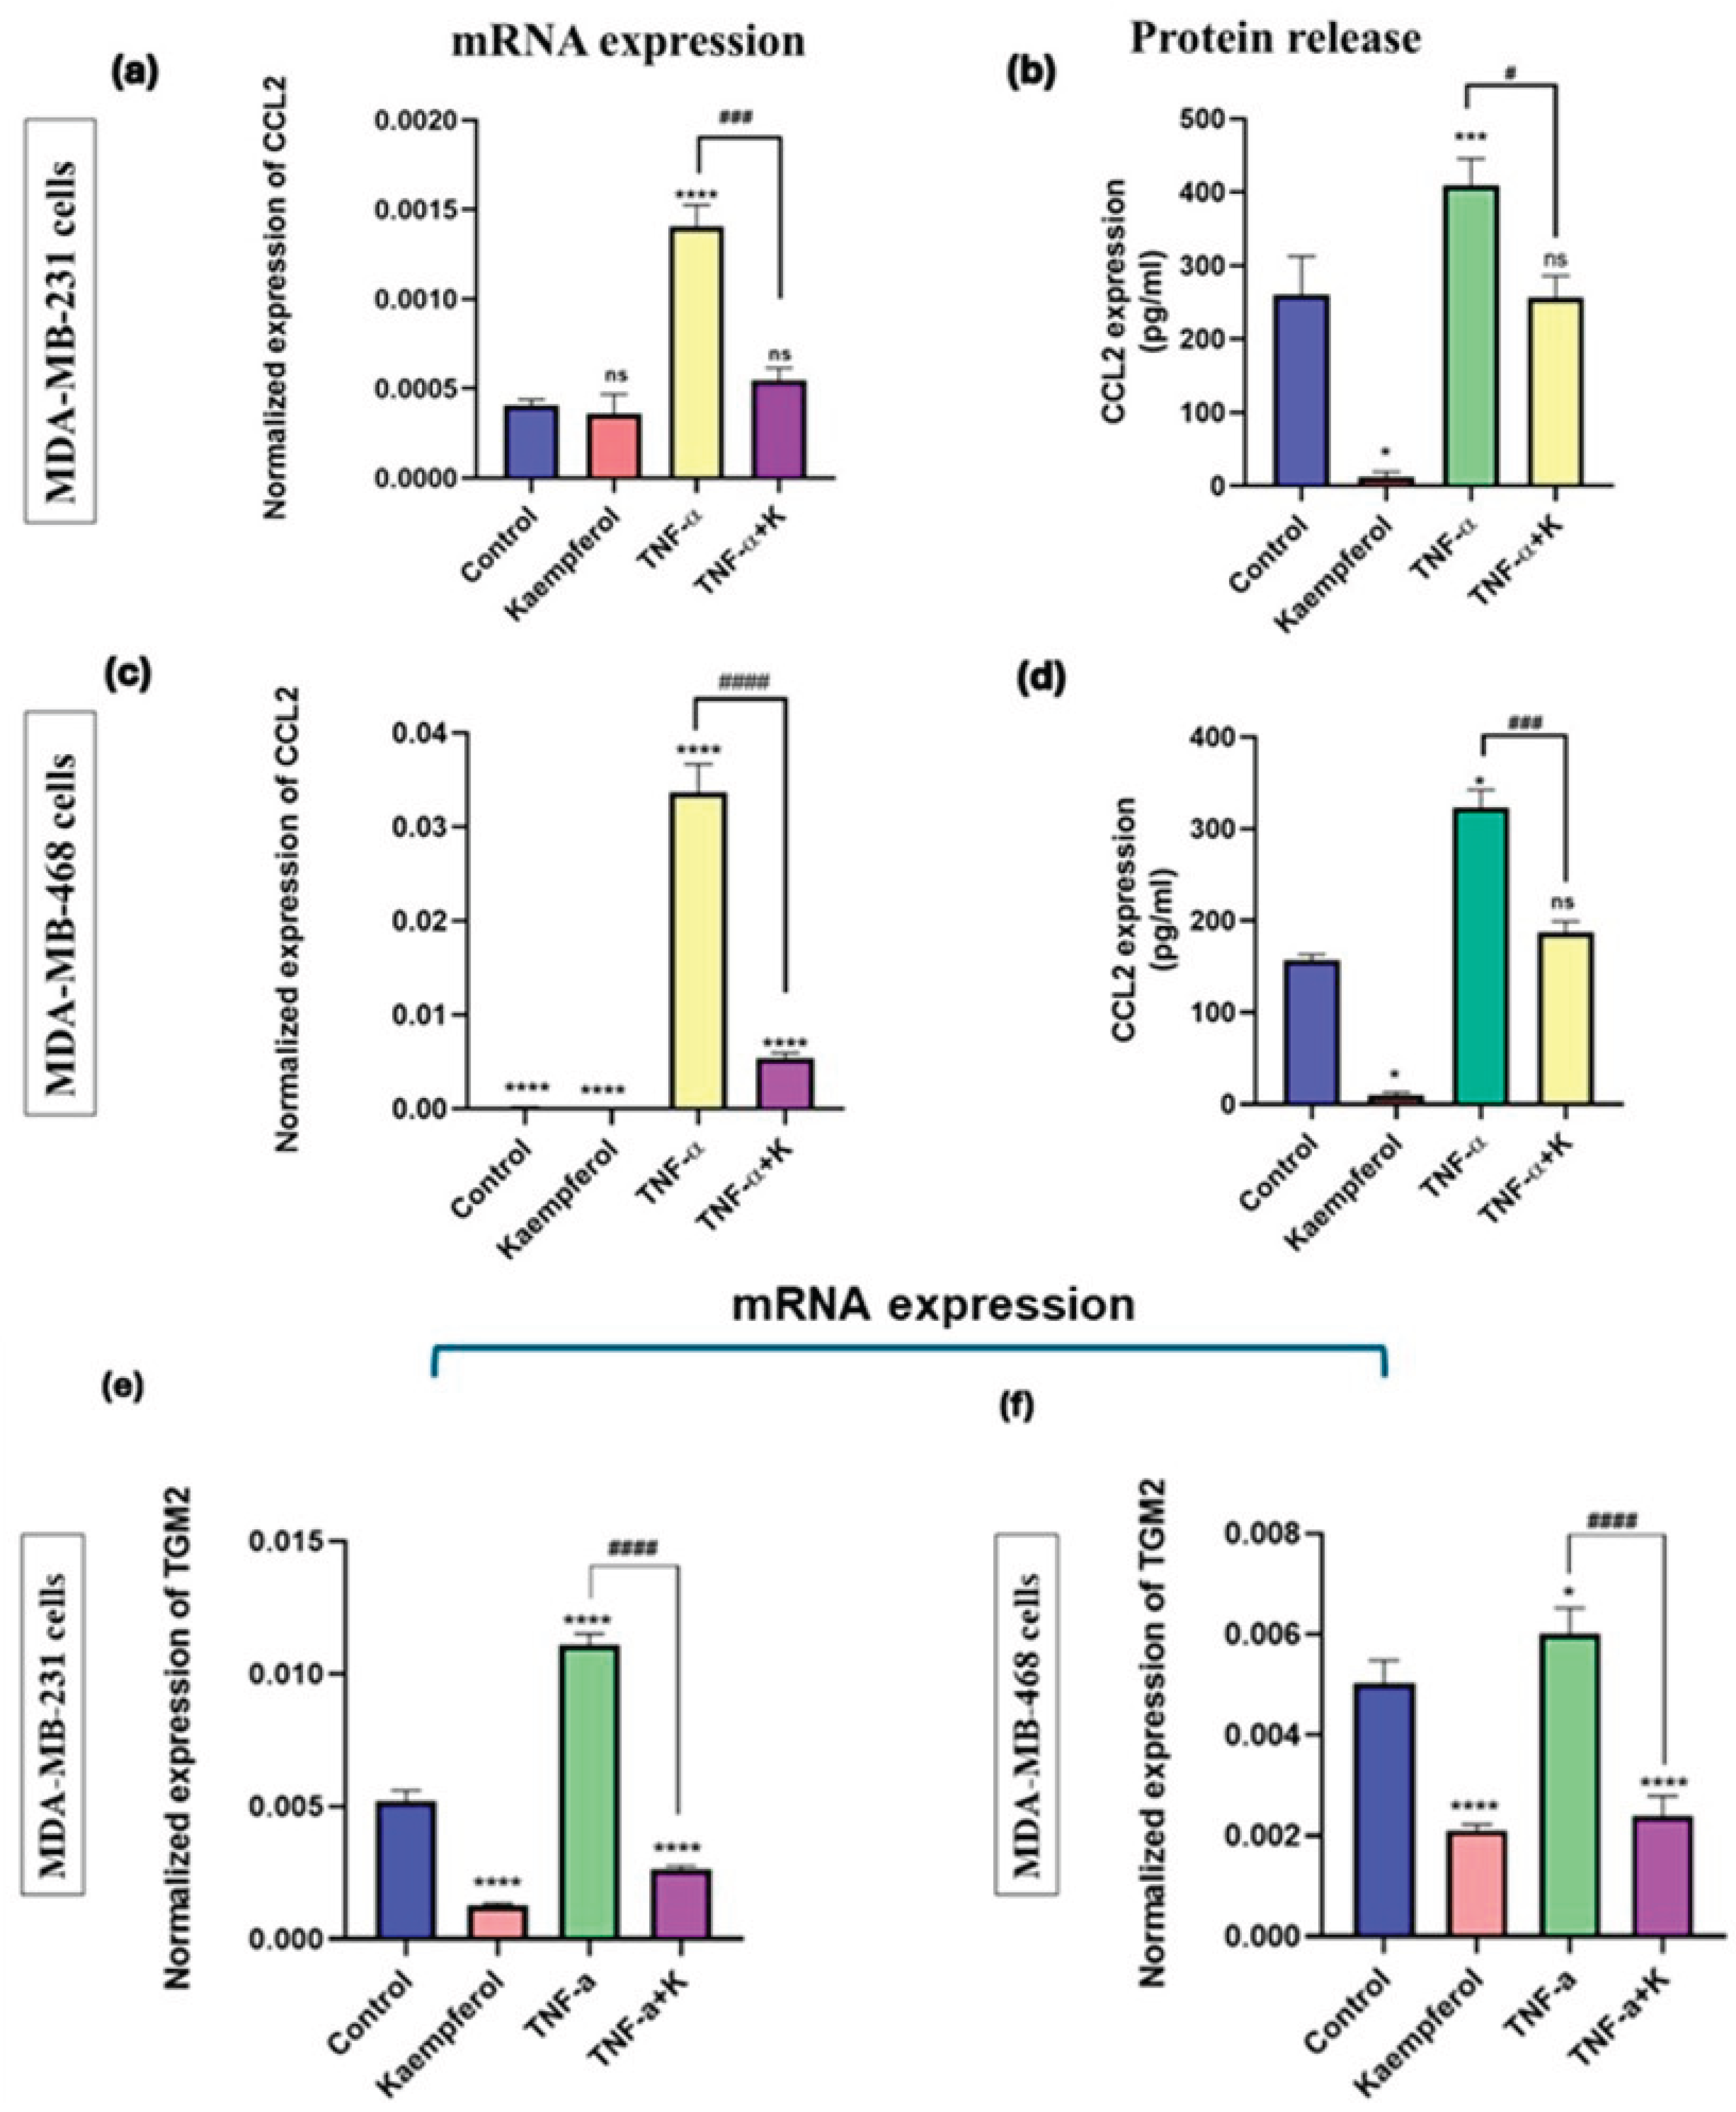
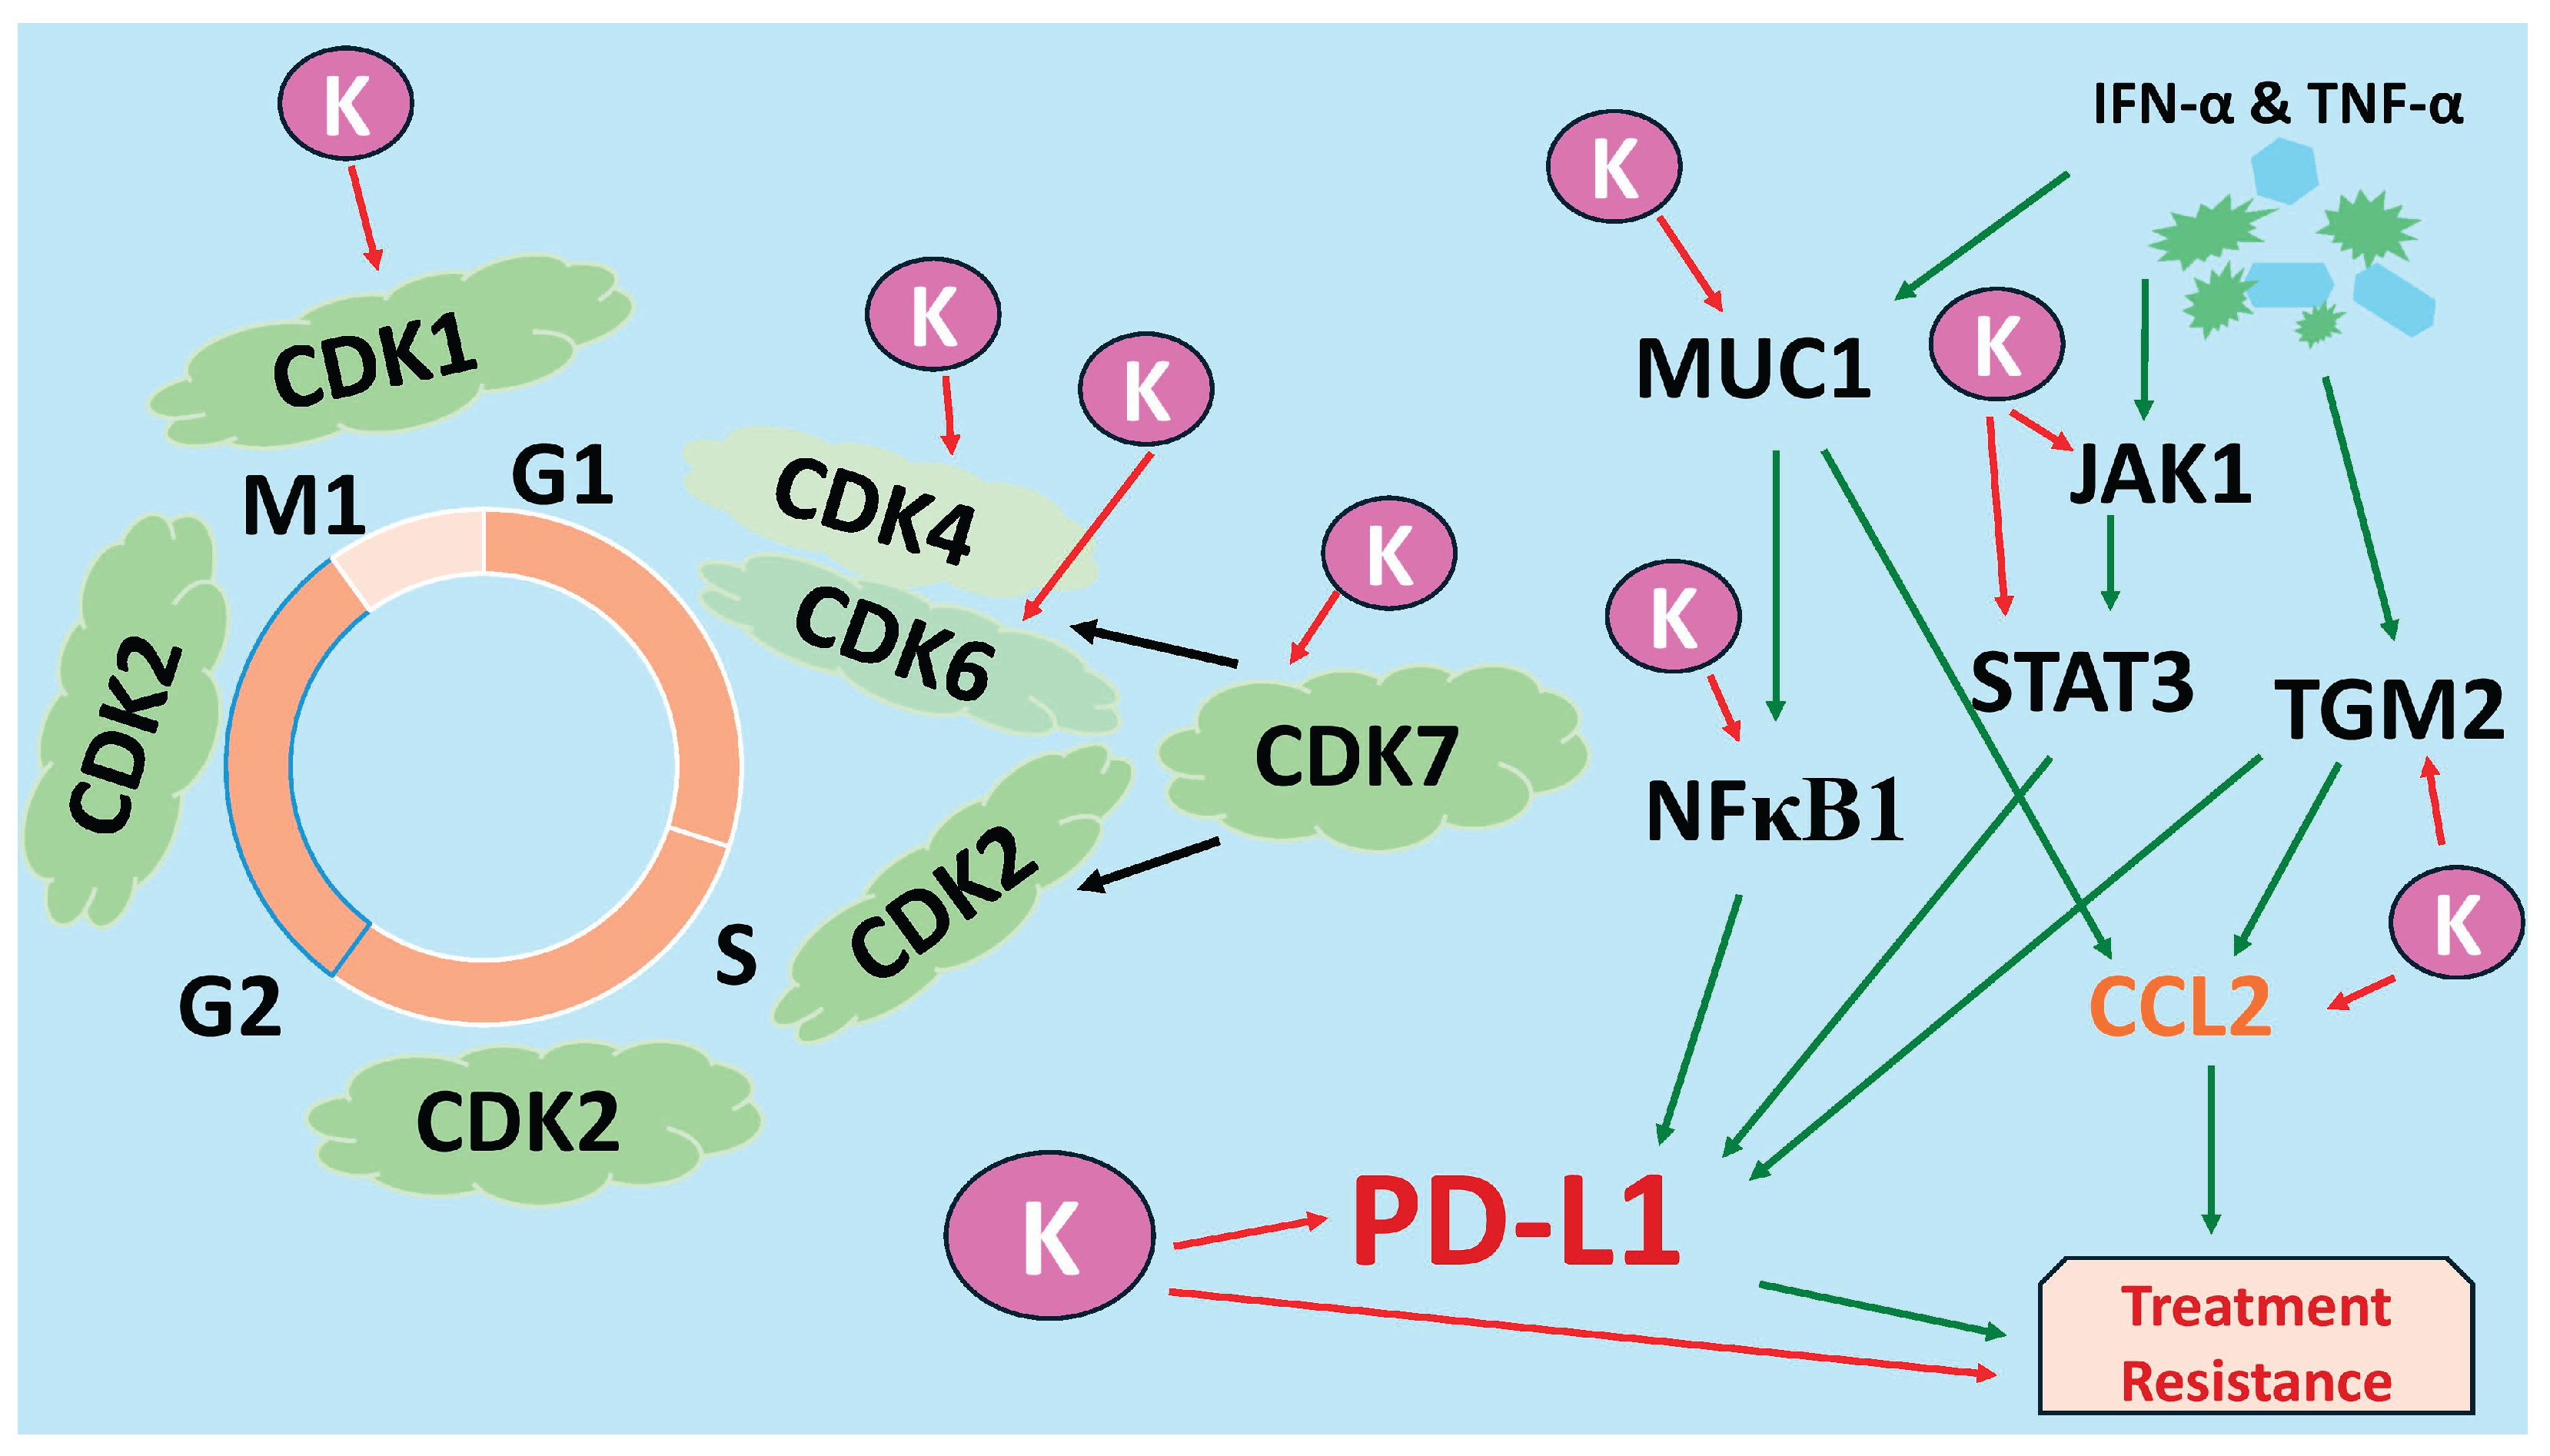
Figure 8.
Kaempferol (K) inhibits multiple cell cycle CDKs (CDK1, CDK4/6, CDK7) and key PD-L1-regulatory nodes (JAK1, STAT3, MUC-1, NF-κB1, CCL2, TGM2) in TNBC cells, thereby suppressing proliferation and pathways associated with immune evasion and treatment resistance. K corresponds to kaempferol, indicating its different anti-cancer mechanisms through the downregulation of several genes and proteins. The black arrow indicates that CDK7 phosphorylates and activates other CDKs; the green arrow indicates induction of expression, and the red arrow indicates inhibition of expression.
Disclaimer/Publisher’s Note: The statements, opinions and data contained in all publications are solely those of the individual author(s) and contributor(s) and not of MDPI and/or the editor(s). MDPI and/or the editor(s) disclaim responsibility for any injury to people or property resulting from any ideas, methods, instructions or products referred to in the content. |
© 2025 by the authors. Licensee MDPI, Basel, Switzerland. This article is an open access article distributed under the terms and conditions of the Creative Commons Attribution (CC BY) license (http://creativecommons.org/licenses/by/4.0/).
Copyright: This open access article is published under a Creative Commons CC BY 4.0 license, which permit the free download, distribution, and reuse, provided that the author and preprint are cited in any reuse.


