
Submitted:
11 November 2025
Posted:
12 November 2025
You are already at the latest version
Abstract
Museums contribute significantly to the cultural and economic development of destinations, yet university museums remain underexplored, especially in developing economies. This study examines how Experimenter Attractiveness (EA), Attitude toward the Museum (ATM), and Self-Concept Connection (SCC) influence Visit Experience (VE) and Loyalty by Location (LL). Using data from 1,400 visitors to university museums in Puebla, Mexico, Partial Least Squares Structural Equation Modeling (PLS-SEM) was applied to test the proposed relationships. All hypotheses were supported, with the strongest effects observed from EA to SCC and from SCC to VE, indicating that attractive and engaging experiences strengthen visitors’ self-connection and lead to greater satis-faction during the overall museum visit. The validated model demonstrates consistent relationships among constructs and contributes to understanding how attractiveness and self-connection shape behavioral intentions in the university museum context. These findings highlight the importance of experiential marketing and emotional engagement strategies, while future research should explore additional attitudinal and technological factors that enhance visitor loyalty.
Keywords:
experimenter attractiveness
; self-concept connection
; attitude toward the museum
; visit experience
; loyalty by location
; university museums
1. Introduction
According to ICOM (2022), a museum is “a not-for-profit, permanent institution in the service of society that researches, collects, conserves, interprets and exhibits tangible and intangible heritage. Open to the public, accessible and inclusive, museums foster diversity and sustainability. They operate and communicate ethically, professionally and with the participation of communities, offering varied experiences for education, enjoyment, reflection and knowledge sharing.”
Seminal contributions in the marketing field have depicted the expansion of museums’ services beyond their traditional and conservative boundaries, representing a shift toward a business-oriented environment. First, by rejecting the notion that conserving and preserving historical pieces, artworks, and cultural objects remains the sole core value of museums (Caldwell, 2002; Frey, 1998; Harrison & Shaw, 2004). Second, by demonstrating that non-profit organizations are not isolated from the commercial sector (McIntyre, 2010a). Consequently, the involvement of both private and government stakeholders may ensure financial stability, leading to higher revenues and greater visitation (Komarac et al., 2019; McIntyre, 2010). Finally, marketing programs can support decision-makers and staff in effectively responding to museumgoers’ needs and expectations (Harrison & Shaw, 2004). These developments, together with the evolution of customer-oriented offerings, have been widely reported in the literature, particularly with respect to large museums (Colbert & Dantas, 2019; Frey, 1998a; Kawashima, 1998; McLean, 1995a; Neilson, 2003).
Over the years, extensive literature in the marketing services field has emphasized the role of value propositions in offering coherent experiences consistent with the brand’s promise (Heinonen & Lipkin, 2023). In this regard, hedonic and sensorial stimuli have become crucial in eliciting individuals’ internal responses and, consequently, fostering consumer retention. Within the cultural domain, attractive product design encourages visitation (Alzaydi & Elsharnouby, 2023; Pereira et al., 2022; Yin et al., 2020), often through visual elements (Lv et al., 2020) and atmospheric cues (Chen, 2024; Goulding, 2000). These factors enhance both perceived value and purchase intentions. Visitors with positive attitudes are thus more likely to engage in consumption behaviors (Uslu & Tosun, 2024; Wu et al., 2023). However, empirical research addressing Self-Concept Connection (SCC) as an explanatory factor of museum visitors’ experiences remains scarce.
The expansion of digitalization and the integration of multiple touchpoints into companies’ strategies have further highlighted the importance of delivering consistent experiences to ensure loyalty, which is now a key source of competitive advantage (Batat, 2024). In cultural consumption, studies have documented the impact of on-site experiences on behavioral responses, particularly the formation of loyalty (Chen et al., 2020; Cheng et al., 2023; Errichiello et al., 2019; Liu et al., 2024; Ortega-Pérez et al., 2025; Preko et al., 2020; Zhang & Abd Rahman, 2022; Zhou & Pu, 2022; Zollo et al., 2020). Nonetheless, few studies have considered location as a decisive factor in attracting visitors (Florido-Benítez, 2025), especially when location itself becomes embedded as a component of loyalty.
Moreover, small museums located in less touristic areas of developing economies often face severe resource constraints, particularly financial. In such cases, budget allocation represents a critical managerial decision, as resources must be prioritized to address the most pressing needs. Academic research has only rarely examined the mechanisms that enable small museums to increase visitation (McNichol, 2005), especially within low- and middle-income economies ((Komarac et al., 2019), such as many Latin American countries.
In addition, investments in the museum sector have struggled with financial gaps at both global and regional levels, as private funding lags significantly behind public spending. This challenge became critical during the COVID-19 pandemic, when 90% of museums worldwide were forced to close, leading to a 60% drop in visitor income and a 52% loss in entrance fees (UNESCO, 2021, 2022). In Mexico, 70.9% of museums depend on public resources and 13.4% on private donors (INEGI, 2021). The lockdown, however, resulted in a reduction of subsidies (UNESCO, 2021), even though Mexican museums reported an influx of 12.7 million visitors, with Ciudad de México, Nuevo León, Guanajuato, and Puebla capturing 71.7% of the audience (INEGI, 2021).
Puebla is among the Mexican states with the largest number of museums (INEGI, 2021). Nonetheless, little attention has been given to museums directly operated by universities, whether in terms of financial resources, staffing, or operations. Since universities aim to strengthen their positioning within the educational sector while contributing to both their local communities and society at large, examining the manifest and latent variables influencing visitation and offerings may yield valuable managerial insights for these institutions.
This study seeks to fill the gaps in the literature regarding this underexplored context. By revisiting constructs from the early stages of research in this field, it addresses persistent issues within the context of developing nations. This approach not only responds to seminal gaps but also lays the groundwork for future studies exploring technological enablers. Specifically, we investigate the relationships among Experimenter Attractiveness (EA), Self-Concept Connection (SCC), Attitude Toward the Museum (ATM), and Visit Experience (VE), and their joint contribution to explaining Loyalty by Location (LL) in university museums.
The present article is structured into four sections. First, we provide an overview of the literature on the experiential domain in tourism and hospitality, with a particular focus on museums and cultural settings. Second, we present the research design and the PLS model. Third, we report the results, examining the relationships among the variables and their impact on location-based loyalty. Finally, we discuss the managerial and theoretical implications of the findings.
2. Literature Review
Antecedents of individuals’ experiences in museums can be traced back to Bourdieu’s concept of cultural capital, which emerges as a central driver of cultural consumption (Bourdieu, 1987), and Holbrook & Hirschman (1982)’s perspective on the hedonic nature of experiences. These two streams marked a milestone in subsequent research agendas, clarifying the psychological outcomes that extend beyond cognitive rationales and outlining the motivations underlying cultural products. This contributed to the adoption of experiential marketing approaches and emphasized the need to develop coherent customer journeys through multiple touchpoints mediated by digital ecosystems.
Over the years, literature on the cultural domain has increasingly focused on rethinking museum functions from a managerial perspective. In this sense, service delivery has been examined along three major dimensions—education, accessibility, and communication—highlighting the benefits of a managerial rather than a purely custodial approach (Gilmore & Rentschler, 2002). Moreover, professionals’ orientation toward museum activities, particularly in attracting visitors and securing financial support, has been emphasized. For instance, museum shops have been conceptualized as services contributing to the overall value of the museum experience (Komarac et al., 2019). Still, discrepancies between managers’ perceptions and service design highlight the importance of service quality, venue quality, and personal interactions in shaping behavioral intentions(Hume et al., 2006). Likewise, museums have fostered co-creation and co-production strategies to enhance authenticity within the visitor experience (Thyne & Hede, 2016), while the synergies between different stakeholders (e.g., artists vs. audiences) have been shown to influence co-production and increase the likelihood of positive co-creation (Ramsey White et al., 2009).
Further developments in this field have emphasized the role of visitors as determinants in the value-creation process. Addressing their needs and expectations represents a crucial gap, positioning experiential marketing as a key framework for understanding how marketing practices enable consumer engagement. Environmental conditions also shape museum experiences through sociocultural and cognitive factors (Goulding, 2000). Additional studies have examined the effects of background music (Correia Loureiro et al., 2019) and peripheral services such as museum shops, showing that the benefits of museum visits include cognitive, affective, and emotional dimensions, with behaviors and experiences contributing significantly to museum value. Uniqueness has similarly been identified as a decisive factor in attracting urban tourists (Brida et al., 2012). Moreover, Caru & Cova (2006) identified three modes of visitor engagement—nesting, investigating, and stamping—which reduce distance from the experience and increase immersion.
Following this line, scholars have sought to measure the quality of core and peripheral services and their impact on visitor satisfaction (Harrison & Shaw, 2004; Kawashima, 1998; Maher et al., 2011). During this phase, customer-centric perspectives gained prominence, stimulating empirical insights into drivers of visitation and re-consumption. Visitor orientation, when linked to technological innovation, has been shown to positively affect market and economic performance by increasing visitor numbers and revenues (Camarero et al., 2015). Mass-orientation strategies have proven effective for infrequent visitors with low repetition, while segmentation remains a viable approach for audiences characterized by high satisfaction (Harrison & Shaw, 2004). The relationship between service quality and satisfaction continues to serve as a key pathway in value generation for museums (Caldwell, 2002; Hume, 2015; Swanson & Davis, 2006). Additionally, a strand of research has focused on stakeholders—particularly sponsors—as crucial agents in bridging financial gaps. In competitive contexts, both sponsors and government actors play critical roles in securing resources(Colbert & Dantas, 2019; Gilmore & Rentschler, 2002; Maher et al., 2011; Swanson & Davis, 2006).
With the advent of digitalization, both practitioners and scholars have increasingly explored innovative breakthroughs in on-site and remote cultural experiences. Larger institutions, for instance, have targeted younger audiences through omnichannel structures embedded in digital ecosystems. Studies have demonstrated the efficiency of social media in enhancing visitation through improved perceptions of service and information quality (Blasco-Lopez et al., 2019). Similarly, social media has been shown to facilitate communication with new audience segments and stakeholders, with relatively low financial costs (Lazzareti et al., 2015). Technological integration has emerged as a key determinant of visitors’ positive perceptions of museums, with quality and customer learning outcomes improving performance judgments (Hume, 2015). Research has also examined communication factors in virtual exhibitions (Kim, 2018) and the use of mobile applications as recommendation services that extend visitation beyond the physical museum space (Koukuolis et al., 2019).
Recent contributions highlight the opportunities for implementing non-immersive digital technologies to stimulate behavioral outcomes. For example, mobile apps have been shown to increase visitors’ purchase intentions in museum shops without negatively affecting the overall experience (Dou et al., 2021). Similarly, AR applications shape attitudes toward the museum experience by reinforcing inspiration and quality as critical determinants of visitation (Wu et al., 2023). Empirical findings on immersive technologies also demonstrate their role in producing diverse emotional and cognitive outcomes, particularly among younger audiences. Smart Tourism Technologies (STTs)—especially AR and VR—facilitate memorability, satisfaction, and behavioral intentions in museum settings (Yang & Zhang, 2022). Experiential immersion through devices such as headsets, apps, or VR glasses positively influences affective and conative responses among Gen Z and millennial visitors (Robaina-Calderin et al., 2023). Likewise, external anchors such as VR tours improve learning outcomes and satisfaction with physical exhibitions (Huang et al., 2025). Visitors exposed to mixed services (e.g., MR technology combined with traditional tours) report higher perceptions of existential authenticity and quality than those experiencing only guided tours or MR services (Çiftçi & Çizel, 2024). Moreover, VR has been shown to enhance perceptions of usefulness and learning, with positive emotions playing a critical role in shaping behavioral intentions in cultural contexts (Errichiello et al., 2019). Similarly, AR usefulness, user satisfaction, and social mimicry have been associated with favorable attitudes toward immersive exhibitions (Khalil et al., 2023), while visual design in AR has been linked to positive perceptions of usefulness, particularly in the Chinese context (Li et al., 2024).
As illustrated, the strategic direction of museums has evolved from a focus on collecting and preserving to the expansion of core activities with peripheral services, recognizing the importance of visitors and stakeholders, and adapting offerings to meet their needs and expectations. More recently, museums have embraced novel technologies that enhance customer value through digital ecosystems, reaching a stage of product innovativeness.
Nevertheless, much of the literature has concentrated on large cultural institutions. Small and local museums have received relatively little attention, particularly regarding the marketing practices and strategies that shape consumer behavior. A critical gap remains in examining perceptual and attitudinal variables, their relationships with visitor experiences, and, ultimately, their influence on loyalty.
3. Hypotheses Development
3.1. Experimenter Attractiveness
Since experience is inherently subjective, it requires specific stimuli to be triggered. Within the museum context, previous studies have demonstrated that visitors are prone to seek aesthetic onsite stimuli (Jung et al., 2018; Li et al., 2024). Accordingly, visual resources play a crucial role in shaping visitors’ perceptions and act as predictors of experience (Carù & Cova, 2006; Chen, 2024; Goulding, 2000; vom Lehn & Heath, 2016). On the one hand, facilities, collections, and—more recently—technological wearables significantly influence the overall evaluation of cultural services (Gu et al., 2024). On the other hand, intangible aspects such as communication strategies, employee performance, service encounters, and peripheral services also contribute to enhancing visitors’ purchase intentions and perceived value (Çiftçi & Çizel, 2024; Correia Loureiro et al., 2019; Gilmore & Rentschler, 2002; Gofman et al., 2011; Harrison & Shaw, 2004; Kim Lian Chan, 2009).
Taken together, the literature suggests a strong nexus between appealing onsite elements and visitors’ evaluative judgments. However, to the best of the authors’ knowledge, no prior research has examined how aesthetic elements may foster deeper connections with individuals through transformations in self-concept. Building upon this gap, we propose the following hypotheses, employing the measurement scales developed by Ohanian (1990) and Escalas & Bettman (2005):
H1.
Experimenter Attractiveness (EA) is positively and significantly related to Attitude toward the Museum (ATM).
H2.
Experimenter Attractiveness (EA) is positively and significantly related to Self-Concept Connection (SCC).
3.2. Attitude Toward the Museum
Existing research in this field has identified that past experiences, cultural capital (Bourdieu, 1987), peripheral services and environment, and education background of individuals (McLean, 1995b), affect visitors’ attitudes (Brida et al., 2013; Maher et al., 2011; Zanibellato et al., 2018).
However, since contemporary visitors of museums have been seen as co-creators, emotions have acquired an essential role within this experiential process (Hume, 2015). Palmer and Koenig-Lewis (2010) proposed that positive emotions toward brands are closely related with satisfied customers. Similarly, (Smith, 2020) suggested that attitude toward a brand is positive associated with customer loyalty; emphasizing that those visitors open to new experiences are more likely to be satisfied.
Specifically, (Riva & Agostino, 2022) provided evidence of how visitors with diverse cultural backgrounds revealed latent dimensions of their personal experience in museums. Hence, a mixture of semantically similar words was used in their personal narratives to describe the encounters to the site, in terms of events during the visitation, perceptions, and appraisals. Therefore, comments indicated a latent dimension related with re-visitation. (Hwang & Lee, 2019) explored the relationship the effect of brand attitude. Hence, they mentioned that attitudes towards brands affect brand loyalty.
Particularly, Aggarwal and McGill (2012) stated that anthropomorphized brands may influence on consumer behavior outside the brand context especially when the brand is liked. This shows that aligning preferences of customers with the image of the brand can help organizations to achieve marketing and cultural goals. Therefore,
Nevertheless, to the best of the authors’ knowledge there are no articles that had focused on Attitude toward Museums (ATM) and Visit Experience (VE) in the context of museums. Therefore, in order to measure attitudes of visitors toward museum, we used the scale of likeability proposed by Aggarwal and McGill (2012). In that respect, this study aims to explore the relationship between ATM and VE, as shown the following hypothesis:
H3.
Attitude toward the Museum (ATM) is positively and significantly related to Visit Experience (VE).
3.3. Self-Concept Connection
Consumption patterns are believed to be linked with a social function. (Bourdieu, 1987) described social structures differences through consumption practices of cultural services and goods. While Holt (1998) broadened this aspect regarding the benefits and symbolic meanings derived from interactions of individuals with brands, which are ultimately expressions of their identities.
Thus, congruence between social and ideal social self-images has a positive impact on overall experience (Han & Hyun, 2017). Particularly, (Dommer & Swaminathan, 2013) examined university identity and demonstrated that people increase possession-self connection when associations of the in-group goods enhance their self. On this basis, (Swanson & Davis, 2006) noted that belonging to a group affects positively consumer’s self-steem. Similarly, (Hwang & Lee, 2019) revealed the impact on well-being perception of tourists derived from educational, entertainment, escapism and aesthetic experiences.
Therefore, identification of consumers with regard to an arts organization can greatly contribute to self-definition and a state of wellness, encouraging individuals to participate in arts consumption (Bourdieu, 1987; Colbert & St-James, 2014). In that respect, Mehmetoglu and Engen (2011) argued that visitation experiences are significant to self-perception, affecting visitors’ overall satisfaction. Besides, in terms of location, (Rather et al., 2019) claimed that place attachment -which comprises two components: place identity and place dependance- relates positively with costumer engagement.
Since connection with the self and cultural venues has not been analyzed in university museums context. We adapted and used the seven items provided by Escalas and Bettman (2005) in order to measure connection strength. Consequently, this study seeks to validate the association between Self-Concept Connection (SCC) and Visit Experience (VE) with the following hypothesis:
H4.
Self-Concept Connection (SCC) is positively and significantly related to visit experience (VE).
3.4. Visit Experience
The association between experience and loyalty is often mediated by other post-purchase constructs. Due to the rationale that a long-term behaviour can only be achieved after repeated consumption situations (Obaidalahe et al., 2017), and these result from evaluating positively the experience through high levels of perceived value (Blasco López et al., 2020). Thus, diverse factors aim to cover the distance between both customer journey phases from psychological ground. In cultural stage, lovemarks’ emotional and cognitive bonds have served as mediators towards loyalty (N. Chen et al., 2020). Also, social and individual factors function as explanatory factors linking theatregoers experience and loyalty (Obaidalahe et al., 2017). Similarly, overall museum experience is strongly associated with tourist satisfaction and therefore loyalty, lastly affecting the willingness to pay more (Preko et al., 2020). Therefore, current scenario suggests that affective and cognitive triggers are shaping the performance of attitudinal and behavioural outcomes.
Additionally, the nexus between experience and loyalty has not been explored yet in museums context. Studies looking into this relationship often consider satisfaction as an intermediate construct that permits a linear flow of customer journey. Furthermore, experience value, under any of its variations, is regarded in a distinct conceptual level in comparison with satisfaction, therefore, a direct impact of experience on loyalty is dismissed statim. However, novel empirical insights in cultural tourism have enlightened the application of this pathway. Thus, gastronomy experience indicates a direct and positive effect on loyalty towards the destination (Ortega-Pérez et al., 2025). Similarly, flow experience is a positive predictor of loyalty in cultural heritage destinations (Liu et al., 2024). Similarly, findings in different sectors, as retailing, have shown that a direct connection between both also yield a significant effect (Chen, 2024).
3.5. Loyalty by Location
Loyalty can be defined as a commitment towards a product or service, encompassing behaviors and attitudes (Bloemer & De Ruyter, 1999). Literature in cultural tourism have shed light on how certain location may encourage visitors’ ties developing loyalty. Heritage sites are frequently cited as venues that may display positive sentiments in tourists. Prior studies have supported this notion based on two aspects, one regarding the identification with the location itself, mainly due to physical and atmospheric attributes; another, relying on intangible aspects embedded in a place, such as a sense of community.
Studies on archaeological ruins or sites with historical values illustrate this situation. The Pyramids of Sun and Moon in Perú (Blasco López et al., 2020), Huanglongxi, a heritage town in the suburds of Cheng Du (China) (Lv et al., 2020), the city of Córdoba (Spain) (Ortega-Pérez et al., 2025). In museum context, the National Museum in Accre (Ghana) (Preko et al., 2020). In this regard, loyalty entails both an attitudinal and a behavioural orientation given by recommendation and revisitation (Singh et al., 2024).
Furthermore, loyalty formation can be developed through the promise of social and sustainable benefits (Musa et al., 2025), history and cultural values (Liang et al., 2024), also values and culture of a community have demonstrated to influence positively visitors’ attitudes toward attendance (Foster et al., 2020). To examine this construct in university museums context, we have adapted Hozier & Stem (1985) scale.
However, given the limited evidence provided in empirical studies in cultural context around the route experience-loyalty, especially within a subgroup of this sector such as university museums. We aim to explore visitors’ experience through the adaptation of van Ittersum et al. (2013) scale, seeking to validate a linkage between Visit Experience (VE) and Loyalty by Location (LL). Therefore, proposing the following hypothesis:
H5.
Visit Experience (VE) is positively and significantly related to Loyalty by Location (LL).
The proposed model explores the causal relationships between variables such as Experimenter Attractiveness (EA), Self-Concept Connection (SCC), Attitude toward the Museum (ATM), and Visit Experience (VE) in shaping Loyalty by Location (LL) within the museum context. Building on the outlined theoretical framework, this study deepens the understanding of museum visitation from a demand perspective, highlighting the impact of overall experience on attendee behavior. It addresses key practical challenges associated with attendance at physical cultural spaces. First, it sheds light on the process of customer engagement within a cultural setting, and second, it offers insights into how geographical location influences the consumption of experiences. Moreover, this holistic approach not only strengthens theoretical frameworks within museum studies but also provides practical insights for enhancing visitor retention and satisfaction, ensuring the long-term sustainability and cultural relevance of museums. Figure 1 illustrates the integrated model and the proposed relationships.
4. Materials and Methods
The questionnaire was originally written in English and then translated to Spanish by a bilingual copyeditor’s expert in the field of social marketing. The original items were then tested in a pre-test with a sample of 40 consumers. The feedback obtained made it possible to identify some confusion surrounding certain items, especially with the items related to adjectives for describing the museum. After the pre-test we distributed our survey to the visitors once they leave the museum. Taking careful we select one member in case of a group visitor and for individual persons each third person. The participation was voluntary, and it was showed in the Table 1.
We designed a questionnaire with the variables studied related to Experimenter Attractiveness (EA), Attitude toward the Museum (ATM), Self-Concept Connection (SCC), Visit Experience (VE), and Loyalty by Location (LL). We used a different scale for each dimension in relation to the model proposed. According to Carfora and Catellani (2021) the model into the PLS technique could be used with different scales among semantic and Likert. However, the validation and reliability test cannot be supplanted. In Table 2 was indicated all the dimensions and items utilized.
5. Results
5.1. Questionnaire Development
The PLS-SEM technique was used to support the model. All dimensions utilized were reflective; moreover, the findings obtained showed inconsistencies in the values of some items. The procedure used was to eliminate the indicators that reached a sufficient strength in each construct. The values with a loading of less than 0.7 were drooped (Hair et al., 2017). It started with the initial variables of the model until ending with the dependent variable. It was included the VIF value as a Belsley (1991) recommend to incorporate or automate the collinearity diagnostics less to 5. Finally, the model fit was explored by SRMR estimated model with the good fit model less 0.08 by Hu and Bentler (1998). Table 3 shows the cleaning rounds up to the sixth round with all decisions taken. In addition, as can be seen, the loadings, VIF values and SRMR estimated model are shown until to get a clean model.
It was calculated Cronbach’s Alpha, rho_A, Composite Reliability and Average Variance Extracted (AVE). The Cronbach’s alpha coefficient was satisfactory, as all constructs reached a coefficient greater than 0.7 (Hair, 2010). Likewise, the Rho_A index for our dimensions was larger than 0.7, indicating that they are homogenous (Werts et al., 1974). In the same way, the composite reliability (CR) values were above 0.9, indicating an excellent internal consistency reliability (Hair et al., 2017). Equally, the AVE of each dimension exceeded the acceptability value of 0.5 (Fornell & Larcker, 1981; C.-C. Huang et al., 2013) (See Table 4).
In the next step, we tested a discriminant validity in the Table 5. The value of the diagonal is the square root of the AVE and it should be higher than the correlation coefficient of the two variables (Fornell & Larcker, 1981).
After evaluating and running all tests, we estimated the model with path coefficients with a bootstrapping of 10,000 resamples. All proposed hypotheses were confirmed with path coefficients, standard deviation, t-value and p-value tests (see Table 6 and Figure 2). Particularly, H2 and H4 showed to be the routes with stronger effects, (β = 0.459, p-value > 0.001; β = 0.679, p-value > 0.001). Thus, this association applies a better understating to the consumer through the Experimenter Attractiveness (EA), Self-Concept Connection (SCC) and finally Visit Experience (VE). Also, H1 was a good result highlighting the Experimenter Attractiveness (EA) to forming an Attitude toward the Museum (ATM) (β = 0.326, p-value > 0.001). This result generated an approach to expectative consumer before the visit experience. In the same way, H5 (β = 0.361, p-value > 0.001) touch a knowledge to the visitors selecting each museum by the visit experience and not much by location. The weak hypothesis was H3 assessing the Attitude toward the Museum (ATM) to Visit Experience (VE), there not relation with the attitude and performance in the day that was the visit (β = 0.102, p-value > 0.001).
It was notable that R2 in VE is 0.534, higher than the 0.130 offered by LL. Also, R2 (SCC and ATM) were 0.211, 0.106, indicating that both components reflect 53.4% of Visit Experience (VE). This result was an outstanding explaining more that the half of whole visit experience (VE).
6. Discussion
The refined model shows a solid consistency between items, dimensions and their causal relationships. This analysis gives a broad picture of the importance of measuring the variables of Experimenter Attractiveness (EA), Attitude toward the Museum (ATM), Self-Concept Connection (SCC), Visit Experience (VE) and Loyalty by Location (LL). Museum managers should be aware of the importance of experiential marketing and its impact on visitor satisfaction. Increasingly, cultural offerings must take into account their market segments and their post-visit evaluation. This research highlights the importance of the engaging experience to the visitor’s own connection. That is, the positive outcomes of the experience involve how visitors see themselves and whether the art demonstrated in their galleries has an impact on their lives. Additionally, this connection has a strong impact on the evaluation of the Visit Experience (VE).
On another point, the relationship of the engaging experience to museum attitude formation shows a lesser, but still significant impact. Possibly, because attitude as a variable that is formed over time, could still be considered immature in the relationship. Likewise, the attitude does not show a strong impact on the experience of the visit, since if it has not been formed beforehand, it cannot be supported.
In another aspect, the Visit Experience (VE) is considered to have a positive impact on loyalty to the museum. Although this relationship has considerable strength, it does not meet the requirements of the explanation of the dependent variable. That is, loyalty to the museum cannot be explained through visit experience (VE). This situation can be discussed through two aspects. The first is that if the visitor considers that the experience of the visit was very satisfactory according to his expectations, he does not have any importance in considering the location to generate a possibility of revisiting the same museum. And secondly, Loyalty by Location (LL), as a matter of convenience, cannot be considered as a critical success factor. Although, the related indicators in the variable form a strong argument towards the advantages of having local museums, such as: supporting them by visiting them regularly, generating satisfying museum experiences, having a variety of local museum selection, and supporting the city by frequent visitation to local museums.
7. Conclusions
Our study contributes to the museum research agenda by proposing a model in which Experimenter Attractiveness (EA), Attitude toward the Museum (ATM), and self-concept connection (SCC) act as antecedents of visitor experience (VE), which ultimately influences loyalty shaped by location (LL). All proposed hypotheses were supported, with a stronger effect observed from EA on SCC (H2) and from SCC on VE (H4). This indicates that an appealing university museum can contribute to the formation of a positive self-perception among its attendees. Furthermore, maintaining favourable attitudes may enhance the overall visitation experience.
Although H1 and H5 were also significant in the model testing, they exhibited a moderate effect. This suggests that a museum’s appearance can generate favourable attitudes, thereby confirming previous findings that physical and atmospheric elements serve as sources that positively shape consumers’ perceptions and judgments (C.-T. Chen, 2024; Lv et al., 2020). Lastly, although H3 demonstrated the weakest effect, it still validates the direct connection between experience and loyalty without a mediator. This shows that a positive visitation experience fosters long-term behaviours, characterized by an increased likelihood of returning to a place (Liu et al., 2024). The small effect size may be attributable to the operationalization of loyalty, which was defined by an attitudinal rating centered on choosing a museum based on its location. Consequently, location may not be a determinant aspect when measuring loyalty. Other attitudinal factors, such as word-of-mouth promotion or e-WOM, could be considered instead.
Although our model follows a conventional structure wherein an external stimulus affects individual judgments and thus the psychological state during a cultural visit, it also offers insight into a scarcely investigated linkage in museum and cultural tourism literature: the direct path between experience and loyalty. Additionally, it invites reflection on the linearity of the customer journey, given the nature of consumption and the contextual constraints that delineate service delivery. This model helps fill a gap in the literature by proposing and validating a direct connection between these two components, suggesting they can be operationalized and modelled without a mediator. However, this relationship could be strengthened by incorporating other behavioural or attitudinal characteristics of loyalty.
This study reveals the underlying mechanisms of attendance at university museums, highlighting the experience of Mexican attendees. However, several limitations should be addressed in future research. Since attitude is primarily formed through direct encounter and subjective processing, this variable may not be applicable in the model until a captive market is achieved. Therefore, other variables should be considered as potential drivers. In contrast, the attractiveness of the experience and individuals’ self-connection emerged as outstanding factors in meeting visitor satisfaction. This represents a key finding for designing actions within the cultural offering to help visitors better satisfy their needs, thereby generating a broader benefit for societal value. Further specification of the sources of attractiveness—whether physical or intangible—is also needed. Of particular interest is understanding how the adoption of innovative technologies may encourage repeat visitation.
Author Contributions
Conceptualization, H.H.P.V., P.A.F.G., and T.I.A.J.; methodology, H.H.P.V.; software, H.H.P.V.; validation, H.H.P.V, P.A.F.G., and M.P.M.R.; formal analysis, H.H.P.V.; investigation, P.A.F.G; data curation, H.H.P.V.; writing—original draft preparation, H.H.P.V, and P.A.F.G.; writing—review and editing, P.A.F.G.; visualization, P.A.F.G.; supervision, M.P.M.R. All authors have read and agreed to the published version of the manuscript.
Funding
This research received no external funding.
Institutional Review Board Statement
The study was conducted in accordance with the Declaration of Helsinki. This study was exempt from ethical review and approval because it used anonymized information data for research purposes, which do not pose any harm to human subjects and do not involve the use of sensitive personal information or commercial interests.
Informed Consent Statement
Informed consent was obtained from all subjects involved in the study.
Data Availability Statement
The data presented in this study are available on request from the corresponding author due to privacy restrictions
Conflicts of Interest
The authors declare no conflicts of interest.
References
- Aggarwal, P., & McGill, A. L. (2012). When Brands Seem Human, Do Humans Act Like Brands? Automatic Behavioral Priming Effects of Brand Anthropomorphism. Journal of Consumer Research, 39(2), 307–323. [CrossRef]
- Alzaydi, Z. M., & Elsharnouby, M. H. (2023). Using social media marketing to pro-tourism behaviours: The mediating role of destination attractiveness and attitude towards the positive impacts of tourism. Future Business Journal, 9(1), 42. [CrossRef]
- Batat, W. (2024). What does phygital really mean? A conceptual introduction to the phygital customer experience (PH-CX) framework. Journal of Strategic Marketing, 32(8), 1220–1243. [CrossRef]
- Belsley, D. A. (1991b). A Guide to using the collinearity diagnostics. Computer Science in Economics and Management, 4(1), 33–50. [CrossRef]
- Blasco López, M. F., Virto, N. R., Manzano, J. A., & García-Madariaga, J. (2020). Archaeological tourism: Looking for visitor loyalty drivers. Journal of Heritage Tourism, 15(1), 60–75. [CrossRef]
- Blasco-Lopez, F., Recuero Virto, N., Aldas Manzano, J., & Cruz Delgado, D. (2019). Facebook’s power: Factors influencing followers’ visit intentions. Spanish Journal of Marketing - ESIC, 23(1), 95–117. [CrossRef]
- Bloemer, J., & De Ruyter, K. (1999). Customer Loyalty in High and Low Involvement Service Settings: The Moderating Impact of Positive Emotions. Journal of Marketing Management, 15(4), 315–330. [CrossRef]
- Bouder-Pailler, D. (1999). A Model for Measuring the Goals of Theatre Attendance. International Journal of Arts Management, 1(2), 4–15.
- Bourdieu, P. (1987). Distinction: A Social Critique of the Judgement of Taste. Harvad University Press.
- Brida, J. G., Disegna, M., & Scuderi, R. (2013). Visitors of two types of museums: A segmentation study. Expert Systems with Applications, 40(6), 2224–2232. [CrossRef]
- Brida, J. G., Meleddu, M., & Pulina, M. (2012). Understanding Urban Tourism Attractiveness: The Case of the Archaeological Ötzi Museum in Bolzano. Journal of Travel Research, 51(6), 730–741. [CrossRef]
- Caldwell, N. (2002). (Rethinking) the measurement of service quality in museums and galleries. International Journal of Nonprofit and Voluntary Sector Marketing, 7(2), 161–171. [CrossRef]
- Camarero, C., Garrido, M. J., & Vicente, E. (2011). How cultural organizations’ size and funding influence innovation and performance: The case of museums. Journal of Cultural Economics, 35(4), 247–266. [CrossRef]
- Camarero, C., Garrido, M. J., & Vicente, E. (2015). Achieving effective visitor orientation in European museums. Innovation versus custodial. Journal of Cultural Heritage, 16(2), 228–235. [CrossRef]
- Carfora, V., & Catellani, P. (2021). The Effect of Persuasive Messages in Promoting Home-Based Physical Activity During COVID-19 Pandemic. Frontiers in Psychology, 12, 644050. [CrossRef]
- Carù, A., & Cova, B. (2006b). How to facilitate immersion in a consumption experience: Appropriation operations and service elements. Journal of Consumer Behaviour, 5(1), 4–14. [CrossRef]
- Chen, C.-T. (2024). Atmospherics fosters customer loyalty: Exploring the mediating effects of memorable customer experience and customer satisfaction in factory outlet malls in Taiwan. Journal of Retailing and Consumer Services, 80, 103936. [CrossRef]
- Chen, H., & Rahman, I. (2018). Cultural tourism: An analysis of engagement, cultural contact, memorable tourism experience and destination loyalty. Tourism Management Perspectives, 26, 153–163. [CrossRef]
- Chen, N., Wang, Y., Li, J., Wei, Y., & Yuan, Q. (2020). Examining Structural Relationships among Night Tourism Experience, Lovemarks, Brand Satisfaction, and Brand Loyalty on “Cultural Heritage Night” in South Korea. Sustainability, 12(17), 6723. [CrossRef]
- Cheng, X., Chi, X., & Han, H. (2023). Perceived authenticity and the heritage tourism experience: The case of Emperor Qinshihuang’s Mausoleum Site Museum. Asia Pacific Journal of Tourism Research, 28(6), 503–520. [CrossRef]
- Çiftçi, Ş. F., & Çizel, B. (2024). Exploring relations among authentic tourism experience, experience quality, and tourist behaviours in phygital heritage with experimental design. Journal of Destination Marketing & Management, 31, 100848. [CrossRef]
- Coblence, E., & Sabatier, V. (2014). Articulating Growth and Cultural Innovation in Art Museums. International Studies of Management & Organization, 44(4), 9–25. [CrossRef]
- Colbert, F., & Dantas, D. C. (2019). Customer Relationships in Arts Marketing: A Review of Key Dimensions in Delivery by Artistic and Cultural Organizations. International Journal of Arts Management, 21(2), Article 2.
- Colbert, F., & St-James, Y. (2014). Research in Arts Marketing: Evolution and Future Directions. Psychology & Marketing, 31(8), 566–575. [CrossRef]
- Correia Loureiro, S. M., Roschk, H., & Lima, F. (2019). The Role of Background Music in Visitors’ Experience of Art Exhibitions: Music, Memory and Art Appraisal. International Journal of Arts Management, 22(1), Article 1.
- Dommer, S. L., & Swaminathan, V. (2013). Explaining the Endowment Effect through Ownership: The Role of Identity, Gender, and Self-Threat. Journal of Consumer Research, 39(5), 1034–1050. [CrossRef]
- Errichiello, L., Micera, R., Atzeni, M., & Del Chiappa, G. (2019). Exploring the implications of wearable virtual reality technology for museum visitors’ experience: A cluster analysis. International Journal of Tourism Research, 21(5), 590–605. [CrossRef]
- Escalas, J. E., & Bettman, J. R. (2005). Self-Construal, Reference Groups, and Brand Meaning. Journal of Consumer Research, 32(3), 378–389. [CrossRef]
- Extraordinary General Assembly of ICOM. (2022, August 24). International Council of Museums. https://icom.museum/en/resources/standards-guidelines/museum-definition/.
- Fillis, I., Lehman, K., & Miles, M. P. (2017). The museum of old and new art: Leveraging entrepreneurial marketing to create a unique arts and vacation venture. Journal of Vacation Marketing, 23(1), Article 1. [CrossRef]
- Florido-Benítez, L. (2025). Theme parks and museums in Asia and the Pacific region boost tourism demand in urban areas. SN Business & Economics, 5(3), 28. [CrossRef]
- Fornell, C., & Larcker, D. F. (1981). Evaluating Structural Equation Models with Unobservable Variables and Measurement Error. Journal of Marketing Research, 18(1), 39. [CrossRef]
- Foster, S., Fillis, I., Lehman, K., & Wickham, M. (2020). Investigating the relationship between visitor location and motivations to attend a museum. Cultural Trends, 29(3), 213–233. [CrossRef]
- Frey, B. S. (1998b). Superstar Museums: An Economic Analysis. Journal of Cultural Economics, 22(2), 113–125. [CrossRef]
- Gilmore, A., & Rentschler, R. (2002b). Changes in museum management: A custodial or marketing emphasis? Journal of Management Development, 21(10), 745–760. [CrossRef]
- Gofman, A., Moskowitz, H. R., & Mets, T. (2011b). Marketing Museums and Exhibitions: What Drives the Interest of Young People. Journal of Hospitality Marketing & Management, 20(6), 601–618. [CrossRef]
- Goulding, C. (2000b). The museum environment and the visitor experience. European Journal of Marketing, 34(3/4), 261–278. [CrossRef]
- Gu, Q., Li, M., & Kim, S. S. (2024b). Effects of liquor and wine heritage stimuli on tourists’ experiential value and behavioral intentions. Journal of Destination Marketing & Management, 34, 100961. [CrossRef]
- Hair, J. F., Black, W. C., & Babin, B. J. (2010). Multivariate Data Analysis: A Global Perspective. Pearson Education.
- Hair, J., Hollingsworth, C. L., Randolph, A. B., & Chong, A. Y. L. (2017). An updated and expanded assessment of PLS-SEM in information systems research. Industrial Management & Data Systems, 117(3), 442–458. [CrossRef]
- Han, H., & Hyun, S. S. (2017). Key factors maximizing art museum visitors’ satisfaction, commitment, and post-purchase intentions. Asia Pacific Journal of Tourism Research, 22(8), 834–849. [CrossRef]
- Harrison, P., & Shaw, R. (2004b). Consumer Satisfaction and Post-purchase Intentions: An Exploratory Study of Museum Visitors. International Journal of Arts Management, 6(2), 23–32.
- Heinonen, K., & Lipkin, M. (2023). Ordinary customer experience: Conceptualization, characterization, and implications. Psychology & Marketing, 40(9), 1720–1736. [CrossRef]
- Holbrook, M. B., & Hirschman, E. C. (1982b). The Experiential Aspects of Consumption: Consumer Fantasies, Feelings, and Fun. Journal of Consumer Research, 9(2), 132–140.
- Holt, D. B. (1998). Does Cultural Capital Structure American Consumption? Journal of Consumer Research, 25(1), 1–25. [CrossRef]
- Hozier, G. C., & Stem, D. E. (1985b). General retail patronage loyalty as a determinant of consumer outshopping behavior. Journal of the Academy of Marketing Science, 13(1), 32–46. [CrossRef]
- Hu, L., & Bentler, P. M. (1998). Fit indices in covariance structure modeling: Sensitivity to underparameterized model misspecification. Psychological Methods, 3(4), 424–453. [CrossRef]
- Huang, C.-C., Wang, Y.-M., Wu, T.-W., & Wang, P.-A. (2013). An Empirical Analysis of the Antecedents and Performance Consequences of Using the Moodle Platform. International Journal of Information and Education Technology, 217–221. [CrossRef]
- Huang, Z. (Joy), Lv, C., Gu, J., & Long, L. (2025). Virtual reality and museum tourism in the anchoring paradigm. Current Issues in Tourism, 28(11), 1768–1786. [CrossRef]
- Hume, M. (2015). To Technovate or Not to Technovate? Examining the Inter-Relationship of Consumer Technology, Museum Service Quality, Museum Value, and Repurchase Intent. Journal of Nonprofit & Public Sector Marketing, 27(2), Article 2. [CrossRef]
- Hume, M., Sullivan Mort, G., Liesch, P. W., & Winzar, H. (2006b). Understanding service experience in non-profit performing arts: Implications for operations and service management. Journal of Operations Management, 24(4), 304–324. [CrossRef]
- Hwang, J., & Lee, J. (Jay). (2019). A strategy for enhancing senior tourists’ well-being perception: Focusing on the experience economy. Journal of Travel & Tourism Marketing, 36(3), 314–329. [CrossRef]
- Jung, T. H., Lee, H., Chung, N., & Tom Dieck, M. C. (2018). Cross-cultural differences in adopting mobile augmented reality at cultural heritage tourism sites. International Journal of Contemporary Hospitality Management, 30(3), 1621–1645. [CrossRef]
- Kawashima, N. (1998). Knowing the Public. A Review of Museum Marketing Literature and Research1. Museum Management and Curatorship, 17(1), Article 1. [CrossRef]
- Khalil, S., Kallmuenzer, A., & Kraus, S. (2024). Visiting museums via augmented reality: An experience fast-tracking the digital transformation of the tourism industry. European Journal of Innovation Management, 27(6), 2084–2100. [CrossRef]
- Kim Lian Chan, J. (2009). The Consumption of Museum Service Experiences: Benefits and Value of Museum Experiences. Journal of Hospitality Marketing & Management, 18(2–3), 173–196. [CrossRef]
- Komarac, T., Ozretic-Dosen, D., & Skare, V. (2019). The Role of the Museum Shop: Eliciting the Opinions of Museum Professionals. International Journal of Arts Management, 21(3), Article 3.
- Li, J., Tu, X.-F., Nie, J.-W., Ye, J., & Lv, C. (2024). Visitors’ Acceptance of Wearable AR Technology in Museums. Sage Open, 14(4), 21582440241303507. [CrossRef]
- Liang, J., Zhang, S., & Lu, L. (2024). Research on the Influence of Cultural Memory in Agricultural Heritage on Brand Loyalty. Sustainability, 16(10), 4162. [CrossRef]
- Liu, H., Park, K.-S., & Wei, Y. (2024). An extended stimulus-organism-response model of Hanfu experience in cultural heritage tourism. Journal of Vacation Marketing, 30(2), 288–310. [CrossRef]
- Lv, X., Li, C. (Spring), & McCabe, S. (2020). Expanding theory of tourists’ destination loyalty: The role of sensory impressions. Tourism Management, 77, 104026. [CrossRef]
- Maher, J. K., Clark, J., & Motley, D. G. (2011). Measuring museum service quality in relationship to visitor membership: The case of a children’s museum. International Journal of Arts Management, 13(2), 29–42.
- McIntyre, C. (2010). Designing museum and gallery shops as integral, co-creative retail spaces within the overall visitor experience. Museum Management and Curatorship, 25(2), 181–198. [CrossRef]
- McLean, F. (1995). A marketing revolution in museums? Journal of Marketing Management, 11(6), 601–616. [CrossRef]
- McNichol, T. (2005). Creative marketing strategies in small museums: Up close and innovative. International Journal of Nonprofit and Voluntary Sector Marketing, 10(4), 239–247. [CrossRef]
- Mehmetoglu, M., & Engen, M. (2011). Pine and Gilmore’s Concept of Experience Economy and Its Dimensions: An Empirical Examination in Tourism. Journal of Quality Assurance in Hospitality & Tourism, 12(4), 237–255. [CrossRef]
- Neilson, L. C. (2003b). The Development of Marketing in the Canadian Museum Community, 1840-1989. Journal of Macromarketing, 23(1), 16–30. [CrossRef]
- Obaidalahe, Z., Salerno, F., & Colbert, F. (2017). Subscribers’ Overall Evaluation of a Multi-experience Cultural Service, Tolerance for Disappointment, and Sustainable Loyalty. International Journal of Arts Management, 20(1), 21–30.
- Ohanian, R. (1990). Construction and Validation of a Scale to Measure Celebrity Endorsers’ Perceived Expertise, Trustworthiness, and Attractiveness. Journal of Advertising, 19(3), Article 3. [CrossRef]
- Ortega-Pérez, L., Domínguez-Valerio, C. M., Pascual-García, C., & Ruiz-Robles, M. D. R. (2025). Understanding the Mediating Role of Gastronomic Experiences in a World Heritage Site: An Explanatory Approach to the Case of Córdoba (Spain). Heritage, 8(7), 254. [CrossRef]
- Palmer, A., & Koenig-Lewis, N. (2010). Primary and secondary effects of emotions on behavioural intention of theatre clients. Journal of Marketing Management, 26(13–14), 1201–1217. [CrossRef]
- Pereira, V., Gupta, J. J., & Hussain, S. (2022). Impact of Travel Motivation on Tourist’s Attitude Toward Destination: Evidence of Mediating Effect of Destination Image. Journal of Hospitality & Tourism Research, 46(5), 946–971. [CrossRef]
- Preko, A., Gyepi-Garbrah, T. F., Arkorful, H., Akolaa, A. A., & Quansah, F. (2020). Museum experience and satisfaction: Moderating role of visiting frequency. International Hospitality Review, 34(2), 203–220. [CrossRef]
- Ramsey White, T., Hede, A., & Rentschler, R. (2009). Lessons from arts experiences for service-dominant logic. Marketing Intelligence & Planning, 27(6), 775–788. [CrossRef]
- Rather, R. A., Hollebeek, L. D., & Islam, J. U. (2019). Tourism-based customer engagement: The construct, antecedents, and consequences. The Service Industries Journal, 39(7–8), 519–540. [CrossRef]
- Rentschler, R., Jogulu, U., Kershaw, A., & Osborne, A. (2012). Extending the theory of metaphor in marketing: The case of the art gallery. Journal of Marketing Management, 28(11–12), Article 11–12. [CrossRef]
- Riva, P., & Agostino, D. (2022). Latent dimensions of museum experience: Assessing cross-cultural perspectives of visitors from tripadvisor reviews. Museum Management and Curatorship, 37(6), 616–640. [CrossRef]
- Robaina-Calderín, L., Martín-Santana, J. D., & Muñoz-Leiva, F. (2023). Immersive experiences as a resource for promoting museum tourism in the Z and millennials generations. Journal of Destination Marketing & Management, 29, 100795. [CrossRef]
- Singh, R., Ps, S., & Bashir, A. (2024). Destination Loyalty: A Systematic Review and Future Outlook. Journal of Quality Assurance in Hospitality & Tourism, 25(5), 1142–1163. [CrossRef]
- Smith, T. A. (2020). The role of customer personality in satisfaction, attitude-to-brand and loyalty in mobile services. Spanish Journal of Marketing - ESIC, 24(2), 155–175. [CrossRef]
- Swanson, S. R., & Davis, J. C. (2006). Arts Patronage: A Social Identity Perspective. Journal of Marketing Theory and Practice, 14(2), 125–138. [CrossRef]
- Thyne, M., & Hede, A.-M. (2016b). Approaches to managing co-production for the co-creation of value in a museum setting: When authenticity matters. Journal of Marketing Management, 32(15–16), 1478–1493. [CrossRef]
- UNESCO. (2021). Museums around the world in the face of COVID-19. https://unesdoc.unesco.org/ark:/48223/pf0000376729_eng.
- UNESCO. (2022). Institute of Statistics releases data and key findings on cultural and natural heritage expenditure. https://uis.unesco.org/en/news/unesco-institute-statistics-releases-data-and-key-findings-cultural-and-natural-heritage.
- UNESCO Institute of Statistics releases data and key findings on cultural and natural heritage expenditure. (2022, May 31). https://uis.unesco.org/en/news/unesco-institute-statistics-releases-data-and-key-findings-cultural-and-natural-heritage.
- Uslu, A., & Tosun, P. (2024). Examining the Impact of the Fear of Missing Out on Museum Visit Intentions. Journal of Hospitality & Tourism Research, 48(6), 1097–1112. [CrossRef]
- van Ittersum, K., Wansink, B., Pennings, J. M. E., & Sheehan, D. (2013). Smart Shopping Carts: How Real-Time Feedback Influences Spending. Journal of Marketing, 77(6), 21–36. [CrossRef]
- vom Lehn, D., & Heath, C. (2016). Action at the exhibit face: Video and the analysis of social interaction in museums and galleries. Journal of Marketing Management, 32(15–16), Article 15–16. [CrossRef]
- Werts, C. E., Linn, R. L., & Jöreskog, K. G. (1974). Intraclass Reliability Estimates: Testing Structural Assumptions. Educational and Psychological Measurement, 34(1), 25–33. [CrossRef]
- Wu, C.-H., Lin, Y.-F., Peng, K.-L., & Liu, C.-H. (2023). Augmented reality marketing to enhance museum visit intentions. Journal of Hospitality and Tourism Technology, 14(4), 658–674. [CrossRef]
- Yang, X., & Zhang, L. (2022). Smart tourism technologies towards memorable experiences for museum visitors. Tourism Review, 77(4), 1009–1023. [CrossRef]
- Yin, J., Cheng, Y., Bi, Y., & Ni, Y. (2020). Tourists perceived crowding and destination attractiveness: The moderating effects of perceived risk and experience quality. Journal of Destination Marketing & Management, 18, 100489. [CrossRef]
- Zanibellato, F., Rosin, U., & Casarin, F. (2018). How the Attributes of a Museum Experience Influence Electronic Word-of-Mouth Valence: An Analysis of Online Museum Reviews. International Journal of Arts Management, 21(1), 76–90.
- Zhang, R. (Renata), & Abd Rahman, A. (2022). Dive in the flow experience: Millennials’ tech-savvy, satisfaction and loyalty in the smart museum. Current Issues in Tourism, 25(22), 3694–3708. [CrossRef]
- Zhang, Z., Jiménez, F. R., & Cicala, J. E. (2020). Fear Of Missing Out Scale: A self-concept perspective. Psychology & Marketing, 37(11), 1619–1634. [CrossRef]
- Zhou, Q., & Pu, Y. (2022). Impact of cultural heritage rejuvenation experience quality on perceived value, destination affective attachment, and revisiting intention: Evidence from China. Asia Pacific Journal of Tourism Research, 27(2), 192–205. [CrossRef]
- Zollo, L., Filieri, R., Rialti, R., & Yoon, S. (2020). Unpacking the relationship between social media marketing and brand equity: The mediating role of consumers’ benefits and experience. Journal of Business Research, 117, 256–267. [CrossRef]
- Zollo, L., Rialti, R., Marrucci, A., & Ciappei, C. (2022). How do museums foster loyalty in tech-savvy visitors? The role of social media and digital experience. Current Issues in Tourism, 25(18), 2991–3008. [CrossRef]
Figure 1.
Model development.
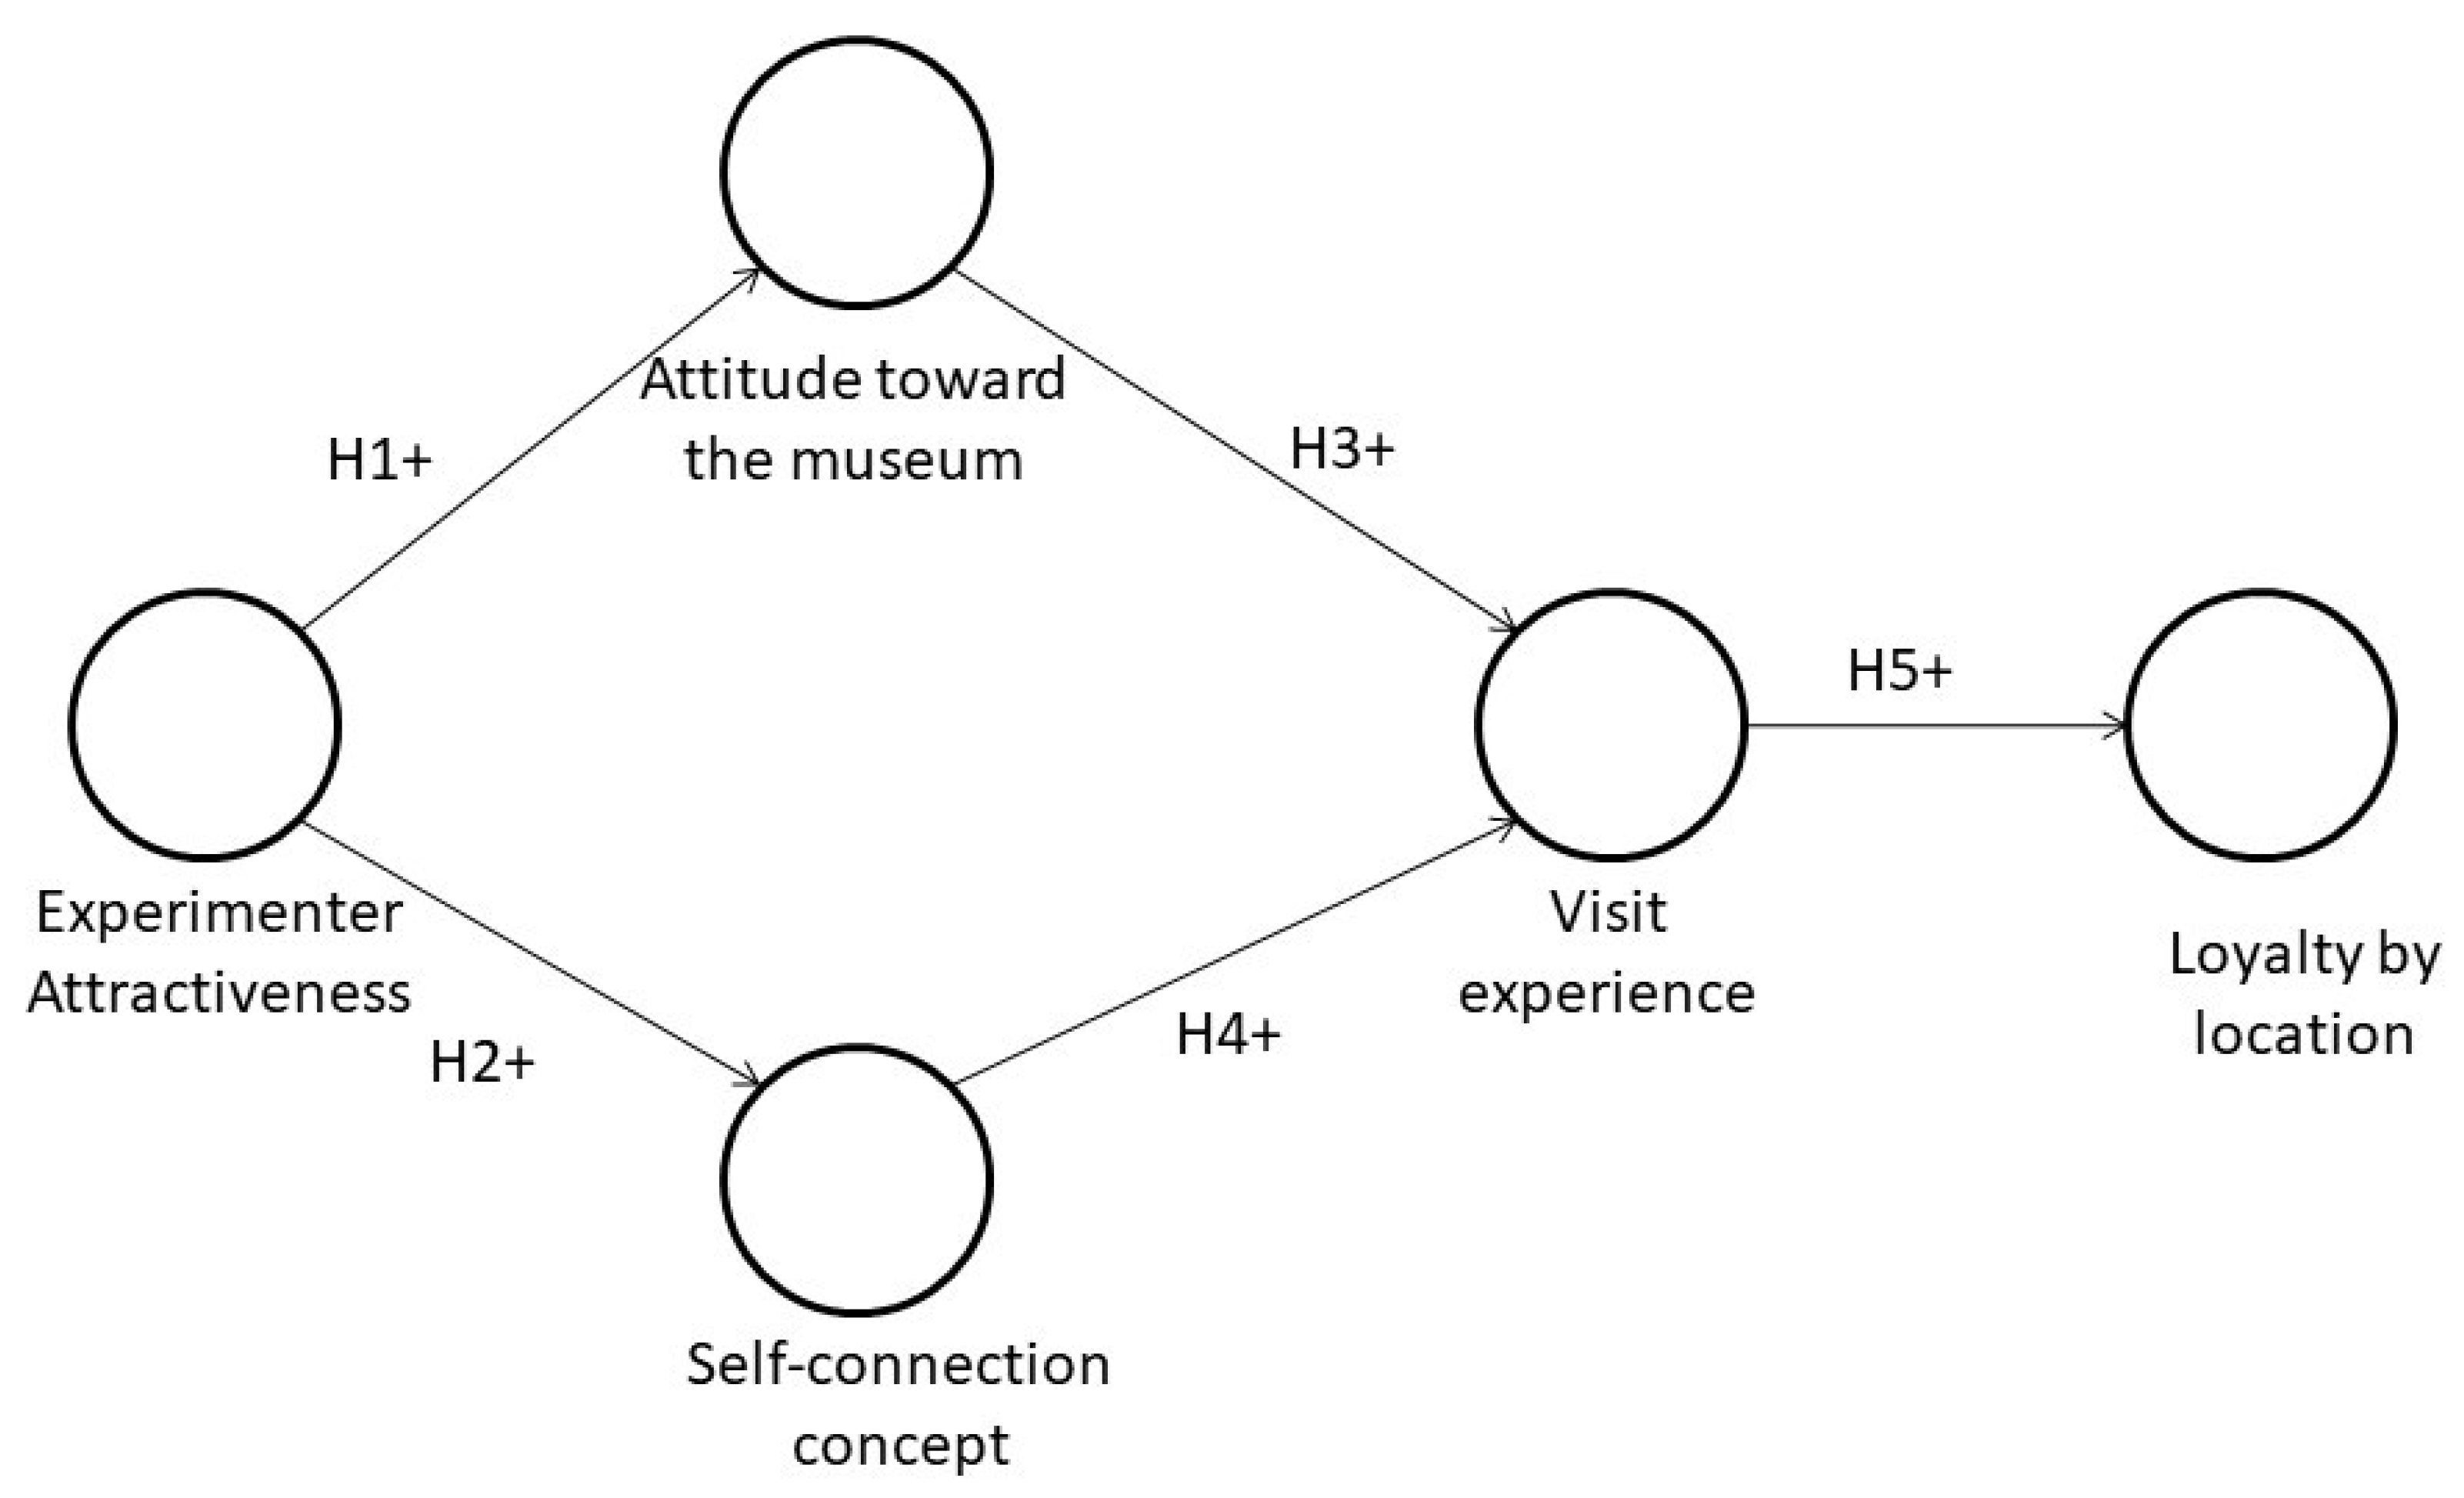
Figure 2.
PLS model analysis results.
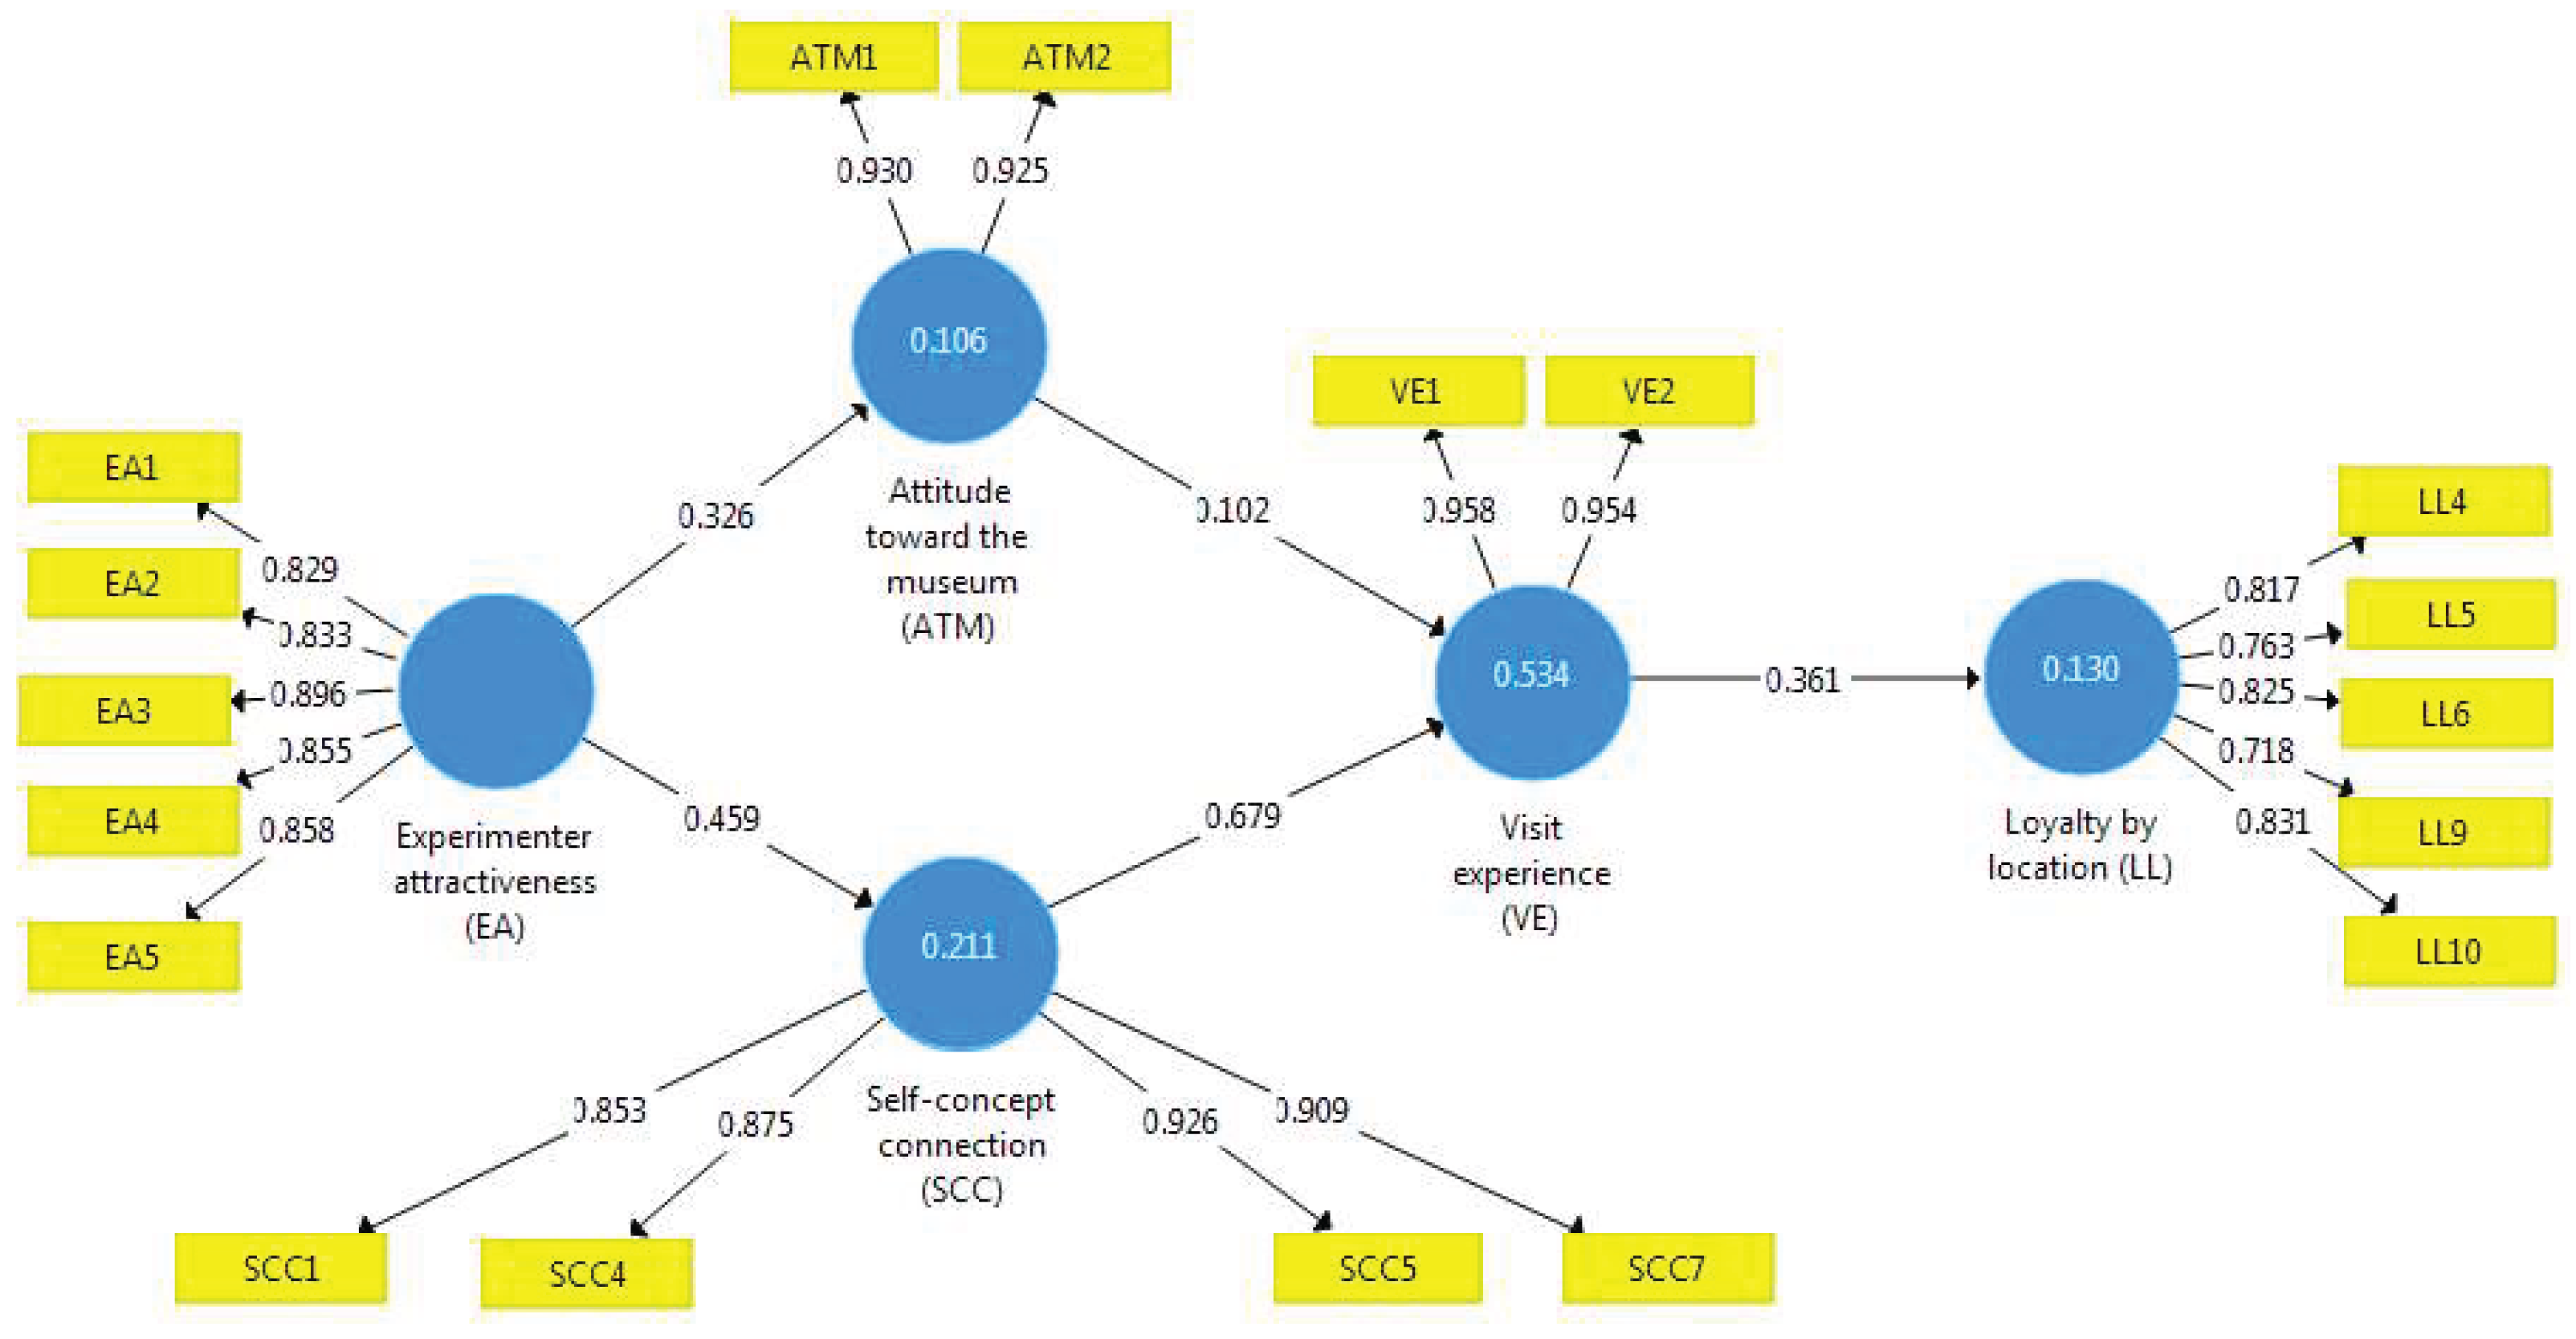

Table 1.
Technical details.
| Universe | Visitors in each museum in Puebla, México. |
| Sample unit | Visitors after the museum experience |
| Information collecting method | Self-administered questionnaire |
| Museums | Museo Casa de los muñecos, Museo Capilla del Arte, Museo Tecnológico de Monterrey, Museo UPAEP |
| Number surveyed | 1400 valid surveys |
| Sample error | ±3.45 |
| Level of reliability | 99% |
| Sample procedure | Probabilistic |
| Period of information collection | April 16 to July 31, 2024 |
Table 2.
Questionnaire dimensions and items.
| Dimensions | Items | Items description | Source | Scale |
|---|---|---|---|---|
| EA | EA1 | Attractive - not attractive | Ohanian (1990) | Semantic differential 7 points |
| EA2 | Beautiful - not beautiful | |||
| EA3 | Likeable - not likeable | |||
| EA4 | Interesting - not interesting | |||
| EA5 | Pleasing - not pleasing | |||
| ATM | ATM1 | I like this museum | Adapted from Aggarwal and McGill (2012) |
Agreement 7 points [completely disagree (1) – completely agree (7)] |
| ATM2 | I admire this museum | |||
| ATM3 | I embarrassing to be seen in this museum | |||
| ATM4 | I avoid being with this museum | |||
| SCC | SCC1 | This museum makes me feel connected to others | Escalas and Bettman (2005) | Agreement 7 points [completely disagree (1) – completely agree (7)] |
| SCC2 | This museum is a statement about how I am a part of a group | |||
| SCC3 | This museum reminds me of who I am | |||
| SCC4 | This museum is a part of me | |||
| SCC5 | This museum says a lot about the kind of person I would like to be | |||
| SCC6 | This museum says a lot about the kind of person I want to be (new) | |||
| SCC7 | This museum is a statement of who I want to be | |||
| VE | VE1 | I am satisfied with my museum experience | Adapted from Van Ittersum et al. (2013) | Agreement 7 points [completely disagree (1) – completely agree (7)] |
| VE2 | I enjoyed visiting in this museum | |||
| LL | LL1 | I will visit slightly more this museum if the location is closer to me | Adapted from Hozier and Stem (1985) |
Frequency 4 points (never, rarely, frequently, very frequently). |
| LL2 | I prefer to visit other museums outside the city, in place to visit this museum | |||
| LL3 | I visit the museum of my city | |||
| LL4 | I visit locally because the convenience outweighs the other advantages of visit outside my city | |||
| LL5 | I visit locally to support the local museums | |||
| LL6 | Visiting at this museum is an enjoyable experience | |||
| LL7 | I will increase my interest in this museum when it will has more location | |||
| LL8 | Because I am more familiar with this museum, I prefer visit locally rather than out of town | |||
| LL9 | I visit locally even when the selection/variety of museums is poor | |||
| LL10 | I am loyal to visit this local area of museum |
Table 3.
Results (Part 1).
| Dimensions | Items | First run | Second run | |||
| Outer Loadings | Decision | Model fit | Outer Loadings | Model fit | ||
| EA | EA1 | 0.827 | Keep | SRMR Estimated Model =0.097 | 0.828 | SRMR Estimated Model =0.095 |
| EA2 | 0.834 | Keep | 0.834 | |||
| EA3 | 0.894 | Keep | 0.895 | |||
| EA4 | 0.857 | Keep | 0.856 | |||
| EA5 | 0.860 | Keep | 0.859 | |||
| ATM | ATM1 | 0.915 | Keep | 0.930 | ||
| ATM2 | 0.892 | Keep | 0.925 | |||
| ATM3 | -0.165 | Drop | Eliminated | |||
| ATM4 | -0.296 | Drop | ||||
| SCC | SCC1 | 0.869 | Keep | 0.869 | ||
| SCC2 | 0.897 | Keep | 0.897 | |||
| SCC3 | 0.914 | Keep | 0.914 | |||
| SCC4 | 0.869 | Keep | 0.869 | |||
| SCC5 | 0.917 | Keep | 0.917 | |||
| SCC6 | 0.919 | Keep | 0.919 | |||
| SCC7 | 0.877 | Keep | 0.877 | |||
| VE | VE1 | 0.958 | Keep | 0.958 | ||
| VE2 | 0.955 | Keep | 0.954 | |||
| LL | LL1 | 0.632 | Drop | Eliminated | ||
| LL2 | 0.628 | Drop | ||||
| LL3 | 0.646 | Drop | ||||
| LL4 | 0.785 | Keep | 0.817 | |||
| LL5 | 0.756 | Keep | 0.763 | |||
| LL6 | 0.786 | Keep | 0.825 | |||
| LL7 | 0.677 | Drop | Eliminated | |||
| LL8 | 0.683 | Drop | ||||
| LL9 | 0.739 | Keep | 0.718 | |||
| LL10 | 0.783 | Keep | 0.831 | |||
Table 4.
Reliability and Validity.
| Dimensions | Cronbach’s Alpha | rho_A | Composite Reliability | Average Variance Extracted (AVE) |
|---|---|---|---|---|
| ATM | 0.838 | 0.838 | 0.925 | 0.860 |
| EA | 0.908 | 0.911 | 0.931 | 0.731 |
| LL | 0.851 | 0.864 | 0.893 | 0.627 |
| SCC | 0.913 | 0.917 | 0.939 | 0.794 |
| VE | 0.906 | 0.907 | 0.955 | 0.914 |
Table 5.
Discriminat validity.
| Dimensions | ATM | EA | LL | SCC | VE |
|---|---|---|---|---|---|
| ATM | 0.928 | ||||
| EA | 0.326 | 0.855 | |||
| LL | 0.227 | 0.225 | 0.792 | ||
| SCC | 0.448 | 0.459 | 0.262 | 0.891 | |
| VE | 0.407 | 0.35 | 0.361 | 0.725 | 0.956 |
Table 6.
Hypothesis testing results.
| Hypotheses | Path | Estimate | Standard Deviation | t-Value | p-Value | Result |
|---|---|---|---|---|---|---|
| H1 | EA ⟶ ATM | 0.326 | 0.031 | 10.595 | 0.000*** | Confirmed |
| H2 | EA ⟶ SCC | 0.459 | 0.025 | 18.616 | 0.000*** | Confirmed |
| H3 | ATM ⟶ VE | 0.102 | 0.029 | 3.546 | 0.000*** | Confirmed |
| H4 | SCC ⟶ VE | 0.679 | 0.023 | 29.852 | 0.000*** | Confirmed |
| H5 | VE ⟶ LL | 0.361 | 0.023 | 15.498 | 0.000*** | Confirmed |
| R2 ATM = 0.106; R2 SCC = 0.211 ; R2 VE = 0.534; R2 LL = 0.130 | ||||||
* Note:*** p ≤ 0.001.
Disclaimer/Publisher’s Note: The statements, opinions and data contained in all publications are solely those of the individual author(s) and contributor(s) and not of MDPI and/or the editor(s). MDPI and/or the editor(s) disclaim responsibility for any injury to people or property resulting from any ideas, methods, instructions or products referred to in the content. |
© 2025 by the authors. Licensee MDPI, Basel, Switzerland. This article is an open access article distributed under the terms and conditions of the Creative Commons Attribution (CC BY) license (http://creativecommons.org/licenses/by/4.0/).
Copyright: This open access article is published under a Creative Commons CC BY 4.0 license, which permit the free download, distribution, and reuse, provided that the author and preprint are cited in any reuse.


